Embed Size (px)
Citation preview

Health and Social Care in the Community
14
(6), 499–507 doi: 10.1111/j.1365-2524.2006.00638.x
© 2006 The Authors, Journal compilation © 2006 Blackwell Publishing Ltd
499
Abstract
This research examined changes in the number of care homes and their residents in the UK between the 1991 and 2001 Censuses. Local-authority-owned provision universally declined in this period, but changes in private residential and nursing homes were far more varied. Some parts of Britain experienced a growth in this market, in particular Scotland. Regions which were traditionally linked with greater numbers of retired people in their populations declined in their private residential home markets (e.g. the South West and South East). Wales experienced a regional decline that was greater than most English regions. Using additional Department of Health data, it was possible to estimate which local authority areas in England were exporting state-funded supported residents to homes out of their area. Most of these authorities were in urban areas and the highest rates of exporting were from Inner London boroughs. Political control and average property prices were explored as possible independent variables influencing the percentage rate of decline in homes in a local authority area. It appeared that Conservative authorities experienced a more rapid decline in government-owned homes than those run by Labour, but the results were not statistically significant, suggesting that local politics was a not a key influence on the trend. Average property prices did not affect all areas of the country, but were found to have a negative and significant association with percentage rates of decline in care homes in both Wales and London.
Keywords:
adult social care, care homes, communal establishments, residential social care, social care market
Accepted for publication
31 March 2006
Blackwell Publishing Ltd
Public policy and private provisions: changes in residential care from 1991
to 2001
Philip Haynes
BA MSc PhD
, Laura Banks
BA
, Susan Balloch
BSc Econ MSc Econ
and Michael Hill
BSc
Health and Social Policy Research Centre, School of Applied Social Science, University of Brighton, Brighton, UK
Correspondence
Philip Haynes Health and Social Policy Research CentreUniversity of Brighton Falmer Brighton BN1 9PH UK E-mail: [email protected]
Introduction
The present paper discusses evidence provided by Censusdata for 1991 and 2001 on the incidence of residential carefor adults. It examines in depth the already-establishedfact that, between those two dates, there was a fall in thenumber of adults in residential care (Knapp
et al.
2001).Census data showed the decline in the UK to be from423 000 to 375 000, a fall of 11%. This was despite anincrease in the numbers of people over 75 years of ageof nearly half a million, from 3 866 000 to 4 305 000, anda proportionate increase in the numbers of people over75 years claiming to have a serious long-term limitingillness in the 2001 Census. It is significant to note that
this period saw the implementation of the 1990 NationalHealth Service and Community Care Act, in which the‘community care’ provisions explicitly aimed to reducethe amount of institutional care provided (Grundy &Glaser 1997) on the grounds both of the preferability ofdomiciliary alternatives and of the excessive costs of theformer (particularly to the public purse).
The 1990 Act required local authorities in Englandand Wales (but not in Scotland) to use 85% of the newmoney coming to them (largely as a result of thephasing out of the social security funding of residentialcare) on non-statutory services. This greatly circum-scribed local authority discretion to invest in their ownservices.

P. Haynes
et al.
500
© 2006 The Authors, Journal compilation © 2006 Blackwell Publishing Ltd
The resulting decline of residential care may be seenas cause for concern, on the grounds that the supplyof needed care decreased (Comas-Herrera
et al
. 2001,Andrews & Phillips 2002, Netten
et al.
2002), or asgrounds for satisfaction that alternative ways of caringfor people have been developed (Knapp
et al.
2001). Anunderlying issue here concerns the extent to which thischange can be seen as a ‘rational’ application of a newnational policy, with a consistent impact upon citizens,or a more haphazard development affected by thevagaries of local situations and local politics, and by thebusiness decisions of key care providers. An importantpart of the evidence needed to evaluate the abovealternatives must concern the quality of care for thoseoutside institutions, a topic beyond the scope of thisstudy. However, the present authors are able to throwsome light on these questions by considering variationsin the impact of the changes in residential care provision.Such an exploration indicates the way in which policywas implemented after the 1990 Act. Extensive localvariations suggest factors beyond national policy whichinfluenced implementation, indicating that the impactupon citizens may have differed from place to place.
Research questions
The present authors posed the following researchquestions:
• Was there change in the residential population in local-authority-owned homes?
• Was there change in the residential population in privately owned homes (including the voluntary sector)?
• What was the relationship between changes in care homes and population change?
• What was the relationship between changes in care homes and the distribution of local-authority-funded places?
• Did local politics affect the rate of change in local areas?• Did variations in average local property prices affect
the rate of change in local areas?
Materials and methods
The aim of the present secondary, quantitative researchwas to identify changes which took place in residentialsocial care provision in the UK between 1991 and 2001using census data. The authors will leave out considera-tion of Northern Ireland, where different administrativearrangements complicate analysis. Additional data isused from the Department of Health and the WelshAssembly Office (previously the Welsh Office), and theLand Registry for England and Wales.
The main outputs from the 1991 and 2001 Censusesare a large number of preformatted standard tableswhich cross-tabulate a selection of variables. An indi-vidual database of Census individuals and variables isnot available for the entire Census. The key tables usedare: (1991 Census) tables LBS03, LBS04 and SAS03; and(2001 Census) tables UV70, KS023, ST126 and ST232.
The present paper uses data taken from the standardtables for the purpose of looking at the overall nationalchange in the availability of communal social care estab-lishments and occurrence of residents between 1991and 2001. This analysis is done at the local authority andregional/country level.
The Censuses identify numerous types of ‘communalestablishment’ (Dale 1993, Office for National Statistics2004). The key subcategories used in the present researchand analysed as residential social care homes are:
•
local authority homes;
•
nursing homes [non-National Health Service (NHS)] in the private and independent sector; and
•
residential homes (non-NHS/local authority/health authority) in the private and independent sector.
In practice, it was not possible to separate nursingand residential homes in the analysis because of changesin classification and the failure of the enumeration sys-tem to identify dual-purpose institutions. Furthermore,some very small homes were excluded by the Censuses(these were likely to be classified as large households).This meant that the research was likely to undercountresidential homes. This is the key difference betweenusing census data rather than Department of Health data.However, the Censuses may represent more reliablecounts of individuals and their social circumstances oncethey are recorded as living in care homes, given thatDepartment of Health data relies on third-party returnsvia a complex local government reporting network.
One methodological issue encountered when organ-ising the secondary data was the changing sociopoliticalgeography between 1991 and 2001. Social care serviceadministration boundaries had changed in many partsof the country following the local government reorgan-isation of 1995–1996. In addition, there had been somechanges to the geographical definitions of some regions.In both cases, the method for making output comparablewas to map back from the 2001 Census definitions.Analysis of the influence of political changes could onlybe attempted with local metropolitan areas which hadnot experienced boundary changes in the 10-year period.
The present data analysis uses tables which arefrequency counts for the two Census years and addscalculations of percentage change. These calculationswere made with the Microsoft Excel computer program.To evaluate the influence of other independent variables
Changes in residential care
© 2006 The Authors, Journal compilation © 2006 Blackwell Publishing Ltd
501
on the rates of care home change, SPSS was used. Datawere analysed using measures of correlation, simplelinear regression and the Kruskal–Wallis (K–W)
H
-test.The changes in the provision of residential care can
be examined in terms of the variations between coun-tries, regions and local authority areas with respect to:
1
changes in the size of the local authority and private (including voluntary) sectors; and
2
the ratio of people financially supported wholly or partly by local authorities.
Results
Table 1 gives the overall picture of the change, and offersdata on the differences between countries and Englishregions, showing an interesting overall decline in thenumber of both homes (
−
10.6%) and residents (
−
11.4%).In the majority of regions (
n
= 9), there was a decline inboth homes and residents. The rate of decline of residentswas greater than the rate of decline of homes in eightregions, but the exception was the South West, whichexperienced a slightly higher rate of decline in homes(
−
16%) than residents (
−
15.3%). The two exceptions in thisstory of decline are Scotland and East England, wherethere were increases in the number of residents (+20.6%and +2.6%). The decline of residents was particularlystrong in Wales (
−
20.6%), London (
−
18%) and the NorthWest (
−
23.4%). In Scotland, the number of residentsgrew substantially more than the number of homes.
Looking at local authority homes alone, the fall inprovision was massive across all the countries (althoughleast in Scotland), as Table 2 shows. An examination ofthe English regions shows that the greatest decline in
the number of local authority homes has been in theSouth West, while the greatest rate of decline in thenumber of residents was in London. There was con-siderable variation in the rate of decline, with Scotlandand Wales experiencing much lower rates of decline intheir stock of local-authority-owned homes (
−
31.4%and
−
32.9%) than England (
−
57.1%).Table 3 shows a much more mixed picture of change
in the private sector, with growth everywhere exceptthe North West, South West, South East and Wales, andwith substantial rises in the East and in Scotland.
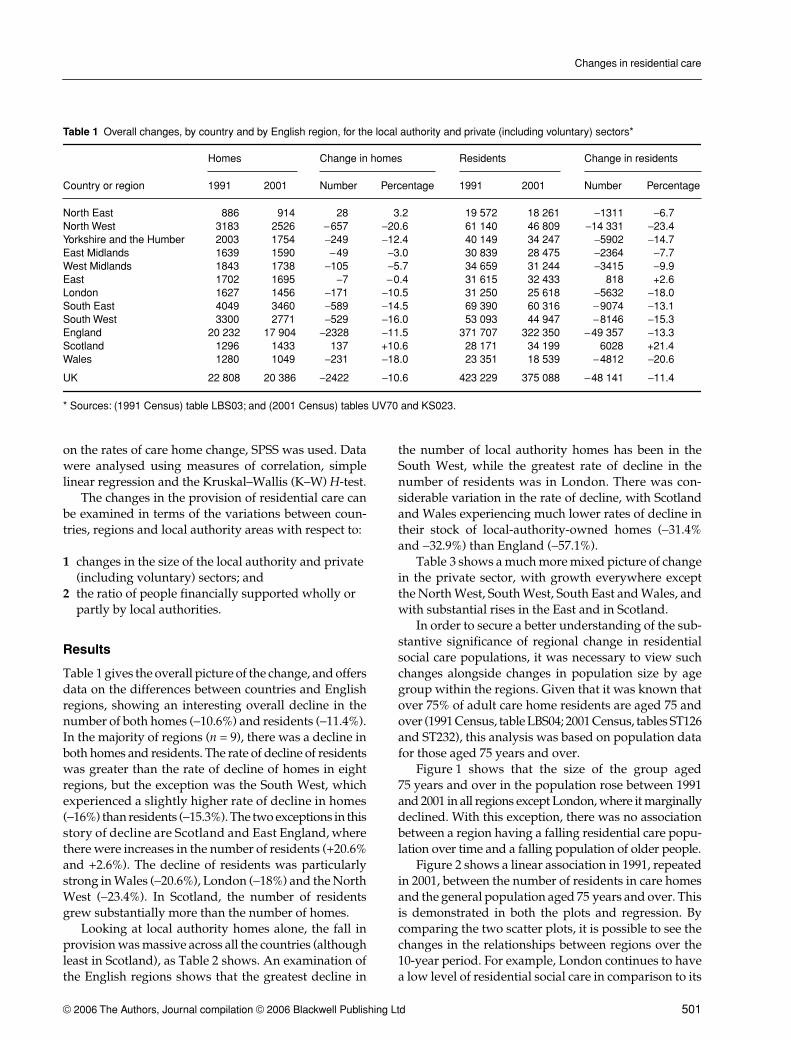
In order to secure a better understanding of the sub-stantive significance of regional change in residentialsocial care populations, it was necessary to view suchchanges alongside changes in population size by agegroup within the regions. Given that it was known thatover 75% of adult care home residents are aged 75 andover (1991 Census, table LBS04; 2001 Census, tables ST126and ST232), this analysis was based on population datafor those aged 75 years and over.
Figure 1 shows that the size of the group aged75 years and over in the population rose between 1991and 2001 in all regions except London, where it marginallydeclined. With this exception, there was no associationbetween a region having a falling residential care popu-lation over time and a falling population of older people.
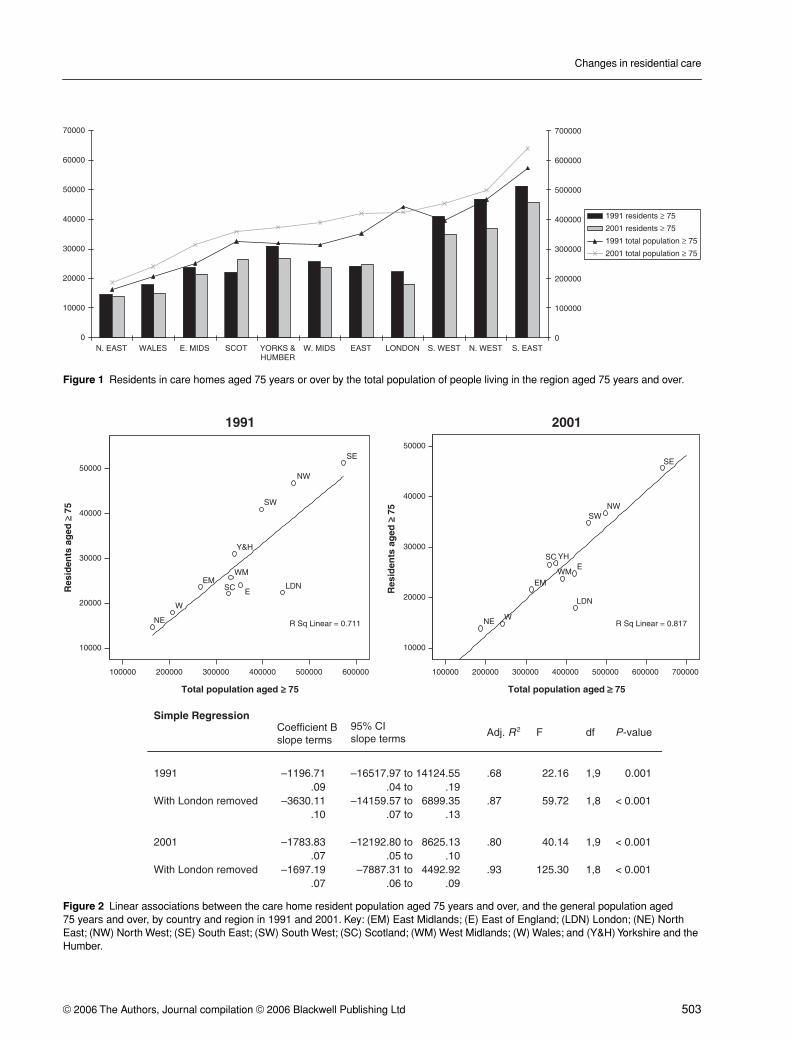
Figure 2 shows a linear association in 1991, repeatedin 2001, between the number of residents in care homesand the general population aged 75 years and over. Thisis demonstrated in both the plots and regression. Bycomparing the two scatter plots, it is possible to see thechanges in the relationships between regions over the10-year period. For example, London continues to havea low level of residential social care in comparison to its
Table 1 Overall changes, by country and by English region, for the local authority and private (including voluntary) sectors*
Country or region
Homes Change in homes Residents Change in residents
1991 2001 Number Percentage 1991 2001 Number Percentage
North East 886 914 28 3.2 19 572 18 261 −1311 −6.7North West 3183 2526 −657 −20.6 61 140 46 809 −14 331 −23.4Yorkshire and the Humber 2003 1754 −249 −12.4 40 149 34 247 −5902 −14.7East Midlands 1639 1590 −49 −3.0 30 839 28 475 −2364 −7.7West Midlands 1843 1738 −105 −5.7 34 659 31 244 −3415 −9.9East 1702 1695 −7 −0.4 31 615 32 433 818 +2.6London 1627 1456 −171 −10.5 31 250 25 618 −5632 −18.0South East 4049 3460 −589 −14.5 69 390 60 316 −9074 −13.1South West 3300 2771 −529 −16.0 53 093 44 947 −8146 −15.3England 20 232 17 904 −2328 −11.5 371 707 322 350 −49 357 −13.3Scotland 1296 1433 137 +10.6 28 171 34 199 6028 +21.4Wales 1280 1049 −231 −18.0 23 351 18 539 −4812 −20.6
UK 22 808 20 386 −2422 −10.6 423 229 375 088 −48 141 −11.4
* Sources: (1991 Census) table LBS03; and (2001 Census) tables UV70 and KS023.

P. Haynes
et al.
502
© 2006 The Authors, Journal compilation © 2006 Blackwell Publishing Ltd
population, while Scotland has moved above the lineand demonstrates its increased ratio of care homeresidents in relation to the population size. If the outlierof London is removed from the analysis the adjusted
R
2
value increases for both years.Going below the regional level, Table 4 shows the local
authorities with the highest rate of decline in homes/residents within each region. It shows that even the regionsand countries which experienced a lower rate of decline,or an increase in homes and residents between 1991 and2001 included some individual local authorities whichhad higher rates of decline. For example, Dundee City inthe growth region of Scotland lost over one-third of itsresidents. However, it should be noted that some regionscontained many authority areas with particularly high
rates of decline. For example, a large majority of InnerLondon boroughs saw a greater than 20% loss of homesand several experienced an over 50% decline in the numberof residents (as shown in Table 5). This picture is some-what complicated by the fact that those areas with thehighest rates of decline were not necessarily synonymouswith having a lower proportion of older people in resi-dential or nursing care, since some had a comparativelyhigh proportion of people aged 75 years and over livingin residential social care in 1991. For example, Kensingtonand Chelsea, which had the largest national decline of boththe number of homes and number of residents, had ahigher proportion of over-75-year-olds in residential ornursing care in 1991 than any other Inner London borough.Kensington and Chelsea’s decline was from a high baseline.
Table 2 Local authority care homes and residents 1991/2001, by country and region*
Country or region
Homes Change in homes Residents Change in residents
1991 2001 Number Percentage 1991 2001 Number Percentage
North East 286 164 −122 −42.7 6697 2544 −4153 −62.0North West 708 316 −392 −55.4 15 290 5038 −10 252 −67.1Yorkshire and the Humber 542 240 −302 −55.7 12 255 4492 −7763 −63.3East Midlands 369 174 −195 −52.8 7989 3630 −4359 −54.6West Midlands 458 216 −242 −52.8 10 294 4421 −5873 −57.1East 431 191 −240 −55.7 9788 3933 −5795 −59.2London 572 201 −371 −64.9 12 863 3122 −9741 −75.7South East 662 278 −384 −58.0 13 000 5434 −7566 −58.2South West 529 173 −356 −67.3 9731 2846 −6885 −70.8England 4557 1953 −2604 −57.1 97 907 35 520 −62 387 −63.7Scotland 401 275 −126 −31.4 9061 5579 −3482 −38.4Wales 292 196 −96 −32.9 6566 3531 −3035 −46.2
UK 5250 2424 −2826 −53.8 113 534 44 630 −68 904 −60.7
* Sources: (1991 Census) table LBS03; and (2001 Census) tables UV70 and KS023.
Table 3 Private and voluntary care homes and residents 1991/2001 by country and region*
Country or region
Homes Change in homes Residents Change in residents
1991 2001 Number Percentage 1991 2001 Number Percentage
North East 600 750 150 +25.0 12 875 15 717 2842 +22.1North West 2475 2210 −265 −10.7 45 850 41 771 −4079 −8.9Yorkshire and the Humber 1461 1514 53 +3.6 27 894 29 755 1861 +6.7East Midlands 1270 1416 146 +11.5 22 850 24 845 1995 +8.7West Midlands 1385 1522 137 +10.0 24 365 26 823 2458 +10.1East 1271 1504 233 +18.3 21 827 28 440 6613 +30.3London 1055 1255 200 +19.0 18 387 22 496 4109 +22.3South East 3387 3182 −205 −6.1 56 390 54 882 −1508 −2.7South West 2771 2598 −173 −6.2 43 362 42 101 −1261 −2.9England 15 675 15951 286 +1.8 273 800 286 830 13 030 +4.8Scotland 895 1158 263 +29.4 19 110 28 620 9510 +49.8Wales 988 853 −135 −13.7 16 785 15 008 −1777 −10.6
UK 17 558 17962 404 +2.3 309 695 330 458 20 763 +6.7
* Sources: (1991 Census) table LBS03; and (2001 Census) tables UV70 and KS023.
Changes in residential care
© 2006 The Authors, Journal compilation © 2006 Blackwell Publishing Ltd 503
Figure 1 Residents in care homes aged 75 years or over by the total population of people living in the region aged 75 years and over.
Figure 2 Linear associations between the care home resident population aged 75 years and over, and the general population aged 75 years and over, by country and region in 1991 and 2001. Key: (EM) East Midlands; (E) East of England; (LDN) London; (NE) North East; (NW) North West; (SE) South East; (SW) South West; (SC) Scotland; (WM) West Midlands; (W) Wales; and (Y&H) Yorkshire and the Humber.

P. Haynes et al.
504 © 2006 The Authors, Journal compilation © 2006 Blackwell Publishing Ltd
As a result of the decline in London, London boroughsstand out as places with a low proportion of the aged75 years and over population living in communal socialcare in 2001. This is indicated in Table 6, which showsthat the majority of authorities with less than 3% (ofpeople aged 75 or over) living in residential social care,were situated in Inner London. In fact, in Inner Londonas a whole in 2001, only 2.85% of people aged 75 yearsor over were living in such establishments, with Londonboroughs ‘exporting’ those in need to other areas (see‘Discussion’ below). This means that they were pur-chasing places from residential care home providerssituated in other local government areas.
Since the picture for the countries and regions showsa general decline in local authority provisions, accom-panied by a varied pattern with respect to private sectorprovision, there is a need to take a brief look at the extentto which there were variations between local authorityareas.
The evidence on this shift tells us nothing aboutchanges to the role of local authorities as funders of the
care home market after 1991, but it was possible todeduce some things about this in England and Wales byinterfacing Department of Health data on this topicwith the census data. But this can only be done in rela-tion to the picture in 2001. In 1991, local authorities were,to a large extent, only funding their own care homes,whilst the main public funder of private residential carewas the social security system. As noted above, a keyobjective of the 1990 Act was to end that peculiar divisionwithin the system by phasing out the social securityfunding of residential care.
However, if we look at the information for 2001 interms of the extent to which places were being fundedby local authorities, we get some interesting findingssuggesting issues about the way that the system mayhave evolved, and be evolving.
First, there was, as Table 7 shows, a group of localauthorities which funded substantially more residents
Table 4 Local authority areas with the highest rates of overall care home decline, by country and region*
Country or region
Homes Residents
Local authority Change (%) Local authority Change (%)
North East Newcastle −30.9 Newcastle −31.0North West Blackpool −36.6 Blackburn −45.1Yorkshire and the Humber North Lincolnshire −34.1 Calderdale −38.4East Midlands Derby −35.9 Nottingham −40.4West Midlands Coventry −28.2 Telford and the Wrekin −22.4East of England Southend-on-Sea −20.3 Luton −25.6London Kensington and Chelsea −65.5 Kensington and Chelsea −74.8South East Brighton and Hove −43.3 Bracknell Forest −40.7South West Bournemouth −48.5 Bournemouth −33.4Scotland West Dunbartonshire −36.7 Dundee City −35.6Wales Conwy −41.6 Conwy −45.8
* Sources: (1991 Census) table SAS03; and (2001 Census) tables UV70 and KS023.
Table 5 Local authorities with the highest rates of overall care home decline*
Local authority
Change (%)
Homes Residents
Kensington and Chelsea −65.5 −74.8Islington −63.2 −73.6Camden −54.8 −65.4Haringey −42.3 −50.0Tower Hamlets −52.6 −47.1
* Sources: (1991 Census) table SAS03; and (2001 Census) tables UV70 and KS023.
Table 6 Local authorities with less than 3% of people aged 75 years and over living in care homes in their own geographical area (2001)*
Local authority Region Percentage
Westminster (Inner) London 0.73Islington (Inner) London 1.28Camden (Inner) London 1.68Hammersmith and Fulham (Inner) London 1.73Kensington and Chelsea (Inner) London 2.12Thurrock East 2.26Tower Hamlets (Inner) London 2.44Brent (Outer) London 2.62Hackney (Inner) London 2.88Newham (Inner) London 2.96
* Sources: (2001 Census) tables UV70, KS023, ST126 and ST232.

Changes in residential care
© 2006 The Authors, Journal compilation © 2006 Blackwell Publishing Ltd 505
in 2001 than existed in their areas. This means that theymust have been purchasing places in the areas coveredby other local authorities. Thus, they may be definedas ‘exporters’ of people in need of care in this sense(although they remained responsible for payments, ofcourse). It will be seen that many of these authoritieswere in Inner London.
At the other extreme were authorities where therewere many more people in residential homes than the
local authority supported. Table 8 lists the English andWelsh local authorities with the lowest levels of resi-dents supported by that local authority.
Influence of local politics
The hypothesis that Conservative-controlled authoritieswere keener privatisers than others was tested bycoding authorities by their respective election results.Only the English metropolitan boroughs (i.e. 68 districtsin London, Greater Manchester, South Yorkshire, WestYorkshire, Merseyside, Tyne and Wear, and the WestMidlands) were included in the test sample since theseareas had been unaffected by boundary changes, allow-ing the two election years (i.e. 1990 and 1998) to be com-pared. A variable was created to test the hypothesis, inwhich the boroughs were coded according to the rela-tionship between the election results in the two electionyears, i.e. where the borough was Labour controlled inboth years, it was classed as ‘Continuously Labour’, andwhere Conservative in both years, ‘Continuously Con-servative’. Any alternative combination (e.g. a change inpolitical control or Liberal Democrat control) was classed‘Other’. The mean percentage change in local-authority-owned homes for ‘Continuously Conservative’ boroughswas then compared with those for the other two groups.
The results show that the mean percentage declineof local-authority-owned homes was greater for ‘Con-tinuously Conservative’ constituencies (−72%; n = 7)than for ‘Continuously Labour’ (−52%; n = 40) or ‘Other’(−61%; n = 21) ones. The difference between the threegroups was not statistically significant (K–W χ2 = 3.91,d.f. = 2, P = 0.14).
The mean percentage decline of local-authority-owned homes as a proportion of all homes was also
Table 7 Local authorities in England and Wales exporting supported residents to other areas (2001). N.B. Supported resident figures for Wales do not include respite care*
Name of authority
Number of supported residents
Number of care home residents in area Ratio
Islington 1067 206 5.2Tower Hamlets 1364 268 5.1Westminster 1113 221 5.0Camden 1082 283 3.8Kensington and Chelsea 763 251 3.0Hammersmith and Fulham 741 260 2.9Hackney 1095 387 2.8Southwark 1361 546 2.5Newham 1063 432 2.5Haringey 1176 480 2.5Brent 1150 566 2.0Slough 481 247 1.9Thurrock 458 241 1.9Lambeth 1534 873 1.8Barking and Dagenham 919 540 1.7St Helens 1168 706 1.7Lewisham 1288 799 1.6Hounslow 943 658 1.4Hillingdon 1076 753 1.4Bexley 904 644 1.4Nottingham 1855 1327 1.4Wandsworth 1405 1006 1.4Gateshead 1465 1097 1.3Sheffield 4272 3210 1.3Telford and the Wrekin 839 632 1.3Gwynedd 1025 774 1.3Salford 1557 1181 1.3Luton 653 499 1.3Newcastle upon Tyne 1677 1311 1.3Kingston upon Hull 2156 1692 1.3Rhondda, Cynon, Taff 1343 1062 1.3Newport 814 669 1.2Cardiff 1452 1204 1.2Calderdale 1213 1007 1.2Merthyr Tydfil 338 281 1.2Greenwich 1030 862 1.2Manchester 2707 2285 1.2South Tyneside 1313 1111 1.2Sandwell 1823 1566 1.2Southampton 1149 993 1.2
* Sources: (Department of Health) tables S3 and 6.12 (year to 31 March 2001); and (2001 Census) table KS023.
Table 8 Local authorities in England and Wales with the lowest ratios of supported funded residents (2001)*
Name of authority
Number of supported residents
Number of care home residents in area Ratio
Bournemouth 1023 2655 0.39Poole 504 1223 0.41Devon 3243 7852 0.41East Sussex 2973 7076 0.42Denbighshire/Sir Ddinbych 502 1179 0.43Wokingham 374 867 0.43North Somerset 1170 2656 0.44Torbay 946 2107 0.45Darlington 499 1012 0.49Southend 894 1768 0.51
* Sources: (Department of Health) table S3/6.12 (year to 31 March 2001); (2001 Census) table KS023.

P. Haynes et al.
506 © 2006 The Authors, Journal compilation © 2006 Blackwell Publishing Ltd
identified, in relation to political control. This allowedthe analysis to look at the decline of local authorityhomes in the context of what had happened to the in-dependent sector. Once again, the proportional declinewas greater in ‘Continuously Conservative’ (−26%) than‘Continuously Labour’ (−20%) or ‘Other’ (−19%) con-stituencies. However, the difference between the meansof the three groups was not statistically significant (K–Wχ2 = 0.67, d.f. = 2, P = 0.71). It should be noted that therewas a very small number of ‘Continuously Conserva-tive’ authorities included in the sample. A more satis-factory test would have included a greater number ofauthorities, including more of those which could beclassed as ‘Continuously Conservative’.
Influence of property prices
Since it was variation in changes in the private sector,rather than in the public sector, that was most variable,the present authors searched for other indices whichmight help to explain this. Differences in decline mightbe explained by changes in property prices. Averageproperty prices in 2001 were obtained from the LandRegistry for England and Wales. Similar data were notavailable for Scotland. There is no association betweenthe percentage change in average regional house pricesand the percentage change in residential social carehomes (Pearson correlation = −0.18, two-tailed P = 0.60,n = 11). Neither was there a substantive national associ-ation between local-authority-based average house pricesand the area decline in the number of homes (Pearsoncorrelation = −0.19, two-tailed P = 0.02, n = 171). How-ever, there was an area-based negative association betweenhigher house prices and a decline in homes within somespecific regions; for example, London (Pearson correla-tion −0.48, two-tailed P = 0.05, n = 23) and Wales (Pearsoncorrelation = −0.56, two-tailed P = 0.01, n = 22). In thesetwo regions, higher average area house prices do havea negative association with the rate of decline in homes.
Discussion
On a regional basis, the association of care home residentsaged 75 years and over in relation to the population sizeof the same age group was stronger in 2001 than it wasin 1991. Regions like the South West and North Westhave reduced their ratios of the population living in carehomes. Scotland’s profile has changed substantially,moving it from a region with comparatively low levelsof older people in care homes to a region with one of thehighest ratios. It seems likely that this is related to aslower comparative decline in its other state institutionalwelfare services (e.g. long-stay hospital wards), but thisis a question beyond the scope of the present paper.
London emerges as rather different from the rest ofthe country in terms of its care home profile and trend.This finding is consistent with other recent research,such as that done by the Robinson & Banks (2005). Theeffect of property prices suggests that decline in the useof residential care is not just a function of local authoritydecision-making and planning. London had the highestrate of decline in local-authority-owned care home re-sidents between 1991 and 2001, but not the local growthin the private sector to compensate for this. Social caremarkets are not confined to local areas, but have regionaland national characteristics. This implies that somepeople will find that the residential care services whichthey need are not situated in their own locality andDepartment of Health data on ‘funded places’ demon-strates this when contrast with the Census counts.
Areas with apparently low levels of local-government-funded places are likely to be subject to two phenomenawhich cannot be precisely disentangled from our Censusdata:
• importing of residents, probably mainly from the ‘exporters’ identified in Table 7; and
• situations in which substantial numbers of people will be paying wholly for themselves.
The first of these phenomena will tend to be concen-trated close to the exporting areas. In most cases, a lowratio of supported residents to residents overall indi-cates the presence of a private sector upon which theimpact of public care support policy was relatively low,with developments in the private market rather thanpublic policy which will then tend to be driving changein these places. An inspection of the geographical loca-tions of the places listed in Table 8 (and compared withthe locations listed in Table 7) suggests that the latterphenomenon was likely to have been dominant in allthe areas listed except Southend and Darlington. TheWest Country cluster of Bournemouth, Poole, Devon,Torbay and North Somerset is particularly noteworthy(Andrews & Phillips 2002). Here private sector declinewould not seem to be related primarily to local author-ity purchasing behaviour.
The implementation of the 1990 Act has been observedas a policy driven by a government committed to thedevelopment of the private and voluntary sectors, andtherefore, it may be questioned as to whether variationsin events might be influenced by local political resistance.Such a proposition was applicable to the evidence onthe decline in the local-authority-owned sector. Wistowet al. (1994, 1996) distinguished local authorities in termsof variations in their commitment to the local authoritysector, with party political affiliations playing a role inthis, whilst, at the same time, many were ‘pragmaticgradualists’. The strong drive towards privatisation by

Changes in residential care
© 2006 The Authors, Journal compilation © 2006 Blackwell Publishing Ltd 507
central government made it unlikely that local politicswould still be a source of difference between authoritiesby 2001, and this was confirmed by the present research.
These results do not support the idea that politicalcontrol has had an effect upon the decline of localauthority residential care and the ratio of local authorityhomes to non-local authority. The mean decline in localauthority homes as a proportion of all homes, althoughgreater in ‘Continuously Conservative’ authorities, wasnot at a statistically significant level given the smallsubsample size.
In any case, it may be that the dichotomy betweenLabour and Conservative control was reflecting socio-economic differences between areas, with the formerbeing less-fertile ground for private care home investors.Nevertheless, evidence from Scotland and Wales doesnot easily support such a view. In both cases, the declinein the local authority sector was strong, but in Scotland,this was offset by strong private sector growth, althoughnot in Wales.
Conclusions
The present study has shown that the decline in the pro-vision of residential care in the UK was a combinationof an almost universal decline (when looked at localauthority by local authority) in publicly provided care,and a mixture of decline and growth in private provi-sions from place to place. There have been changes inboth the numbers of homes and numbers of residents.
The variations from place to place are hard to explain.Local politics has not had more than a marginal impactupon the decline of local authority homes. The behavi-our of the private sector may have been influenced bycost considerations in areas like London, and by thestrength of private demand in some of the areas wherelocal authority support for residential care was low.
The erratic pattern of change does not suggest arationally planned policy. This suggests that hardshipmay follow in some areas from an excessive decline inprovision – notably in the Inner London area in whichminority populations may be poorly served and the
‘decanting’ of people away from their home boroughsmay make contact with relatives more difficult. Hence, thedata suggest further questions about territorial justiceand the fitting of provision to need in the UK as a whole.
Acknowledgements
The Joseph Rowntree Foundation supported this projectas part of its programme of research. However, the factspresented and views expressed in this paper are thoseof the authors, and not necessarily the views of theFoundation.
References
Andrews G.J. & Phillips D.R. (2002) Changing local geogra-phies of private residential care for older people 1983–1999:lessons for social policy in England and Wales. Social Scienceand Medicine 55, 63–78.
Comas-Herrera A., Wittenberg R. & Pickard L. (2001) Projec-tions of Demand for Residential Care for Older People in Englandto 2020. PSSRU Discussion Paper 1719. PSSRU, University ofKent, Canterbury.
Dale A. (1993) The content of the 1991 Census: change and con-tinuity. In: A. Dale & C. Marsh (Eds) The 1991 Census User’sGuide, pp. 16–51. HMSO, London.
Grundy E. & Glaser K. (1997) Trends in, and transitions to,institutional residence among older people in England andWales, 1971–91. Journal of Epidemiology and CommunityHealth 51, 531–540.
Knapp M., Hardy B. & Forder J. (2001) Commissioning forquality: ten years of social care markets in England. Journalof Social Policy 30 (2), 283–306.
Netten A., Darton R. & Williams J. (2002) Closure of Care Homesfor Older People. Summary of Findings, No. 1. PSSRU, Univer-sity of Kent, Canterbury.
Office for National Statistics, General Register Office for Scot-land & Northern Ireland Statistics and Research Agency(2004) Census 2001: Definitions. The Stationery Office, London.
Robinson J. & Banks P. (2005) The Business of Caring: King’sFund Inquiry into Care Services for Older People in London.King’s Fund, London.
Wistow G., Knapp M., Hardy B. & Allen C. (1994) Social Carein a Mixed Economy. Open University Press, Buckingham.
Wistow G., Knapp M., Hardy B., Forder J., Kendall J. &Manning R. (1996) Social Care Markets: Progress and Prospects.Open University Press, Buckingham.