Embed Size (px)
Citation preview

1
Public reporting of health system performance: a rapid review of evidence on impact on patients, providers and healthcare organisations
Jack Chen
An Evidence Check review brokered by the Sax Institute
August 2010

2
This rapid review was brokered by the Sax Institute. This report was prepared by Jack Chen. © The Sax Institute, 2010. This work is copyright. It may be reproduced in whole or in part for study training purposes subject to the inclusion of an acknowledgement of the source. It may not be reproduced for commercial usage or sale. Reproduction for purposes other than those indicated above requires written permission from the copyright owners. Enquiries regarding this report may be directed to the: Manager Knowledge Transfer Program The Sax Institute www.saxinstitute.org.au Phone (02) 9514 5950 Fax (02) 9514 5951 Email: [email protected] Suggested Citation: Chen, J C. Public reporting of health system performance: Review of evidence on impact on patients, providers and healthcare organisations: An Evidence Check rapid review brokered by the Sax Institute (http://www.saxinstitute.org.au) for the Bureau of Health Information, 2010. Disclaimer: This Evidence Check review was produced using the Evidence Check methodology in response to specific questions from the commissioning agency. It is not necessarily a comprehensive review of all literature relating to the topic area. It was current at the time of production (but not necessarily at the time of publication). It is reproduced for general information and third parties rely upon it at their own risk.

3
Contents
Acknowledgements _____________________________________________________________ 4
List of Figures ____________________________________________________________________ 5
List of Tables _____________________________________________________________________ 5
Executive summary ______________________________________________________________ 6
Introduction ___________________________________________________________________ 6
Methods ______________________________________________________________________ 6
Results ________________________________________________________________________ 8
Summary ___________________________________________________________________ 14
The key success factors ______________________________________________________ 14
Introduction ___________________________________________________________________ 15
Methods ______________________________________________________________________ 16
The existing systematic reviews and the rationale for the choice of the baseline systematic review to update _________________________________________________ 16
The search strategy in conducting literature review ____________________________ 20
Aims, study selection and endpoints of the review _____________________________ 21
Data extraction and quality assessment ______________________________________ 22
Results ________________________________________________________________________ 23
Health plans ___________________________________________________________________ 24
Selection ___________________________________________________________________ 24
Quality improvement activity ________________________________________________ 25
Clinical outcomes and unintended consequences ____________________________ 26
Hospitals ______________________________________________________________________ 26
Selection ___________________________________________________________________ 26
Quality Improvement ________________________________________________________ 28
Clinical outcomes ___________________________________________________________ 29
Unintended Consequences __________________________________________________ 32
Individual providers ____________________________________________________________ 33
Selection ___________________________________________________________________ 33
Clinical Outcomes and Unintended Consequences ___________________________ 34
General comments on existing literature of effectiveness of public reporting ____ 35
What are the success factors for public reporting? _______________________________ 37
The importance of evidence-based guidelines __________________________________ 38
Appendix 1: The search strategies employed in Fung’s (2008) review _____________ 41
Appendix 2: Two summary tables of updated publications ______________________ 43
Appendix 3: Three summary tables adopted from the baseline systematic review by Fung (2008) ____________________________________________________________________ 65
References ____________________________________________________________________ 88

4
Acknowledgements The author would like thank the senior staff of the BHI for their helpful discussion regarding the scope, methodology and content of the review. The author also would like to thank Gabriel Moore of the Sax Institute for her valuable support during the review period. The author is grateful to Ms Lixin Ou for her help in searching and retrieving some of the articles. The views expressed in the review are entirely those of the author and should not be interpreted as that of the BHI or the Sax Institute. Needless to say, all errors remain the author’s own.

5
List of Figures Figure E1: Two pathways for improving performance through release of publicly reported performance data (Berwick et al. 2003) .............................................................. 7
Figure 1: Flow diagram of the search strategy and literature retrieval .......................... 21
Figure 2: Two pathways for improving performance through release of publicly reported performance data (Berwick et al. 2003) ............................................................ 22
List of Tables
Table E1: The components, rating criteria, symbol and categories used in summarising the study evidence in the current study............................................................................... 8
Table E2: The number of reviewed articles for each provider and outcome ................. 8
Table E3: The matrix of strength and direction of evidence .............................................. 9
Table 1: A comparison between three baseline reviews ................................................. 18
Table 2: The components, rating criteria, symbol and categories used in summarising the study evidence in the current study............................................................................. 23
Table 3: The number of reviewed articles for each provider and outcome ................ 24
Table 4: The matrix of strength and direction of evidence .............................................. 35
Table A.1a: Two summary tables of updated publications ............................................ 43
Table A.2a: Effect of public release of performance data on hospital/organisational providers ................................................................................................................................. 47
Table A.1b: Effect of public release of performance data on health plan (Fung (2008)) ..................................................................................................................................... 65
Table A.2b: Effect of public release of performance data on individual provider (Fung (2008)) .......................................................................................................................... 68
Table A.3b: Effect of public release of performance data on hospital quality (Fung (2008)) ..................................................................................................................................... 74

6
Executive summary Introduction Public reporting of heathcare performance, underpinned by accountability and transparency, fuelled by consumerism, autonomy and new information technology, is growing in momentum and becoming common practice globally. Public reporting in health takes a variety of forms. Health care performance reports such as report cards typically describe the outcomes of medical care in terms of mortality, selected complications, or medical errors and, to a lesser extent, economic outcomes. Increasingly, process measures (i.e., measurement of adherence to recommended health care practices, such as hand hygiene) are being used to gauge how well organisations adhere to evidence-based standards and models of best practice with the implicit assumption that good processes lead to good health care outcomes. Sometimes structural measures such as surgical volume for specific procedure of a hospital are also reported. Reporting can also vary in terms of levels of analysis, reporting performance for populations, regions, hospitals, teams and individual clinicians However, despite the widespread of the practice, previous systematic reviews reported that the evidence of the effectiveness of public reporting on quality of care is lacking. Commissioned by the Bureau of Health Information (BHI) of New South Wales, a newly formed independent, board-governed organisation established by the NSW government to be the leading source of information on the performance of the public health system in NSW with a mandate to provide objective, relevant and reliable information to the community and health care professionals that deliver services and formulate health policy, this review aimed to provide an update to the international evidence of public reporting of healthcare performance data on: 1) general public/patients; 2) healthcare professionals; and 3) provider organisations. Methods After deliberating on the strength, weakness and relevance of existing reviews on the topic, this review updates an existing systematic review (Fung et al. (2008)1 review) through a mixed methodology. We adopted Berwick and colleagues’ (2003)2 framework to guide our review. According to Berwick and colleague (Figure E1), the potential impact of public reporting on performance is through two pathways: 1) selection: consumers’ increased knowledge and awareness of healthcare providers’ performance will help them to make informed selection that may lead to the loss of market share for those low-performing services providers; this in turn will force them to make meaningful changes and improve their performance; 2) change: the increased knowledge and awareness of their own performance by service providers, perhaps through appealing to their professional ethos, will foster their quality improvement activities. Both pathways will, hopefully, lead to the final improvement of their performance and the quality of care.

7
We included articles with substantial content in presenting empirical evidence on the impact of public reporting on at least one of the above outcomes. We excluded non-English languages articles, opinion and theory articles, historical descriptions, review articles, and articles on awareness and comprehension of publicly reported performance data that did not also measure and present one of the above discussed endpoints (i.e. two pathways, performance, or unintended consequences). We extracted data and rated the data using similar methods used in Fung et al.’s (2008) review. We used a revised appraisal criteria adapted from the guidelines on assessment of quality improvement interventions3,4. We also created a global rating after the Grading of Recommendations, Assessment, Development, and Evaluation (GRADE) system5. The GRADE system has been recommended by the British Medical Journal since 2006. Full details of such rating scheme are presented (Table E1).
Figure E1: Two pathways for improving performance through release of publicly reported performance data (Berwick et al. 2003)

8
Table E1: The components, rating criteria, symbol and categories used in summarising the study evidence in the current study
Domain 1 Domain 2 Global (GRADE) Decision Components
Subject of public reporting (or study population) and study participants (sample)
Types of study (i.e. study designs)
Components from Domain 1 & 2 as well as adherence, dose-response gradient, precision and validity of the outcomes, uncertainty of direction of the results.
Rating criteria How well does the study sample represent the study population?
How strong is the study design both in terms of its external and internal validity?
How much weight does the current study add to the evidence-base taking into considerations of all the components above?
Symbol used & categories of rating
1* : no overlap 2*: modest overlap 3*: large overlap 4*: complete overlap
1*: weakest design 2* : moderate design 3*: strong design 4*: strongest design
√: little weight √√: moderate weight √√√: great weight
Results We retrieved more than 120 full text articles and identified 30 articles to be added to the 45 articles in Fung’s (2008) review. Our update has added substantial new evidence to the existing review. A summary of numbers of articles included in different areas are presented (Table E2). Table E2: The number of reviewed articles for each provider and outcome
Selection Quality improvement
Clinical outcomes
Unintended consequences
Health plan providers
11 2 2 1
Organisational Providers (e.g. hospitals, nursing homes)
14 16 25 11
Individual providers
7 0 1 6
Total 32 18 28 18
* Note that as some articles covered multiple endpoints, so the final sum (96) is greater than the number of reviewed articles (n=75).

9
A summary of the strength and directions of evidence is also presented (Table E3). Table E3: The matrix of strength and direction of evidence
Selection Quality Improvement
Clinical outcomes
Unintended consequences
Health plans Strong positive effect
Moderate positive effect
Not available Not available
Hospitals/Nursing homes
Considerable positive effect
Strongest positive effect
Strong positive effect
Uncertain effect or minor negative effect
Individual providers
Moderate positive effect
Not available Not available Considerable negative effect
A short summary of key findings are as follows: Health Plan:
• Selection: There is considerable and consistent evidence that public disclosure of performance information can and does influence plan choices.
• Quality improvement: There is some very early and limited evidence that public reporting has increased quality improvement activities of health plans.
• Clinical outcomes and unintended consequences: There is very little and uncertain evidence on the impact of public disclosure of performance data on clinical outcomes and unintended consequences at the health plan level.
Individual providers:
• Selection: there is some evidence that that public disclosure of performance information may influence consumers’ selection of individual providers, individual providers’ self-selection and contracting agency’s selection of doctors. However, the magnitude of these selections appears to be low.
• Quality improvement: no evidence.
• Clinical outcomes: no evidence (one study only).
• Unintended consequences: There is some evidence that public reporting may be associated with doctors’ risk-avoiding behaviours. There is also limited early evidence indicating that those socioeconomically disadvantaged groups may benefit less or be worse off from public reporting. Specific efforts in monitoring and reducing the possible disparity needed.
Organisational providers (e.g. hospitals/nursing homes):
• Selection: Recent evidence shows that public disclosure may be able to make significant and policy-important changes of consumers’ decisions in choosing hospitals in some settings. More evidence is needed in order to have confidence in this observation. A short summary of 14 studies included in this section is presented as follows.

10
↑ average 5% in non-emergency, Medicare patient volume from year to year due to rank changes
Pope et al. (2009)
↑ education, prior experience, reputation, physicians’ recommendations and insurance are influential
Mazor et al. (2009)
↑Refuse admissions to the hospitals with poor score Merle et al. (2009)
↑market share after the adoption of report cards for those better Assisted Reproductive Technology clinics
Bundorf et al. (2009)
↑ comprehension and better choices using adapted presentation strategies were more pronounced for participants with lower numeracy
Peters et al. (2007)
Small ↑in volume for “better” hospitals after releasing hospital morality & large ↓ after press report of single unexpected death
Mennemeyer et al.(1997)
No effect: 30 non federal hospitals of Ohio Baker et al. (2003)
No effect: 24 hospitals of Wisconsin Hibbard et al. (2005)
Small and transient ↑in volume for “better” hospitals after releasing risk-adjusted CABG related mortality data
Jha & Epstein, (2006)
Small and transient ↑in volume for “better” hospitals (CABG, AMI & postdiskectomy)
Romano & Zhou (2004)
Small and transient ↑in volume for “better” hospitals (NYS CSRS: CABG)
Chassin et al. (2002
Small and transient ↑in volume for “better” hospitals (NYS CSRS: CABG)
Mukamel & Mushlin (1998)
No effect: between volume and performance of hospitals (NYS CSRS: CABG)
Hanna (1994)
No effect: between volume and performance of hospitals (NYS CSRS: CABG)
Vladeck et al. (1988)
Note: NYS CSRS: New York State Cardiac Surgery Registration System; CABG: Coronary Artery Bypass Grating
• Quality improvement (QI): There is strong and consistent evidence in
supporting the notion that public disclosure of performance data stimulates quality improvement activities at hospital level. A short summary of 16 studies included in this section is as follows:
↑ QI in hospitals after public release of data on cardiac quality indicators within a 86-hospital cluster RCT
Tu et al.. (2009)
↑ QI in patients hospitalised with health failure Fonarow et al. (2007)
↑QI in 2/3 nursing homes after public reporting Zinn et al. (2008)
↑QI in all eligible hospitals Rask et al. (2009)
↑QI in stroke patients Stewart et al. (2006)

11
↑ QI in hospitals of NHS and better prioritising Mannion et al. (2005)
Small ↑ QI in non-federal hospitals in California Luce et al. (1996)
Small ↑ QI in non-federal hospitals in California Rainwater et al. (1998)
↑ QI in patients with AMI in Ontario Tu et al. (2003)
↑ QI in patients with hip/knee surgery, cardiac care and obstetric care in Wisconsin
Hibbartd et al. (2005)
↑ QI in patients with hip/knee surgery, cardiac care and obstetric care in Wisconsin
Hibbard et al. 2003
↑ QI in hospitals Rosenthal et al. (1998)
↑ QI in obstetric care in Missouri hospitals Longo et al. (1997)
↑ QI in hospitals with public reporting compared with the hospitals without public reporting
Bentley & Nash (1988)
↑ QI in hospitals (NYS CSRS project) Chassin et al. (2002)
↑ QI in hospitals (NYS CSRS project) Dziuban et al. (1994)
Note: NYS CSRS: New York State Cardiac Surgery Registration System; RCT: Randomised Controlled trial; AMI: Acute Myocardial Infarction
• Clinical outcomes: The results are mixed. However, the majority of studies
showed significant positive impact of public disclosure on the improvement of clinical outcomes. More recent literature tends to have better study design, data, analytic framework and covers different topics. Recent studies also are more likely to show a positive effect of public reporting (PR) on clinical outcomes. A short summary of 25 studies included in this section is as follows:
Improved postacute care in nursing homes; no change in rate of preventable rehospitalisation after PR
Werner et al. (2009a)
Improved postacute care in nursing homes; Improved care in both reported and unreported areas
Werner et al. (2009)
Better CMS patient-reported discharge planning indicators associated with small decrease of readmission rate
Jha et al. (2009)
Improved care in most but not all reported dimensions in nursing homes
Mukamel et al. (2008)
lower 30-day AMI mortality rate among early feedback group compared with later feedback group
Tu et al. (2009)
Improved care in hospitals receiving only feedback is similar to the improved care in hospitals with intensive QI collaboration
Kritchevsky et al. (2008)
Lower morality in patients with AMI, CHF, hemorrhagic stroke, ischemic stroke, pneumonia, and sepsis after PR
Hollenbeak et al. (2008)
Improved care (measured by 10 individual and 4 Lindenauer et al. (2007)

12
composite indicators) in hospitals with only public reporting is only marginally less compared with the care in hospitals with both public reporting and pay-for-performance
Improved patients’ satisfaction in Israel arm infirmaries in comparison with the control group
Levy et al. (2008)
More improved quality indicators (out of 7) in stroke care
Stewart et al. (2006)
Improved clinical outcomes for carotid endarterectomy in a moderate-to-low volume hospital compared to national benchmark
Sullivan et al. (2006)
Improved medication safety in Georgia after PR Rask et al. (2006) Lower mortality among CABG patients in California Li et al. (2010)
Lower mortality among CABG patients in Ontario; Similar improvement between public and private reporting
Guru et al. (2006)
Similar improvement in care between public and private reporting in obstetric care
Hibbard et al. (2005)
Lower mortality in hospitals (CHQC Program) Rosenthal et al. (1997)
No effect: mortality in hospitals (CHQC Program) Clough et al. (2002)
No effect: mortality in hospitals (CHQC Program) Baker et al. (2003)
Improved care in several outcomes among outlier hospitals after PR
Longo et al. (1997)
Lower mortality in hospitals after PR (NYS CSRS) Dziuban et al. (1994)
Lower mortality in hospitals after PR (NYS CSRS) Hannan et al. (1994a)
Lower mortality in hospitals after PR (NYS CSRS) Hannan et al. (1994b)
No effect: mortality in hospitals (NYS CSRS) Ghali et al.(1997)
Lower mortality in hospitals in NY compared with the national trends (NYS CSRS)
Peterson et al. (1998)
Lower raw mortality among percutaneous coronary intervention (PCI) ) in hospitals of NY compared with the rate in Michigan; no effect on adjusted mortality
Moscucci et al. (2005)
Note: NYS CSRS: New York State Cardiac Surgery Registration System; CHQC: Cleveland Health Quality Council; CABG: Coronary Artery Bypass Grating; AMI: Acute Myocardial Infarction; CHF: Chronic Heart Failure.
• Unintended consequences: There is growing number of studies that assess the
unintended consequences of public reporting. Despite the limited evidence, more recent studies do not provide evidence to support long-running concerns on access issues for CABG patients and cream skimming admissions for nursing home residents. The evidence on appropriateness of antibiotics timing measures in pneumonia patients is mixed and more research is needed.
No negative consequences on CAGB patients in Li ,. (2010)

13
California
Only limited degree of cream skimming occurred in nursing homes
Mukamel et al. (2009)
Public reporting of antibiotic timing score was NOT associated with increased pneumonia diagnosis, antibiotic use, or a change in patient prioritisation
Firedberg et al. (2009)
Antibiotic timing score may lead to negative unintended consequences
Drake et al. (2007)
Reduction in the overall cases conducted by a surgical trainee in the UK
Khan et al. (2007)
Possible risk-avoiding by doctors for PCI patients in NY
Moscucci et al. (2005)
Possible risk-avoiding behaviours by doctors for CABG patients in NY
Dranove et al. (2003)
No strong evidence of risk-avoiding behaviours by doctors for CABG patients in NY
Peterson et al. (2003)
Possible risk-avoiding behaviours by doctors for CABG patients in NY
Omoigui et al. (1996)
Potential early discharge of sicker patients in order to improve hospital mortality rate
Baker et al. (2006)
Potential for tunnel version, distortion of priorities and disincentive to the higher performers to improve
Mannion et al. (2005)
Note: CABG: Coronary Artery Bypass Grating; PCI: Percutaneous Coronary Intervention

14
Summary Our review results further confirmed the belief that public reporting can significantly stimulate quality improvement activity at hospital level, and that the quality of care and clinical outcomes of hospitals after the public disclosure are more likely to improve, possibly due to the greater quality improvement activity. The literature in general supports the notion that consumers are able to utilise the health information, whether it is sponsored by government or private sector, to make informed choices. Such choices could be made at individual care providers level (such as doctors), or at hospital and health plan level. There is evidence that public reporting can give rise to unintended consequences. Such consequences can be both negative (such as risk-avoidance by doctors) and positive (such as the improvement of care in unreported areas in nursing homes). Overall, public reporting holds great promise in achieving its potential provided that the risks are properly managed. The key success factors It is important to note that a successful public reporting endeavour requires a great deal of coordinated effort and significant investment at the outset. Some of the important success factors in the literature are to: 1) establish a centralised, arm-length government agency to coordinate public
reporting; such an agency should have clearly specified jurisdictions and the necessary resources to provide the leadership and oversight of all public reporting activities;
2) establish an evidence-based, culturally relevant guideline on public reporting; such guideline should consult widely different stakeholders, engage clinical governance and leadership, and have transparent principles and methodology;
3) set up clear objectives (such as the enhancement of executive accountability versus quality improvement) and find the right audiences;
4) develop the right content according to the objectives, pre-test the product and distribute it through the most appropriate channels (available at the right place, at the right time, in the right quantities, to the right people);
5) understand the political and economic environment, change the culture of provider organisations and engage the public and media;
6) monitor and minimise the negative unintended consequences of public reporting;
7) provide timely evaluation of the public reporting activity itself and apply the lessons learnt to new endeavours;
8) set-up a research agenda on specific issues that are important for the success of public reporting such as the development of standardised measures and building the necessary data and information infrastructure for public reporting.

15
Introduction A decade ago, two landmark Institute of Medicine (IOM) reports—To Err Is Human: Building a Safer Health System (IOM, 2000) and Crossing the Quality Chasm: A New Health System for the 21st Century (IOM, 2001)6 7 stimulated unprecedented levels of concern about, and action to improve, the quality of health care. The six aims for quality improvement as specified in the Quality Chasm report - better safety, effectiveness, patient-centredness, timeliness, efficiency, and equity - have catalysed significant change throughout healthcare systems internationally. The “quality of care” movement has had a profound influence on governments, not-for-profit organisations, professional associations, payers, regulators, accrediting bodies, and consumer groups around the world. However, despite considerable activity and significant investments, the quality chasm in health care remains wide, the pace of changes often appears slow, and the lessons learned are fragmented. In the same spirit, another major reform attempt from Institute of Medicine (2006)8, reported in: Performance measurement: Accelerating improvement, documented that a great number of new initiatives is now under way. The new initiatives include public reporting, pay-for-performance, and ongoing quality improvement programs that are aimed at enhancing quality. Many public- and private-sector health care programs now engage in public reporting of data that allows comparison of the quality of institutional and provider performance. Public reporting in health takes a variety of forms. Health care performance reports such as report cards typically describe the outcomes of medical care in terms of mortality, selected complications, or medical errors and, to a lesser extent, economic outcomes. Increasingly, process measures (i.e. measurement of adherence to recommended health care practices, such as hand hygiene) are being used to gauge how well organisations adhere to evidence-based standards and models of best practice with the implicit assumption that good processes lead to good health care outcomes. Sometimes structural measures such as surgical volume for specific procedures of a hospital are also reported. Reporting can also vary in terms of levels of analysis, reporting performance for populations, regions, hospitals, teams and individual clinicians. A recent review of hospital reporting initiatives found 45 web sites in the United States and two in other countries (Delmarva Foundation, 2005)9. In the United States, the Health Care Financing Administration (HCFA) – now the Centers for Medicare and Medicaid Services (CMS) – took the lead in this area with the release of hospital-specific coronary artery bypass grafting (CABG) mortality in 1987. Currently, CMS produces comparative quality reports on many of its participating providers, including health plans, hospitals, nursing homes, home health agencies, and renal dialysis centres (CMS, 2010)10. The National Committee for Quality Assurance (NCQA) of the USA makes available comparative quality information on health plans (NCQA, 2010)11. State governments, private purchasers, coalitions, and others operate additional public reporting programs (AHRQ, 2010; CMS, 2010; The Joint Commission, 2010; New York State Department of Health, 2010)10,12-14. In the United Kingdom, the great effort to increase investment in health services and modernise the English National Health Service has led to a series of carefully developed National Service Frameworks to guide this massive new investment and to ensure the value of the Modernisation Program8,15. Various agencies and departments within the government led the work in developing hundreds of goals, benchmarks, and associated measures for targeted clinical areas, such as heart disease, cancer care, orthopaedics, and primary care in order to measure, track, and report on progress. In Canada, public reporting is conducted by provincial and federal governments, advocacy groups, independent agencies, and increasingly by arm’s-length agencies established by

16
governments such as Canadian Institute for Health Information and Health Quality Council (Wallace et al. 2007)16. Despite the huge investment globally in public reporting and its potential policy implications, a recent systemic review on the effectiveness of public reporting by Fung et al. (2008) concluded that evidence is scant and the research is lacking.
The purpose of this review is to provide a rapid update on international evidence regarding the impact of public disclosure of healthcare performance data on: 1) general public/patients; 2) healthcare professionals; 3) provider organisations. This review also involves identifying factors that maximise the beneficial impacts of public reporting.
The review was commissioned by the Bureau of Health Information (BHI) of New South Wales. The BHI is a newly formed independent, board-governed organisation established by the NSW government to be the leading source of information on the performance of the public health system in NSW. The BHI’s mandate is to provide objective, relevant and reliable information to the community and health care professionals that deliver services and formulate health policy. As one of the “four pillars of reform” identified by Peter Garling SC, the BHI works closely with the Agency of Clinical Innovation (ACI), the Clinical Excellence Commission (CEC, and the Clinical Education and Training Institute (CETI). The work was conducted with input from senior staff of the BHI with respect to its scope, methodology, focus and review outcomes.
Methods The existing systematic reviews and the rationale for the choice of the baseline systematic review to update There are existing systematic reviews of the impact of public reporting on quality of care (Fung et al. 2008; Marshall et al. 2000; Shauffer et al. 2001)1,17,18,F1. Marshall’s (2000)18 review was the first systematic review conducted on public reporting. Shaffer’s (2001)17 review included 31 studies between 1995-2000. There were no special literature search strategies and no inclusion and exclusion criteria stated. There were four major content areas covered in the review: 1) Consumers: consumer preferences for health plan performance measures (4 studies); impact of information on consumer preferences for health plan performance measures (2 studies); consumer choice of health plans (5 studies); patient choice of hospital (1 study); trusted sources of consumer report cards (3 studies); 2) providers: 11 studies in total - 7 on hospitals; 1 on physician groups, 3 on physicians; 3) purchasers: ( 1 study). Fung’s (2008) review is an update of Marshall et al.’s work albeit with a much tighter focus. It included 27 more articles that were not included in Marshall’s (2000) review. A comparison of three reviews is presented (Table 1). A recent scoping review published in Implementation Science (Brien et al. 2010)19 provides a comprehensive search of relevant literature on health system reporting. Scoping reviews utilise a novel methodology for systematically assessing the breadth of a body of literature in a particular research area. The Brien review was performed based on the methodology outlined by Arksey and O’Malley20 of the University of York. It searched 14 peer reviewed and grey literature databases with English
F1 For simplicity, we will cite the reviews using the first author name hereinafter (i.e., Marshall’s (2000) review instead of Marshall et al.’ s (2000) review).

17
abstracts published between 1980 and June 2006 with update to November 2008. Topic areas represented by this review included the effectiveness of health system report cards (n=194 articles), methodological issues in their development (n=815 articles), stakeholder views on report cards (n=144 articles), and ethical considerations around the development of a report card (n=69 articles). The references were stored in an accessible online database. In the course of our review we examined the title and description of each article published after 2006 in both the effectiveness section and the stakeholders’ views section of the database to assess their appropriateness for inclusion in our study. It is worth noting that around 160 articles published before 2006 were included in the effectiveness section in Brien’s (2010) online database; a figure that is much higher than the number of articles included in Fung’s (2008) review (45 studies between January 1999 and March 2006).

18
Table 1: A comparison between three baseline reviews
First author, year
Aim and review scope Time span and the Search Strategy
Search Terms Articles included in the review
Major conclusions
Marshall, 2000
To examine the research evidence to determine the extent to which the expectations of public disclosure have been realised and identify a future research agenda. To assess the impact of public disclosure on quality of care and the financial cost.
Between January 1986 and October 1999 using MEDLINE and EMBASE electronic databases; assisted by a professional librarian; only original research articles were included. All citations were reviewed and leading authors contacted.
Medical Subject Headings: report cards, public performance reports, provider profiling, public/consumer/patient information, and consumer reports.
31 peer-reviewed articles included; a total of 21 publications were found relating to 7 reporting systems in the USA.
Consumers and purchasers rarely search out the information and do not understand or trust it; it has a small, although increasing, impact on their decision making. Physicians are sceptical about such data and only a small proportion use it. The use of the information by provider organisations for quality improvement may be the most productive area for further research.
Shaffer, 2001
To evaluate the evidence on the impact of consumer report cards on the behaviour of consumers, providers, and purchasers.
Between 1995 and 2000 using Medline and Healthstar to identify papers published.
Not available. 32 publications included in the review.
Consumer report cards do not make a difference in decision making, improvement of quality, or competition. Consumers desire information that is provider specific and may be more likely to use information on rates of errors and adverse outcomes.

19
Fung, 2008 To synthesise the
evidence for using publically reported performance data to improve quality. Only articles that provided empirical evidence on the impact of public reporting on outcomes (effectiveness, patient safety, and patient-centeredness) and unintended consequences, as well as the selection and quality improvement activity were included.
Between January 1999 and March 2006 using Web of Science, MEDLINE, Econlit, and Wilson Business Periodicals Abstract; assisted by a professional librarian; only original research included; all citations were reviewed and leading authors contacted.
Comprehensive (see Appendix 2).
45 articles included in the review including 18 publications from Marshall’s (2000) review list.
Evidence is limited, particularly with regard to the impact on individual providers and practices. Rigorous evaluation of many major public reporting systems is lacking. Evidence suggests that publicly releasing performance data stimulates quality improvement activity at the hospital level. The effect of public reporting on effectiveness, safety, and patient-centeredness remains uncertain.

20
After carefully reviewing the existing review articles, we decided to adopt Fung’s (2008) review as the baseline for our update for following reasons: 1) it is the most recent systematic review conducted with methodological rigor; 2) the search strategy was comprehensive and professionally designed; 3) the scope and inclusion criteria of the review are pertinent to our current review purposes; 4) the review methodology as well as the GRADE framework in assessing the quality of study is very sound. The search strategy in conducting literature review We developed a mixed methodology in our literature search in order to maximally identify the recent literature in a short period of time. We have conducted our search in five different ways. First, we reviewed all the publications that cited Fung’s (2008) review. Second, we reviewed the effectiveness literature database that was provided online by Brien’s (2010) scoping review. Third, we re-ran the search strategy used by Fung’s review in Scopus database and reviewed all the titles of retrieved articles. Fourth, we searched the Cochrane literary and Scopus database with a much simplified search strategy (i.e. using text terms “public report*” OR “report card*” in title, abstract and key words) in order to retrieve more specific publications both for original research articles and review articles. We also reviewed reference lists of important publications to identify potential eligible publications to be included in the review. We limited our search to Scopus and Cochrane library databases. The justification for relying heavily on Scopus in our search are: 1) it is the largest abstract and citation database of peer-reviewed literature and quality web sources; 2) it has tools to track, analyse and visualise research; 3) it covers nearly 18,000 titles from more than 5,000 international publishers, including 100% coverage of Medline titles, making any search of using Medline redundant; 4) it has powerful and efficient features in retrieving full-text publications. Scopus’s references tracking feature is well suited for our forward search strategy as discussed below. The following flow diagram shows the number of articles retrieved, title and abstracts reviewed, and full text articles reviewed (Figure 1). Fung’s (2008) review added 27 articles over an eight-year period to Marshall’s (2000) review and our current update added 30 new publications over a 4-year period to Fung’s (2008) review.

21
Figure 1: Flow diagram of the search strategy and literature retrieval
Aims, study selection and endpoints of the review In this review, our aims are similar to those stated in Fung (2008)’s review. That is, we aim: 1) to synthesise the evidence for using publicly reported performance data to stimulate quality improvement activity, after selection of providers, and improve clinical outcomes; 2) to assess the extent of unintended consequences after public reporting. We adopted Berwick and colleagues’ (2003)2 framework to guide our review. According to Berwick and colleague (Figure 2), the potential impact of public reporting on performance is through two pathways: 1) selection: consumers’ increased knowledge and awareness of healthcare providers’ performance will help them to make an informed selection that may lead to the loss of market share for those low-performing service providers; this in turn will force them to make meaningful changes and improve their performance; 2) change: the increased knowledge and awareness of their own performance by the service providers, perhaps through appealing to their professional ethos, will foster their quality improvement activities. Both pathways will, hopefully, lead to the final improvement of their performance and the quality of care. Such quality of care can be measured on different domains such as effectiveness of care, safety, and patient-centredness. As public reporting may produce unexpected responses from complex societal and healthcare system interactions, it may entail unintended consequences that should be carefully monitored.
The search on reference list from Fung (2008) (n=94)
The forward search on Fung (2008) (n=73)
The search of literature database by Brien’s (2009) review (n=195 & n=146)
The search on TKA for review articles since 2006 on Scopus(n=114)
45
The search on title, keywords and abstract (TKA) for original articles since 2006 on Scopus (n=463)
24
28
In total, 122 full text articles retrieved 30 articles used to update Fung (2008)’s review
6
The search on TKA from Cochrane library all years (n=19)
0
The search from reference lists and other sources (n=19)

22
Figure 2: Two pathways for improving performance through release of publicly reported performance data (Berwick et al. 2003)
We adopted the same inclusion criteria as used in Fung’s (2008) review. The articles included should have substantial content in presenting empirical evidence on the impact of public reporting on at least one of the following outcomes: 1) selection; 2) change; 3) performance (effectiveness, patient safety, and patient-centredness); 4) unintended consequences. We excluded non-English language articles, opinion and theory articles, historical descriptions, review articles, and articles on awareness and comprehension of publicly reported performance data that did not also measure and present one of the above discussed endpoints (i.e. two pathways, performance, or unintended consequences). To reflect the demanding and complex nature of evaluating public reporting initiatives, the studies eligible to be included have a variety of designs including but not limited to randomised controlled trials (RCTs), controlled before-after trials (CBA) and interrupted time series (ITS). ITS designs have a longitudinal character, with repeated measurements and at least 3 data points before and after the intervention point. Data extraction and quality assessment Data extraction was performed in accordance with the methods outlined in Fung’s (2008) review. We listed all qualifying studies chronologically and assessed their objectives, reporting systems (ie: Nursing Home Compare by CMS), participants, and designs. We classified reporting systems and subsequent participants or sample as domain one and rated it on a 4-point scale representing how closely the participants or reporting systems overlap with the characteristics and needs of the intended study populations. For example, for a study conducted in the USA we will rate it based on the overlap with the characteristics and needs of the privately insured or Medicare population that would probably be the target of most major public reporting initiatives (on this scale, 1 star indicates no overlap and 4 stars indicate complete overlap). We classified study design as domain two and rated it on 4 categories, with

23
1 star indicating the weakest design and 4 stars indicating the strongest design. We used a revised appraisal criteria adapted from the guidelines on assessment of quality improvement interventions3,4. We also created a global rating after the Grading of Recommendations, Assessment, Development, and Evaluation (GRADE) system5. The GRADE system has been recommended by BMJ since 2006 (through its “Instructions to Authors” on bmj.com) that authors should preferably use the GRADE system for grading evidence when submitting a clinical guidelines article. It has multiple advantages and is useful for systematic reviews and health technology assessments, as well as evaluating research on clinical guidelines. The global rating that we created was based on the integration of domain 1 and domain 2 ratings, as well as the penetration of report card use (adherence), dose-response gradient, precision and validity of outcomes (potential confounding factors and biases), and uncertainty of direction of the results. The global rating has three categories. We indicated that the study should carry great (3 checks), moderate (2 checks), or little (1 check) weight when considering the strength of evidence. An illustration of the rating scheme is presented (Table 2). Table 2: The components, rating criteria, symbol and categories used in summarising the study evidence in the current study
Domain 1 Domain 2 Global (GRADE) Decision Components
Subject of public reporting (or study population) and study participants (sample)
Types of study (i.e. study designs)
Components from Domain 1 & 2 as well as adherence, dose-response gradient, precision and validity of the outcomes, uncertainty of direction of the results.
Rating criteria How well does the study sample represent the study population?
How strong is the study design both in terms of its external and internal validity?
How much weight does the current study add to the evidence-base taking into considerations of all the components above?
Symbol used & categories of rating
1* : no overlap 2*: modest overlap 3*: large overlap 4*: complete overlap
1*: weakest design 2*: moderate design 3*: strong design 4*: strongest design
√: little weight √√: moderate weight √√√: great weight
We made no attempt to quantitatively synthesise the results and the data were too heterogeneous to support pooling. Results Our multiple search strategies yielded 30 new publications that were eligible to be included in the update. Data from previous review were summarised in three large tables. To assist interpretation, we listed the tables in Appendix 3 and re-labelled the titles (Table 1, 2, Appendix Table 2 to Table A.1b, A.2b and A.3b, respectively). We re-organised the entries of each table chronologically according to the publication date and kept other content of the tables unchanged. We present our summary tables from the new studies in Table A.1a and Table A.3a for health plans and hospitals results, respectively (Appendix 2). As we were unable to identify any new publications relating to individual providers, the corresponding Table 2a is not listed.

24
Within each table, we stratified the results by selection, quality improvement (if applicable), clinical outcomes and unintended consequences. The number of articles included in the previous review and current update are presented according to provider level (i.e. individual providers, organisational providers, and health plan providers) and outcomes (Table 3). Table 3: The number of reviewed articles for each provider and outcome
Selection Quality improvement
Clinical outcomes
Unintended consequences
Health plan providers Fung’s review 8 0 1 1
Current update 3 2 1 0 Total 11 2 2 1
Organisational Providers (e.g. hospitals, nursing homes) Fung’s review 9 11 11 6
Current update 5 5 14 5 Total 14 16 25 11
Individual providers Fung’s review 7 0 1 6
Current update 0 0 0 0 Total articles 7 0 1 6
Total 32 18 28 18 * Note that as some articles covered multiple endpoints, so the final sum (96) is great than the number of reviewed articles (n=75). We discussed the impact of public reporting firstly by provider level and then by selection, quality improvement, clinical outcomes and unintended consequences.
Health plans Selection We identified 3 additional studies published since 2006 that brought the total number of the studies to 11 (with the eight from Fung’s review). The two new studies employed large longitudinal design and econometric models to examine the impact of public disclosure of performance data on customer choices. Chernew (2008)21 examined health plan enrolment decisions for approximately 70,000 active, non-union US GM (General Motors) employees between 1996 and 1997 after the distributing health plan ratings by GM to its employers. The study showed that the release of the heath plan rating had a statistically significant effect on health plan choices. Consumers were willing to pay about $330 per year per below expected performance rating avoided. There were large variations in valuations across different performance domains, but no significant evidence of heterogeneity based on observable employee characteristics or unobservable dimensions. In another study by Dafny (2008)22 which examined the relationship between enrolment and quality before and after report cards were mailed to 40 million Medicare beneficiaries in 1999 and 2000, the authors found that public report card and market-based learning produced substantial swings in Medicare HMO (Health Management Organisation) market share during the study period 1994–2002. Market-based learning was largest in markets with private-sector report cards, which provides secondary evidence that

25
report cards are an effective means of disseminating quality information, whether publicly or privately sponsored. The study also showed that the effect of the government-issued report cards is entirely due to customer satisfaction ratings; other reported measures did not affect subsequent enrolment. These two new studies added much weight to the already existing four studies with similar study design included in Fung’s review. The four previous studies showed that Harvard University employees (Beaulieu et al. 2002)23, and federal employees (Wedig and Tai-Seal, 2002; Jin and Sorenson, 2006)24,25 were all more likely to choose the health plan associated with higher quality score. Chernew’s (2008)21 study also was consistent with an earlier study on GM employees (Scanlon, 2002)26 which showed that General Motor employees tended to avoid plans with below-average ratings and would be willing to pay more for better plans. In a randomised controlled trial, Uhrig (2006)27 showed that integrated comparative information on costs, benefits, and quality of health plans increased the use of quality information, and the quality information was rated as being more important in choice decisions. Simplified terminology, increased use of white space, improved formatting, and shorter lengths increases the likelihood of selecting a high-quality health plan. Spranca (2000)28 tested a hypothetical health plan on 311 privately insured adults with an experimental design and showed that CAHPS (Consumer Assessment of Healthcare Providers and Systems) rating could affect consumer selection of health plans and ultimately contain costs, while two randomised controlled trials (Farley ,. 2002a, 2002b)29 30 of disclosure CAHPS rating on HMO Medicaid plans choices showed that health plan performance information can influence plan choices by Medicaid beneficiaries, but will do so only among those who actually read it. Quality improvement activity Existing reviews reported no evidence in this area. Our update found two studies. London and colleagues31 (2008) examined the state of quality monitoring and management activities of health plans in the USA through a survey of 252 medical directors of commercial HMOs with a very high response rate (96%). The authors found that almost all health plans measured their performance on multiple indicators of quality. The majority of health plans also collected data at the level of the individual physician or group and used this data in quality improvement activities, but not in public reporting. A recent Canadian study by Duvalko et al. (2009)32 described the structure and examined the impact of Cancer Care Ontario’s Clinical Governance FrameworkF2. The framework aimed to: 1) develop system-level quality indicators; 2) use data for developing clinical guidelines; 3) transfer knowledge through a coordinated program and clinical engagement; 4) use contractual agreements, financial incentives and public reporting. The authors found that adherence to clinical practice guidelines of colorectal cancer surgery increased between 2004 and 2006 and 13 out of the 14
F2 This study may not be strictly on health plans but due to its emphasis on system-level performance and complex structure, we listed the study here for discussion.
Overall, there is considerable and consistent evidence that public disclosure of performance information can and does influence plan choices.

26
Regional Cancer Programs (RCP) had a plan to meet the thoracic cancer surgery standards in 2008. Clinical outcomes and unintended consequences Duvalko (2009)32 also reported that through the implementation of Cancer Care Ontario’s Clinical Governance Framework, the cancer surgical waiting time and the variability has decreased among different regions between 2005 and 2008. Bost (2001)33 reported that health plans that voluntarily report performance data achieved better performance in quality of care, technical measures (Health Employers Data and Information Set: HEDIS) and patient experience. However, McCormic (2002)34, in a retrospective cohort study, showed that lower quality-of-care plans are more likely than higher-scoring plans to stop publicly reporting their quality data. Hospitals Selection We identified five new studies in addition to the 9 studies from Fung’s (2008) review. Out of the total of fourteen, six studies explored the impact of hospital selection after public disclosure of the data by New York State Cardiac Surgery Reporting System (NYS CSRS) (1991-present). Using earlier period data, Vladeck and colleagues35 (1988, study period: 1985-1992) and Hanna36 (1994; study period: 1984-1992) found no association between overall mortality rate outlier status and hospital volume of GABG (Coronary Artery Bypass Grating) operations. However, Mukamel & Mushlin37 (1998; study period: 1990-1993) and Chassin et al.38 (2002, study period: 1989-1995) found that hospitals with better outcomes experienced higher rates of growth in market share but the changes in market share were small and not lasting. These studies have the limitations of only including few data points, failing to adjust for several possible determinants of provider volume and failing to consider short-term effects (Romano and Zhou, 2004)39. Romano and Zhou (2004)39 studied impact of public reporting on CABG in New York, acute myocardial infarction (AMI) mortality and postdiskectomy complications in California. The study results were generally consistent with previous studies that public reporting of risk-adjusted performance indicators appears to have relatively small and transient effect on consumer behaviour as measured by hospital volumes. The most recent study on NYS CSRS (Jha & Epstein, 2006)40 confirmed such findings using more data points (study period: 1989-2002). Two other studies also demonstrated the lack of impact of report cards on market share in 30 non-federal hospitals of Ohio (Baker et al. 2003)41 and in 24 hospitals of Wisconsin (Hibbard et al. 2005)42. However, Mennemeyer and colleagues (1997)43 reported observing a small
In summary, there is some very early and limited evidence that public reporting has increased quality improvement activities of health plans. There is a need for further research in this area.
In summary, there is very limited and uncertain evidence in this area.

27
but statistically significant association between releasing hospital-specific mortality and utilisation, in contrast to the fact that press reports of single, unexpected deaths were associated with a relatively large effect. The previous review studies in general seem to show little evidence in supporting the expectation that the public disclosure would increase the market share of those higher-performing hospitals. However, the newly added five studies paint a different picture.
• Peters et al. (2007)44 conducted a randomised controlled trial and reported that comprehension of cost, quality of information, and choice of a better-quality hospital, all increased when less information was presented or when most important information was highlighted. Different symbols had different effects on comprehension and choice. Increased comprehension and better choices induced by adapted presentation strategies were more pronounced for participants with lower numeracy.
• Using a large population database between 1995 to 2003 including 440 clinics which were the members of the Society for Assisted Reproductive Technology (SART), Bundorf et al. (2009)45 showed not only that clinics with higher birth rates had larger market share after the adoption of report cards relative to before, but also that clinics with a disproportionate share of young, relatively easy-to-treat patients had lower market share after adoption versus before, and that report cards had larger effects on consumers and clinics from states with ART insurance coverage mandates. One of the strengths of the study is that its outcome measure (i.e. the baby count) is less susceptible to measurement errors.
• Through surveying 381 patients from 29 French hospitals, Merle et al. (2009)46 showed that close to one quarter of patients would refuse admission to the hospitals with poorer infection control scores but more than half indicated that they would consult with their general practitioners.
• Mazor et al. (2009)47 showed that consistency of indicators, data presentation, report format, or inclusion of confidence intervals had no significant impact on consumers’ understanding but education did. Prior experience, reputation, physicians’ recommendations and insurance coverage were also influential on their decision in choosing hospitals.
• More recently in a large observational cohort study, Pope et al. (2009)48 found that hospitals that improve their rank are able to attract significantly more patients. The average hospital in the sample experiences a 5% change in non-emergency, Medicare patient volume from year to year due to rank changes.
In summary, recent evidence shows that public disclosure may be able to make significant and policy-important changes of consumers’ decisions in choosing hospitals in some settings. More evidence is needed to be confident on this observation.

28
Quality Improvement Our review identified five studies in this area adding further weight to the existing 11 publications that support the notion that public disclosure of performance data stimulates quality improvement activity.
• Stewart and colleagues (2006)49 surveyed a sample of 16 hospitals of various sized and types in Oregon that were part of Oregon Stroke Centers Prototype Registry in order to assess whether ongoing data completeness reports and monthly comparative quality reports will stimulate changes in the acute care process. The authors found that 12 out of 16 sampled hospitals utilised the report to make changes in their hospitals over the year.
• Using two case studies, Rask and co-workers50 (2006) showed hospital participation in the Partnership for Health and Accountability (PHA), a voluntary quality improvement and patient safety program focused on comprehensive evaluation and feedback in Georgia. PHA publishes an annual state-wide hospital-specific report, Insights, available to the public. The study found that hospital participation in PHA-sponsored programs has increased each year, with all eligible hospitals participating in at least one PHA program.
• With a sample of 1502 nursing homes, a 10% random sample of all facilities listed in the first publication of the Nursing Home Compare Report by CMS, Zinn and associates (2008)51 reported that close to two-thirds of nursing homes took some actions in responding to the public report. Whether, when, and how nursing homes reacted to publication of federally reported quality measures is associated with four strategic orientation types: Defender, Analyser, Prospector, and Reactor.
• In an experimental design study, Fonarow and colleagues (2007)52 showed that through a national hospital-based initiative on quality of care in patients hospitalised with heart failure (HF) with data reported on a web-based information system that allowed participating hospitals to review their performance data in real-time, benchmarked to aggregate data from similar national and regional hospitals, the participating hospitals were associated with an increase in use of evidence-based therapy, adherence to performance measures, and shorter lengths of stay in patients hospitalised with HF. Increased use of process-of-care improvement tools was associated with further improvements in quality of care.
• Tu and colleagues (2009)53 conducted a well-executed 86-hospital cluster randomised trial and found that the public release of data on cardiac quality indicators effectively stimulates hospitals to undertake quality improvement activities. The results showed that: a) the early feedback group were significantly more likely to report starting 1 or more quality improvement initiatives; b) unexpected initiation of quality improvement activities in the late feedback group that may indicate a potential Hawthorne effect.
Previously, two studies showed that public reporting of CABG surgery mortality performance data influences quality improvement activity among New York hospitals (NYS CSRS project, Dziuban and colleagues, 1994; Chassin et al. 2002)38,54. In a descriptive comparison of 21 Pennsylvania hospitals subjected to public reporting with 8 New Jersey hospitals which were not required to publicly report performance results, a great amount more quality improvement activity occurred in Pennsylvania hospitals than in New Jersey hospitals (Bentley and Nash, 1998)55. Studies also

29
consistently showed the positive public reporting impact on other topical areas at different settings: obstetric care in Missouri hospitals (Longo et al. 1997)56, risk-adjusted hospital mortality data in Cleveland hospitals (Cleveland Health Quality Council project (CHQC), Rosenthal et al. 1998)57, summary measures of adverse events and 3 clinical areas – hip/knee surgery, cardiac care, and obstetric care in Wisconsin (Quality Counts project, Hibbard et al. 2003; 2005)42,58, hospital-specific AMI data in Ontario hospitals (Tu et al. 2003)59. However, two studies reported a rather weak impact of reporting risk-adjusted hospital mortality data in Californian non-federal hospitals (California Hospital Outcome Project (CHOP); Luce et al. 1996; Rainwater et al. 1998)60,61. In a case series study, Mannion et al. (2005)62 described the impact of the National Health Services (NHS) star performance ratings on quality improvement efforts targeted on all hospital trusts in England, the authors found that the ratings played an important role in transmitting central government priorities and helped direct and concentrate front-line resources, despite the fact that, in several instances, public reporting provided disincentives for improvement activity. Clinical outcomes Twenty-five articles are included in our review (14 of them published after 2006) which makes this area the one with the largest amount of recent research activity. Six studies assessed the impact of cardiac public reporting programs in New York on hospital mortality. Three early studies (Dziuban et al. 1994; Hannan et al. 1994a; 1994b)36,54,63 reported a significant risk-adjusted mortality rate reduction after the implementation of the NYS CSRS, although the studies failed to account for secular trends or migration in or out of the state. However, Ghali and colleagues64 (1997) compared the risk-adjusted mortality rate of Massachusetts hospitals (which did not have a state-wide public reporting of CABG outcomes during the study period) with those in New York and found that both mortality rates decreased in a similar rate. Peterson and colleagues65 (1998) reported that the decrease of 30-day adjusted and unadjusted CABG mortality rate was greater in New York compared with the national trends. Using New York and Michigan’s percutaneous coronary intervention (PCI) database (where Michigan acted as a control with no public reporting), Moscucci and co-workers (2005)66 reported that unadjusted morality rates were lower in New York than Michigan but adjusted mortality rates were not statistically different. Four studies assessed the impact of CHQC program. Rosenthal and colleagues (1997)67 reported that the implementation of CHQC program was associated with a reduction in the risk-adjusted in-hospital mortality rate. By comparing Cleveland hospitals with those in the rest of Ohio (where no public reporting systems), Clough and co-authors(2002)68 showed that both sets of hospitals had a similar rate of decline in in-hospital mortality. Baker and co-workers (2002)69 showed that the decrease in in-hospital mortality was offset by the increase in mortality after hospital discharge, which led to no net reduction in 30-day mortality. In a subsequent study, Baker and colleagues (2003)41 reported that the mortality rates in the high-mortality outlier hospitals did not statistically decrease after the report release. Using data from
In summary, there is strong and consistent evidence supporting the notion that public disclosure of performance data stimulates quality improvement activities at hospital level.

30
Missouri hospitals which were providing obstetrics care between 1989 and 1994, Longo and colleagues (1997)56 showed the outlier hospitals had improvements in rates of several outcome measures. In a controlled before-after trial, Hibbard and colleagues (2005)42 compared the impact of public, confidential, and no reporting on clinical outcomes as well as other measures. The authors found that both public and confidential feedback were associated with improved clinical outcomes and hospitals with lower obstetric performance at baseline significantly improved their outcomes in comparison with the 2 other groups. Fourteen studies published after 2006 included a variety of designs and covered quite diverse clinical areas with two new additions on CABG outcomes.
• Based on a controlled before-after trial, Guru and colleagues (2006)70 reported that the risk-adjusted 30-day mortality rate after CABG surgery in Ontario decreased 29% (95% CI: 21-39) from the era of no reporting (1991- 1993) to confidential reporting (1994-1998). There was no further decrease with public reporting (1999-2001). The control outcome of 30-day readmission did not decrease across reporting eras. In-hospital mortality fell significantly faster in Ontario during the period of confidential reporting than in other parts of Canada.
• Li and co-workers (2010)71explored the data from California CABG Outcomes reporting program and reported that total CABG volume decreased from 2003 to 2006 by almost 27% but patient case mix for most hospitals and surgeons was unchanged. Despite similar patient characteristics, the operative mortality for patients in the highest risk group was 26% lower in 2006 than in 2003.
• Stewart and colleagues (2006)49 surveyed a sample of 16 hospitals of various sizes and types in Oregon that were part of Oregon Stroke Centers Prototype Registry in order to assess whether ongoing data completeness reports and monthly comparative quality reports would stimulate changes in the acute care process. The authors found that the report-user group showed a range of 1 to 4 sustained changes in seven quality indicators over the last 3 months of the study. However, hospitals not using reported data showed 0 to 1 sustained changes in the seven quality indicators.
• Sullivan and colleagues (2006)72 assessed the outcomes for carotid endarterectomy after an institutional approach including public reporting in a 325-bed hospital with moderate-to-low procedure volume. The authors reported that the program achieved a total death and disabling stroke rate of 1.6% - compared favourably with the public benchmarks and discussed multiple factors that may have contributed to the success.
• Rask et al. (2006)50 described Partnership for Health and Accountability (PHA), a voluntary quality improvement and patient safety program focused on comprehensive evaluation and feedback in Georgia, the USA. The study found that participants in the Safe Medication Use initiative were associated with significant reductions in targeted medication errors, and 97% of the hospitals have reported their performance on Joint Commission on Accreditation of Healthcare Organisations core measures.
• Hollenbeak and colleagues73 (2008) employed a quasi-experimental design with interrupted time series and propensity score matching technique to ascertain associations between intensive public reporting and in-hospital mortality in 6 conditions: AMI, congestive heart failure (CHF), haemorrhagic stroke, ischemic stroke, pneumonia, and sepsis. The authors found that a more intensive public reporting was associated with significant improvement in outcomes in comparison with limited and no public reporting environment.

31
• A study (Levy 2008)74 from the Israeli army on the impact of a computerised online system that comparatively displays grades of patient satisfaction among primary care military infirmaries (intervention group) versus 130 defence force infirmaries (control group) reported that patient satisfaction improved in both groups at the end of the 1 year period but the magnitude of the improvement was greater in the intervention group.
• The relative importance and impact of pay-for-performance and public report on patient outcomes is the central focus of a large controlled before-after study by Lindenauer and colleagues (2007)75. The authors reported that both pay-for-performance combined with the public reporting group, and the public reporting only group, achieved significant improvement from the baselines and the hospitals in the combined group showed modestly greater improvements in quality than did the hospitals engaged only in public reporting.
• In contrast, in a randomised controlled trial on quality of preoperative antimicrobial prophylaxis, Kritchevsky et al. (2008)76 found that the intensive quality improvement collaborative group (including feedback of performance data) achieved similar improvement compared with the hospitals receiving only the comparative feedback.
• In a recent large cluster randomised controlled trial including 86 acute hospitals from Ontario to test the effectiveness of the early feedback group (on cardiac quality indicators) versus delayed feedback group on health care process and clinical outcomes improvement among AMI and CHF patients, Tu and colleagues (2009)53 found that the early feedback group had a significantly lower 30-day AMI mortality rate (2.5%) compared with the delayed feedback group. However, both groups experienced significant before-after improvement.
Three studies assessed impact of publication of Nursing Home Compare quality report card by CMS.
• Mukamel and colleagues (2008)77 used multiple data sources for 701 random sampled nursing homes and reported that publication of a report card was associated with improvement in some but not all reported dimensions.
• In two large before-after studies (one with control and another without control) using the Nursing Home Minimum Data Set from 1999 to 2005, Werner and co-authors (2009; 2009a)78,79 reported that the quality of post-acute care improved after the initiation of public reporting for two of the three reported quality measures used in Nursing Home Compare. However, rates of potentially preventable re-hospitalisation did not significantly improve and, in some cases, worsened. Overall, both unreported and reported care were improved which indicates a potential positive ‘spillover” effect. The improvements in unreported care were particularly large among facilities with high scores or that significantly improved on reported measures, whereas low-scoring facilities experienced no change or worsening of their unreported quality of care.
• In another large observational cohort study, Jha and colleagues (2009) 80 showed that there was no association between discharge planning performance on the chart-based measures (as recommended by CMS) and readmission rates, and only a very modest association between performance on the patient-reported measure and readmission rates among patients with CHF. These results suggest that the current efforts to collect and publically report data on discharge planning as required by CMS are unlikely to yield large reductions in unnecessary readmissions.

32
Unintended Consequences Eleven studies explored this topic (5 published after 2006). The earlier studies focused on investigating possible unintended consequences of public reporting related to cardiac patients (ie: the NYS CSRS (3 studies) and PCI (1 study). Omoigui and colleagues(1996)81 reported that patients from New York receiving CABG at the Cleveland Clinic had higher expected mortality than the patients from New York state-wide, patients from Ohio and patients from other states that indicate the possible selective referral out of the state of sicker cardiac patients. However, Peterson and colleagues (1998)65 found that despite the fact that New York patients with AMI were less likely to receive CABG than those admitted outside New York, the overall percentage increased, paralleling national trends, even among higher risk elderly subsets and out-of-state CABG rates decreased. Dranove and colleagues (2003)82 showed that report cards were associated with a shift in CABG use to healthier patients, leading to worse cardiac outcomes, especially among sicker patients. The sicker patients were defined as higher hospital expenditures and days in hospitals and the appropriateness of such definition could be a subject of debate. Moscucci and co-workers (2005)66 compared the case-mix of the patients undergoing PCI in New York (with public reporting) and Michigan (without public reporting) and found significant differences between the two cities, suggesting a propensity in New York toward not intervening on high-risk patients. However, in a time trend analysis of all acute hospitals with CABG operation in California, Li and colleagues (2010)71 found no evidence of decreased access to CABG for high-risk patients in California during the period of public reporting of isolated CABG outcomes. Baker et al. (2002)69 examined mortality trends associated with the CHQC program and found potential evidence suggesting patients discharged early in order to artificially improve in-hospital mortality were more likely to die sooner than those not discharged early. More recent literature added new dimensions.
• Khan and colleagues (2007)83 assessed the impact of analysing the effect of introducing surgeon-specific data (SSD) on surgical training in a large cardiac surgical centre in the UK. The authors found that SSD was associated with a reduction in the overall proportion of cases performed by trainees (49% versus 42.8%) and, in particular, a reduction in the proportion of aortic and mitral valve procedures performed by trainees. In addition, the proportion of cases performed by the trainees without consultant supervision declined significantly following SSD (18.7% versus 10.4%).
• Drake et al. (2007)84 added more evidence to the long-running concern about current use of the pneumonia antibiotic timing measure by the Hospital Quality Incentive Demonstration (HQID) program (the measure requires administration of antibiotics on patients within four hours of diagnosis of pneumonia). The authors found that increased success in meeting the pneumonia antibiotic timing measure correlates to an increase in pneumonia
In summary, the results are mixed. However, the majority of studies showed significant positive impact of public disclosure on the improvement of clinical outcomes. More recent literature tends to have better study design, data, analytic framework and covers different topics. Recent studies also are more likely to show a positive effect of public reporting on clinical outcomes.

33
antibiotic use among selected conditions (which do not call for antibiotic use). This result is consistent with the hypothesis that adopting this performance measures may lead to increase of inappropriate use of antibiotics and potential spread of drug-resistant cases.
• However, using a large before-after study with 13,042 emergency department (ED) visits by adult patients with respiratory symptoms in the National Hospital Ambulatory Medical Care Survey 2001-1005, Friedberg and colleagues (2009)85 tested the hypothesis that publicly reporting hospital scores on antibiotic timing in pneumonia (percentage of patients with pneumonia receiving antibiotics within 4 hours) has led to unintended adverse consequences for patients. The authors found that despite concerns, public reporting of hospital of hospital antibiotic timing scores has not led to increased pneumonia diagnosis, antibiotic use, or a change in patient prioritisation.
• In addition, Mukamel and colleagues (2009)86 reported that, despite the theoretical expectations, only a limited degree of cream skimming occurred in nursing homes (through selectively admitting healthier people) after the public release of Nursing Home Compare report cards.
Individual providers Fung’s review identified 7 articles related to selection, 1 article to clinical outcomes and 6 articles related to unintended consequences. The current review did not find any new additions to the previous literature. No articles were identified from either review relating to quality improvement. For completeness, we present a short overview of the articles reviewed by Fung. Selection Seven articles investigating the possible impact of public reporting on the selection of individual providers such as surgeons all explored the NYS CSRS ranking data. Five studies explored the impact of such ranking on surgeons’ market share, defined often as the volume of CABG surgeries. Hannan and colleagues (1994)63 reported that surgeon group CABG surgery volume did not change substantially between 1989 and 1992 but found in a subsequently study (Hannan et al. 2005)87 that percentage of patients undergoing CABG surgery by low-volume surgeons decreased from 7.6% in 1989 to 5.7% in 1992. The authors also showed that the reasons for such a decrease were largely due to the fact that the low-volume surgeons were more likely to stop practicing and the surgeons who were either new to the system or had inconsistently low volume performed better. Mukamel and Mushlin (1998)37 found that the higher-ranking surgeons had higher rates of growth of charges and in a subsequently study, Mukamel et al. (2004)88 showed that the NYR CSRS ranking replaced the surgeon experience and price as signals for quality and became a major deterministic factor
In summary, there is growing number of studies that assess the unintended consequence of public reporting but much more evidence is needed. Despite the limited evidence, more recent studies do not provide evidence to support long-running concerns on access issues for CABG patients and cream skimming admissions for nursing home residents. The evidence on appropriateness of the antibiotics timing measures in pneumonia patients is mixed and more research is needed.

34
in the selection of cardiac surgeons. Jha and Epstein (2006)40 reported that despite the good predictive accuracy of the NYS CSRS ranking on the subsequent adjusted mortality rate and the fact that bottom-decile hospitals or surgeons subsequently have approximately twice the risk-adjusted mortality rate as the top-performing hospitals or surgeons, performance was not associated with a subsequent change in market share. Surgeons with the highest mortality rates were much more likely than other surgeons to retire or leave practice after the release of each report card. The study showed the possible profound impact of public reporting on physicians and their livelihood. Mukamel and colleagues (2002, 2004)89,90 assessed the impact of public reporting of performance data on intermediaries’ selection (contracting) practice. The results showed that only a small proportion (20%) of managed care organisations considered NYS CSRS ranking as a major factor in their contracting decisions (Mukamel et al. 2002)90. In a subsequent study, Mukamel and colleagues (2004)89 reported that managed care organisations (MCO) were more likely to contract cardiac surgeons with higher quality for their services. Clinical Outcomes and Unintended Consequences Hannan and colleagues (1994)63 reported that the risk-adjusted mortality rates for surgeons in all terciles decreased after the public disclosure of the NYR CSRS ranking. Four studies investigated the possible negative effect of public reporting on the access of care by severely ill patients. Three studies showed similar results that doctors were reluctant to operate on high-risk patients after the implementation of public reporting in Pennsylvania and New York for cardiac surgeons (Schneider and Epstein, 1996; Burack et al. 1999)91,92 and in New York for interventional cardiologists (PCI program, Narins et al. 2005)93. However, Hannan and associates (1995)87 reported that the decrease in risk-adjusted morality rate was not associated with the severity of patients’ illness. Two articles examined the differential impact of public reporting on access to care among different socioeconomic groups. Mukamel and associates (2004)88reported that among New York Medicare beneficiaries in the post-report period, patients from more affluent and more educated neighbourhoods were more likely to be treated by surgeons with low risk-adjusted mortality rates, and patients from lower socioeconomic neighbourhoods were more likely to be treated by surgeons with high risk-adjusted mortality rates. In a subsequent study, Werner and colleagues (2005)94 reported that racial and ethnic disparity in CABG use increased in New York immediately after implementation of the NYS CSRS, whereas disparities did not change in the comparison states. However, these disparities decreased to levels similar to report card pre-release levels over time.
In summary, there is some evidence that that public disclosure of performance information may influence consumers’ selection of individual providers, individual providers’ self-selection and contracting agency’s selection of doctors. However, the magnitude of these selections appears to be low and more large and better designed studies are needed to understand the nature and magnitude of these selections.

35
General comments on existing literature of effectiveness of public reporting Despite the fact that the public reporting has been in widespread use for more than two decades, and has been used as a powerful policy lever in many countries, the research evidence on its effectiveness is still sparse. However, recent research activity revealed by this update suggest that this situation is changing. It is even more evident if we consider the large number of publications compiled by Brien and colleagues (2010). Keeping abreast of the latest research evidence is challenging. Our review highlights how, even within a relatively short period of time, emerging evidence can substantially alter our understanding of the topic. The current update added substantial evidence with respect to the impact of public reporting on all review endpoints at hospital levels (i.e. selection, quality improvement, clinical outcomes and unintended consequences), with modest new evidence on selection and quality improvement on health plan provider level, with no addition to any endpoints at individual providers level (Table 4.) Table 4: The matrix of strength and direction of evidence
Selection Quality improvement
Clinical outcomes
Unintended consequences
Health plans +++ + NA NA
Hospitals/Nursing homes
++ ++++ +++ 0/x
Individual providers
+ NA NA xx
Note: ++++: the strongest positive effect; xxxx: the strongest negative effect; NA: not available; 0 : mutual (no significant effect). The literature on quality improvement at hospital level is strong. The literature demonstrates significantly increased quality improvement activities associated with public reporting in different settings. Recent studies tend to have high quality scores and researchers used more sophisticated designs such as large experimental design (Fonarow et al. 2007)52 and large cluster randomised controlled trials (Tu et al. 2009)53. The increased quality improvement activity could be seen in the area of acute stroke care (Steward et al. 2006)49, participation in hospital quality improvement programs (Rask et al. 2006)50, nursing homes (Zinn et al. 2006)51, patients hospitalised with heart failure and other cardiac problems (Dziuban et al. 1994; Cassin et al. 2002; Bentley and Nash, 1998; Fonarow et al. 2007; Tu et al. 2009)38 52-55, obstetrics care (Longo et al. 1997)56 and some other areas (Ronsenthal et al. 1998; Hibbarad et al. 2003; 2005; Tu et al. 2003)42,57-59.
In summary, it is concerning that only one publication studied the impact of public disclosure of performance data on individual providers’ clinical outcomes. There is some evidence that public reporting may be associated with doctors’ risk-avoiding behaviours. There is also limited early evidence indicating that those socioeconomically disadvantaged groups may benefit less or be worse off from pubic reporting. Specific efforts in monitoring and reducing the possible disparity are needed.

36
The literature on clinical outcomes at hospital level is encouraging. The majority of studies on this topic have showed that public reporting has the potential to significantly improve clinical outcomes across different settings and on various topical areas. However, questions remain regarding why some public reporting fails to deliver expected clinical improvements. Further areas of uncertainty include:
• the relative costs and benefits of public reporting versus pay-for-performance schemes;
• public reporting versus private reporting which could be applied sequentially; and
• public reporting alone versus public reporting being embedded into an intensive collaborative clinical governance network with multifaceted intervention strategy.
The current literature provided interesting but very limited results on each of these questions. Much more research is needed. The updated literature on unintended consequences of public reporting at hospital level alleviated many of the concerns around the possible “bypass” effect (selective referring those severely-ill patients to other practices) on CABG patients (Li et al. 2010)71 and the “cream skimming” effect (selectively admitting those healthier patients) on nursing home residents (Mukamel et al. 2008)77. It is also clear that in some instances, unintended consequences do occur but in general, despite the theoretical expectation, the magnitude of such impact is low (Mukamel et al. 2008)77. More interestingly, there is evidence of an unintended positive “spillover” effect of publishing reports from Nursing Home Compare that led to improvement of nursing homes in the areas not subject to performance measurement (Werner et al. 2009)78. Emerging unintended consequences such as the impact of public reporting on reduced opportunities in surgical training83 underlines the importance of monitoring for new unintended consequences. It is also noteworthy that some of these unintended consequences may have complex implications. For example, the reduction of time to operate alone on patients by surgical trainees may lead to longer training periods or less experience for them but it may also lead to fewer complications for patients. This review revealed huge gaps in our knowledge regarding the impact of public reporting on individual providers in general and health plan providers to some extent. As previous reviews found, public reporting may have a profound impact on physicians’ livelihood (Jha et al. 2006)40 and a recent national survey of general internists in the USA revealed that the large majority of physicians were concerned about public reporting but most of them felt comfortable with pay-for-performance (Cassialo et al. 2007)95. Most respondents stated that the public reporting programs will result in physicians avoiding high-risk patients and will divert attention from important types of care for which quality is not measured. It is important for future research to close these gaps through:
• understanding the magnitude of the unintended consequences at different settings;
• exploring possible intervention strategies in mediating negative unintended consequences;
• understanding specifically why some doctors have the tendency to resign, retire or move out the usual practice area after finding themselves at the bottom of the performance table and understanding the long-term consequences of such choices;

37
• understanding the potential impact of public disclosure on doctors’ quality improvement activities and clinical outcomes performances;
• understanding why and how doctors may or may not act upon the information from public disclosure;
• exploring the proper targets for public reporting (i.e. should the public disclosure be on individual providers, teams, organisations/hospitals, or health plan/other system levels?);
• understanding the enabling factors that may maximise the potential positive effects of public reporting on different levels and minimise the negative effects.
There are five general noteworthy observations after the review.
1. There is general agreement that public reporting as a global trend is here to stay. It is not a matter of whether public reporting should be done, but rather how. Much of the future efforts should explore how it can be applied consistently and effectively.
2. Decision-makers and public reporting agencies should not be paralysed by the possible unintended consequences of public disclosure of performance data. Instead, through careful planning and monitoring, the potential risks of public reporting can be properly managed.
3. Public reporting should not be considered as a “silver bullet” as many other sociopolitical and contextual factors may facilitate or hinder its success in achieving its goals – improving quality of care. It remains a challenge for public reporting agency to navigate the sociopolitical landscape to maximise the benefit of public reporting.
4. The performance of “performance measurement” and public reporting activities should also be measured and evaluated. Lessons learnt from such evaluations should be applied to improve the future activities.
5. There is an urgent need to establish some global collaborations such as a Cochrane Collaboration group in order to provide timely update of the global evidence on public reporting, performance measurement and pay-for-performance.
Our review has limitations. We did not search the grey literature to a great extent and the data extraction was not cross-examined. We did not conduct a full-blown systematic literature search and made no attempt to contact the authors of retrieved publications. However, we have in a short time span, sought to identify the latest publications and were surprised by the amount of literature that we managed to find. What are the success factors for public reporting? What are the ways to maximise the impact of the public reporting of quality of care? Marshall et al. (2004)96 offered several recommendations:
1) understand the political and economic environment;
2) change the culture of provider organisations;
3) minimise the unintended consequences of public reporting;
4) engage key stakeholders, especially clinicians;

38
5) engage the public;
6) work with the media.
These are critically important steps to take when an agency plans its public reporting approach. Wallace et al. (2007)16 also discussed many factors that may contribute to a successful public reporting system. These include setting clear objectives (such as executive accountability versus quality improvement), finding the right audiences, developing the right content, pre-testing and market-researching the product and distributing them through the most proper and efficient channels (available at the right place, at the right time, in the right quantities, to the right people). In a typical Marketing Mix 5P’s terms (Product, Price, Place, Promotion, People), the only missing P here is price. In general, much of social marketing theories and strategies can be easily applied to public reporting practices. In a recent systematic review aiming to understand how consumers use quality-of-care information which only included randomised controlled trials, Faber and colleagues (2009)97 elaborated on the important steps for consumers to make informed choices within the Consumer Choice Model in four stages:
Stage 1. Awareness: recall of receiving and seeing quality information.
Stage 2. Knowledge: the ability to interpret information correctly, resulting in comprehension of quality information and knowledge about the quality scoring systems.
Stage 3. Attitude: beliefs regarding quality information.
Stage 4. Behaviour: selecting, switching, or visiting a health care provider.
This model emphasises the importance in providing information to an audience (awareness and knowledge) to help them in making meaningful choices. It also highlights the importance of facilitating the intended attitude and behaviour changes that may go beyond simple information disclosure. The authors also made distinctions about the types of quality-of-care information: a) consumer or patients experiences; b) clinical performance-based quality measures; 3) expert or peer assessed quality measures. Different measure may require specific attention to its design, format and marketing strategy. The authors found that easy-to-read presentation formats and explanatory messages improve knowledge about and attitude towards the use of quality information. The importance of evidence-based guidelines A number of professional societies and organisations in the USA have recently developed guidelines for public reporting or pay-for-performance practice (e.g. the American Medical Association and RAND Corporation). In September 2004, the American Academy of Family Physicians (AAFP), the American College of Physicians (ACP), America’s Health Insurance Plans (AHIP), and the Agency for Healthcare Research and Quality (AHRQ), joined together to lead an effort for determining how to most effectively and efficiently improve performance measurement, data aggregation and reporting in the ambulatory care setting. The mission of this effort named the AQA endorsed a principle for reporting to clinicians and hospitals (http://www.aqaalliance.org/ about.htm) in May 2006. The AQA Principles cover five areas: 1) contents of reports; 2) transparent methods; 3) portrayal of performance difference; 4) report design and testing for usability. The full content of the principles below provides a solid guide for other reporting systems:

39
1. Reports should focus on areas that have the greatest opportunities to improve quality by making care safe, timely, effective, efficient, equitable and patient centred.
2. Reports should rely on standard performance and patient experience measures that meet the AQA Principles for Performance Measurement (e.g., measures should be evidence-based, relevant to patient outcomes, statistically valid and reliable).
3. Reports should include overall composite assessments of individual clinician or group performance as well as assessments of the individual measures used for the overall composite assessment (e.g., quality or cost of care).
4. Performance data should, when available, reflect trend data over time rather than periodic snapshots to optimise data use for quality improvement. Measures used for trending should be stable (e.g., the data definitions or collection methodology do not change between intervals) unless there is compelling evidence or a justifiable reason not to be.
5. Data specifications for reported performance data, such as sample size and methods of data collection and analysis, should be explicit and disclosed to physicians and hospitals.
6. Clinicians whose performance is reported should be able to review and comment on the methodology for data collection and analysis (including risk adjustment). Clinicians and hospitals should be notified in writing in a timely manner of any changes in program requirements and evaluation methods.
7. Sponsors of reports should also make the performance results available to clinicians for review prior to any public release. In order to improve the accuracy of reports, mechanisms need to be in place to verify and correct reported data.
8. To the extent possible, results should accurately reflect all services that are accountable in whole or in part for the performance measured. Attribution should be explicit and transparent.
9. Results of individual clinician or group performance should be displayed relative to peers. Any reported differences between individual providers or groups should include the clinical relevancy of the findings.
10. Practicing physicians should be actively involved in the design of performance reports.
11. Report formats should be designed to be user-friendly and easily understood, and should be pilot-tested before implementation.
12. Data displays in reports should highlight meaningful and actionable differences in performance.
13. Reports should be continually improved so that they are increasingly effective and evaluated for potential unintended consequences.
14. Clinicians and hospitals should collaborate to share pertinent information in a timely manner that promotes patient safety and quality improvement.

40
The importance of a centralised, arm-length government agency in coordinating public reporting
This chapter provides an overview of the current state of health care performance measurement and reporting. To better align and coordinate existing efforts in this area, the committee calls for a national system for performance measurement and reporting and identifies key attributes of a well-functioning system that can meet this need. (Chapter Summary: IOM: Performance Measurement, 2006)
The sub-committee of IOM, co-chaired by Don Bewick and Elliott Fisher, in preparing the Performance Measurement report made one of the most important recommendations in the report and called for the establishment of a National Quality Coordination Board (NQCB) with seven key functions:
1) specify the purpose and aims for American health care; 2) establish short- and long-term national goals for improving the health care
system;
3) designate, or if necessary develop, standardised performance;
4) measures for evaluating the performance of current providers, and monitor the nation’s progress toward these goals;
5) ensure the creation of data collection, validation, and aggregation processes;
6) establish public reporting methods responsive to the needs of all stakeholders, and
7) identify and fund a research agenda for the development of new measures to address gaps in performance measurement.
The report made a compelling case in elaborating the importance of such recommendation in 2005. However, at the time of the writing of this review, the recommendation has not come into fruition. Interestingly, with Don Berwick as the only special advisor, the National Quality Board in the UK was established in 2009, eighteen months after one line recommendation (i.e. to “provide strategic oversight and leadership on quality”) from Lord Darzi’s (June 2008) final report, High Quality Care for All98. Almost at the same time, the Bureau of Health Information of New South Wales, the first of its kind in Australia, was born and is full of life.

41
Appendix 1: The search strategies employed in Fung’s (2008) review PubMed, 1999–2006 Other limiters: English, human Search 1 Title search on Marshall et al. (27) Items retrieved: 31 Search 2 “Related articles” search on Marshall et al. (27) Items retrieved: 312 Search 3 “Related articles” search on Schneider and Lieberman (29) Items retrieved: 49 Search 4A information dissemination OR information services OR disclos* OR data shar* OR report card* OR profil* OR disseminat*[tiab] AND public opinion OR attitude of health personnel OR consumer participation OR benchmark* OR consumer*[tiab] OR public[tiab] AND quality of health care[mj] OR hospitals/standards[mh:noexp] OR physicians/standards[mh:noexp] OR performance[tiab] Items retrieved: 1691 Search 4B: The following terms were added to search 4A: public opinion OR attitude of health personnel OR consumer participation OR benchmark* OR consumer*[tiab] OR public[tiab] AND quality of health care[mj] OR hospitals/standards[mh:noexp] OR physicians/standards[mh:noexp] OR performance[tiab] AND transparen* OR scorecard* OR score card* NOT Results of search 4A Items retrieved: 67 EconLit, 1999–2006 Search 5A* kw: health* or kw: medical or kw: doctor* or kw: physician* or kw: nurs* AND kw: report* or kw: scorecard* or kw: profil* or kw: benchmark* or kw: inform* AND kw: public* or kw: disclos* or kw: disseminat* or kw: releas* or kw: publish* or kw: share* or kw: sharing) AND kw: quality or kw: standard_ Items retrieved: 358 Search 5B kw: health* or kw: medical or kw: doctor* or kw: physician* or kw: nurs* AND de: information AND de: quality or de: standard

42
NOT Results of search 5A Items retrieved: 26 Wilson Business Periodicals Abstracts, 1999–2006 Search strategies* kw: health* or kw: medical or kw: doctor* or kw: physician* or kw: nurs* AND kw: report* or kw: scorecard* or kw: profil* or kw: benchmark* or kw: inform* AND kw: public* or kw: disclos* or kw: disseminat* or kw: releas* or kw: publish* or kw: share* or kw: sharing AND de: quality or de: standard_ or de: ranking or de: rating Items retrieved: 200 † ‘.kw’. indicates a keyword or terms from title, abstract or subject heading; ‘.de’. indicates a descriptor (subject heading term).

43
Appendix 2: Two summary tables of updated publications Table A.1a: Two summary tables of updated publications
First author, Year Objective Domain 1 Domain 2 Key findings Global ratings¶
Public Reporting Subject Participants Rating ‡ Type Ratings§
Selection Uhrig, 2006 To assess the efficacy
of materials that integrated comparative information on cost, benefits, and quality for employer-based retiree health plans and Medicare Advantage plans.
People aged 58-64 years old, non-Medicare beneficiary, never worked in the health insurance industry, no vision problems and could read English.
A total of 152 people recruited through employers, word-of-mouth or snowball sample, and use of a recruitment firm.
*** RCT **** Integrated comparative information on costs, benefits, and quality increased the use of quality information, and the quality information was rated as being more important. Simplified terminology, increased use of white space, improved formatting, and shorter lengths were effective for selecting a high-quality HP more often.
√√
Chernew, 2008
To estimate the impact and value of information using data from a large employer (General Motor, GM), which started distributing health plan ratings to its employees in 1997.
All, non-union US GM employees between 1996 and 1997.
1996 and 1997 health plan enrollment decisions for the approximately 70,000 active, non-union US GM employees.
**** Obser-vational cohort.
*** The release of heath plan rating had a statistically significant effect on health plan choices. Consumers were willing to pay about $330 per year per below expected performance rating avoided. There were large variation in valuations across different performance domains, but no significant evidence of heterogeneity based on observable employee characteristics or unobservable dimensions.

44
First author, Year Objective Domain 1 Domain 2 Key findings Global ratings¶
Public Reporting Subject Participants Rating ‡ Type Ratings§
Dafny, 2008 To examine the relationship between enrolment and quality before and after report cards were mailed to 40 million Medicare beneficiaries in 1999 and 2000
All Medicare beneficiaries before and after the public reporting of HMO in 1999 and 2000 the USA.
40 million Medicare beneficiaries.
**** Before-after study
*** Public report card and market-based learning produced substantial swings in Medicare HMO market share during the study period, 1994–2002. Market-based learning was largest in markets with private-sector report cards, which provides secondary evidence that report cards are an effective means of disseminating quality information, whether publicly or privately sponsored. The effect of the government-issued report cards is entirely due to customer satisfaction ratings; other reported measures did not affect subsequent enrolment.
√√√
Quality improvement
London, 2008 To examine the current state of quality monitoring and management activities of US health plans.
All health plans in the USA.
Medical directors of 252 commercial HMOs (96% response rate) drawn from 41 nationally representative markets in the United States.
*** Cross-sec-tional (survey)
*** Almost all health plans measured their performance on multiple indicators of quality. The majority of health plans also collected data at the level of the individual physician or group and used these data in quality improvement activities, but not in public reporting.
√√

45
First author, Year Objective Domain 1 Domain 2 Key findings Global ratings¶
Public Reporting Subject Participants Rating ‡ Type Ratings§
Duvalko 2009 To describe the structure and examine the impact of Cancer Care Ontario’s Clinical Governance Framework. The framework aims to 1) develop system-level quality indicators; 2) use data for developing clinical guidelines; 3) transfer knowledge through a coordinated program and clinical engagement, and 4) use contractual agreements, financial incentives and public reporting.
All healthcare facilities involving cancer care and delivering services.
Population based databases.
*** Case series
** Adherence with clinical practice guidelines of colorectal cancer surgery has increase between 2004 and 2006. Thirteen out of the fourteen Regional Cancer Programs (RCP) had a plan to meet the thoracic surgery standards in 2008.
√√

46
Clinical outcomes
Duvalko 2009 To describe the structure and examine the impact of Cancer Care Ontario’s Clinical Governance Framework. The framework aimed to 1) develop system-level quality indicators; 2) use data for developing clinical guidelines; 3) transfer knowledge through a coordinated program and clinical engagement, and 4) use contractual agreements, financial incentives and public reporting
All healthcare facilities involving cancer care and delivering services.
Population based databases.
*** Case series
** The cancer surgical waiting time and the variability has decreased among different regions between 2005 and 2008.
√√
Unintended consequences
‡ Samples with 4 stars were representative of the population in whom public reporting is contemplated; those with 3 stars had major overlap between the targeted sample and the population in whom public reporting is contemplated; those with 2 stars had a narrow set of characteristics that differs from that of the population in whom public reporting is contemplated; and those with 1 star were completely different from the population in whom public reporting is contemplated. § Four stars indicate a randomised trial or experimental study; 3 stars indicate a controlled trial, pre–post trial with control (controlled before–after trial), time series, or observational cohort with multivariable adjustment; 2 stars indicate a pre–post trial without control, observational cohort study without multivariable adjustment, cross-sectional study without multivariable adjustment, analysis of time trends without control, or well-designed qualitative study; and 1 star indicates a case series, other qualitative study, or survey (descriptive) study. Three checks indicate great weight in the stratum’s body of evidence, 2 checks indicate moderate weight, and 1 check indicates little weight.
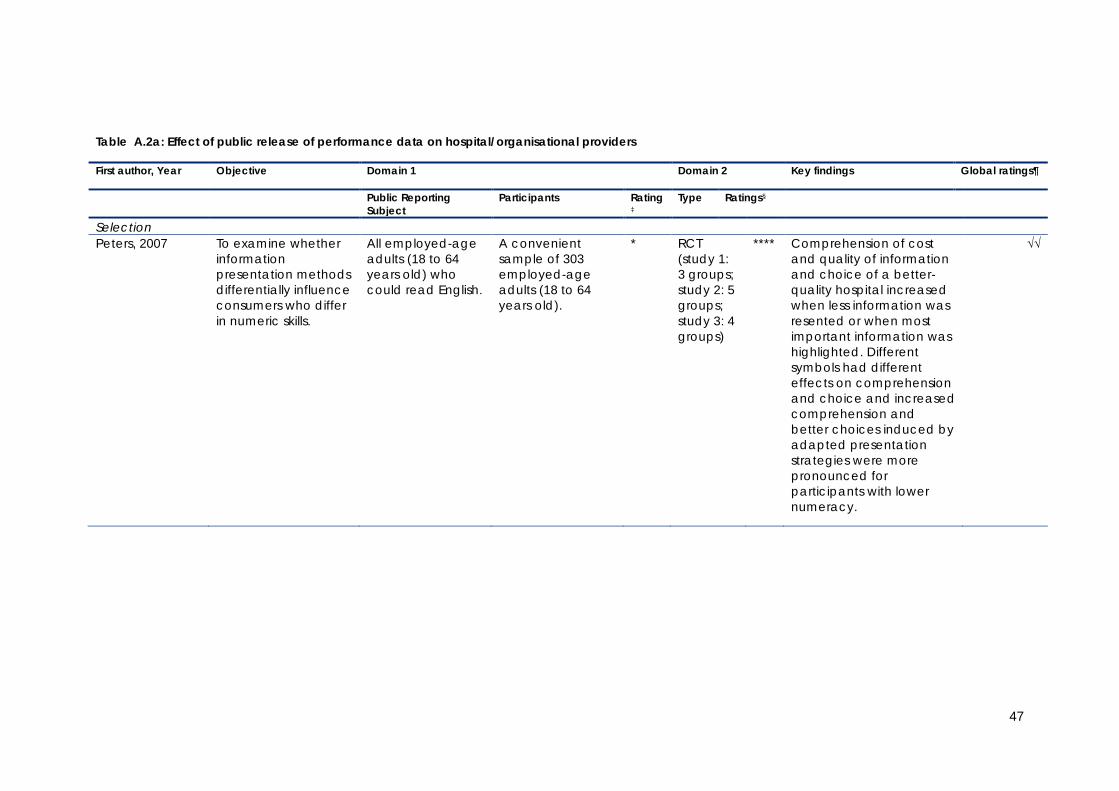
47
Table A.2a: Effect of public release of performance data on hospital/organisational providers
First author, Year Objective Domain 1 Domain 2 Key findings Global ratings¶
Public Reporting Subject
Participants Rating ‡
Type Ratings§
Selection Peters, 2007 To examine whether
information presentation methods differentially influence consumers who differ in numeric skills.
All employed-age adults (18 to 64 years old) who could read English.
A convenient sample of 303 employed-age adults (18 to 64 years old).
* RCT (study 1: 3 groups; study 2: 5 groups; study 3: 4 groups)
**** Comprehension of cost and quality of information and choice of a better-quality hospital increased when less information was resented or when most important information was highlighted. Different symbols had different effects on comprehension and choice and increased comprehension and better choices induced by adapted presentation strategies were more pronounced for participants with lower numeracy.
√√

48
First author, Year Objective Domain 1 Domain 2 Key findings Global ratings¶
Public Reporting Subject
Participants Rating ‡
Type Ratings§
Baundorf, 2009 To evaluate the impact of public reporting on consumer choices in the context of providing Assisted Reproductive Therapies (ART).
All the clinics who were the member of the Society for Assisted Reproductive Technology (SART) and the subjects of mandatory public reporting since 1998 through CDC, the USA.
All clinics that submitted their data to SART between 1995 to 2003. In 2003, 440 clinics were included.
**** Before-after study
*** Clinics with higher birth rates had larger market share after the adoption of report cards relative to before. Clinics with a disproportionate share of young, relatively easy-to-treat patients had lower market share after adoption versus before. Report cards had larger effects on consumers and clinics from states with ART insurance coverage mandates.
√√
Merle, 2009 To assess the impact of French government mandatory infection control activity (ICALIN) report card on patients’ attitude towards hospital choice.
All French hospitals.
29 hospitals from Upper Normandy (north-western France) areas with a total of 381 patients participants.
** Des-criptive (Survey)
** In the case of a low ICALIN score, 24.1% of participants would refuse admission and 54.9% would seek advice from their general practitioner. Sociodemographic factors had no influence on patients’ attitude.

49
First author, Year Objective Domain 1 Domain 2 Key findings Global ratings¶
Public Reporting Subject
Participants Rating ‡
Type Ratings§
Mazor, 2009 To evaluate different approaches for reporting hospital-level comparative data on healthcare associated infections (HAIs).
Residents of the city of Worcester, Massachusetts, the USA.
A random sample of 201 residents.
** Cross-sectional study (survey)
* Consistency of indictors, data presentation, report format, or inclusion of confidence intervals had no significant impact on consumers’ understanding but education did. Prior experience, reputation, physicians’ recommendations and insurance coverage were also influential on their decision in choosing hospitals.
√
Pope, 2009 To estimate impact of hospital rankings on changes of both patient volume and hospital revenues.
All hospitals ranked by US News and World Report.
All hospitalised Medicare patients in California (1998–2004) and a sample of other hospitals around the country (1994–2002).
*** Obser-vational cohort
*** Hospitals that improve their rank are able to attract significantly more patients. The average hospital in the sample experiences a 5% change in non-emergency, Medicare patient volume from year to year due to rank changes.
√√
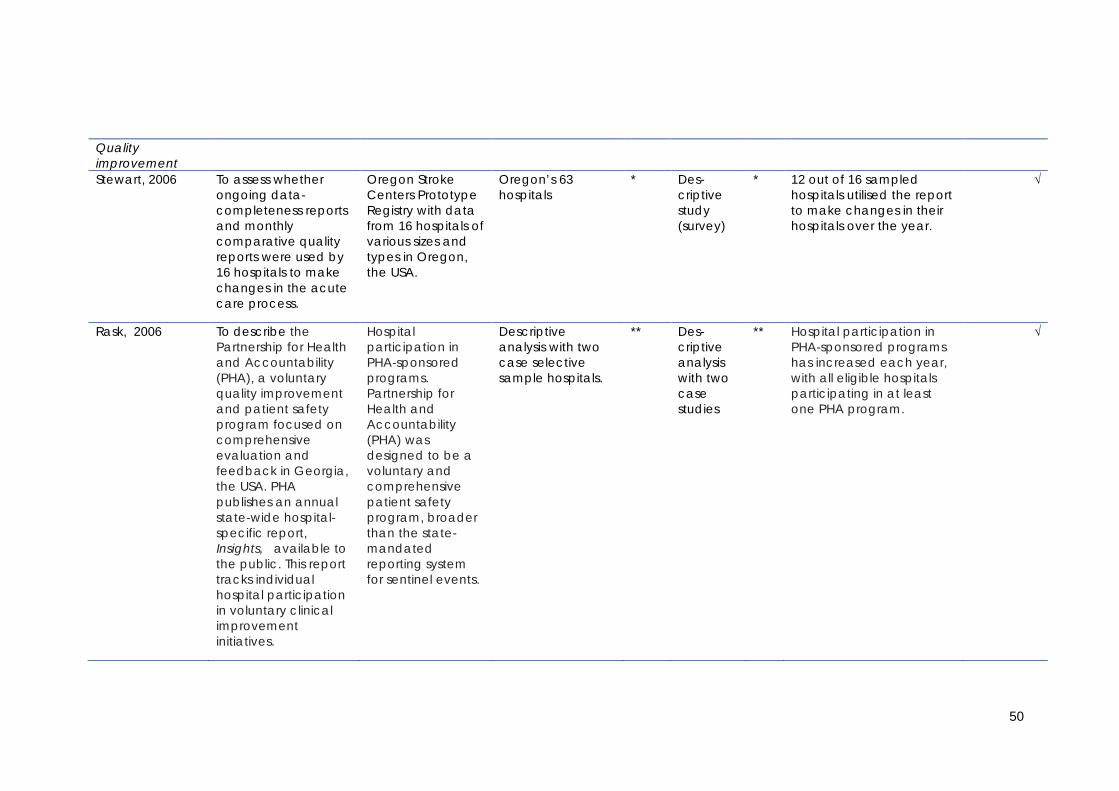
50
Quality improvement
Stewart, 2006 To assess whether ongoing data-completeness reports and monthly comparative quality reports were used by 16 hospitals to make changes in the acute care process.
Oregon Stroke Centers Prototype Registry with data from 16 hospitals of various sizes and types in Oregon, the USA.
Oregon’s 63 hospitals
* Des-criptive study (survey)
* 12 out of 16 sampled hospitals utilised the report to make changes in their hospitals over the year.
√
Rask, 2006 To describe the Partnership for Health and Accountability (PHA), a voluntary quality improvement and patient safety program focused on comprehensive evaluation and feedback in Georgia, the USA. PHA publishes an annual state-wide hospital-specific report, Insights, available to the public. This report tracks individual hospital participation in voluntary clinical improvement initiatives.
Hospital participation in PHA-sponsored programs. Partnership for Health and Accountability (PHA) was designed to be a voluntary and comprehensive patient safety program, broader than the state-mandated reporting system for sentinel events.
Descriptive analysis with two case selective sample hospitals.
** Des-criptive analysis with two case studies
** Hospital participation in PHA-sponsored programs has increased each year, with all eligible hospitals participating in at least one PHA program.
√

51
Zinn, 2007
To assess whether differences in strategic orientation of nursing homes as identified by the Miles and Snow typology are associated with differences in their response to the publication of quality measures on the Nursing Home Compare website.
All facilities included in the first publication of the Nursing Home Compare report conducted in May–June 2004.
10 percent random sample (1502 nursing homes) with a response rate of 48.2%.
***
Des-criptive survey
**
Close to two-third nursing homes took some actions in responding to the public report. Whether, when, and how nursing homes reacted to publication of federally reported quality measures is associated with four strategic orientation types: Defender, Analyser, Prospector, and Reactor.
Tu, 2009 To evaluate whether the public release of data on cardiac quality indicators effectively stimulates hospitals to undertake quality improvement activities that improve health care processes and patient outcomes on composite and individual 12 AMI and 6 CHF process-of-care indicators.
All acute Ontario hospitals.
86 Acute Ontario hospital corporations.
*** Cluster RCT (early feed-back group versus late feed-back group)
**** a) early feedback group was significantly more likely to report starting 1 or more quality improvement initiatives b) unexpected initiation of quality improvement activities in late feedback group c) early feedback hospital report card did not result in a significant systemwide improvement in either the composite AMI process-of-care indicator or the composite CHF process-of-care indicator.
√√√

52
Clinical outcome Stewart, 2006 To assess whether
ongoing data-completeness reports and monthly comparative quality reports were used by 16 hospitals to make changes in the acute care process.
Oregon Stroke Centers Prototype Registry with data from 16 hospitals of various sizes and types in Oregon, the USA.
Oregon’s 63 hospitals
* Des-criptive study (survey)
* The report-user group showed a range of one to four sustained positive changes in the seven quality indicators over the last 3 months of the study. Hospitals not using reported data showed zero to one sustained changes in the seven quality indicators.
√
Sullivan, 2006 To assess the outcomes for Carotid Endarterectomy after an institutional approach including public reporting in a setting with Moderate-to-Low Procedure Volume.
An institutional approach in improving outcomes for Carotid Endarterectomy including public reporting.
The 555 Carotid Endarterectomy conducted in a 325-bed hospital which is served by a single multispeciality group practice with more than 500 medical, dental and associate staff.
*** Obser-vational cohort
** Success of an institutional program tracking carotid endarterectomy outcomes depends on multispecialty cooperation and communication; a prospective database to document results; independent audit of results by a stroke neurologist; institutional commitment to review the results and use the data to make difficult decisions designed to improve outcomes; and a vehicle to make the results available to referring health-care providers and the public.
√√

53
Rask, 2006 To describe the Partnership for Health and Accountability (PHA), a voluntary quality improvement and patient safety program focused on comprehensive evaluation and feedback in Georgia, the USA. PHA publishes an annual state-wide hospital-specific report, Insights available to the public. This report tracks individual hospital participation in voluntary clinical improvement initiatives.
Hospital participation in PHA-sponsored programs. Partnership for Health and Accountability (PHA) was designed to be a voluntary and comprehensive patient safety program, broader than the state-mandated reporting system for sentinel events.
Descriptive analysis with two case selective sample hospitals
** Descriptive analysis with two case studies
** Participants in the Safe Medication Use initiative have seen reductions in targeted medication errors, and 97% of the hospitals have reported their performance on Joint Commission on Accreditation of Healthcare Organisations’ core measures.
√

54
Guru, 2006 To evaluate the differences in patient characteristics and outcomes observed during the transition from no reporting to confidential, and ultimately public performance report cards for CABG surgery in a public health system.
Institution-level performance report cards on outcomes of coronary artery bypass graft (CABG) surgery in Ontario between 1994 and 2002.
CABG surgery in Ontario for 67693 patients from September 1, 1991, to March 31, 2002.
**** Con-trolled before-after study (no report-ing: 1991-1993; confi-dential report-ing: 1994-1998; public report-ing: 1999-2002)
*** The risk-adjusted 30-day mortality rate decreased 29% (95% CI 21-39) from the era of no reporting (1991-1993) to confidential reporting (1994-1998). There was no further decrease with public reporting (1999-2001). The control outcome of 30-day readmission did not decrease across reporting eras. Inhospital mortality fell significantly faster in Ontario during the period of confidential reporting than in other parts of Canada.
√√√

55
Levy, 2007 To evaluate the effect of a computerised online system that comparatively displays grades of patient satisfaction among primary care military infirmaries in Israel.
Computerised online grading systems of patient satisfaction.
Fifteen Israel Air Force primary care infirmaries and 130 Defence Force infirmaries.
*** Quasi-experi-mental design (with 15 Israel Air Force infirm-aries as inter-vention group and 130 Israel Defene Force infirm-aries as control group).
*** At the end of the 1 year period, patient satisfaction scores improved in both groups but the magnitude of the improvement was greater in intervention groups. The most pronounced improvement was noted in availability of services.
√√

56
Lindenauer, 2007 To evaluate the individual and comparative benefits of public reporting and pay-for-performance.
All hospitals participated in CMS Premier Hospital Quality Incentive Demonstration (HQID) program (pay-for-performance: P4P) and Hospital Quality Alliance (HQA) program (public reporting: PR).
406 HQID hospitals (P4P+PR) and 207 HQA (Public reporting only) hospitals over 2 year period.
*** Controlled before-after design (CBA)
*** Both groups showed improvement from the baseline. Hospitals engaged in both public reporting and pay for performance achieved modestly greater improvements in quality than did hospitals engaged only in public reporting.
√√√

57
Hollenbeak, 2008 To identify associations between intensive public reporting and in-hospital mortality in 6 conditions AMI, congestive heart failure (CHF), hemorrhagic stroke, ischemic stroke, pneumonia, and sepsis.
Public reporting of the Pennsylvania Health Care Cost Containment Council.
Propensity score matching produced 168 104 matched patient pairs for analysis.
*** Quasi-experimental study with interrupted time series
*** In both the point-in-time and pre-post perspectives, significant improvements in outcome were associated with a more intensive public reporting environment in comparison with limited and no public report environment. No significant difference in mortality between patients treated in Pennsylvania and 3 states (California, Colorado,Texas) for pneumonia, CHF, and AMI in the period of 2000-2003, during which all 4 states were reporting the mortality outcomes of the 3 clinical conditions.
√√√

58
Kritchevsky, 2008 To assess the effects of a quality improvement collaborative group (as intervention) versus feedback only (receiving comparative report only as control) on preoperative antimicrobial prophylaxis.
Quality Improvement collaborative (including comparative feedback report, 2 in-person meetings led by experts, monthly teleconferences, and receipt of supplemental materials over 9 months).
44 acute care hospitals, each of which randomly sampled approximately 100 selected surgical cases (cardiac, hip or knee replacement, and hysterectomy) at both the baseline and remeasurement phases.
**** Cluster randomised controlled trial
**** Both groups showed significant improvement at follow-up period. There was no significant difference in the improvement between two groups. Providing comparative reports only achieved the same magnitude of improvement as the quality improvement collaboration group did.
√√√
Mukamel, 2008 To examine associations between nursing homes’ quality and publication of the Nursing Home Compare quality report card by CMS.
Nursing Home Compare quality report card by CMS.
701 random sample nursing homes; the Minimum Data Set (MDS) with information about all residents in these facilities, and the Nursing Home Compare published quality measure (QM) scores.
** Survey and time trend analysis
** Publication of the Nursing Home Compare report card was associated with improvement in some but not all reported dimensions of quality.
√√

59
Jha, 2009 To examine the association between discharge planning performance measures and rates of readmission for congestive health failure and pneumonia.
Medicare Provider Analysis and Review that includes data on all hospitalisations of enrollees in the Medicare fee-for -service plan.
2007 Medicare Provider Analysis and Review that includes data on all hospitalisations of enrollees in the Medicare fee-for-service plan.
**** Obser-vational cohort
*** No association between discharge planning performance on the chart-based measure and readmission rates among patients with congestive heart failure and only a very modest association between performance on the patient-reported measure and readmission rates for congestive heart failure. Current efforts to collect and publicly report data on discharge planning as required by CMS are unlikely to yield large reductions in unnecessary readmissions.
√√√

60
Tu, 2009 To evaluate whether the public release of data on cardiac quality indicators effectively stimulates hospitals to undertake quality improvement activities that improve health care processes and patient outcomes on composite and individual 12 AMI and 6 CHF process-of-care indicators.
All acute Ontario hospitals.
86 Acute Ontario hospital corporations.
*** Cluster RCT (early feedback group versus late feedback group)
**** The mean 30-day AMI mortality rates were 2.5% lower in the early feedback group compared with the delayed feedback group.
√√√
Werner, 2009 To evaluate whether public reporting in the setting of nursing homes resulted in improvement of reported and broader but unreported quality of post-acute care.
Centers for Medicare and Medicaid Services (CMS), Nursing Home Compare report.
1999–2005 nursing home Minimum Data Set and inpatient Medicare claims. A total of 8,137 skilled nursing home facilities (SNFs) were included in the study covering 9,390,930 post-acute care stays and 5,899,327 post-acute care stays of at least 14 days.
**** Control-led before-after study
**** Reported quality of postacute care improved after the initiation of public reporting for two of the three reported quality measures used in Nursing Home Compare. However, rates of potentially preventable rehospitalisation did not significantly improve and, in some cases, worsened.
√√√

61
Werner, 2009a To examine the effect of publicly reporting quality information on unreported quality of care in the setting of nursing homes.
Centers for Medicare and Medicaid Services, Nursing Home Compare.
1999-2005 nursing home Minimum Data Set and inpatient Medicare claims with 13683 skilled nursing facilities.
**** Before-after study
** Overall both un-reported and reported care improved following the launch of public reporting. Improvements in un-reported care were particularly large among facilities with high scores or that significantly improved on reported measures, whereas low-scoring facilities experienced no change or worsening of their unreported quality of care.
Li, 2010 To assess the impact of coronary artery bypass graft surgery (CABG) Outcomes Reporting Program in California.
All acute hospitals with CABG operations in California.
All isolated CABG cases from the California CABG Outcomes Reporting Program database between 2003 and 2006.
**** Time trend analysis
*** Total CABG volume decreased from 2003 to 2006 by almost 27% but patient case mix for most hospitals and surgeons was unchanged. Despite similar patient characteristics, the operative mortality for patients in the highest risk group was 26% lower in 2006 than in 2003.
√√√
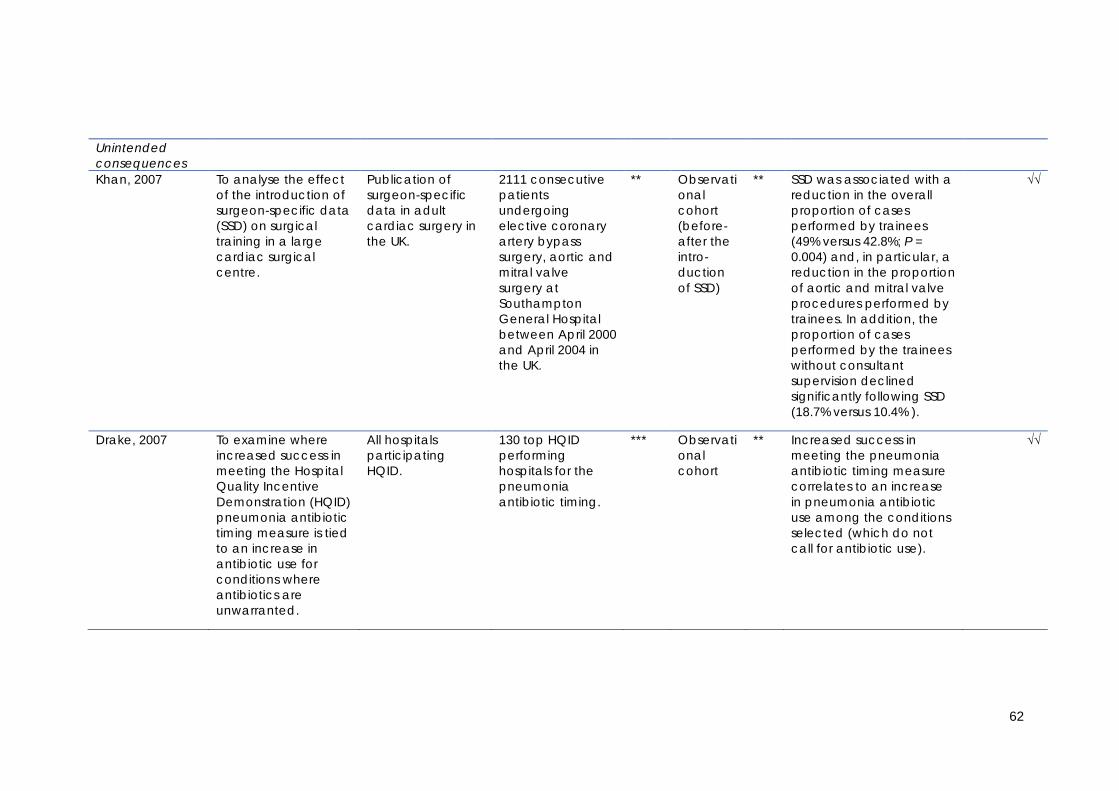
62
Unintended consequences
Khan, 2007 To analyse the effect of the introduction of surgeon-specific data (SSD) on surgical training in a large cardiac surgical centre.
Publication of surgeon-specific data in adult cardiac surgery in the UK.
2111 consecutive patients undergoing elective coronary artery bypass surgery, aortic and mitral valve surgery at Southampton General Hospital between April 2000 and April 2004 in the UK.
** Observational cohort (before-after the intro-duction of SSD)
** SSD was associated with a reduction in the overall proportion of cases performed by trainees (49% versus 42.8%; P = 0.004) and, in particular, a reduction in the proportion of aortic and mitral valve procedures performed by trainees. In addition, the proportion of cases performed by the trainees without consultant supervision declined significantly following SSD (18.7% versus 10.4% ).
√√
Drake, 2007 To examine where increased success in meeting the Hospital Quality Incentive Demonstration (HQID) pneumonia antibiotic timing measure is tied to an increase in antibiotic use for conditions where antibiotics are unwarranted.
All hospitals participating HQID.
130 top HQID performing hospitals for the pneumonia antibiotic timing.
*** Observational cohort
** Increased success in meeting the pneumonia antibiotic timing measure correlates to an increase in pneumonia antibiotic use among the conditions selected (which do not call for antibiotic use).
√√

63
Mukamel, 2009 To test empirically the hypothesis that nursing homes have responded to the publication of the report by adopting cream skimming admission policies.
All Medicare- and Medicaid certified nursing homes nationally (16,745).
All Medicare and Medicaid certified nursing homes nationally, focusing on those residents admitted for long-term rather than post-acute care, those identified as non-Medicare admissions, and those aged 65 years and older (2001-2005).
**** Obser-vational cohort
*** Despite the theoretical expectation, empirical evidence suggests only a limited degree of cream skimming.
√√
Friedberg, 2009 To determine whether publicly reporting hospital scores on antibiotic timing in pneumonia (percentage of patients with pneumonia receiving antibiotics within 4 hours) has led to unintended adverse consequences for patients.
Hospital Quality Alliance (HQA) measure “Initial Antibiotic Received within 4 Hours of Hospital Arrival”.
Retrospective analyses of 13,042 emergency department (ED) visits by adult patients with respiratory symptoms in the National Hospital Ambulatory Medical Care Survey, 2001-2005.
**** Before-after study.
** Despite concerns, public reporting of hospital antibiotic timing scores has not led to increased pneumonia diagnosis, antibiotic use, or a change in patient prioritisation.
√√√

64
Li, 2010 To assess the impact of coronary artery bypass graft surgery (CABG) Outcomes Reporting Program in California.
All acute hospitals with CABG operations in California.
All isolated CABG cases from the California CABG Outcomes Reporting Program database between 2003 and 2006.
**** Time trend analysis
*** No evidence of decreased access to CABG for high-risk patients in California during the period of public reporting of isolated CABG outcomes.
√√√
‡ Samples with 4 stars were representative of the population in whom public reporting is contemplated; those with 3 stars had major overlap between the targeted sample and the population in whom public reporting is contemplated; those with 2 stars had a narrow set of characteristics that differs from that of the population in whom public reporting is contemplated; and those with 1 star were completely different from the population in whom public reporting is contemplated. § Four stars indicate a randomised trial or experimental study; 3 stars indicate a controlled trial, pre-post trial with control (controlled before-after trial), time series, or observational cohort with multivariable adjustment; 2 stars indicate a pre-post trial without control, observational cohort study without multivariable adjustment, cross-sectional study without multivariable adjustment, analysis of time trends without control, or well-designed qualitative study; and 1 star indicates a case series, other qualitative study, or survey (descriptive) study. ¶ Three checks indicate great weight in the stratum’s body of evidence, 2 checks indicate moderate weight, and 1 check indicates little weight.

65
Appendix 3: Three summary tables adopted from the baseline systematic review by Fung (2008) Table A.1b: Effect of public release of performance data on health plan (Fung (2008))
First author, Year Objective Domain 1 Domain 2 Key findings Global ratings¶
Subject of Public Reporting
Participants Rating ‡ Type Ratings §
Selection Spranca et al. 2000
To assess effects of providing CAHPS information about hypothetical health plans on plan choices.
Hypothetical plans (Los Angeles; laboratory settings)
Adults with private insurance
** Experi-mental study
**** When plans had high CAHPS ratings, participants were willing to enrol in less expensive plans that restrict services.
√√
Scanlon et al. 2002
To assess effects of providing HEDIS and patient satisfaction ratings on plan choices.
Private health plans (HMO only) at General Motors
General Motors employees (1996 -1997)
*** Obser-vational cohort
*** Employees avoided plans with many below-average ratings and would be willing to pay more to avoid plans with lower ratings, but they were not strongly attracted to plans with many superior ratings.
√√√
Harris, 2002 To investigate the impact of expert-assessed and consumer-assessed quality ratings on willingness to enrol in hypothetical health plans that restrict provider access.
Hypothetical plans (Los Angeles; laboratory setting)
Privately insured adults (2000)
** Experi-mental study
**** Provision of report cards with information about quality of health plan reduced importance of provider network features.
√√

66
First author, Year Objective Domain 1 Domain 2 Key findings Global ratings¶
Subject of Public Reporting
Participants Rating ‡ Type Ratings §
Farley et al. 2002 To asses effects of providing CAHPS information on plan choices.
HMO Medicaid plans in New Jersey
Medicaid beneficiaries (1998)
*** Random-ised con-trolled trial
**** No effect on HMO choices overall; participants who read the report card and did not select the dominant HMO chose the HMO with higher CAHPS scores.
√√√
Farley et al. 2002 To assess effects of providing CAHPS information on plan choices.
HMO Medicaid plans in Iowa
Medicaid beneficiaries (2000)
*** Random-ised con-trolled trial
**** No effect on HMO choices overall.
√√
Beaulie, 2002 To assess effects of providing health performance data (HEDIS measures, patient satisfaction) on consumers’ enrolment decisions.
Private health plans available to Harvard University employees
Harvard University employees (1994-1997)
*** Obser-vational cohort
*** Provision of quality information had a small but statistically significant effect on health plan choices.
√√
Wedig and Tai-Seale, 2002
To assess effects of providing quality ratings from the Federal Employee Heath Benefit guide on consumers’ plan choices.
Private health plans available to U.S. federal employees
Federal employees with HMO coverage residing in counties with ≤ unique plans (1995-1996)
*** Obser-vational cohort
*** Dissemination of report cards influenced plan selection; employees were likely to select plans with better quality ratings.
√√
Jin and Sorenson, 2006
To assess effects of providing quality ratings from the Federal Employee Health Benefit guide
Private health plans serving U.S. federal employees
Federal employees, retirees, and surviving family of deceased
**** Obser-vational cohort
*** Overall inertia in health plan enrolment decisions; for individuals affected by performance ratings, better scores were associated with
√√√

67
First author, Year Objective Domain 1 Domain 2 Key findings Global ratings¶
Subject of Public Reporting
Participants Rating ‡ Type Ratings §
on plan choices. federal employees
increased likelihood of selecting the plan.
Clinical outcome Bost, 2001 To compare HEDIS
and CAHPS results for plans that publicly report data with those who do not, over a 3-year period.
U.S. commercial health plans
Commercial health plans (1997-1999)
**** Obser-vational cohort
** Technical performance measures and patient experience measures ( except communication) were higher for health plans that publicly report data.
√
Unintended consequences
McCormick et al. 2002
To compare the relationship between health plan performance and participation in public reporting programs.
U.S. commercial health plans (HMO only)
HMO health plans (1997-1999)
*** Obser-vational cohort
*** Lower-scoring plans were more likely than higher-scoring plans to stop disclosing publicly their quality data.
√√
Note: CAHPS (Consumer Assessment of Healthcare Providers and Systems); HEDIS: Health Employer Data and Information Set. No studies of health plan performance data and quality improvement activity were identified. ‡ Samples with 4 stars were representative of the population in whom public reporting is contemplated; those with 3 stars had major overlap between the targeted sample and the population in whom public reporting is contemplated; those with 2 stars had a narrow set of characteristics that differs from that of the population in whom public reporting is contemplated; and those with 1 star were completely different from the population in whom public reporting is contemplated. § Four stars indicate a randomised trial or experimental study; 3 stars indicate a controlled trial, pre–post trial with control (controlled before–after trial), time series, or observational cohort with multivariable adjustment; 2 stars indicate a pre–post trial without control, observational cohort study without multivariable adjustment, cross-sectional study without multivariable adjustment, analysis of time trends without control, or well-designed qualitative study; and 1 star indicates a case series, other qualitative study, or survey (descriptive) study. ¶ Three checks indicate great weight in the stratum’s body of evidence, 2 checks indicate moderate weight, and 1 check indicates little weight.

68
Table A.2b: Effect of public release of performance data on individual provider (Fung (2008))
First author, Year Objective Domain 1 Domain 2 Key findings Global ratings¶
Public Reporting Subject Participants Rating ‡ Type Ratings §
Selection Hannan et al. 1994
To determine whether mortality rate outlier status was associated with overall improvement in risk adjusted mortality and changes in volume of CABG operations following the implementation of the NYS CSRS.
All New York cardiac surgeons performing CABG
New York cardiac surgeons (1989–1992)
**** Obser-vational cohort
*** Surgeon group volume did not change substantially (exact figures were not presented).
√√
Hannan et al. 1995
To examine the longitudinal relationship between surgeon volume and in-hospital mortality for CABG surgery in New York and explain changes in mortality over time.
All New York cardiac surgeons performing CABG
57 187 patients undergoing isolated CABG surgery in New York (1989-1992)
**** Obser-vational cohort
*** Percentage of patients undergoing CABG surgery by low-volume surgeons decreased from 7.6% in 1989 to 5.7% in 1992.
√√

69
First author, Year Objective Domain 1 Domain 2 Key findings Global ratings¶
Public Reporting Subject Participants Rating ‡ Type Ratings §
Mukamel and Mushlin, 1998
To measure the relationship between provider ratings in the NYS CSRS and rates of growth in fee-for-service market share.
All New York cardiac surgeons performing CABG
New York cardiac surgeons with a Unique Physician Identification Number (1990- 1993)
*** Obser-vational cohort
** Physicians with better outcomes had higher rates of growth of charges.
√
Mukamel et al. 2000
To use telephone interviews and contracting data from the majority of MCOs licensed in New York to determine whether New York MCOs consider quality when they choose cardiac surgeons and whether NYS CSRS affects contracting patterns.
All New York cardiac surgeons performing CABG
Decision makers within MCOs who are responsible for the selection of providers in New York (59% response rate) (1998)
*** Cross-sectional study
** 20% indicated that the NYS CSRS reports were a major factor in their contracting decision; actual contracting patterns show that MCOs contract on the basis of a surgeon’s designation as a high quality outlier, but they do not make choices on the basis of poor-quality outlier designation or actual RAMR.
√
Mukamel et al. 2002
To evaluate the association between contracting practices of MCOs with cardiac surgeons and the quality of the cardiac surgeons.
All New York cardiac surgeons performing CABG
Cardiac surgeons offering CABG surgery and 78% of MCOs in New York (1998)
*** Obser-vational cohort
*** Contract probability decreased with excess RAMR and increased with high-quality outlier status in downstate New York.
√√

70
First author, Year Objective Domain 1 Domain 2 Key findings Global ratings¶
Public Reporting Subject Participants Rating ‡ Type Ratings §
Mukamel et al. 2004
To examine the impact of the NYS CSRS on selection of cardiac surgeons.
All New York cardiac surgeons performing CABG
All New York Medicare fee-for-service enrolees 65 years of age who underwent CABG (1991–1992)
*** Obser-vational cohort
*** For the average patient, the NYS CSRS influenced selection of cardiac surgeon and diminished the importance of surgeon experience and price as signals for quality.
√√
Jha and Epstein, 2006
To examine the relationship between providers” NYS CSRS rankings and market share; to examine impact of cardiac surgeons” performance on the likelihood of ceasing practice in New York.
All New York cardiac surgeons performing CABG
All New York cardiac surgeons who dropped out of the reporting system (1989–1999)
**** Obser-vational cohort
*** Poor performance was associated with increased odds of ceasing practice.
√√

71
Clinical outcome
Hannan et al. 1994
To determine whether mortality rate outlier status was associated with overall improvement in risk-adjusted mortality and changes in volume of CABG operations following the implementation of the NYS CSRS.
All New York cardiac surgeons performing CABG
New York cardiac surgeons (1989–1992)
**** Observational cohort
*** When providers were split into terciles based on RAMR, the 3 groups showed different risk-adjusted mortality for the pre-release period; RAMR decreased for all groups after release; when terciles were based on outlier status, the middle and highest outliers had a decrease in RAMR and the lowest outlier group had a slight increase in RAMR.
√√
Unintended consequences
Hannan et al. 1995
To examine the longitudinal relationship between surgeon volume and in-hospital mortality for CABG surgery in New York and explain changes in mortality over time.
All New York cardiac surgeons performing CABG
57 187 patients undergoing isolated CABG surgery in New York (1989–1992)
**** Obser-vational cohort
*** Proportionately larger decrease in RAMR for low-volume surgeons was not due to changes in patient case mix; the decrease was due in part to an exit of high RAMR surgeons from clinical practice and an influx of low RAMR surgeons.
√√

72
Schneider and Epstein, 1996
To assess the influence of the Pennsylvania Consumer Guide to CABG Surgery on cardiologists and cardiac surgeons.
All Pennsylvania cardiac surgeons performing CABG
Randomly selected cardiologists and cardiac surgeons practicing in Pennsylvania (65% overall response rate) (1995)
*** Des-criptive (survey)
*** 59% of cardiologists reported increased difficulty finding surgeons willing to perform CABG in severely ill patients who required it; 63% of cardiac surgeons reported being less willing to operate on such patients.
√
Burack et al. 1999
To examine the effects on the practice of cardiac surgery, as perceived by surgeons.
All New York cardiac surgeons performing CABG
104 New York cardiac surgeons (69% response rate) (1997)
*** Des-criptive (survey)
* 62% of cardiac surgeons refused to operate on ≥1 high-risk CABG patient over the preceding year, primarily because of public reporting.
√
Mukamel et al. 2004
To examine the impact of the NYS CSRS on selection of cardiac surgeons.
All New York cardiac surgeons performing CABG
All New York Medicare fee-for-service enrolees 65 years of age who underwent CABG (1991-1992)
*** Obser-vational cohort
*** In the post-report period, patients from more affluent and more educated neighbourhoods were more likely to be treated by low RAMR surgeons, and patients from lower socioeconomic neighbourhoods were more likely to be treated by high RAMR surgeons.
√√

73
Werner et al. 2005
To investigate the impact of the NYS CSRS on racial and ethnic disparities in use of CABG, PTCA, and cardiac catheterisation.
All New York hospitals and cardiac surgeons performing CABG
Hospital discharges from the New York State Department of Health’s inpatient data files and hospital discharges in a group of comparison states in the Nationwide Inpatient Sample from the HCUP-3 (928 551 patients with acute myocardial infarction) (1988-1995)
**** Obser-vational cohort
*** Racial and ethnic disparity in CABG use increased in New York immediately after implementation of the NYS CSRS, whereas disparities did not change in the comparison states; these disparities decreased to levels similar to report card pre-release levels over time; no differences in PTCA or cardiac catheterisation after the CABG report card was released.
√√
Narins et al. 2005
To assess the influence of the New York PCI report on physicians being monitored.
All New York physicians and hospitals performing PCI
Interventional cardiologists included in the New York State PCI report (65% response rate) (2003)
*** Des-criptive (survey)
* 79% of interventional cardiologists agreed or strongly agreed that public reporting has influenced their decision on whether to perform angioplasty on individual patients and critically ill patients with high expected mortality rates.
√
Note: CAHPS (Consumer Assessment of Healthcare Providers and Systems); HEDIS: Health Employer Data and Information Set. No studies of health plan performance data and quality improvement activity were identified. ‡ Samples with 4 stars were representative of the population in whom public reporting is contemplated; those with 3 stars had major overlap between the targeted sample and the population in whom public reporting is contemplated; those with 2 stars had a narrow set of characteristics that differs from that of the population in whom public reporting is contemplated; and those with 1 star were completely different from the population in whom public reporting is contemplated. § Four stars indicate a randomised trial or experimental study; 3 stars indicate a controlled trial, pre–post trial with control (controlled before–after trial), time series, or observational cohort with multivariable adjustment; 2 stars indicate a pre–post trial without control, observational cohort study without multivariable adjustment, cross-sectional study without multivariable adjustment, analysis of time trends without control, or well-designed qualitative study; and 1 star indicates a case series, other qualitative study, or survey (descriptive) study. ¶ Three checks indicate great weight in the stratum’s body of evidence, 2 checks indicate moderate weight, and 1 check indicates little weight.

74
Table A.3b: Effect of public release of performance data on hospital quality (Fung (2008))
First author, Year Objective Domain 1 Domain 2 Key findings Global ratings¶
Public Reporting Subject Participants Rating ‡ Type Ratings §
Selection Vladeck et al. 1988
To examine the relationship between mortality rate outlier status and hospital CABG volume after HCFA release of hospital mortality rates.
New York hospitals providing care to Medicare patients.
All New York general acute hospitals serving Medicare patients (1985 to 1986).
**** Analysis of time trend
** No statistically significant effect on occupancy rates.
√
Hannan et al. 1994
To determine whether mortality rate outlier status was associated with overall improvement in risk adjusted mortality and changes in volume of CABG operations following the implementation of the NYS CSRS.
All New York cardiac surgeons performing CABG.
New York cardiac surgeons (1989-1992).
**** Obser-vational cohort
*** No association overall between mortality rate outlier status and hospital volume.
√√
Mennemeyer et al. 1997
To assess the relationship between the release of HCFA hospital-specific mortality rates and
U.S. hospitals providing care to Medicare patients.
Community hospitals treating Medicare patients (1984-1992).
**** Obser-vational cohort
*** Hospitals with mortality rates twice that expected by HCFA had <1 fewer discharge per week in the first year; press reports of single, unexpected
√√

75
First author, Year Objective Domain 1 Domain 2 Key findings Global ratings¶
Public Reporting Subject Participants Rating ‡ Type Ratings §
utilisation (discharges); to compare the impact of publicly releasing HCFA mortality rates to press reports of unexpected deaths, on utilisation.
deaths were associated with 9% decrease in hospital discharges within 1 year.
Mukamel and Mushlin, 1998
To measure the relationship between provider ratings in the NYS CSRS and rates of growth in fee-for-service market share.
All New York hospitals performing CABG.
All New York hospitals performing CABG (1990-1993).
*** Obser-vational cohort
** Hospitals with better outcomes experienced higher rates of growth in market share.
√
Chassin, 2002 To examine the relationship between mortality rate outlier status and hospital CABG volume and quality improvement activity after NYS CSRS implementation.
All New York hospitals performing CABG.
New York hospitals with the highest and lowest CABG mortality (1989-1995).
**** Analysis of time trend
** Small changes in market share and less than half the time in the expected direction.
√
Baker et al. 2003 To examine market share after release of risk-adjusted 30-day mortality rates for 6 acute conditions as part of the CHQC
30 non-federal hospitals in northeast Ohio.
30 non-federal hospitals (1991-1997)
*** Time series
*** No relationship overall between higher-than-expected mortality rates and market share
√√

76
First author, Year Objective Domain 1 Domain 2 Key findings Global ratings¶
Public Reporting Subject Participants Rating ‡ Type Ratings §
program.
Romano and Zhou, 2004
To examine the relationship between outlier status in California and New York public reports for 3 conditions or procedures (CABG mortality in New York; AMI and postdiskectomy complications in California) and hospital volume.
All New York hospitals performing CABG; all non-federal.
All licensed, non-federal hospitals in New York performing CABG, and non-federal hospitals in California except Kaiser hospitals and state developmental and correctional hospitals.
**** Time series
*** No statistically significant AMI-related volume changes among outlier hospitals; slight increase in lumbar diskectomy-related volume for low-complication outliers; transient increase in CABG volume for low-mortality hospitals and transient decrease in volume for high-mortality outliers.
Romano and Zhou, 2004
Hibbard et al. 2005
To compare the impact of public (Quality Counts), internal (confidential), and no reporting on quality improvement activity, market share (hospital discharges), and risk-adjusted performance (2 summary indices of adverse events and indices in 3 clinical areas - hip/knee surgery, cardiac
24 hospitals in south-central Wisconsin.
Hospitals participating in Quality Counts.
** Analysis of time trend
** No changes in market share for hospital with publicly reported data; no results given for internal or no reporting groups.
Hibbard et al. 2005

77
First author, Year Objective Domain 1 Domain 2 Key findings Global ratings¶
Public Reporting Subject Participants Rating ‡ Type Ratings §
care, and obstetric care).
Jha and Epstein, 2006
To examine the relationship between providers’ NYS CSRS rankings and market share; to examine impact of cardiac surgeons’ performance on the likelihood of ceasing practice in New York.
All New York hospitals performing CABG.
All New York hospitals performing CABG for >3 years (1989-2002)
**** Time series
*** No relationship between ranking and subsequent market share.
Jha and Epstein, 2006
Quality improvement
Dziuban et al. 1994
To document a hospital’s response to being identified as a high risk-adjusted mortality outlier in the NYS CSRS.
All New York hospitals providing CABG surgery.
1 outlier hospital (1992-1993)
** Case study
* Quality improvement activity increased (change in timing and technique used for patients undergoing emergent CABG, change in hospital policies).
√
Luce et al. 1996 To describe quality improvement activity after California CHOP report featuring risk-adjusted outcomes.
All California non-federal hospitals.
17 of 22 public hospitals that are members of the California Association of Public Hospitals and Health Systems (1993-1994).
** Des-criptive (survey)
* Minimal impact on quality improvement activity.
√
Longo et al. To examine the All Missouri hospitals Key informants *** Des- * Hospitals instituted services √

78
First author, Year Objective Domain 1 Domain 2 Key findings Global ratings¶
Public Reporting Subject Participants Rating ‡ Type Ratings §
1997 impact of Missouri Department of Health’s obstetrics consumer report, which provides structure, process, and outcomes measures, on quality improvement activity and clinical outcomes.
providing obstetric care.
designated by hospital administrators at 82 hospitals (93% response rate) (1994).
criptive (survey)
(e.g., hospital policy that infants ride in car seats upon discharge, formal neonatal transfer agreements) after the reports were published.
Bentley and Nash, 1998
To determine whether Pennsylvania Health Care Cost Containment Council’s Consumer Guide to CABG, which compared in-hospital mortality rates, led to more changes in Pennsylvania hospitals’ CABG policies/practices than in New Jersey hospitals, which were not required to publicly report performance results.
Hospitals providing CABG surgery in Pennsylvania.
Key informants at hospitals identified by the chief executive officers of 21 Pennsylvania and 8 New Jersey hospitals.
*** Survey (des-criptive)
* Response in Pennsylvania hospitals (e.g., recruited staff, started continuous quality improvement program to improve CABG procedures); more changes in Pennsylvania than New Jersey hospitals (no formal statistical testing because the sample was small).
√
Rainwater et al. To describe the California non- 39 key informants at ** Inter- * Minimal impact on quality √

79
First author, Year Objective Domain 1 Domain 2 Key findings Global ratings¶
Public Reporting Subject Participants Rating ‡ Type Ratings §
1998 impact of publicly reporting California’s CHOP risk-adjusted 30-day inpatient mortality rates for patients with AMI on quality improvement activity.
federal acute-care hospitals
a sample of acute-care hospitals in California (1996-1997)
views improvement activity (two thirds of respondents indicated no specific activity).
Rosenthal et al. 1998
To measure quality improvement activity following release of CHQC reports of mortality rates, length of stay, and caesarean section rates (all measures adjusted for severity).
Cleveland hospitals 1 academic and 3 community hospitals of varying size
** Case series
* Quality improvement activities increased (e.g., interdisciplinary process improvement teams, review of processes of care, development of practice guidelines).
√
Chassin, 2002 To examine the relationship between mortality rate outlier status and hospital CABG volume/quality improvement activity following the implementation of the NYS CSRS.
All New York hospitals performing CABG
Key informants at 4 hospitals and state officials directly involved in quality improvement efforts at the hospitals (interviewed in 2001).
** Case series
* Increase in quality improvement activity (e.g., staffing policy changes, multidisciplinary approach to examining care processes, changes in operating room schedule).
√
Hibbard et al. 2003
To compare the effects of public
24 hospitals in south-central Wisconsin
Hospitals participating in
** Con-trolled
*** Quality Counts hospitals did not engage in different
√

80
First author, Year Objective Domain 1 Domain 2 Key findings Global ratings¶
Public Reporting Subject Participants Rating ‡ Type Ratings §
(Quality Counts), confidential, and no reporting on quality improvement activity, market share, and risk-adjusted performance (2 summary indices of adverse events and indices in 3 clinical areas - hip/knee surgery, cardiac care, and obstetric care.
Quality Counts (2002)
trial strategies of quality improvement overall, but they did engage in a statistically higher number of quality improvement efforts specific to the areas included in the reports.
Tu and Cameron,2003
To study the impact of the Cardiovascular Health and Services in Ontario: An ICES Atlas, which reports hospital-specific AMI performance measures, on quality improvement activity.
All Ontario hospitals providing AMI care
Physicians working in Ontario hospitals representing 62 of 121 eligible hospitals (52% overall hospital response rate) (2000)
** Des-criptive (survey)
* 54% of respondents indicated that their hospitals made changes in response to public reporting
√
Hibbard et al. 2005
To compare the effects of public (Quality Counts), internal
24 hospitals in south-central Wisconsin
Hospitals participating in Quality Counts
** Des-criptive (survey)
* Of 7 possible activities, the mean number of quality improvement activities was 4.1 overall (5.7 for hospitals
√

81
First author, Year Objective Domain 1 Domain 2 Key findings Global ratings¶
Public Reporting Subject Participants Rating ‡ Type Ratings §
(confidential), and no reporting on quality improvement activity, market share (hospital discharges), and risk-adjusted performance (2 summary indices of adverse events and indices in 3 clinical areas - hip/knee surgery, cardiac care, and obstetric care).
with improved ratings and 2.6 with no change in ratings); 4 had a decrease in ratings; no formal statistical testing.
Mannion et al. 2005
To describe impact of the NHS star performance ratings on quality improvement efforts.
All hospital trusts in England.
Staff at 4 low-performing hospital trusts and 2 high-performing hospital trusts.
** Case series
* Ratings transmitted important priorities from central government and helped direct and concentrate front-line resources.
√
Clinical outcome
Hannan et al. 1994 (64)
To assess changes in in-hospital mortality rates of CABG patients after publication of mortality data in the NYS CSRS.
All New York hospitals performing CABG.
57 187 patients undergoing CABG (1989-1992).
**** Obser-vational cohort
*** RAMR decreased from 4.17% to 2.45%.
√√
Dziuban et al. To document a All New York One poor- ** Case * Excess mortality was localised √

82
First author, Year Objective Domain 1 Domain 2 Key findings Global ratings¶
Public Reporting Subject Participants Rating ‡ Type Ratings §
1994 hospital’s response to being identified as a high risk-adjusted mortality outlier in the NYS CSRS.
hospitals performing CABG.
performing New York hospital (1992-1993).
study to high-acuity patients undergoing emergent CABG; mortality decreased to 0% over 1 year after a focused effort to optimise management of these patients.
Hannan et al. 1994
To determine whether mortality rate outlier status was associated with changes in CABG-related in-hospital RAMRs and changes in provider volume of CABG performed after NYS CSRS implementation.
All New York hospitals performing CABG.
All New York patients discharged after CABG (1989-1992)
**** Obser-vational cohort
*** Reductions in RAMR, especially among hospitals that had highest initial mortality rates; convergence in risk-adjusted mortality rates among hospitals initially identified as high, medium, and low performers.
√√
Ghali et al. 1997 To compare trends in CABG-related mortality in Massachusetts (which lacks state-wide public reporting of CABG outcomes) with those in New York (which has public reporting) and northern New England.
All New York hospitals performing CABG.
12 Massachusetts hospitals performing cardiac surgery (except Veterans Affairs hospitals) and hospitals contained in the HCFA hospital 30-day unadjusted mortality data set (1990, 1992, and 1994).
**** Observational cohort
*** RAMR reductions in Massachusetts were similar to mortality reduction in New York and northern New England; unadjusted mortality trends were similar in Massachusetts, New York, northern New England, and the United States
√√

83
First author, Year Objective Domain 1 Domain 2 Key findings Global ratings¶
Public Reporting Subject Participants Rating ‡ Type Ratings §
Rosenthal et al. 1997
To measure changes in hospital mortality that occurred after implementation of the CHQC reporting initiative, which publicly released in-hospital mortality rates.
Cleveland hospitals. 101 060 consecutive eligible discharges with 8 diagnoses from 30 northeastern Ohio hospitals (1991-1993).
*** Time series
*** Risk-adjusted mortality for most conditions declined from 7.5% to 6.8% (July-December 1992), 6.8% (January-June 1993), and 6.5% (July-December 1993) for 3 periods after publication; decreases in mortality rates were statistically significant in weighted linear regression analyses for heart failure (0.50% per period) and pneumonia (0.38% per period).
√
Longo et al. 1997
To examine the impact of Missouri Department of Health’s obstetrics consumer report, which provides structure, process, and outcomes measures.
All Missouri hospitals providing obstetric care.
All Missouri hospitals providing obstetrics care (1989-1994).
*** Obser-vational cohort
*** Outlier hospitals had improvements in rates of ultrasonography, vaginal birth after cesarean section, and cesarean section.
√√
Peterson et al. 1998
To examine the impact of the NYS CSRS on in-hospital mortality rates by comparing mortality rates in New York to
All New York hospitals performing CABG.
Medicare patients 65 years of age who underwent CABG in a U.S. hospital (1987-1992).
**** Obser-vational cohort
*** Both unadjusted and risk-adjusted mortality rates in New York decreased more than in other states.
√√√

84
First author, Year Objective Domain 1 Domain 2 Key findings Global ratings¶
Public Reporting Subject Participants Rating ‡ Type Ratings §
those in other states.
Clough et al. 2002
To measure changes in in-hospital mortality rates associated with the implementation of the CHQC reporting initiative.
Cleveland hospitals. Hospitals included in the Ohio Hospital Association’s inpatient discharge data (1992-1995).
*** Obser-vational cohort
*** No statistical difference in rate of decline in combined mortality in Cleveland compared with the rest of the Ohio.
√√
Baker et al. 2003 To examine hospitals’ market share and 30-day risk-adjusted mortality at hospitals participating in CHQC.
Hospitals in the Cleveland area.
Medicare patients receiving care at Cleveland-area hospitals (1991-1997).
*** Time series
*** Hospital outlier status was not related to changes in risk-adjusted 30-day mortality overall.
√√
Hibbard et al. 2005
To compare the impact of public (Quality Counts), confidential, and no reporting on quality improvement activity, market share, and risk-adjusted performance (2 summary indices of adverse events and indices in 3 clinical areas - hip/knee surgery, cardiac care, and obstetric
24 Wisconsin hospitals.
115 Wisconsin hospitals ( 2001–2003).
** Controlled before-after trial
*** Performance feedback, whether public or confidential, was associated with improved performance.
√√

85
First author, Year Objective Domain 1 Domain 2 Key findings Global ratings¶
Public Reporting Subject Participants Rating ‡ Type Ratings §
care).
Moscucci et al. 2005
To measure the effect of the New York State PCI report on case selection for PCI by comparing Michigan’s and New York’s adjusted and unadjusted in-hospital mortality rates.
All New York hospitals performing CABG.
11 374 patients in a multicenter Michigan PCI database and 69 048 patients in a state-wide New York PCI database (1998-1999).
**** Observational cohort
*** Unadjusted mortality rates were lower in New York than Michigan, but adjusted mortality rates were not statistically different.
√√
Unintended consequences
Omoigui et al. 1996
To determine whether dissemination of NYS CSRS mortality data was associated with outmigration of high-risk patients to undergo treatment at the Cleveland Clinic.
All hospitals performing CABG in New York.
9442 patients receiving CABG at the Cleveland Clinic (1989-1993).
**** Obser-vational cohort
*** Patients from New York receiving CABG at the Cleveland Clinic had higher expected mortality than the New York state-wide mix, patients from Ohio, and patients from other states or countries.
√√
Peterson et al. 1998
To examine the impact of the NYS CSRS on in-state access to CABG and referral out of state of patients in need of
All New York hospitals performing CABG.
Medicare patients 65 years of age who underwent CABG in a U.S. hospital (1987-1992).
**** Obser-vational cohort
*** New York patients with AMI were less likely to receive CABG than those admitted outside New York, but the overall percentage increased, paralleling
√√

86
First author, Year Objective Domain 1 Domain 2 Key findings Global ratings¶
Public Reporting Subject Participants Rating ‡ Type Ratings §
CABG. national trends, even among higher risk elderly subsets; out-of-state CABG rates decreased.
Baker et al. 2002 To examine mortality trends associated with the CHQC program
Cleveland hospitals Medicare patients hospitalised with AMI, heart failure, gastrointestinal hemorrhage, obstructive pulmonary disease, pneumonia, or stroke (1991- 1997)
*** Times series
*** Risk-adjusted in-hospital mortality declined for most conditions, but mortality rate in the early postdischarge period rose for most conditions and the 30-day mortality rate declined for only heart failure and obstructive pulmonary disease and increased for stroke.
√√
Dranove et al. 2003
To study the effects of public reporting in New York and Pennsylvania.
All New York and Pennsylvania hospitals performing CABG.
Medicare beneficiaries and hospitals found in a Medicare claims data set (not specified) and hospitals participating in the American Hospital Association annual survey (1987-1994).
**** Observational cohort
*** Report cards were associated with a shift in CABG use to healthier patients, leading to worse cardiac outcomes, especially among sicker patients (who were defined as higher hospital expenditures and days in hospitals).
√√√
Mannion et al. 2005
To describe impact of the NHS star performance ratings
All hospital trusts in England
Staff at 4 low-performing hospital trusts and 2 high-
** Case series
* Public reporting led to tunnel vision, distortion of clinical priorities, and disincentive to
√√

87
First author, Year Objective Domain 1 Domain 2 Key findings Global ratings¶
Public Reporting Subject Participants Rating ‡ Type Ratings §
on quality improvement efforts.
performing hospital trusts.
improve performance among high-rated organisations.
Moscucci et al. 2005
To measure the effect of the NYS CSRS on case selection for PCI by comparing Michigan’s and New York’s adjusted and unadjusted in-hospital mortality rates.
All New York hospitals performing CABG.
11 374 patients in a multicenter (8-hospital) PCI database in Michigan and 69 048 patients in a state-wide (34-hospital) PCI database in New York (1998-1999).
**** Observational cohort
*** Significant case-mix differences between patients undergoing PCI in Michigan and New York, suggesting a propensity in New York toward not intervening on high-risk patients.
√
Note: CAHPS (Consumer Assessment of Healthcare Providers and Systems); HEDIS: Health Employer Data and Information Set. No studies of health plan performance data and quality improvement activity were identified. ‡ Samples with 4 stars were representative of the population in whom public reporting is contemplated; those with 3 stars had major overlap between the targeted sample and the population in whom public reporting is contemplated; those with 2 stars had a narrow set of characteristics that differs from that of the population in whom public reporting is contemplated; and those with 1 star were completely different from the population in whom public reporting is contemplated. § Four stars indicate a randomised trial or experimental study; 3 stars indicate a controlled trial, pre–post trial with control (controlled before–after trial), time series, orobservational cohort with multivariable adjustment; 2 stars indicate a pre–post trial without control, observational cohort study without multivariable adjustment, cross-sectional study without multivariable adjustment, analysis of time trends without control, or well-designed qualitative study; and 1 star indicates a case series, other qualitative study, or survey (descriptive) study. ¶ Three checks indicate great weight in the stratum’s body of evidence, 2 checks indicate moderate weight, and 1 check indicates little weight.

88
References 1. Fung CH, Lim YW, Mattke S, Damberg C, Shekelle PG. Systematic review: The
evidence that publishing patient care performance data improves quality of care. Annals of Internal Medicine 2008;148(2):111-23.
2. Berwick DM, James B, Coye MJ. Connections between quality measurement and improvement. Medical Care 2003;41(1 Suppl).
3. Grimshaw J, McAuley LM, Bero LA, Grilli R, Oxman AD, Ramsay C, et al.. Systematic reviews of the effectiveness of quality improvement strategies and programmes. Quality and Safety in Health Care 2003;12(4):298-303.
4. Cochrane Effective Practice and Organisation of Care Review Group 2002. 5. Guyatt GHO, Andrew D; E, Gunn; Kunz, Regina; Falck-Ytter, Yngve; Alonso-Coello,
Pablo. GRADE: an emerging consensus on rating quality of evidence and strength of recommendations. british Medical Journal 2008;336:924.
6. Crossing the Quality Chasm: A New Health System for the 21st Century. Institute of Medicine, 2001.
7. To Err Is Human. Institute of Medicine, 2000. 8. Performance measurement: Accelerating Improvement. Institute of Medicine,
2006. 9. Delmarva Foundation The State of the Art of Online Hospital Public Reporting: A
Review of Forty-Seven Websites. http://www.delmarvafoundation.org/newsAndPublications/pressReleases/2005/08_18_05.pdf#search= 'The State of the Art of Online Hospital Public Reporting A Review of Forty Seven Websites' 2005.
10. CMS. http://www.cms.gov/QualityInitiativesGenInfo/downloads/QualityMeasurementRoadmap_OEA1-16_508.pdf. 2010.
11. NCQA. http://www.ncqa.org/tabid/1044/Default.aspx. 2010. 12. AHRQ. http://www.ahrq.gov/qual/. 2010. 13. The Joint Commission
http://www.jointcommission.org/PerformanceMeasurement/. 2010. 14. New York State Department of Health http://www.health.state.ny.us/facilities/.
2010. 15. Greener I. Towards a history of choice in UK health policy. Sociol Health Illn
2009;31(3):309-24. 16. Wallace JT, Gary F; Verrall, Tanya; Chan, BTB;. Public Reporting on the Quality of
Heatlhcare: Emerging Evidence on Promising Practice for Effective Practice. Canadian Health Services Research Foundation 2007.
17. Schauffler HH, Mordavsky JK. Consumer reports in health care: Do they make a difference? Annual Review of Public Health, 2001:69-89.
18. Marshall MN, Shekelle PG, Leatherman S, Brook RH. The release of performance data: What do we expect to gain? A review of the evidence. Journal of the American Medical Association 2000;283(14):1866-74.
19. Brien SE, Lorenzetti DL, Lewis S, Kennedy J, Ghali WA. Overview of a formal scoping review on health system report cards. Implementation Science 2010;5(1).
20. Arksey HOM, L. Scoping Studies: Towards a Methodological Framework. Int J Socical Research Methodology 2005;8:19-32.
21. Chernew M, Gowrisankaran G, Scanlon DP. Learning and the value of information: Evidence from health plan report cards. Journal of Econometrics 2008;144(1):156-74.
22. Dafny L, Dranove D. Do report cards tell consumers anything they don't already know? The case of Medicare HMOs. RAND Journal of Economics 2008;39(3):790-821.
23. Beaulieu ND. Quality information and consumer health plan choices. Journal of Health Economics 2002;21(1):43-63.

89
24. Wedig GJ, Tai-Seale M. The effect of report cards on consumer choice in the health insurance market. Journal of Health Economics 2002;21(6):1031-48.
25. Jin GZ, Sorensen AT. Information and consumer choice: The value of publicised health plan ratings. Journal of Health Economics 2006;25(2):248-75.
26. Scanlon DP, Chernew M, McLaughlin C, Solon G. The impact of health plan report cards on managed care enrollment. Journal of Health Economics 2002;21(1):19-41.
27. Uhrig JD, Harris-Kojetin L, Bann C, Kuo TM. Do content and format affect older consumers' use of comparative information in a medicare health plan choice? Results from a controlled experiment. Medical Care Research and Review 2006;63(6):701-18.
28. Spranca M, Kanouse DE, Elliott M, Short FP, Farley DO, Hays RD. Do consumer reports of health plan quality affect health plan selection? Health Services Research 2000;35(5 I):933-47.
29. Farley DO, Short PF, Elliott MN, Kanouse DE, Brown JA, Hays RD. Effects of CAHPS health plan performance information on plan choices by New Jersey medicaid beneficiaries. Health Services Research 2002;37(4):985-1007.
30. Farley DO, Elliott MN, Short PF, Damiano P, Kanouse DE, Hays RD. Effect of CAHPS performance information on health plan choices by Iowa Medicaid beneficiaries. Medical Care Research and Review 2002;59(3):319-36.
31. Landon BE, Rosenthal MB, Normand SLT, Frank RG, Epstein AM. Quality monitoring and management in commercial health plans. American Journal of Managed Care 2008;14(6):377-86.
32. Duvalko KM, Sherar M, Sawka C. Creating a system for performance improvement in cancer care: Cancer Care Ontario's clinical governance framework. Cancer Control 2009;16(4):293-302.
33. Bost JE. Managed care organisations publicly reporting three years of HEDIS measures. Managed care interface 2001;14(9):50-54.
34. McCormick D, Himmelstein DU, Woolhandler S, Wolfe SM, Bor DH. Relationship between low quality-of-care scores and HMOs' subsequent public disclosure of quality-of-care scores. Journal of the American Medical Association 2002;288(12):1484-90.
35. Vladeck BC, Goodwin EJ, Myers LP, Sinisi M. Consumers and hospital use: the HCFA "death list” Health Affairs 1988;7(1):122-25.
36. Hannan EL, Kumar D, Racz M, Siu AL, Chassin MR. New York State's Cardiac Surgery Reporting System: Four years later. Annals of Thoracic Surgery 1994;58(6):1852-57.
37. Mukamel DB, Mushlin AI. Quality of Care Information Makes a Difference: An Analysis of Market Share and Price Changes after Publication of the New York State Cardiac Surgery Mortality Reports. Medical Care 1998;36(7):945-54.
38. Chassin MR. Achieving and sustaining improved quality: Lessons from New York state and cardiac surgery. Health Affairs 2002;21(4):40-51.
39. Romano PS, Hong Z. Do well-publicised risk-adjusted outcomes reports affect hospital volume? Medical Care 2004;42(4):367-77.
40. Jha AK, Epstein AM. The predictive accuracy of the New York State coronary artery bypass surgery report-card system. Health Affairs 2006;25(3):844-55.
41. Baker DW, Einstadter D, Thomas C, Husak S, Gordon NH, Cebul RD. The effect of publicly reporting hospital performance on market share and risk-adjusted mortality at high-mortality hospitals. Medical Care 2003;41(6):729-40.
42. Hibbard JH, Stockard J, Tusler M. Hospital performance reports: Impact on quality, market share, and reputation. Health Affairs 2005;24(4):1150-60.
43. Mennemeyer ST, Morrisey MA, Howard LZ. Death and reputation: How consumers acted upon HCFA mortality information. Inquiry 1997;34(2):117-28.
44. Peters E, Dieckmann N, Dixon A, Hibbard JH, Mertz CK. Less is more in presenting quality information to consumers. Medical Care Research and Review 2007;64(2):169-90.

90
45. Bundorf MK, Chun N, Goda GS, Kessler DP. Do markets respond to quality information? The case of fertility clinics. Journal of Health Economics 2009;28(3):718-27.
46. Merle V, Germain JM, Tavolacci MP, Brocard C, Chefson C, Cyvoct C, et al.. Influence of infection control report cards on patients' choice of hospital: pilot survey. Journal of Hospital Infection 2009;71(3):263-68.
47. Mazor KM, Dodd KS, Kunches L. Communicating hospital infection data to the public: A study of consumer responses and preferences. American Journal of Medical Quality 2009;24(2):108-15.
48. Pope DG. Reacting to rankings: Evidence from "America's Best Hospitals” Journal of Health Economics 2009;28(6):1154-65.
49. Stewart VT. Use of a Prototype Acute Stroke Registry to Improve Care. Profile of Receptive Stroke Programs. American Journal of Preventive Medicine 2006;31(6 SUPPL. 2).
50. Rask KJS, Linda D; Naylor, Dorothy. A State-wide Voluntary Patient Safety Initiative Journal on Quality and Patient Safety 2006;32(10):564-72.
51. Zinn JS, Spector WD, Weimer DL, Mukamel DB. Strategic orientation and nursing home response to public reporting of quality measures: An application of the miles and snow typology. Health Services Research 2008;43(2):598-615.
52. Fonarow GC, Abraham WT, Albert NM, Gattis Stough W, Gheorghiade M, Greenberg BH, et al.. Influence of a performance-improvement initiative on quality of care for patients hospitalised with heart failure: Results of the organised program to initiate lifesaving treatment in hospitalised patients with heart failure (OPTIMIZE-HF). Archives of Internal Medicine 2007;167(14):1493-502.
53. Tu JV, Donovan LR, Lee DS, Wang JT, Austin PC, Alter DA, et al.. Effectiveness of public report cards for improving the quality of cardiac care - The EFFECT study: A randomised trial. JAMA - Journal of the American Medical Association 2009;302(21):2330-37.
54. Dziuban Jr SW, McIlduff JB, Miller SJ, Dal Col RH. How a New York cardiac surgery program uses outcomes data. Annals of Thoracic Surgery 1994;58(6):1871-76.
55. Bentley JM, Nash DB. How Pennsylvania hospitals have responded to publicly released reports on coronary artery bypass graft surgery. The Joint Commission journal on quality improvement 1998;24(1):40-49.
56. Longo DR, Land G, Schramm W, Fraas J, Hoskins B, Howell V. Consumer reports in health care: Do they make a difference in patient care? Journal of the American Medical Association 1997;278(19):1579-84.
57. Rosenthal GE, Hammar PJ, Way LE, Shipley SA, Doner D, Wojtala B, et al.. Using hospital performance data in quality improvement: the Cleveland Health Quality Choice experience. The Joint Commission journal on quality improvement 1998;24(7):347-60.
58. Hibbard JH, Stockard J, Tusler M. Does publicising hospital performance stimulate quality improvement efforts? Health Affairs 2003;22(2):84-94.
59. Tu JV, Cameron C. Impact of an acute myocardial infarction report card in Ontario, Canada. International Journal for Quality in Health Care 2003;15(2):131-37.
60. Luce JM, Thiel GD, Holland MR, Swig L, Currin SA, Luft HS. Use of risk-adjusted outcome data for quality improvement by public hospitals. Western Journal of Medicine 1996;164(5):410-14.
61. Rainwater JA, Romano PS, Antonius DM. The California Hospital Outcomes Project: how useful is California's report card for quality improvement? The Joint Commission journal on quality improvement 1998;24(1):31-39.
62. Mannion R, Davies H, Marshall M. Impact of star performance ratings in English acute hospital trusts. Journal of Health Services Research and Policy 2005;10(1):18-24.

91
63. Hannan EL, Kilburn Jr H, Racz M, Shields E, Chassin MR. Improving the outcomes of coronary artery bypass surgery in New York State. Journal of the American Medical Association 1994;271(10):761-66.
64. Ghali WA, Ash AS, Hall RE, Moskowitz MA. State-wide quality improvement initiatives and mortality after cardiac surgery. Journal of the American Medical Association 1997;277(5):379-82.
65. Peterson ED, Delong ER, Jollis JG, Muhlbaier LH, Mark DB. The effects of New York's bypass surgery provider profiling on access to care and patient outcomes in the elderly. Journal of the American College of Cardiology 1998;32(4):993-99.
66. Moscucci M, Eagle KA, Share D, Smith D, De Franco AC, O'Donnell M, et al.. Public reporting and case selection for percutaneous coronary interventions: An analysis from two large multicenter percutaneous coronary intervention databases. Journal of the American College of Cardiology 2005;45(11):1759-65.
67. Rosenthal GE, Quinn L, Harper DL. Declines in Hospital Mortality Associated with a Regional Initiative to Measure Hospital Performance. American Journal of Medical Quality 1997;12(2):103-11.
68. Clough JD, Engler D, Snow R, Canuto PE. Lack of relationship between the Cleveland Health Quality Choice project and decreased inpatient mortality in Cleveland. American Journal of Medical Quality 2002;17(2):47-55.
69. Baker DW, Einstadter D, Thomas CL, Husak SS, Gordon NH, Cebul RD. Mortality trends during a program that publicly reported hospital performance. Medical Care 2002;40(10):879-90.
70. Guru V, Fremes SE, Naylor CD, Austin PC, Shrive FM, Ghali WA, et al.. Public versus private institutional performance reporting: What is mandatory for quality improvement? American Heart Journal 2006;152(3):573-78.
71. Li Z, Carlisle DM, Marcin JP, Castellanos LR, Romano PS, Young JN, et al.. Impact of Public Reporting on Access to Coronary Artery Bypass Surgery: The California Outcomes Reporting Program. Annals of Thoracic Surgery 2010;89(4):1131-38.
72. Sullivan HG, Cogbill TH, Fischer GG, Hoppe CM, Lambert PJ, Mathiason MA, et al.. An institutional approach to maintenance of excellent outcomes for carotid endarterectomy in a setting with moderate-to-low procedure volume. J Am Coll Surg 2006;203(5):634-41.
73. Hollenbeak CS, Gorton CP, Tabak YP, Jones JL, Milstein A, Johannes RS. Reductions in mortality associated with intensive public reporting of hospital outcomes. American Journal of Medical Quality 2008;23(4):279-86.
74. Levy FH, Henion JS, Harris 2nd JM. Journey toward meaningful pediatric quality metric reporting: the Texas experience. Journal for healthcare quality : official publication of the National Association for Healthcare Quality 2008;30(3).
75. Lindenauer PK, Remus D, Roman S, Rothberg MB, Benjamin EM, Ma A, et al.. Public reporting and pay for performance in hospital quality improvement. New England Journal of Medicine 2007;356(5):486-96.
76. Kritchevsky SB, Braun BI, Bush AJ, Bozikis MR, Kusek L, Burke JP, et al.. The effect of a quality improvement collaborative to improve antimicrobial prophylaxis in surgical patients a randomised trial. Annals of Internal Medicine 2008;149(7):472-80.
77. Mukamel DB, Weimer DL, Spector WD, Ladd H, Zinn JS. Publication of quality report cards and trends in reported quality measures in nursing homes. Health Services Research 2008;43(4):1244-62.
78. Werner RM, Konetzka RT, Kruse GB. Impact of public reporting on unreported quality of care. Health Services Research 2009;44(2P1):379-98.
79. Werner RM, Konetzka RT, Stuart EA, Norton EC, Polsky D, Park J. Impact of public reporting on quality of postacute care. Health Services Research 2009;44(4):1169-87.
80. Jha AK, Orav EJ, Epstein AM. Public reporting of discharge planning and rates of readmissions. New England Journal of Medicine 2009;361(27):2637-45.

92
81. Omoigui NA, Miller DP, Brown KJ, Annan K, Cosgrove Iii D, Lytle B, et al.. Outmigration for coronary bypass surgery in an era of public dissemination of clinical outcomes. Circulation 1996;93(1):27-33.
82. Dranove D, Kessler D, McClellan M, Satterthwaite M. Is more information better? The effects of "Report Cards" on health care providers. Journal of Political Economy 2003;111(3):555-88.
83. Khan OAI, Srikanth; Pontefract, David; Rogers, Vanessa; Ohri, Sunil K. Impact of surgeon-specific data reporting on surgical trianing. Ann R Coll Surg Engl 2007;89(796-798).
84. Drake DE, Cohen A, Cohn J. National hospital antibiotic timing measures for pneumonia and antibiotic overuse. Quality Management in Health Care 2007;16(2):113-22.
85. Friedberg MW, Mehrotra A, Linder JA. Reporting hospitals' antibiotic timing in pneumonia: adverse consequences for patients? American Journal of Managed Care 2009;15(2):137-44.
86. Mukamel DB, Ladd H, Weimer DL, Spector WD, Zinn JS. Is there evidence of cream skimming among nursing homes following the publication of the nursing home compare report card? Gerontologist 2009;49(6):793-802.
87. Hannan EL, Siu AL, Kumar D, Kilburn Jr H, Chassin MR. The decline in coronary artery bypass graft surgery mortality in New York State: The role of surgeon volume. Journal of the American Medical Association 1995;273(3):209-13.
88. Mukamel DB, Weimer DL, Zwanziger J, Gorthy SFH, Mushlin AI. Quality report cards, selection of cardiac surgeons, and racial disparities: A study of the publication of the New York State Cardiac Surgery Reports. Inquiry 2004;41(4):435-46.
89. Mukamel DB, Peterson DR, Bajorska A, Temkin-Greener H, Kunitz S, Gross D, et al.. Variations in risk-adjusted outcomes in a managed acute/long-term care program for frail elderly individuals. International Journal for Quality in Health Care 2004;16(4):293-301.
90. Mukamel DB, Weimer DL, Zwanziger J, Mushlin AI. Quality of cardiac surgeons and managed care contracting practices. Health Services Research 2002;37(5):1129-44.
91. Schneider EC, Epstein AM. Influence of cardiac-surgery performance reports on referral practices and access to care: A survey of cardiovascular specialists. New England Journal of Medicine 1996;335(4):251-56.
92. Burack JH, Impellizzeri P, Homel P, Cunningham Jr JN. Public reporting of surgical mortality: A survey of New York state cardiothoracic surgeons. Annals of Thoracic Surgery 1999;68(4):1195-202.
93. Narins CR, Dozier AM, Ling FS, Zareba W. The influence of public reporting of outcome data on medical decision making by physicians. Archives of Internal Medicine 2005;165(1):83-87.
94. Werner RM, Asch DA, Polsky D. Racial profiling: The unintended consequences of coronary artery bypass graft report cards. Circulation 2005;111(10):1257-63.
95. Casalino LP, Alexander GC, Jin L, Konetzka RT. General internists' views on pay-for-performance and public reporting of quality scores: A national survey. Health Affairs 2007;26(2):492-99.
96. Marshall MN, Romano PS, Davies HTO. How do we maximise the impact of the public reporting of quality of care? International Journal for Quality in Health Care 2004;16(SUPPL. 1).
97. Faber M, Bosch M, Wollersheim H, Leatherman S, Grol R. Public reporting in health care: How do consumers use quality-of-care information? A systematic review. Medical Care 2009;47(1):1-8.
98. High Quality Care for All: NHS Next Stage Review Final Report. Department of Health, 2008.