Embed Size (px)
DESCRIPTION
Citation preview

The Technology Authority
CONFIDENTIAL
Public SaaS Company Performance: Winners, Losers & Lessons Learned
2
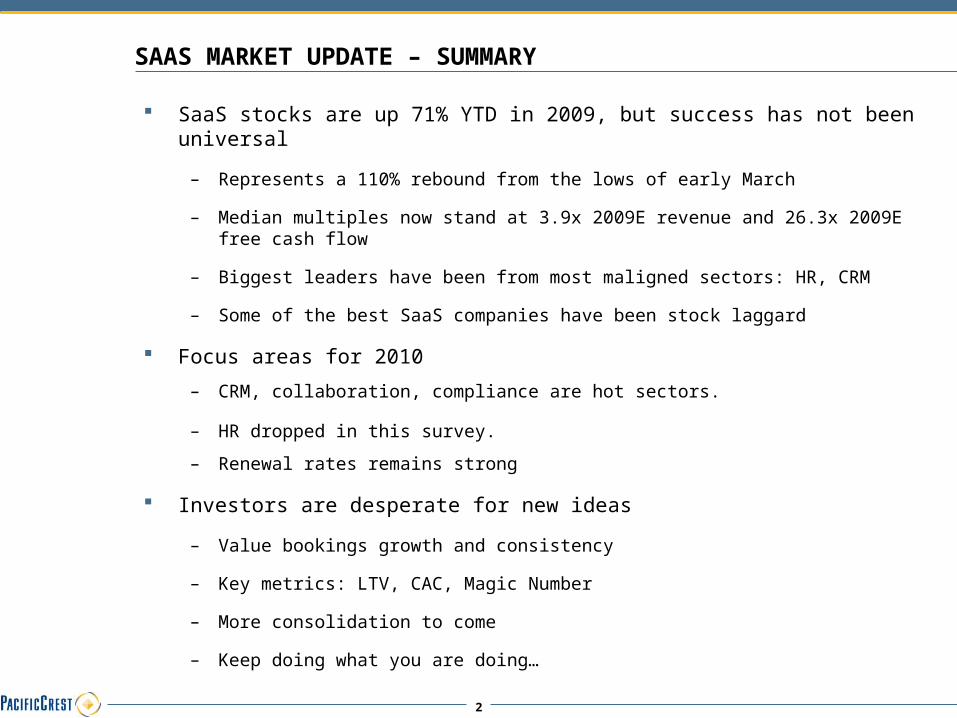
SAAS MARKET UPDATE – SUMMARY
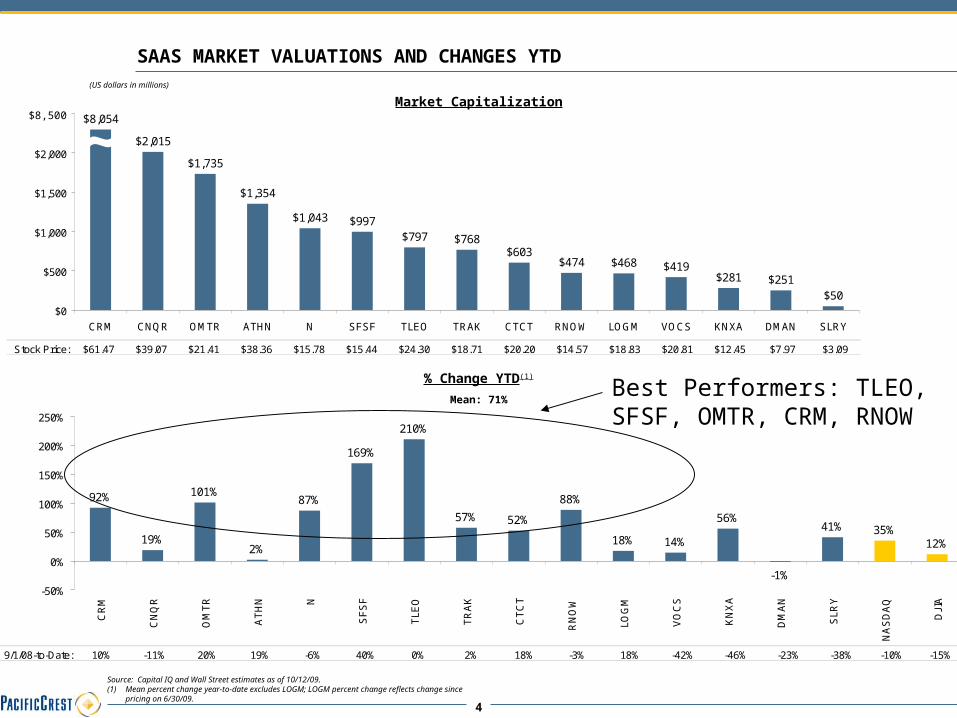
SaaS stocks are up 71% YTD in 2009, but success has not been universal
– Represents a 110% rebound from the lows of early March
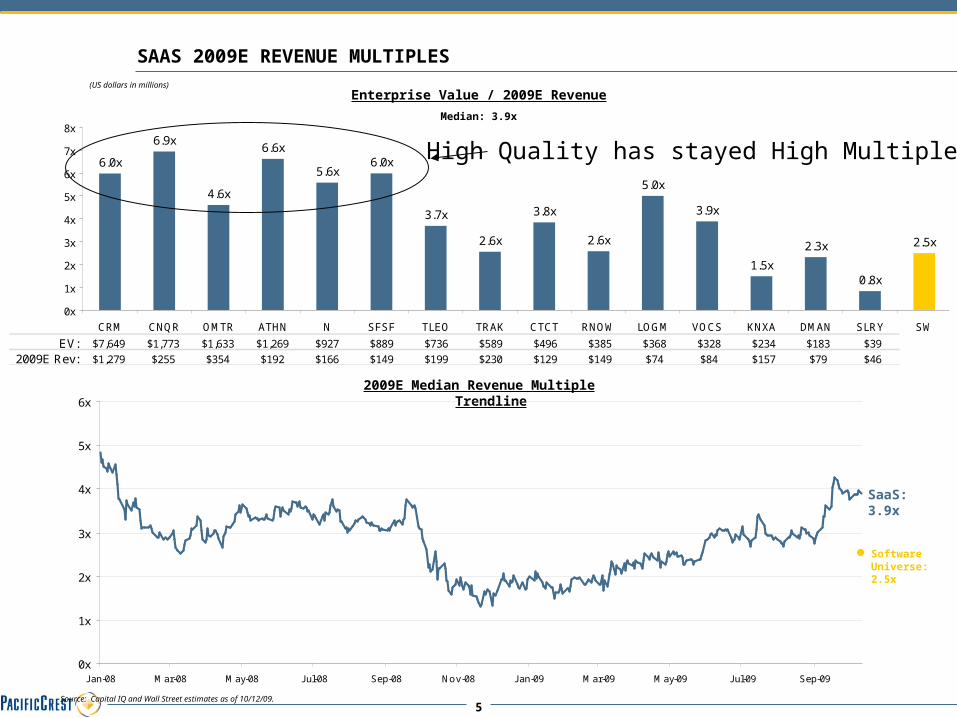
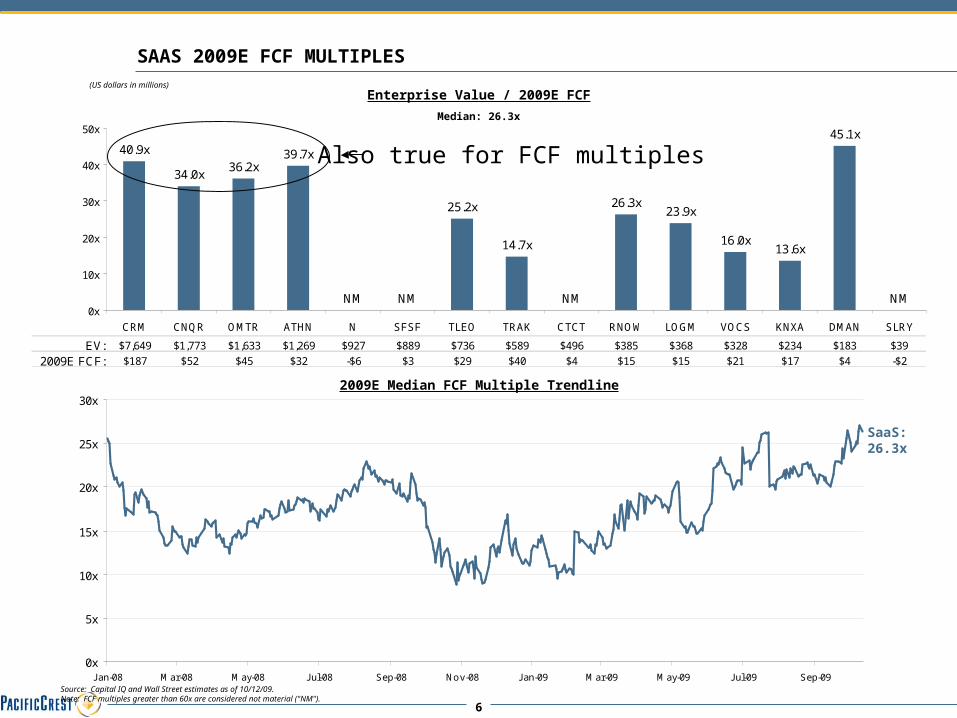
– Median multiples now stand at 3.9x 2009E revenue and 26.3x 2009E free cash flow
– Biggest leaders have been from most maligned sectors: HR, CRM
– Some of the best SaaS companies have been stock laggard
Focus areas for 2010
– CRM, collaboration, compliance are hot sectors.
– HR dropped in this survey.
– Renewal rates remains strong
Investors are desperate for new ideas
– Value bookings growth and consistency
– Key metrics: LTV, CAC, Magic Number
– More consolidation to come
– Keep doing what you are doing…
3
30
40
50
60
70
80
90
100
110
J an-08 Mar-08 May-08 J ul-08 Sep-08 Nov-08 J an-09 Mar-09 May-09 J ul-09 Sep-09
SaaS Index (Equal Weights) SaaS Index (Market Cap Weighted) DJIA NASDAQ
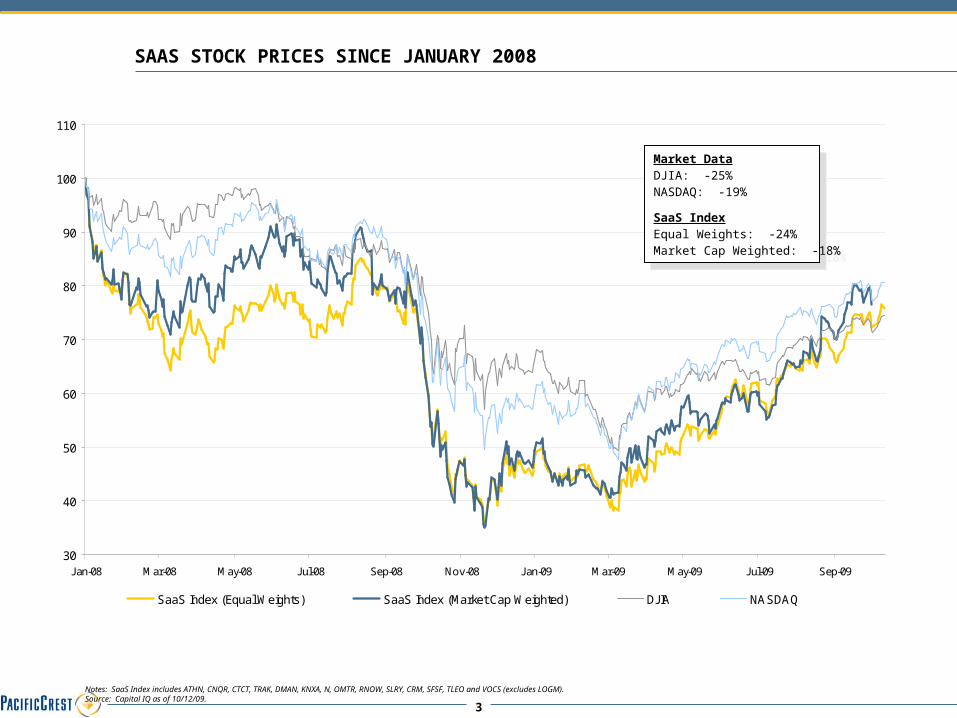
SAAS STOCK PRICES SINCE JANUARY 2008
Notes: SaaS Index includes ATHN, CNQR, CTCT, TRAK, DMAN, KNXA, N, OMTR, RNOW, SLRY, CRM, SFSF, TLEO and VOCS (excludes LOGM).Source: Capital IQ as of 10/12/09.
Market DataDJIA: -25%NASDAQ: -19%
SaaS Index Equal Weights: -24%Market Cap Weighted: -18%
Market DataDJIA: -25%NASDAQ: -19%
SaaS Index Equal Weights: -24%Market Cap Weighted: -18%
4
Stock Price: $61.47 $39.07 $21.41 $38.36 $15.78 $15.44 $24.30 $18.71 $20.20 $14.57 $18.83 $20.81 $12.45 $7.97 $3.09
$2,015
$1,735
$1,354
$1,043 $997$797 $768
$603$474 $468 $419
$281 $251$50
$8,054
$0
$500
$1,000
$1,500
$2,000
$2,500
CRM CNQR OMTR ATHN N SFSF TLEO TRAK CTCT RNOW LOGM VOCS KNXA DMAN SLRY
$8,500
% Change YTD(1)
SAAS MARKET VALUATIONS AND CHANGES YTD
Mean: 71%
Market Capitalization
(US dollars in millions)
Source: Capital IQ and Wall Street estimates as of 10/12/09.(1) Mean percent change year-to-date excludes LOGM; LOGM percent change reflects change since
pricing on 6/30/09.
9/1/08-to-Date: 10% -11% 20% 19% -6% 40% 0% 2% 18% -3% 18% -42% -46% -23% -38% -10% -15%
92%
19%
101%
2%
87%
169%
210%
57% 52%
88%
18% 14%
56%
-1%
41% 35%12%
-50%
0%
50%
100%
150%
200%
250%
CR
M
CN
QR
OM
TR
AT
HN N
SF
SF
TLE
O
TR
AK
CT
CT
RN
OW
LOG
M
VO
CS
KN
XA
DM
AN
SLR
Y
NA
SD
AQ
DJI
A
Best Performers: TLEO, SFSF, OMTR, CRM, RNOW
5
SAAS 2009E REVENUE MULTIPLES
Median: 3.9x
(US dollars in millions)
Enterprise Value / 2009E Revenue
2009E Median Revenue Multiple Trendline
Source: Capital IQ and Wall Street estimates as of 10/12/09.
SaaS: 3.9x
Software Universe: 2.5x
0x
1x
2x
3x
4x
5x
6x
J an-08 Mar-08 May-08 J ul-08 Sep-08 Nov-08 J an-09 Mar-09 May-09 J ul-09 Sep-09
EV: $7,649 $1,773 $1,633 $1,269 $927 $889 $736 $589 $496 $385 $368 $328 $234 $183 $39
2009E Rev: $1,279 $255 $354 $192 $166 $149 $199 $230 $129 $149 $74 $84 $157 $79 $46
6.0x
6.9x
4.6x
6.6x
5.6x6.0x
3.7x
2.6x
3.8x
2.6x
5.0x
3.9x
1.5x
2.3x
0.8x
2.5x
0x
1x
2x
3x
4x
5x
6x
7x
8x
CRM CNQR OMTR ATHN N SFSF TLEO TRAK CTCT RNOW LOGM VOCS KNXA DMAN SLRY SW
High Quality has stayed High Multiple
6
SAAS 2009E FCF MULTIPLES
Median: 26.3x
(US dollars in millions)
Enterprise Value / 2009E FCF
2009E Median FCF Multiple Trendline
Source: Capital IQ and Wall Street estimates as of 10/12/09.Note: FCF multiples greater than 60x are considered not material ("NM").
SaaS: 26.3x
0x
5x
10x
15x
20x
25x
30x
J an-08 Mar-08 May-08 J ul-08 Sep-08 Nov-08 J an-09 Mar-09 May-09 J ul-09 Sep-09
EV: $7,649 $1,773 $1,633 $1,269 $927 $889 $736 $589 $496 $385 $368 $328 $234 $183 $39
2009E FCF: $187 $52 $45 $32 -$6 $3 $29 $40 $4 $15 $15 $21 $17 $4 -$2
40.9x
34.0x36.2x
39.7x
NM NM
25.2x
14.7x
NM
26.3x23.9x
16.0x13.6x
45.1x
NM0x
10x
20x
30x
40x
50x
CRM CNQR OMTR ATHN N SFSF TLEO TRAK CTCT RNOW LOGM VOCS KNXA DMAN SLRY
Also true for FCF multiples
7
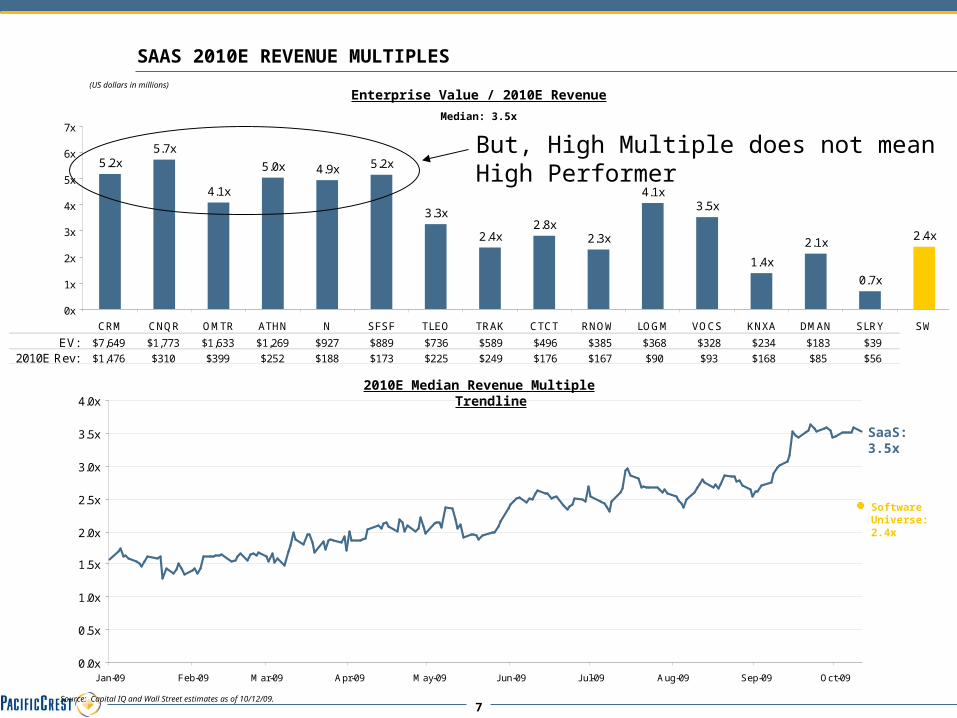
SAAS 2010E REVENUE MULTIPLES
Median: 3.5x
(US dollars in millions)
Enterprise Value / 2010E Revenue
2010E Median Revenue Multiple Trendline
Source: Capital IQ and Wall Street estimates as of 10/12/09.
SaaS: 3.5x
Software Universe: 2.4x
0.0x
0.5x
1.0x
1.5x
2.0x
2.5x
3.0x
3.5x
4.0x
J an-09 Feb-09 Mar-09 Apr-09 May-09 J un-09 J ul-09 Aug-09 Sep-09 Oct-09
EV: $7,649 $1,773 $1,633 $1,269 $927 $889 $736 $589 $496 $385 $368 $328 $234 $183 $39
2010E Rev: $1,476 $310 $399 $252 $188 $173 $225 $249 $176 $167 $90 $93 $168 $85 $56
5.2x5.7x
4.1x
5.0x 4.9x 5.2x
3.3x
2.4x2.8x
2.3x
4.1x3.5x
1.4x
2.1x
0.7x
2.4x
0x
1x
2x
3x
4x
5x
6x
7x
CRM CNQR OMTR ATHN N SFSF TLEO TRAK CTCT RNOW LOGM VOCS KNXA DMAN SLRY SW
But, High Multiple does not mean High Performer
8
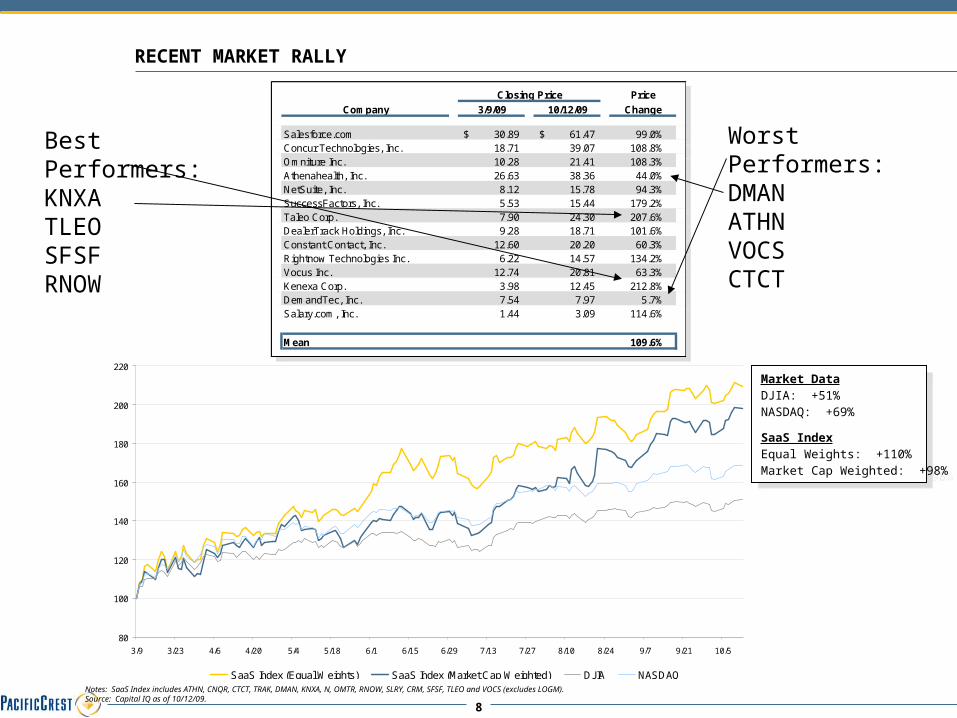
RECENT MARKET RALLY
Notes: SaaS Index includes ATHN, CNQR, CTCT, TRAK, DMAN, KNXA, N, OMTR, RNOW, SLRY, CRM, SFSF, TLEO and VOCS (excludes LOGM).Source: Capital IQ as of 10/12/09.
Market DataDJIA: +51%NASDAQ: +69%
SaaS Index Equal Weights: +110%Market Cap Weighted: +98%
Market DataDJIA: +51%NASDAQ: +69%
SaaS Index Equal Weights: +110%Market Cap Weighted: +98%
80
100
120
140
160
180
200
220
3/9 3/23 4/6 4/20 5/4 5/18 6/1 6/15 6/29 7/13 7/27 8/10 8/24 9/7 9/21 10/5
SaaS Index (Equal Weights) SaaS Index (Market Cap Weighted) DJIA NASDAQ
Closing Price Price
Company 3/9/09 10/12/09 Change
Salesforce.com 30.89$ 61.47$ 99.0%Concur Technologies, Inc. 18.71 39.07 108.8%Omniture Inc. 10.28 21.41 108.3%Athenahealth, Inc. 26.63 38.36 44.0%NetSuite, Inc. 8.12 15.78 94.3%SuccessFactors, Inc. 5.53 15.44 179.2%Taleo Corp. 7.90 24.30 207.6%DealerTrack Holdings, Inc. 9.28 18.71 101.6%Constant Contact, Inc. 12.60 20.20 60.3%Rightnow Technologies Inc. 6.22 14.57 134.2%Vocus Inc. 12.74 20.81 63.3%Kenexa Corp. 3.98 12.45 212.8%DemandTec, Inc. 7.54 7.97 5.7%Salary.com, Inc. 1.44 3.09 114.6%
Mean 109.6%
Best Performers:KNXATLEOSFSFRNOW
Worst Performers:DMANATHNVOCS CTCT
9
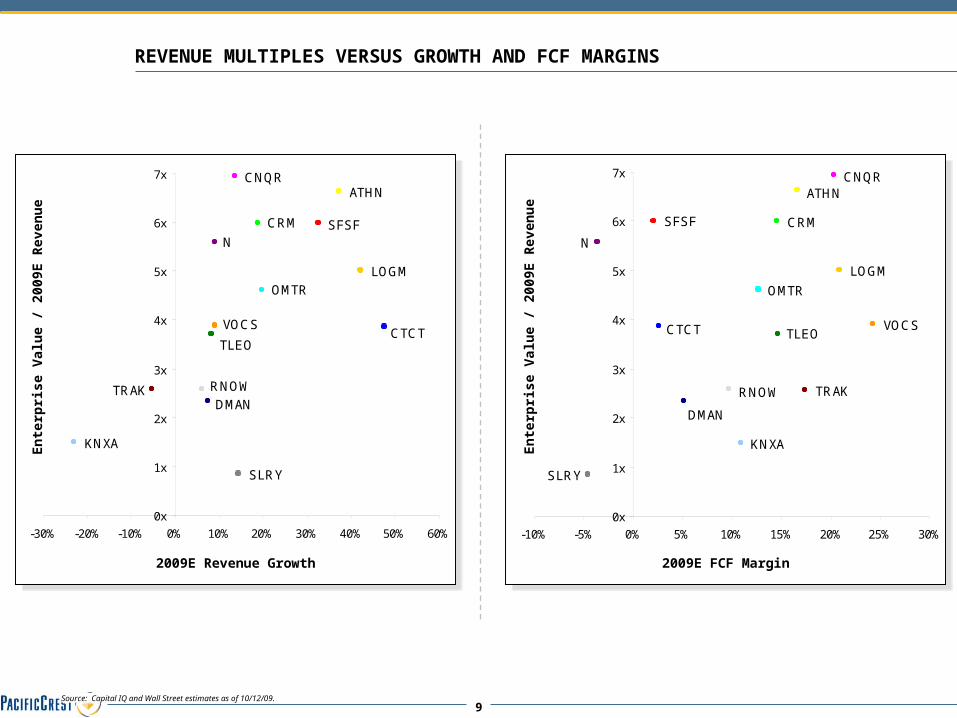
REVENUE MULTIPLES VERSUS GROWTH AND FCF MARGINSE
nte
rpri
se V
alu
e / 2
009E
Rev
enu
e
2009E Revenue Growth
En
terp
rise
Val
ue
/ 200
9E R
even
ue
2009E FCF Margin
Source: Capital IQ and Wall Street estimates as of 10/12/09.
ATHN
KNXA
LOGM
CRM
CNQR
OMTR
N
TRAK
SFSF
CTCTVOCS
RNOW
DMAN
TLEO
SLRY
0x
1x
2x
3x
4x
5x
6x
7x
-30% -20% -10% 0% 10% 20% 30% 40% 50% 60%
LOGM
CRM
CNQRATHN
OMTR
N
TRAK
SFSF
CTCT VOCS
RNOW
DMAN
TLEO
KNXA
SLRY
0x
1x
2x
3x
4x
5x
6x
7x
-10% -5% 0% 5% 10% 15% 20% 25% 30%
10
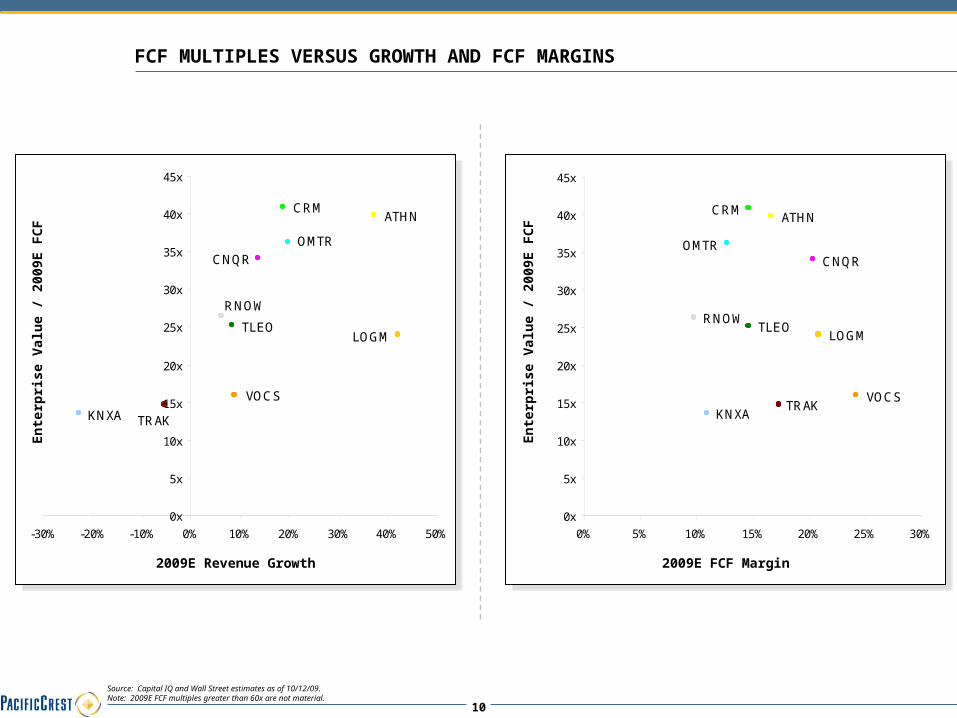
FCF MULTIPLES VERSUS GROWTH AND FCF MARGINSE
nte
rpri
se V
alu
e / 2
009E
FC
F
2009E Revenue Growth
En
terp
rise
Val
ue
/ 200
9E F
CF
2009E FCF Margin
Source: Capital IQ and Wall Street estimates as of 10/12/09.Note: 2009E FCF multiples greater than 60x are not material.
ATHN
LOGM
CRM
CNQROMTR
VOCS
RNOWTLEO
KNXATRAK
0x
5x
10x
15x
20x
25x
30x
35x
40x
45x
0% 5% 10% 15% 20% 25% 30%
ATHNCRM
CNQR
OMTR
VOCS
RNOW
TLEO
KNXA TRAK
LOGM
0x
5x
10x
15x
20x
25x
30x
35x
40x
45x
-30% -20% -10% 0% 10% 20% 30% 40% 50%
11
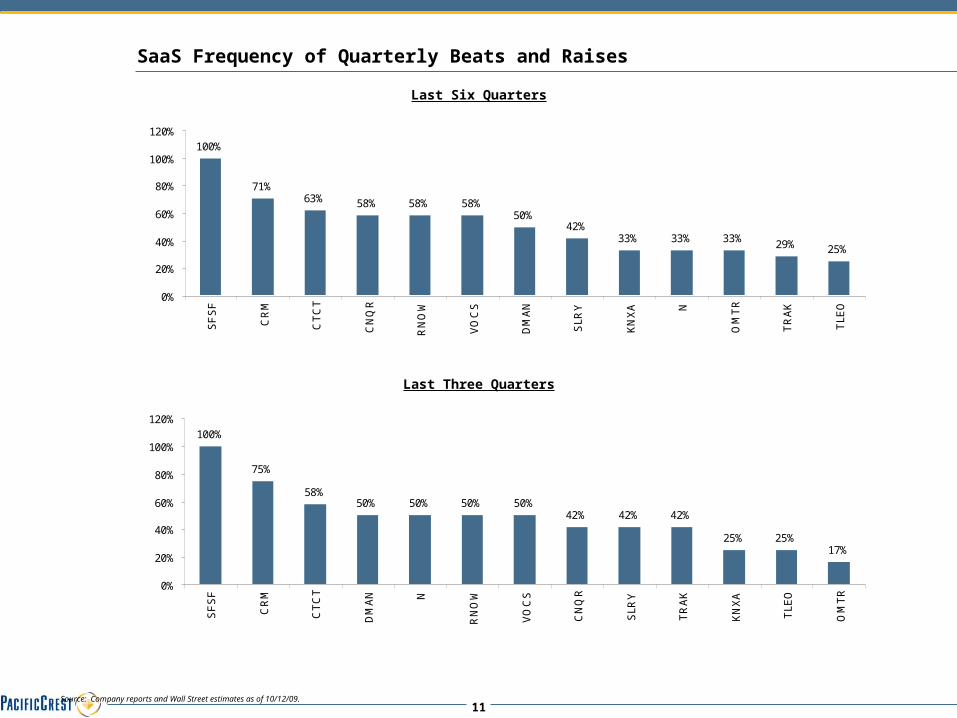
SaaS Frequency of Quarterly Beats and Raises
Source: Company reports and Wall Street estimates as of 10/12/09.
Last Six Quarters
Last Three Quarters
100%
71%63% 58% 58% 58%
50%42%
33% 33% 33% 29% 25%
0%
20%
40%
60%
80%
100%
120%
SF
SF
CR
M
CT
CT
CN
QR
RN
OW
VO
CS
DM
AN
SLR
Y
KN
XA N
OM
TR
TR
AK
TLE
O
100%
75%
58%50% 50% 50% 50%
42% 42% 42%
25% 25%17%
0%
20%
40%
60%
80%
100%
120%
SF
SF
CR
M
CT
CT
DM
AN N
RN
OW
VO
CS
CN
QR
SLR
Y
TR
AK
KN
XA
TLE
O
OM
TR
12
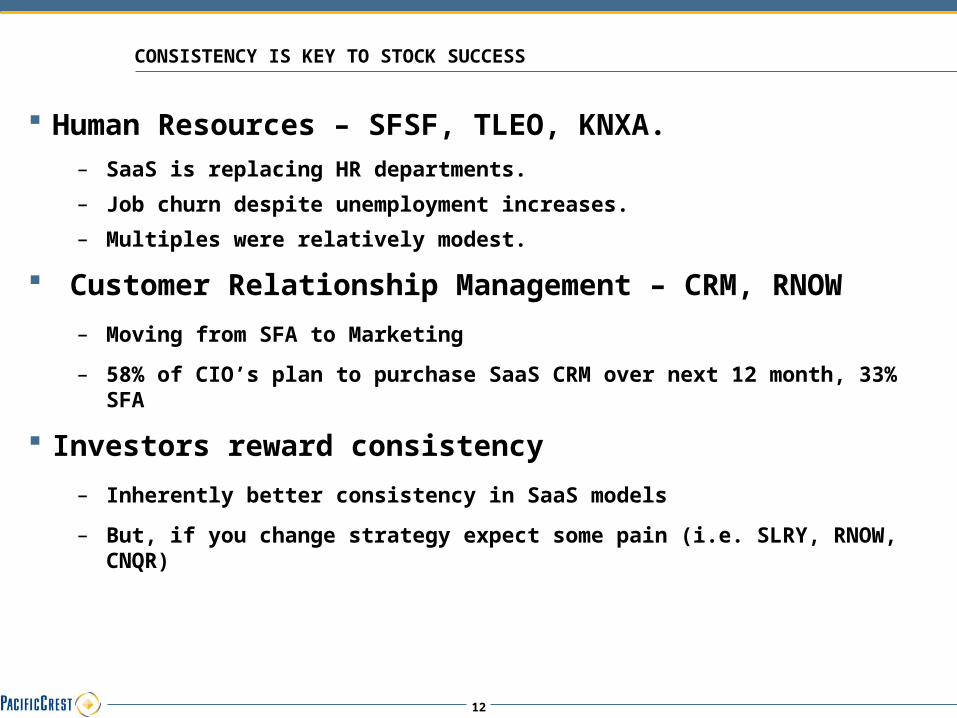
CONSISTENCY IS KEY TO STOCK SUCCESS
Human Resources – SFSF, TLEO, KNXA.– SaaS is replacing HR departments.
– Job churn despite unemployment increases.
– Multiples were relatively modest.
Customer Relationship Management – CRM, RNOW
– Moving from SFA to Marketing
– 58% of CIO’s plan to purchase SaaS CRM over next 12 month, 33% SFA
Investors reward consistency
– Inherently better consistency in SaaS models
– But, if you change strategy expect some pain (i.e. SLRY, RNOW, CNQR)
13
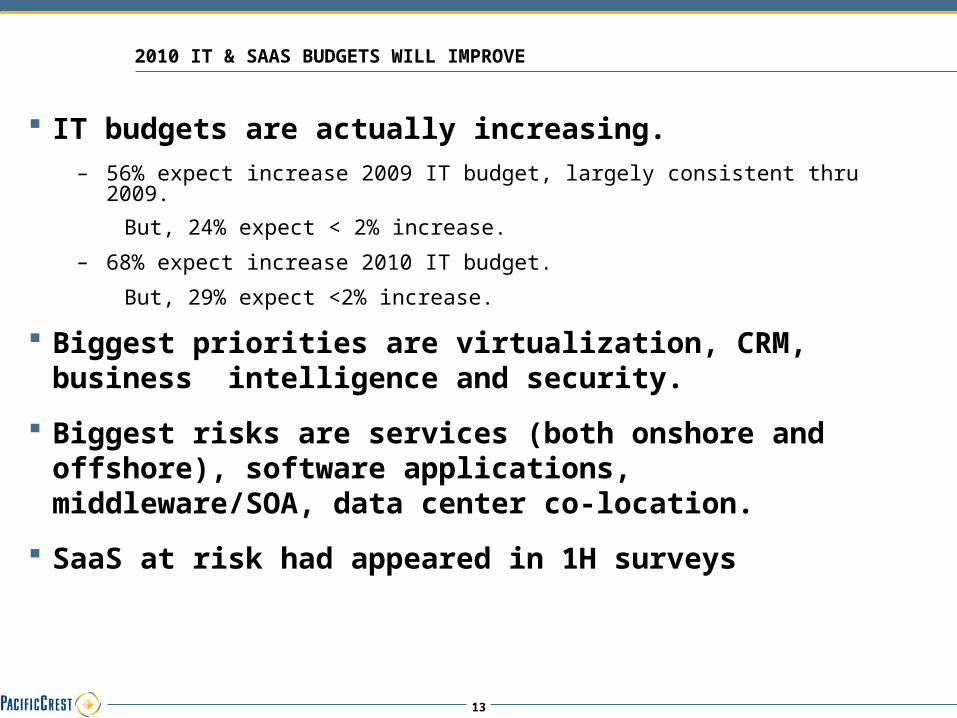
2010 IT & SAAS BUDGETS WILL IMPROVE
IT budgets are actually increasing.– 56% expect increase 2009 IT budget, largely consistent thru 2009.
But, 24% expect < 2% increase.
– 68% expect increase 2010 IT budget.
But, 29% expect <2% increase.
Biggest priorities are virtualization, CRM, business intelligence and security.
Biggest risks are services (both onshore and offshore), software applications, middleware/SOA, data center co-location.
SaaS at risk had appeared in 1H surveys
14
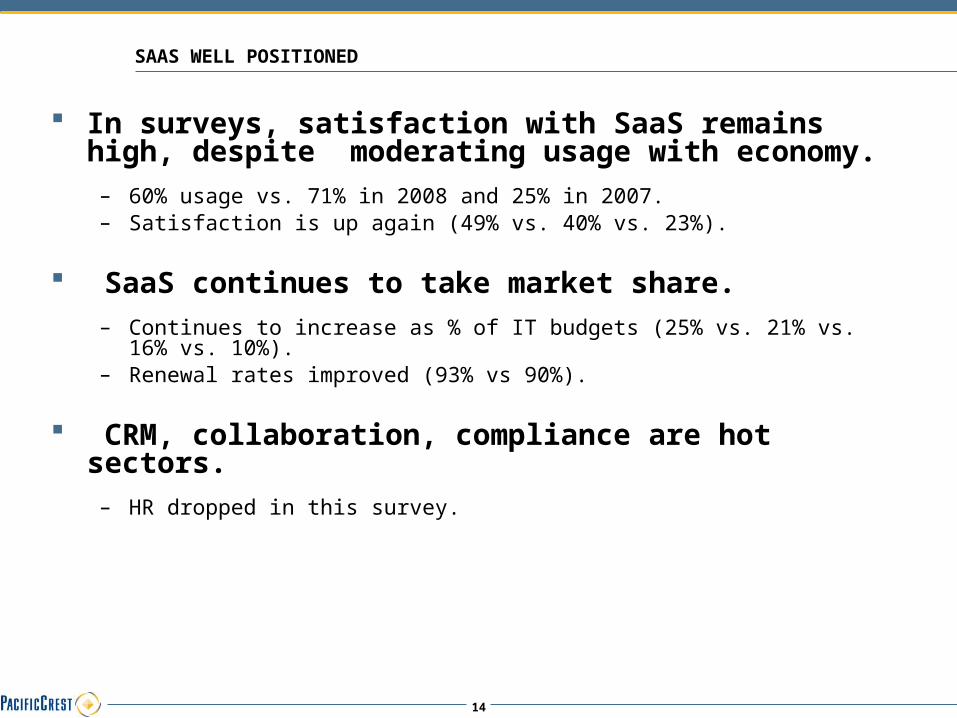
SAAS WELL POSITIONED
In surveys, satisfaction with SaaS remains high, despite moderating usage with economy.
– 60% usage vs. 71% in 2008 and 25% in 2007.– Satisfaction is up again (49% vs. 40% vs. 23%).
SaaS continues to take market share.– Continues to increase as % of IT budgets (25% vs. 21% vs. 16% vs. 10%).– Renewal rates improved (93% vs 90%).
CRM, collaboration, compliance are hot sectors.– HR dropped in this survey.
15
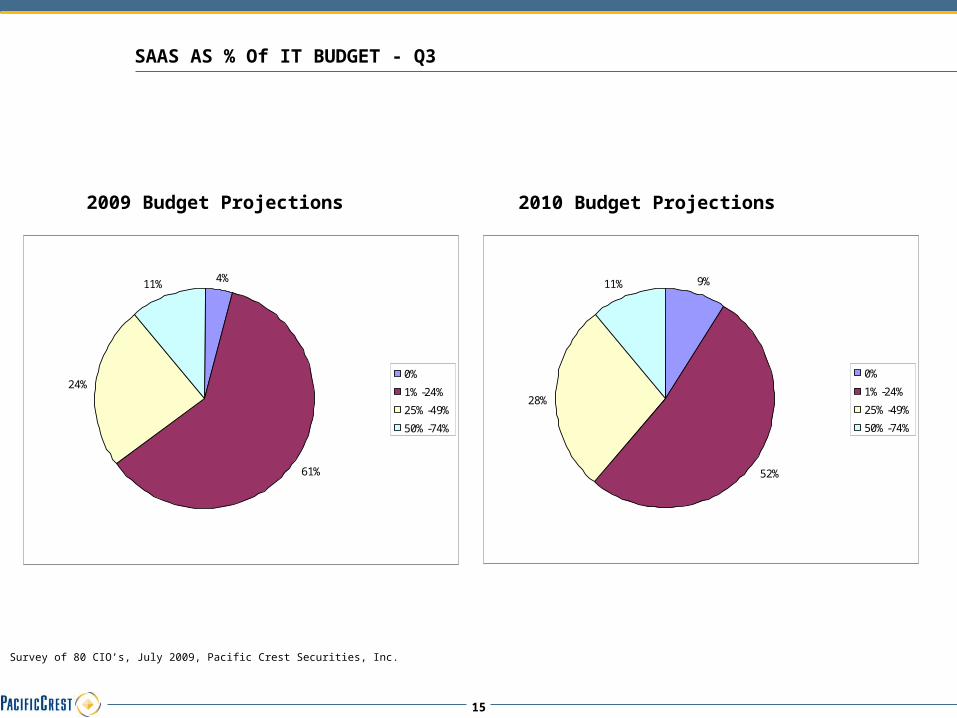
SAAS AS % Of IT BUDGET - Q3
4%
61%
24%
11%
0%
1%-24%
25%-49%
50%-74%
9%
52%
28%
11%
0%
1%-24%
25%-49%
50%-74%
2009 Budget Projections 2010 Budget Projections
Survey of 80 CIO’s, July 2009, Pacific Crest Securities, Inc.
16
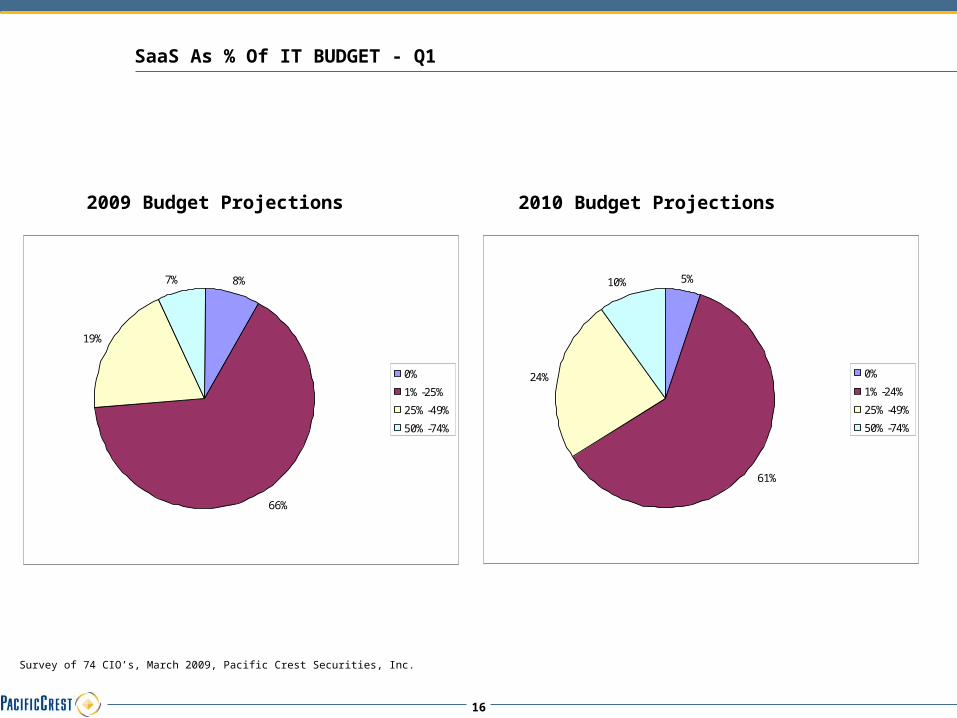
SaaS As % Of IT BUDGET - Q1
2009 Budget Projections 2010 Budget Projections
8%
66%
19%
7%
0%
1%-25%
25%-49%
50%-74%
5%
61%
24%
10%
0%
1%-24%
25%-49%
50%-74%
Survey of 74 CIO’s, March 2009, Pacific Crest Securities, Inc.
17
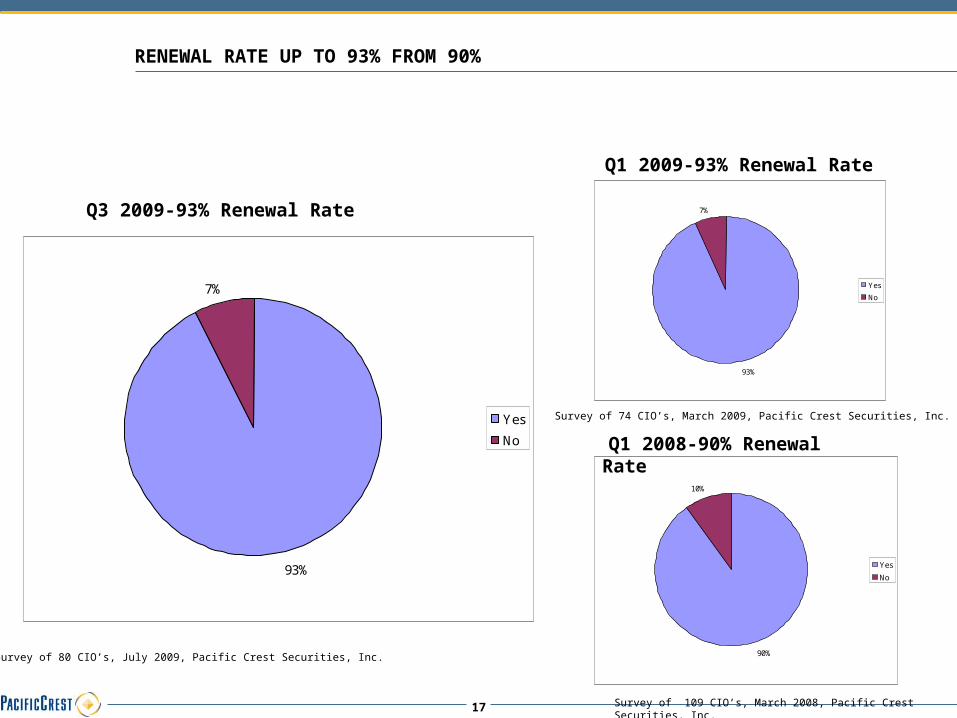
RENEWAL RATE UP TO 93% FROM 90%
93%
7%
Yes
No
93%
7%
Yes
No
90%
10%
Yes
No
Q3 2009-93% Renewal Rate
Q1 2009-93% Renewal Rate
Q1 2008-90% Renewal Rate
Survey of 80 CIO’s, July 2009, Pacific Crest Securities, Inc.
Survey of 74 CIO’s, March 2009, Pacific Crest Securities, Inc.
Survey of 109 CIO’s, March 2008, Pacific Crest Securities, Inc.
18
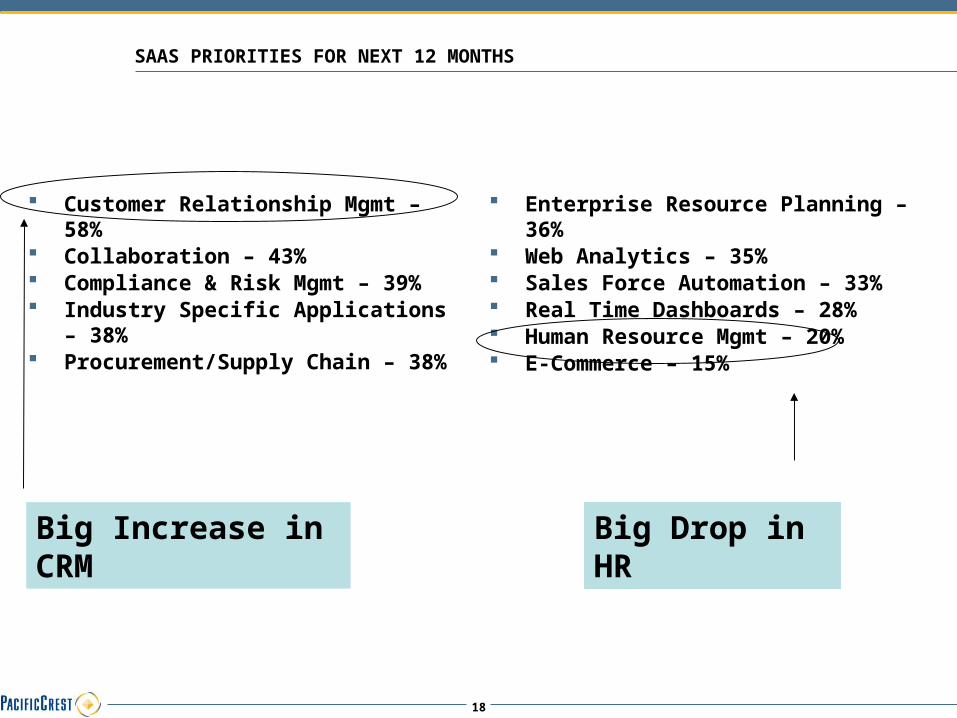
SAAS PRIORITIES FOR NEXT 12 MONTHS
Customer Relationship Mgmt – 58% Collaboration – 43% Compliance & Risk Mgmt – 39% Industry Specific Applications – 38% Procurement/Supply Chain – 38%
Enterprise Resource Planning – 36% Web Analytics – 35% Sales Force Automation – 33% Real Time Dashboards – 28% Human Resource Mgmt – 20% E-Commerce – 15%
Big Increase in CRM
Big Drop in HR
19
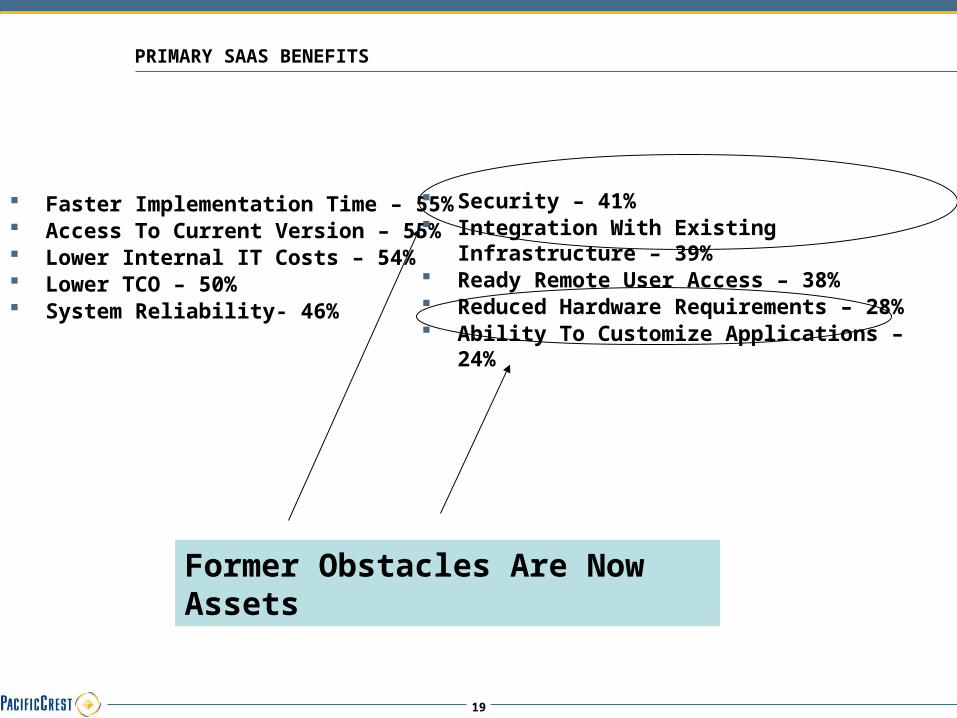
PRIMARY SAAS BENEFITS
Faster Implementation Time – 55% Access To Current Version – 55% Lower Internal IT Costs – 54% Lower TCO – 50% System Reliability- 46%
Security – 41% Integration With Existing Infrastructure – 39% Ready Remote User Access – 38% Reduced Hardware Requirements – 28% Ability To Customize Applications – 24%
Former Obstacles Are Now Assets
20
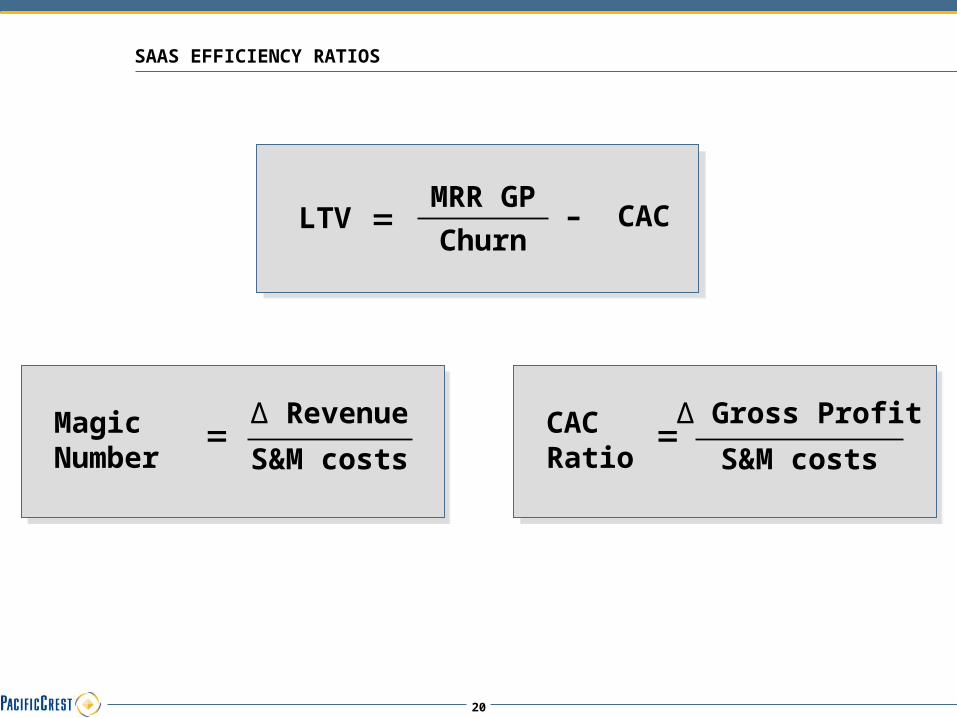
SAAS EFFICIENCY RATIOS
Magic Number
=Δ Revenue
S&M costsCAC Ratio
=Δ Gross Profit
S&M costs
LTV =MRR GP
Churn– CAC
21
($400)
($200)
$0
$200
$400
$600
$800
$1,000
Lif
eti
me
Cu
sto
me
r V
alu
e
Monthly Customer Gross Profit Net Customer Value
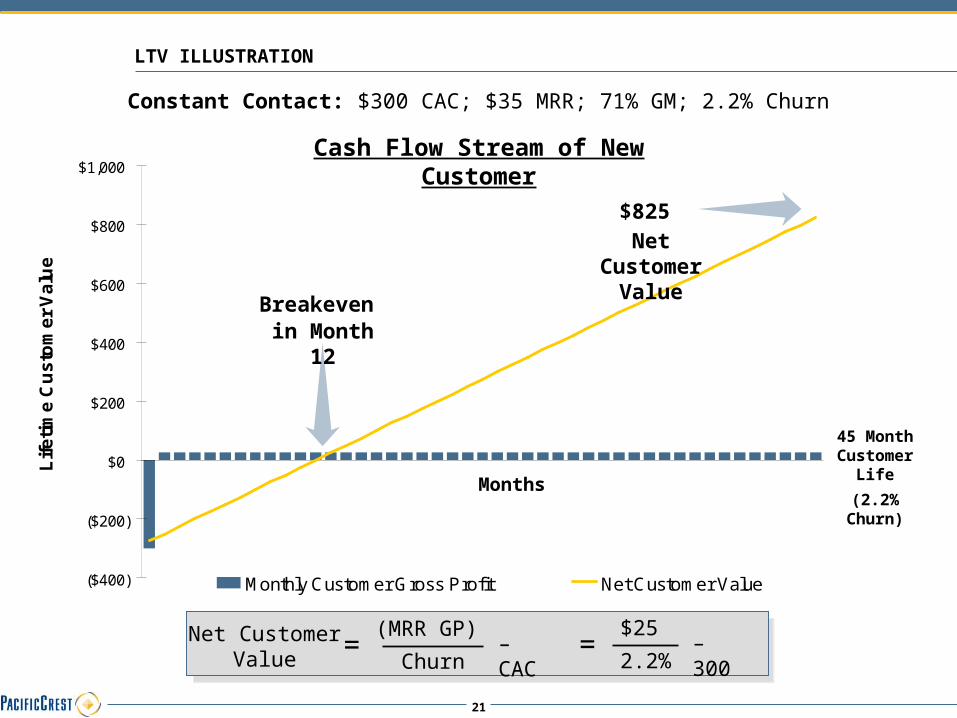
LTV ILLUSTRATION
Breakeven in Month 12
$825 Net Customer
Value
45 Month Customer
Life
(2.2% Churn)
Cash Flow Stream of New Customer
Months
Net Customer Value =
Churn
(MRR GP)
Constant Contact: $300 CAC; $35 MRR; 71% GM; 2.2% Churn
– CAC =2.2%
$25 – 300
22
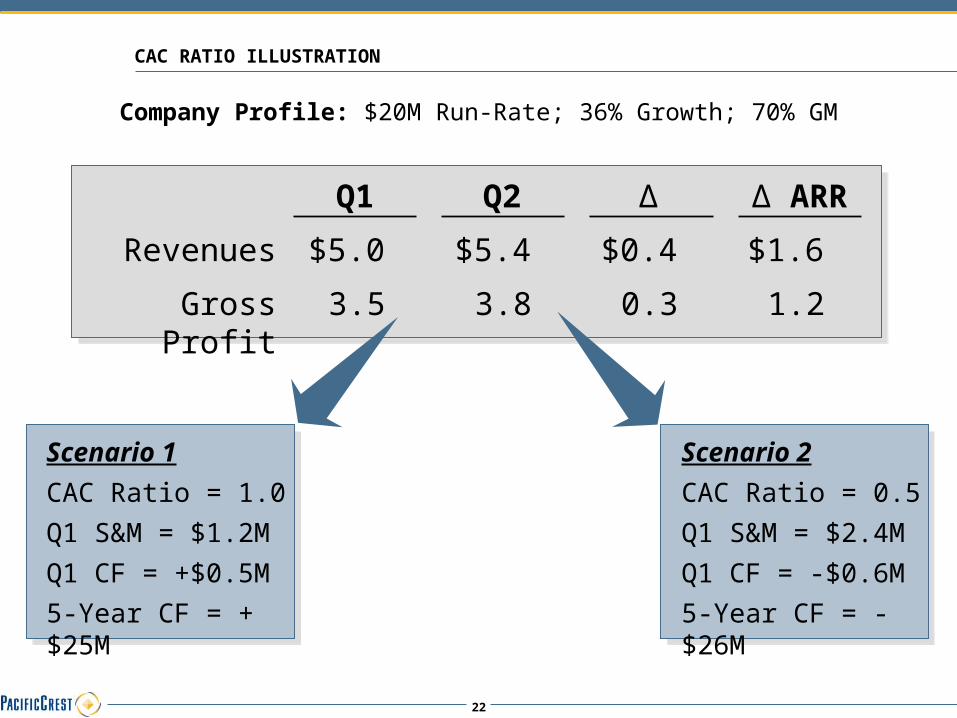
CAC RATIO ILLUSTRATION
Company Profile: $20M Run-Rate; 36% Growth; 70% GM
Q1 Q2 Δ Δ ARR
$5.0 $5.4 $0.4 $1.6
3.5 3.8 0.3 1.2
Revenues
Gross Profit
Scenario 1
CAC Ratio = 1.0
Q1 S&M = $1.2M
Q1 CF = +$0.5M
5-Year CF = +$25M
Scenario 2
CAC Ratio = 0.5
Q1 S&M = $2.4M
Q1 CF = -$0.6M
5-Year CF = -$26M
23
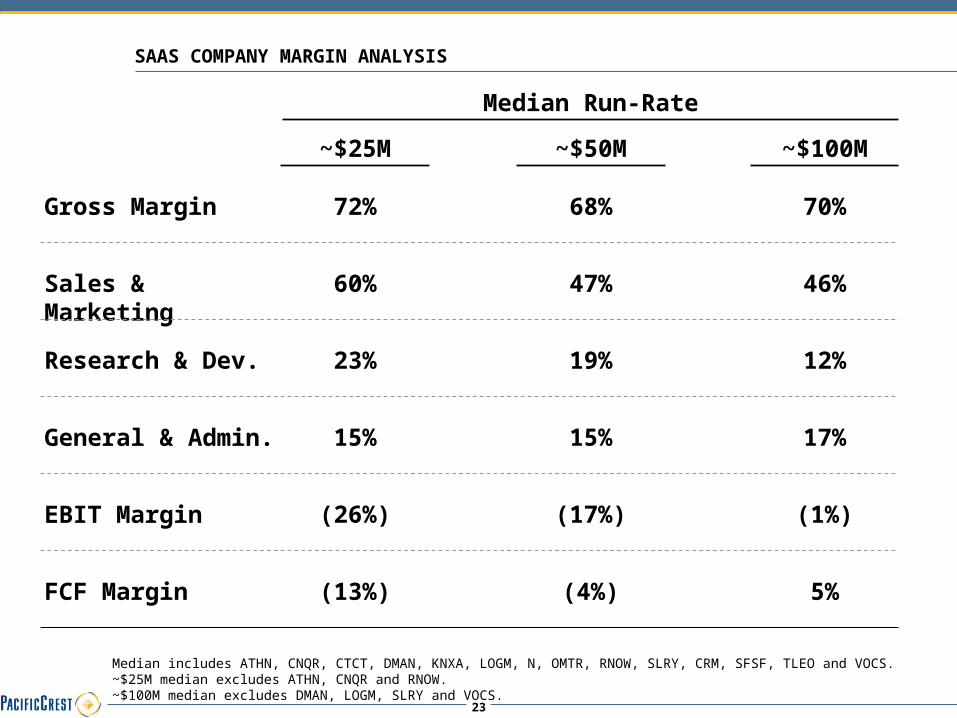
SAAS COMPANY MARGIN ANALYSIS
~$25M ~$50M ~$100M
Median Run-Rate
72%
60%
23%
15%
(26%)
(13%)
Gross Margin
Sales & Marketing
Research & Dev.
EBIT Margin
General & Admin.
FCF Margin
68%
47%
19%
15%
(17%)
(4%)
70%
46%
12%
17%
(1%)
5%
Median includes ATHN, CNQR, CTCT, DMAN, KNXA, LOGM, N, OMTR, RNOW, SLRY, CRM, SFSF, TLEO and VOCS.~$25M median excludes ATHN, CNQR and RNOW.~$100M median excludes DMAN, LOGM, SLRY and VOCS.
24
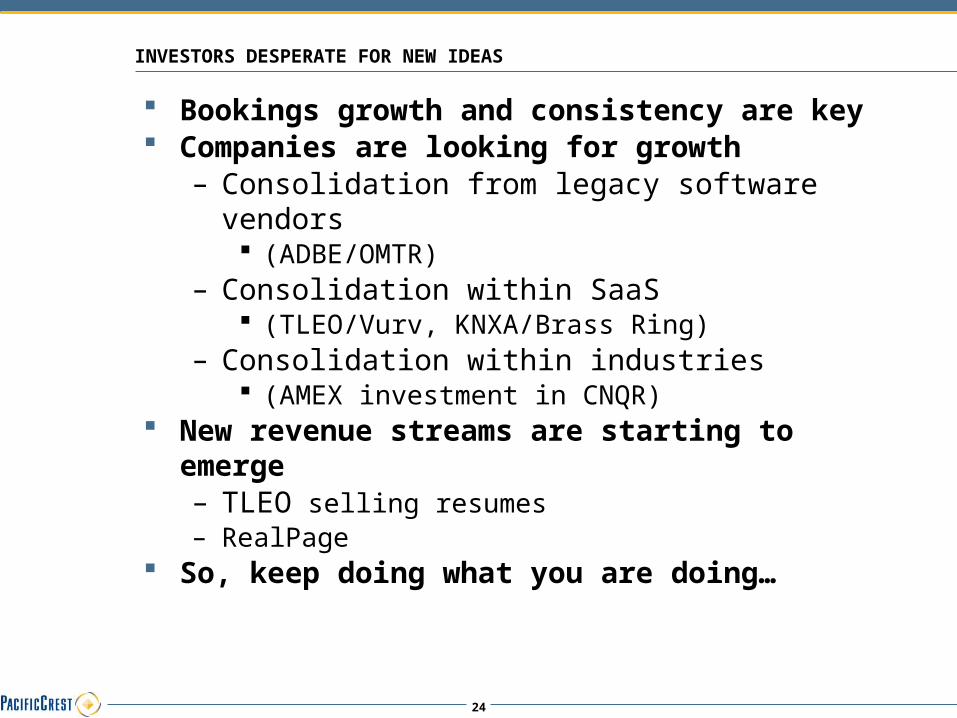
INVESTORS DESPERATE FOR NEW IDEAS
Bookings growth and consistency are key Companies are looking for growth
– Consolidation from legacy software vendors (ADBE/OMTR)
– Consolidation within SaaS (TLEO/Vurv, KNXA/Brass Ring)
– Consolidation within industries (AMEX investment in CNQR)
New revenue streams are starting to emerge– TLEO selling resumes– RealPage
So, keep doing what you are doing…
The Technology Authority
CONFIDENTIAL
Public SaaS Company Performance: Winners, Losers & Lessons Learned