Embed Size (px)
Citation preview

This chapter discusses Public Services and Utilities potentially affected by the HALA Mandatory Housing Affordability (MHA) program. Public services and utilities include: Police Services, Fire and Emergency Medical, Public Schools, Water, Sewer and Drainage and Electricity. Impacts on public parks and recreation are evaluated in Section 3.7 Open Space and Recreation.
Analysis includes comparison of the impacts on public services and utilities associated with growth as a result of the proposed project under the alternatives. Impacts are summarized at the citywide scale, with a focus on the Urban Villages (UVs) and their proposed expansion areas at a neighborhood scale.
3.8.1 AFFECTED ENVIRONMENTThe existing conditions described below are based on the City of Seattle’s 2035 Comprehensive Plan EIS. Public services and utilities that were not analyzed as a part of the Comprehensive Plan but would be affected by the MHA program were identified and added to this analysis.
The City of Seattle is currently experiencing a construction boom, with over 17,000 housing units in the permitting pipeline or under construction as of December 2016. As a result, there is an associated increase in population and use of public services and utilities.
PUBLIC SERVICES
Police Services
The City of Seattle Police Department serves five precincts within the city’s jurisdictional boundary: north, west, east, south and southwest. Urban villages within each precinct are as follows:
3.8 PUBLIC SERVICES AND UTILITIES.
What’s changed since the DEIS?New information and other corrections and
revisions since issuance of the DEIS are described in cross-out (for deleted text)
and underline (for new text) format. Entirely new sections or exhibits may be identified by a sidebar callout instead of underline.

MHA Final EISNov. 2017
3.360
• North Precinct: University District, Northgate, Ballard, Bitter Lake, Fremont, Lake City, Aurora-Licton Springs; Crown Hill, Green Lake, Greenwood-Phinney Ridge, Roosevelt, Wallingford, and Ballard-Interbay-Northend
• East Precinct: First/Capitol Hill, 23rd & Union-Jackson, Eastlake, and Madison-Miller
• West Precinct: Downtown South Lake Union, Uptown, Upper Queen Anne, Ballard-Interbay-Northend, and Greater Duwamish
• South Precinct: Columbia City, North Beacon Hill, Othello, and Rainier Beach
• Southwest Precinct: West Seattle Junction, Admiral, Morgan Junction, South Park, Westwood-Highland Park, and Greater Duwamish
Services such as patrol officers and 9-1-1 responders, bike patrol, anti-crime team, on-site liaison attorney, burglary/theft detectives, community police teams and crime prevention are provided depending on the specific characteristics and needs of each precinct (City of Seattle, 2015).
The Seattle 2035 Comprehensive Plan made the following observations with respect to existing capacity:
• The South Precinct station is currently near capacity for staffing space and in need of seismic upgrades. If additional staff were hired, it is likely that the station would be renovated (possibly including a building addition), additional parking would be provided, and seismic upgrades would be made.
• Increased staffing in the North Precinct over the next 20 years will be accommodated at a planned facility located at the intersection of North 130th Street and Aurora Avenue North. This station will provide sufficient building area to meet the needs of both existing and future staff. Land for the North Precinct facility has already been acquired.
• In other precincts, no growth-related facility needs are identified at this time. The Southwest Precinct station has capacity for 13 additional staff members, which will likely be sufficient to accommodate staffing for the 20-year planning period. Ongoing planning is conducted for the East and West precincts to help determine staffing and related facility needs (if any) in the coming year.
The Seattle Police Department established an average emergency response time target of seven minutes, which it currently meets (City of Seattle, 2035).
MHA Final EISNov. 2017
3.361
Fire and Emergency Medical Services
The Seattle Fire Department provides a full-range of fire protection, prevention and emergency medical services, which are defined citywide in service areas allocated through battalions and stations. Urban villages within each applicable Battalion are as follows:
• Battalion 2: Downtown, First/Capitol Hill, South Lake Union, Madison-Miller
• Battalion 4: Uptown, Ballard, Bitter Lake, Fremont, Crown Hill, Greenwood-Phinney Ridge, Upper Queen Anne, Wallingford, Ballard-Interbay-Northend
• Battalion 5: First/Capitol Hill, 23rd & Union-Jackson, Columbia City, North Beacon Hill, Othello, Rainier Beach, Greater Duwamish
• Battalion 6: University District, Northgate, Lake City, Aurora-Licton Springs, Eastlake, Green Lake, Roosevelt, Wallingford
• Battalion 7: West Seattle Junction, Admiral, Morgan Junction South Park, Westwood-Highland Park, Greater Duwamish
The Seattle Fire Department responds to emergency medical services (EMS) and fire incidents, of which approximately 80 percent are EMS related. The Seattle Fire Department monitors and documents response times based on the National Fire Protection Association (NFPA) Standard Guidelines. Response standards are established by specifying the minimum criteria for effectively and efficiently delivering fire suppression and emergency medical services. The target is to meet the NFPA standards 90 percent of the time. On average, the department currently meets EMS response standards 86 percent of the time and fire response standards 89 percent of the time (City of Seattle, 2015).
The Seattle Comprehensive Plan identified anticipated increases in service demands for fire protection in the following areas:
• Fire Station 2 in South Lake Union Urban Center—new fire station planned due to growth in the area;
• Fire Station 31 in portions of Bitter Lake, Aurora-Licton Springs, Crown Hill and Greenwood-Phinney Ridge urban villages. Fire Station 31 is the second busiest engine company in the city, and additional fire resources may be necessary to address current and projected growth (City of Seattle, 2015).
According to the EMS Demand Forecast model, a study of emergency medical services demand based on demographics, EMS services are
MHA Final EISNov. 2017
3.362
likely to be needed in the following neighborhoods/urban villages due to projected demand:
• Denny Regrade (Uptown Urban Center);
• South Lake Union (South Lake Union Urban Center);
• Broadview—Bitter Lake—Haller Lake (multiple urban villages and surrounding areas);
• Aliki/Admiral (multiple urban villages and surrounding areas); and
• Rainier Valley (multiple urban villages and surrounding areas).
Public Schools
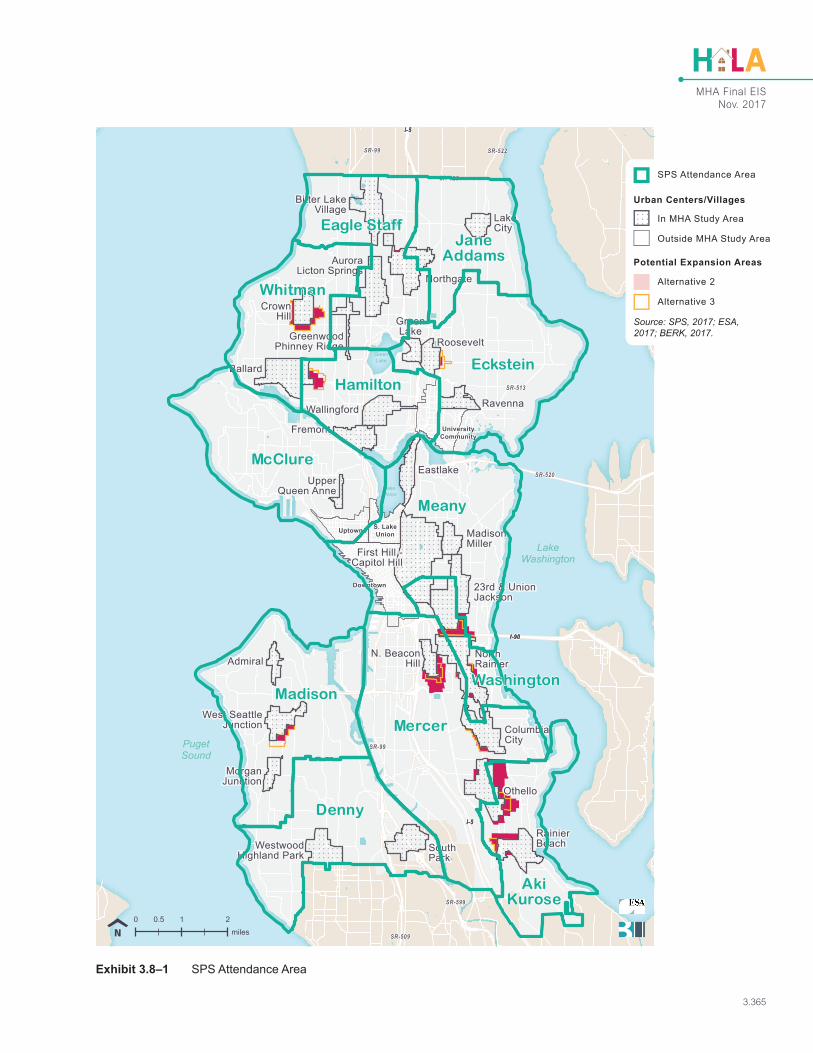
Seattle Public Schools (SPS) provides public education from kindergarten through 12th grade. The Comprehensive Plan analyzed public schools through sectors. Additional analysis in this EIS analyzes schools using Seattle Public Schools attendance areas (Exhibit 3.8–1). Sectors and their respective urban villages are included below.
• Sector 1: Ballard, Fremont, Aurora-Licton Springs, Green Lake, Greenwood-Phinney Ridge, Wallingford;
• Sector 2: Northgate, Lake City, Roosevelt;
• Sector 3: Uptown;
• Sector 4: Eastlake;
• Sector 5: First/Capitol Hill, 23rd & Union-Jackson, Madison-Miller;
• Sector 6: Admiral, Morgan Junction;
• Sector 7: South Park; and
• Sector 8: North Rainier, Columbia City, North Beacon Hill, Rainier Beach.
The Seattle Public Schools 2012 Facilities Master Plan (SPS, 2012) identified enrollment projections through 2022 for elementary, middle and high schools in Seattle. The projection is 13 years shorter than the 2035 planning horizon of the Seattle Comprehensive Plan. The Facilities Master Plan estimates that the projected growth of 9,000 students would surpass the existing capacity. Student enrollment is anticipated to grow with population increase, which would affect future capacity (City of Seattle, 2015). To address anticipated enrollment analyzed in the Facilities Master Plan, the Building Excellence (BEX) Phase IV capital program would construct 18 new or replacement schools and provide seismic upgrades for 37 additional schools, adding capacity for 7,900
MHA Final EISNov. 2017
3.363
additional students. Projects currently underway as parts of the BEX Phase IV Program include:
• Arbor Heights Elementary, replacement of existing school on the same site;
• Bagley Elementary: modernization and addition of classroom and core facilities;
• Fairmount Park Elementary: modernization and addition of classroom and core facilities;
• Jane Addams Building: re-purpose as a middle school;
• Jane Addams Hazel Wolf K-8: new replacement;
• Lincoln Building: modernize and repurpose as a comprehensive high school;
• Loyal Heights Elementary: modernize and add classroom and core facilities;
• Meany Middle School: modernize and repurpose;
• Northeast Elementary: new construction with a capacity of 500-650 seats;
• Nova Alternative High School: modernize and add classroom and core facilities;
• Olympic Hills Elementary: replacement of existing school on same site;
• Queen Anne Elementary: add classroom and core facilities;
• Schmitz Park Elementary: repurposing for elementary seats, construction of a new building;
• New construction of Genesee Hill elementary;
• Wilson Pacific Elementary and Middle School: new construction;
• New construction of Robert Eagle Staff Middle School and Cascadia Elementary School;
• Wing Luke Elementary: replacement of existing school on same site; and
• World School at T.T. Minor: repurpose and modernize.
An important element to public school infrastructure capacity includes sidewalks that are used for transportation to and from schools. SDOT identifies the preferred routes through their Safe Routes to School program. Out of the 105 schools in the SPS school district, approximately 25 are missing sidewalk infrastructure (City of Seattle, 2015). Of these, urban villages that are near or contain schools lacking full sidewalk infrastructure walking routes include: Northgate, Bitter Lake, Lake City, North Beacon Hill, Othello, Rainier Beach, South Park, Crown Hill, and Greater Duwamish.

MHA Final EISNov. 2017
3.364
To provide additional analysis in this FEIS data on school enrollment and capacity are provided for the SPS middle school service areas. All K-8 students in elementary schools within a middle school pathway plus the middle school students in the middle school are summarized by the school service area. Likewise, the total school capacity within elementary schools and middle schools within the school service area are aggregated. Analysis by school service areas provides an overview of school enrollment and capacity issues that is matched to SPS reports and analysis, and by geographic area of the city.. A map of SPS middle school service areas is provided at right as Exhibit 3.8–1.
In December of 2015, City Council passed Ordinance 124919 directing Seattle’s Office of Planning and Community Development, in coordination with the Department of Education and Early Learning and Seattle Public Schools, to develop planning strategies that support the District’s public school facility needs for anticipated student population consistent with adopted comprehensive plan policies and growth forecasts. The City of Seattle and SPS are engaged in coordination efforts to identify opportunities and sites for new school facilities. Ongoing efforts include exploration of sites for possible downtown elementary and high schools.
New to the FEIS
FEIS Exhibit 3.8–1 is new since issuance of the DEIS
MHA Final EISNov. 2017
3.365
PugetSound
LakeWashington
LakeUnion
GreenLake
SR-520
SR-900
SR-522
SR-509
SR-599
SR-523
SR-513
SR-99
SR-99
I-5I-5I-5
I-90I-90I-90
I-5I-5I-5
Downtown
S. LakeUnion
UniversityCommunity
Uptown
Ballard
Othello
Northgate
Ravenna
NorthRainier
Fremont
SouthPark
Eastlake
23rd & UnionJackson
ColumbiaCity
Wallingford
RainierBeach
Bitter LakeVillage
CrownHill
Roosevelt
Lake City
AuroraLicton Springs
Admiral
WestwoodHighland Park
GreenLake
MadisonMiller
N. BeaconHill
GreenwoodPhinney Ridge
UpperQueen Anne
MorganJunction
West SeattleJunction
First Hill -Capitol Hill
Denny
Eckstein
JaneAddams
Madison
Meany
Mercer
Eagle Staff
Whitman
Washington
McClure
AkiKurose
Hamilton
miles210 0.5
Exhibit 3.8–1 SPS Attendance Area
SPS Attendance Area
Alternative 2
Potential Expansion Areas
Urban Centers/Villages
In MHA Study Area
Outside MHA Study Area
Alternative 3
Source: SPS, 2017; ESA, 2017; BERK, 2017.
MHA Final EISNov. 2017
3.366
UTILITIES
Water, Sewer, and Drainage Systems
Municipal water is provided to Seattle Public Utilities (SPU) customers from the Cedar River watershed and the South Fork of Tolt Reservoir, and a small amount of groundwater is obtained from the SPU’s Seattle Well Fields located south of the City. Approximately 1,880-miles of transmission and distribution pipes distribute water to Seattle retail and wholesale customers (City of Seattle, 2015).
Capacity and system needs are monitored by the Puget Sound Regional Council and Washington Office of Financial Management, which uses a 20 year water demand forecast based on various factors, including growth projections. The existing water system currently has excess capacity to accommodate population growth anticipated in the Seattle 2035 Comprehensive Plan, due to declining average household usage (City of Seattle, 2015). To control demand, SPU uses management strategies, such as water availability certificates and developer improvements (City of Seattle Draft EIS, 2015).
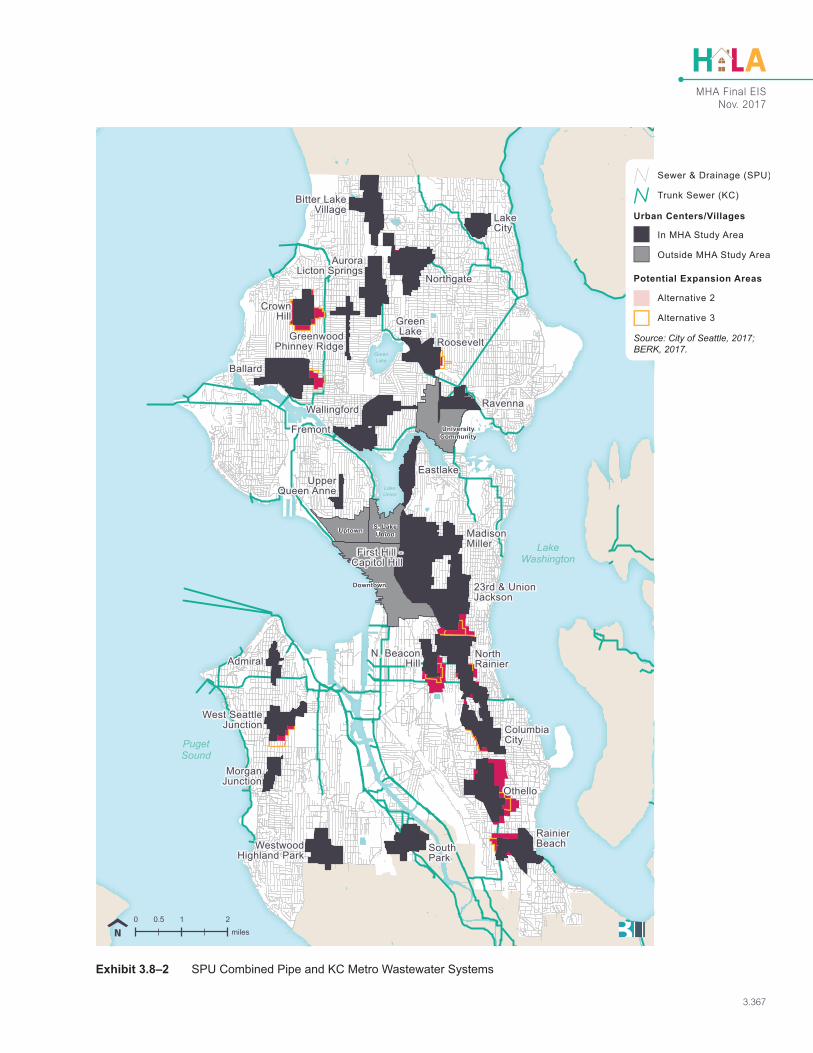
SPU drainage infrastructure includes three types of systems: combined (carries sewage and stormwater through one pipe to a wastewater treatment plant (WWTP)), fully separated (separate piped systems for stormwater and sanitary sewers, which discharge to surface water and a WWTP, respectively) and partially separated sewer and storm drain systems (roads drain to stormwater system, where the street runoff discharges to surface waters, but roofs drains and private property drainage discharges to the combined system), each serving approximately one-third of the City of Seattle. King County Wastewater Treatment Division (KC) and SPU own and operate combined sewer systems that serve about one-third of the city. Each combined sewer system is a piped network carrying both sanitary wastewater and stormwater runoff to a King County WWTP (City of Seattle, 2015).
New developments and redevelopments are typically required to comply with the following measures that ensure available water and drainage capacity prior to permit issuance.
Water Availability Certificates and Conservation. SPU uses a hydraulic network model to evaluate capacity and make a determination of water availability. If there is a gap between what the existing system can provide and what a development needs, the developer is required to upgrade the existing system to meet demand (SPU 2012). New
MHA Final EISNov. 2017
3.367
PugetSound
LakeWashington
LakeUnion
GreenLake
Downtown
S. LakeUnion
UniversityCommunity
Uptown
Ballard
Othello
Northgate
Ravenna
NorthRainier
Fremont
SouthPark
Eastlake
23rd & UnionJackson
ColumbiaCity
Wallingford
RainierBeach
Bitter LakeVillage
CrownHill
Roosevelt
Lake City
AuroraLicton Springs
Admiral
WestwoodHighland Park
GreenLake
MadisonMiller
N. BeaconHill
GreenwoodPhinney Ridge
UpperQueen Anne
MorganJunction
West SeattleJunction
First Hill -Capitol Hill
miles210 0.5
Exhibit 3.8–2 SPU Combined Pipe and KC Metro Wastewater Systems
Sewer & Drainage (SPU)
Trunk Sewer (KC)
Alternative 2
Potential Expansion Areas
Urban Centers/Villages
In MHA Study Area
Outside MHA Study Area
Alternative 3
Source: City of Seattle, 2017; BERK, 2017.
MHA Final EISNov. 2017
3.368
development and redevelopment is required by the plumbing code to include efficient plumbing fixtures. This requirement will reduce the overall impact to water demand resulting from the proposed alternatives (Seattle 2035 Comprehensive Plan).
Developer Sewer Improvements. In areas that are not designated as capacity constrained, developers are required to demonstrate that the downstream stormwater system has sufficient capacity for additional flow. Some parts of the City are served by sewers that are less than 12-inch diameter. These areas are likely at or near their capacity and downstream pipes from new development would have to be upgraded to a minimum 12-inch diameter. Redevelopments may reduce per-capita sewer demand, as newer, low- or no-flow plumbing fixtures and equipment replaces older, less efficient, installations. These practices may help reduce the overall impact to the wastewater system (City of Seattle, 2015).
Capital Projects. SPU also identifies candidate capital projects which the City implements independent of private development. A list of priority areas for Capital Improvement Projects was identified in the in the 2004 Comprehensive Drainage Plan and the 2006 Wastewater System Master Plan. These lists are updated and refined as additional data is available. Priority is determined based on the impact on public health, safety, and the environment. Capital projects to reduce combined sewer overflows (CSOs) are identified in the 2015 Plan to Protect Seattle’s Waterways. Under the SPU Asset Management system, projects must be justified through a business case process that establishes whether a problem or opportunity is timely and important, and whether the proposed solution is superior to alternatives based on a triple bottom line analysis (economic, environmental and social) of life cycle costs and benefits (City of Seattle, 2015). Additionally, the King County Long-term Control Plan (LTCP) identifies ways to reduce CSOs overflow into Seattle’s local water bodies. The LTCP identifies which CSOs will be fixed, solutions, cost and construction schedule. The LTCP is required by the Department of Ecology to be updated every five years (King County, 2016).
Seattle Stormwater Code. Current stormwater regulations require new development and redevelopment to mitigate new impervious surfaces and pollution generating surfaces with flow control and/or water quality treatment. City of Seattle stormwater regulations protect people, property and the environment from damage caused by stormwater runoff. The stormwater codes satisfy the City’s obligation to comply with their Washington State Municipal Stormwater Permit—National
MHA Final EISNov. 2017
3.369
Pollutant Discharge Elimination System (NPDES) Permit, issued by the Washington State Department of Ecology (City of Seattle, 2015).
The stormwater regulations address how stormwater from development needs to be controlled and/or treated using on-site stormwater management including green stormwater infrastructure (GSI) and other measures. The code also identifies erosion control requirements for construction and grading activities. The erosion control, flow control and treatment requirements help to maintain or mitigate the conditions of the downstream system and discharge location and may reduce the overall impact of development. New development must comply with these regulations, standards and practices and may help reduce the overall impact to the drainage system. Redevelopment that replaces existing impervious surface and provides flow control may reduce runoff rates even below current levels (City of Seattle, 2015). There are areas (single family zoning) in the City where flow control is not required and thus runoff rates can still cause cumulative impacts in downstream systems especially during intense storms. Developers, outside of single family zones, are required to demonstrate that the downstream system has sufficient capacity for changes in stormwater runoff.
Informal drainage generally exists in areas where there are no sidewalks and limited systems of drainage infrastructure to collect stormwater runoff. Areas of Seattle that are primarily served by “informal” drainage systems of ditch and culverts and/or surface drainage frequently experience drainage and flooding issues. In areas of informal drainage the developer may be required to extend the drainage main. The current Right of Away Improvement Manual (ROWIM) also requires some development to install sidewalks with curb and gutter which can affect the drainage patterns (City of Seattle, 2012). Refer to Exhibit 3.8–3 and Figure 3.9–4 in the Seattle 2035 Comprehensive Plan Update EIS (City of Seattle, 2015) for the location of stormwater capacity constrained areas, as well as the extent of informal ditch and culvert drainage. Due to the limitations of areas with informal drainage, these locations are more constrained for development with respect to stormwater infrastructure. In urban villages and centers, sidewalks must be constructed when any number of new housing units are built, with certain exceptions. SPU and SDOT are currently developing options in the ROWIM to allow for low cost sidewalk improvements for small scale developments in areas of informal drainage.

MHA Final EISNov. 2017
3.370
PugetSound
LakeWashington
LakeUnion
GreenLake
EVERGREEN
THORNTON-MAINSTEM
THORNTON-N BRANCH
THORNTON-S BRANCH
LICTONSPRINGS
KRAMER
LITTLEBROOK
VICTORY
MEADOWBROOK
BECKLER
WILLOW MAPLE
MATTHEWS
YESLER
BROADVIEW
VENEMA
PIPERS
LAWTON
MAHTEEN
MADRONA
PUGETRIDGE
FAIRMONT
FAUNTLEROY
FAUNTLEROY
LONGFELLOW
LONGFELLOW
SEOLABEACH
HAMM
HAMMMAPES
TAYLOR
TAYLOR-W FORK
TAYLOR-E FORK
WASHINGTONPARKINTERLAKEN
FRINK
MOUNT BAKER
WOLFE
LITTLES
MOCK
RAVENNA
INVERNESS
SCHMITZ
MEE-KWA-MOOKS
PELLY
EVERGREEN
THORNTON-MAINSTEM
THORNTON-N BRANCH
THORNTON-S BRANCH
LICTONSPRINGS
KRAMER
LITTLEBROOK
VICTORY
MEADOWBROOK
BECKLER
WILLOW MAPLE
MATTHEWS
YESLER
BROADVIEW
VENEMA
PIPERS
LAWTON
MAHTEEN
MADRONA
PUGETRIDGE
FAIRMONT
FAUNTLEROY
FAUNTLEROY
LONGFELLOW
LONGFELLOW
SEOLABEACH
HAMM
HAMMMAPES
TAYLOR
TAYLOR-W FORK
TAYLOR-E FORK
WASHINGTONPARKINTERLAKEN
FRINK
MOUNT BAKER
WOLFE
LITTLES
MOCK
RAVENNA
INVERNESS
SCHMITZ
Downtown
S. LakeUnion
UniversityCommunity
Uptown
Ballard
Othello
Northgate
Ravenna
NorthRainier
Fremont
SouthPark
Eastlake
23rd & UnionJackson
ColumbiaCity
Wallingford
RainierBeach
Bitter LakeVillage
CrownHill
Roosevelt
Lake City
AuroraLicton Springs
Admiral
WestwoodHighland Park
GreenLake
MadisonMiller
N. BeaconHill
GreenwoodPhinney Ridge
UpperQueen Anne
MorganJunction
West SeattleJunction
First Hill -Capitol Hill
miles210 0.5
Exhibit 3.8–3 Capacity Constrained Areas
Stream
Ditch and CulvertDrainage SystemCapacity ConstrainedBasin—Densmore
Alternative 2
Potential Expansion Areas
Urban Centers/Villages
In MHA Study Area
Outside MHA Study Area
Alternative 3
Source: City of Seattle, 2017; BERK, 2017.

MHA Final EISNov. 2017
3.371
Seattle City Light
Seattle City Light (SCL) has been supplying electricity to Seattle since 1905. SCL supplies hydroelectric power to substations throughout the SCL service area, which conveys power to users (City of Seattle, 2015). Seattle City Light’s Six-Year Strategic Business Plan and the state-mandated Integrated Resource Plan are used to insure adequate retail revenue, and necessary physical infrastructure and energy resources to meet the City’s demand due to projected economic or population growth (City of Seattle, 2015).
New developments and redevelopments are typically required to comply with the following requirements that ensure available electrical capacity before development occurs.
Energy Benchmarking. The Energy Benchmarking and Reporting Program adopted in 2010 and administered by the City’s Office of Sustainability & Environment, requires owners of non-residential and multifamily buildings (20,000 square feet or larger) to track energy performance and annually report to the City of Seattle. This allows building owners to understand and better manage their building’s energy usage (City of Seattle, 2015).
Seattle Energy Code. Seattle’s commercial and residential energy code sets a baseline for energy efficiency in new construction and substantial alterations (City of Seattle, 2015).
Customer Energy Solutions (CES). The CES division of Seattle City Light delivers several programs and services designed to meet customer energy-related needs. These offerings include energy efficiency, distributed generation (primarily solar), and electric vehicle-related infrastructure services that are available to residential, commercial, and industrial customers. These programs are also available to entities pursuing new construction projects as well as customers pursuing actions within the existing building stock.
MHA Final EISNov. 2017
3.372
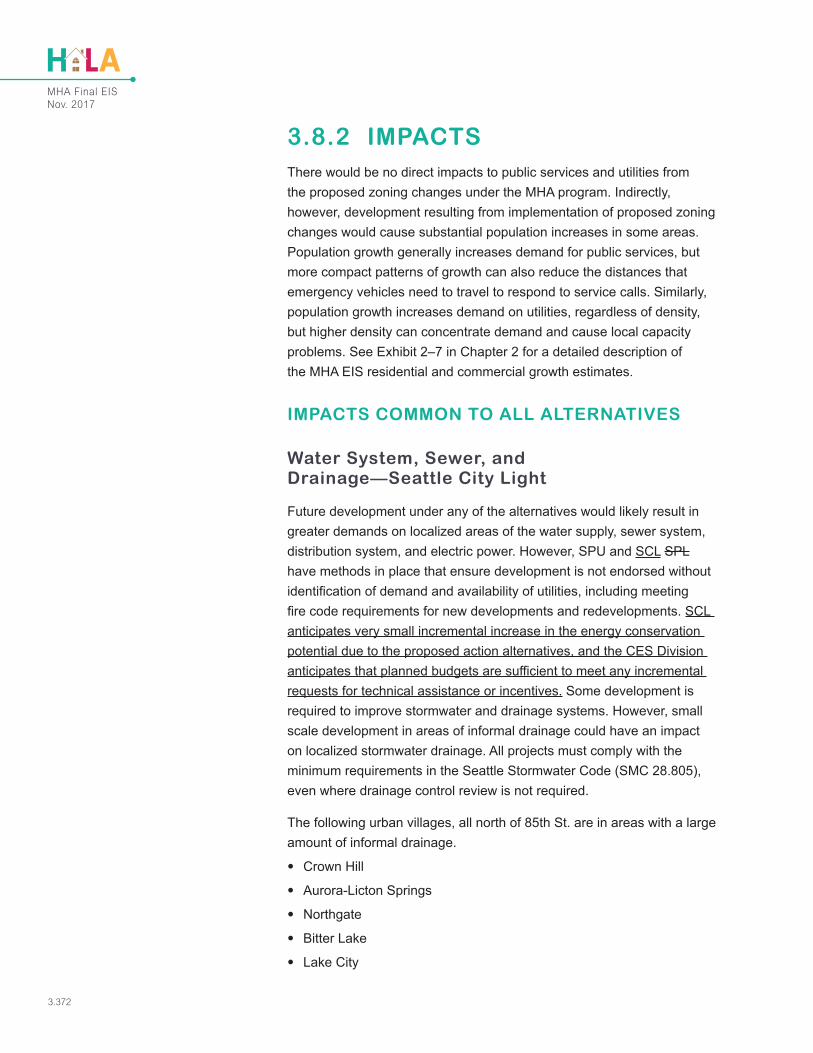
3.8.2 IMPACTSThere would be no direct impacts to public services and utilities from the proposed zoning changes under the MHA program. Indirectly, however, development resulting from implementation of proposed zoning changes would cause substantial population increases in some areas. Population growth generally increases demand for public services, but more compact patterns of growth can also reduce the distances that emergency vehicles need to travel to respond to service calls. Similarly, population growth increases demand on utilities, regardless of density, but higher density can concentrate demand and cause local capacity problems. See Exhibit 2–7 in Chapter 2 for a detailed description of the MHA EIS residential and commercial growth estimates.
IMPACTS COMMON TO ALL ALTERNATIVES
Water System, Sewer, and Drainage—Seattle City Light
Future development under any of the alternatives would likely result in greater demands on localized areas of the water supply, sewer system, distribution system, and electric power. However, SPU and SCL SPL have methods in place that ensure development is not endorsed without identification of demand and availability of utilities, including meeting fire code requirements for new developments and redevelopments. SCL anticipates very small incremental increase in the energy conservation potential due to the proposed action alternatives, and the CES Division anticipates that planned budgets are sufficient to meet any incremental requests for technical assistance or incentives. Some development is required to improve stormwater and drainage systems. However, small scale development in areas of informal drainage could have an impact on localized stormwater drainage. All projects must comply with the minimum requirements in the Seattle Stormwater Code (SMC 28.805), even where drainage control review is not required.
The following urban villages, all north of 85th St. are in areas with a large amount of informal drainage.
• Crown Hill
• Aurora-Licton Springs
• Northgate
• Bitter Lake
• Lake City
MHA Final EISNov. 2017
3.373
Of these villages, Bitter Lake and Aurora-Licton Springs also overlap capacity constrained areas, and all urban villages have portions served by ditch/culvert systems which are inherently capacity constrained. Crown Hill is the only urban village boundary expansion area of these villages. The expansion area would include blocks north of 85th Street with informal drainage.
Public Schools
School Enrollment and Housing Growth
Development of housing could increase demand for schools within the vicinity of the new housing; potentially resulting in either capacity constraints or worsening existing capacity constraints. Considering growth alternatives, estimations of longer term student enrollment stemming from housing growth can inform how school capacity could be affected due to different long-term patterns of growth considered in the MHA proposal.
For the purposes of this analysis, conceptual level net enrollment estimations are made based on the amount of new housing estimated in the school service areas. This analysis focuses on the net new students due to estimated housing growth over the 20-year timeline of the proposed program with a baseline of an existing to a five-year time period. Aside from housing growth a variety of other factors influence demand for schools such as: birth rates, enrollment in private schools, or demographic composition of families in existing housing. These other factors could more substantially effect student enrollment over the 20-year planning horizon.
To arrive at the estimation of net new students from housing growth, historic information on the number of students in different housing unit types, provided by SPS, was used to create a student generation factor from housing units. Estimated housing growth for each alternative is tabulated for the school service area, and broken into three broad categories of housing types in the zoning categories: Residential Small Lot (RSL), Low-rise (LR), and a grouping of other Midrise (MR), High-rise (HR) and Commercial/mixed use zones (C,NC,SM). The amount of housing growth within each of the housing types is estimated based on the proportion of land that can be redeveloped within those zones that are within the school service area under each proposed alternative.
New to the FEIS
Public Schools under Impacts Common to All Alternatives, including Exhibit 3.8–4, Exhibit 3.8–5, and Exhibit 3.8–6, is a new section since issuance of the DEIS

MHA Final EISNov. 2017
3.374
Exhibit 3.8–4 represents the assumed generation rate of enrolled SPS students within the service area that are living in either residential small lot, low-rise multifamily, midrise/high-rise multifamily or mixed use commercial housing types. These rates are based on aggregated data for the attendance area level for all SPS students (K-12).
Student generation factors can be used to estimate net student enrollment for planning purposes; they reflect the rate at which housing unit types produce students that then attend a school within the SPS geographic attendance area, including Highly Capable Cohort (HCC) students and Special Education Students. For example, 17.1 percent of residential small lot housing units in the SPS school district are estimated to produce SPS students; 11.9 percent of low-rise multifamily housing units in the SPS school district are estimated to produce SPS students; and 6.7 percent of midrise/high-rise multifamily and mixed use commercial housing units are estimated to produce SPS students.
School Capacity
The SPS Capital Projects and Planning division calculates capacity by determining the number of available classroom-sized spaces in a building and utilizing information from Enrollment Planning on grade configuration and class size requirements for that particular school. There are two ways of evaluating a school building’s capacity, the right size capacity and the operating capacity.
• Right size capacity is the target for a school. Class sizes would meet all requirements, programs such as preschools and daycares would have adequate space, and there would be only periodic need for temporary portable classrooms.
• Operating capacity is the existing capacity as the school is currently configured. This may include reconfigured spaces, multiple portables, and spaces that were previously used by other programs such as a daycare or preschool. (SPS, 2017a).
Exhibit 3.8–4 Student Generation Rate by Housing Type
Housing Type Category Student Generation Rate
Residential Small Lot 17.1%
Low-rise Multifamily 11.9%
Midrise/High-rise Multifamily and Mixed Use Commercial 6.7%
Source: Appendix N; Derived from SPS students in single family homes, apartments, and condos data.

MHA Final EISNov. 2017
3.375
The estimated aggregate right size capacity of schools for each middle school service area are summarized in Exhibit 3.8–5. The exhibit also displays the total number of K-8 students within the school service area. The estimated existing percent capacity, is an indication of which school service areas are at or near right size capacity under existing conditions.
When capacity is near, at, or exceeding the adopted educational program standards for facility space needs, grade configuration, facility size, class size, educational program offerings, and classroom utilization and scheduling requirements suffer.
The SPS Capital Planning division evaluates the long-range capacity needs of the district in order to plan any needed classroom additions or an increase in capacity as part of a building remodel or replacement. This occurs on a 3- to 6-year cycle with capital levy planning. Capital levies are part of Seattle Public Schools’ long-range plan to upgrade and renovate aging school facilities on a planned and predictable timetable (SPS, 2017a).
Exhibit 3.8–5 2017–2018 Estimated Total K-8 Students to Aggregate Right Size Capacity by School Service Area
School or Service Area 2017/2018 Estimated Total Students
Estimated Aggregate Right Size Capacity
Estimated Existing Capacity (%)
Aki Kurose 3,252 3,885 84%
Denny International 3,953 3,653 108%
Eagle Staff 3,553 3,676 97%
Eckstein 4,166 4,248 98%
Hamilton 3,585 4,294 83%
Jane Addams 3,144 4,271 74%
Madison 4,126 4,221 98%
McClure 3,385 4,214 80%
Meany 2,791 4,306 65%
Mercer International 4,141 4,306 96%
Washington 2,619 4,367 60%
Whitman 2,377 4,254 56%
Total School Service Areas 41,092 49,695 83%
Source: Appendix N.
MHA Final EISNov. 2017
3.376
Enrollment Planning and Projections
The Seattle Public School District makes three types of enrollment projections that are updated on an annual basis:
1. the 10-year resident projection of all students residing and enrolled in the district, but not based on where in SPS they attend;
2. the school projection for October of the upcoming school year; and
3. the school projection for October of the next 5 years.
The five year annual projections are developed for Capital Projects and Planning to prepare for how student enrollment changes could affect the district’s building capacity. They do not include service schools, are not used for school budgeting, and they do not take into consideration changes in school program offerings. These projections help to inform decision making, and they may inform future capital facility needs.
The SPS five-year projections include information by individual schools and school service areas. School services areas are named by Middle Schools, and each contains from five to 11 elementary schools that feed into a middle school. The school service areas are used as a geography to review how potential housing and population changes could affect school capacity.
The most recent available five-year projection at the time of this writing is for the 2016–2020 period. The projections are influenced significantly by planned school boundary changes and the opening of new schools, which will affect the enrollment at schools by shifting student populations.
Projected increases in enrollment at local public schools are generally governed by factors such as rate of new development, demographics of families residing in the community and the availability and utilization of private schools. Any time-based projections for increased enrollment can be altered by changes in these or other factors. SPS’s school projections for student enrollment are done based on historical information. For SPS enrollment changes at a five-year projection by school attendance, see Appendix N.
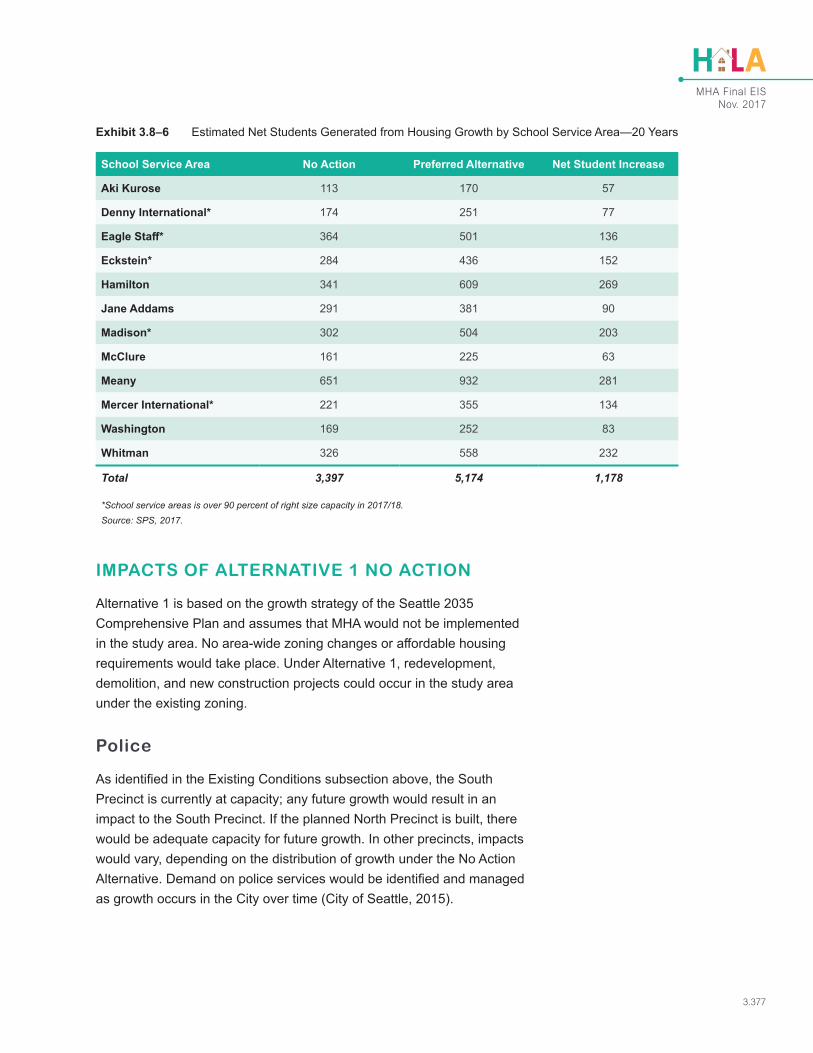
For analysis in this FEIS 20-year net students generated from housing growth by school service area is estimated for the No Action and the Preferred Alternative in Exhibit 3.8–6. Student generation rates from Exhibit 3.8–4 are applied to the amount of projected housing growth in the school service areas. The net student increase is the number of additional students expected in each school service area due to the additional housing from the Preferred Alternative over a 20-year period. The school service areas with an asterisk are at over 90 percent of right size capacity in 2017–18 (Exhibit 3.8–5).
MHA Final EISNov. 2017
3.377
IMPACTS OF ALTERNATIVE 1 NO ACTION
Alternative 1 is based on the growth strategy of the Seattle 2035 Comprehensive Plan and assumes that MHA would not be implemented in the study area. No area-wide zoning changes or affordable housing requirements would take place. Under Alternative 1, redevelopment, demolition, and new construction projects could occur in the study area under the existing zoning.
Police
As identified in the Existing Conditions subsection above, the South Precinct is currently at capacity; any future growth would result in an impact to the South Precinct. If the planned North Precinct is built, there would be adequate capacity for future growth. In other precincts, impacts would vary, depending on the distribution of growth under the No Action Alternative. Demand on police services would be identified and managed as growth occurs in the City over time (City of Seattle, 2015).
Exhibit 3.8–6 Estimated Net Students Generated from Housing Growth by School Service Area—20 Years
School Service Area No Action Preferred Alternative Net Student Increase
Aki Kurose 113 170 57
Denny International* 174 251 77
Eagle Staff* 364 501 136
Eckstein* 284 436 152
Hamilton 341 609 269
Jane Addams 291 381 90
Madison* 302 504 203
McClure 161 225 63
Meany 651 932 281
Mercer International* 221 355 134
Washington 169 252 83
Whitman 326 558 232
Total 3,397 5,174 1,178
*School service areas is over 90 percent of right size capacity in 2017/18.Source: SPS, 2017.

MHA Final EISNov. 2017
3.378
Fire and Emergency Services
Under the No Action alternative, growth would occur and potentially result in an increase in call volumes. As identified in the Existing Conditions above, existing growth trends in South Lake Union Urban Center (Fire Station 2) and portions of Bitter Lake, Aurora-Licton Springs, Crown Hill and Greenwood-Phinney Ridge urban villages (Fire Station 31), could contribute to increased service call volumes and potential slower average response times in these areas. However, the City would continue to manage fire and EMS services in the city as a whole in view of planned housing and employment growth (City of Seattle, 2015).
Public Schools
Under the No Action alternative, growth would continue to occur based on the preferred alternative identified in the Seattle 2035 Comprehensive Plan. For SPS, growth is expected to be most evident in Northwest Seattle, Northeast Seattle, Downtown/Lake Union and Capitol Hill/Central District. The Northwest Seattle, Northeast Seattle and Capitol Hill/Central Districts currently have the capacity to serve potential growth (City of Seattle, 2015).
IMPACTS OF ALTERNATIVE 2
Alternative 2 would revise the existing Land Use Code, resulting in the potential for 63,070 housing units within the EIS study area, an increase of almost 40 percent in housing units from the No Action Alternative of 45,361 housing units. The overall effect would be an additional 17,709 housing units more than would be developed within the planning area under Alternative 1 (see Exhibit 2–7). The additional units would result in an associated population increase of approximately 31,522 residents (based on population generation factor of 1.78 average household sizes in Hub Urban Villages (City of Seattle, 2015). This would be consistent with the Comprehensive Plan’s direction of future growth in identified urban villages, which are typically characterized by higher densities.
Police
The pattern of growth under Alternative 2 would be denser in some areas, resulting in a greater concentration of people within a precinct that the police department would have to serve. As identified, the South Precinct is currently at capacity and serves the urban villages of Columbia City, North Beacon Hill, Othello and Rainier Beach and

MHA Final EISNov. 2017
3.379
the surrounding areas. Alternative 2 would add the potential for 3,959 housing units (1,359 more than under Alternative 1) to these urban villages in the South Precinct. Therefore, implementation of the proposed project under Alternative 2 could result in additional impacts to police services in the South Precinct above those expected under the Seattle 2035 Comprehensive Plan. However, if the planned North Precinct is built, there would be adequate capacity for future growth. In other urban villages, demand on police services would be identified and managed as projects under the MHA are implemented.
Fire and Emergency Services
The pattern of growth would result in a greater concentration of people within an area (Battalion) that fire and emergency would have to serve. Similar to the No Action Alternative, growth in portions of Bitter Lake, Aurora-Licton Springs, Crown Hill and Greenwood-Phinney Ridge urban villages (Fire Station 31), could contribute to increased service call volumes and potential slower average response times in these urban villages. Alternative 2 has the potential to add a total of 4,465 housing units (965 more than under Alternative 1) to urban villages that Fire Station 31 serves. Therefore, implementation of the proposed project under Alternative 2 would result in a higher number of housing units that would need fire and emergency services and therefore could result in additional impacts to Fire Station 31. In other urban villages, demand on fire and emergency services would be identified and managed as the project is implemented.
Public Schools
Population growth would increase student enrollment in various urban villages throughout the city. Approximately 30 percent of SPS’s schools are located in urban villages. Encouraging population growth in urban villages could result in the exceedance of maximum enrollment levels. SPS has calculated enrollment through the 2021/2022 school year, while the MHA is projected through 2035. SPS would respond to the exceedance of capacity as it has done in the past, by adjusting school boundaries and/or geographic zones, adding or removing portables, adding/renovating buildings, reopening closed buildings or schools, and/or pursuing future capital programs. If the MHA program is adopted, SPS would adjust their enrollment projections accordingly for the next planning cycle. Additional projections of net students that could be generated due to MHA implementation is provided in this FEIS for the Preferred Alternative.

MHA Final EISNov. 2017
3.380
The rise in enrollment at public schools in urban villages will impact SPS transportation services. The Northgate, Bitter Lake, Lake City, North Beacon Hill, Othello, Rainier Beach, South Park, Greater Duwamish urban villages are currently experiencing strain on existing deficient sidewalk infrastructure. As a result, the increased school capacity in these villages would subsequently burden the existing sidewalk infrastructure even further, posing a safety risk to pedestrian students.
IMPACTS OF ALTERNATIVE 3
Alternative 3 would revise the existing Land Use Code resulting in the potential for 62,858 housing units, an increase of approximately 39 percent in housing units over the No Action Alternative of 45,361 housing units. The overall effect would be an additional 17,497 housing units more than would be developed on the same number of existing parcels (see Exhibit 2–7). The additional units would result in an associated population increase of approximately 31,144 residents, based on population generation factor of 1.78 average household size in Hub Urban Villages (City of Seattle, 2015). This would be consistent with the Comprehensive Plan’s direction of future growth in identified urban villages, which are typically characterized by higher densities.
Police
Impacts to police services would be the similar to those identified for Alternative 2. Alternative 3 has the potential to add a total of approximately 3,272 housing units to the urban villages in the South Precinct, which is approximately 687 fewer units in the South Precinct urban villages than in Alternative 2. As a result, impacts related to police services would be slightly less in Alternative 3. However, implementation of Alternative 3 would still likely result in impacts to police services in the at-capacity South Precinct due to a potential increase in demand. In other urban villages, impacts on police services as a result of demand increases would be identified and managed during the project approval process.
Fire and Emergency Services
Impacts to fire and emergency services would be similar to those identified in Alternative 2. Alternative 3 has the potential to add a total of approximately 5,184 housing units to urban villages that Fire Station 31 serves, which is approximately 719 more units in the service area of Fire Station 31 than Alternative 2. As a result, impacts related to fire and emergency service could be slightly more than those of Alternative

MHA Final EISNov. 2017
3.381
2. However, implementation of Alternative 3 would still likely result in impacts to fire and emergency services as a whole due to the potential for increased demand. In other urban villages, impacts on fire and emergency services as a result of demand increases would be identified and managed during the project approval process.
Public Schools
Impacts to public schools would be the same as those identified in Alternative 2. Additional projections of net students that could be generated due to MHA implementation is provided in this FEIS for the Preferred Alternative.
IMPACTS OF THE PREFERRED ALTERNATIVES
The preferred alternative would revise the existing Land Use Code resulting in the potential for 62,376 housing units; the overall effect would be an additional 17,015 housing units more than would be developed on the same number of existing parcels (see Exhibit 2–7). The additional units would result in an associated population increase of approximately 30,287 residents, based on population generation factor of 1.78 average household size in Hub Urban Villages (City of Seattle, 2015). This would be consistent with the Comprehensive Plan’s direction of future growth in identified urban villages, and other goals for MHA housing production citywide, which are typically characterized by higher densities.
Police
Impacts to police services would be the similar to those identified for Alternative 3. The Preferred Alternative has the potential to add a total of approximately 3,739 housing units to the urban villages in the South Precinct. Implementation of the Preferred Alternative would still likely result in impacts to police services in the at-capacity South Precinct due to a potential increase in demand. In other urban villages, impacts on police services as a result of demand increases would be identified and managed during the project approval process.
Fire and Emergency Services
Impacts to fire and emergency services would be similar to those identified in Alternative 3. The Preferred Alternative has the potential to add a total of approximately 4,846 housing units to urban villages that Fire Station 31 serves. Implementation of the preferred alternative would
New to the FEIS
Impacts of the Preferred Alternative, including Exhibit 3.8–4, Exhibit 3.8–5, and Exhibit 3.8–6, is a new section since issuance of the DEIS
MHA Final EISNov. 2017
3.382
still likely result in impacts to fire and emergency services as a whole due to the potential for increased demand. In other urban villages, impacts on fire and emergency services as a result of demand increases would be identified and managed during the project approval process.
Public Schools
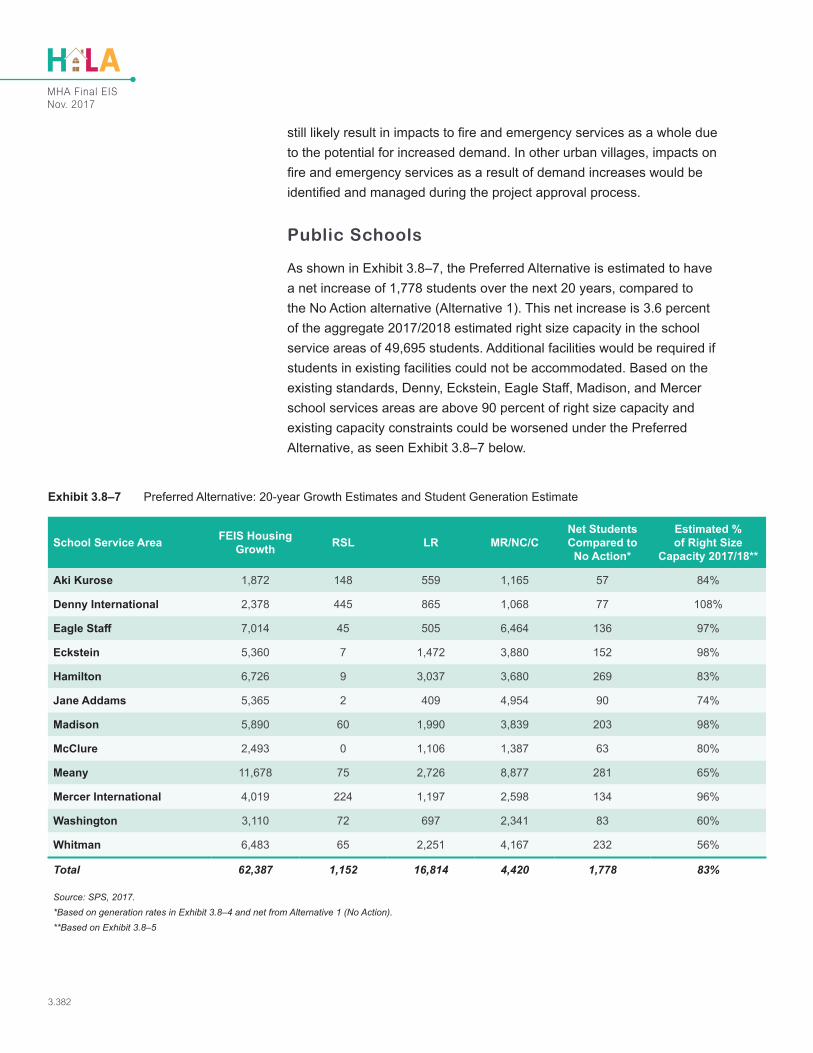
As shown in Exhibit 3.8–7, the Preferred Alternative is estimated to have a net increase of 1,778 students over the next 20 years, compared to the No Action alternative (Alternative 1). This net increase is 3.6 percent of the aggregate 2017/2018 estimated right size capacity in the school service areas of 49,695 students. Additional facilities would be required if students in existing facilities could not be accommodated. Based on the existing standards, Denny, Eckstein, Eagle Staff, Madison, and Mercer school services areas are above 90 percent of right size capacity and existing capacity constraints could be worsened under the Preferred Alternative, as seen Exhibit 3.8–7 below.
Exhibit 3.8–7 Preferred Alternative: 20-year Growth Estimates and Student Generation Estimate
School Service Area FEIS Housing Growth RSL LR MR/NC/C
Net Students Compared to No Action*
Estimated % of Right Size
Capacity 2017/18**
Aki Kurose 1,872 148 559 1,165 57 84%
Denny International 2,378 445 865 1,068 77 108%
Eagle Staff 7,014 45 505 6,464 136 97%
Eckstein 5,360 7 1,472 3,880 152 98%
Hamilton 6,726 9 3,037 3,680 269 83%
Jane Addams 5,365 2 409 4,954 90 74%
Madison 5,890 60 1,990 3,839 203 98%
McClure 2,493 0 1,106 1,387 63 80%
Meany 11,678 75 2,726 8,877 281 65%
Mercer International 4,019 224 1,197 2,598 134 96%
Washington 3,110 72 697 2,341 83 60%
Whitman 6,483 65 2,251 4,167 232 56%
Total 62,387 1,152 16,814 4,420 1,778 83%
Source: SPS, 2017.*Based on generation rates in Exhibit 3.8–4 and net from Alternative 1 (No Action).**Based on Exhibit 3.8–5
MHA Final EISNov. 2017
3.383
Capital Planning evaluates school capacity and space needs annually. If there is enough increased enrollment in a school that additional classroom space is needed, SPS will emphasize use of space in buildings for the primary purpose of K-12 instruction according to these priorities:
1. K-12 Instruction
2. Preschool (because it requires dedicated space and licensing)
3. Before and After Care (because it is more flexible in utilizing multi-use space)
4. Other Youth Activities
5. All other activities
COMPARISON OF THE ALTERNATIVES
Compared to the No Action Alternative, the more compact urban development patterns associated with Alternatives 2, and 3, and the Preferred Alternative would be more efficient to serve and less impactful to police and fire and emergency services, primarily because residents would be located closer to service areas, reducing service time response demands. Additionally, in urban areas where infrastructure is already in place, the extension of public services and utilities is typically less difficult and less costly than in suburban and rural areas where there is less existing infrastructure and greater distances to cover. The concentration of development would likely allow for more efficient use of existing infrastructure associated with public services and utilities.
3.8.3 MITIGATION MEASURESMeasures to address immediate school capacity needs include re-purposing spaces to create classrooms. This may be reconfiguring computer labs or other classroom-sized spaces. This may also cause relocation of preschool or daycare programs. Another option to address capacity needs is to add portable classrooms to the site. The BEX V capacity projects would also help alleviate capacity where needed. Strategies to deal with capacity issues are dependent on the availability of funds, so if levies do not pass, the impacts of the increased growth would be magnified (SPS, 2017a).
MHA implementation is studied over a 20-year time period. Since SPS typically plans for a shorter-term horizon, the district will continue to monitor student generation rates into the future and adjust its facility planning accordingly. The district will continue to implement existing
MHA Final EISNov. 2017
3.384
plans to expand permanent student capacity at area schools. In addition, the district may use portable classrooms or shift attendance boundaries to address student capacity issues that arise on a shorter-term basis.
In coordination with the Department of Education and Early Learning and in partnership with the Seattle Public Schools, the City’s Office of Planning and Community Development will develop planning strategies that support the District’s public school facility needs for anticipated student population consistent with adopted comprehensive plan policies and growth forecasts. The City of Seattle and SPS are engaged in coordination efforts to identify opportunities and sites for new school facilities. Ongoing efforts include exploration of sites for possible downtown elementary and high schools.
Increased collaboration between the School District and City of Seattle over the 20-year time period will mitigate school capacity constraints. The City could provide assistance to identify and procure sites for new school facilities. This may include exploration of the reuse of existing publicly-owned lands for school facilities particularly in areas of known school capacity constraints. The City and SPS could investigate ways to strengthen integrated long-term planning efforts, which could include creation of new plans that are jointly approved by City and School District governing bodies. This could be achieved within the context of the City’s Comprehensive Plan and/or future community plans, or in other ways. As additional mitigation of school capacity constraints, the City could study and develop a recommendation for a schools impact fee on new development to support the funding of public school facilities. However, decision-makers would need to evaluate such an impact fee in conjunction with potential impact fees for other services, including parks, and transportation.
MHA Final EISNov. 2017
3.385
Mitigation recommendations proposed in Section 3.8.3 of the Seattle 2035 Comprehensive Plan EIS would also apply to the potential impacts identified for this project, including prioritizing identified needs in areas that currently experience deficiencies and are anticipated to grow in number of residences. No other mitigation would be required.
Additional mitigation measures to address stormwater drainage impacts in areas of informal drainage could be considered by the City. The City could strengthen tools and regulations to ensure that systematic stormwater drainage improvements are made at the time of small scale infill developments in areas of informal drainage. Tools could include incorporating drainage design techniques in the low cost sidewalk improvements section of the Right of Way Improvements Manual.
Another potential tool is to establish a latecomer agreement mechanism for sidewalk / drainage improvements. This tool would allow homeowners and builders of small scale development projects to sign an agreement to contribute to future block-scale sidewalk / drainage improvements at the time the City is prepared to construct a block-scale improvement in the area. The tool could be combined with low-cost loan financing assistance from the city.
3.8.4 SIGNIFICANT UNAVOIDABLE ADVERSE IMPACTS
No significant unavoidable impacts to public services or utilities are anticipated at this time for any of the proposed alternatives. Existing local or statewide regulatory framework would apply at the time of development that would identify any specific project-level impacts and would be addressed on a project-by-project analysis.

MHA Final EISNov. 2017
3.386
« intentionally blank »