Embed Size (px)
Citation preview
PUBLIC SPENDING AT THE DISTRICT LEVEL
IN GHANA
By Isaac Osei-Akoto Robert Darko Osei William Quarmine
George Adayi-Nwoza Adiah
.ifpri.org/divs/dsgd.htm).
IFPRI’s GSSP Office in Accra International Food Policy Research Institute c/o International Water Management Institute (IWMI) Postal Address: PMB CT 112, Cantonments, Accra, Ghana Local Address: Martin Odei Block, CSIR Campus, Airport Residential Area Tel: +233-(0)-21-780716 • Fax: +233-(0)-21-784752 http://www.ifpri.org/themes/gssp/gssp.htm For further information: Shashi Kolavalli, Senior Research Fellow and Program Coordinator ([email protected]; Note: located in Accra)
IFPRI HEADQUARTERS International Food Policy Research Institute 2033 K Street NW Washington, DC 20006-1002 USA Tel. +1-202-862-5600 Fax +1-202-467-4439 E-mail [email protected] www.ifpri.org
Ghana Strategy Support Program (GSSP) Background Paper No. GSSP 0008
September 2007
In collaboration with:
Institute of Statistical, Social and Economic Research (ISSER)
G S S P Background Paper 8
THE GHANA STRATEGY SUPPORT PROGRAM (GSSP) BACKGROUND PAPERS
ABOUT GSSP GSSP is a research, communication, and capacity-strengthening program to build the capabilities of researchers, administrators, policymakers, and members of civil society in Ghana to develop and implement agricultural and rural development strategies. With core funding from the U.S. Agency for International Development (USAID)/Ghana and a mandate to develop a multi-donor-funded Program, IFPRI launched GSSP as a partnership between Ghana and its development partners. IFPRI is working with these stakeholders to generate information, improve dialogue, and sharpen decisionmaking processes essential for effective formulation and implementation of development strategies. GSSP informs stakeholders on the role of agriculture and rural development in the broader economic and policy context in line with the emphasis placed on agriculture in Ghana’s Growth and Poverty Reduction Strategy. GSSP supports the development and implementation of a system to monitor and evaluate progress toward achieving Ghana’s growth and poverty reduction targets and the Millennium Development Goals. ABOUT THESE BACKGROUND PAPERS IFPRI’s Ghana Strategy Support Program (GSSP) Background Papers contain preliminary material and research results from IFPRI and/or its partners in Ghana. The papers have not been subject to a formal peer review. They are circulated in order to stimulate discussion and critical comment. The opinions are those of the authors and do not necessarily reflect those of their home institutions or supporting organizations.
PUBLIC SPENDING AT THE DISTRICT LEVEL
IN GHANA
By Isaac Osei-Akoto Robert Darko Osei William Quarmine
George Adayi-Nwoza Adiah
Institute of Statistical, Social and Economic Research (ISSER)
A draft report submitted to the International Food Policy Research Institute’s
Ghana Strategy Support Program (GSSP)
September 2007

Copyright © 2007 International Food Policy Research Institute. All rights reserved. Sections of this material may be reproduced for personal and not-for-profit use without the express written permission of but with acknowledgment to IFPRI. To reproduce the material contained herein for profit or commercial use requires express written permission. To obtain permission, contact the Communications Division at [email protected].
TABLE OF CONTENTS
1. Introduction......................................................................................................................... 1 2. Trends in Public Expenditures at the District Level ........................................................... 3
2.1 Components of Recurrent Expenditures....................................................................... 8 2.2 Components of Capital Expenditures......................................................................... 12
3. Trends in Key Sources of Funding for District Assemblies ............................................. 18
3.1 Components of Internally Generated Funds (IGF)..................................................... 21 3.2 Components of Grant Received by District Assemblies ............................................ 25
4. Status of Socio-Economic Indicators at the District Level ............................................... 28
4.1 Introduction ................................................................................................................ 28 4.2 Changes in Socio-Economic Indicators at the District Level..................................... 29
5. Conclusion ........................................................................................................................ 32 References ............................................................................................................................... 34 APPENDIX 1: An Attempt to Explain the Relationship between Development Outcomes and District Assemblies’ Spending ........................................................................ 36 APPENDIX 2: Revenue of Local Government Bodies........................................................... 40 APPENDIX 3: Classification of Expenditure Items................................................................ 41
1
1. INTRODUCTION Public spending may influence poverty alleviation objectives at several levels
including overall spending plans of government (aggregate fiscal policy), policy decisions
funded in the budget and the flow of budgeted resources to Ministries, Department and
Agencies (MDAs); frontline service delivery institutions whose activities directly impact the
development outcomes. As a starting point for analysis of the returns of public spending at the
district level, this short report attempts to review the trends in financial inflows and outlays
from District Assemblies (DAs) and link them to key development outcomes over the period
spanning 1994 to 2004.
To minimize emphasis on traditional financial management system whereby control
of resources over achievement of outcome-oriented objectives is stressed, Ghana introduced
its MTEF in 1998 to enhance budgetary performance. The budget formulation phases of the
preparation of the MTEF successfully initiated a shift from the traditional incremental but
fragmented annual budgetary exercise to one that has more of a performance focus (World
Bank, 2001). The current system has more medium-term perspective and it holds the potential
to integrate decisions on recurrent and capital expenditure and sources of funding. It is also
hoped that the MTEF could offer support to the efforts to devolve authority within central
government sector ministries to district level so as to make the links between resources and
performance at the lower levels of government more clear and easy to evaluate. Ghana has so
far implemented the MTEF concept at the MDAs’ level but it is hoped that on-going
preparation for a more financial decentralized concept - composite budgeting approach within
the MTEF framework - at the district level will extend potential gains from the MTEF
approach to the local level of governance1.
Despite significant progress made, weaknesses in the implementation of the MTEF
continue to make assessment of the gains in efficiency and effectiveness of government
programmes quite difficult at the MDAs’ level. Notable amongst such problems in general is
the classification of financial inflows and outlays at the district level. Judging how over time
organizations have become flexible and responsive, whether resources are diverted from
delivery of essential services to administrative overheads, and even whether the public service
system has appropriate incentives to generate desirable outputs and outcomes is complicated.
Classification of expenditure by programme categories is often desirable in this regard, but at
this stage the information available at the national level do not permit detailed discussions that
1 The composite budgets would serve an informational purpose mostly as they would incorporate
expenditure under different jurisdictions aggregating the budgets of the decentralized departments together with the central administration budget of the DAs into a composite budget. Thus it is hoped that the approach would provide the basis for fiscal reports that include all tiers of government at the district level.
2
would link plan and policy objectives more directly to budget provisions for running of
development programmes.
We have therefore, used information from three main sources to analyze what is
easily available and assess the extent of work that is required to get detailed and precise
estimates on the returns to public spending at lower levels of governance. We obtained
information on expenditures and revenue from district assemblies’ trial balances from the
Controller and Accountant Generals Department. We have also used data on both releases and
utilization of resources from the District Assemblies’ Common Fund (DACF) Secretariat2 and
obtained information on health, education, water and sanitation from the datasets gathered
from the two Core Welfare Indicators Questionnaire surveys conducted by the Ghana
Statistical Service. The data from the trial balances were obtained through the assistance of
IFPRI office in Accra. There are plans to liaise with various MDAs to gather more financial
and development outcome data in order to get a more detailed understanding of the issues
IFPRI has asked ISSER to investigate.
The first set of tasks to be accomplished in the terms of reference concerning district
level analysis is; (i) to develop a more detailed database to permit deeper analysis of the
impacts of various forms of government spending on growth and poverty reduction, (ii) to
analyze expenditures of district assemblies and examine their sources of funds, and (iii) to
relate public spending to development outcomes of key sectors at the district level. It is
important to note that this report is mainly descriptive and intended to provide preliminary
explanation of the relationship between public expenditures and district level development
outcomes.
2 The DACF represents one of the most important financial inflows to district assemblies.
Constitutionally, 5% of total government revenue is shared among the assemblies on a formula determined by Parliament. The percentage has recently been increased to 7.5%.
3
2. TRENDS IN PUBLIC EXPENDITURES AT THE DISTRICT LEVEL
Ghana’s 10 administrative regions are subdivided into 138 distinctive metropolitan, municipal
and district assemblies. The political-administrative head in each district is the district chief
executive – similar to an executive mayor. The district chief executive is nominated by the
state president and must receive the approval of two-thirds of the district assembly. Each
district has a district coordinating director, similar in role to a town clerk as head of paid
service.
Each district assembly also has a presiding member who is the chairperson and is
elected by at least two-thirds of the members of the assembly. All elected assembly members
represent single member wards and they are required to meet at least three times each year.
Priorities that drive the development agenda at the district level are set by an executive
committee comprising not more than one-third of all assembly members.
The district chief executive chairs the executive committee, and the executive
committee normally has a number of sub-committees, which deliberate over issues and make
recommendations to the executive committee. The executive in turn reports to the district
assembly in full session. Apart from the executive committee there are five mandatory
subcommittees: development planning, social services, works, justice and security, and
finance and administration.
With the exception of the presiding member, all district assembly members must sit
on at least one sub-committee. The assemblies have full discretion to establish further
committees as they see fit. They are also empowered to establish joint committees with one
another for any project in which they hold a joint interest.
The system of accounting at the district level follows the concept of classifying
expenses according to economic classification and line item details. The assemblies’ financial
system operates according to economic categories, distinguishing among capital and current
spending. Further details are classified according to categories used for administrative control,
like separation of salaries from transportation and general administration. Even though
recurrent and capital budgets (sometimes also referred to as development budget) are not
merged they are coordinated to enable coherent and strategic expenditure planning. The two
form the main sections of public spending at the district level.
The district assemblies have two major expenditure classification systems; the main
budget expenditure classification and the supplementary budget expenditure classification for
accessing and utilization of the district assemblies’ common fund. The supplementary budget
is the DACF expenditure budget covering projects envisaged by the assemblies in the ensuing
year. It also covers recurrent expenses permitted under the guidelines for utilization of the
4
common fund, which is issued from time to time by the Ministries of Local Government and
Rural Development and Finance and Economic Planning.
In the main budget the expenditure classification covers seven major expenditure
headings namely, personnel emoluments; traveling and transport expenditure; general
expenditure; maintenance, repairs and renewals; miscellaneous expenditure; subventions and;
capital expenditure (see Appendix 2 and 3 for details about sub-headings of the various
items). The supplementary expenditure classification covers five major sectoral headings
namely, education; health and sanitation; local government and rural development; agriculture
and; economic activities (details on this classification are provided in section 2.2).
Like the subsequent sections in this report, the data in this section relate solely to
expenditures incurred by DAs. Therefore, the items do not include other public spending by
various MDAs that work in the districts. Expenses by development partners that do not pass
through district assemblies’ financial systems are also not covered in this analysis. It is
important to note that the other organizations directly implementing their programmes outside
the budgeting framework of the DAs could be spending on similar items like those the DAs
spend on. Indeed, the DAs could be aware of the types and levels of expenditures by the
agencies but they could not have direct control over them, and as such it is difficult for reports
like this to show the volume of these expenditures relative to DAs expenses. The situation
makes it difficult to assess the real volume of financial flows to the jurisdiction of the
different DAs. By way of comparison, the total amount of money expensed by the assemblies
constitutes 6.5% of total national government expenditure and about 1.8% of total GDP in
2004 (see Table 2.1 for other details on the size of public spending that DAs control directly).
Before describing the trends in the components of recurrent expenditure, we have
presented average recurrent expenditures in Table 2.2 and Figures 2.1 to 2.4, which compare
them to capital expenditures across the various categories of districts. The district assemblies
are different in many respects, so it will be quite misleading to combine them and report
averages of key policy variables for all of them. In this report we categorized them using the
Ministry of Local Government’s administrative classification, which invariably also reflects
the size of the districts and other socio-economic differences. Our first group is termed
“metropolitan assemblies”, which are assemblies with population of over 250,000. Ghana had
3 of them by the year 2004 and they also served as regional capitals. The second is termed
“other regional capitals” to represent the assemblies that serve as regional capitals but are not
metropolis. The third group represents districts that do not have a single urban locality, which
were 4 in number out of the total of 110 districts Ghana had in 20043. These are examples of
the many configurations that the DAs can fall into; ecological, level of deprivation or even 3 The districts with no urban locality in 2004 were Amansie West in Ashanti Region, Builsa and
Bongo in Upper East Region and Nadowli in Upper West Region
5
ethnicity. We have left out the last group because our intention of grouping them here is only
to highlight the fact that it is quite misleading to generalize patterns of spending for the DAs
by using only averages.
Table 2.1 District Assemblies Total Expenditures as Percentage of Some National
Economic Aggregates (%), 2000-2004
Year % of Total Revenue
% of Tax Revenue
% of Total Expenditures
% of GDP
2000 5.2 6.2 4.2 0.4 2001 5.4 5.4 4.0 0.7 2002 4.9 5.7 4.5 0.9 2003 2004 5.9 8.0 6.5 1.8
Source: Computed from Public Accounts of Ghana (CAGD, various issues), DAs Trial Balances (MLGRD, various issues) and State of Ghanaian Economy Report (ISSER, various issues)
The average expenditure figures have been adjusted for population sizes of the
districts by using weighted average computations. Recurrent expenditures on the average
constitute nearly 55% of total outlays by the DAs with a large degree of variations between
the districts and over time. The metropolitan assemblies’ recurrent expenditures form nearly
two-thirds of total expenditures while smaller districts spend just about a fifth of total
expenditures on recurrent spending items.
Table 2.2 Average Shares of District Assemblies Total Spending (%)
Expenditure Item Metropolitan
Assemblies Other Regional
Capitals Districts with no
urban locality All District Assemblies
Recurrent o/w Personal emoluments 27.5 24.0 10.8 24.2 Travel and transport 8.8 6.9 4.0 8.2 General 5.5 4.0 2.4 5.1 Maintenance & Repairs 2.8 0.9 0.5 2.3 Miscellaneous 20.3 4.3 3.4 15.0 Sub-total 65.0 40.1 21.0 54.8 Capital 35.0 59.9 79.0 45.2 Total 100.0 100.0 100.0 100.0 Source: Computed from District Assemblies’ Trial Balances, MLGRD: 1994-2004
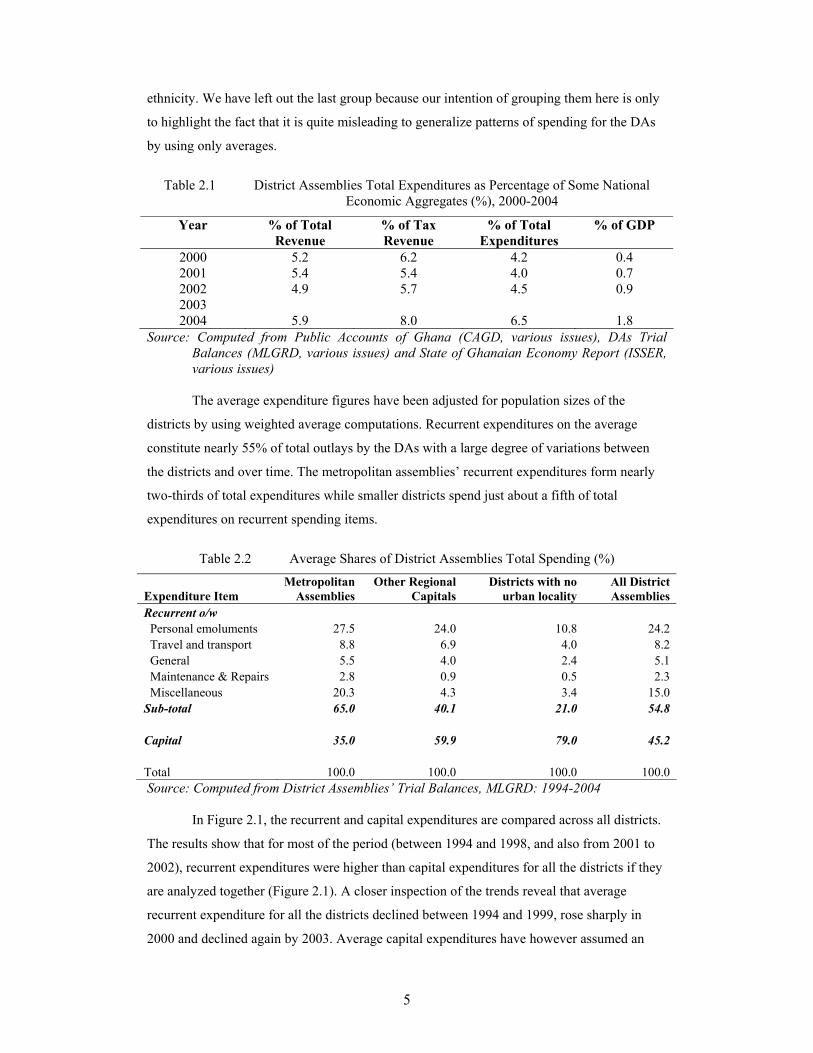
In Figure 2.1, the recurrent and capital expenditures are compared across all districts.
The results show that for most of the period (between 1994 and 1998, and also from 2001 to
2002), recurrent expenditures were higher than capital expenditures for all the districts if they
are analyzed together (Figure 2.1). A closer inspection of the trends reveal that average
recurrent expenditure for all the districts declined between 1994 and 1999, rose sharply in
2000 and declined again by 2003. Average capital expenditures have however assumed an
6
upward trend after 1997. It is interesting to observe that in 2000, average recurrent and capital
expenditures for all districts were almost equal. Over the last few years, capital expenditures
have outpaced recurrent expenditures for all districts – whereas average capital expenditures
rose between 2002 and 2004, average recurrent expenditures declined.
0
500
1,000
1,500
2,000
2,500
3,000
3,500
4,000
1994 1995 1996 1997 1998 1999 2000 2001 2002 2004
1997
Mill
ion
Cedi
s
Fig 2.1: Trends in Recurrent & Capital Expenditures (1997 million cedis)All District Assemblies
recurrent capital
0
2,000
4,000
6,000
8,000
10,000
12,000
14,000
1994 1995 1996 1997 1998 2000 2001 2002 2004
Fig 2.2: Trends in Recurrent & Capital Expenditures (1997 million cedis)Metropolitan Assemblies
recurrent capital
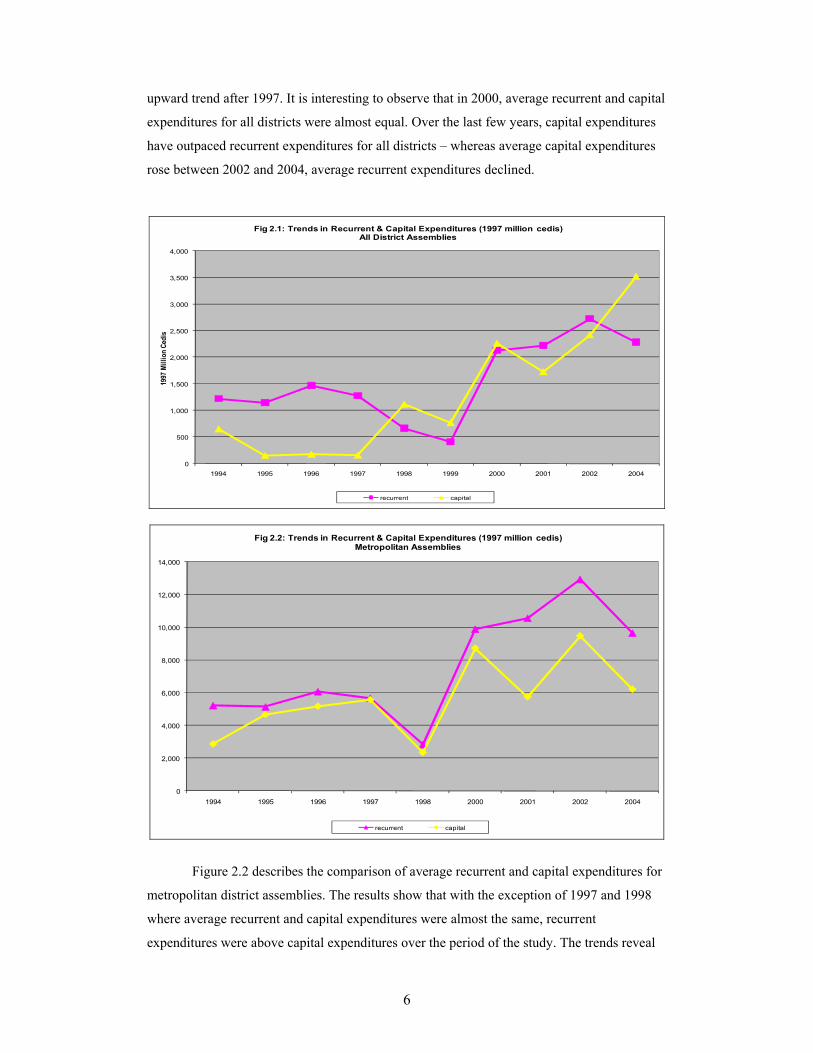
Figure 2.2 describes the comparison of average recurrent and capital expenditures for
metropolitan district assemblies. The results show that with the exception of 1997 and 1998
where average recurrent and capital expenditures were almost the same, recurrent
expenditures were above capital expenditures over the period of the study. The trends reveal
7
that both expenditures were relatively close for metropolitan DAs between 1994 and 2000.
After 2000 however, capital expenditures have lagged far behind recurrent expenditures in
these districts. Compared to Figure 2.7, it will be observed that miscellaneous expenditures
have formed a larger proportion of rising recurrent expenditures since 2000. It is worth noting
that it was only in metropolitan district assemblies that the two expenditure items declined
between 2002 and 2004 (see Figures 2.2, 2.3 and 2.4).
Fig 2.3: Trends in Recurrent & Capital Expenditures (1997 million cedis)Other Regional Capital Districts
0
500
1,000
1,500
2,000
2,500
3,000
3,500
4,000
1994 1995 1996 1997 1998 1999 2000 2001 2002 2004
recurrent development
0
500
1,000
1,500
2,000
2,500
3,000
3,500
1994 1995 1996 1997 1998 2000 2001 2002 2004
Fig 2.4: Trends in Recurrent & Capital Expenditures (1997 million cedis)Districts with No Urban Locality
recurrent capital
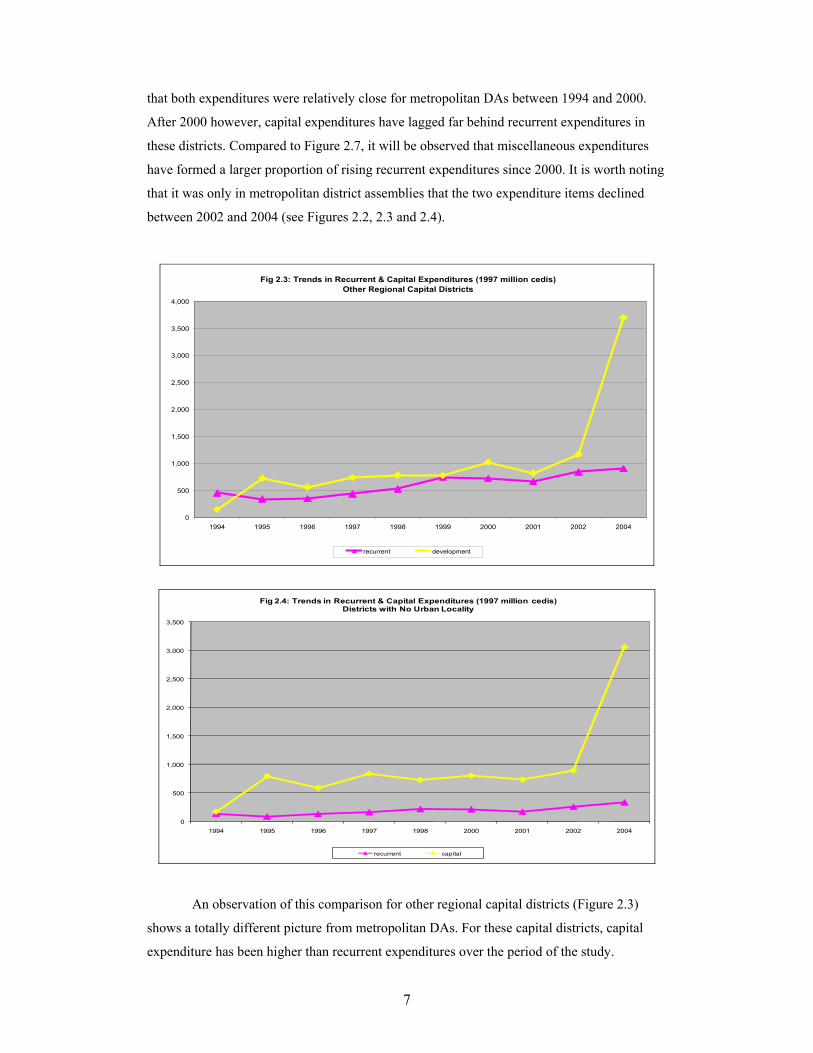
An observation of this comparison for other regional capital districts (Figure 2.3)
shows a totally different picture from metropolitan DAs. For these capital districts, capital
expenditure has been higher than recurrent expenditures over the period of the study.
8
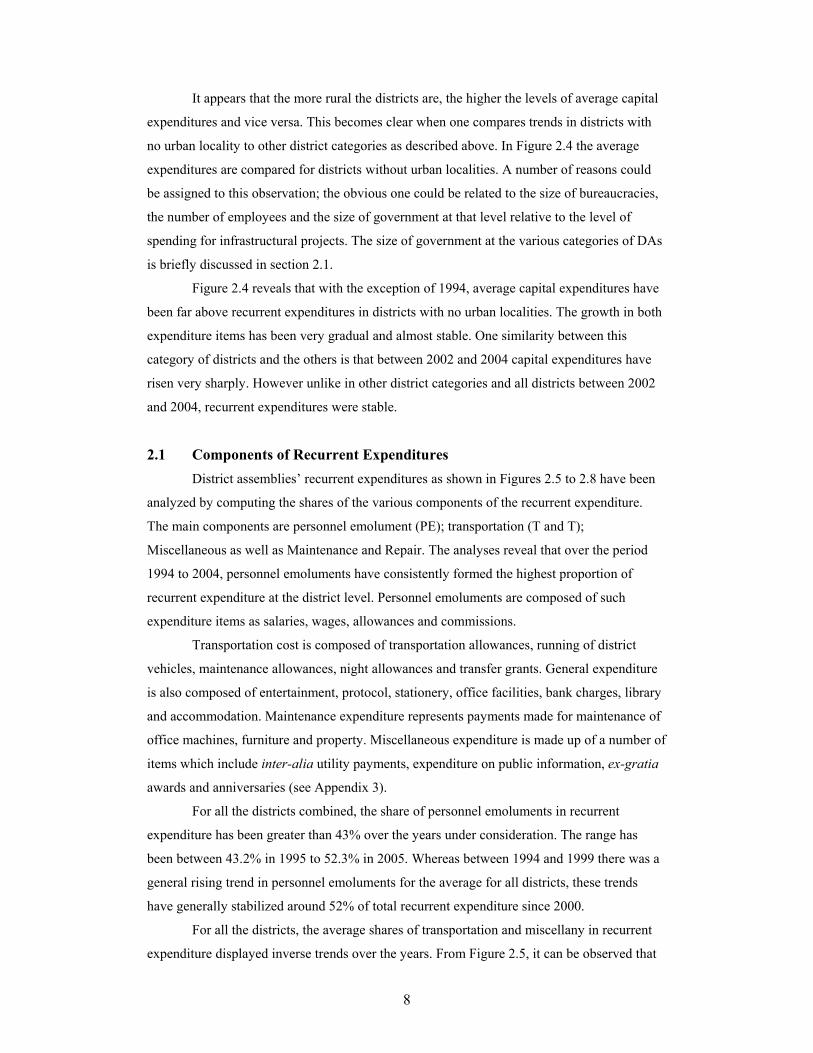
It appears that the more rural the districts are, the higher the levels of average capital
expenditures and vice versa. This becomes clear when one compares trends in districts with
no urban locality to other district categories as described above. In Figure 2.4 the average
expenditures are compared for districts without urban localities. A number of reasons could
be assigned to this observation; the obvious one could be related to the size of bureaucracies,
the number of employees and the size of government at that level relative to the level of
spending for infrastructural projects. The size of government at the various categories of DAs
is briefly discussed in section 2.1.
Figure 2.4 reveals that with the exception of 1994, average capital expenditures have
been far above recurrent expenditures in districts with no urban localities. The growth in both
expenditure items has been very gradual and almost stable. One similarity between this
category of districts and the others is that between 2002 and 2004 capital expenditures have
risen very sharply. However unlike in other district categories and all districts between 2002
and 2004, recurrent expenditures were stable.
2.1 Components of Recurrent Expenditures District assemblies’ recurrent expenditures as shown in Figures 2.5 to 2.8 have been
analyzed by computing the shares of the various components of the recurrent expenditure.
The main components are personnel emolument (PE); transportation (T and T);
Miscellaneous as well as Maintenance and Repair. The analyses reveal that over the period
1994 to 2004, personnel emoluments have consistently formed the highest proportion of
recurrent expenditure at the district level. Personnel emoluments are composed of such
expenditure items as salaries, wages, allowances and commissions.
Transportation cost is composed of transportation allowances, running of district
vehicles, maintenance allowances, night allowances and transfer grants. General expenditure
is also composed of entertainment, protocol, stationery, office facilities, bank charges, library
and accommodation. Maintenance expenditure represents payments made for maintenance of
office machines, furniture and property. Miscellaneous expenditure is made up of a number of
items which include inter-alia utility payments, expenditure on public information, ex-gratia
awards and anniversaries (see Appendix 3).
For all the districts combined, the share of personnel emoluments in recurrent
expenditure has been greater than 43% over the years under consideration. The range has
been between 43.2% in 1995 to 52.3% in 2005. Whereas between 1994 and 1999 there was a
general rising trend in personnel emoluments for the average for all districts, these trends
have generally stabilized around 52% of total recurrent expenditure since 2000.
For all the districts, the average shares of transportation and miscellany in recurrent
expenditure displayed inverse trends over the years. From Figure 2.5, it can be observed that
9
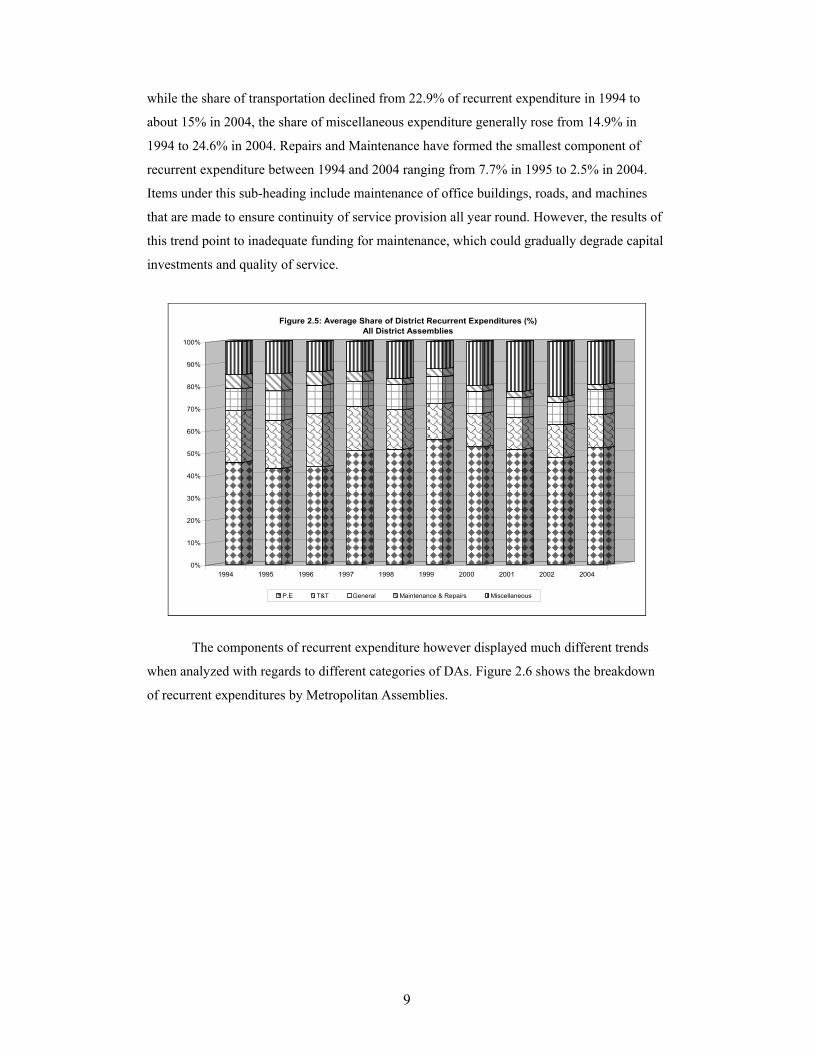
while the share of transportation declined from 22.9% of recurrent expenditure in 1994 to
about 15% in 2004, the share of miscellaneous expenditure generally rose from 14.9% in
1994 to 24.6% in 2004. Repairs and Maintenance have formed the smallest component of
recurrent expenditure between 1994 and 2004 ranging from 7.7% in 1995 to 2.5% in 2004.
Items under this sub-heading include maintenance of office buildings, roads, and machines
that are made to ensure continuity of service provision all year round. However, the results of
this trend point to inadequate funding for maintenance, which could gradually degrade capital
investments and quality of service.
0%
10%
20%
30%
40%
50%
60%
70%
80%
90%
100%
1994 1995 1996 1997 1998 1999 2000 2001 2002 2004
Figure 2.5: Average Share of District Recurrent Expenditures (%)All District Assemblies
P.E T&T General Maintenance & Repairs Miscellaneous
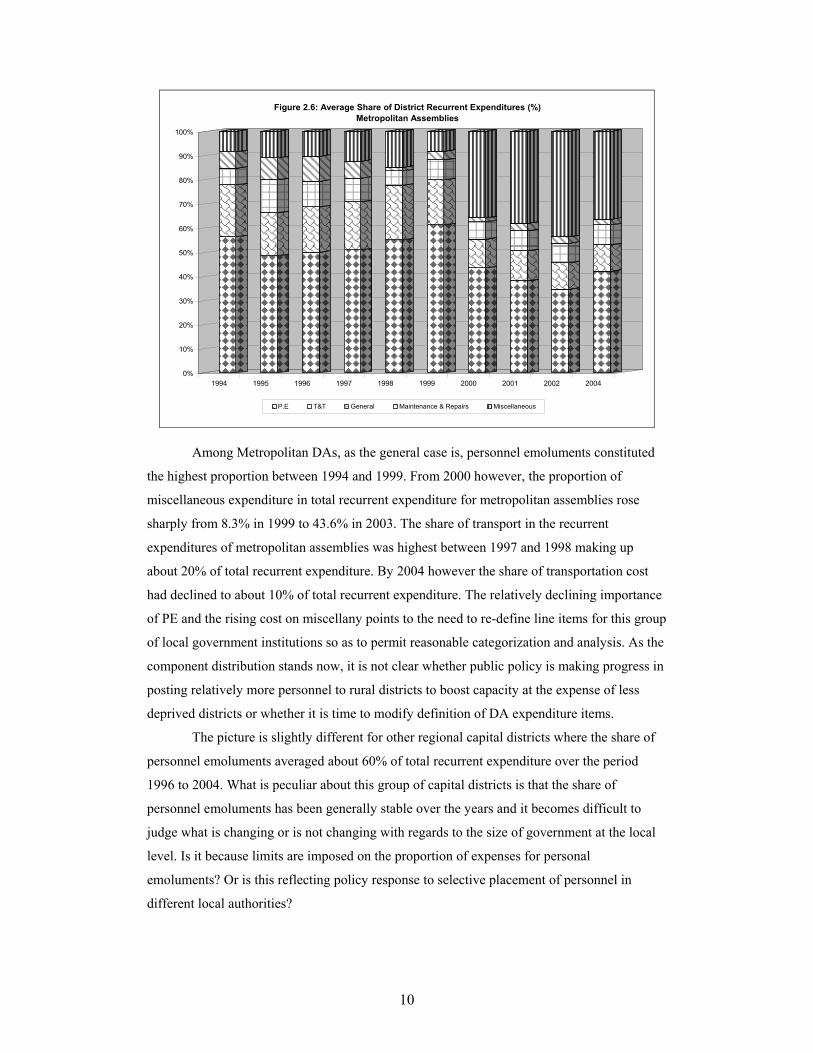
The components of recurrent expenditure however displayed much different trends
when analyzed with regards to different categories of DAs. Figure 2.6 shows the breakdown
of recurrent expenditures by Metropolitan Assemblies.
10
0%
10%
20%
30%
40%
50%
60%
70%
80%
90%
100%
1994 1995 1996 1997 1998 1999 2000 2001 2002 2004
Figure 2.6: Average Share of District Recurrent Expenditures (%)Metropolitan Assemblies
P.E T&T General Maintenance & Repairs Miscellaneous
Among Metropolitan DAs, as the general case is, personnel emoluments constituted
the highest proportion between 1994 and 1999. From 2000 however, the proportion of
miscellaneous expenditure in total recurrent expenditure for metropolitan assemblies rose
sharply from 8.3% in 1999 to 43.6% in 2003. The share of transport in the recurrent
expenditures of metropolitan assemblies was highest between 1997 and 1998 making up
about 20% of total recurrent expenditure. By 2004 however the share of transportation cost
had declined to about 10% of total recurrent expenditure. The relatively declining importance
of PE and the rising cost on miscellany points to the need to re-define line items for this group
of local government institutions so as to permit reasonable categorization and analysis. As the
component distribution stands now, it is not clear whether public policy is making progress in
posting relatively more personnel to rural districts to boost capacity at the expense of less
deprived districts or whether it is time to modify definition of DA expenditure items.
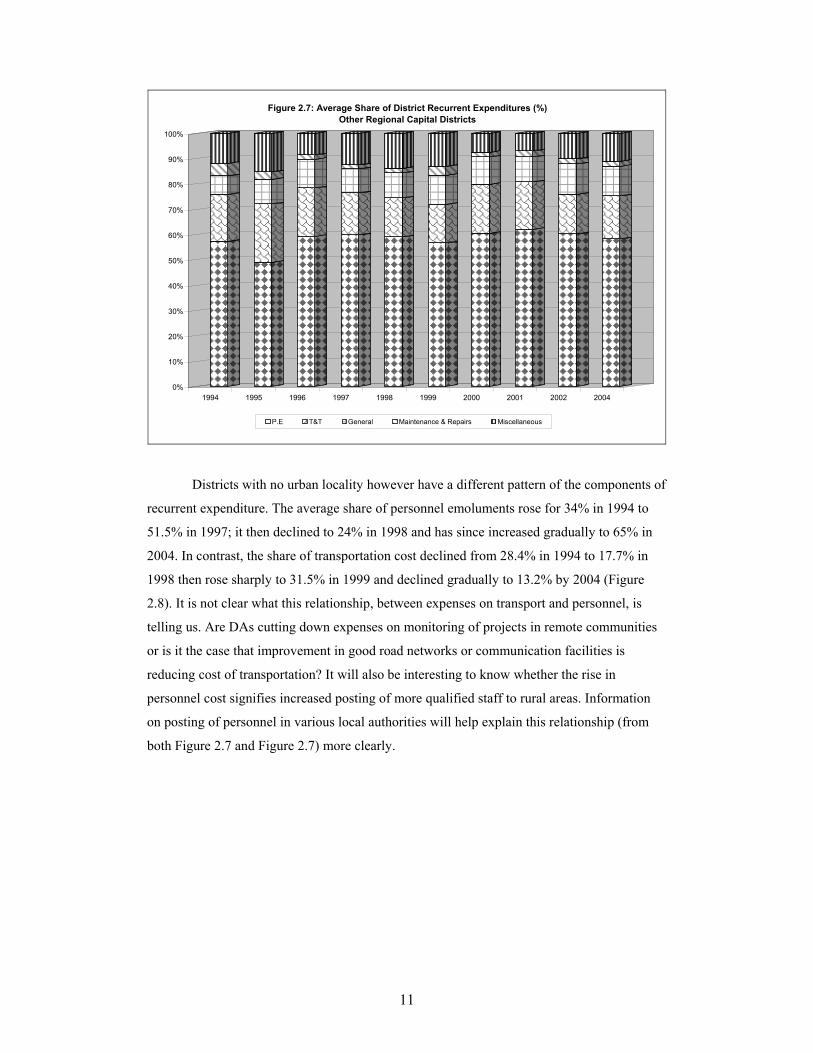
The picture is slightly different for other regional capital districts where the share of
personnel emoluments averaged about 60% of total recurrent expenditure over the period
1996 to 2004. What is peculiar about this group of capital districts is that the share of
personnel emoluments has been generally stable over the years and it becomes difficult to
judge what is changing or is not changing with regards to the size of government at the local
level. Is it because limits are imposed on the proportion of expenses for personal
emoluments? Or is this reflecting policy response to selective placement of personnel in
different local authorities?
11
0%
10%
20%
30%
40%
50%
60%
70%
80%
90%
100%
1994 1995 1996 1997 1998 1999 2000 2001 2002 2004
Figure 2.7: Average Share of District Recurrent Expenditures (%)Other Regional Capital Districts
P.E T&T General Maintenance & Repairs Miscellaneous
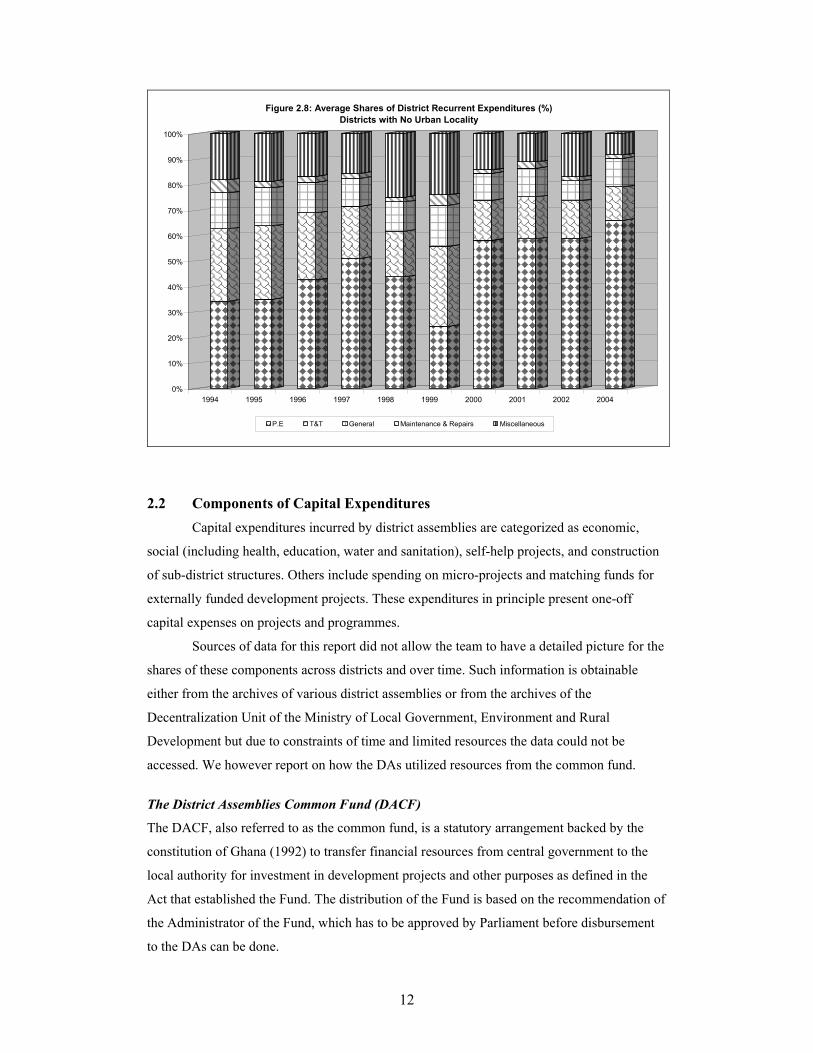
Districts with no urban locality however have a different pattern of the components of
recurrent expenditure. The average share of personnel emoluments rose for 34% in 1994 to
51.5% in 1997; it then declined to 24% in 1998 and has since increased gradually to 65% in
2004. In contrast, the share of transportation cost declined from 28.4% in 1994 to 17.7% in
1998 then rose sharply to 31.5% in 1999 and declined gradually to 13.2% by 2004 (Figure
2.8). It is not clear what this relationship, between expenses on transport and personnel, is
telling us. Are DAs cutting down expenses on monitoring of projects in remote communities
or is it the case that improvement in good road networks or communication facilities is
reducing cost of transportation? It will also be interesting to know whether the rise in
personnel cost signifies increased posting of more qualified staff to rural areas. Information
on posting of personnel in various local authorities will help explain this relationship (from
both Figure 2.7 and Figure 2.7) more clearly.
12
0%
10%
20%
30%
40%
50%
60%
70%
80%
90%
100%
1994 1995 1996 1997 1998 1999 2000 2001 2002 2004
Figure 2.8: Average Shares of District Recurrent Expenditures (%)Districts with No Urban Locality
P.E T&T General Maintenance & Repairs Miscellaneous
2.2 Components of Capital Expenditures
Capital expenditures incurred by district assemblies are categorized as economic,
social (including health, education, water and sanitation), self-help projects, and construction
of sub-district structures. Others include spending on micro-projects and matching funds for
externally funded development projects. These expenditures in principle present one-off
capital expenses on projects and programmes.
Sources of data for this report did not allow the team to have a detailed picture for the
shares of these components across districts and over time. Such information is obtainable
either from the archives of various district assemblies or from the archives of the
Decentralization Unit of the Ministry of Local Government, Environment and Rural
Development but due to constraints of time and limited resources the data could not be
accessed. We however report on how the DAs utilized resources from the common fund.
The District Assemblies Common Fund (DACF)
The DACF, also referred to as the common fund, is a statutory arrangement backed by the
constitution of Ghana (1992) to transfer financial resources from central government to the
local authority for investment in development projects and other purposes as defined in the
Act that established the Fund. The distribution of the Fund is based on the recommendation of
the Administrator of the Fund, which has to be approved by Parliament before disbursement
to the DAs can be done.
13
Guidelines for the use of the common fund
Since the year 2003, poverty situation in a particular DA has been added to the
original four factors that are used as criteria for the distribution of DACF to DAs. The factors
have various levels of weight and by design the weights are varied according to the proposal
of the administrator based on various levels of consultations. We outline the rational for the
factors used and details about their respective weights can be found in Table 2.3:
The Need Factor: This is set to address the imbalance in development and infrastructure
among the districts. The level of need is determined from the GDP per capita;
The Equalizing Factor: This is aimed at ensuring that DAs have a minimum allocation
from the fund;
The Responsive Factor: This is the rewarding factor for DAs that have done well in
revenue collection in terms of per capita revenue collected;
The Service Pressure Factor: This factor serves to compensate for population pressure
on facilities; and
The Poverty Factor: This was set in line with the Ghana Poverty Reduction Strategy
(GPRS) to make the DACF allocation more pro-poor. The factor allocates a little bit
more resources to less deprived districts.
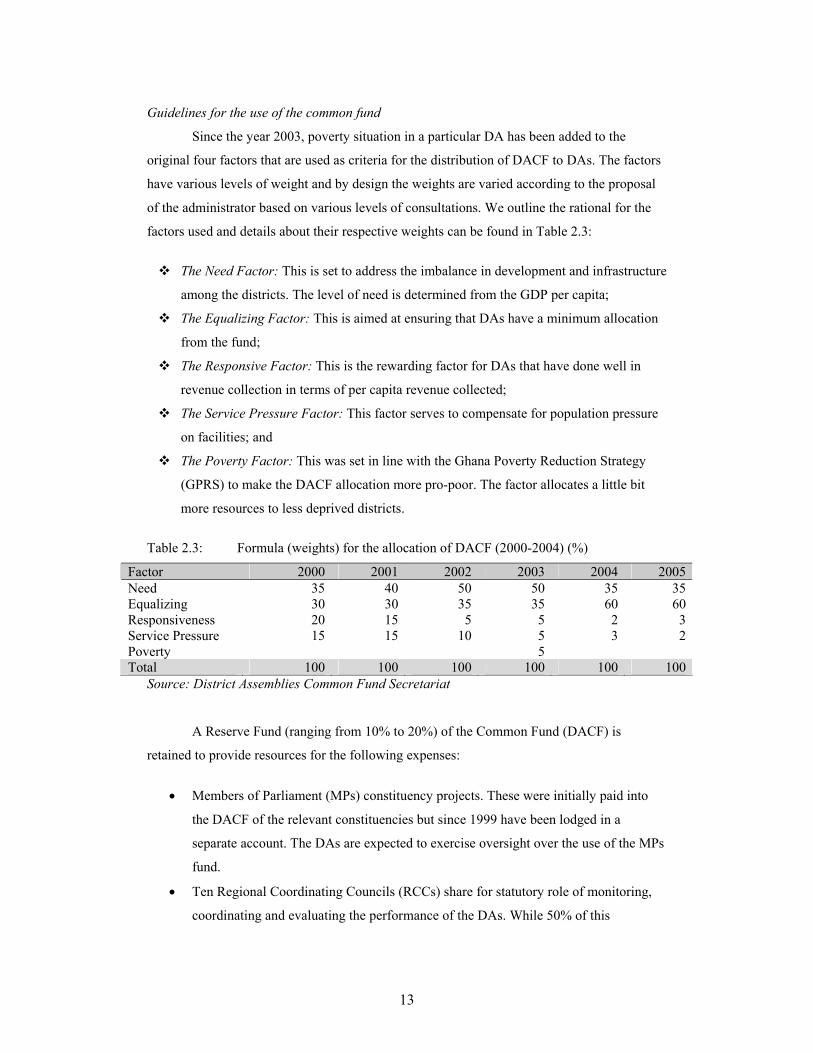
Table 2.3: Formula (weights) for the allocation of DACF (2000-2004) (%)
Factor 2000 2001 2002 2003 2004 2005Need 35 40 50 50 35 35Equalizing 30 30 35 35 60 60Responsiveness 20 15 5 5 2 3Service Pressure 15 15 10 5 3 2Poverty 5 Total 100 100 100 100 100 100
Source: District Assemblies Common Fund Secretariat
A Reserve Fund (ranging from 10% to 20%) of the Common Fund (DACF) is
retained to provide resources for the following expenses:
• Members of Parliament (MPs) constituency projects. These were initially paid into
the DACF of the relevant constituencies but since 1999 have been lodged in a
separate account. The DAs are expected to exercise oversight over the use of the MPs
fund.
• Ten Regional Coordinating Councils (RCCs) share for statutory role of monitoring,
coordinating and evaluating the performance of the DAs. While 50% of this
14
allocation is shared equally to all the RCCs, the other 50% is shared proportionally to
the regions using the number of districts in each region as a basis.
• Separate allocation for sanitation, rural/feeder roads, rural health, housing and
telecommunications. This allocation is meant to be used as counterpart funding of
projects co-financed with donors and also to fund emergencies.
• The office of the Administrator’s allocation for monitoring of its activities. The Reserve Fund is often deducted before the Formula is applied to the remaining
quantum of money. Even though a formula is used to allocate the Fund, actual utilization in a
year depends on the DAs’ timely submission of proposals (based on their development plans)
to the Administrator and the level of projected revenue that could be realized in the year. The
DACF is often accompanied with guidelines on spending at the district level. Though some
variations exist over the years in the guidelines, on the average, about 41% of the DACF has
often been predetermined for districts as in the following areas:
• Not less 2% as district education fund for needy but brilliant students
• 10% for self-help projects
• 20% for productivity improvement and employment generation
• 1% for HVI/AIDS
• 1% for malaria control
• 5% to support sub district structures
• 2% for capacity building programmes by Institute of Local Government Studies
The other 59 has often been directed to be spent in the economic, social, environment
and other local government expenditures (2005 DACF guidelines).
Monies are released on quarterly basis after revenue has been collected, implying that
one year’s final quarter money can only be received in the subsequent year. There are
instances when further delays in the allocation and disbursements of the Fund to the District
Assemblies occurred but statutory requirement of setting aside 5% of all tax revenue for the
DACF has broadly been followed, sometimes (i.e. 1995 and 1996) exceeding the required
amount (ISODEC, 2005).
There is the need to exercise caution in looking at the relationship between capital
expenditures and utilized DACF at the early stages of the implementation of the common
15
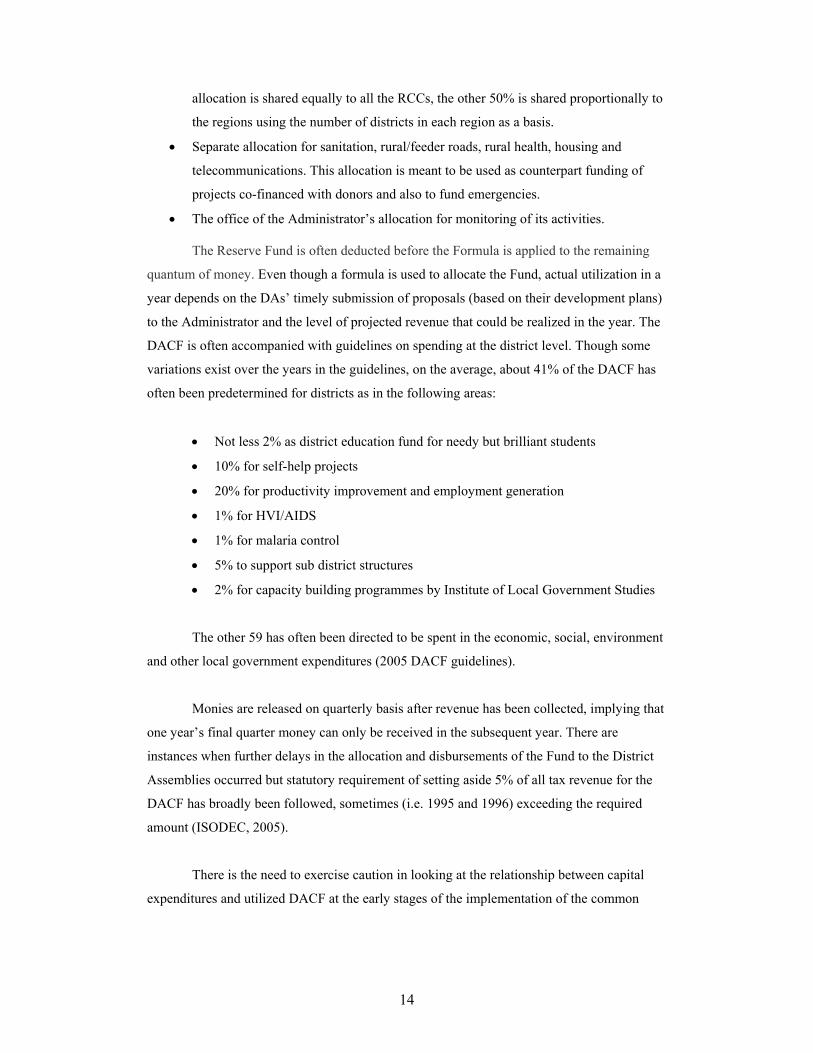
fund policy4. Analysis of the relationship between utilization of DACF and total expenses on
capital items shows that the amount of money received from the common fund and spent by
the district assemblies was far more than what the assemblies needed to finance their capital
expenditures before 1998. For example in 1996, the average ratios of utilized DACF to total
capital expenditures were 3 and 6 times for the metropolitan assemblies and for the other
assemblies respectively. These ratios rose substantially in 1997 but have since 1998 been
declining remarkably (Figure 2.9).
0.0
1.0
2.0
3.0
4.0
5.0
6.0
7.0
8.0
9.0
10.0
11.0
1996 1997 1998 2000 2001 2002 2004
Num
ber o
f tim
es
Fig 2.9: Ratio of Utilized DACF to Capital Expenditures
Metros Other Regional Capitals Districts with no urban locality
It is not very clear as to how the amount of money utilized from the DACF was
captured in the capital expenditures components. It could also mean that other inflows from
development partners and HIPC sources to finance development activities in recent times
have led to substantial reduction of the ratio of DACF to capital expenditures to levels much
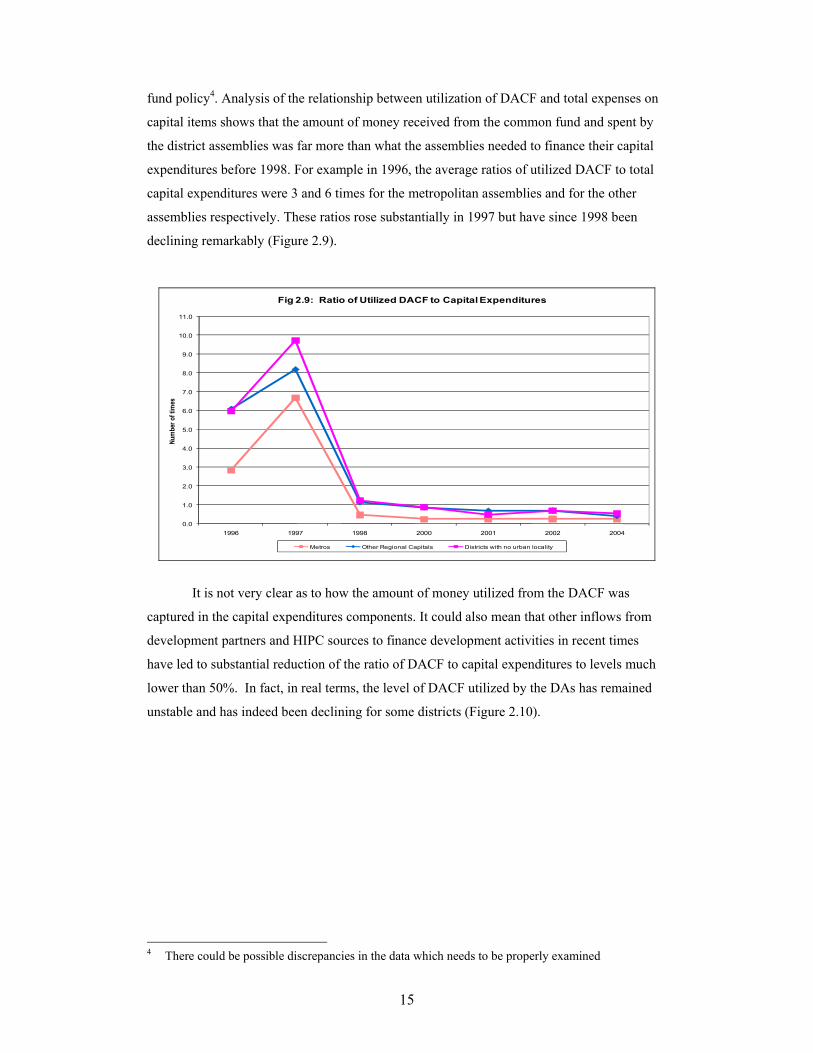
lower than 50%. In fact, in real terms, the level of DACF utilized by the DAs has remained
unstable and has indeed been declining for some districts (Figure 2.10).
4 There could be possible discrepancies in the data which needs to be properly examined
16
0.0
500.0
1,000.0
1,500.0
2,000.0
2,500.0
3,000.0
3,500.0
4,000.0
1996 1997 1998 1999 2000 2001 2002 2003 2004
1997
Mill
ion
Cedi
s
Fig 2.10: Trends in Utilized DACF(Metropolitan Assemblies)
health education total
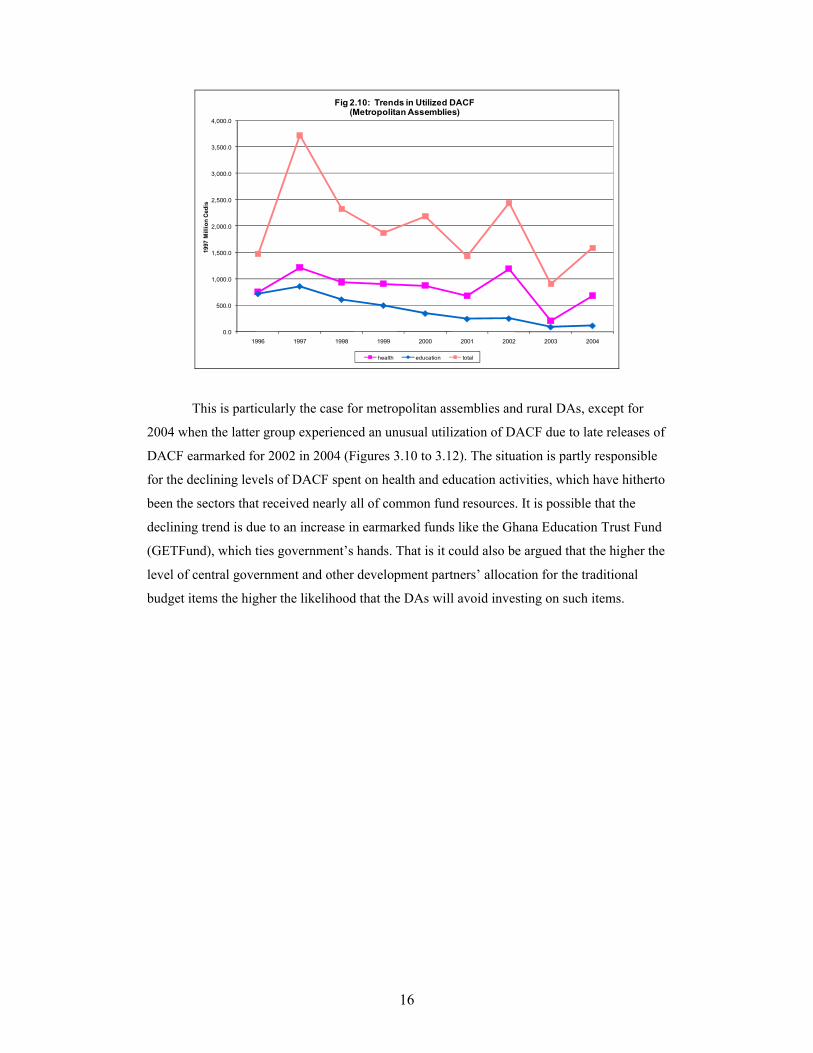
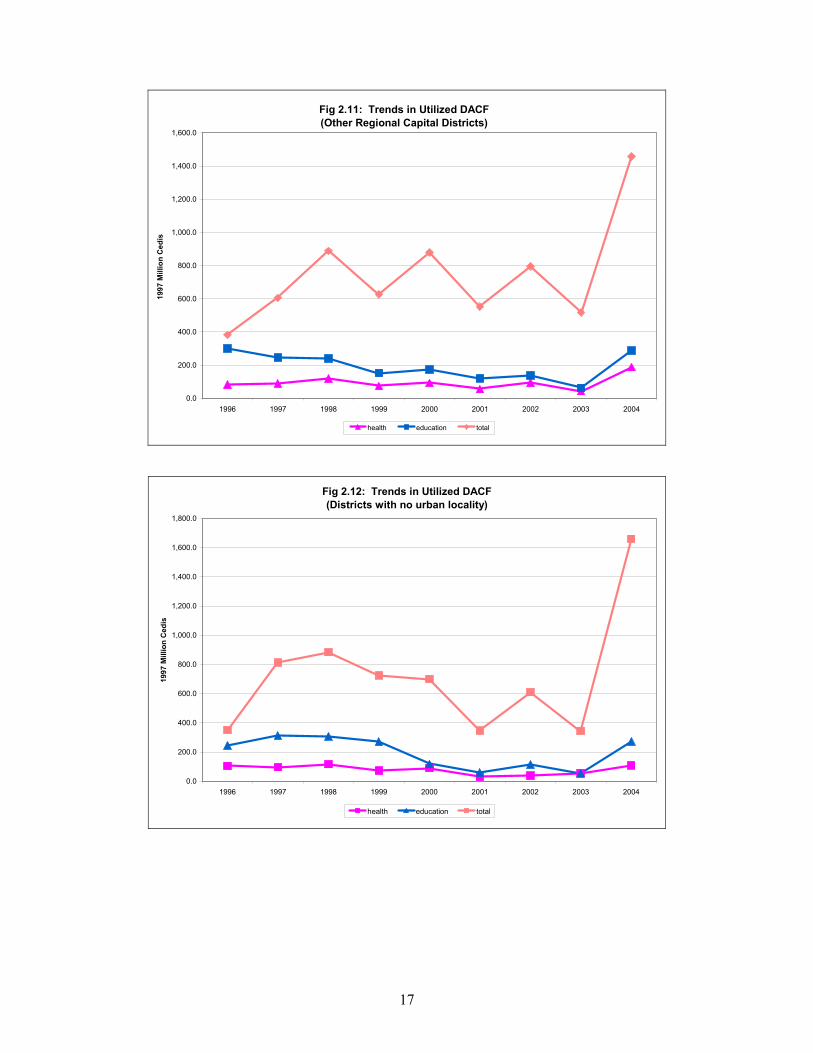
This is particularly the case for metropolitan assemblies and rural DAs, except for
2004 when the latter group experienced an unusual utilization of DACF due to late releases of
DACF earmarked for 2002 in 2004 (Figures 3.10 to 3.12). The situation is partly responsible
for the declining levels of DACF spent on health and education activities, which have hitherto
been the sectors that received nearly all of common fund resources. It is possible that the
declining trend is due to an increase in earmarked funds like the Ghana Education Trust Fund
(GETFund), which ties government’s hands. That is it could also be argued that the higher the
level of central government and other development partners’ allocation for the traditional
budget items the higher the likelihood that the DAs will avoid investing on such items.
17
Fig 2.11: Trends in Utilized DACF(Other Regional Capital Districts)
0.0
200.0
400.0
600.0
800.0
1,000.0
1,200.0
1,400.0
1,600.0
1996 1997 1998 1999 2000 2001 2002 2003 2004
1997
Mill
ion
Ced
is
health education total
Fig 2.12: Trends in Utilized DACF(Districts with no urban locality)
0.0
200.0
400.0
600.0
800.0
1,000.0
1,200.0
1,400.0
1,600.0
1,800.0
1996 1997 1998 1999 2000 2001 2002 2003 2004
1997
Mill
ion
Ced
is
health education total
18
3. TRENDS IN KEY SOURCES OF FUNDING FOR DISTRICT ASSEMBLIES
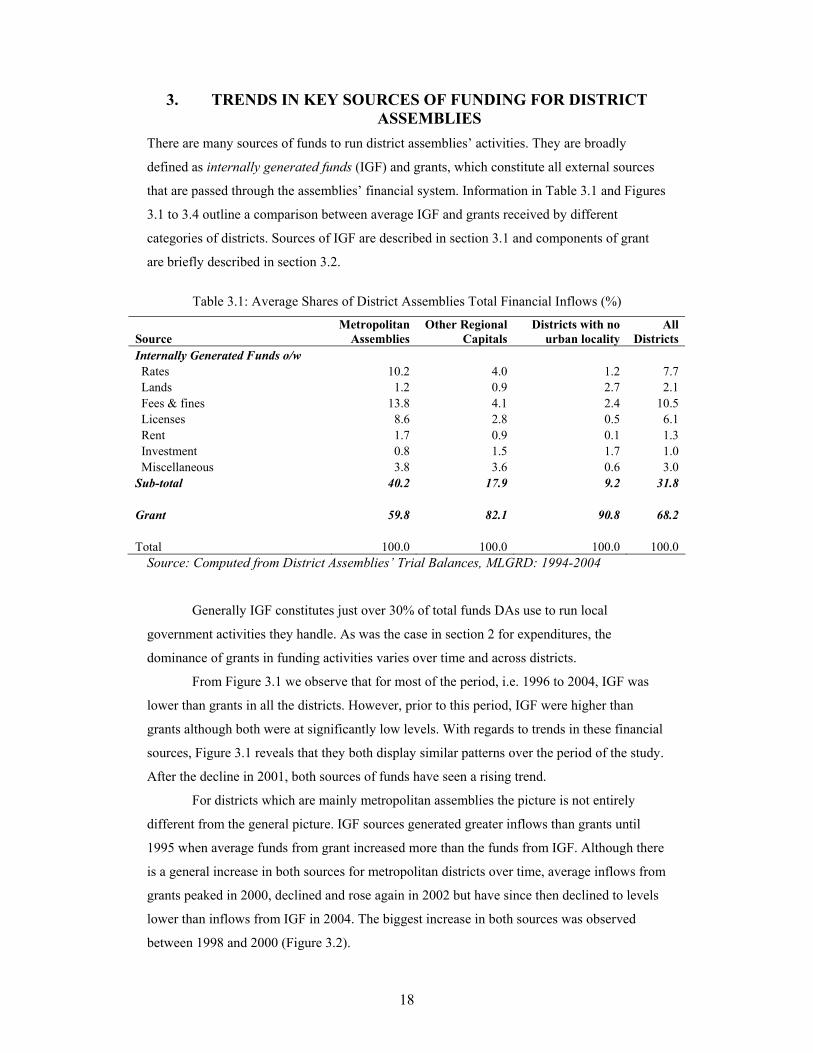
There are many sources of funds to run district assemblies’ activities. They are broadly
defined as internally generated funds (IGF) and grants, which constitute all external sources
that are passed through the assemblies’ financial system. Information in Table 3.1 and Figures
3.1 to 3.4 outline a comparison between average IGF and grants received by different
categories of districts. Sources of IGF are described in section 3.1 and components of grant
are briefly described in section 3.2.
Table 3.1: Average Shares of District Assemblies Total Financial Inflows (%)
Source Metropolitan
Assemblies Other Regional
Capitals Districts with no
urban locality All
Districts Internally Generated Funds o/w Rates 10.2 4.0 1.2 7.7 Lands 1.2 0.9 2.7 2.1 Fees & fines 13.8 4.1 2.4 10.5 Licenses 8.6 2.8 0.5 6.1 Rent 1.7 0.9 0.1 1.3 Investment 0.8 1.5 1.7 1.0 Miscellaneous 3.8 3.6 0.6 3.0 Sub-total 40.2 17.9 9.2 31.8 Grant 59.8 82.1 90.8 68.2 Total 100.0 100.0 100.0 100.0
Source: Computed from District Assemblies’ Trial Balances, MLGRD: 1994-2004
Generally IGF constitutes just over 30% of total funds DAs use to run local
government activities they handle. As was the case in section 2 for expenditures, the
dominance of grants in funding activities varies over time and across districts.
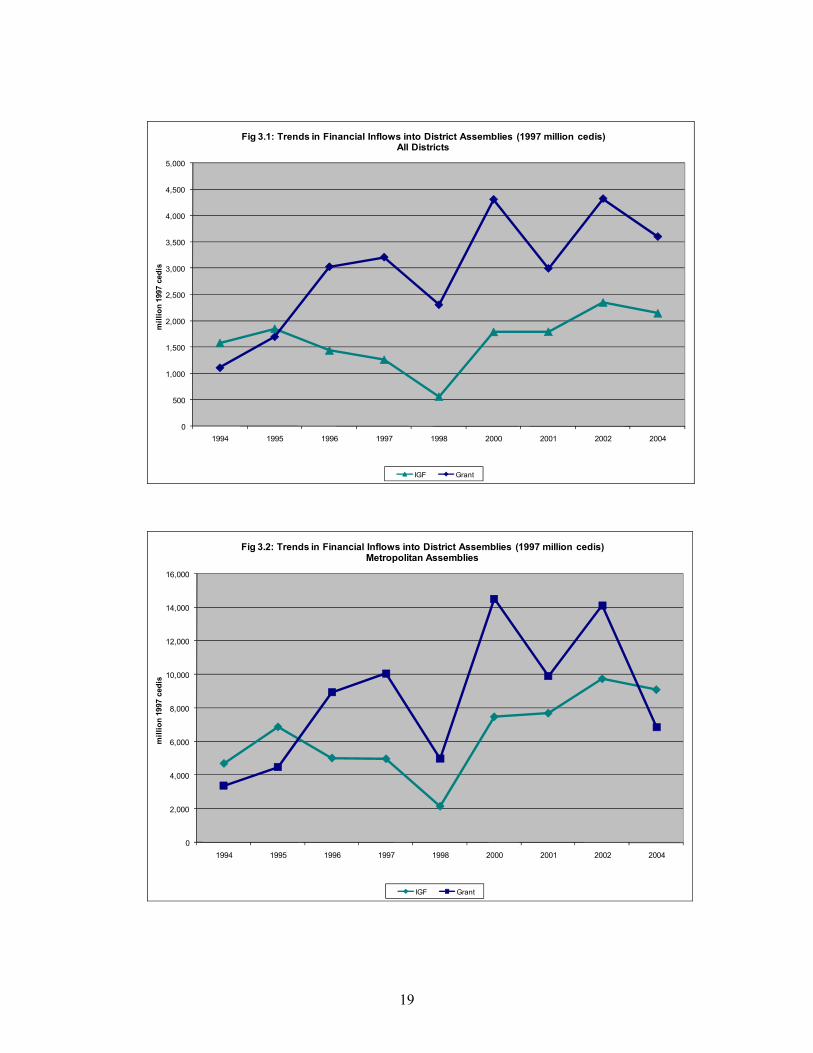
From Figure 3.1 we observe that for most of the period, i.e. 1996 to 2004, IGF was
lower than grants in all the districts. However, prior to this period, IGF were higher than
grants although both were at significantly low levels. With regards to trends in these financial
sources, Figure 3.1 reveals that they both display similar patterns over the period of the study.
After the decline in 2001, both sources of funds have seen a rising trend.
For districts which are mainly metropolitan assemblies the picture is not entirely
different from the general picture. IGF sources generated greater inflows than grants until
1995 when average funds from grant increased more than the funds from IGF. Although there
is a general increase in both sources for metropolitan districts over time, average inflows from
grants peaked in 2000, declined and rose again in 2002 but have since then declined to levels
lower than inflows from IGF in 2004. The biggest increase in both sources was observed
between 1998 and 2000 (Figure 3.2).
19
0
500
1,000
1,500
2,000
2,500
3,000
3,500
4,000
4,500
5,000
1994 1995 1996 1997 1998 2000 2001 2002 2004
mill
ion
1997
ced
is
Fig 3.1: Trends in Financial Inflows into District Assemblies (1997 million cedis)All Districts
IGF Grant
0
2,000
4,000
6,000
8,000
10,000
12,000
14,000
16,000
1994 1995 1996 1997 1998 2000 2001 2002 2004
mill
ion
1997
ced
is
Fig 3.2: Trends in Financial Inflows into District Assemblies (1997 million cedis)Metropolitan Assemblies
IGF Grant
20
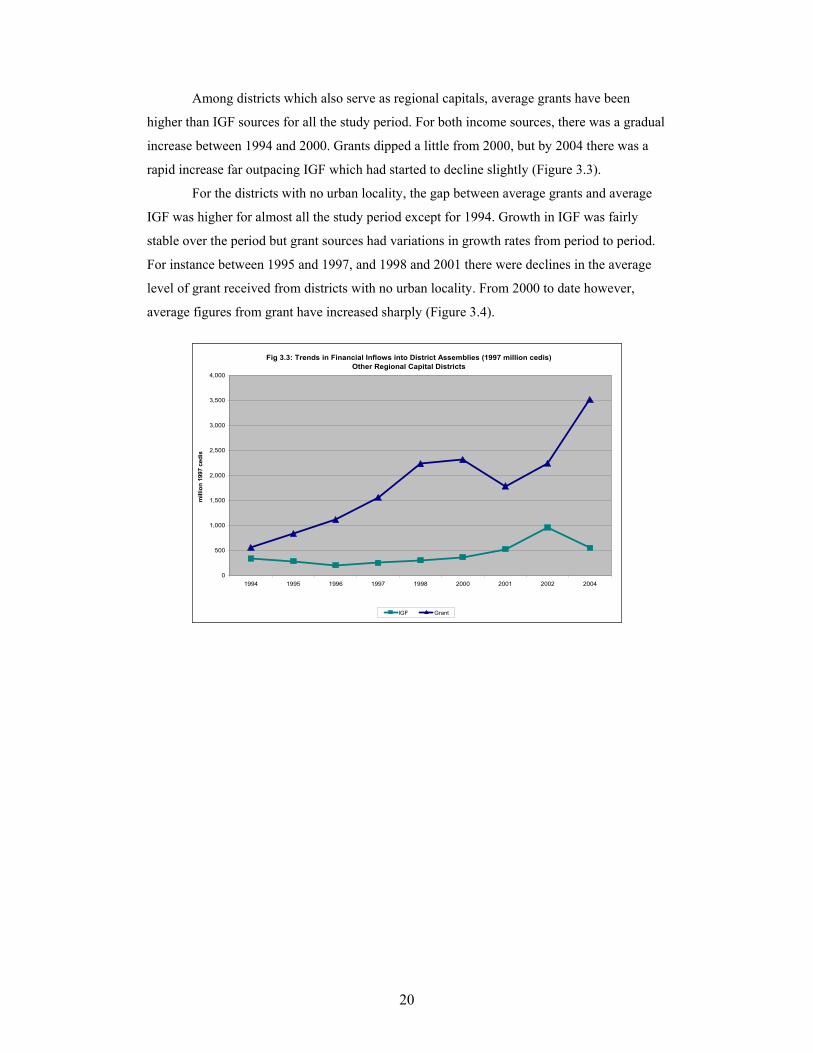
Among districts which also serve as regional capitals, average grants have been
higher than IGF sources for all the study period. For both income sources, there was a gradual
increase between 1994 and 2000. Grants dipped a little from 2000, but by 2004 there was a
rapid increase far outpacing IGF which had started to decline slightly (Figure 3.3).
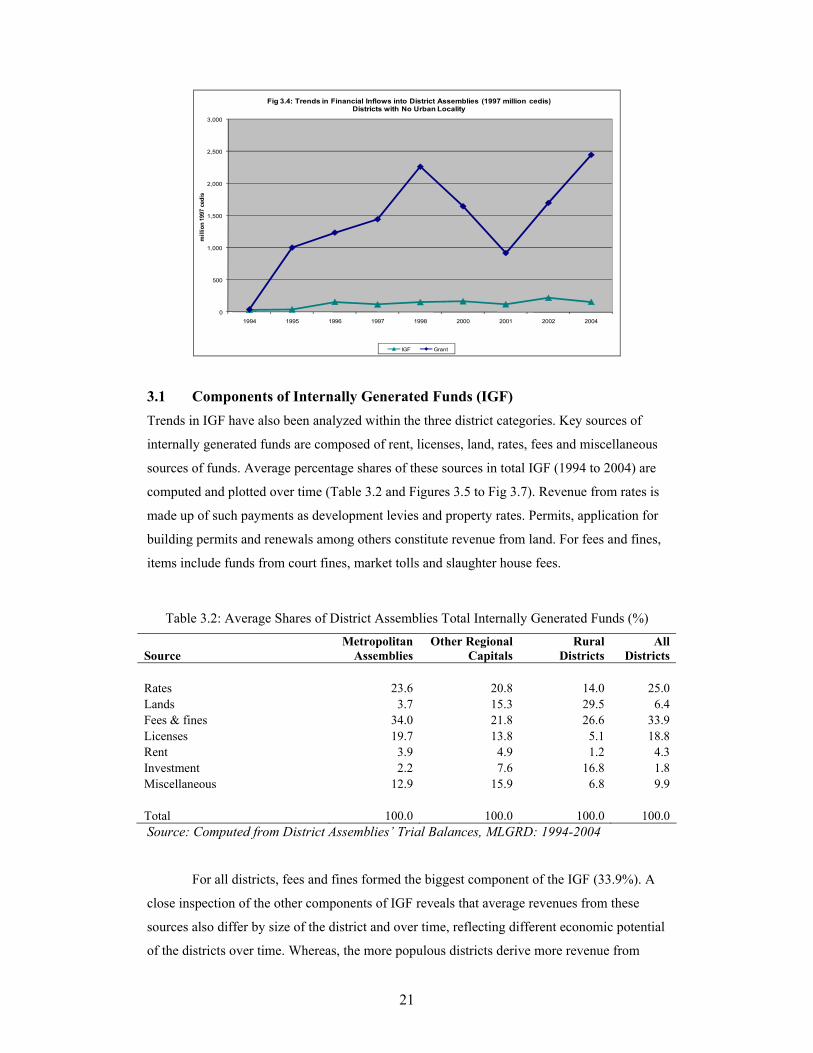
For the districts with no urban locality, the gap between average grants and average
IGF was higher for almost all the study period except for 1994. Growth in IGF was fairly
stable over the period but grant sources had variations in growth rates from period to period.
For instance between 1995 and 1997, and 1998 and 2001 there were declines in the average
level of grant received from districts with no urban locality. From 2000 to date however,
average figures from grant have increased sharply (Figure 3.4).
Fig 3.3: Trends in Financial Inflows into District Assemblies (1997 million cedis)
Other Regional Capital Districts
0
500
1,000
1,500
2,000
2,500
3,000
3,500
4,000
1994 1995 1996 1997 1998 2000 2001 2002 2004
mill
ion
1997
ced
is
IGF Grant
21
0
500
1,000
1,500
2,000
2,500
3,000
1994 1995 1996 1997 1998 2000 2001 2002 2004
mill
ion
1997
ced
is
Fig 3.4: Trends in Financial Inflows into District Assemblies (1997 million cedis)Districts with No Urban Locality
IGF Grant
3.1 Components of Internally Generated Funds (IGF) Trends in IGF have also been analyzed within the three district categories. Key sources of
internally generated funds are composed of rent, licenses, land, rates, fees and miscellaneous
sources of funds. Average percentage shares of these sources in total IGF (1994 to 2004) are
computed and plotted over time (Table 3.2 and Figures 3.5 to Fig 3.7). Revenue from rates is
made up of such payments as development levies and property rates. Permits, application for
building permits and renewals among others constitute revenue from land. For fees and fines,
items include funds from court fines, market tolls and slaughter house fees.
Table 3.2: Average Shares of District Assemblies Total Internally Generated Funds (%)
Source Metropolitan
Assemblies Other Regional
Capitals Rural
Districts All
Districts Rates 23.6 20.8 14.0 25.0 Lands 3.7 15.3 29.5 6.4 Fees & fines 34.0 21.8 26.6 33.9 Licenses 19.7 13.8 5.1 18.8 Rent 3.9 4.9 1.2 4.3 Investment 2.2 7.6 16.8 1.8 Miscellaneous 12.9 15.9 6.8 9.9 Total 100.0 100.0 100.0 100.0 Source: Computed from District Assemblies’ Trial Balances, MLGRD: 1994-2004
For all districts, fees and fines formed the biggest component of the IGF (33.9%). A
close inspection of the other components of IGF reveals that average revenues from these
sources also differ by size of the district and over time, reflecting different economic potential
of the districts over time. Whereas, the more populous districts derive more revenue from
22
fees, fines, rates and licenses, the rural districts in particular have received relatively more
revenue from lands and what is termed as investment, which includes returns from bank
interests on unused DACF money and collection of tolls from assembly’s micro-projects like
public toilets.
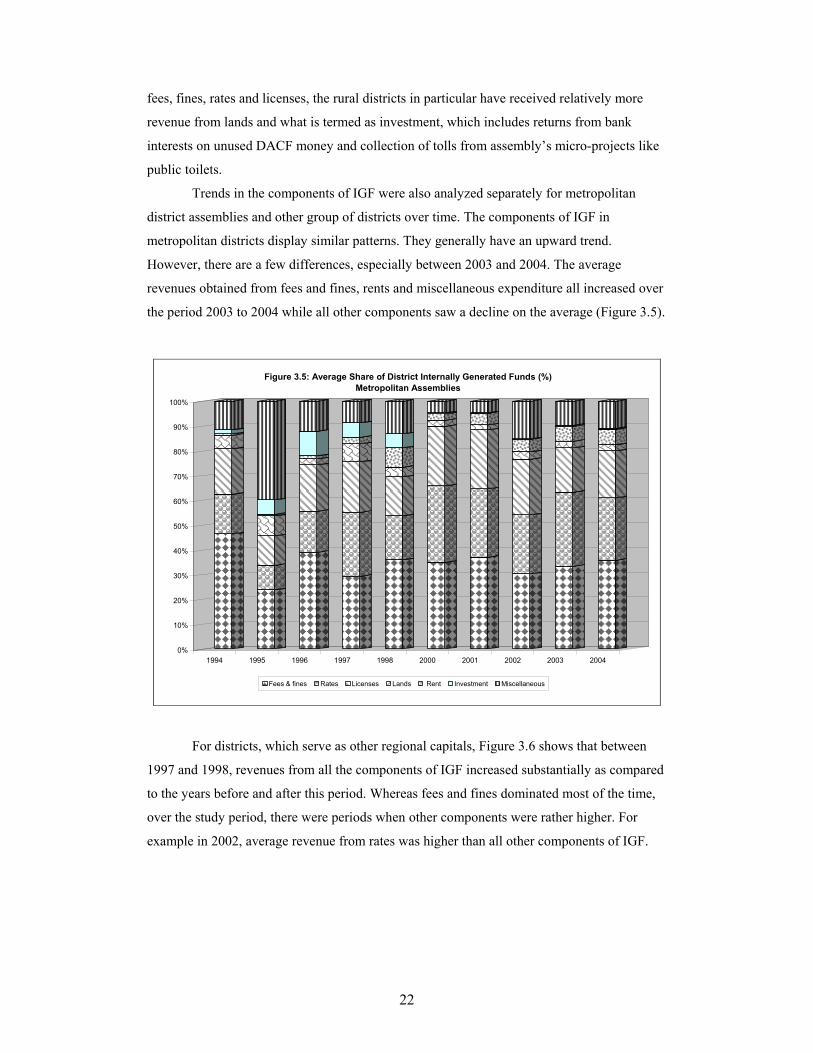
Trends in the components of IGF were also analyzed separately for metropolitan
district assemblies and other group of districts over time. The components of IGF in
metropolitan districts display similar patterns. They generally have an upward trend.
However, there are a few differences, especially between 2003 and 2004. The average
revenues obtained from fees and fines, rents and miscellaneous expenditure all increased over
the period 2003 to 2004 while all other components saw a decline on the average (Figure 3.5).
0%
10%
20%
30%
40%
50%
60%
70%
80%
90%
100%
1994 1995 1996 1997 1998 2000 2001 2002 2003 2004
Figure 3.5: Average Share of District Internally Generated Funds (%)Metropolitan Assemblies
Fees & fines Rates Licenses Lands Rent Investment Miscellaneous
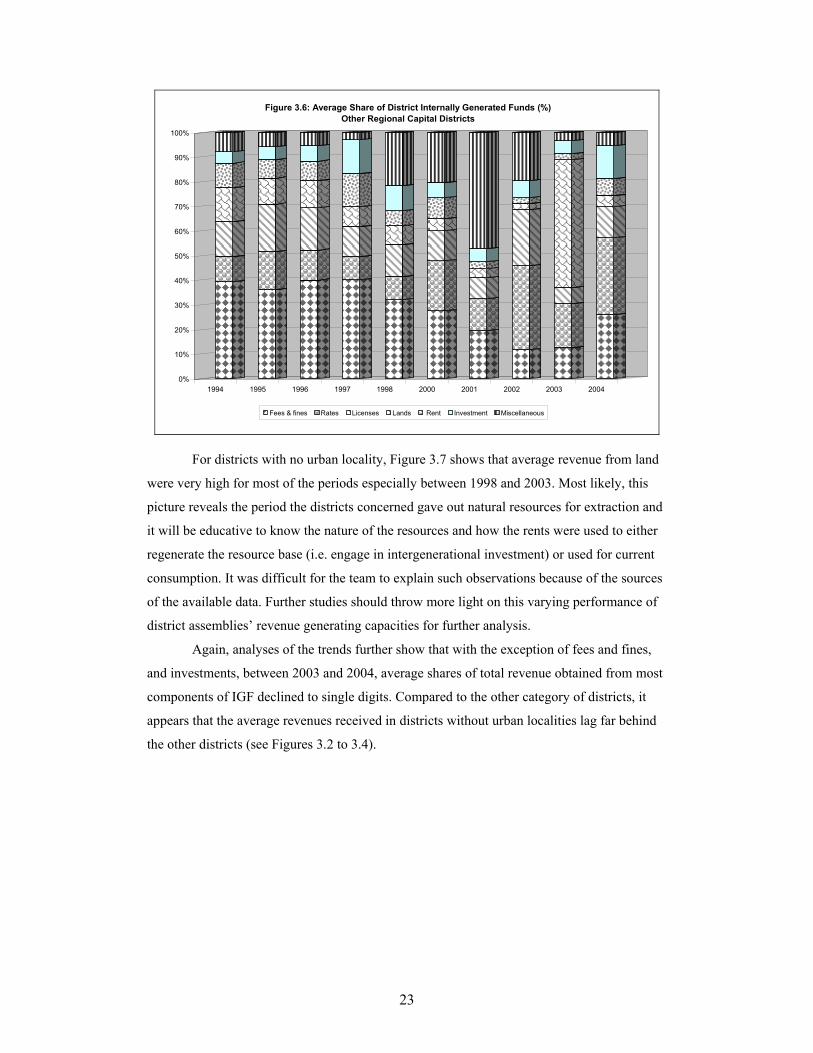
For districts, which serve as other regional capitals, Figure 3.6 shows that between
1997 and 1998, revenues from all the components of IGF increased substantially as compared
to the years before and after this period. Whereas fees and fines dominated most of the time,
over the study period, there were periods when other components were rather higher. For
example in 2002, average revenue from rates was higher than all other components of IGF.
23
0%
10%
20%
30%
40%
50%
60%
70%
80%
90%
100%
1994 1995 1996 1997 1998 2000 2001 2002 2003 2004
Figure 3.6: Average Share of District Internally Generated Funds (%)Other Regional Capital Districts
Fees & fines Rates Licenses Lands Rent Investment Miscellaneous
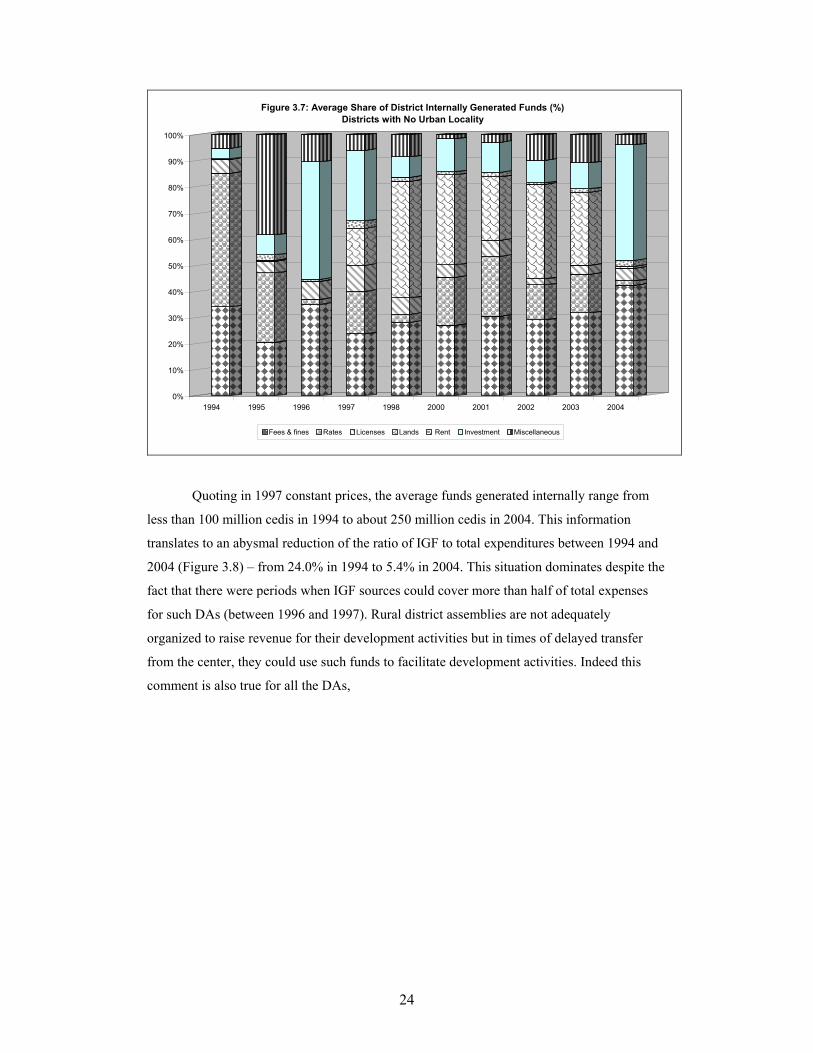
For districts with no urban locality, Figure 3.7 shows that average revenue from land
were very high for most of the periods especially between 1998 and 2003. Most likely, this
picture reveals the period the districts concerned gave out natural resources for extraction and
it will be educative to know the nature of the resources and how the rents were used to either
regenerate the resource base (i.e. engage in intergenerational investment) or used for current
consumption. It was difficult for the team to explain such observations because of the sources
of the available data. Further studies should throw more light on this varying performance of
district assemblies’ revenue generating capacities for further analysis.
Again, analyses of the trends further show that with the exception of fees and fines,
and investments, between 2003 and 2004, average shares of total revenue obtained from most
components of IGF declined to single digits. Compared to the other category of districts, it
appears that the average revenues received in districts without urban localities lag far behind
the other districts (see Figures 3.2 to 3.4).
24
0%
10%
20%
30%
40%
50%
60%
70%
80%
90%
100%
1994 1995 1996 1997 1998 2000 2001 2002 2003 2004
Figure 3.7: Average Share of District Internally Generated Funds (%)Districts with No Urban Locality
Fees & fines Rates Licenses Lands Rent Investment Miscellaneous
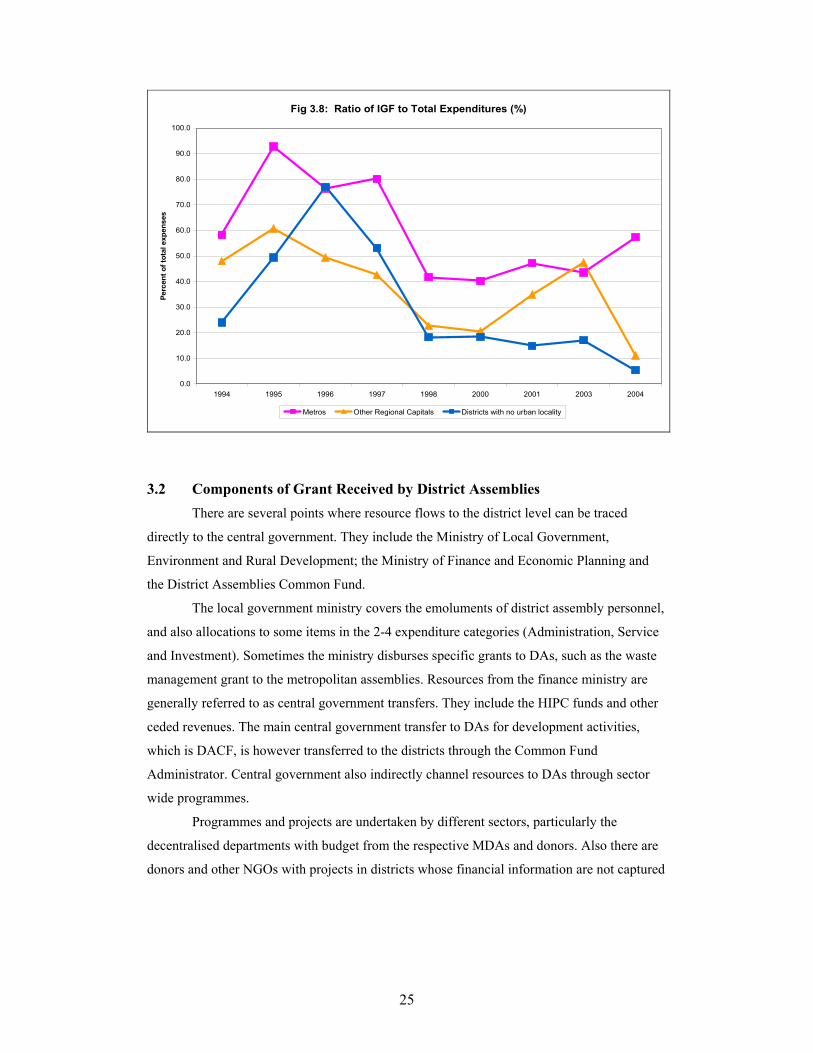
Quoting in 1997 constant prices, the average funds generated internally range from
less than 100 million cedis in 1994 to about 250 million cedis in 2004. This information
translates to an abysmal reduction of the ratio of IGF to total expenditures between 1994 and
2004 (Figure 3.8) – from 24.0% in 1994 to 5.4% in 2004. This situation dominates despite the
fact that there were periods when IGF sources could cover more than half of total expenses
for such DAs (between 1996 and 1997). Rural district assemblies are not adequately
organized to raise revenue for their development activities but in times of delayed transfer
from the center, they could use such funds to facilitate development activities. Indeed this
comment is also true for all the DAs,
25
Fig 3.8: Ratio of IGF to Total Expenditures (%)
0.0
10.0
20.0
30.0
40.0
50.0
60.0
70.0
80.0
90.0
100.0
1994 1995 1996 1997 1998 2000 2001 2003 2004
Perc
ent o
f tot
al e
xpen
ses
Metros Other Regional Capitals Districts with no urban locality
3.2 Components of Grant Received by District Assemblies
There are several points where resource flows to the district level can be traced
directly to the central government. They include the Ministry of Local Government,
Environment and Rural Development; the Ministry of Finance and Economic Planning and
the District Assemblies Common Fund.
The local government ministry covers the emoluments of district assembly personnel,
and also allocations to some items in the 2-4 expenditure categories (Administration, Service
and Investment). Sometimes the ministry disburses specific grants to DAs, such as the waste
management grant to the metropolitan assemblies. Resources from the finance ministry are
generally referred to as central government transfers. They include the HIPC funds and other
ceded revenues. The main central government transfer to DAs for development activities,
which is DACF, is however transferred to the districts through the Common Fund
Administrator. Central government also indirectly channel resources to DAs through sector
wide programmes.
Programmes and projects are undertaken by different sectors, particularly the
decentralised departments with budget from the respective MDAs and donors. Also there are
donors and other NGOs with projects in districts whose financial information are not captured
26
by the official districts financial data (ISSER and CEPA 2004)5. The concentration of such
resources in particular districts will affect development of the districts significantly. However,
these resources from MDAs to the districts, which do not pass through the accounts of DAs,
are not captured by the District.
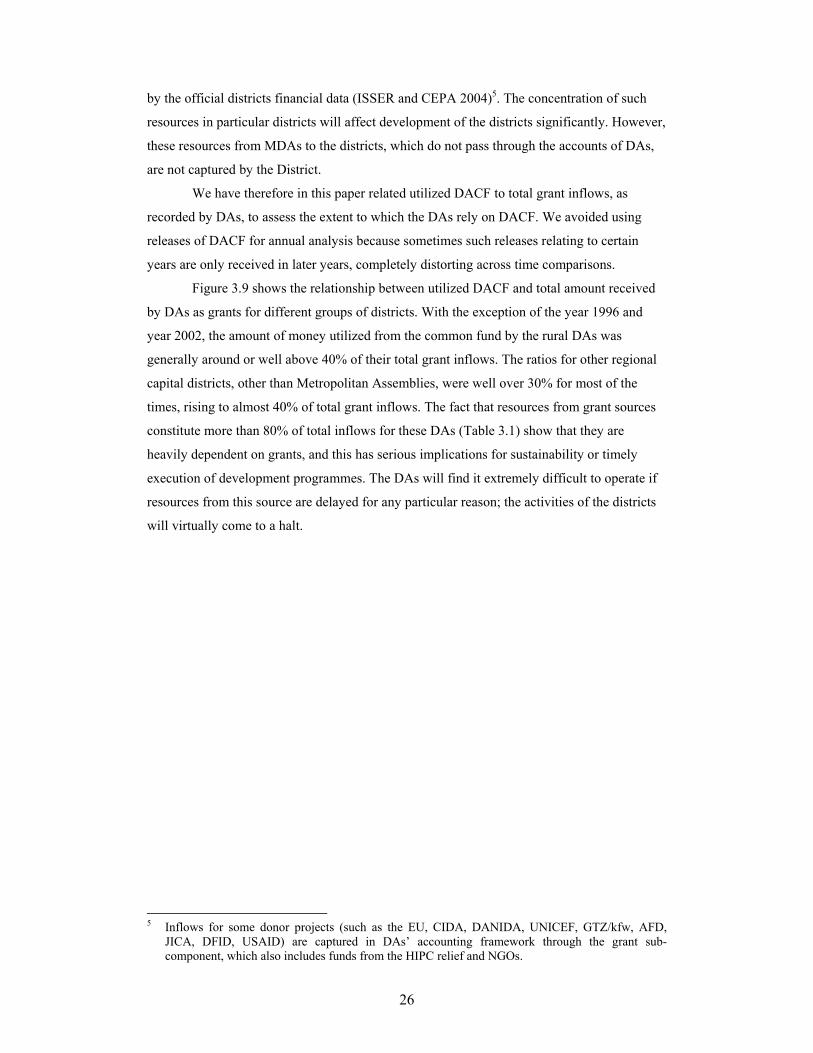
We have therefore in this paper related utilized DACF to total grant inflows, as
recorded by DAs, to assess the extent to which the DAs rely on DACF. We avoided using
releases of DACF for annual analysis because sometimes such releases relating to certain
years are only received in later years, completely distorting across time comparisons.
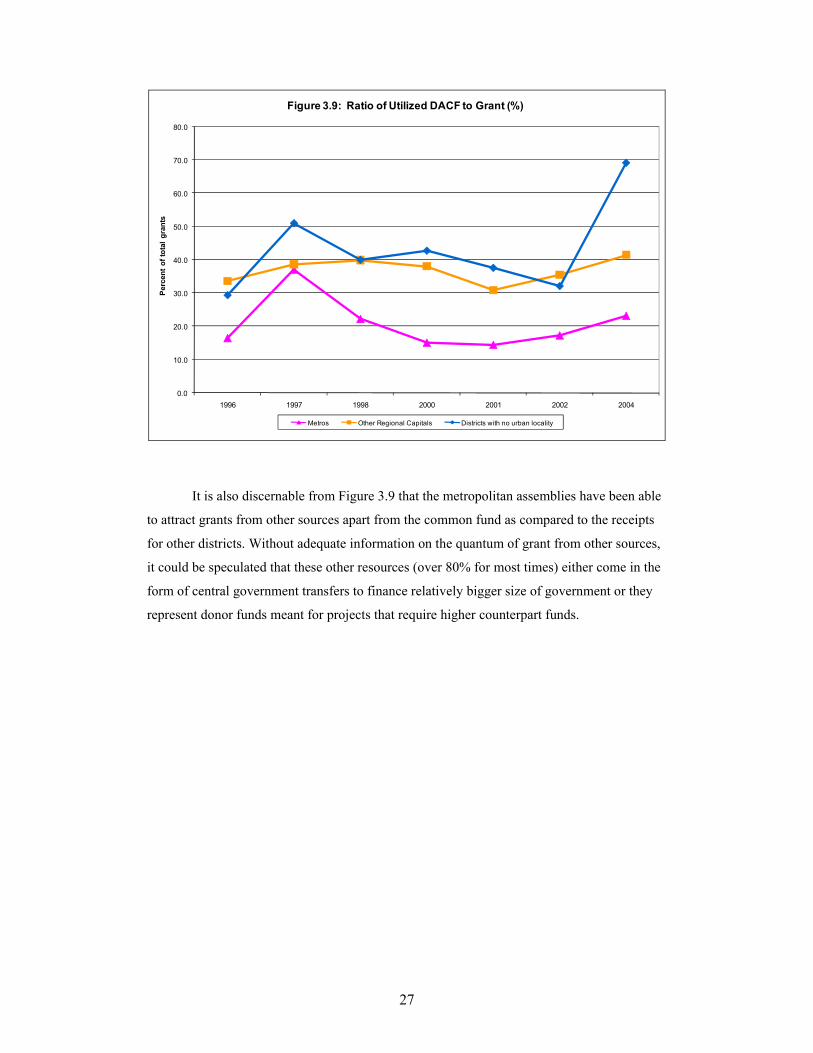
Figure 3.9 shows the relationship between utilized DACF and total amount received
by DAs as grants for different groups of districts. With the exception of the year 1996 and
year 2002, the amount of money utilized from the common fund by the rural DAs was
generally around or well above 40% of their total grant inflows. The ratios for other regional
capital districts, other than Metropolitan Assemblies, were well over 30% for most of the
times, rising to almost 40% of total grant inflows. The fact that resources from grant sources
constitute more than 80% of total inflows for these DAs (Table 3.1) show that they are
heavily dependent on grants, and this has serious implications for sustainability or timely
execution of development programmes. The DAs will find it extremely difficult to operate if
resources from this source are delayed for any particular reason; the activities of the districts
will virtually come to a halt.
5 Inflows for some donor projects (such as the EU, CIDA, DANIDA, UNICEF, GTZ/kfw, AFD,
JICA, DFID, USAID) are captured in DAs’ accounting framework through the grant sub-component, which also includes funds from the HIPC relief and NGOs.
27
0.0
10.0
20.0
30.0
40.0
50.0
60.0
70.0
80.0
1996 1997 1998 2000 2001 2002 2004
Perc
ent o
f tot
al g
rant
s
Figure 3.9: Ratio of Utilized DACF to Grant (%)
Metros Other Regional Capitals Districts with no urban locality
It is also discernable from Figure 3.9 that the metropolitan assemblies have been able
to attract grants from other sources apart from the common fund as compared to the receipts
for other districts. Without adequate information on the quantum of grant from other sources,
it could be speculated that these other resources (over 80% for most times) either come in the
form of central government transfers to finance relatively bigger size of government or they
represent donor funds meant for projects that require higher counterpart funds.
28
4. STATUS OF SOCIO-ECONOMIC INDICATORS AT THE DISTRICT LEVEL
4.1 Introduction Even though the research team has as of now not firmed up a conceptual framework or an
analytical framework to use, an attempt is made in this section to assess whether the use of
funds by the DAs has any effect or association with human development in the districts.
Receipts from the DACF by law should go into expenditures directed according to the
guidelines of the DACF and also according to the district’s development plan which must
have been prepared in line with central government policy (now GPRS II). DAs’ spending in
general are therefore used on the following broad items:
Basic infrastructure for district administration;
Health;
Education;
Water and sanitation; and
Poverty alleviation - revolving fund disbursed as credit to self-employed and Small
and Medium Scale Enterprises (SMEs).
We have therefore used four sets of indicators on education and health for this
preliminary analysis. They are adult and youth literacy rates, gross and net primary school
enrolment ratios, junior secondary school (JSS) enrolment ratios, and access to health care
facilities, use of safe drinking water and use of safe sanitation facilities. Changes in these
indicators are computed from datasets gathered from CWIQ1997 and CWIQ2003 and
analyzed using regression methods. The choice of these indicators is solely based on
availability of data that are disaggregated to the district level.
We also used the poverty data generated by the National Development Planning
Commission (NDPC) and the Ghana Statistical Service (GSS) to provide district-wide
poverty mapping. These poverty rates are derived more or less from most of the indicators
mentioned above and captured in the 2000 Population and housing Census based on
coefficients derived from the 1998/99 Ghana Living Standards Survey (GLSS4). Even though
the poverty rates serve as good composite indices to rank the districts, our initial analysis
shows clearly that one needs detailed sector-wide indicators to fully understand the
relationship between public spending and poverty at the local level.
We applied various econometric specifications to the data on public spending as
measured in this report for the period before 2000 to analyze the variations in the district
29
poverty rates, which pertain to the year 2000. Various lag lengths for the expenditure
variables were used, some of them were statistically correlated to poverty rates but most of
them had the wrong signs and had little policy interpretation value. An example of our initial
attempts to examine the extent to which these financial inflows, and for that matter public
spending influence development outcomes is presented in Appendix 1. The results point to
specification difficulties one may encounter with the use of insufficient information in such
analysis. We have therefore only presented them as summary tables to reflect at least the
degree of correlation or association between public spending and development outcomes,
without inferring any causation at this stage.
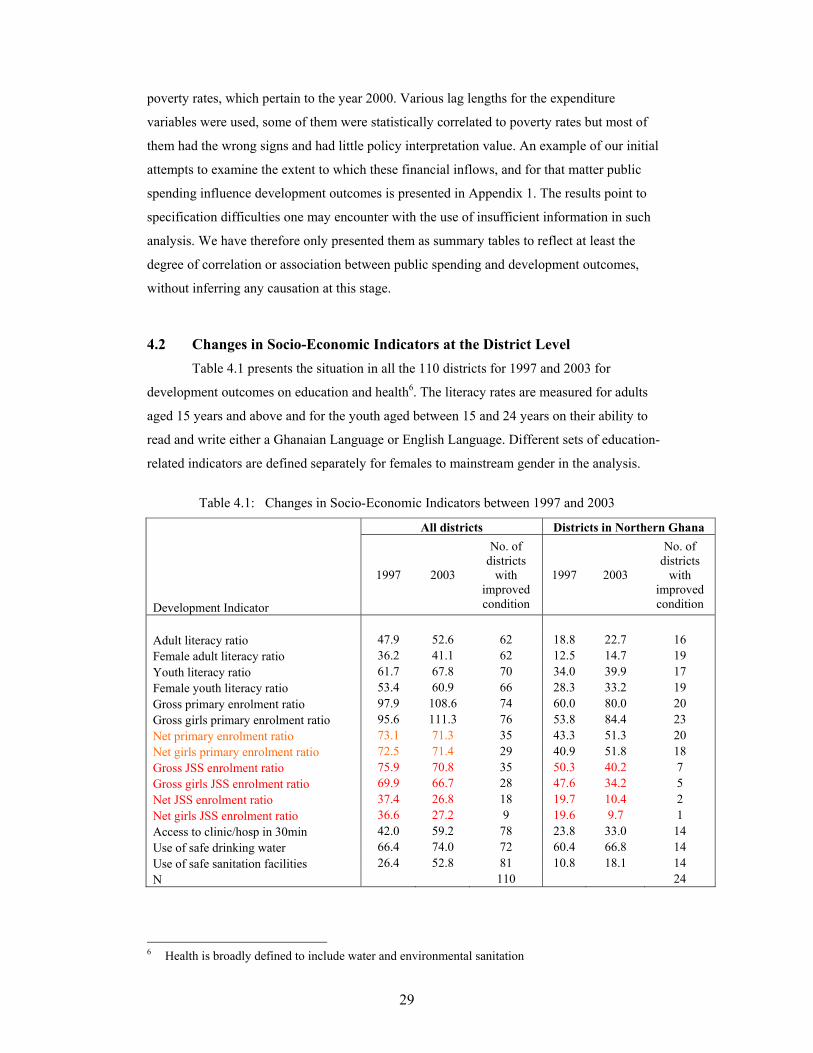
4.2 Changes in Socio-Economic Indicators at the District Level
Table 4.1 presents the situation in all the 110 districts for 1997 and 2003 for
development outcomes on education and health6. The literacy rates are measured for adults
aged 15 years and above and for the youth aged between 15 and 24 years on their ability to
read and write either a Ghanaian Language or English Language. Different sets of education-
related indicators are defined separately for females to mainstream gender in the analysis.
Table 4.1: Changes in Socio-Economic Indicators between 1997 and 2003
All districts Districts in Northern Ghana
Development Indicator
1997 2003
No. of districts
with improved condition
1997 2003
No. of districts
with improved condition
Adult literacy ratio 47.9 52.6 62 18.8 22.7 16 Female adult literacy ratio 36.2 41.1 62 12.5 14.7 19 Youth literacy ratio 61.7 67.8 70 34.0 39.9 17 Female youth literacy ratio 53.4 60.9 66 28.3 33.2 19 Gross primary enrolment ratio 97.9 108.6 74 60.0 80.0 20 Gross girls primary enrolment ratio 95.6 111.3 76 53.8 84.4 23 Net primary enrolment ratio 73.1 71.3 35 43.3 51.3 20 Net girls primary enrolment ratio 72.5 71.4 29 40.9 51.8 18 Gross JSS enrolment ratio 75.9 70.8 35 50.3 40.2 7 Gross girls JSS enrolment ratio 69.9 66.7 28 47.6 34.2 5 Net JSS enrolment ratio 37.4 26.8 18 19.7 10.4 2 Net girls JSS enrolment ratio 36.6 27.2 9 19.6 9.7 1 Access to clinic/hosp in 30min 42.0 59.2 78 23.8 33.0 14 Use of safe drinking water 66.4 74.0 72 60.4 66.8 14 Use of safe sanitation facilities 26.4 52.8 81 10.8 18.1 14 N 110 24
6 Health is broadly defined to include water and environmental sanitation
30
Source: Computed from CWIQ1997 & CWIQ2003
Access to health care facilities is defined for households who are within 30 minutes of
travel to a clinic or hospital. Drinking water is defined as safe for the household if it is
collected from the following sources; piped into dwelling or compound, public outdoor tap,
borehole and protected well. Sanitation facility is also defined as safe if a household mainly
uses either flush toilet to sewer or ventilated improved pit latrine. The computation of
proportions and changes in the proportions during the period is weighted by size of the
districts, where size is defined by population of the districts as captured in 2000 population
and housing census.
The results show that a number of the districts recorded improvement in some of the
indicators but a significant number also had worsened situation during the period of study.
Most of the positive changes were observed for health related indicators, primary school
enrolment for both girls and boys and for changes in literacy rates, particularly for the youth.
Over 70 out of the 110 districts in the country experienced improved conditions for majority
of the above dimensions of development indicators.
However, the districts’ conditions concerning improvement in JSS enrolment were
not encouraging during the period of study. Most of them could not significantly improve
enrolment; less than 40 out of the 110 districts experienced improved changes for both males
and females in junior secondary schools. Districts in the three northern regions have low
levels apart from changes in primary school enrolment, where the regions’ improvements
were remarkably higher than the rest (Table 4.1).
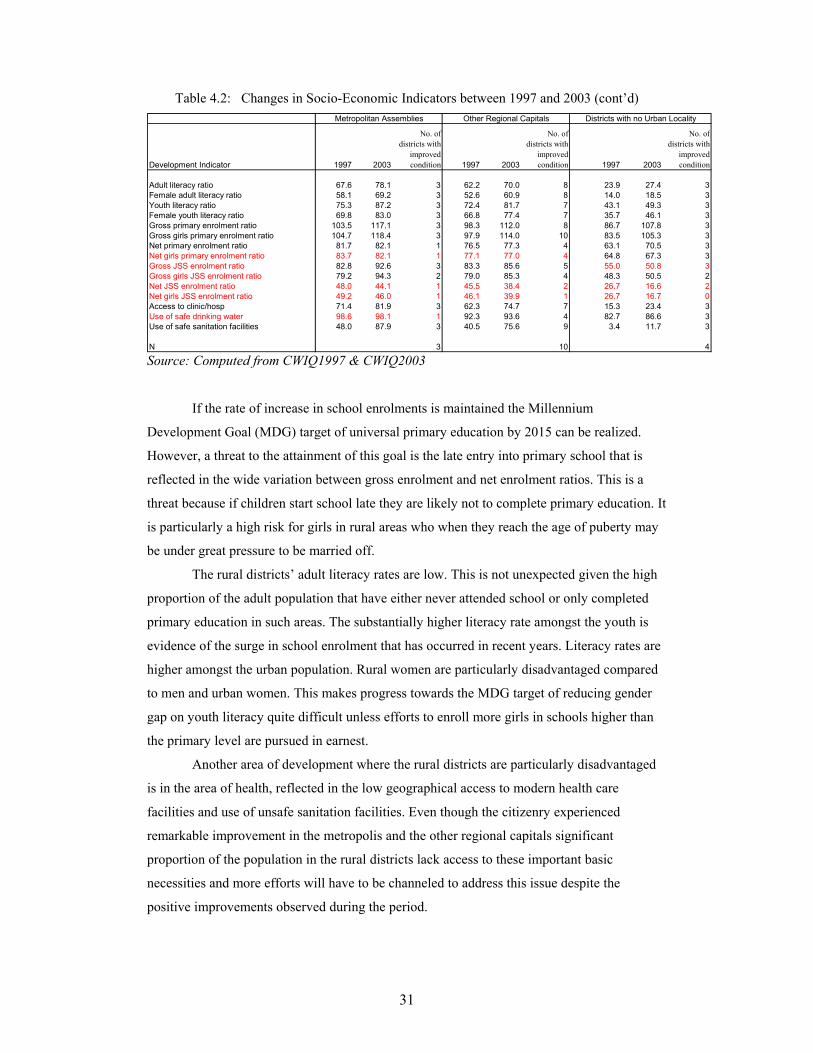
Table 4.2 looks at the changes in the socio-economic status of the separate groups of
the districts that have received various degrees of focus in the report between 1997 and 2000.
As it is the case for other districts in general, the districts made great strides in improving
enrolment at the lower levels of education and youth literacy. The challenge they face is how
to ensure that children start primary school at 6 years and complete at least nine years of basic
education.
31
Table 4.2: Changes in Socio-Economic Indicators between 1997 and 2003 (cont’d)
Development Indicator 1997 2003
No. of districts with
improved condition 1997 2003
No. of districts with
improved condition 1997 2003
No. of districts with
improved condition
Adult literacy ratio 67.6 78.1 3 62.2 70.0 8 23.9 27.4 3Female adult literacy ratio 58.1 69.2 3 52.6 60.9 8 14.0 18.5 3Youth literacy ratio 75.3 87.2 3 72.4 81.7 7 43.1 49.3 3Female youth literacy ratio 69.8 83.0 3 66.8 77.4 7 35.7 46.1 3Gross primary enrolment ratio 103.5 117.1 3 98.3 112.0 8 86.7 107.8 3Gross girls primary enrolment ratio 104.7 118.4 3 97.9 114.0 10 83.5 105.3 3Net primary enrolment ratio 81.7 82.1 1 76.5 77.3 4 63.1 70.5 3Net girls primary enrolment ratio 83.7 82.1 1 77.1 77.0 4 64.8 67.3 3Gross JSS enrolment ratio 82.8 92.6 3 83.3 85.6 5 55.0 50.8 3Gross girls JSS enrolment ratio 79.2 94.3 2 79.0 85.3 4 48.3 50.5 2Net JSS enrolment ratio 48.0 44.1 1 45.5 38.4 2 26.7 16.6 2Net girls JSS enrolment ratio 49.2 46.0 1 46.1 39.9 1 26.7 16.7 0Access to clinic/hosp 71.4 81.9 3 62.3 74.7 7 15.3 23.4 3Use of safe drinking water 98.6 98.1 1 92.3 93.6 4 82.7 86.6 3Use of safe sanitation facilities 48.0 87.9 3 40.5 75.6 9 3.4 11.7 3
N 3 10 4
Districts with no Urban LocalityOther Regional CapitalsMetropolitan Assemblies
Source: Computed from CWIQ1997 & CWIQ2003
If the rate of increase in school enrolments is maintained the Millennium
Development Goal (MDG) target of universal primary education by 2015 can be realized.
However, a threat to the attainment of this goal is the late entry into primary school that is
reflected in the wide variation between gross enrolment and net enrolment ratios. This is a
threat because if children start school late they are likely not to complete primary education. It
is particularly a high risk for girls in rural areas who when they reach the age of puberty may
be under great pressure to be married off.
The rural districts’ adult literacy rates are low. This is not unexpected given the high
proportion of the adult population that have either never attended school or only completed
primary education in such areas. The substantially higher literacy rate amongst the youth is
evidence of the surge in school enrolment that has occurred in recent years. Literacy rates are
higher amongst the urban population. Rural women are particularly disadvantaged compared
to men and urban women. This makes progress towards the MDG target of reducing gender
gap on youth literacy quite difficult unless efforts to enroll more girls in schools higher than
the primary level are pursued in earnest.
Another area of development where the rural districts are particularly disadvantaged
is in the area of health, reflected in the low geographical access to modern health care
facilities and use of unsafe sanitation facilities. Even though the citizenry experienced
remarkable improvement in the metropolis and the other regional capitals significant
proportion of the population in the rural districts lack access to these important basic
necessities and more efforts will have to be channeled to address this issue despite the
positive improvements observed during the period.
32
5. CONCLUSION In this report, we have assessed the income and expenditure patterns at the district
level, as an initial attempt to analyze the trends in public spending at the lower levels of
governance in Ghana. The components of and trends in expenditure and revenues were
analyzed by describing their time profiles over the period 1994 to 2004. The status of socio-
economic indicators, mainly on education, literacy and access to health and environmental
sanitation in the districts is discussed in the report. The indicators refer only to the years 1997
and 2000 because these were periods when district level data for such indicators are available.
Attempts to use regression methods to identify linkages between expenditures and
development outcomes were also made but the analysis require more work in the future when
richer data set is made available.
The main sources of data were district assemblies’ trial balances from the Controller
and Accountant Generals Department, data on releases and utilization of resources from the
District Assemblies’ Common Fund (DACF) as well as information on key welfare indicators
including health, education, water and sanitation. The welfare indicator variables were
obtained from the datasets gathered from the two Core Welfare Indicators Questionnaire
surveys conducted by the Ghana Statistical Service. The data from the trial balances were
obtained through the assistance of IFPRI office in Accra.
As also observed in the national level report, we find that personnel emolument form
the highest component of recurrent expenditures, accounting for about 27.5% of total
expenditures by Metropolitan Assemblies. For all districts, capital expenditure forms about
45.2% of total expenditures with large degree of variation between districts and over time. It
appears that the more rural the districts are, the higher the levels of capital expenditures and
vice versa. For example, capital expenditures for districts with no urban locality constitute
79% of total expenditures. Such differences in spending patterns may reflect differential
development needs of the districts and also portrays differences in the caliber of personnel
and the size of government at the district level. The results also show that the average ratios of
utilized resources from the common fund to total capital expenditures have since 1998 been
declining remarkably. Indeed in real terms, the level of DACF utilized by the DAs has
remained unstable and has been declining for some districts.
Generally IGF constitutes just over 30% of total funds district assemblies use to run
local government activities they handle. As is the case for expenditures, the dominance of
grants in funding activities varies over time and between districts; the average shares of grants
in rural districts form about 90% of total inflows into those district assemblies’ financial
system, whilst those for bigger districts like metropolitan assemblies represent about 60%. It
is also important to note that resource flow into the district assemblies (particularly from grant
33
sources and through IGF for metropolitan assemblies) have seen upward trends after 1998.
However, over the years, it has become clear that most of the DAs are heavily dependent on
DACF. We note that this has serious implications for the timely execution of development
programmes.
The analysis shows that over 70 out of the 110 districts in the country experienced
improved conditions for majority of development indicators measured over the period of
study. The results also show that high levels of basic education expenditures are associated
with improved changes in female enrolment. High levels of per capita recurrent expenditures
are also associated with improved changes in gross JSS enrolment for females whilst DAs
expenses on other development activities, apart from health and education are associated with
low or negative changes in adult female or youth literacy rates, and the use of safe sanitation
in the districts.
The findings in the report may not be that conclusive because programmes and
projects undertaken by different sectors, particularly decentralised departments with budget
from MDAs, impact on development of the districts significantly. These resources from
MDAs to the districts, which do not pass through the accounts of DAs are not captured by the
report. We analysed the small proportion of total government expenditures (between 4.0%
and 6.5%) and efforts to increase knowledge of the process and of a significant part of total
inflows and outlays will help in a long way to explain this important relationship between
public spending and development.
34
REFERENCES Alma Kanani (2002a), “Albania: Linking the Medium Term Expenditure Framework and the
GPRSP”. World Bank,Washington D.C.
Bahl, R. W. and J. Linn (1992). Urban Public Finance in Developing Countries, Oxford
University Press, New York.
Bevan, D and Palomba, G. (2000),“Uganda: the Budget and Medium Term Expenditure
Framework Set in a Wider Context”, paper prepared as background for the World
Bank’s PRSPC, financed by DFID.
Bevan, D and Adams, C (2001), ‘Guidance Note: Poverty Reduction Strategies and the
Macroeconomic Policy Framework’ , paper prepared for DFID.
Booth, David and Lucas, Henry (2002), “Good Practice in the Development of PRSP
Indicators and Monitoring Systems”, ODI Working Paper 172.
Byaruhanga, Charles (2002), ‘Poverty Reduction and Public Sector Reform in Uganda. The
Roles of Institutions in Past Experience and Challenges for the Way Forward.’ Paper
presented to seminar on ‘Modernising Government: Integrating Structural and Budget
Reforms for a Better Performing Public Sector’ Adam Smith Institute, London. April.
Campos, Ed and Pradhan, Sanjay (1996), “Budgetary Institutions and Expenditure Outcomes.
Policy Research Working Paper”, No. 1646. World Bank.
Dafflon, B. (1992), The Assignment of Functions to Decentralized Government: from theory
to practice. Government and Policy
Financial Administration Act (2003), Act 654, Accra Ghana
Financial Memoranda for District Assemblies (2004). Under Local Government Act of 1993,
Act 462. Ministry of Local Government and Rural Development, Accra Ghana.
Financial Memoranda for Local and Urban Councils (under Section 81 of Local Government
Act of 1961)
Folscher, Alta (2002) eds. Budget Transparency and Participation: Five African Case
Studies, IDASA.
Foster, Mick; Conway, T. et al (2002) How, When, Why Does Poverty Get Budget Priority.
Poverty Reduction Strategy and Public Expenditure in Five African Countries. ODI
Working Paper 168
Guidelines for the Preparation of the District Medium Term Development Plan, Under the
Ghana Poverty Reduction Strategy, 2002-2004. National Development Planning
Commission, June, 2002.
IMF (2000), “Ghana: Interim Poverty Reduction Strategy Paper 2000-2002.”
IMF (2004), “Ghana: Report on the Observance of Standards and Codes- Fiscal Transparency
Module”
35
ISODEC (2005), “Budgeting and Accounting structures of District Assemblies in Ghana”,
Accra
ISSER (2000-2005), “The State of the Ghanaian Economy”, Various editions, Accra.
ISSER and CEPA (2004), “Accessible Information for Development Dialogue”, Accra.
John Short (2002e), “Assessment of the Medium Term Expenditure Framework in Ghana”,
REPIM, U.K.
Malcolm H. and A. Evans (2003), “A Review of Experience in Implementing Medium Term
Expenditure Frameworks in a PRSP Context: A Synthesis of Eight Country Studies”
McKay, A. and Aryeetey, E. (2004), “Operationalising Pro- Poor Growth” A Country Case
Study on Ghana
Moon, Allister (1998) ‘Aid, MTEFs and Budget Process, Manuscript’, World Bank
Public Procurement Act of 2003, Act 663. Accra, Ghana
Schick, Allen (1998) ‘Why Most Countries Should Not Try New Zealand’s Reforms’, World
Bank Research Observer, Vol. 13, No. 1 p. 130.
Shenggen, F. and Neetha, R. (2003), “Public spending in developing countries: trends,
determination and impact”
The District Assemblies Common Fund Act (1993), Act 455. GPC, Accra Ghana
The Growth and Poverty Reduction Strategy (GPRS I) (2003), Ghana report.
The Growth and Poverty Reduction Strategy (GPRS II) (2005), Ghana report
World Bank (1998) Public Expenditure Management Handbook, PREM Network,
Washington DC.
World Bank (2001) PRSP Sourcebook, Chapter on Public Spending and the Poor.
World Bank (2002) ‘Medium Term Expenditure Frameworks: From Concept to Practice.
Preliminary Lessons from Africa’, Philippe Le Houerou and Robert Taliercio,
Washington DC.
World Bank/IMF (2002), ‘Good Practices for PRSP Design and Implementation: A Summary
for Practitioners’, Washington D.C.
World Bank/ IMF (2004), “Public Expenditure Management -Country Assessment and Action
Plan (AAP) –Ghana.”
36
APPENDIX 1: An Attempt to Explain the Relationship between Development Outcomes and District Assemblies’ Spending
This appendix section examines the extent to which financial inflows to DAs, and for that matter public spending on these activities by the DAs have led to the current situation. We employed a simplified regression model that relates current levels of the indicators to various types of expenditures and the districts’ ability to raise funds internally, conditioned by the situation in 1997 and other location attributes. This model tries to indirectly analyze changes in development indicators between 1997 and 2003 using total pubic resources expensed by DAs within that period. We have two data points for the dependent variables but the independent variables have values for all the years in the period. We accumulated the independent variables data points and analyzed to show whether total spending on various items correlate with the changes in development outcomes. Different econometric specifications were tried, some using the lags of the independent expenditure variables to explain the two points. Once again the results (not shown here) had little policy interpretation value. The model is stated as follows: εαααα ++++= CXyy 321997102003
where 2003y represents indicators measuring different dimensions of development in 2003 as
explained above and 1997y represents the situation of the indicators in 1997. The independent variables in the model are various expenditure variables expressed in per capita terms; accumulated health expenses financed by DACF (including expenses on water and sanitation), accumulated basic education and secondary expenditures financed by DACF, other accumulated capital expenditures and recurrent expenses. The other control variable (also measured in vector C) measures the average ratio of IGF to total expenditures, indicating the extent to which a DA is able to finance its activities using internal sources of funds. Adult literacy rate in 1997 was also used as control variable for non-literacy models to account for other initial conditions that are not captured by 1997y in those equations. The estimated model is presented in Tables 4.2 to 4.5. All the models are statistically significant with relatively high R-squared values observed because of the seemingly lagged dependent variables on the right hand side. The summary findings on the patterns of relationship is that per capita expenditures on health and secondary school education accumulated over the period are not related to any of the changes in the development indicators. Accumulated per capita expenditures for basic education positively affects gross and net primary enrolment for girls. The results also show that high levels of per capita recurrent expenditures are associated with improved changes in gross JSS enrolment for females whilst DAs’ expenses on other development activities, apart from health and education are associated with low or negative changes in adult female or youth literacy rates, and the use of safe sanitation in the districts. We have tried not to explain this relationship because of the preliminary nature of the data gathering process. There is a need to conduct in-depth or use other qualitative methods for clearer understanding of the findings, especially those that suggest rather counter-intuitive relationship like the one between expenses on other development activities and almost all of the development indicators.
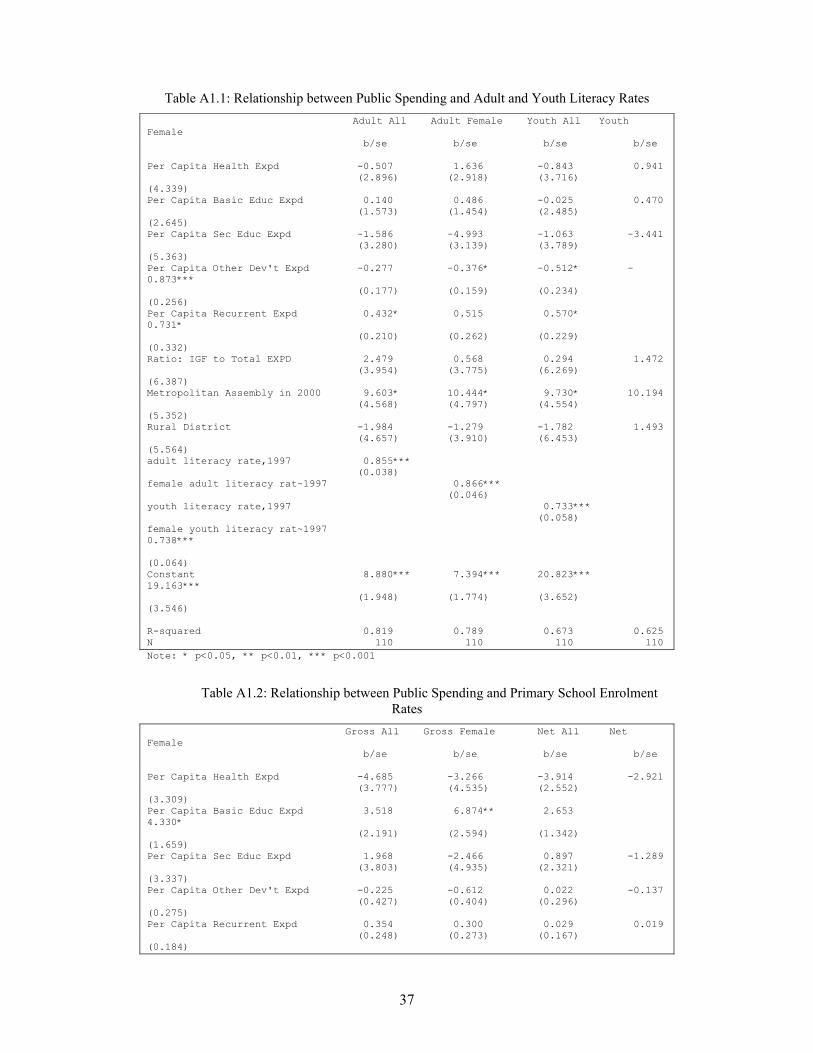
37
Table A1.1: Relationship between Public Spending and Adult and Youth Literacy Rates Adult All Adult Female Youth All Youth Female b/se b/se b/se b/se Per Capita Health Expd -0.507 1.636 -0.843 0.941 (2.896) (2.918) (3.716) (4.339) Per Capita Basic Educ Expd 0.140 0.486 -0.025 0.470 (1.573) (1.454) (2.485) (2.645) Per Capita Sec Educ Expd -1.586 -4.993 -1.063 -3.441 (3.280) (3.139) (3.789) (5.363) Per Capita Other Dev't Expd -0.277 -0.376* -0.512* -0.873*** (0.177) (0.159) (0.234) (0.256) Per Capita Recurrent Expd 0.432* 0.515 0.570* 0.731* (0.210) (0.262) (0.229) (0.332) Ratio: IGF to Total EXPD 2.479 0.568 0.294 1.472 (3.954) (3.775) (6.269) (6.387) Metropolitan Assembly in 2000 9.603* 10.444* 9.730* 10.194 (4.568) (4.797) (4.554) (5.352) Rural District -1.984 -1.279 -1.782 1.493 (4.657) (3.910) (6.453) (5.564) adult literacy rate,1997 0.855*** (0.038) female adult literacy rat~1997 0.866*** (0.046) youth literacy rate,1997 0.733*** (0.058) female youth literacy rat~1997 0.738*** (0.064) Constant 8.880*** 7.394*** 20.823*** 19.163*** (1.948) (1.774) (3.652) (3.546) R-squared 0.819 0.789 0.673 0.625 N 110 110 110 110 Note: * p<0.05, ** p<0.01, *** p<0.001
Table A1.2: Relationship between Public Spending and Primary School Enrolment Rates
Gross All Gross Female Net All Net Female b/se b/se b/se b/se Per Capita Health Expd -4.685 -3.266 -3.914 -2.921 (3.777) (4.535) (2.552) (3.309) Per Capita Basic Educ Expd 3.518 6.874** 2.653 4.330* (2.191) (2.594) (1.342) (1.659) Per Capita Sec Educ Expd 1.968 -2.466 0.897 -1.289 (3.803) (4.935) (2.321) (3.337) Per Capita Other Dev't Expd -0.225 -0.612 0.022 -0.137 (0.427) (0.404) (0.296) (0.275) Per Capita Recurrent Expd 0.354 0.300 0.029 0.019 (0.248) (0.273) (0.167) (0.184)
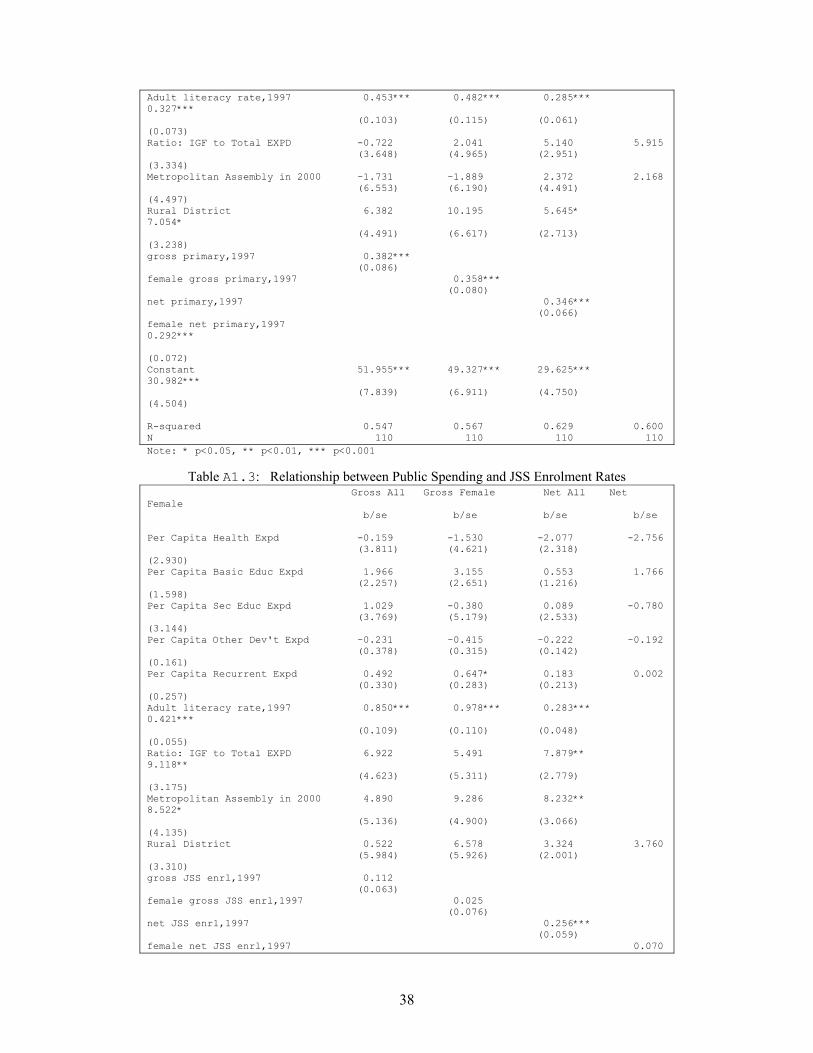
38
Adult literacy rate,1997 0.453*** 0.482*** 0.285*** 0.327*** (0.103) (0.115) (0.061) (0.073) Ratio: IGF to Total EXPD -0.722 2.041 5.140 5.915 (3.648) (4.965) (2.951) (3.334) Metropolitan Assembly in 2000 -1.731 -1.889 2.372 2.168 (6.553) (6.190) (4.491) (4.497) Rural District 6.382 10.195 5.645* 7.054* (4.491) (6.617) (2.713) (3.238) gross primary,1997 0.382*** (0.086) female gross primary,1997 0.358*** (0.080) net primary,1997 0.346*** (0.066) female net primary,1997 0.292*** (0.072) Constant 51.955*** 49.327*** 29.625*** 30.982*** (7.839) (6.911) (4.750) (4.504) R-squared 0.547 0.567 0.629 0.600 N 110 110 110 110 Note: * p<0.05, ** p<0.01, *** p<0.001
Table A1.3: Relationship between Public Spending and JSS Enrolment Rates Gross All Gross Female Net All Net Female b/se b/se b/se b/se Per Capita Health Expd -0.159 -1.530 -2.077 -2.756 (3.811) (4.621) (2.318) (2.930) Per Capita Basic Educ Expd 1.966 3.155 0.553 1.766 (2.257) (2.651) (1.216) (1.598) Per Capita Sec Educ Expd 1.029 -0.380 0.089 -0.780 (3.769) (5.179) (2.533) (3.144) Per Capita Other Dev't Expd -0.231 -0.415 -0.222 -0.192 (0.378) (0.315) (0.142) (0.161) Per Capita Recurrent Expd 0.492 0.647* 0.183 0.002 (0.330) (0.283) (0.213) (0.257) Adult literacy rate,1997 0.850*** 0.978*** 0.283*** 0.421*** (0.109) (0.110) (0.048) (0.055) Ratio: IGF to Total EXPD 6.922 5.491 7.879** 9.118** (4.623) (5.311) (2.779) (3.175) Metropolitan Assembly in 2000 4.890 9.286 8.232** 8.522* (5.136) (4.900) (3.066) (4.135) Rural District 0.522 6.578 3.324 3.760 (5.984) (5.926) (2.001) (3.310) gross JSS enrl,1997 0.112 (0.063) female gross JSS enrl,1997 0.025 (0.076) net JSS enrl,1997 0.256*** (0.059) female net JSS enrl,1997 0.070
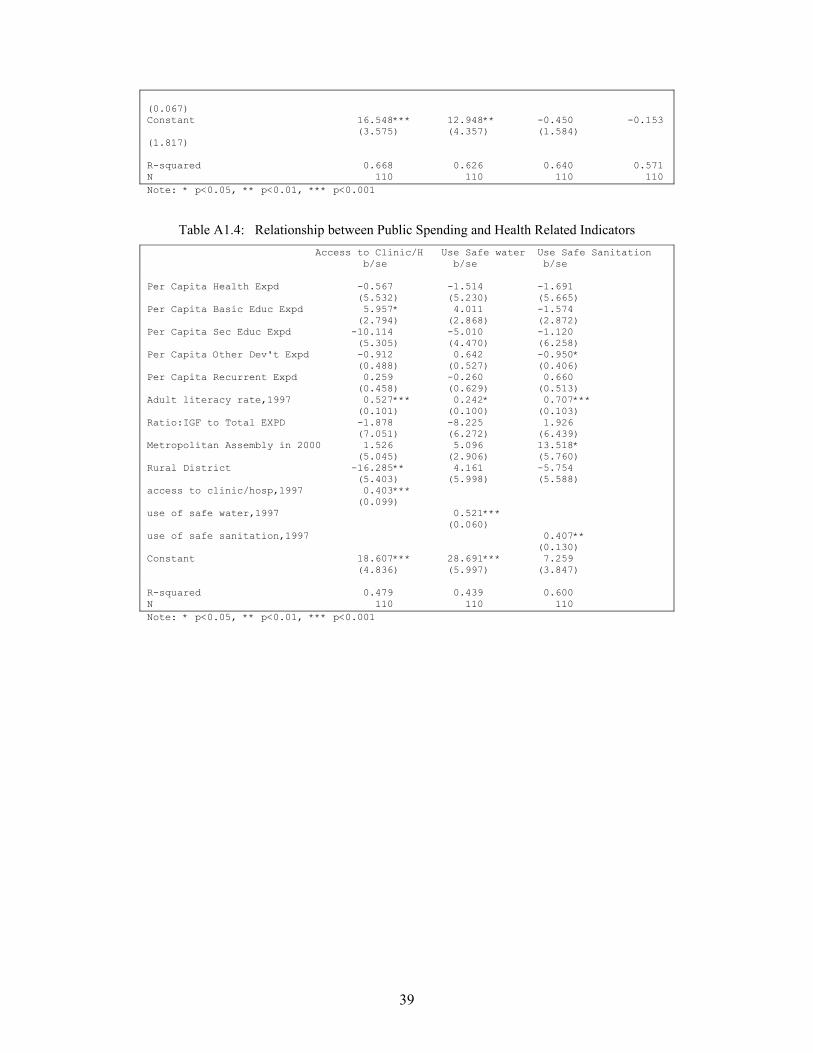
39
(0.067) Constant 16.548*** 12.948** -0.450 -0.153 (3.575) (4.357) (1.584) (1.817) R-squared 0.668 0.626 0.640 0.571 N 110 110 110 110 Note: * p<0.05, ** p<0.01, *** p<0.001
Table A1.4: Relationship between Public Spending and Health Related Indicators
Access to Clinic/H Use Safe water Use Safe Sanitation b/se b/se b/se Per Capita Health Expd -0.567 -1.514 -1.691 (5.532) (5.230) (5.665) Per Capita Basic Educ Expd 5.957* 4.011 -1.574 (2.794) (2.868) (2.872) Per Capita Sec Educ Expd -10.114 -5.010 -1.120 (5.305) (4.470) (6.258) Per Capita Other Dev't Expd -0.912 0.642 -0.950* (0.488) (0.527) (0.406) Per Capita Recurrent Expd 0.259 -0.260 0.660 (0.458) (0.629) (0.513) Adult literacy rate,1997 0.527*** 0.242* 0.707*** (0.101) (0.100) (0.103) Ratio:IGF to Total EXPD -1.878 -8.225 1.926 (7.051) (6.272) (6.439) Metropolitan Assembly in 2000 1.526 5.096 13.518* (5.045) (2.906) (5.760) Rural District -16.285** 4.161 -5.754 (5.403) (5.998) (5.588) access to clinic/hosp,1997 0.403*** (0.099) use of safe water,1997 0.521*** (0.060) use of safe sanitation,1997 0.407** (0.130) Constant 18.607*** 28.691*** 7.259 (4.836) (5.997) (3.847) R-squared 0.479 0.439 0.600 N 110 110 110 Note: * p<0.05, ** p<0.01, *** p<0.001
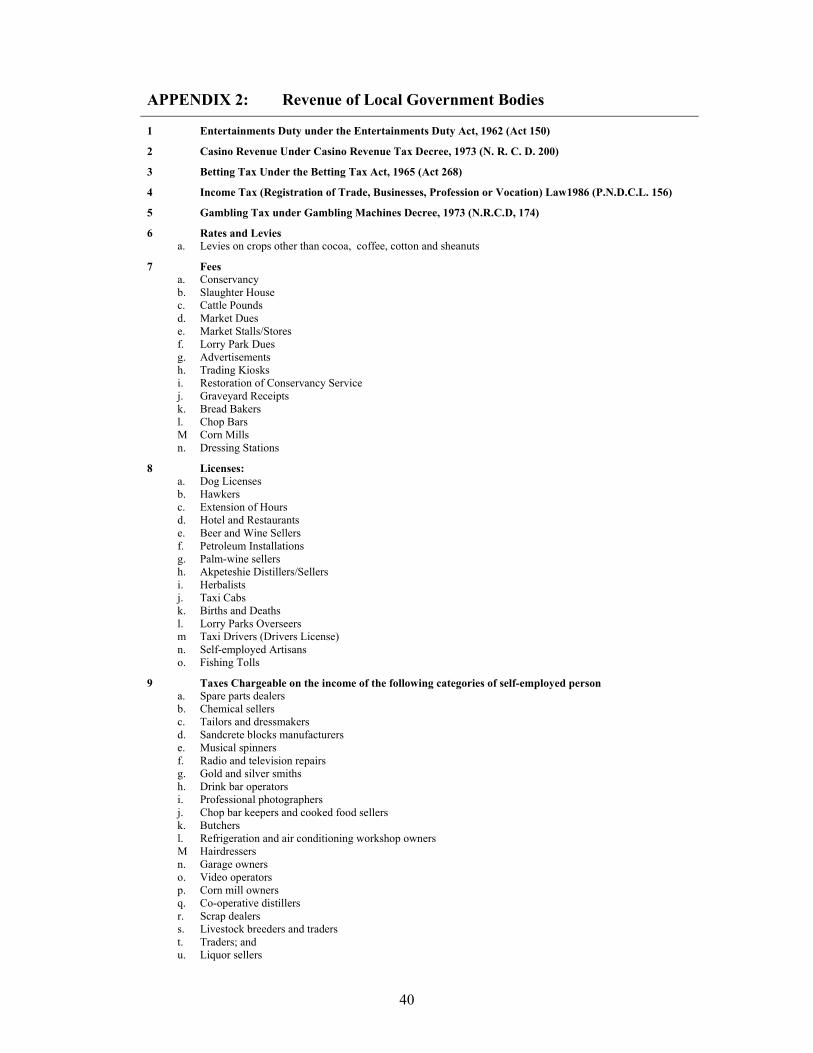
40
APPENDIX 2: Revenue of Local Government Bodies
1
Entertainments Duty under the Entertainments Duty Act, 1962 (Act 150)
2 Casino Revenue Under Casino Revenue Tax Decree, 1973 (N. R. C. D. 200)
3 Betting Tax Under the Betting Tax Act, 1965 (Act 268)
4 Income Tax (Registration of Trade, Businesses, Profession or Vocation) Law1986 (P.N.D.C.L. 156)
5 Gambling Tax under Gambling Machines Decree, 1973 (N.R.C.D, 174)
6 Rates and Levies a. Levies on crops other than cocoa, coffee, cotton and sheanuts
7 Fees a. Conservancy b. Slaughter House c. Cattle Pounds d. Market Dues e. Market Stalls/Stores f. Lorry Park Dues g. Advertisements h. Trading Kiosks i. Restoration of Conservancy Service j. Graveyard Receipts k. Bread Bakers l. Chop Bars M Corn Mills n. Dressing Stations
8 Licenses: a. Dog Licenses b. Hawkers c. Extension of Hours d. Hotel and Restaurants e. Beer and Wine Sellers f. Petroleum Installations g. Palm-wine sellers h. Akpeteshie Distillers/Sellers i. Herbalists j. Taxi Cabs k. Births and Deaths l. Lorry Parks Overseers m Taxi Drivers (Drivers License) n. Self-employed Artisans o. Fishing Tolls
9 Taxes Chargeable on the income of the following categories of self-employed person a. Spare parts dealers b. Chemical sellers c. Tailors and dressmakers d. Sandcrete blocks manufacturers e. Musical spinners f. Radio and television repairs g. Gold and silver smiths h. Drink bar operators i. Professional photographers j. Chop bar keepers and cooked food sellers k. Butchers l. Refrigeration and air conditioning workshop owners M Hairdressers n. Garage owners o. Video operators p. Corn mill owners q. Co-operative distillers r. Scrap dealers s. Livestock breeders and traders t. Traders; and u. Liquor sellers
41
10 Miscellaneous a. Town Hall/Community Center Receipts b. District Hearse Hiring c. Dislodging of Latrines d. Hire of Bulldozers/Grader e. Collection of Sand/Grave/Stone f. Slot Machines g. Stool Land Revenue h. Toilets Receipts (Source: Sixth Schedule- Act 462, section 86) APPENDIX 3: Classification of Expenditure Items 1.
PERSONNEL EMOLUMENTS Established Posts Established Posts Non-Established posts Non Established Post Contract Appointments Daily Rated Probation Recruitment Secondment Other (specify) 2. ADMINISTRATION ACTIVITY EXPENSES Utilities Electricity Water Telecommunications Postal Sanitation Charges Armed Guard & Security Fire Fighting Campaign Office Cleaning Cleaning Materials Contract Cleaning Office Consumables Stationery Refreshments First Aid Materials Other Office consumables Head of State End of Year Activities Printing & Publications Contract Printing Contract Photocopying Purchase of Publications Advertisements Rent Office Accommodation Residential Accommodation Rental of Office Equipment Hotel Accommodation Travel & Transport Travel Allowance Running Costs of Official Vehicles (POL) Maintenance of Official Vehicles Car Rental Transfer Grants Out Station Running Cost of Presidential Aircraft Running Cost of Fighting Vehicles Maintenance Driveways and Grounds Minor Repairs of Residential Buildings
42
Minor Repairs of Office Buildings Maintenance of Furniture and Fixtures Maintenance of Equipment, Machinery and Plant Minor Repairs of Schools/Colleges Maintenance of Presidential Aircraft Maintenance of Fighting Vehicles Financial Charges Insurance and Compensation Bank Charges Contributions Refunds of Medical Expenses Audit Other Charges UN-Peace Overseas Medical Treatments Other Allowances Motorbike Maintenance Allowance Bicycle Maintenance Allowance Car Maintenance Allowance Overtime Allowance Guide Allowance Etc. etc… Other Allowance 3 SERVICE ACTIVITY EXPENSES Training & Conference Cost Training Materials Hire of Venue Hotel Accommodation Refreshments Tuition Fees (Courses, Seminars etc) Consultancy Local Consultants Fees External Consultants Fees Materials and Consumables Materials And Consumables Stationery Refreshments Uniform & Protective Clothing Household Items Rations School Textbooks/Library Books Chemicals and Consumables for School Laboratories Other Teaching / Learning Materials National Awards Printing and Publications Printing & Publications Contract Printing Contract Photocopying Purchase of Publications Advertisement Rent of Plant & Equipment Rent of Plant and Equipment Travel & Transport Night Allowance Local Travel Running Costs Mileage Allowance Local Hotel Foreign Travel Per Diem Foreign Travel Costs Credit Facilities Credit (grant) Nat. Health Insurance Scheme Exempt for aged, antenatal, under 5 years Refund for Med. Exp (Paupers/disease Category) Customs duty/Handling Charges Special Activities
43
Special Operations (COS) Special Operations (NSC) Service of the State Protocol Official Celebrations Head of State End of Year Activities Special Operations (Peace Keeping) Special Operations (Docking of Ships) Construction Works Consultancy Fees Contractors Fees Compensation For Land Sanitary Facility only Access Roads Only New Buildings Rehabilitation Buildings Plant and Equipment Purchase of Plant, Equipment, Furniture and Vehicles Purchase Of Plant, Equipment, Furniture & Vehicles Purchase of Plant & Equipment Purchase of Vehicles Purchase of Furniture/Fittings Purchase of Motor Cycles, Bicycles & Life-jackets Purchase of Computers & Accessories Source: Guidelines for the preparation of the 2002- 2004 Budget, Ministry of Finance October, 2001