Embed Size (px)
Citation preview
Haider and Badami
Forum on Urban Infrastructure and Public Service Delivery for the Urban Poor Regional Focus: Asia
Dates: June 24-25
Location: New Delhi, India
Public transit for the urban poor in Pakistan: Balancing efficiency and equity Murtaza Haider, Ph.D. Assistant Professor School of Urban Planning McGill University 815 Sherbrooke Street West, Suite 403 Montreal, QC H3A 2K6 Canada Tel: 514.398.4079, email: [email protected] Madhav Badami, Ph.D. Assistant Professor School of Urban Planning McGill University 815 Sherbrooke Street West, Suite 400 Montreal, QC H3A 2K6 Canada Tel: 514.398.3183, email: madhav.badami @mcgill.ca
Haider and Badami Page 1
1. Abstract Improving accessibility to employment, education, health, and other urban services is necessary for improving the welfare of the urban poor and low-income households. Although the rate of motorization is increasing in developing countries, the bulk of the urban poor in the developing world do not have the means to afford private motorised transport. The urban poor rely on public transit for trips that require motorised transport. Thus, public transit plays a critical role in sustaining and improving the welfare of urban poor by providing mobility to millions.
The past few decades have witnessed a continuous disinvestment in public transit by governments in Pakistan who have cut public services in an attempt to balance their books. When the government funded mass transit disappeared from the streets, the private sector stepped in to provide transit service, which left much to be desired in terms of efficient provision of quality service and safety.
Recently, provincial governments in Pakistan have embarked on bus-franchising schemes, which offer exclusive service rights to operators on dedicated routes. The transit operators, in return, guarantee a certain level of service. In Punjab, for example, bus-franchising scheme has delivered hundreds of new buses now plying on intra-urban routes.
The franchised bus service is a step up in quality when compared with the para-transit service it has replaced on the select routes. However, bus franchising has raised some immediate concerns as well. For instance, the new bus service is more expensive than the service it has replaced. The expensive, albeit improved, transit system creates new hurdles for the poor households. Similarly, the fate of para-transit operators, who have lost their livelihoods because of the new bus franchising services, is not certain. The bus-franchising experience in Pakistan suggests that the gains in quality and efficiency have been realised at the cost of equity.
Using a case study approach, the paper focuses on the mobility concerns of the lower and middle-income groups in the Greater Islamabad Rawalpindi Area (GIRA). The study area comprises the urban parts of the federal capital, Islamabad, and the urban areas of the neighbouring city, Rawalpindi. The paper documents the opportunities and constraints resulting from privatization of public transit in general, and bus franchising in particular, related to GIRA.
Haider and Badami Page 2
2. Introduction The 1990s have witnessed an increase in poverty levels in Pakistan. Low-income households have experienced significant decline in their purchasing power. Most low-income households rely on public transit for trips that require motorised transport. In most instances, public transit is the only viable means of commuting to access employment, education, health, and other urban services.
The rapid pace of urbanization in Pakistan has resulted in a significant increase in the urban population at a time when resources have become increasingly scarce. While thousands leave their rural abodes for cities in search of employment opportunities, the physical infrastructure of cities in Pakistan is fast becoming incapable of meeting the demand for urban services. Thus, water and housing shortages, and inadequate public transport services are common in most Pakistani cities.
This paper addresses the challenge of how to provide for the mobility needs of the urban poor and discusses public transit provision to serve the growing needs of urban poor within the context of severely constrained resources. The paper also suggests strategies to improve bus franchising in developing countries.
This paper first presents a brief literature review on transport planning in developing countries. The paper then focuses on demographics of the Greater Islamabad Rawalpindi Area (GIRA). This is followed by a discussion on poverty levels in urban Pakistan. Next, the consumption patterns of urban households are discussed. The paper distinguishes between the urban poor and low-income households and discusses their unique mobility and housing needs. A discussion on mobility issues in GIRA follows with a discussion on what circumstances necessitated transit franchising. The bus franchising scheme and its impact on the mobility of the transportation disadvantaged in GIRA is discussed in detail. The paper ends with recommendations for effective transport planning in urban Pakistan that balance equity and efficiency.
3. Literature Review Urban transport in developing countries has been a focus of numerous studies since the late 1970s (Bryne et al., 1979; Courtney, 1979; farahmand-Razavi, 1994; Hirten & Echenique, 1979). Interestingly enough, while the application and development of integrated land use-transport models is still in its nascent stage in the developed world, such models were being applied in some developing countries a quarter century ago (Hirten & Echenique, 1979).
The impact of income on accessibility has also been studied in the developing countries context (Silva et al., 1998). Other research has focused on how to improve women’s welfare by improving their access to better transport services (Turner & Fouracre, 1995). Improving traffic-related safety issues in the developing countries has been the focus of recent research efforts (Aftonso et al., 1998; Vasconcellos, 1995). At the same time, researchers pondered over the type and size of vehicles that may fit better with the physical environments in developing countries (Vijayakumar, 1986).
Haider and Badami Page 3
The World Bank and other multilateral donors have a strong interest in transport and mobility in the developing world. In the case of Pakistan, the multilateral donors have invested heavily in improving intercity passenger and freight transportation. Investments in urban transit are of much smaller magnitude. The World Bank has produced three strategy papers on urban transport. The previous two strategy papers were focussed on economic and financial viability, management of capacity, and sustainability. The latest in the series is focussed on the poverty and transport (Gwilliam, 2001). The latest strategy paper on transport followed the release of the World Bank’s strategy paper on urban development, which focussed on the liveability of cities and quality of life (Kessides, 2000).
The World Bank strategy paper advocates the need for competition in the delivery of transit services in developing countries. Arguing that competition is pro-poor, the Bank advocates provision of urban transit by the private sector. However, the Bank points to the fine distinction between privatization and deregulation of transit on one hand, and the preferred carefully managed competition in transit services on the other.
Service delivery to the urban poor is also the focus of the latest annual development report of the World Bank. It is becoming increasingly pertinent for policymakers to ensure service delivery to the poor (World Bank, 2003). Transport services are a key component of the large services bundle. The delivery of transport service to all segments of society is thus becoming increasingly critical.
One of the most comprehensive studies on bus transit was commissioned by the World Bank in the late 1980s (Armstrong-Wright & Thiriez, 1987). The study noted that in several instances, private ownership of public transit offered cheaper service in the developing world when state-operated transit operators underwent a decline in service. As operating losses mounted, numerous governments stepped in to shut down publicly-operated transit. While state-owned transit mostly operated large buses, privately-owned transit fleets ranged from small vehicles with capacities of fewer than 10 passengers to large buses. Small transit vehicles are less energy efficient and do not result in economies of scale. They remain popular among private operators for two main reasons. First, small vehicles are much cheaper than large buses and hence do not act as a barrier to entry in the transit market. In addition, regulatory approval for small transit vehicles is easier to obtain than for large buses.
Armstrong-Wright and Thiriez (1987) argue that public transit in the developing world works best with minimum intervention from government. They further suggest that that all publicly operated transit services returned operating ratios of less than 1, whereas most privately owned/operated transit demonstrated operating ratios of greater than 1.
Rapid urbanization in developing countries has been the focus of numerous studies as well. Recent studies have shown that the rate of motorization in developing countries is higher than the rate of increase in population (Jraiw, 2003). These trends may have serious repercussions because of insufficient transport infrastructure, which has not kept pace with the increasing motorization/urbanization in developing countries. Although the rate of motorization is increasing in developing countries, the bulk of the urban poor in the developing world do not have the means to afford private motorised transport. The urban poor rely on public transit for trips that require motorised transport.
Haider and Badami Page 4
4. Urban Dynamics in Pakistan
4.1. Demographics & Urbanization
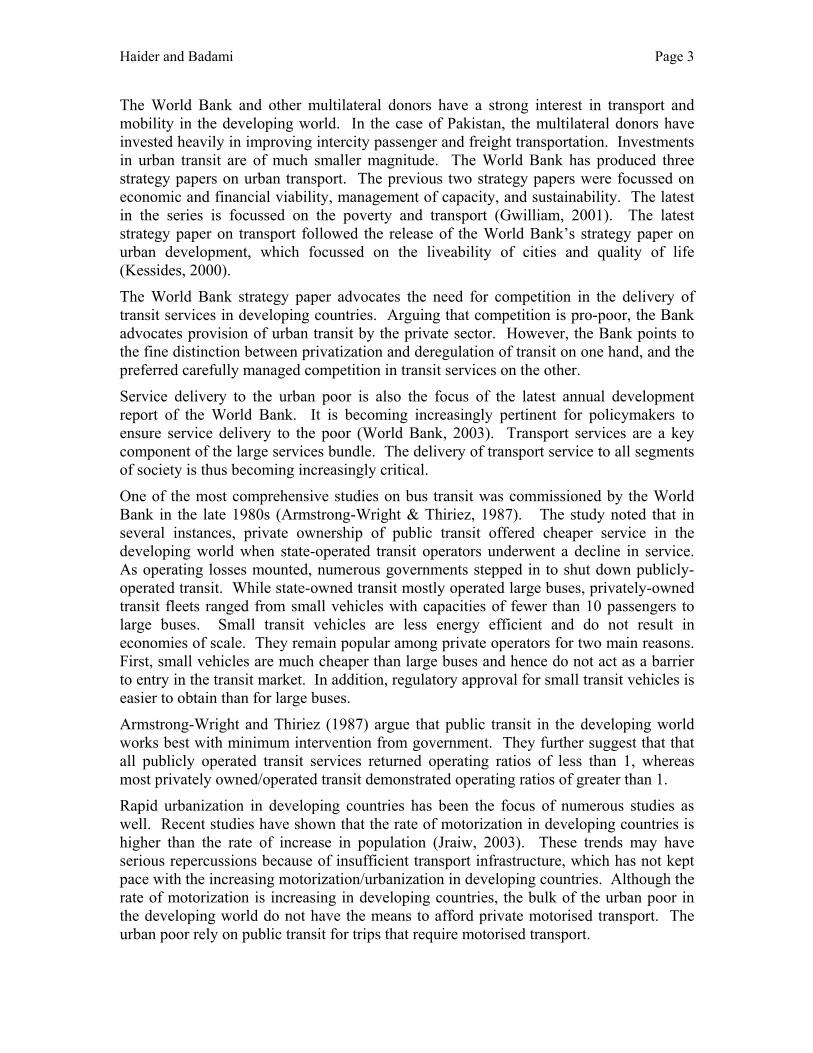
Pakistan’s population has been growing at a rate of 2.5% per year. The growth rate for urban centres is even higher. In 1981, the rural population accounted for 72% of the total population. That number had declined to 68% by 1998 (Table 1). Table 1: Demographics and population growth rate in Pakistan 1998 Pop 1981 Pop Growth Rate Pop%98 Pop%81 Pakistan 130,579,571 84,253,644 2.61% Rural 88,121,232 60,426,305 2.24% 67.5% 71.7% Urban 42,458,339 23,827,339 3.46% 32.5% 28.3%
It is pertinent to mention here that census statistics in Pakistan are not free from criticism. Researchers have found it odd that the provincial shares of population, despite major demographic changes since 1981, have remained unchanged since 1981 (Weiss, 1999).
Islamabad is the capital of Pakistan. The city was purpose-built in the 1960s, when the capital was shifted from Karachi. Islamabad was placed adjacent to an historical town, Rawalpindi, which has experienced rapid urbanization in the recent past. Being the federal capital, Islamabad is home to most federal government operations, the elected government, the Supreme Court, and the diplomatic missions. Rawalpindi is home to the General Headquarters of Pakistan’s Armed Forces.
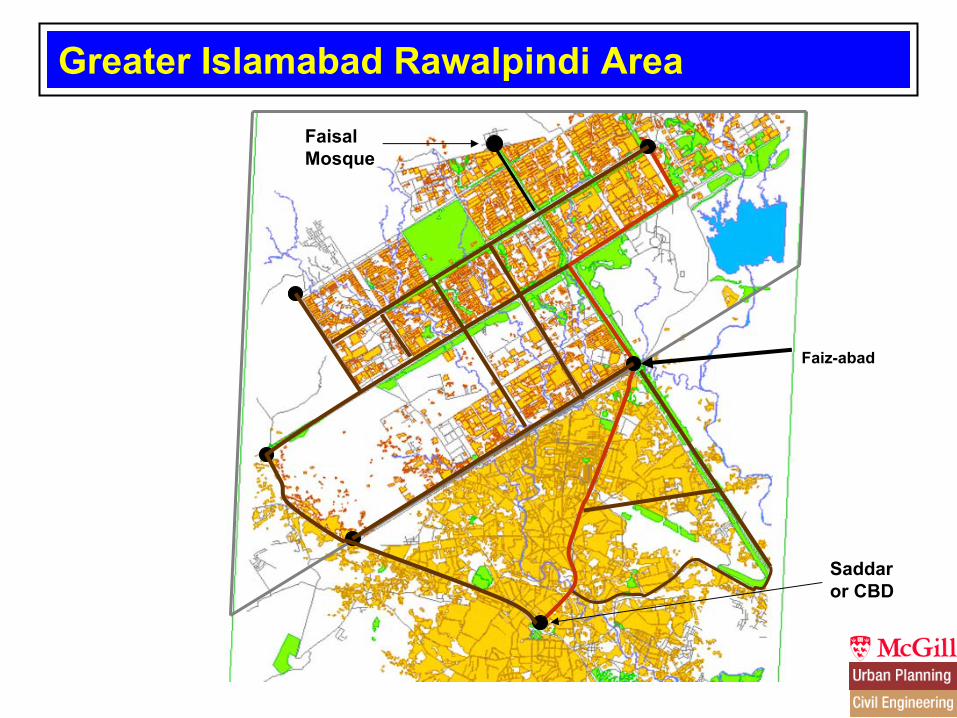
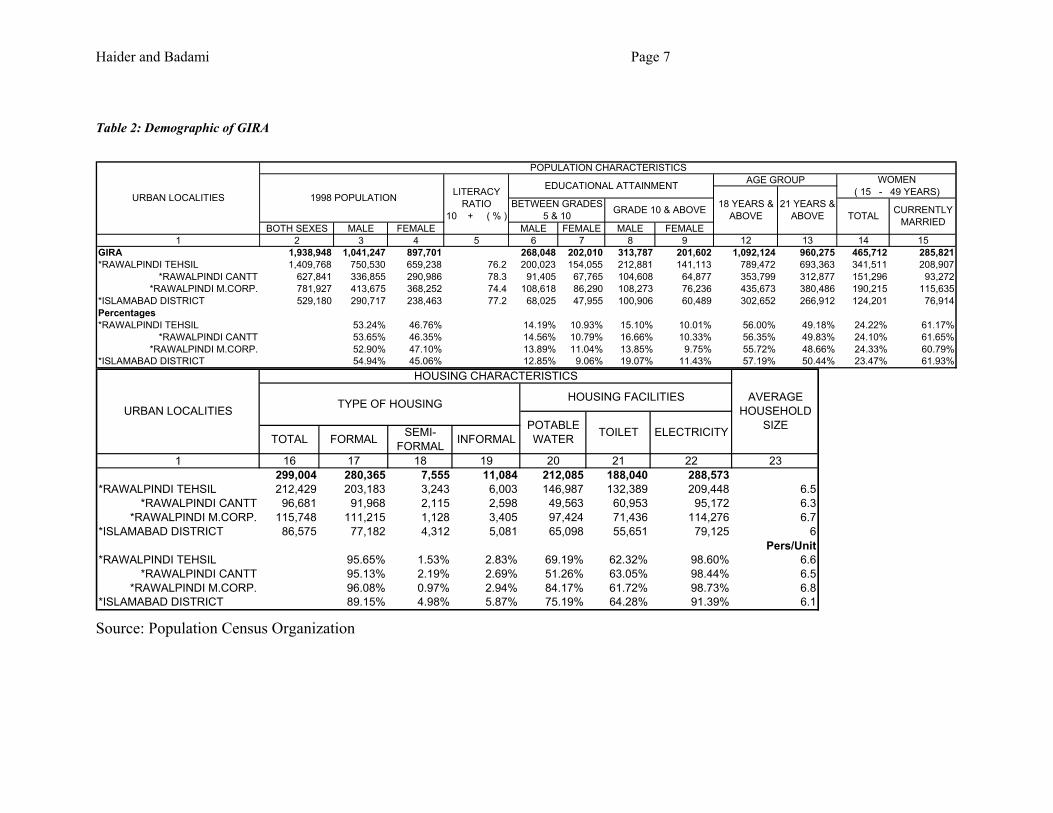
The urban areas of Islamabad and Rawalpindi constitute GIRA (Figure 1), and have a population of 1.9 million (Table 2). The mean annual rate of population increase in GIRA is around 4%, which is two times higher than that of rural areas in Rawalpindi District. Rawalpindi City (Tehsil) is divided in two municipal jurisdictions: the Rawalpindi Cantonment Board, urban areas under the control of Armed Forces, and the Rawalpindi Municipal Corporation. The Cantonment Boards are part of the British legacy in Pakistan. Historically, Cantonment Boards offered better living conditions than the Municipal Corporations. This is not true any more for most cities in Pakistan.
According to the latest census in 1998, urban households in Rawalpindi District on average had a larger household size than rural households. The same was not true for Islamabad, even though higher urban household size was observed at the aggregate national levels. It was earlier hypothesised that because of large housing units with abundant lands, rural households would, on average, support larger households. This hypothesis was also consistent with the lower literacy and family planning in rural areas.
The urban Islamabad has an area of 220 square kilometres, with the highest population density of 12,000 persons per square kilometre in some areas. Urban Rawalpindi has an area of 94 sq. km., with the highest population density of 60,000 persons per sq. km (Scandiaconsult & Contrans AB, 1995).
Faiz-abad
Greater Islamabad Rawalpindi Area
Saddaror CBD
FaisalMosque
Haider and Badami Page 6
The male-to-female ratio in GIRA is 1.16. There are more males than females in the population. This phenomenon is common in South Asia. The preference for a male child has resulted in a systematic decline of females. This phenomenon has an adverse impact on the welfare of women in Pakistan. For instance, the welfare status of females is inferior to males in GIRA. A comparison of education attainment in GIRA reveals that 14% of males reported receiving education up to grade 5 compared to 11% of females. The male-female divide in education attainment widens for higher levels of education (Table 2). In addition, residents of Islamabad have reported lower levels of education attainment than the residents of Rawalpindi.
The average literacy rate reported for GIRA is around 75%. The rate of literacy should not be confused with education attainment. Table 2 suggests that approximately 30% of the population has received grade 5 or higher education. This implies that 45% of the literate in GIRA have less than grade 5 education. Therefore, the illiterate and barely literate comprise 70% of the population in GIRA. Again, there is a very high percentage of females in the illiterate population.
The urban population in Pakistan consists primarily of youth. Almost 50% of the population in GIRA is under the age of 21. This coupled with high unemployment among youth has contributed to fuelling socio-political unrest in urban Pakistan. Women in their child bearing age comprise 25% of the total population (50% of all females) in GIRA. Almost 60% of women in their child-bearing age are married. These trends hint at higher fertility rates in the future in GIRA.
The latest census in 1998 reported 300,000 housing units in GIRA. Most housing in GIRA is characterised as formal housing. Islamabad in comparison to Rawalpindi has a lower share of formal housing. Though a significantly large percentage of housing units is characterised as formal, it does not imply that all basic amenities are available to those housing units. For instance, 99% of housing units in Rawalpindi and 91% housing units in Islamabad have electricity. On the other hand, the situation water supply and sewerage paints a different picture. Only 51% of houses in Rawalpindi Cantonment and 84% houses in Rawalpindi Municipal Corporation have access to in-house potable water. Almost 75% housing units in Islamabad have access to potable water. Similarly, 63% housing units in GIRA were equipped with toilets, which again may not be connected to a proper sewerage system.
Average number of persons per housing unit in GIRA is 6.5. Most housing units in the region have fewer than three rooms, which suggest crowding in housing units with two or more persons per room.
Haider and Badami Page 7
Table 2: Demographic of GIRA
BOTH SEXES MALE FEMALE MALE FEMALE MALE FEMALE1 2 3 4 5 6 7 8 9 12 13 14 15
GIRA 1,938,948 1,041,247 897,701 268,048 202,010 313,787 201,602 1,092,124 960,275 465,712 285,821*RAWALPINDI TEHSIL 1,409,768 750,530 659,238 76.2 200,023 154,055 212,881 141,113 789,472 693,363 341,511 208,907
*RAWALPINDI CANTT 627,841 336,855 290,986 78.3 91,405 67,765 104,608 64,877 353,799 312,877 151,296 93,272*RAWALPINDI M.CORP. 781,927 413,675 368,252 74.4 108,618 86,290 108,273 76,236 435,673 380,486 190,215 115,635
*ISLAMABAD DISTRICT 529,180 290,717 238,463 77.2 68,025 47,955 100,906 60,489 302,652 266,912 124,201 76,914Percentages*RAWALPINDI TEHSIL 53.24% 46.76% 14.19% 10.93% 15.10% 10.01% 56.00% 49.18% 24.22% 61.17%
*RAWALPINDI CANTT 53.65% 46.35% 14.56% 10.79% 16.66% 10.33% 56.35% 49.83% 24.10% 61.65%*RAWALPINDI M.CORP. 52.90% 47.10% 13.89% 11.04% 13.85% 9.75% 55.72% 48.66% 24.33% 60.79%
*ISLAMABAD DISTRICT 54.94% 45.06% 12.85% 9.06% 19.07% 11.43% 57.19% 50.44% 23.47% 61.93%
URBAN LOCALITIES
POPULATION CHARACTERISTICS
1998 POPULATION LITERACY RATIO
10 + ( % )
EDUCATIONAL ATTAINMENT AGE GROUP WOMEN ( 15 - 49 YEARS)
18 YEARS & ABOVE
21 YEARS & ABOVE
BETWEEN GRADES 5 & 10 GRADE 10 & ABOVE TOTAL CURRENTLY
MARRIED
1 16 17 18 19 20 21 22 23299,004 280,365 7,555 11,084 212,085 188,040 288,573
*RAWALPINDI TEHSIL 212,429 203,183 3,243 6,003 146,987 132,389 209,448 6.5*RAWALPINDI CANTT 96,681 91,968 2,115 2,598 49,563 60,953 95,172 6.3
*RAWALPINDI M.CORP. 115,748 111,215 1,128 3,405 97,424 71,436 114,276 6.7*ISLAMABAD DISTRICT 86,575 77,182 4,312 5,081 65,098 55,651 79,125 6
Pers/Unit*RAWALPINDI TEHSIL 95.65% 1.53% 2.83% 69.19% 62.32% 98.60% 6.6
*RAWALPINDI CANTT 95.13% 2.19% 2.69% 51.26% 63.05% 98.44% 6.5*RAWALPINDI M.CORP. 96.08% 0.97% 2.94% 84.17% 61.72% 98.73% 6.8
*ISLAMABAD DISTRICT 89.15% 4.98% 5.87% 75.19% 64.28% 91.39% 6.1
HOUSING CHARACTERISTICS
AVERAGE HOUSEHOLD
SIZE
TYPE OF HOUSING HOUSING FACILITIES
POTABLE WATER TOILET ELECTRICITYTOTAL FORMAL SEMI-
FORMAL INFORMAL
URBAN LOCALITIES
Source: Population Census Organization
Haider and Badami Page 8
4.2. Urban Poverty in Pakistan
This section relies on household surveys conducted by the Federal Bureau of Statistics and Pakistan Institute of Development Economics (PIDE) to present the state of urban poverty in Pakistan. The very definition of poverty line is not free from controversy. There exist numerous definitions of urban poverty in Pakistan. However, this paper shies away from the debate on how urban poverty should be estimated and instead focuses upon the generally accepted definition of poverty in Pakistan.1
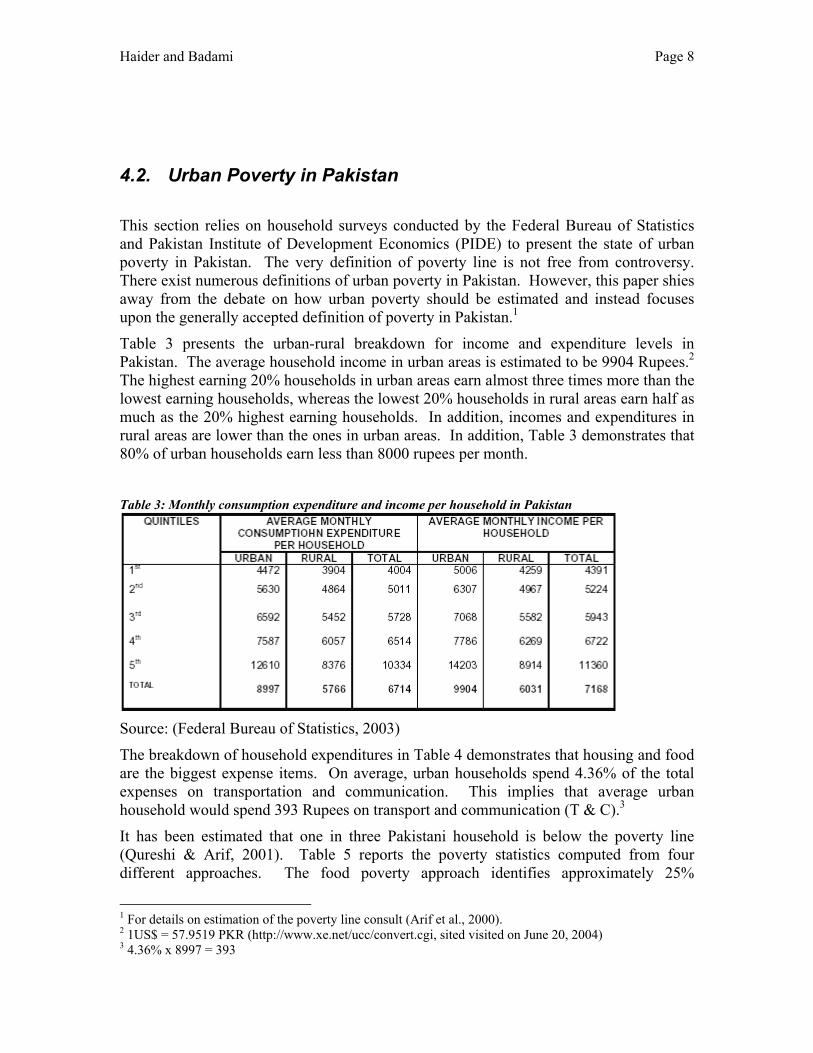
Table 3 presents the urban-rural breakdown for income and expenditure levels in Pakistan. The average household income in urban areas is estimated to be 9904 Rupees.2 The highest earning 20% households in urban areas earn almost three times more than the lowest earning households, whereas the lowest 20% households in rural areas earn half as much as the 20% highest earning households. In addition, incomes and expenditures in rural areas are lower than the ones in urban areas. In addition, Table 3 demonstrates that 80% of urban households earn less than 8000 rupees per month.
Table 3: Monthly consumption expenditure and income per household in Pakistan
Source: (Federal Bureau of Statistics, 2003)
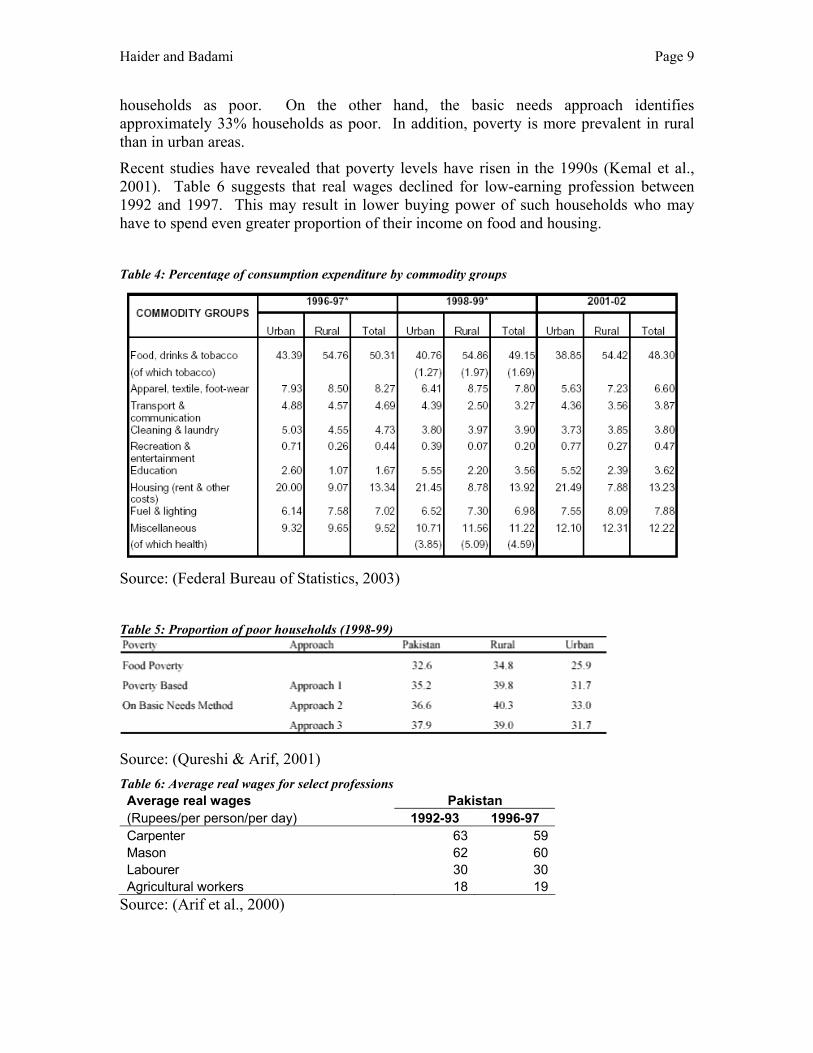
The breakdown of household expenditures in Table 4 demonstrates that housing and food are the biggest expense items. On average, urban households spend 4.36% of the total expenses on transportation and communication. This implies that average urban household would spend 393 Rupees on transport and communication (T & C).3
It has been estimated that one in three Pakistani household is below the poverty line (Qureshi & Arif, 2001). Table 5 reports the poverty statistics computed from four different approaches. The food poverty approach identifies approximately 25%
1 For details on estimation of the poverty line consult (Arif et al., 2000). 2 1US$ = 57.9519 PKR (http://www.xe.net/ucc/convert.cgi, sited visited on June 20, 2004) 3 4.36% x 8997 = 393
Haider and Badami Page 9
households as poor. On the other hand, the basic needs approach identifies approximately 33% households as poor. In addition, poverty is more prevalent in rural than in urban areas.
Recent studies have revealed that poverty levels have risen in the 1990s (Kemal et al., 2001). Table 6 suggests that real wages declined for low-earning profession between 1992 and 1997. This may result in lower buying power of such households who may have to spend even greater proportion of their income on food and housing.
Table 4: Percentage of consumption expenditure by commodity groups
Source: (Federal Bureau of Statistics, 2003)
Table 5: Proportion of poor households (1998-99)
Source: (Qureshi & Arif, 2001) Table 6: Average real wages for select professions Average real wages Pakistan (Rupees/per person/per day) 1992-93 1996-97 Carpenter 63 59Mason 62 60Labourer 30 30Agricultural workers 18 19
Source: (Arif et al., 2000)
Haider and Badami Page 10
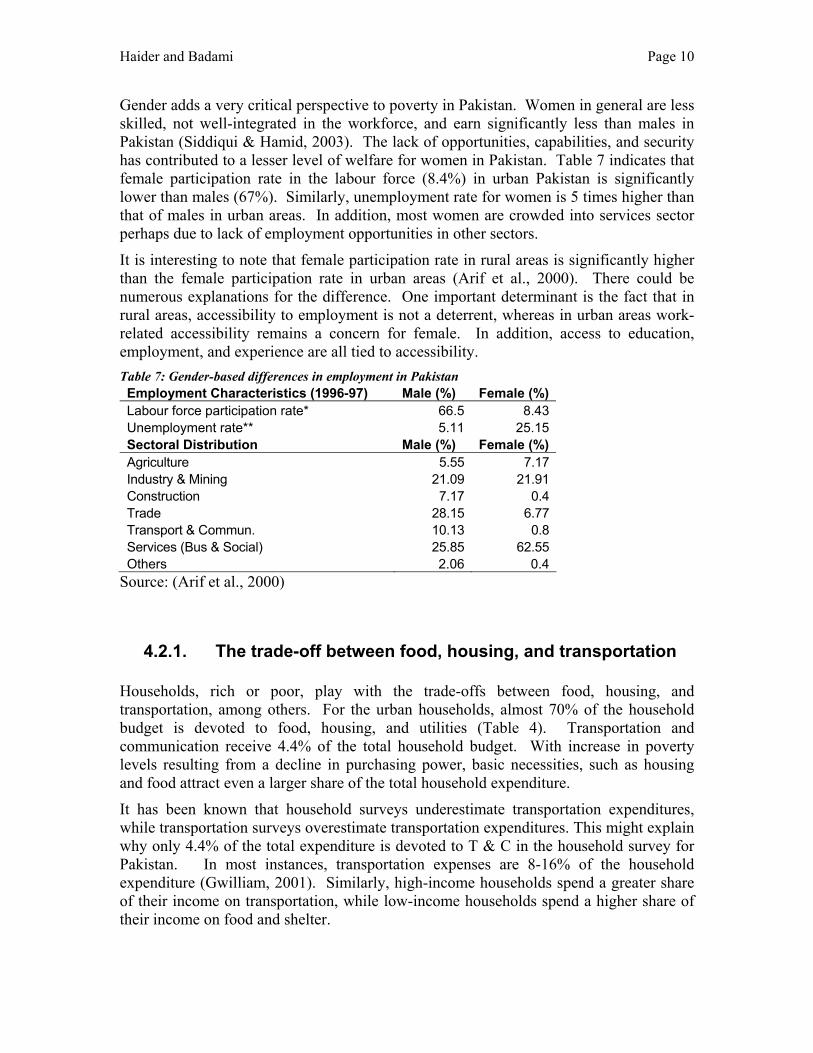
Gender adds a very critical perspective to poverty in Pakistan. Women in general are less skilled, not well-integrated in the workforce, and earn significantly less than males in Pakistan (Siddiqui & Hamid, 2003). The lack of opportunities, capabilities, and security has contributed to a lesser level of welfare for women in Pakistan. Table 7 indicates that female participation rate in the labour force (8.4%) in urban Pakistan is significantly lower than males (67%). Similarly, unemployment rate for women is 5 times higher than that of males in urban areas. In addition, most women are crowded into services sector perhaps due to lack of employment opportunities in other sectors.
It is interesting to note that female participation rate in rural areas is significantly higher than the female participation rate in urban areas (Arif et al., 2000). There could be numerous explanations for the difference. One important determinant is the fact that in rural areas, accessibility to employment is not a deterrent, whereas in urban areas work-related accessibility remains a concern for female. In addition, access to education, employment, and experience are all tied to accessibility. Table 7: Gender-based differences in employment in Pakistan Employment Characteristics (1996-97) Male (%) Female (%) Labour force participation rate* 66.5 8.43Unemployment rate** 5.11 25.15Sectoral Distribution Male (%) Female (%) Agriculture 5.55 7.17Industry & Mining 21.09 21.91Construction 7.17 0.4Trade 28.15 6.77Transport & Commun. 10.13 0.8Services (Bus & Social) 25.85 62.55Others 2.06 0.4
Source: (Arif et al., 2000)
4.2.1. The trade-off between food, housing, and transportation Households, rich or poor, play with the trade-offs between food, housing, and transportation, among others. For the urban households, almost 70% of the household budget is devoted to food, housing, and utilities (Table 4). Transportation and communication receive 4.4% of the total household budget. With increase in poverty levels resulting from a decline in purchasing power, basic necessities, such as housing and food attract even a larger share of the total household expenditure.
It has been known that household surveys underestimate transportation expenditures, while transportation surveys overestimate transportation expenditures. This might explain why only 4.4% of the total expenditure is devoted to T & C in the household survey for Pakistan. In most instances, transportation expenses are 8-16% of the household expenditure (Gwilliam, 2001). Similarly, high-income households spend a greater share of their income on transportation, while low-income households spend a higher share of their income on food and shelter.
Haider and Badami Page 11
Given the budgetary constraints, how much can households in different income categories spend on transportation? In addition, when do transport expenses become prohibitive for low-income households? The Armstrong-Wright Maxim states that mobility-related discrimination realises when more than 10% of households spend more than 15% of their income on work-related journeys.
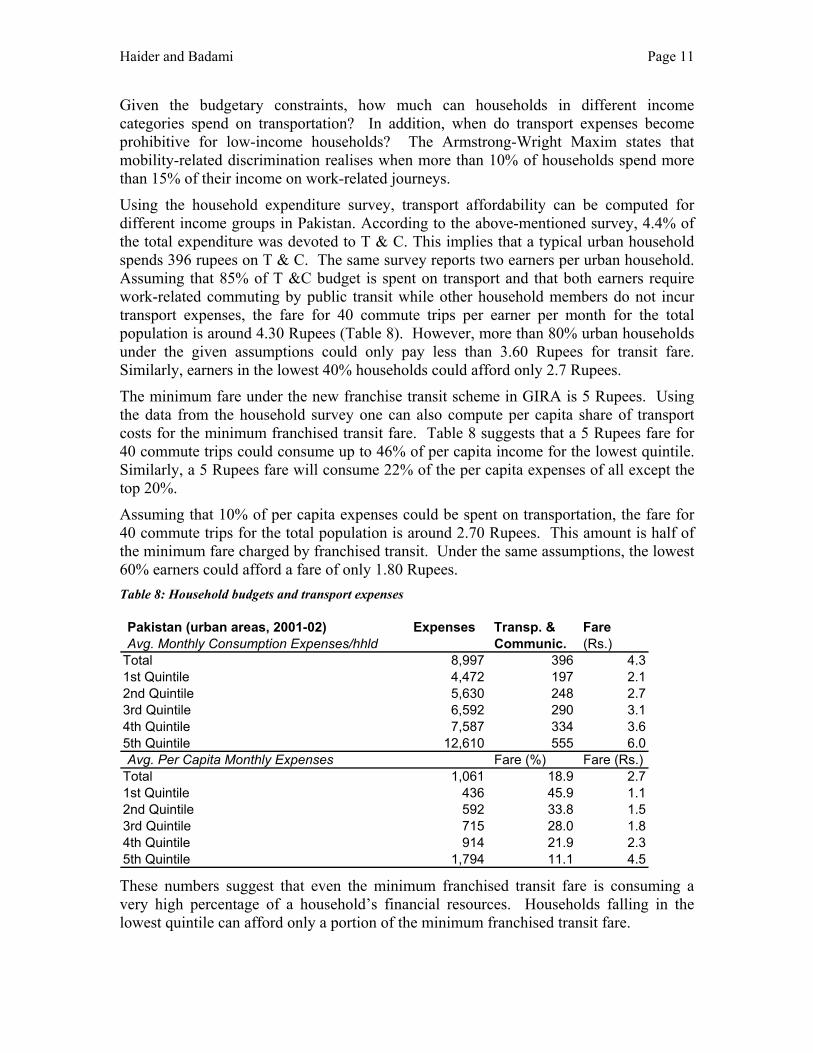
Using the household expenditure survey, transport affordability can be computed for different income groups in Pakistan. According to the above-mentioned survey, 4.4% of the total expenditure was devoted to T & C. This implies that a typical urban household spends 396 rupees on T & C. The same survey reports two earners per urban household. Assuming that 85% of T &C budget is spent on transport and that both earners require work-related commuting by public transit while other household members do not incur transport expenses, the fare for 40 commute trips per earner per month for the total population is around 4.30 Rupees (Table 8). However, more than 80% urban households under the given assumptions could only pay less than 3.60 Rupees for transit fare. Similarly, earners in the lowest 40% households could afford only 2.7 Rupees.
The minimum fare under the new franchise transit scheme in GIRA is 5 Rupees. Using the data from the household survey one can also compute per capita share of transport costs for the minimum franchised transit fare. Table 8 suggests that a 5 Rupees fare for 40 commute trips could consume up to 46% of per capita income for the lowest quintile. Similarly, a 5 Rupees fare will consume 22% of the per capita expenses of all except the top 20%.
Assuming that 10% of per capita expenses could be spent on transportation, the fare for 40 commute trips for the total population is around 2.70 Rupees. This amount is half of the minimum fare charged by franchised transit. Under the same assumptions, the lowest 60% earners could afford a fare of only 1.80 Rupees. Table 8: Household budgets and transport expenses
Pakistan (urban areas, 2001-02) Expenses Transp. & FareAvg. Monthly Consumption Expenses/hhld Communic. (Rs.)
Total 8,997 396 4.31st Quintile 4,472 197 2.12nd Quintile 5,630 248 2.73rd Quintile 6,592 290 3.14th Quintile 7,587 334 3.65th Quintile 12,610 555 6.0Avg. Per Capita Monthly Expenses Fare (%) Fare (Rs.)
Total 1,061 18.9 2.71st Quintile 436 45.9 1.12nd Quintile 592 33.8 1.53rd Quintile 715 28.0 1.84th Quintile 914 21.9 2.35th Quintile 1,794 11.1 4.5 These numbers suggest that even the minimum franchised transit fare is consuming a very high percentage of a household’s financial resources. Households falling in the lowest quintile can afford only a portion of the minimum franchised transit fare.
Haider and Badami Page 12
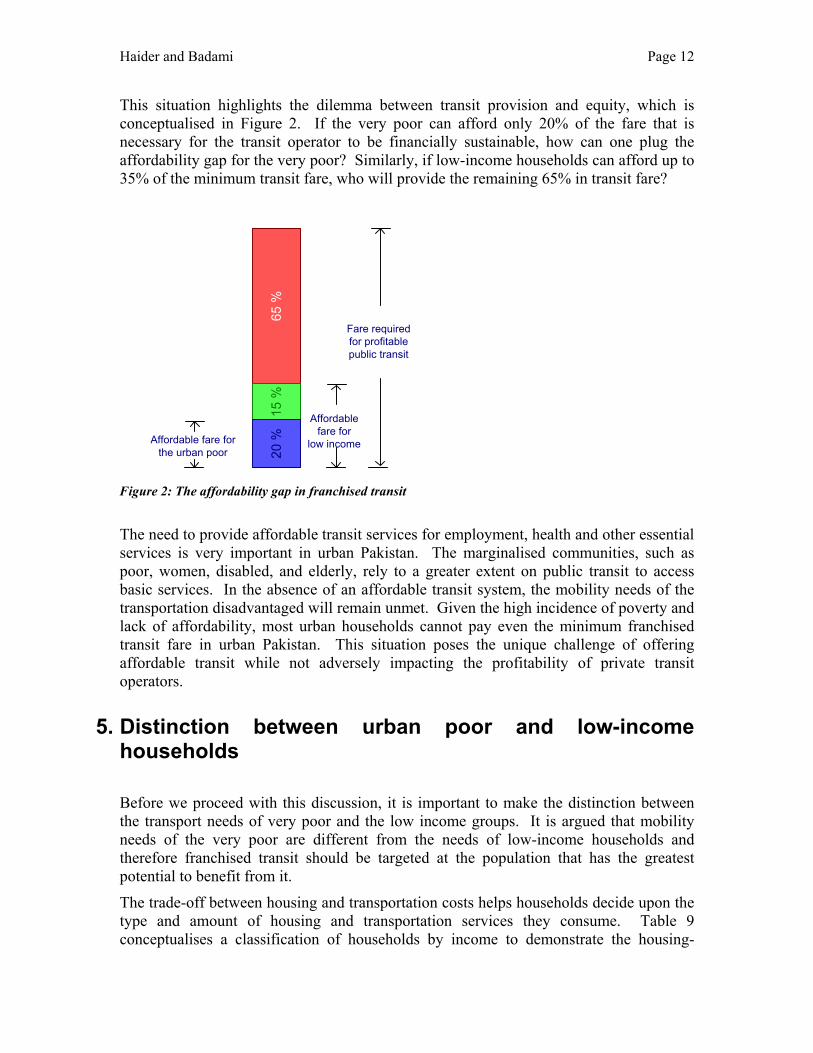
This situation highlights the dilemma between transit provision and equity, which is conceptualised in Figure 2. If the very poor can afford only 20% of the fare that is necessary for the transit operator to be financially sustainable, how can one plug the affordability gap for the very poor? Similarly, if low-income households can afford up to 35% of the minimum transit fare, who will provide the remaining 65% in transit fare?
Affordable fare forthe urban poor
65 %
15 %
20 %
Affordablefare for
low income
Fare requiredfor profitablepublic transit
Figure 2: The affordability gap in franchised transit
The need to provide affordable transit services for employment, health and other essential services is very important in urban Pakistan. The marginalised communities, such as poor, women, disabled, and elderly, rely to a greater extent on public transit to access basic services. In the absence of an affordable transit system, the mobility needs of the transportation disadvantaged will remain unmet. Given the high incidence of poverty and lack of affordability, most urban households cannot pay even the minimum franchised transit fare in urban Pakistan. This situation poses the unique challenge of offering affordable transit while not adversely impacting the profitability of private transit operators.
5. Distinction between urban poor and low-income households
Before we proceed with this discussion, it is important to make the distinction between the transport needs of very poor and the low income groups. It is argued that mobility needs of the very poor are different from the needs of low-income households and therefore franchised transit should be targeted at the population that has the greatest potential to benefit from it.
The trade-off between housing and transportation costs helps households decide upon the type and amount of housing and transportation services they consume. Table 9 conceptualises a classification of households by income to demonstrate the housing-
Haider and Badami Page 13
transportation trade-offs. It could be seen from the table that very poor households live in informal housing and often locate very close to their employment. Examples are construction workers who sleep on-site. Their mobility needs are different from low-income households whose housing location is constrained by affordability. The low- to mid-income households depend on public transit more than either very poor or high-income households.
Table 9: Housing-Transportation trade-off in GIRA and its impact on transit
Poverty Level Housing Mode of travel Potential for Transit
Very Poor Informal housing NMT* None Poor Inadequate housing NMT/public transit Low Low-income Semi-adequate housing Public transit/NMT Very high Lower mid-income Less than sufficient housing M2W**/Transit Very High Middle income Sufficient housing M2W/Transit High Upper mid-income Adequate housing Auto/M2W Low High income Adequate housing Auto None
* NMT: Non-motorised travel by walk or bike modes
** M2W: Motorised two-wheelers
This paper argues that improving public transit services is likely to have the greatest impact on households that fall within the mid-income strata. These households are better equipped to climb out of poverty and increase their consumption of private transport services. If transit services are designed for the very poor, who may not rely on transit as much as it is required by the mid-income households, the quality of such transit service is likely to be inferior, which may not be attractive to mid-income households.
Franchised transit offers quality transit services, but at a premium. If transit operators are forced to operate private transit at very low fares, such services are less likely to be financially sustainable and they might disappear over time. Similarly, the fare structure necessary for profit may not be affordable for even the middle-income households. This situation has been illustrated in Figure 2. The challenge, therefore, is to determine how to plug the affordability gap.
6. Mobility Issues in GIRA GIRA comprises urban areas of two jurisdictions with different planning mandates and supply constraints. In addition, the imbalance between employment and affordable housing results in large number of work related trips for residents of Rawalpindi who are employed in Islamabad.
The urban transportation situation in GIRA depicts characteristics similar to the ones in other mid-sized cities in the developing world. The diversity in modes is another impediment to effective transportation management in GIRA. Horse driven carts, bicycles, small transit vehicles, two- and three-wheelers compete for space on urban
Haider and Badami Page 14
arterials and freeways along with high-speed vehicles such as automobiles and buses. The vehicle mix reduces the performance of transport systems, resulting in low average speed, higher fuel use, high rate of accidents and higher GHG emissions.
6.1. Non-franchised Transit in GIRA In 1994-95, 3229 vehicles licensed to operate public transit in GIRA (Table 10). Large transit vehicles were predominantly licensed in Islamabad, while smaller vehicles were licensed in Rawalpindi. Almost 50% of the transit fleet comprised Suzuki pickups, which have a limited capacity of 10-12 commuters. Less than 3% of the transit fleet comprised buses. This suggests that transit system in GIRA is primarily operating smaller vehicles, which has resulted in an inefficient transit system with limited passenger-carrying capacity. Table 10: Public transit vehicles in GIRA
Vehicle Type Islamabad Rawalpindi Both Cities Total %Bus 78 78 2.4%Minibus 312 312 9.7%Wagon 485 55 685 1225 37.9%Pickup 175 1139 300 1614 50.0%Total 738 1194 1297 3229 100
Licensed in
Source: (Scandiaconsult & Contrans AB, 1995)
There were only 48 transit routes in GIRA. Some routes were confined to either Rawalpindi or Islamabad, while others were allowed to ply between Rawalpindi and Islamabad (Table 11). Interestingly enough, Islamabad (with only a quarter of the region’s total population) had more transit routes than Rawalpindi. Table 11: Transit routes in GIRA Vehicle Type Islamabad Rawalpindi Both Cities TotalBus Routes 2 4 6Minibus routes 5 5Wagon Routes 7 2 9 18Pickup Routes 6 9 4 19Total 15 11 22 48 Source: (Scandiaconsult & Contrans AB, 1995)
The crowded bus stops in GIRA suggest that the supply of transit services on select routes do not respond well to the demand. Swedish consultants tried to determine if there were enough transit vehicles on the road to cater to the demand. They conducted a survey of select transit routes and determined that in some corridors there were 2.5 times more vehicles plying the route than were actually licensed (Table 12). This suggests that the traffic authorities had grossly underestimated the demand for transit in those corridors. Therefore, private transit operators were operating illegally on routes with high demand.
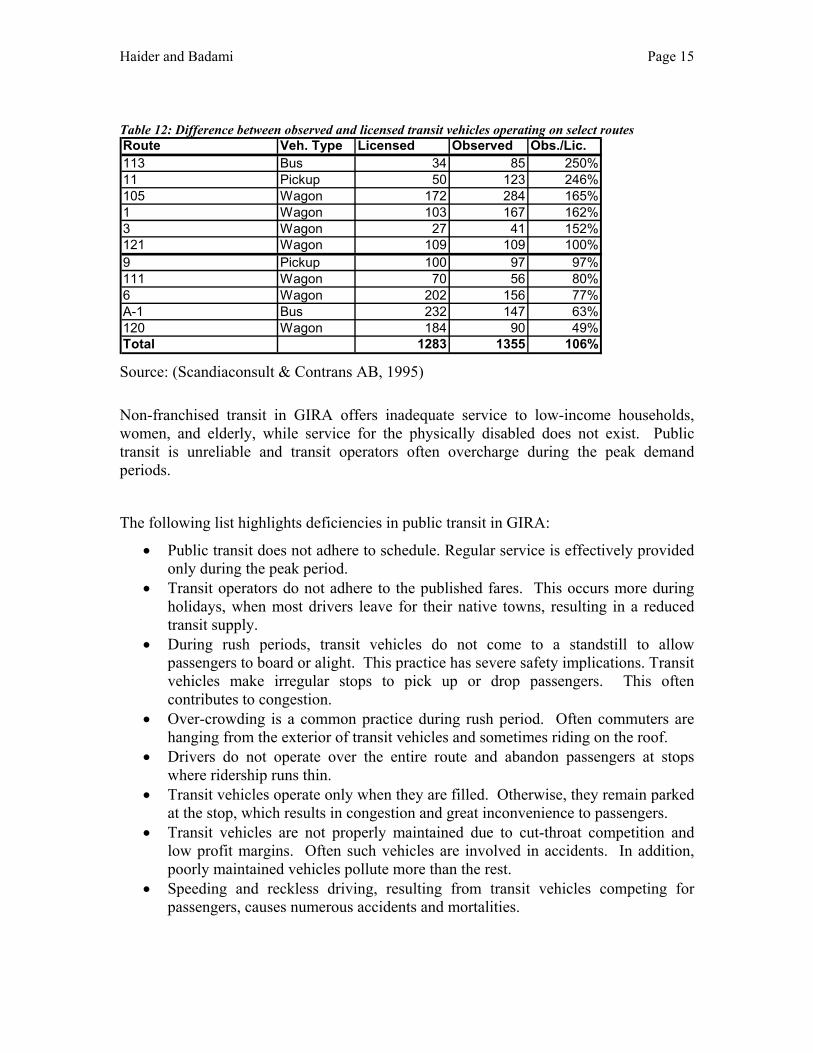
Haider and Badami Page 15
Table 12: Difference between observed and licensed transit vehicles operating on select routes Route Veh. Type Licensed Observed Obs./Lic.113 Bus 34 85 250%11 Pickup 50 123 246%105 Wagon 172 284 165%1 Wagon 103 167 162%3 Wagon 27 41 152%121 Wagon 109 109 100%9 Pickup 100 97 97%111 Wagon 70 56 80%6 Wagon 202 156 77%A-1 Bus 232 147 63%120 Wagon 184 90 49%Total 1283 1355 106% Source: (Scandiaconsult & Contrans AB, 1995) Non-franchised transit in GIRA offers inadequate service to low-income households, women, and elderly, while service for the physically disabled does not exist. Public transit is unreliable and transit operators often overcharge during the peak demand periods.
The following list highlights deficiencies in public transit in GIRA:
• Public transit does not adhere to schedule. Regular service is effectively provided only during the peak period.
• Transit operators do not adhere to the published fares. This occurs more during holidays, when most drivers leave for their native towns, resulting in a reduced transit supply.
• During rush periods, transit vehicles do not come to a standstill to allow passengers to board or alight. This practice has severe safety implications. Transit vehicles make irregular stops to pick up or drop passengers. This often contributes to congestion.
• Over-crowding is a common practice during rush period. Often commuters are hanging from the exterior of transit vehicles and sometimes riding on the roof.
• Drivers do not operate over the entire route and abandon passengers at stops where ridership runs thin.
• Transit vehicles operate only when they are filled. Otherwise, they remain parked at the stop, which results in congestion and great inconvenience to passengers.
• Transit vehicles are not properly maintained due to cut-throat competition and low profit margins. Often such vehicles are involved in accidents. In addition, poorly maintained vehicles pollute more than the rest.
• Speeding and reckless driving, resulting from transit vehicles competing for passengers, causes numerous accidents and mortalities.
Haider and Badami Page 16
6.1.1. Transport Safety Traffic related accidents kill at least 5000 persons per year in Pakistan. According to the World Bank estimates, Pakistan has an estimated rate of 70-plus fatalities per million persons per year (The World Bank, 2002). A better picture emerges only when rate of motorization is accounted for in the comparison. When controlled for the number of registered vehicles, Pakistan has one of the world’s worst records in traffic safety. According to recent estimates, Pakistan recorded 14.4 fatalities per 10,000 registered vehicles. In comparison, Japan recorded a fatality rate of 1.7 per 10,000 vehicles and Canada reports a fatality rate of 1.67 per 10,000 vehicles. While rates of motorisation in Japan and Canada are much higher than in Pakistan, the appalling fatality rate in Pakistan shows the dire need for intervention. The true picture will emerge only when deaths per vehicle-miles travelled are compared, which would further expose the high accident rates in Pakistan.
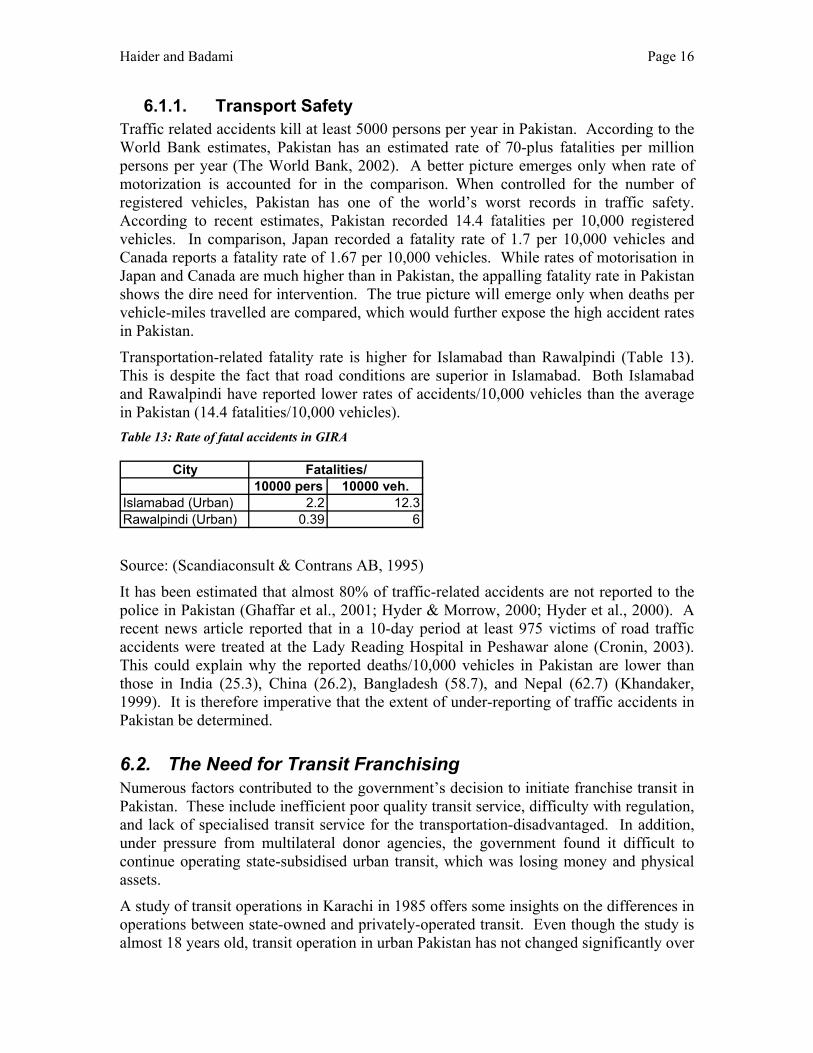
Transportation-related fatality rate is higher for Islamabad than Rawalpindi (Table 13). This is despite the fact that road conditions are superior in Islamabad. Both Islamabad and Rawalpindi have reported lower rates of accidents/10,000 vehicles than the average in Pakistan (14.4 fatalities/10,000 vehicles). Table 13: Rate of fatal accidents in GIRA
City10000 pers 10000 veh.
Islamabad (Urban) 2.2 12.3Rawalpindi (Urban) 0.39 6
Fatalities/
Source: (Scandiaconsult & Contrans AB, 1995)
It has been estimated that almost 80% of traffic-related accidents are not reported to the police in Pakistan (Ghaffar et al., 2001; Hyder & Morrow, 2000; Hyder et al., 2000). A recent news article reported that in a 10-day period at least 975 victims of road traffic accidents were treated at the Lady Reading Hospital in Peshawar alone (Cronin, 2003). This could explain why the reported deaths/10,000 vehicles in Pakistan are lower than those in India (25.3), China (26.2), Bangladesh (58.7), and Nepal (62.7) (Khandaker, 1999). It is therefore imperative that the extent of under-reporting of traffic accidents in Pakistan be determined.
6.2. The Need for Transit Franchising Numerous factors contributed to the government’s decision to initiate franchise transit in Pakistan. These include inefficient poor quality transit service, difficulty with regulation, and lack of specialised transit service for the transportation-disadvantaged. In addition, under pressure from multilateral donor agencies, the government found it difficult to continue operating state-subsidised urban transit, which was losing money and physical assets.
A study of transit operations in Karachi in 1985 offers some insights on the differences in operations between state-owned and privately-operated transit. Even though the study is almost 18 years old, transit operation in urban Pakistan has not changed significantly over
Haider and Badami Page 17
time. Publicly-operated transit providers were able to operate only 40% of their fleet owing to poor maintenance (Armstrong-Wright & Thiriez, 1987). Private operators, on the other hand, operated 70% of their fleets. Similarly, the employee to bus ratio was two times higher for public operators than for private transit operators. Because of these cost factors, publicly-owned transit was more expensive to operate than the privately-owned transit.
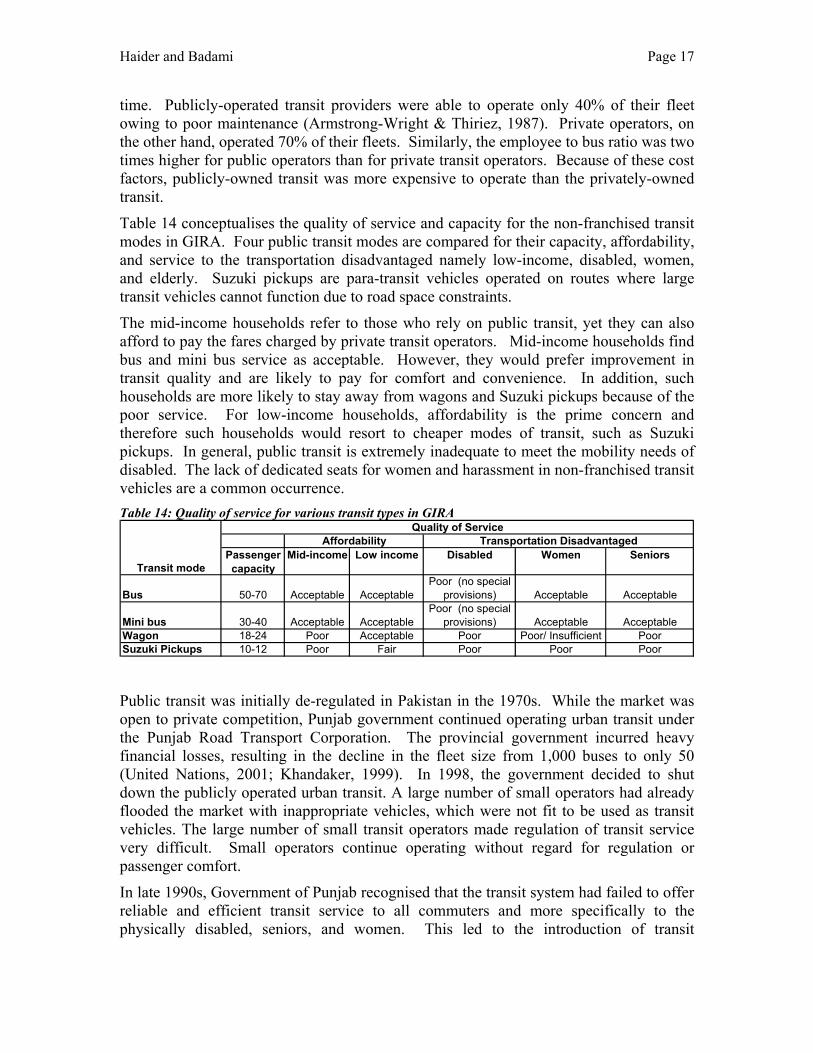
Table 14 conceptualises the quality of service and capacity for the non-franchised transit modes in GIRA. Four public transit modes are compared for their capacity, affordability, and service to the transportation disadvantaged namely low-income, disabled, women, and elderly. Suzuki pickups are para-transit vehicles operated on routes where large transit vehicles cannot function due to road space constraints.
The mid-income households refer to those who rely on public transit, yet they can also afford to pay the fares charged by private transit operators. Mid-income households find bus and mini bus service as acceptable. However, they would prefer improvement in transit quality and are likely to pay for comfort and convenience. In addition, such households are more likely to stay away from wagons and Suzuki pickups because of the poor service. For low-income households, affordability is the prime concern and therefore such households would resort to cheaper modes of transit, such as Suzuki pickups. In general, public transit is extremely inadequate to meet the mobility needs of disabled. The lack of dedicated seats for women and harassment in non-franchised transit vehicles are a common occurrence. Table 14: Quality of service for various transit types in GIRA
Passenger capacity
Mid-income Low income Disabled Women Seniors
Bus 50-70 Acceptable AcceptablePoor (no special
provisions) Acceptable Acceptable
Mini bus 30-40 Acceptable AcceptablePoor (no special
provisions) Acceptable AcceptableWagon 18-24 Poor Acceptable Poor Poor/ Insufficient PoorSuzuki Pickups 10-12 Poor Fair Poor Poor Poor
Transit mode
Quality of ServiceAffordability Transportation Disadvantaged
Public transit was initially de-regulated in Pakistan in the 1970s. While the market was open to private competition, Punjab government continued operating urban transit under the Punjab Road Transport Corporation. The provincial government incurred heavy financial losses, resulting in the decline in the fleet size from 1,000 buses to only 50 (United Nations, 2001; Khandaker, 1999). In 1998, the government decided to shut down the publicly operated urban transit. A large number of small operators had already flooded the market with inappropriate vehicles, which were not fit to be used as transit vehicles. The large number of small transit operators made regulation of transit service very difficult. Small operators continue operating without regard for regulation or passenger comfort.
In late 1990s, Government of Punjab recognised that the transit system had failed to offer reliable and efficient transit service to all commuters and more specifically to the physically disabled, seniors, and women. This led to the introduction of transit
Haider and Badami Page 18
franchising, where the government allowed a franchise to operate exclusively on a route in return for guaranteeing a certain level of service.
6.3. Public Transit Franchising in Punjab
According to the government, following are the salient feature of Punjab’s franchising scheme:4
• Franchise of a route is awarded through a transparent and competitive bidding process.
• Franchise period is 10 years. • Franchise affords exclusivity of operations on the franchised route, provided the
franchisee is able to cater to the entire load of passengers; • Fares are flexible. • A subsidy of 4% and 8% is offered on the mark-up of loans obtained by the
operator for the purchase of non-air-conditioned buses and air-conditioned buses, respectively.
Bids are advertised in the press. A bids evaluation committee, made up of senior bureaucrats from the province, evaluates all bids, with special attention to the financial stability of the bidding operator. The recommended bids are sent to the provincial chief minister for approval, who issues the franchise for an initial 10-year period.
The government’s role in franchising is not merely restricted to awarding franchises or regulating fare. In Punjab, franchise operators can also lease land, terminals, and depots previously used by the (now defunct) state-owned Punjab Road Transport Corporation. The government also offers lower interest rates for loans to import buses, along with exemption from import duties. Both foreign and local franchise operators can bid for franchises. The minimum fleet requirement for large cities is 40 new buses; for small cities, 20 new buses. The government also offers protection to direct foreign investment.
Most franchise operators in Punjab were already operating inter-city transit buses (Table 15). For instance, M/s New Khan and Daewoo have been operating inter-city buses between Lahore and Rawalpindi. More established transporters had access to capital and were already familiar with the local bureaucracy – moving into urban transit proved straightforward. There are, however, new operators in the market as well. For example, M/s Varan Tours in Rawalpindi is a newcomer to the transit market.
M/s Varan Tours has added 155 buses to the transit fleet in GIRA, while another 105 buses are in the approval process. The average capacity of these new buses is around 50 to 70 commuters. This implies that the franchised buses are bringing a maximum of 18,200 seats to the GIRA transit market. This is not a net increase in the transit capacity, since franchised buses are replacing existing, substandard, transit services on the select routes.
Recent media reports suggest that mid-income commuters in general and women, who can afford franchise fares have benefited from franchise transit (Anjum, 2001). The mid-
4 (http://www.punjab.gov.pk/transport/index.htm)
Haider and Badami Page 19
income working class has welcomed courteous and efficient transit service by franchisers. Similarly, mid-income senior citizens, who need assistance in embarking and disembarking have also benefited from franchised transit. The franchise transit buses have reserved two seats in each bus for disabled commuters. However, the general population uses those seats because the mechanisms to move disabled from the origin or destination of their trip to the transit stops do not exist.
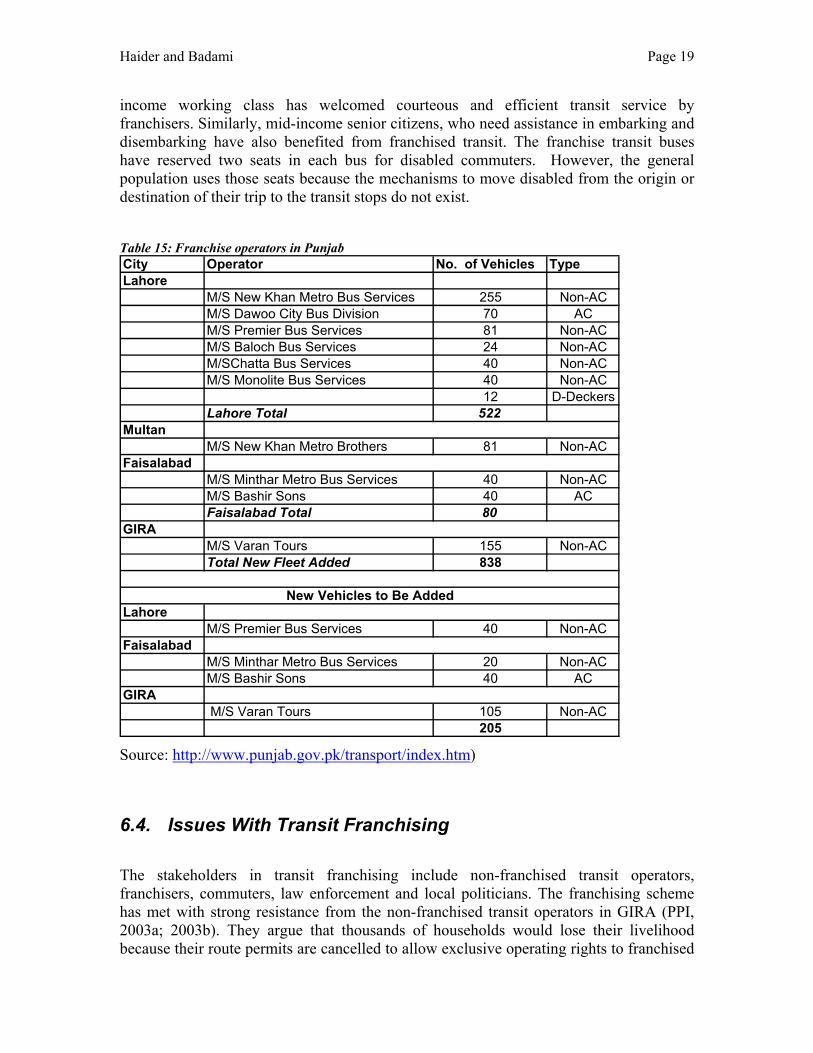
Table 15: Franchise operators in Punjab City Operator No. of Vehicles TypeLahore
M/S New Khan Metro Bus Services 255 Non-ACM/S Dawoo City Bus Division 70 ACM/S Premier Bus Services 81 Non-ACM/S Baloch Bus Services 24 Non-ACM/SChatta Bus Services 40 Non-ACM/S Monolite Bus Services 40 Non-AC
12 D-DeckersLahore Total 522
MultanM/S New Khan Metro Brothers 81 Non-AC
FaisalabadM/S Minthar Metro Bus Services 40 Non-ACM/S Bashir Sons 40 ACFaisalabad Total 80
GIRAM/S Varan Tours 155 Non-ACTotal New Fleet Added 838
LahoreM/S Premier Bus Services 40 Non-AC
FaisalabadM/S Minthar Metro Bus Services 20 Non-ACM/S Bashir Sons 40 AC
GIRA M/S Varan Tours 105 Non-AC
205
New Vehicles to Be Added
Source: http://www.punjab.gov.pk/transport/index.htm)
6.4. Issues With Transit Franchising
The stakeholders in transit franchising include non-franchised transit operators, franchisers, commuters, law enforcement and local politicians. The franchising scheme has met with strong resistance from the non-franchised transit operators in GIRA (PPI, 2003a; 2003b). They argue that thousands of households would lose their livelihood because their route permits are cancelled to allow exclusive operating rights to franchised
Haider and Badami Page 20
buses. Political unrest followed with strikes and demonstration by the affected non-franchised operators. Some commuters who could not afford to pay the higher transit fares for the franchise transit also joined in protest against the franchise transit operator.
Franchised transit has created new job opportunities while eliminating jobs for non-franchised transit operators. If the new transit system proves to be resource efficient, it is likely to offer better service using fewer resources, which may cause a net loss in employment.
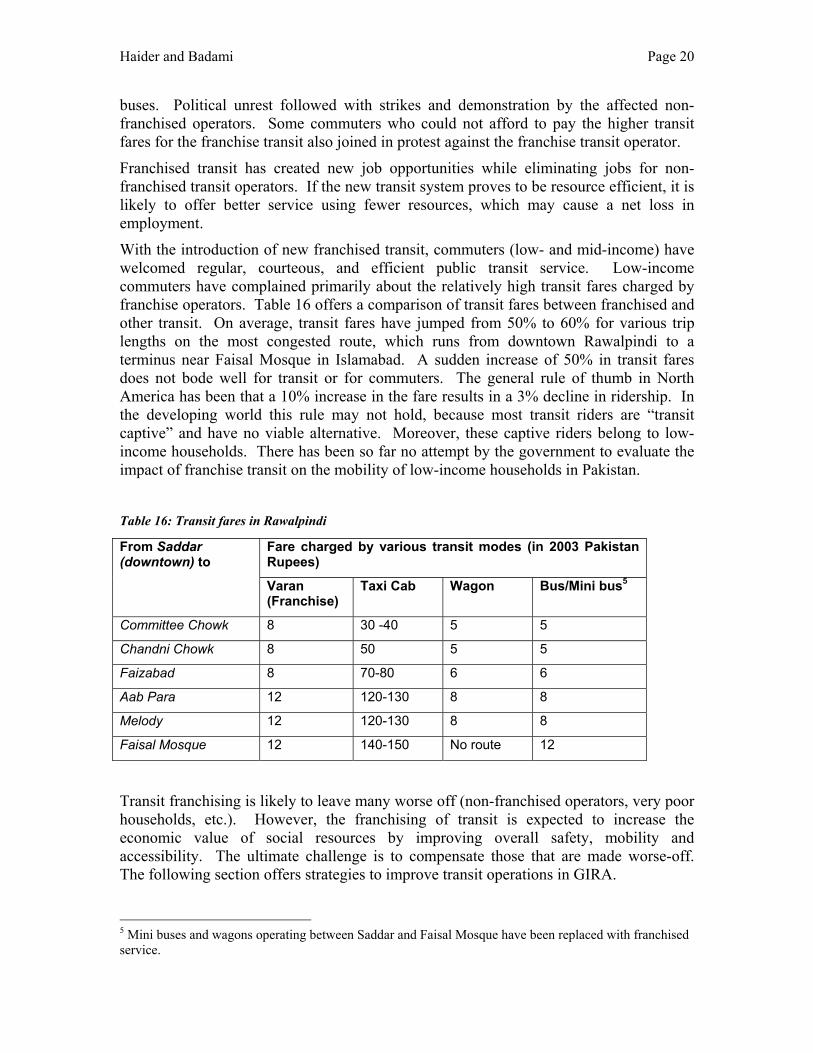
With the introduction of new franchised transit, commuters (low- and mid-income) have welcomed regular, courteous, and efficient public transit service. Low-income commuters have complained primarily about the relatively high transit fares charged by franchise operators. Table 16 offers a comparison of transit fares between franchised and other transit. On average, transit fares have jumped from 50% to 60% for various trip lengths on the most congested route, which runs from downtown Rawalpindi to a terminus near Faisal Mosque in Islamabad. A sudden increase of 50% in transit fares does not bode well for transit or for commuters. The general rule of thumb in North America has been that a 10% increase in the fare results in a 3% decline in ridership. In the developing world this rule may not hold, because most transit riders are “transit captive” and have no viable alternative. Moreover, these captive riders belong to low-income households. There has been so far no attempt by the government to evaluate the impact of franchise transit on the mobility of low-income households in Pakistan.
Table 16: Transit fares in Rawalpindi
Transit franchising is likely to leave many worse off (non-franchised operators, very poor households, etc.). However, the franchising of transit is expected to increase the economic value of social resources by improving overall safety, mobility and accessibility. The ultimate challenge is to compensate those that are made worse-off. The following section offers strategies to improve transit operations in GIRA.
5 Mini buses and wagons operating between Saddar and Faisal Mosque have been replaced with franchised service.
Fare charged by various transit modes (in 2003 Pakistan Rupees)
From Saddar (downtown) to
Varan (Franchise)
Taxi Cab Wagon Bus/Mini bus5
Committee Chowk 8 30 -40 5 5 Chandni Chowk 8 50 5 5 Faizabad 8 70-80 6 6 Aab Para 12 120-130 8 8 Melody 12 120-130 8 8 Faisal Mosque 12 140-150 No route 12
Haider and Badami Page 21
7. Recommendations for Urban Transit Improvements in GIRA
Not all transportation problems in GIRA were caused by inefficient transit systems. The land use imbalance, which is caused by concentration of government jobs in Islamabad and affordable housing in Rawalpindi, will continue to pose additional challenges. Along with improving transit services, the government should also focus on eliminating the land use imbalance. This can be achieved by creating high-density, affordable housing in Islamabad in areas conducive for transit operations and by strategically locating employment nodes in Rawalpindi to eliminate the need for workers to commute long distances.
The largest employer in Rawalpindi is the Pakistan Armed Forces. In the next five years, the General Headquarters and the related are scheduled to relocate in Islamabad. This move is likely to exacerbate the land use imbalance in GIRA.
This paper argues that transit service in GIRA should target low- to mid-income households, rather than the very poor. It has been shown earlier that income levels in urban Pakistan are not sufficient to afford even the minimum franchise fares. The government can enforce a fare regime on franchisers that may be affordable for most commuters. However, the franchise operator is likely to shut the operations if the fare regime does not return profit. In such a case, low-income households will be worse off than before. On the other hand, the government can subsidies transit operations. A direct subsidy could involve financial assistance to the operator. This has been tried in the UK, where line operators were subsidised by the state. Conversely, seniors, students, and low-income commuters could receive vouchers from the government to bridge the gap between what they can afford and what is being charged by the transit operators. This in-direct subsidy will allow operators to charge fares that keep the service profitable.
The playing field between large and small transit operators is no longer level. Transit franchising is capital intensive and therefore it has attracted established transport operators in Pakistan who have ready access to capital and political/bureaucratic authority. Transit operators, who are forced out of the market, could be given access to non-franchised routes. This, however, might not improve the quality of service or safety. Non-franchised operators might continue operating in the same inefficient and unsafe manner. This strategy merely transfers the risks from one route to another.
The idea to assist non-franchise transporters to set up cooperatives to bid for franchised routes, while attractive, might not be very successful in stemming the employment losses. For instance, Suzuki operators might not have enough resources or collateral to form a cooperative to operate franchise transit. The cost of new buses and related infrastructure is prohibitive. A preferred alternative is to offer vocational training to transit operators to ease their transition into a different career.
Franchise operators require access to publicly-owned transit infrastructure, such as bus depots, workshops, etc. The government agreed in principle to allow franchise operators the use of infrastructure of the defunct state transit authorities. In practice, such concessions were not extended to franchise operators in Rawalpindi and Karachi. The
Haider and Badami Page 22
stumbling block was the lower level bureaucracy who owed its allegiance to the bosses of defunct public transit agencies. In some instances, the prime real state assets were either sold or converted into housing for employees. For future franchising in Punjab and other provinces, the provincial governments should act fast to secure public infrastructure, which is vital for the success of transit franchising.
The exemption from import duties for buses could also adversely impact the budding bus manufacturing industry in Pakistan. According to the Pakistan Automotive Manufacturers Association, the installed capacity for bus production in Pakistan is around 1900 buses per year. The government of Pakistan should adjust tariffs and duties to strengthen up-and-coming manufacturing niche in the country.
7.1. Need for Transport Data and Planning Expertise Effective formulation of transport policy requires assessment of the commuting needs of population. This requires extensive commuting data based on origin-destination surveys. Such data do not exist for GIRA or for any major city in Pakistan. The situation in most cities in the developing world is no different. In addition, qualified personnel, capable of transportation planning and travel demand modelling, are not available. Often transport studies are conducted by untrained staff.
A recent survey of transport planning and data collection methods noted that developing countries lag behind in data collection, and expertise in transport planning (McDonald et al., 2003). In South Asia, comprehensive travel demand surveys are rare. The last such survey in Mumbai was conducted in 1979 whereas an EMME/2-based travel demand model has been operational in Shanghai for over 15 years (McDonald et al., 2003). In Pakistan, such surveys do not exist because different tiers of governments have cut funding to the agencies responsible for collecting travel behaviour information.6
Data collection and their subsequent use in transport planning/travel demand modelling require extensive resources. Data needs for effective transport planning include information on travel behaviour, traffic counts be vehicle type, fuel sales data, household expenditure surveys, and the like. In addition, there is an acute shortage of data on traffic-safety in developing countries. Any comprehensive data collection effort should also include provisions for nation-wide road safety data (Jraiw, 2003). Unless the government in developing countries identify data needs as a priority, the multi-lateral donor agencies may not invest in large-scale data collection.
Data alone cannot be the panacea especially when technical expertise and know-how to incorporate data into effective planning is missing. For instance, the imbalance between transit demand and supply in GIRA was caused by poor transport planning. The Local knowledge is critical for implementing city-specific urban transport reviews (Mitric, 2003). The combination of data and local expertise is likely to assist in studies to evaluate poverty impacts of market-oriented reforms in transport services.
There is an urgent need to embark on a capacity building programme to build expertise in transport planning in developing countries. This could be achieved through specialised
6 For instance, National Transport Research Centre in Islamabad has lost funding for the staff that collected travel behavior data in the past.
Haider and Badami Page 23
workshops to be held in collaboration with institutions of higher learning in the developing countries. The government should embark on creating centres of excellence in transportation research and should facilitate collaboration between academia, NTRC, and experts from abroad to develop an active research agenda in urban transportation planning.
In brief, the state’s role in transit planning should include the following:
• Improve and enforce regulatory frameworks. • Ensuring equity of accessibility by guaranteeing equal access through public
transit to low-income, women, elderly, and disabled. • Ensure equal and fair access to the transit franchise market. • Provide and maintain the road network. • Manage traffic and conduct transport studies to improve traffic flow. • Prepare long-term plans including integrated land use transportation plans. • Improve the R&D capacity in transport planning and modelling.
8. Conclusions Franchised urban transit has the capacity to improve mobility in GIRA. Franchised transit can offer safe, courteous, reliable and efficient transit service that has not been offered by private transit operators in GIRA in the past two decades. Franchised transit comes at a high price to the end users. The high fares of franchised might reduce the accessibility of low-income households in GIRA. It is critical that the impact of the fare hike on low-income households should be evaluated at the earliest. The government should subsidise low-income households to ensure equity. Similarly, the government should provide vocational training to those transit operators who have lost livelihoods because of franchised transit. Their transition into new careers should be preferred over assigning them non-franchised routes, which will simply move poor transit service to a different jurisdiction.
There is an urgent need of capacity building in urban/transport planning in Pakistan. Similarly, travel behaviour data do not exist for any metropolitan area in Pakistan. Efficient transportation planning requires data. Almost all investment decisions in transport sector in Pakistan are based on crystal ball forecasting. This could only change if regular travel behaviour surveys are instituted in metropolitan areas in Pakistan. This is to be accompanied by training of planners and engineers in transport planning.
Haider and Badami Page 24
9. References
Aftonso,N.S., Rezende,F., & Pavarino,V. (1998). Peace within traffic: A revolution of attitudes in Brasilia. Urban Transport Policy, 583-586.
Anjum, G. A. Franchise Operation: A New Approach Towards Improving Urban Public Transport in Pakistan. 2001. Lahore. Ref Type: Generic
Arif, G. M., Nazli, Hina, and Haq, Rashida. Basic MIMAP Poverty Profile of Pakistan. 1-53. 2000. Ref Type: Report
Armstrong-Wright, A. and Thiriez, Sebastian. Bus services: reducing costs, raising standards. 68. 1987. Washington, DC, The World Bank. Urban Transport Series. Ref Type: Report
Bryne, Paul C., Tadross, Ronald E., and Grava, Sigurd. Sadat City: Transportation planning for major new towns in developing countries. 3-4. 1979. Transportation Research Board. Ref Type: Report
Courtney, John. Transportation land policy and the urban poor in developing countries. 7-10. 1979. Transportation Research Board. Ref Type: Report
Cronin, Sean. Ramadan fasting ups mishaps in Pakistan. United Press International . 11-17-2003. Washington, DC. Ref Type: Newspaper
farahmand-Razavi,A. (1994). The role of international consultants in developing countries: Lessons from Tehran (Iran). Transport Policy, 1(2), 117-123.
Federal Bureau of Statistics. Household integrated economic survey. 1-26. 2003. Islamabad, Federal Bureau of Statistics. Ref Type: Report
Ghaffar,A., Hyder,A.A., & Bishai,D. (2001). Newspaper reports as a source for injury data in developing countries. Health Policy and Planning, 16(3), 322-325.
Haider and Badami Page 25
Gwilliam, K. M. Cities on the Move: A World Bank Urban Transport Strategy Review. 1-210. 2001. Washington, DC., The World Bank. Ref Type: Report
Hirten, John E. and Echenique, Marcial. An operational land use transport model for the Tehran region, Iran. 6-7. 1979. Transportation Research Board. Ref Type: Report
Hyder,A.A., Ghaffar,A., & Tayyeb,M. (2000). Motor vehicle crashes in Pakistan: defining the epidemic. Injury Prevention, 6, 199-202.
Hyder,A.A. & Morrow,R.H. (2000). Applying burden of disease methods to developing countries: case study of Pakistan. American Journal of Public Health, 90, 1235-1240.
Jraiw,K. (2003). Urban road transport in Asia's developing countries: Safety and efficiency strategy. Transportation Research Record, 1846, 19-25.
Kemal, A. R., Irfan, M., and Arif, G. M. MIMAP Synthesis Report: Major Conclusions and Policy Implications. 1-43. 2001. Ref Type: Report
Kessides, Christine. Cities in Transition. 1-157. 2000. Washington D.C., The World Bank. Ref Type: Report
Khandaker, Azadur Rahman. Ensuring safer highways. The Independent . 10-15-1999. Dhaka. Ref Type: Newspaper
McDonald,N.C., Porter,C.D., & Gorham,R. (2003). Availability of Travel Forecasting Methods and Data for Air Quality Planning in Developing Countries. Transportation Research Record,(1859), 110-116.
Mitric,S. (2003). Reorienting World Bank Involvement with Urban Transport in Europe and Central Asia. Transportation Research Record,(1846), 1-8.
Pakistan Press International Information Services (PPI) (2003a). Franchise scheme termed black law by transporter leader. 8 June 2003. Rawalpindi.
Pakistan Press International Information Services (PPI) (2003b). Transporters stage rally against franchised scheme. 4 June 2003. Rawalpindi.
Qureshi, Sarfraz K. and Arif, G. M. Profile of Poverty in Pakistan, 1998-99. 5-27. 2001. Ref Type: Report
Scandiaconsult and Contrans AB. Greater Islamabad/Rawalpindi Area Transportation Survey (GIRATS): Final Report. 1995. Ref Type: Report
Haider and Badami Page 26
Siddiqui, Rehana and Hamid, Shahnaz. Gender, Poverty, and Occupational Choice in Poor and Non-poor Households: An Analysis Based on the Household Survey Data of Pakistan. 8-51. 2003. Ref Type: Report
Silva,A.N.R., Lima,R.S., Raia Jr,A.A., & Waerden,P.V.D. (1998). Urban Transportation Accessibility and Social Inequity in a Developing Country. Urban Transport Policy, 709-714.
The World Bank. Pakistan Transport Assistance Strategy Note. 24354-PAK, 1-25. 2002. Washington, DC., The World BAnk. Energy and Infrastructure Unit, South Asia Region. Ref Type: Report
Turner,J. & Fouracre,P.R. (1995). Women and transport in developing countries. Transport Reviews, 15(1), 77-96.
United Nations. Review of Developments in Transport and Communications in the Escap Region, 1996-2001: Asia and the Pacific. 2001. New York, NY. Economic and Social Commission for Asia and the Pacific. Ref Type: Report
Vasconcellos,E.A. (1995). Reassessing traffic accidents in developing countries. Transport Policy, 2(4), 263-269.
Vijayakumar,S. (1986). Optimal vehicle size for road-based urban public transport in developing countries. Transport Reviews, 6(2), 193-212.
Weiss,A.M. (1999). Much ado about counting. Asian Survey, 39(4), 679-693.
World Bank. Making services work for poor people. 1-271. 2003. Washington, DC., The World Bank. Ref Type: Report