Embed Size (px)
Citation preview

Journal of Physical and Chemical Reference Data 14, 695 (1985); https://doi.org/10.1063/1.555734 14, 695
© 1985 American Institute of Physics for the National Institute of Standards and Technology.
The Homogeneous Nucleation Limits ofLiquidsCite as: Journal of Physical and Chemical Reference Data 14, 695 (1985); https://doi.org/10.1063/1.555734Published Online: 15 October 2009
C. T. Avedisian
ARTICLES YOU MAY BE INTERESTED IN
Homogeneous bubble nucleation in liquids: The classical theory revisitedThe Journal of Chemical Physics 118, 792 (2003); https://doi.org/10.1063/1.1525797
Growth of a Vapor Bubble in a Superheated LiquidJournal of Applied Physics 25, 474 (1954); https://doi.org/10.1063/1.1721664
A kinetic theory of homogeneous bubble nucleationThe Journal of Chemical Physics 118, 768 (2003); https://doi.org/10.1063/1.1526836

The Homogeneous Nucleation Limits of Liquids
c. T. Avedisian
Sibley School of Mechanical and Aerospace Engineering. Cornell University. Ithaca, New York 14853.
This work provides a critical compilation of the homogeneous nucleation limits of liquids. Data for 90 pure substances and 28 mixtures have been compiled over a range of pressures, nucleation rates, and compositions. Detailed descriptions of the experimental methods used to obtain the included data are given to assess the accuracy of measured values. Criteria used to ·select the measurements included in the final listing are discussed.
Key words: boiling; bubbles; droplets; heat transfer; homogeneous nucleation; limit of superheat; metastable stateS; superheated liquids; vapor explosions; vaporization.
Contents
1. Significance of the Limit of Supt:rbC2.l ................ . 2. The Limiting Liquid Superheat as a Physical
Property .............................................................. . 3. Experimental Methods ................................... ; ... ..
3.1.--Methods InvolvingLiquids in_Contact with. Solids .......................................................... . a. Introduction .......................................... .. b. Pulse Heating Method ........................... . c. Capillary Tube Methods ......................... . d. Bulb Method ......................................... ..
3.2. Methods Involving Liquids in Contact with Immiscible Liquids .................................... .. a. Introduction ............................................ . b. Isobaric Droplet Heating ................. ~ .... .. c. Isothermal Decompression Methods· ..... .
4. Nucleation Rates Commensurate with Experi-mental Conditions ............................................... . 4.1. Introduction ............................................... . 4.2. Floating Droplet and Capillary Tube Meth-
ods .............................................................. . 4.3. Pulse Heating Method .............................. .. 4.4. Summary .................................................... .
5. Criteria for Inclusion of Data in Tables 4-6 ....... . 5.1. Criteria .......................... ; ............................ . 5.2. Exceptions and Discrepancies .................... .
6. Data Extraction from Original Sources ............. .. 7. Nomenclature ............................ ~ ....................... .. 8. Acknowledgments ............................................... . 9. References .......................................................... ..
696
696 698
698 698· 699 699 702
702 702 703 704
704 704
704 705 706 707 707 707 707 728 729
·729
@ 1985 by the U. S. Secretary of Commerce on behalf of the United States. This copyright is assigned to the American Institute of Physics and the American Chemical Society. Reprints available from ACS; see Reprints List at back of issue.
List of Tables
1. Thermodynamic limit of superheat of several pure liquids at atmospheric pressure calculated using the Peng-Robinson equation of state ...... ..
2. Limit of superheat and flucleation-rateof-watel' at atmospheric pressure ........................................ ..
3. Approximate nucleation rates commensurate with various experimental methods .................. ..
4. Limits of superheat of pure liquids .................... . 5. Limits of superheat of binary mixtures .............. . 6. Limits of superheat of ternary mixtures ............. .
List of Figures
1. Pressure-temperature phase diagram for a pure substance (solidl1iquid and soHd/ga.c; equilihrium boundaries omitted). Path a-c corresponds to isobaric heating. Path b-c corresponds to iso- . thermal decompression ..................................... .
2. Schematic variation of nucl~ation rate with temperature at a given ambient pressure. Jo defines the minimum nucleation rate below which homogeneous nucleation is unlikely. The superheats Il.T} and Il.T2 correspond to ratesJ1 andJ2, respectively. The superheat atJmax is shown cor-responding to the thermodynamic limit ............ .
3. Schematic illustration of states corresponding to the tensile strength (i.e., limiting negative pressure). When T> T' ambient pressure is compressive. When T < T' ambient pressure is extensive.
4. Variation of limit of superheat of argon with pressure ............................................................. .
5. Variation of limit of superheat of water with pressure ............................................................. .
6. Variation of limit of superheat of ethanol with pressure ............................................................. .
697
698
706 710 722 728
696
698
701
708
708
708
0047-2689/85/030695-35/$07.00 695 J. Phys. Chem. Ref. Data, Vol. 14, No.3, 1985
696 c. T. AVEDISIAN
7. Variation of limit of superheat and tensile strengths (negative pressures) of ether with pres-sure .................................................................... .
8. Variation of limit of superheat of n-hexane with pressure ............................•.................................
9. Variation of limit of superheat of ethane/ n-propane mixtures with mole fraction propane at
708
709
1. Significance of the Limit of Superheat The homogeneous nucleation limit, or limit of super
heat, of a liquid represents the deepest possible penetration of a liquid in the domain of metastable states. At constant pressure and composition, it is the highest temperature below the critical point a liquid can sustain without undergoing a phase transition; at constant temperature, it is the lowest pressure. The practical significance of this limit resides in the . consequences of the phase transition that eventually occurs when this limit is reached. The energy released when a liquid at its limit of superheat vaporizes could create a so-called vapor explosion if a significant fraction of this energy appears in the form of a thermal detonation wave, or if bubbles grow at a rate that exceeds the ability of the surrounding liquid to acoustically respond. 16 Although this energy is orders of magnitude less_!han· t~~t typiC?al of chemi~~!.exploslons, the destructive capability of vapor explosions produced when a hot nonvolatile liquid comes in intimate contact with a cold volatile liquid is well documented in the literature.6O It is therefore important to accurately predict the conditions under which liquids can undergo vapor explosive boiling. These conditions involve initiation and propagation mechanisms. The initiation process is relevant to the present study. Subsequent events ·after the initiation phase involve dynamic and thermal considerations that are outside the scope of this work.
There has been a wide range of opinions otferedto explain vapor explosions. 16,60 There is general agreement concerning two necessary conditions:
(1) A volatile and nonvolatile liquid must come into intimate liquidlliquid contact.
(2) The temperature of the nonvolatile liquid must be above some well-defined minimum value (which we shall give the symbol "Tk" in this work) which is at least greater than the boiling point of the volatile liquid: below this threshold temperature, or well above it, vapor explosions may not occur~
Use of this simple threshold temperature criterion requires either a reliable method for estimating Tk , or a listing of measured values. The present work provides such a critically evaluated compilation. It is distinguished from other pr~vious data listings23
•57
.&2 with respect to the extent of the compilation, the inclusion of data encompassing all pressure and composition ranges, and the criteria used to test the validity of published data. The re.Qlt1ting compilation may be valuable both with respect to its relevance to vapor explosions, and for its more fundamental importance in further characterizing the physical properties of superheated liquids.
J. Phys. Chern. Ref. Data, Vol. 14, No.3, 1985
.0.101 MPa .......................................................... 709 10. Variation of limit of superheat of ethanollben
zene mixtures with mole fraction benzene at 0.101 and 0.98 MPa ........................................... 709
11. Variation oflimit of superheat of benzene/ cyclohexane mixtures with mole fraction cyclohexane at 0.101 and 0.310 MPa ..................................... 709
2. The Limiting Liquid Superheat as a Physical Property
Normal·saturation states of liquids represent a special case of equilibrium across a fiat phase boundary. Such equilibrium states are not unique. For example, a liquid that fills a vessel with perfectly smooth walls (the smoothest such walls being the surface of another immiscible liquid) may be heated to temperatures that surpass its "normal" boiling point corresponding to the ambient pressure Po.
Figure 1 schematically illustrates, on a pressure-temperature projection of a phase diagram, two possible paths that a pure, subcooled liquid may follow to become superheated. The solid line separating the stable liquid and stable vapor regions in Fig. 1 corresponds to phase equilibrium across a fiat (r~ 00 ) liquid/vapor interface. Transgression of this_phase boundaryimplie$ an absence of a planar interface between the two phases. Hence, any vapor phase present within the metastable (superheated) liquid region shown in Fig. 1 must be in the form of bubbles (r < 00 ) •. The static mechanical equilibrium of such bubbles requires that
2q PI n·Po == >0. (1)·
r
For a vapor bubble (when n·Po < 0), P> Po and r < 00. Therefore T{Po) > Ts{Po), where Ts is referred to r~oo. A superheated liquid is one for which T (Po) > Ts (Po). There is a limit to the extent to which a liquid can be heated above its normal boiling point (Ts) before a phase transition must occur. The thermodynamic state of a liquid at this theor~licall11wUlI1WIl
-- -=- ..;;::::; Liqtiid(P ,Tk} Vapor ::::::r: .... ,;-./j 0
- -:.... \tY -=---. - - - -
Critical point
./ b I.
, " Vapor pressure •. ' /' T
curve, Ps (r-oo}"" ,I
Region of "stObie" liQuid stotes ./ J! 20" .' 'I r
1 c,
Vapor stotes !i-Kinetic limit in bubble. P "Region "of.. 'I,. of superheat ~ .,. mctQ:r.tQblc liqUId It "Thermodynamic limit ~ .•. ~ states (r < CD) of superheat
I I , T s (Pol TklPolTtlPol Te
Temperature
FIG. 1. Pressur~temperature phase diagram for a pure substance (solid/ liquid and solid/gas equilibrium boundaries omitted), Path a-c corresponds to isobaric heating, Path b-c corresponds to isothermal decompression,

THE HOMOGENEOUS NUCLEATION LIMITS OF LIQUIDS 697
temperature is on the phase boundary separating the metastable and thermodynamically unstable states. This boundary, known as the spinodal curve, divides stable states from states that are inherently unstable with respect to small perturbations in certain intrinsic variables (e.g., volume along an isotherm for a pure liquid19
). For a pure liquid the spinodal curve, or thermodynamic limit of superheat (~), is defined by states for which80
api =0 (2) av T,n '
as first presented by Gibbs41 (the fluid is still stable in the "metastable" regime and is conditionally stable on the spinodal curve). Equation (2) is aconsequence of the basic extremum principle of thermodynamics, which states that the entropy is a maximum in a stable equilibrium state." At the limit of stability the second-order variation of the Helmholtz, function vanishes, along an isotherm, which leads to Eq. (2) for a pure substance. Similar formulations may be developed for multicomponent miscible mixtw't=S of llquius.lQ '
The ability to rigorously define in mathematical terms the limit of stability of a liquid supports the belief that it is a fundamental thermodynamic property. It may be considered a kind of "critical point" of a liquid corresponding to each pressure. As such we should be able to experimentally verify its existence and predict it using an appropriate equation of state. It is at this point that we face difficulties. '
Fkstiy;an equatio~of state applicable in the metastable region is needed to evaluate the terms in the appropriate stability criterion [e.g., Eq. (2) for pure liquids]. Few such equations currently exist. We are therefore forced to extrapolate existing equations of state into the region of metastable states with little data to test the accuracy of such extrapolations; the procedures for such extrapolations are not well developed, although recent, work48 has shown how a cubic equation of state could be used to predict spinodal' limits of pure liquids. ,
Secondly, the limit ofintrinsic stability is defined by the entropy-extremum principle. It can therefore only be approached but never actually reached (rather like our inability to precisely reach 0 K). Therefore, if we could accurately predict the limit of stability' Tt (Po), this value would only provide an upper limit on the temperature (or lower limit on the pressure) at which a liquid phase could exist. The best experiments would be expected to yield maximum superheat temperatures TJr. (or minimum pressures Po). such that
TdPo) < ~(Po) . (3)
Differences between Tt and Tk are often substantial and outside the range of experimental uncertainty. For example, Table I lists predicted thermodynamic limits of superheat calculated' using the Peng-Robinson57 equation of state. Also shown are the highest measured superheat temperatures Tk of the respective liquids. These values were taken from the present compilation (Table 4). The results conform to Eq. (3).
Differences between Ti and Tk can be explained by a physical mechanism for phase transitions, which presumes the existence of microscopic "seeds" or "nuclei" of the vapor phase in bulk liquid. These nuclei are the principal means by
TABLE 1. Thermodynamic limit of superheat of some pure liquids at atmo-spheric preSsure calculated using the Peng-Robinson equation of state
Ts T t Tk . Tc J(~)
Substance (K) (K) (K) (K) TtlTc (nuc1eil(cm3.s))
n-pentane 309 431 426.2 470 0.918 8X1024
n-heptane 372 499 493.7 540 0.924 8Xl<)26 n-octane 399 525 513.8 569 0.923 2XIQ26 methanol. 338 477 466.2 513 0.931 lQ29
ethanol 352 482 471.5 516 0.934 1()3° water 373 596 575.1 647 0.921 9X1028
which a liquid becomes "~ware" of an impending violation of the second law of thermodynamics as the spinodal line is approached; They are postulated to grow or decay in a more or less. random manner until a certain size of bubble is produced such that it is in unstable thermodynamic equilibrium with the surrounding liquid. These bubbles are called "critical size nuclei," and their continued growth results in complete vaporization of the metastable liquid.23
•77
Kinetic theory provides a means for predicting the birth rate of critical size nuclei. The mean rate of forming these nuclei--etrectively,· the number of critical vapor nuclei per unit volume and time (given the symbol J )-is proportional to the exponential of their energy,
J = rkr Noe -A.4>*/kTk • (4)
r is a factor to account for the possibility that nuclei larger than the critical size may decay (assuming that r = I introduces little error in predicting Tk ) and kr is a molecular evaporation rate. Solving for Tk , Eq. (4) yields
(5)
where the nucleus energy.J f/J * is given by the following wellknown expression:
.J4> * = 161TU 3 (6) 3(P-PO)2 '
where12,23,59
P~Ps exp[~(Po-Ps)]. RTk
From classical homogeneous nucleation theory, one possible expression for the product rkf may be derived as42
2n rkr~-'
1Tm (7)
For a pure liquid, the nucleation rate is then a function of two variables: liquid pressure PO) and temperature Tk (all physical properties depend on these two quantities, and Ps is only a function of temperature). For a mixture, composition (i.e., mole fraction) must be added as an additional variable.
An alternative interpretation of the nucleation rate is in terms of a waiting time. At a given temperature and pressure, we ask how long one must wait for a critical size nucleus to form in the metastable superheated liquid. In this case, 77 1'~ l/(JV) where Vis the volume ofliquid of interest. Table 2 lists calculated waiting times fot water under a pressure of 0.101 MPa. Note the characteristic precipitous vari-
J. Phys. Chem. Ref. Data, Vol. 14, No.3, 1985

698 c. T. AVEDISIAN
TABLE 2.Limit of superheat and nucleation rate of water at atmospheric pressure
T p Ps rX107 J waiting timet (K) (MPa) (MPa) (cm) (nuclei/{cm3.s}) cm3(-11 J)
500 2.58 2.61 25;2 < 10-99 > 1091 yr 550 5.91 6.10 6.76 < 10-99 > 1091 yr 560 6.83 7.10 5.2 2.7X1O- 76 1.2X 1068 yr 570 7.85 8.2 3.9 8.5X 10⁻²⁰ 3. 7X 10¹¹ yr . 575 8.39 8.8 3.4 5.7XlO-3 1.8X lOZ s 580 8.96 9.44 2.9 4.3XI09 2.3X 10- 10 s 590 10.16 10.89 2.1 4.3X 1()23 2.3x 10⁻²⁴ S
ation of waiting time (and J) with temperature, though there is a finite nucleation rate corresponding to each temperature. This fact lends some arbitrariness to a precise definition of a maximum liquid superheat based on kinetic theory. By contrast, the thermodynamic limit of superheat [e.g., Eq. (2)] is a well-clefine.d qu~ntity (albeit difficult to predict and impossible to measure). Table 2 shows that, for all practical purposes, intrinsic bubble formation within water is highly unlikely to occur at temperatures below 570 K. Thus the so-called "kinetically" defined maximum temperature, determined by Eq. (5), still represents a fairly well defined limit to the extent to which a liquid may be heated without boiling.
Figure 2 illustrates the qualitative va.ria.tion O.f J with T.
J max
Q,)
J2 -0 0::: c .2 '0 Q,)
U ::J Z
J,
AI 10'30 nuclei cm3 -s
.. , \ I
Po = constant
I I I
\
I I I
~Tf ~T2 6Tc 6Tt
~T=T-Ts FIG. 2. Schematic variation of nucleation rate with temperature at a given
ambient pressure. Jo defines the minimum nucleation rate below which homogeneous nucleation is unlikely. The superheats ATI and AT2 correspond to rates J1 and Jz, respectively. The superheat at Jmax is shown corresponding to the thermodynamic limit.
J. Phys. Chern. Ref. Data, Vol. 14, No.3, 1985
Only above a certain (arbitrarily defined) threshold nucleation rate (e.g., 10 in Fig. 2) is it meaningful to speak of an experimentally accessible limit of superheat. In practice this limiting nucleation rate is defined to correspond to Jo~ 1 cm -3 S -1. Above this value, the limit of superheat exhibits a small variation with nucleation rate.
An interesting fact that emerges from Eqs. (4)-(7) is that J (for a pure substance) apparently passes through a maximum value at a ·given pressure Po in the temperature range
I: < Tk < Tc. This result follows because J~ (rk{-;'()) as both P---+Po (i.e., along the "normal" saturation curve} and Tk ---+ Te. It is attractive to suppose that the temperature corresponding to this maximum value of J lies on the spinodal curve. Lienhard and Karimi49 have conjectured this to be the case. They have estimated a maximum universal nucleation. rate of about 1(f8 cm -3 s -1. Pavlov and SkripoyS6 estimated this maximum to be about 1030 cm-3 S-I. Table 2 lists values of J calculated at Tt using Eq. (4). The results conform to the above ranges. (It is questionable whether such high rates
could ever be achieved in experiment.) If the calculated variation of 1 with T and Po obtained
from Eq. (4) is indeed correct, then measured values of Tk obtained from various experimental methods must be less than the thermodynamic limit of superheat at the same pressure--.:..Eq. (3) must be satisfied. Unfortunately, the inability to accurately predict ~ eliminates the potential usefulncs:s of this fact as an· aid for testing the validity of purported superheat limit measurements.
3. Experimental Methods This section reviews the most often used methods for
measuring the limits of superheat of liquids. All the data included in Tables 4-6 were taken with one or more of these methods.
3.1. Methods Involving Liquids in Contact with Solids a. Introduction
The high liquid superheats characteristic of homogeneous nucleation are generally difficult to reach when a liquid is in contact with a solid. Vapor formation may be initiated by nucleation of gas bubbles at the solid/liquid interface (heterogeneous nucleation) at superheat conditions much less extreme. than for homogeneous nucleation. The energy ·of bubble formation at a flat smooth surface is less than for bubble formation in the bulk of a liquid at the same ambient pressure. The corresponding superheat is thereby generally reduce(f7 (though the competing influence of reduced number density of molecules at a surface relative to the bulk could lead to a higher probability for bubble nucleation in the bulk depending on the contact angle82
). Yet, in spite of these facts, two principal methods for measuring the superheat limit of liquids have emerged·which involve liquids in contact with solids. These methods have produced superheat limit data that are, in some cases, quite close to values predicted by homogeneous nucleation theory, Eqs. (5H7). Data from some of these methods are therefore included in the present compilation.
The principles of these methods are discussed to show

THE HOMOGENEOUS NUCLEATION LIMITS OF LIQUIDS 699
why measurements obtained from them may qualify as valid superheat limits. Two successful methods have involved (1) rapidly heating a wire or flat crystal immersed in a subcooled pool of the test liquid-the so-called pulse heating methOd26,56,64,65,72,75.77 and (2) isothermally decompres-. sing14•28,29.37,44,66-68.76.83 or isobarically heating15,30,34,47,53,74
a small volume of liquid in a container, which may be a capillary tube made of glass or metal.
b. Pulse Heating M~thod
One variant of the pulse heating method consists ofimposing a programmed current (--10 A) through a small diameter platilium wire (.-0.02 mm in diameter and 1.0 cm long). During the time of application of the current (ranging between 25 and 1000 p,s), the wire heats the liquid adjacent to it, thereby creating a thermal boundary layer around the wire. When the liquid in this boundary layer reaches the superheat limit, bubbles appear and alter the wire resistance by their effect on the heat transfer between wire and liquid. This resistance change may be measured, thereby giving a measure of the liquid temperature at which bubbles are formed. The wire thus acts as both a temperature sensor and a heat source.
The wire diameter and the magnitude and duration of the imposed current are chosen so as to minimize the tendency of the wire to promote nucleate boiling from gases trapped in surface defects of'the wife: The idea is to·heat the wire at a sufficiently high rate for a short enough time that any bubbles that would tend to grow and detach from the wire would require a longer interval of time than is necessary to heat the liquid around the wire to its limit of superheat. The bubbles that do form oreate a measurable temperature perturbation of the wire by their effect on the heat transfer between the wire and the surrounding liquid. This temperature perturbation (,...,10-3 K for most organic liquids) may be related to the nucleation rate.77
Few details have appeared in the literature that permit results obtained from this method to be reproduced and that allow accurate estimation of the errors involved. The pulse heating method of using a wire as the heating element has apparently been successfully employed only by Skripov and oO-workersS6.72.7S.77 and Sinha,64 while another study58 at-
tempted to reproduce the method without much success. A variant ·of this method involved rapid heating by a pulsed current of a bismuth crystal immersed in a bath of the test fluid.26
,64.65 This method was successfully used to measure the limit of superheat of helium I .. The bismuth· crystal served both as the heating element and temperature sensor by the strong dependence of its magnetoresistance with temperature. The low contact angle and surface tension of helium I ensured a negligible influence of the crystal on surface nucleation.
The errors associated with the pulse heating method are (1) spatial nonuniformities in the heating element tempera~ ture (the temperature inferred from its resistance is an average characteristic of the entire heated element mass), (2) reproducibility in the calibration to relate element resistance with temperature, (3) pressure changes in the liquid film surrounding the element, due to abrupt thermal expansion on
bubble formation, and (4) measurement of the temperature perturbation created by bubble nucleation. The cumulative error in the superheat limit associated with the first three effects has been estimated to range between 10-3 and 5 K.26,65.72.75,77 Temperature perturbation and bubble density measurement errors are much less important. This information is used to estimate the nucleation rate commensurate with the imposed current pulse and ambient pressure.
c. Capillary Tube Methods
Isobaric Heating
The original experiment of this genre was performed by Kenrick et al.47 The method consists of heating liquid-filled glass capillary tubes in a constant pressure environment. The purpose of using capillary tubesis to reduce both the number of potential nucleation sites by reducing the liquid/solid contact area, and the size of these sites. The liquid is brought into the metastable state al()ng path a-c in Fig. 1. At a certain characteristic temperature, usually identified with the homogeneous nucleation limit, the liquid in the capillary boils. The nature of this boiling depends on the ambient pressure. At pressures near atmospheric, most hydrocarbons characteristically "explode" in the capillary. This explosive boiling is usually manifested by an audible sound, such as click or crack. At elevated pressures, generally above 0.5 Pc, 74 boilinglos~-its explosi~e charactet:. Measurement of the superheat Iilnit then relies more heavily on visual observation (bubbles in the capillaries are observable), and any tempera- . ture and pressure perturbations produced by the phase transition. The corresponding accuracy of the measurement thus appears to be reduced ·at higher pressures.
Three ma.jor souroes of error assooiated with this method are (1) minimizing the effect of the container walls (the capillary tube surface) on promoting heterogeneous nucleation at the liquid/glass interface, (2) the thermal lag between the test liquid and surrounding heat bath, and (3) spatial nonuniformities of temperature within the superheated liquid sample.
The effect of solid/liquid contact resides in the propensity for the solid to (1) reduce the energy required to form a critical size bubble at the solidlliquid interface and (2) trap noncondensablc gtlSCS in surface irregularities. The former
. effect may be minimal depending on the glass/vapor/liquid contact angle. The latter effect is more serious in that it is difficult to create a hypothetically smooth (on a microscopic level) surface, and to remove gases trapped in surface irregularities. These effects may be minimized, however, by reducing the volume of liquid heated, carefully cleaning the test surfaces, prepressurization, and degassing the test liquids. The fact that liquids have been heated to values within a few degrees of their theoretical limits of superheat is testimony to the value of these preparatory efforts. The number of studies that have been successful in this regard is, however, small. Efforts were made to select from among the large number of studies that used capillary tubes for measuring the superheat limit, those that yielded superheat temperatures that appeared to characterize the intrinsic nature of the liquid itself, rather than the adhesion of the liquid to its container.
Systematic errors are created by the thermal lag
J. Phys. Chem. Ref. Data, Vol. 14, No.3, 1985

700 c. T. AVEDISIAN
between the test liquid in· the capillaries and the heat bath within which the capillaries are heated (which may be a thermostatted liquid pOOI34.47.53 or thermostatted solid block15.74), and heat conduction effects through the walls of the capillaries themselves. To reduce the temperature difference across the capillary, the heating rate (dT /dt ) should be low and the capillary wall thickness small. Typical experimental values have ranged between 0.01 and 3 K/s, and between 0.07 and 1 mm. Spatial nonuniformities of Tk are reduced by superheating small liquid volumes. Values have ranged between 0.01 and 0.1 cm3. A rather simple lumped capacity model ofthe volume of superheated liquid, together with assuming a linear variation of Tat the above mentioned values, can be shown to yield temperature tinderheatings of the test liquid on the order of less than 1 K.
Isothermal decompression methods
(a) Bubble chambers
Another path for transgressing the phase boundary of a liquid (besides isobaric heating) is isothermal decompression' (path b-c in Fig. 1). Experimental techniques that have utilized this idea are called "bubble chambers.,,14,28.29.37.44.66-69.83.85 A forerunner of this method was originally developed by Wismer85 in 1922. One end of a sealed capillary tube containing the test liquid (ethyl ether, isopentane, or ethyl cWoride) was connected toascrew-type cylinder, which was used for pressurizing the test liquid. The capillary was placed in a thermostatted reservoir, and the pressure was initialized to a value greater than the saturation pressure corresponding to the reservoir temperature. Suddenly releasing the pressure brought the initially subcooled (Po>Pin Pig. 1) test liquid into the metastable state. Vapodzation was usually manifested by an audible sound after a certain waiting time. Subsequent refinements to the method consisted of improving accuracy of pressure and temperature measurement, correcting for, and minimizing, the temperature drop associated with the idealized adiabatic decompression process, and refining the measurement of waiting time and the detection of vaporization itself 4t the capillary. 14,28,29.37,66-69,83
Data obtained from this experiment are the ambient pressure Po, superheat temperature Tk , and the waiting time 1". In· a certain temperature range, the waiting time is observed to abruptly decrease with a comparatively small increase in temperature. For example, at only 2.5 K below the mean limit of superheat of several organic liquids, the waiting time was found to decrease from over 1 h to just a few S.67 This behavior is indicative of a homogeneous nucleation phenomenon and is a manifestation of the very strong depen~ dence of nucleation rate on temperature. The mean temperature in this range of sudden change in 1" is identified with the limit of superheat corresponding to a nucleation rate associated with T (see Sec. 4). Measurement of temperature and waiting time in the region of Tk is the intent of the experiment.
Systematic errors of the method are due to (1) the temperature drop of the test liquid during adiabatic decompression, (2) propensity for nucleation to occur on the walls of the capillary (this problem also occurs, to a lesser extent, wIth
J. Phys. Chem. Ref. Data, Vol. 14. No. 3.1985
the pulse heating method), and (3) spatial nonuniformities of temperature in the volume of superheated liquid. For mixtures, accuracy of the mixture composition may also be problematic, though composition errors on the order of only 0.1 mol % are typical. 29
. The small temperature drop of the test liquid caused by rapid decompression was kept to under 0.5K by a two~stage decompression technique. Spatial nonuniformities of temperature within the test volume were also minimized by using small volumes. Typical values have ranged between 0.005 and 0.15 cm3. 14,29,67-69 Small-diameter tubes also mini-mize the effect of gas bubble nucleation from gases trapped in surface irregularities. An exception is the experiments reported by Hord et al.44 on superheating liquid hydrogen. The hydrogen pool chamber volume was nearly l(X)() cm3, yet their data are indicative of the limit of superheat of hydrogen. The reason relates more to the test fluid properties than to any special liquid or container preparation techniques. The surface tension and wettitig characteristics of liquid hy-· drogen at low temperatures-25 to 30 K -are such that the presence of vapor-filled cavities is unlikely. With no potentially active surface nucleation sites, the liquid superheat is limited by the type of random density fluctuations that lead to homogeneous nucleation.
(b) Dynamic Stressing Method Dynamic stressing methods bring· sUbcooled liquids
into the metastable state by isothermal decompression (path lrc in Fig. 1). Differences with the bubble chamber technique reside in the method of stressing the liquid, and the pressure and temperature ranges at which vaporization is induced. Temperatures at the start of decompression are typically low enough that the pressure on the liquid changes from a compressive to a tensile stress (path b-:c in Fig. 3). This gives rise to the concept of "negative pressure.,,20,21 This term is used to identify the direction ot" the imposed pressure on the liquid relative to the outward normal on the nucleus surface. Figure 3 illustrates the concepts involved.
The static mechanical equilibrium of critical size nuclei requires that Eq. (1) be satisfied. Given that n-P P will always be positive, a liquid temperature-T' (Fig. 3)--exists below which the liquid pressure will be extensive relative to the nucleus surface (nopo> 0), and above which it will be compressive (n-Po < 0). Dynamic stressing methods usually operate in the temperature range for which T < T' (in fact, usually Tr < 0.7 in contrast to other experimental methods in which Tr > 0.9 when T> T /). Furthermore, most reported data are such that IPol). IP I so that the "tensile strength" Po is related tu bubble radius as
2u Po':::::t.-·
r (8)
Equation (8) is typical of cavitation induced nucleation. By convention, measured nucleation pressures are assigned negative values when T < T' (napo> 0).
Three types of experiments have been developed to measure the tensile stress (i.e., negative pressure) of liquids. The first involves static application of tension to a liquid. The second involves dynamically stressing the liquid, and

THE HOMOGENEOUS NUCLEATION LIMITS OF LIQUIDS 701
Meaning of Negative Pressure
~ ;:, e Q) Co
T
~ Tk
T~
...---Critical point
Locus of normal (r-oo) soturo1ion sta'es
Stable liquid Locus of tensile ,.. ,.. ~r!ngths ~ ./ ~
(n·P.>O) ", T o ./ ...... c b
",.."'" I-- 2cr r
Initial liquid steite
P
Pressure
Negative pressures: tensile strength
(extensive Po )
~ -~-
It' , 'Po
P+Po = 2;r
-I~ Positive pressures: superheat limit
( compressive Po)
,~I/-. _ r n P
/ t ' Po
FIG. 3. Schematic illustration of states corresponding to the tensile strength (i.e., limiting negative pressure). When T> T' ambient pressure is compressive. When T < T' ambient pressure is extensive.
the third method concerns imposing ultrasonic waves of .high.atUpIitudeonthe. testJiquidL.~
(t) Static application of tension to a liquid was first employed by BertheloeO~the so-called "Berthelot tube method." In this technique, a tube, typically a glass capillary or steel tube, is almost completely filled with the test liquid. The remaining volume is occupied by air. With the tube sealed, the contents are heated and the trapped gas is forced into solution. Subsequent cooling contracts the liquid, and the difference between the expansion coefficients of the liquid and material that encapsulates it creates a state of internal stress in the liquid, the liquid 'essentially attempting to contract more than its solid container. Eventually the contraction tears the liquid from the walls of its container and the liquid "ruptures." The breaking pressure may be evaluated from either the increase in volume of the container caused by the phase change (if the container walls are flexible)81 or the volume of the vapor produced in the container.77 In the original work of Berthelot, the tensile strength of water was measured at room temperature to be about 5 MPa. More recent work46 in which one side of the tube wall formed the surface of a pressure transducer reported a limiting tensile stress for water at 279 K of 4.66 MPa. Considering that the theoretical values of the limiting negative pressure for water in a temperature range of 273 to 373 K have been estimated to vary from about ..:..- 100 to· - 600 MPa, there is serious doubt concerning the identification of these data with the true tensile strengthS of water. Even accounting for the etfect of dissolved gases in the test sample cannot bring theory and experiment into agreement. This fact suggests that what may be really measured in this' static stressing method is the adhesion of the liquid to its container, rather than the intrinsic adhesion of the liquid to itself. For these reasons, nearly all data obtained from static stressing methods of the type de-
scribed above have been rejected in this compilation. (See Sec. 5.2 for exceptions.)
(2) Dynamic stressing methods are similar to the Berthelot tube method except that a state of tension is now induced by centrifugal rotation or sudden linear deceleration of the test liquid.8,18,24,25 A Z-shaped tube used by Briggs24,25 (0.6 to 0.8 mm internal diameter) was rotated about itsz axis. One half of the liquid in the tube thereby pulls against the other half at the center of rotation, and the maximum stress occurs at the tube center. At a certain rotational speed the liquid in the tube center will fracture-literally split apart. (This method is qualitatively similar to that discussed by Trevena81 in which a shock wave w~s generated in a liquid by. firing a bullet against a steel tube fitted with a piston at one end. The rarefaction wave generated by reflection of the shock wave created tension in the liquid which subsequently led to its rupture.) The breaking stress may be related to the angular velocity of the tube. Maximum tensile strengths for water thus far reported-27.5 MPaat 281.2 K25-are still far below theoretical estimates. As with the Berthelot tube method, measured fracture pressures are probably indicative of the adhesion strength of the test liquid to its container walls. Nevertheless, these data are the best available measurements and are included in Table 4 so as to provide a basis· for comparison with future work. A refinement of this method by Apfel8 involved greater care in preparing the test liquid(i.e.,p!estre~~ingjt) andu,~ip.g_at.~~l fllljd with a lower surface tension (ethyl ether).
The linear deceleration method employed by Beams18
utilized an inverted U-shaped capillary tube (3-5mm internal diameter) which was thrust downward and then abruptly stopped. The downward momentum imparted t() the liquid by this, sudden stopping action created a tensile stress in the upper portion of the tube, which essentially "broke" the liquid. The tensile strength was then inferred from the height of the liquid in the arms of the U tube. the temperature. and the deceleration force. Values of tensile· strengtl1 for several cryogenic liquids again exhibited serious discrepancies with nucleation theory. The reported negative pressures are therefore not indicative of having reached the true limit of superheat. Nevertheless, the reported tensile strengths are the best available data and are therefore included in Table 4 for completeness.
(3) One of the most successful methods for measuring the limiting negative pressures of liquids was developed by Apfel. 3-6 The technique involved levitating a test liquid droplet by a standing wave field generated. bya piezoelectric acoustic transducer cemented to the walls of a vertical tube filled with another immiscible liquid (similar to the bubble column method~ec. 3.2.a). The droplet is stressed for those periods it is exposed to the negative parts of the acoustic cycle. When the magnitude of the negative pressure is high enough and of long enough duration, any cavities formed by homogeneous nucleation will grow to observable size. This growth is usually manifested by an explosive type of boiling, depending on the pressure level. (If the cavity does not grow fast enough during the negative part of the cycle, it will collapse as the acoustic pressure becomes positive.) The excellent agreement between measured negative pressures
J.Phys. Chern. Ref. Data, Vol. 14, No.3, 1985
702 C. T. AVEDISIAN
and values calculated from homogeneous nucleation theory, e.g., Eqs. (5H7)-the first such agreement yet demonstrated for the tensile stress of a liquid4-7 -is evidence that the problems that prevented such agreement using the other methods described above were largely overcome by this variant of the floating droplet method. Tensile strength measurements obtained from this acoustic levitation method are therefore regarded as indicative of the true tensile strength of the test liquids. A similar method was used by Marston50 to measure the extent of superheating of helium II (the helium was now in contact with the walls of a thermostatted bath). The poor agreement between measured and calculated values (at 2.09 K, calculated tensile strengths ranged between - 0.3 and - 0.5 MPa, whereas the measured value was - 0.06 MPa)
may be more indicative of inaccuracies in predicting the physical properties of helium II (in particular, ~urface tension) than to defects in the experimental method. These measurements are inconsistent with those reported by Beams, 18 but are believed to be more reHahle owing to direct observations of bubbles nucleating within the bulk of the stressed helium II pool. 50
d. Bulb Method
In this method, a heated surface (a spherical glass bulk) is placed in a pool of the test liquid. The test liquid adjacent to the bulb then becomes superheated and eventually boils. The.vaporization temperature is measured by ·measuring the· bulb wall temperature (due account being taken of the temperature drop across the bulb wall). Boiling is typically detected by the visual appearance of bubbles on the bulb surface.
. The rather large size of heated surface which is in contact with the test liquid (the bulb was 2.1 cm in dlameterl7,63) increases the probability for gas bubble nucleation on the sUrface. This fact is reflected by the comparatively low superheats realized by this technique in comparison with those measured using other methods. For example, the maximum liquid temperature before vaporization of n-heptane at 0.101 MPa was measured to be 430 K. This value is more than 50 K below the true limit of superheat of n-heptane (see Table 4). Even neglecting the (rather substantial) temperature drop across the bulb cannot reduce thi~ discrepancy_ Similar discrepancies may be noted for the other fluids tested in Refs. 17 and 63. Most of these data were therefore not included in the final listing.
The few data which were included from Refs. 17 and 63 are the highest temperatures to which the respective liquids have been heated before undergoing a phase change. These superheat temperatures, however, are not indicative of the true limit of superheat. Future work on these substances may use the included data as base values above which the respective superheat temperatures must fall.
3.2. Methods Involving Liquids in Contact with Immiscible Liquids
a. Introduction
These methods consist of suspending a volatile droplet of a test liquid in another nonvolatile liquid (the "field" liquid) in which it has a low solubility. The field liquid is then
subjected to such conditions as to bring the encapsulated droplet into the metastable state. These conditions have consisted of isobarically heating the field liquid 1,2,1 1-13,22,35,36,42,52.54,55.59.61.62.71,73.77-79.84 or isothermally
decompressing it.3.I0,38-40.51 The corresponding states that the test droplet experiences as it approaches its limit of superheat are illustrated by paths a-c and b-c, respectively, in Fig. 1. When the test droplet vaporizes, the ambient pressure and temperature at which this boiling takes place are inferred from corresponding measurements in the field liquid. Principal errors associated with the method are, therefore, discrepancies between the field and test liquid temperature and pressure. Pressure differences are negligible. However, the average droplet temperature, both spatially and temporally, may be quite different from the field liquid, the extent of the difference depending on the droplet size and other factors as discussed below.
The chief advantage of the floating droplet method over other methods involving encapsulation of the test liquid in a solid container (i.e., pulse heating or capillary tube methods) resides in the fact that the test droplet/field liquid interface constitutes a hypothetically ideal smooth surface, free of any solid·motes or trapped gases which would tend to initiate a phase transition. The liquid/liquid interface has essentially a similar microscopic structure to the bulk of the droplet. Any phase transition at this interface would therefore have to occur by the·same mechanism as in the bulk of the test droplet. Depending on the surface and interfacial tensions of the test and field liquids, the probability for homogeneous nucleation may be greater in the bulk of the test droplet (desired) than at the liquid/liquid interface (undesired). The key to successful use of this method therefore relies on carefully selecting the test/field liquid combination to satisfy the following criteria: (I) the field liquid must have a boiling point higher than the limit of superheat of the most nonvolatile component within the test droplet over the entire range of ambient pressures at which the limit of superheat is to be measured, (2) both liquids must have low mutual solubility, (3) the,physical properties of both liquids should be available (or predictable), and (4) the probability for nucleation within the bulk of the test droplet must be higher than that at the droplet/field liquid interface. The la.~t requirement i~ satisfied if'·9,23.4S,51
(9)
where (71' (72' and (T12 are surface tensions (against theil- own vapor) of the test liquid (1) and field liquid (2) and interfacial tension (12), respectively.IfEq. (9) is not satisfied, measured superheat limits will essentially have characterized the interface between the two liquids rather than the test liquid itself (similar to the situation which occurs for some of the isothermal stressing methods described in Sec. 3.t.c). The measured temperatures (at a given pressure) will, in this event, be generally far below what would be indicative of homogeneous nucleation in the bulk of the test droplet. 10,23,45 This fact limits the extent of the various liquids which can be tested by floating droplet methods. Nevertheless, the method, when the above criteria are satisfied, has yielded some of the most reproducible and accurate superheat limit data thus far re-ported. .

THE HOMOGENEOUS NUCLEATION LIMITS OF LIQUIDS 703
b. Isobaric Droplet Heating
The first experimental proof of the existence of superheated liquids was obtained by Dufour,3l,32 who heated water droplets of 1-2 Jl1Ii1 diameter ill a pool of oil of roughly equal density. On slowly heating the oil, the water droplets were able to sustain temperatures as high as 448 K before boiling. The phase change was always observed as a violent explosion in these tests. Though this temperature is low compared to more recently measured values,2,22 Dufour's experiments were remarkable for their day. They remained the highest measured liquid phase temperatures for water at 0.101 MPa for over 100 years.
The modem adaptation of Dufour's method consists of injecting small light volatile droplets (0.1-1 mm) of a test liquid into the bottom of a vertical tube (called a "bubble column") that contains a heavier immiscible nonvolatile field liquid. A stable temperature gradient is imposed on the field liquid such that temperature is hotter at the top of the column than at the bottom. As the droplets rise, they w:e progressively heated until they begin to boil. This boiling may either take the form of a small explosion (audible as a cracking sound) or a sudden increase in rise velocity of the droplet caused by a bubble growing inside the droplet, depending on the ambient pressure and composition of the droplet. The droplet vaporization temperature and pressure are inferred by measuring the temperature and pressure in the field" liquid at which vaporization "occUrS.
This method has become very" popular because (1) the experiment is quite simple to construct and operate, and (2) the measured superheat limits essentially agree with the theoretical predictions of homogeneous nucleation theory.
The bubble column itself is glass with inside diameters that have ranged from as small as 1.3 cmll to over 6 cm.62
Tube length has ranged from 100 cml down to 35 cm.73,84
Temperature gradients imposed on the field liquid have been effected by heating Nichrome wire wrapped around the tube with varying pitch. I - 3,22,33,42,52,54,55,59,61 Other approaches
have employed a metal sleeve fitted around the tube with attached electrical heater13.3536.62.71.73.7R.R4 and a. CUIllWt:l-
cially available rope heater. I I Temperature gradients produced by these various methods have ranged from 0.0342 to 10 K/cm.71 For typical rise velocities in the range of 1 to 5 cm/s, test droplets are heated at rates ranging from 0.03 to 50 K/s.
Field liquids that have been used as heating media include: glycerine; ethylene glycol; sulphuric acid; various mixtures of water with ethylene glycol, lithium chloride, and ammonium; Krytox 143AD (Dupont); benzyl benzoate; and silicollt: oil. Superheat limit~ mea~ured using different field liquids (for example, pentane droplets in both glycerine and sulphuric acid) have yielded no discernible differences. This would confirm that measured vaporization temperatures in these cases characterize the test liquid and not the test/field liquid interface.
Principal errors associated with this method are due to underheating of the test droplet caused by a finite heat transfer rate between the droplet and ambient liquid, spatial nonuniformities of droplet temperature, heat conduction along thermocouple wires, and finite solUbility between test drop-
let and field liquid. Detailed modelling of the first three effects has shown that for droplets less than 1 mm in diameter, the droplet surface temperature is within 2 K of the ambient.73,77,79 For smaller droplets, the errors are much less (viz., 0.6-mm droplets typically lag the ambient temperature by 1 K,79 while O.3-mm droplets are typically only 0.1 K
cooler than the field liquid73).
More serious difficulties are encountered when the droplet and field liquid are not completely immiscible. This effect is usually observed as the test droplets decreasing in diameter as they move through the bubble column.42,79 The droplet, then, ess~ntia1ly becomes a mixture of a volatile and " nonvolatile liquid. The corresponding limit of superheat will then be higher than what would be realized for a completely immiscible droplet/field liquid combination. This superheat " limit is no less valid than the superheat limit of the test liquid itself. The difficulty is in knowing to what precise composition this superheat 'limit corresponds. These problems are encountered with nearly all test/field liquid combinations. This ambiguity is most pronounced for very small droplets ( < 0.1 mm in diameter): droplets of this size may completely disappear as they are heated to temperatures approaching their limits of superheat. Larger droplets are better able to survive before completely dissolving, but the problem of droplet underheating then increases.
As a droplet dissolves, a diffusion front will propagate inward from the dropletsunace. The central region maybe assumed undisturbed at the original composition until the diffusion front reaches the droplet center. During this time the composition will vary from pure test liquid to pure ambient liquid. The limit of superheat will range from a value corresponding to the pure test liquid to that corresponding to the field liquid. The region in this diffusion zone most likely to reach its limit of superheat first is the diffusion front. Thus, even in the presence of appreciable dissolution, measured droplet vaporization temperatures may be characteristic of the test liquid itself. All of the data reported in Table 4 obtained by the bubble column method have yielded temperatures that are within a. few ut:grt:t::s uf lht: b~l t:slimates of the superheat limits of these substances. The strong dependence of nucleation rate on superheat limit (Sec. 4) together with the above noted agreement, is strong evidence that the true limits of superheat were measured in these experiments.
The situation for miscible mixtures of liquids is more tenuous. The relative rates of diffusion of the various components into the field liquid make it difficult to know the precisecomposition of the droplet. For equal rates of diffusion, the situation would be as described above for pure liquids. For unequal rates, the composition of the liquid undergoing homogeneous nucleation would be unknown, thus rendering any measured droplet vap~rization temperatures meaningless. Those data listed in Table 5 taken using the bubble column method apparently had low enough mutual solubility of all components in the respective field liquids that measured superheat limits were found to be within a few degrees of predicted values. Solubility effects for these data are thus considered to be minimal (at least compared to errors created by droplet underheating).

704 c~ T. AVEDISIAN
c. Isothermal Decompression Methods
The isothermal decompression method is essentially the same as the bubble column technique described in the previous section. The main difference is that the field liquid temperature remains isothermal while the ambient pressure is reduced. Encapsulated droplets thus become superheated by following path Ire· in Fig. 1.
This method eliminates the problem of droplet underheating because the droplets may, in principle, be levitated in the isothermal field liquid for such time as is required for thermal eqUilibrium to be established. Larger droplets may also be studied, thus reducing the solubility problem noted in the previous section. The method is also convenient for measuring the limits of superheat of test liquids that are heavier than the candidate field liquids (e.g., the Freon 12/water system studied by Moore51
). In this case, the droplets must be introduced into the top of the bubble column. During . their transit down the column, they are superheated by reducing the pressure on the field liquid. .
Experimental difficulties associated with isothermal decompression methods are more formidable than the simple isobaric bubble column. The isothermal bubble column must be pressurized. The test liquid droplet must then be introduced into this pressurized atmosphere and . remain there until thermal eqll!libriumisesta,Qlished and thepres~ sure-is reduced from its initial value (Po> P) to the final nucleation pressure (Po < P). Three variants of this method have been employed: (1) acoustic levitation of the test droplets,3-6 (2) droplet levitation in an isothermal flow field,38-40,43 and (3) droplets freely falling in an isothermal bath of the field liquid. IO,51 Droplet levitation methods are attractive for both measuring the nucleation pressure of the test liquid as a function of field liquid temperature, and studying the intensity of vaporization of the motionless droplets.5
Principal errors associated with isothermal decompression methods are fewer than isobarically heating the· droplets. The droplets are essentially isothermal. No positioning difficulties of thermocouples at the location of droplet boiling exist because of the isothermal conditions in the field liquid. Typical errors in pressure measurement are identify- . ing the pressure on the field liquid during decompression 'at which the droplets vaporize. This difficulty· can be minimized by slowly reducing the pressure (e.g., a few kPa per s), and recording the pressure transient on a chart recorder with an event marker to identify the correct nucleation pressure. In those cases where vaporization is sufficiently violent, the pressure perturbation produced in the test section as a result of the droplet undergoing homogeneous nucleation may be large enough to be detected by the pressure sensors.3
8-40 Errors in nucleation pressure measurement have thus been reported to range from a few percent to about 10%. Since the limit of superheat has a rather small dependence on pressure compared to the effect of temperature on the nucleation pressure (as shown by the data in Tables 4 and 5) errors in nucleation pressure are much less important than errors in the limit of superheat at a given pressure. The uncertainty in nucleation pressure noted above is therefore insignificant.
4. Nucleation Rates Commensurate with Experimental Conditions
4.1. Introduction
For the limit of superheat of a liquid to be meaningful, it is necessary to know the approximate nucleation rate to which it corresponds. Equation (5) by itself is indeterminate. without added information which could be used to indepen~ dently arrive at an e5timate of J. Fortunately, the very weak dependence of Tk . on 1 (Fig. 2)-,..1 occurs in a logarithmic term in Eq. (5)-relaxes requirements for an accurate estimate of I. The superheat limit may be shown to change by little more than 1 K for a three to four order of magnitUde change in/.
In this section we present very approximate formulations for the nucleation rate appropriate to the various experimental methods that have yielded valid superheat limit data. These formulations are based largely on physical insight. They are believed to be indicative of the orders of magnitude of nucleation rates one may expect to achieve in the various experimental methods considered.
4.2. Floating Droplet and Capillary Tube Methods
The main differences between these two methods are in the volume of liquid heated, the rate at which the liquid is
···brought-into-themetastable·state, and the container within which the test liquid is heated (solid walls for the capillary tube method and a liquid/liquid interface for the floating droplet method). In other respects an estimate of the nucleation rate may be derived in an equivalent manner for the two methods.
From the meaning ofthenueleation rate, the total number n of critical size nuclei produced in a volume V in the time interval O-T is
n= [IVdt. (10)
Two approximate means for estimating 1 from Eq. (10) are now considered.
The first approach assumes that the volume of liquid V is brought into the metastable state such that I behaves like a delta function but with a finite value at T. At time T, a number n of critical size nuclei form at the rate I. Equation (10) can then be written
J-==~. VT
(11)
Now by convention34,61.77 we will define the nucleation rate to correspond to only one nucleus forming in the volume V. This assumption can never be proven because of the inability to observe the events leading to formation of critical size nuclei. These events occur on a microscopic scale. However, recent photographic evidence of bubble formation in pure liquid droplets has revealed only one bubble within the droplet.62 Thus we will take n = 1. Equation (1) then becomes
1 J=-. (12)
VT [Equation (12) was used to calculate the waiting times shown
THE HOMOGENEOUS NUCLEA.TION LIMITS OF LIQUIDS 705
in Table 2.] Equation (12) may be used to provide an estimate of the nucleation rate commensurate with those experiments in which T may be measured directly, and the volume of superheated liquid is well defined (e.g., as in the capillary tube and floating droplet methods if T can be reasonably estimated42
). In other cases, it is more convenient to account for the variations of J with T as the liquid state transgresses its phase boundary. This leads to a second approach for obtaining an estimate of nucleation rate from Eq. (10).
The continuous variation of nucleation rate with temperature should be considered in evaluating the integral in Eg. (10). This is done below for the case of a constant heating rate and a constant decompression rate.
For a constant heating rate it is convenient to change the variable of integration from t to T through the relation Tdt = dT. Equation (10) then becomes (with n = 1)
1 = vi' rT
JdT. )1;, (13)
Now in the temperature range of interest, it can be shown that Eq.(4) is well approximated by the following relation 77:
(14)
where To is chosen as the temperature where J = 1 nucleus/ cm3·s (this choice is arbitrary and selected only for convenience), and GT~d(A 4> * /kT}/ dTandisapproxima.tely cons~t<?yer the temperature.~ange To to r .. ComQbting_Eqs. (13) and (14) and integrating gives
J~ IGrIT. V
(lS)
Equation (15) is useful for estimating the nucleation rate corresponding to an experiment in which the volume and am· bient pressure are fixed, while the test liquid is heated at the rate t.
For isothermal decompression techniques, Eq. (15) is awkward to use. Decompression causes a temperature drop in the test liquid due to its finite adiabatic compressibility. In this event the. magnitude of the heating' rate may be exl'r~~ed B....'l.
T= dPo. dT, dt dPo
(16)
where dT /dPo may be measured. Equation (15) then becomes
(17)
The decompression rate Po is fixed by experimental conditions.
A nucleation rate commensurate with the floating droplet and capillary tube methods may now be estimated from Eqs. (15) and (17), respectively. For the isobaric heating variant of the capillary tube method, we have the following information
0.01 K/s < T < 3 K/s
and
0.01 cm3 < V <0.1 em3 •
Equation (15} then gives
1 nucleus/{cm3.s) < J < 103 nuclei/(cm3.s) . (18)
For the isothermal variant of the capillary tube'method (i.e., bubble chamber experiments), best estimates from available information give68,69
dPoIdt~l.Ol MPa/s,
dT /dPo~0:5 K/MPa ,
and·
0.005 cm3 < V <0.15 cm3•
Equation.{17) then gives
10 nucleil{cm3.s) < J < 1<Y nuclei/(cm3.s) . (19)
[A'similar range is obtained if Eq. (12) is used with a characteristic waiting time of 1- ~ 1 s.] The pool decompression method employed by Hord et a/.44 corresponded to a much lower nucleation rate-lO- 2 nuclei/(cm3.s)-because of the large volume of superheated liquid (~1000 cm3
).
Finally, floating droplet (i.e., the bubble column) methods have
0.03 K/s < T < 50 K/s
and
10-7 cm3 < V < 10-4 cm3 •
Equation (15) correspondingly gives
100 nuclei/(cm-\sl < J < 108 nucleil(cm3.s) . (20)
(The ranges of nucleation rate commensurate with the various experimental methods calculated above are very approximate values and were rounded off to the nearest order of magnitude.)
4.3.Pulee Heating Method
A pulsed current imposed on the platinum wire in this method rapidly heats the wire. This heating creates a thermal boundary layer. which propagate-4iI into the amhip.nt liquid. The liquid in this boundary layer may eventually become superheated, after which the limit of superheat may ultimately be reached. The wire diameter will generally be large compared to the boundary layer thlckness, so a plane approximation is valid. The intent is to estimate the number of bubbles that form a distance dx from the wire surface {of area A ) in a liquid region of volume A-dx.
The nucleation rate is the number of critical size nuclei that form in a unit volume and unit time. From Eq. (4) we have
(21)
where C -Fkf No [Eq. (4)) and G =.J tP * /kT. In the volume element A dx, the number of nuclei dn that form in the time dtis
dn= JA dxdt.
Then,
n = [ LX JA dx dt .
Since A is constant (the plane approximation)
n"==~= r" (X J dxdt, A Jo Jo
(22)
(23)
J. Phvs. Chem. Ref. Data. Vol. 14. No. 3~ 1985

706 c. T. AVEDISIAN
where n H is the number density (molecules per unit area) at the wire surface. Now following Skripov,77 we recognize that G = G(T) and T= T(x,t). Expanding G in a Taylor series about T, and in tum T in a similar series about x = 0 and t = T, and retaining only the linear terms, yields
aT G~G(T(x =0,(= T)) + Gr-(t-T)
at
aT +Gr-·x+ ... , ax
where aT / at is the heating rate of the liquid and aT / ax is the spatial temperature gradient. Combining the above equation with Eq. (21), substituting into Eq. (23), and integrating (assuming a Constant heating rate) gives
J'::::!.n"G} aT < aT. (24) ax at
In the thermal boundary layer (of thickness 6 ) the following approximations are made:
aT T- To ax '::::!. -8-' (25a)
where
and
aT......,T-To_ at - T
Equation (24) therefore becomes
J'::::!.n" G 2 (T- To)2 . T .[ci; -,3/2
(25b)
(25c)
(26)
Equation (26) may be used to eStimate J as follows. A typical order_ of magnitude of n" for many organic liquids is 103
bubbles/cm2< n" < 104 bubbles/cm2, while for water, n" :::::.106 bubbles/cm2.72 T - To is directly inferred from the wire resistance (now T -'ll-Tk and To is/ the bulk. temperature-near room value). GT can be estimated from the form ofEq. (4). We therefore arrive at the following estimates of the order of magnitude of nucleation rate commensurate with the pulse heating method. For
1 Ql bubbles/ cm2 < n" < 106 bubbles/ cm2 ,
3 K- 1 <Gr < 10 K-1,
200K<T- To< 300K,
25 J-Ls < T < 1000 J-Ls ,
.[ci; ,....,10-2 cm/sI12 ,
Equation (26) yields a range of nucleation rates achievable with the pulse heating method of
1015 nucleilcm3.s < J < 1022 nuclei/cm3·s . (27)
A similar range (to within a few orders of magnitude) can be estimated by using Eq. (15) if it is assumed that critical size nuclei form in a superheated liquid layer at the heating surface, which has a thickness of the order of magnitude of the critical nucleus diameter.
The origin of this high range of rates compared to other methods is in the large wire heating rate ('::::!.106 K/s). The method of pulse heating a bismuth crystaI26.64.65 yielded a
smaller effective nucleation rate-on the order of 107 nuclei! (cm3 <s)-primarily because the crystal was heated at a much smaller rate ('::::!.10 K/s).
4.4. Summary Table 3 summarizes the results of the previous two sec
tions. Because of the (albeit weak) dependence of nucleation rate on temperature, the higher the effective nucleation rate PI-UUUet:U by a particular method, the higher should be the measured limit of superheat. Differences in nucleation rates must be substantial, though, to yield measurable differences in limit of superheat: from Eq. (4) it may be shown that a three to four order of magnitude change in J will yield only a 1 K difference in calculated limit of superheat. Thus it may be expected that both variants of the capillary tube method (isobaric heating and isothermal decompression) will produce about the same value of limits of superheat. Floating droplet methods should yield limits of superheat a few degrees higher than capillary tube methous. The pube heating method should unmistakably produce the highest superheat limits. Thus an internal consistency requirement of pub .. lished data emerges from the etrective nucleation rates produced by the various experimental methods,
(28)
where subscripts 1, 2, 3, and 4 refer to superheat limits measuredby the isobaric heatmg-anaisotheririiifdecompressl():rl variants of the capillary tube methods, the floating droplet method, and the pulse heating method, respectively. Data obtained from the various methods considered that did not conform to Eq. (28) were rejected.
Because of the simplifying approximations made in deriving Eqs. (15), (17), and (26), calculated nucleation rates corresponding to the various experimental methods are only rough estimates. It is unknown how inaccurate these estimates may be. The ra~hcr good agreement typically observed between measured and calculated superheat limits indicates that inaccuracies in precisely estimating-J are insignificant. In fact, the above development is often ignored altogether when estimating the limit of superheat: J = 1 nucleus/ (cm3.s) is sometimes used to define the homogeneous nucleation limit (see Refs. 26, 53, 65, and 84, for example). The chief value of being more precise about the nucleation rate is in the insight such precision can give in explaining the definite differences in limits of superheat measured for: a given liquid at a gi veIl pn::ssuI'e but using di1fel-ellt methods.
TABLE 3.Approximate nucleation rates commensurate with various experimental methods
Method
1. Capillary tube Isobaric heating (Sec. 3.1.c) Isothermal decompression (Sec. 3.2.c)
2. Floating droplets (Sec. 3.2) 3. Pulse heating (Sec. 3.1.bl
1 to 1(j 1()2 to 1(j 1()2 to 108
1015 to 1 ()22

THE HOMOGENEOUS NUCLEATION LIMITS OF LIQUIDS 707
5. Criteria for Inclusion of Data in Tables 4-6 5.1. Criteria
The following requirements had to be satisfied to warrant inclusion of published limits of superheat in the present compilation.
(1) the higher the effective nucleation rate commensurate with a given experimental method, the higher should be fts limit of superheat. Equation (28) should therefore be satisfied. Limits of superheat obtained from the pulse heating method should be higher than values obtained from the floating droplet method at a given ambient pressure. Bubble column data should in tum (generally) be higher than superheat limits measured by capillary tube methods . The data listed in Tables 1 and 2 generally conformed to this rule.
(2) The limit of superheat must increase as ambient pressure increases when the nucleation rate varies by at most two or three orders of magnitude [see, for instance, Eqs. (5)(7)].
(3) Enough information must be provided in the original reference, or the experimental method must be sufficiently established, that both the experimental uncertainty of reported superheat limits and an approximate nucleation rate commensurate with the experiment can be estimated.
(4) When one of the standard methods for measuring the limiLofsuperheaLwas employed_and the limit o[superheat for a particular substance was reported only once by one investigating group, those data were included in Tables 4-6 (if the other criteria were also satisfied). This was done to provide a complete listing of the available data.
(5) When the limit of superheat for a particular substance was reported by a_number of different investigating groups using various methods, an arithmetic average of the respective superheat limits at a given pressure, composition, and nucleation rate was taken to arrive at the values listed in Tables 4-6. The range for these values was less than 5 K. This average was rounded to the first decimal (except when the accuracy of measuring temperature was known to be more precise than this).26,64,65 Given that the experimental ancertainty for all methods is of the order of a few degrees, all numbers listed in Tables 4-6 should not generally be considered more precise than this.
(6) It was not necessary that the reported data be theoretically verified in every case. Such verification of measurement with theory is the foundation of our understanding of homogeneous nucleation in superheated liquids. However, the paucity of relevant properties, the most important of which are bubble-point pressure and surface tension, precludes calculating the limit of superheat for all liquids. This problem is particularly severe for mixtures. 11 Those substances for which sufficient property data were available and which therefore were amenable to theoretical predictions [e.g., via Eqs. (5H7)] had superheat limits within a few degrees of measured values.
(7) Though the kinetic limit of superheat (Tk ) must be less than the thermodynamic limit of superheat (Tt ) at a given pressure [see Eq. (3)], to make practical use ofthis requirement, 1',. must be calculated. Difficulties -of the type discussed in Sec. 2 prevent such a calculation. Thus this
requirement is only conceptual and cannot in practice be usefully applied.
5.2. Exceptions and Discrepancies
Most of the data in Tables 4-6 are internally consistent in that they satisfy the criteria stated in Sec. 5.1. A few of the data did riot meet these criteria, yet are still included in the present compilation.
(1) The measurements of Sinha and co-workers, 17,63 Beams,18 Apfel,S and Briggs24,25 were most certainly influenced by gas bubble nucleation on the container walls. A comparison of some of their data with those obtained from other methods revealed, in some cases, substantial differences. In spite of these discrepancies, some of these data are included in the present compilation because they are the best available measurements of the extent of superheating (or dynamic stressing) of the particular liquids studied. Their inclusion in the final listing is meant to serve as a guide for future efforts to measure the limits of superheat or tensile strengths of the liquids in question.
(2) The limits of superheat of degassed methanol and ethanol reported in Ref. 54 showed apparently anomalous results compared to other published data. A substantial effect of degassing-on the limit of superheat of methanol was
-noted (460.2 K for undegassed methanol versus 482 K for degassed methanol), while essentially no difference was observed for-ethanol (472 versus 473 K). These two liquids are very close in structure so the origin of this difference is unknown. The degassed data reported in Ref. 54 were therefore not included in Table 4;
6. Data Extraction from Original Sources The limits of superheat were reported in the original
references in two ways: graphically and in the form of tabulated values.
Graphical presentation of data consisted of displaying the variation of superheat limit with either ambient pressure, composition, or waiting time. Figure quality had some bearing on the accuracy with which plotted data were reduced to tabular form for inclusion in the present compilation. In all cases, figures in the original sources were first enlarged. Each figure was then divided according to the indicated divisions on the coordinate axes and then subdivided into regions encompassing one or more of the plotted data. The coOrdinates of the data points were then obtained by scaling their locations in the respective subdivided regions in which they were located.
When data were presented in tabular form, they were extracted directly without modification. When the same data were presented in both tabular form and displayed graphically, they were extracted only from the table and the figures were not used.
The superheat limits listed in Tables 4-6 are presented
J. Phvs. Chem. Ref. Data. Vol. 14. No. 3.1985

708 c. T. AVEDISIAN
in the order of increasing composition, pressure (at each composition), and nucleation rate (at each pressure). Values are listed to the first decimal place.
All substances are listed in the first column in alphabetical order by chemical formula. Immediately beneath it, the name of the substance is given. Inorganic compounds are listed first, followed by organic compounds in the order of increasing carbon number.
Definition of Symbols for Figures 4-11 and Tables 4-6
T p
139
138
137
Limit of superheat (K) Pressure to which the limit of superheat corresponds (MPa)
• •
. ARGON (Ar)
• g 136 • ~ • It. :l 135 e III It. E 134 ~ • REFERENCE SYMBOL. METHOD .....L-
133 • 74 • CTI lOS
14· ,. CT2 102
132 ..... ''1,7'' CTI,CT2 103
• 131.
,.
130~~~--~--~--~--~~--~--~--~--~~~ OJ O?O 040 OM OAO 100 1.20 140 I.SO 1.80 2.00 2.20 2.40
Pressure (MPa)
FIG. 4. Variation of limit of superheat of argon with pressure .
WATER • 630 (H2O) •
620 • •
~ 610 .: ?6 • • !! GOO :J • c; • ~ 590 • E
~ 580 • • ~ SYM80L Mllt!Q.Q --L
It. 1,22 • BCI lOS
570~ 72. It. PH 1015
56 • PH 1021
560
• 550 0.1 2.0 4.0 6.0 B.O 10.0 12.0 14.0 16.0 18.0
Pressure (MPo)
FIG. 5. Variation of limit of superheat of water with pressure.
J. Phys. Chem. Ref. Data. Vol. 14. Nn ~ 1QAI;;
J
x
PH BCl
BC2
CTt CT2
BUB
495
4~0
g 495
~ :l e 480 III a. E III f- 475
• 470
1 .. 1
4640 0.1
Nucleation rate (nuclei/(cm3.s)) commensurate with the experimental method used to measure the limit of superheat Mole fraction of the second listed substance in the binary mixture PullS~ b~atillg method (Sec. 3.1.b) Bubble column method: isobaric droplet heating (Sec. 3.2.b) Bubble C'.olnmn met.hod~ i~ot.hennal decompression (Sec. 3.2.c) Capillary tube: isobaric heating (Sec. 3.1.c) Capillary tube: isothermal decompression (Sec.3.1.c) Bulb method (Sec. 3.l.d)
E:THANOL (C2HsO)
• •
•
• •
~ SYMBOL
28,29.34,66 0
II It.
n.75,77 •
•
METHOO ..L
eTl,2 101
BCI 104
PH 10'1
•
77 • PH 101$-1022 ll.
28,29,66 ll. CT2 102
0.6 1.0 1.4 1.8 2.2 2.6 3.0 3.4
Pressure (MPo)
FIG. 6. Variation ofUmit of superheat of ethanol with pressure.
FIG. 7. Variation of limit of superheat and tensile strengths (negative pres~ sures) of ether with pressure.
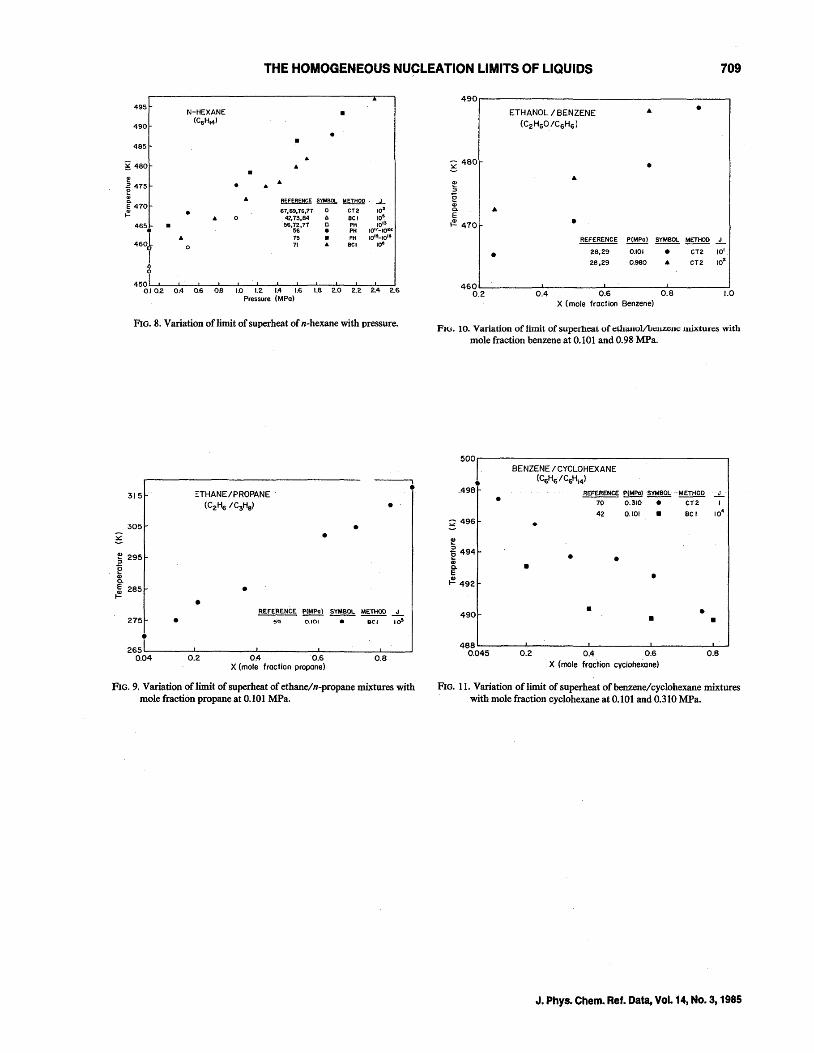
THE HOMOGENEOUS NUCLEATION LIMITS OF LIQUIDS 709
495 N-HEXANE •
490 (CSHI4)
• • 485
g 480 •
~ .a 475 • ~
~ ~ m!:!QQ ..L E 470 i!!. 67,69,7S,77 0 CT2 102 .. 0 42,73,84 to BCI lOS.
465 56.72,77 0 PH 10'5 . 56 • PH 10"-IOU
4s01 75 • PH 10'S-IO'·
0 71 BCI lOS
J t;. 6
450 0.1 0.2 0.4 O.S 0.8 1.0 1.2 1.4 I.S 1.8 2.0 2.2 2.4 2.S
Pressure (MPo)
FIG. 8. Variation of limit of superheat of n-hexane with pressure.
315
305
g e 295 Z e CI) a. E 285 ~
275 • •
265 0.04
::THANE/PROPANE .
(CzHs IC3Ha)
• •
• •
--. • •
~~~~...L 59 0.101 BCI 105
0.2 OA 0.6 0.8 X (mole fraction propane)
FIG. 9. Variation of limit of superheat of ethane/n-propane mixtures with mole fraction propane at 0.10 1 MPa.
490
ETHANOL / BENZENE • (C2 HSO ICSHs)
~ 480 • Q)
::3
e Q) a. .... E ~ 410 •
~ ~ ~~ ..L
• 28.29 0.101 • CT2 101
28.29 0.980 .... CT2 102
460 0.2 0.4 0.6 0.8 1.0
X (mole fraction Benzene)
FIG. to. Variation of limit of superheat ofe;:thanol/lJcllzeilc lIlixtuces with mole fraction benzene at 0.101 and 0.98 MPa.
500r-----------------------------------------~
• A9B
g 496
CI)
} 494 E GI a. E ~ 492
490
•
BENZENE/CYCLOHEXANE (CsHs/CsHI4)
~ P(MPo) ~ METHOD '-L 70 0.310. CT2 I
42 O. 101 • BC I 104
• • • •
• • • •
x (mole fraction cyclohexane)
FIG. 11. Variation of limit of superheat ofbenzene/cyclohexane mixtures with mole fraction cyclohexane at 0.101 and 0.310 MPa.
J. Phys. Chem. Ref. Data, Vol. 14, No.3, 1985

710 c. T. AVEDIS.lAN
Table 4: Limits of superheat of pure liquids
Substance P T J Method Reference [MFa] [K] [nuclei/(cm3 ·s)]
1. Ar -1.220 85.0 lE+02 CT2 18 Argon 0.101 130.8 lE+02 CT1 74
0.190 131.2 lE+02 CT2 14 0.260 131.5 lE+05 CTI 74 0.360 131.8 1E+01 CT2 14 0.410 131.9 lE+05 CT1 74 0.600 132.8 1E+05 CTI 74 0.810 133.5 lE+03 CTl,2 74 1.100 134.3 lE+Ol CT2 14 1.150 135.1 lE+05 CT1 74 1.400 135.3 1E+Ol CT2 14 1.420 136.0 lE+05 CT1 74 1.720 137.1 lE+05 CTI 74 2.140 138.6 1E+05 CT1 74 2.450 139.5 1E+05 CTI 74 2.710 141.3 lE+05 CTI 74
2. HZ .076 27.8 1E-02 CT2 44 Hydrogen .149 27.9 lE-02 CT2 44
.381 29.4 lE-02 CT2 44
.751 .30.6 1E-02 CT2- 44
.834 30.8 1E~02 CT2 44
3. H2 O -27.700 283.2 lE+03 eT2 24,25 Water 0.101 553.0 1E+06 Bel 1,22
0.101 575.2 lE+15 PH 72 1.293 580.4 1E+21 PH 56 2.519 584.9 1E+21 PH 56 2.710 588.3 lE+2l PH 56 5.000 593.6 1E+21 PH- 56 6.808 600.4 lE+21 PH 56 8.500 606.5 lE+21 PH 56 9.731 607.2 1E+21 PH 56
10.746 610.3 1E+21 PH 56 11.978 615.6 IE+21 PH 56 12.873 616.7 lE+21 PH 56 13.731 620.2 1E+21 PH 56 15.789 627.0 1E+21 PH 56 17.556 632.3 1E+2l PH 56 20.113 642.2 1E+21 PH 56
4. He I 0.012 4.05 lE+07 PH 64 Helium I 0.017 4.12 lE+07 PH 64
0.037 4.22 lE+07 PH 65 0.054 4.31 lE+07 PH 65 0.066 4.37 1E+07 PH 65 0.081 4.45 lE+07 PH 65 0.100 4.55 1E+07 PH 65 0.112 4.62 lE+07 PH 64 0.129 4.70 lE+07 PH 64 0.143 4.76 lE+07 PH 64
J. Phys. Chem. Ref. Data, Vol. 14, No.3, 1985

THE HOMOGENEOUS NUCLEATION LIMITS OF LIQUIDS 711
Table 4: Limits of superheat of pure liquids - Continued
Substance P T J Method Reference [HPal [K] [nuclei/(cu.3 .s) ]
5. He II -0.06 2.09 lE+OS eT2 50 Helium II
6. Kr 0.400 182.5 IE+05 eTI 74 Krypton 0.820 184.3 1J!:+05 eTl 74
1.200 187.0 lE+05 CTI 14 ·1.410 187.6 lE+05 CTI 74 1.630 189.1 lE+05 CTI 7/, 1.900 189.9 lE+05 CTl 74 2.200 192.1 lE+05 eTl 74 2.430 192.9 lE+05 CTI 74 2.800 194.8 lE+05 CTI 74 3.140 196.6 1E+05 CTl 74 3.460 198.0 lE+OS CTl 74 3.800 199.4 lE+05 CTI 74
7. N2 -1.010 75.0 lE+02 CT2 18 Nitrogen 0.101 110.0 1E+00 erl 53
0.410 111.4 IE+05 eTI 15 0.520 112.0- lEi-OS eTl 15 0.610 112.1 lE+05 eTl 15 0.700 112.7 lE+05 CTl 15 0.820 113.2 lE+05 eTl 15 0.940 113.8 lE+05 eTI 15 1.060 114.2 lE+05 eTI 15 1.210 114.8 lE+OS CTI 15 1.240 115.2 lEf-05 CTI 15 1.330 115.5 lE+05 CTI 15 1.360 115.6 lE+05 CTI 15 1.460 116.2 lE+OS eTl 15 1.590 116.8 lE+OS CTI 15 1.620 117.0 lE+()1) CTI 15 1.730 117.6 lE+05 CTI 15 1.770 117.7 lE+05 CTI 15 1 .. 870 118.3 lE+OS CTI 15 1.920 118.4 lE+OS CTI 15 2.070 119.1 IE+OS CTI 15
8. N203 0.154 395.6 . lE+02 eT2 83 Nitrogen- 0.554 396.2 lE+02 CT2 83 tetroxide 0.980 398.2 lE+Ol CT2 83
2.000 401.5 lE+01 CT2 83 3.040 405.2 lE+Ol CT2 83 3.920 408.1 lE+Ol CT2 83 4.500 410.2 1E+01 CT2 83 5.000 412.5 lE+Ol CT2 83 5 .. 500 414.5 1E+Ol CT2 83 6.000 416.4 lE+Ol CT2 83
J. Phvs. Chem. Ref. Data. Vol. 14, No.3, 1985

712 C. T. AVEDISIAN
Table 4: Limits of superheat of pure liquids -- Continued
Substance P T J Method Reference [MPa] (K] - [nuclei/(c.3 ·s)]
9. 0, -1.520 75.0 lE+02 CT2 18 Oxygen 0.101 -134.1 lE+OO eTI 53
0.400 135.4 lE+05 CTl 15 0.500 136.2 1E+05 CT1 15,30 0.680 136.5 lE+05 CTI 15,30 0.920 137.4 lE+05 CTl 30 1.060 137.5 lE+05 CTl 15,30 1.lBO 13B.3 1E+05 CTl 15,30 1.350 138.9 1E+05 CTI 15,30 1.480 139.3 lE+05 CTl 15,30 -1.740 140.7 1E+05 CTl 15,30 2.030 141.9 1~+05 CTI 15,30 2.260 142.8 lE+05 CT1 15,30 2.500 143.6 IE+05 CTI 15,30 2.700 144.5 lE+05 CTl 15,30 2.970 145.9 lE+05 CTl 15,30
10. 8°2 0.101 323.~ lE+02 CTl 47 8ulphur-dioxide
11. Xe 0.500 254.1 lE+05 CTI 74 Xenon 0.830 256.3 lE+05 CTI 74
1.070 257.2 lE+05 CTI 74 1.260 258.2 lE+05 CTl 74 1.470 259.6 lE+05 CT1 74 1.550 260.3 lE+05 CTI 74 1.680 261.0 IE+05 eTl 74 1.750 261.6 1E+05 CTI 74 1.860 261.9 1E+05 CTl 74 1.970 262.8 lE+05 CTl 74 2.070 263.4 lE+05 CTI 74 2.170 263.8 lE+05 CTI 74 2.370 265.2 lE+05 CT1 74
11. Xe 2.480 266.1 lE+05 CTI 74 Xenon 2.630 266.9 IE+05 CTl 74 (Contd.) 2.750 267.5 lE+05 CTl 74
2.850 267.8 lE+05 CTI 74 2.970 269.1 lE+05 CT1 _74 3.050 269.7 lE+05 CTI 74 3.130 270.0 lE+05 CT1 74 3.450 272.0 IE+OS CTl 74 3.630 273.0 lE+05 CTI 74
12. CICHF2 0.101 327.8 lE+04 BCl 52 Chloro- 0.236 328.2 lE+04 BCl 52 difluoro- 0.280 329.4 lE+04 BCl 52 m~thane 0.510 330.8 lE+04 Bel 52
0.560 331.5 lE+04 Bel 52 0.710 332.4 lE+04 BCl 52
J.PhV8. ChAm. A8f. OAt$lL Vnl 14 Nn ~ iDa ..

THE HOMOGENEOUS NUCLEATION LIMITS OF LIQUIDS 713
Table 4: Limits of superheat of pure liquids--Continued
Substance P T J Method Reference [Mfa] IX] {nuclei/(cm3 ·s)]
12. CICHF2 0.810 332.9 lE+04 BCl 52 Chloro- 0.910 334.2 lE+04 Bel 52 difluoro-methane (Cont.)
13. C2 C12H2F2 0.221 342.5 lE+06 BC2 51 Dichlora- 0.427 344.3 lE+06 Be2 51 difluora- 0.462 344.7 lE+06 BC2 51 ethane 0.655 346.6 lE+06 Be2 51
0.896 348.8 1E+06 BC2 51 0.931 349.0 1E+06 Be2 51 1.227 351.7 1E+06 BC2 51 1.489 354.4 lE+06 Be2 51 1.917 358.8 1E+06 Be2 .51 2.399 363.7 lE+06 Be2 51 2.910 369.0 lE+06 BC2 51 3.289 373.0 lE+06 Be2 51 3.323 373.4 1E+06 Be2 51 3.585 376.2 lE+06 Be2 5-1 3.634 376.9 lE+06 Be2 51
14_ CC14 -27.600 268.2 IE+03 CI2 25 Carbon tetra-chloride
15. CHC13 -31.700 258.2 1E+03 CT2 25 Chloroform 0.101 466.2 IE+02 CTI 47
16. CH2C12 0.101 394.8 lE+Ol BUB 17 Methylene-chloride
17. CH3C1 0.101 366.2 1E+05 BCI 59 Chloro-methane
18. CH4 0.400 167.6 lE+05 CTl 15 Me t.hane 0.620 168.3 lE+05 CTI 15
0.820 169.3 lE+05 CTI 15 1.030 170.5 lE+05 CTI 15 1.230 171.4 lE+05 CTI 15 1.430 172.1 1E+05 CTI 15 1.630 173.1 lE+05 CTI 15 1.830 174.0 lE+05 CTI 15 2.030 175.2 lE+05 CT1 15 2.220 176.4 lE+OS CTl 15 2.430 177.6 lE+05 CTl 15 2.630 178.6 lE+05 CTl 15 2.820 180.0 IE+05 CTl 15
J. Phys. Chem. Ref. Data, Vol. 14, No.3, 1985

714 c. T. AVEDISIAN
Table 4: Li1lits of superheat of pure liquids - Continued
Substance P T J Method Reference [HPa) [K] {nuclei/(cm3·s)]
9. C~O 0.101 458.4 lE+Ol CTI,2 34,66 Me than()1 0.101 461.2 lE+05 Bel 11~54
0.101 466.2 lE+18 PH 72,77 0.600 469.2 lE+19 PH 77 1.050 471.2 lE+20 PH 77 2.030 476.7 lE+16 PH 77 2.030 478.2 lE+20 PH 77 3.000 482.2 lE+2l PH 77 4.000 488.7 lE+22 PH 77 4.980 494.7 lE+22 PH 77 5.970 501.2 lE+23 PH 77 6.960 507.7 1E+23 PH 77
20. C2HgC1 0.101 374.1 1E+05 BCI 59 Chloroethane
21. C2H3F 0.101 290.1 1E+05 Bel 59 Fluoroethene
22. C2H3N 0.101 497.0 lE+06 BCl 55 Acetonitrile
23 .• C2HI.tFZ 0.101 .143.6 1E+05 Bel 59 1 , I-Dif luoro-ethane
24. C2 HI.t 02 -28.800 292.7 1E+03 eT2 25 Acetic acid 0.101 526.2 IE+06 Bel 55
25. C2H,+°z 0.101 423.2 lE+01 BUB 17 Methyl-formate
26. C2HSBr 0.101 422.2 lE+Ol BUB 63 Ethylbromide
27. CZHSCI 0.101 399.2 1E+Ol CT1 85 Ethylchloride
28. C2H6 0.101 269.2 lE+OS BCl 59 Ethane
29. CzH60 0.101 464.1 lE+Ol CTl,2 28,29,34,66 Ethanol 0.101 466.0 lE+04 BCI 11
0.101 471.5 1E+17 PH 72,75,77 0.580 474.2 1E+19 PH 71 0.980 471.0 lE+02 CT2 28,29,66 1.070 477.2 1E+20 PH 77 1.540 481.7 1E+20 PH 77 2.030 484.2 1E+21 PH 77 2.520 486.7 1E+21 PH 77 3.010 490.2 1E+21 PH 77 3 .. 500 494.2 1E+22 PH 77
J. Phys. Chem. Ref. Data, Vol. 14, No.3, 1985

THE HOMOGENEOUS NUCLEATION LIMITS OF LIQUIDS 715
Table 4: Limits of superheat of pure liquids -- Continued
Substance P T J Method Reference [HPa] [K] [nuclei I (c.:~· s) ]
30. C3 H3N 0.101 489.0 lE+05 BCI 55 Acrylonitrile
31. C3Hl+ 0.101 346.2 lE+05 BCI 59 Propadiene
32. C3 H4 0.101 356.8 1E+05 BCl 59 Propyne
33. C3H6 0.101 350.7 lE+05 BC1 59 Cyclopropane
34. C3 H6 0.101 325.6 lE+05 BCI 59 Propene
35. C3H60 0.101 454.5 lE+01 CT2 29 Acetone -0.101 456.4- 1E+02 CT2 28,66
0.101 458.7 1E+13 PH 72 0.101 462.7 1E+18 PH 72 0.980 462-~-6 1E+Ol CT2 29,66
36. C3H602 0.101 428.5 lE+01 BUB 17 Ethylformate
37. C3 H602 0.101 416.6 1E+01 BUB 17 Methylacetate
38. C3Ha 0.101 326.4 lE+06 BC1 59,61 N-Propane 0.302 332.8 1E+04 BCl 52
0.491 336.8 lE+04 BCl 52 0.715 339.1 1E+04 BCI 52 0.907 343.2 lE+o4 Bel 52
39. C3HaO 0.101 487.4 1E+04 BCl 11 N-Propanol 0.101 1,93 .. 0 1E+15 -PH 72
0.101 495.7 lE+18 PH 72
40. CaHg O 0.101 473.0 lE+06 BCI 55 Isopropanol
41. C4H6 0.101 377.3 IE+05 BC1 59 1,3-Butadene
42. C4Ha 0.101 371.0 1E+05 BCI 59 I-Butene
43. C4 Ha 0.101 510.2 1E+16 PH 75 Butylen~
J.Phys. Chem. Ref. Data, Vol. 14, No.3, 1985

716 C. T. ·AVEDISIAN
Table 4: Limits of superheat of . pure liquids - Continued
Substance P T J Method Reference IHPa] [K] [nuclei/(cm3·s)]
44. C4 Ha 0.101 385.4 1E+05 BC1 59 Cis-2-Butene
45. C4Ha 0.101 379.7 1E+05 Bel 59 Trans-2-Butene·
46. C4 Ha 0.101 369.6 1E+05 BC1 59 2-Methylpropene
47. C4HIO 0.101 377.6 1E+05 Bel: 33,59,61,62 N-Butane
48. C4 HIO 0.101 361.0 1E+05 BC1 59 2-Methylpropane
49. C4H100 0.101 509.6 1E+02 CT2 28,29,66 N-Butanol 0.101 511.9 lE+04 BCl 11
0.101 513.2 1E+13 PH 72 0.101 516.2 lE+16 PH 72
. ·0.101 518.2 lE+18· PH 72 0.980 519.4 lE+02 CT2 29,66
50. C4 HlOO -1.75 293. lE+02 eT2 8 Ether -1.520 402.7 lE+o4 BC2 3
-1.220 407.6 lE+04 Be2 3 -1.120 409.2 1E+04 Be2 3 -1.000 410.2 lE+04 Be2 3 -0.740 413 .. 4 lE+04 BC2 3
0 • .101 417.5 1E+OZ BCI,Z/CTl,Z 3,47,67,76, 77,84,85
0.101 425.7 1E+19 PH 72 0.211 419.4 lE+Ol Be2 39,40 0.415 420.3 1E+01 CT2 85 0.480 427.7 lE+18 PH 77 0.500 411.1 lR+02 CT2 67 ~76~ 77 0.641 424.3 lE+02 CT2 37 0.777 426.3 lE+01 BC2 38-40 0.880 432.7 lE+18 PH 77 1.000 428.4 lE+01 CT2 67,76,77,85 1.280 436.7 lE+01 PH 77 1.366 433.6 1E+Ol BC2 38-40 1.442 435.1 lE+02 CT2 37 1.575 437.2 lE+Ol CT2 85 1.660 440.7 1E+19 PH 77 1.865 1.41.2 lE ..... Ol CT2 85 2.089 443.3 lE+01 Be2 38-40 2.450 450.7 lE+21 PH 77 2.850 455.7 lE+20 PH 77
51. e,+HlOo 0.101 437.2 lE+Ol BUB 17 Isobutanol
J. Phys. Chem. Ref. Data, Vol. 14, No.3, 1985

THE HOMOGENEOUS :NUCLEATION LIMITS OF LIQUIDS 717
Table-4: Limits of superheat of pure liquids - Continued
Substance P T J Method Reference [HPa) [K] [nuclei/(cm3·s»)
52. C4 HII N 0.101 408.5 lE+01 BUB 17 Diethylamine
53. CsF12 0.101 381.5 lE+06 BCl 36 Perfluoro- 0.300 385.4 lE+06 BCl 36 pentane 0.500 388.7 lE+06 BCl 36
0.700 392.2 lE+06 BCl 36 0.890 396.4 lE+06 BCl 36 1.090 399.0 lE-t-06 Bel 36 _ 1.280 403.1 1E+06 BCl 36 1.480 407.4 1E+06 BC1 36
54. CsHa 0.101 451.4 lE+06 BC1 33 Cyclopentene
55. CsHIO 0.101 455.1 1E+06 BCI 33,84 Cyclopentane
56. CsH10 0.101 417.2 lE+06 BCl 33 . --1 ~Pentene
57. CsH12 0.101 386.1 1E+06 BCl 33 2,2-Dimethyl-propane
58. CsH12 0.101 409.2 IE+01 CT2 85 Isopentane 0.101 411.7 lE+07 BCl 73,84
59. CSH12 0.101 418.8 lE+04 BCl/CT2 22,27,42,45, N-Pentane 61,67,68,71,
73,76-78,84 0.101 426.2 1E+18 PH 72 0.490 423.7 lE+02 CT2 66-68,76,77 0.880 429.1 1E+02 CT2 66-68,76,77 1.280 435.3 lE+02 CT2 66-68,76,77 2.600 451.2 lE+06 BCl 78
60. CSH120 0.101 532.2 1E+17 PH 77 N-Pentanol
61. C6 F6 0.101 464.8 1E+Ol CT2 77 Hexaf luoro- 0.101 467.9 1E+06 BCl 35 benzene 0.500 469.9 - lE+02 CT2 77
0.570 474.1 1E+06 BC1 35 1.000 477.1 lE+02 CT2 77 1.050 480.4 lE+06 BCl 35 1.540 486.0 lE+06 BCl 35 2.030 494.2 lE+06 BCl 35
J. Phys. Chem. Ref. Data, Vol. 14, No.3, 1985

718. c. T. AVEDISIAN
Table 4: Liaits of superheat of pure liquids --Continued
S~bstance P T J Method Reference [MPa] [K] [nuclei/(cm3.s)]
62. C6 F14 0.101 409.8 lE+06 BCI 36 Perfluoro- 0.300 414.4 lE+06 BCl 36 hexane 0.500 418.5 lE+06 BCl 36
0.700 422.3 lE+06 BCl 36 0.880 425.6 lE+06 BCl 36 1.050 430.3 lE+06 BCl 36 1.2·40 434.6 lE+06 BCl 36
63. C6 H5 Br 0.101 534.2 lE+02 CTI 47 Bromobenzene
·64. C6HSC1 0.101 523.2 lE+02 CTI 47 Chlorobenzene
65. CGHG -15.000 291.2 lE+03 CT2 25 Benzene 0.101 498.9 lE+02 CT2/BCI 28,29,42,
67,76,77 0.101 510.2 lE+18 PH 72 0.'490 502.2 lE+02 CT2 67,76,77
. -0~580 514.2 - lE+19 PH" . 56 0.980 509.2 lE+02 CT2 28,29,67,76 1.070 516.7 lE+18 PH 56 1.470 513.8 lE+02 CT2 67,76,77 1.540 520.7 lE+19 PH 56 2.030 525.7 IE+19 PH 56 2.520 532.2 lE+20 PH 56 3.010 537.7 IE+17 PH 77 3.500 544.7 lE+18 PH 56
66. C6H / N -30.000 272.2 1E+03 CT2 25 Aniline 0.101 535.2 lE+02 CTI 47
67. C6H12 0.101 490.8 IE+06 CT2/BCl 33,35,42,84 Cyclohexane 0.300 493.1 lE+02 CT2 66,70
0.420 495.2 IE+06 BCl 35 0.720 499.7 lE+06 BCI 35 0.950 501.7 lE+06 BCI 35 0.980 502.1 lE+02 CT2 66 1.110 504.2 IE+06 BCl 35 1.350 506.2 lE+06 BCl 35 1.700 512.2 lE+o6 BCl 35 2.160 518.2 lE+06 BCl 35 2.370 519.2 lE+06 BCl 35 2.550 523.2 lE+06 BCl 35
68. C6H12 0.101 465.2 IE+06 BCl 33 1-Hexyne
69. C6H12 0.101 476.1 lE+o6 BCl 33 Methylcyclo-pentane
J.Phys. Chem. Ref. Data. Vol. 14. No.3. 1985

THE HOMOGENEOUS NUCLEATION LIMITS OF LIQUIDS 719
Table 4: Limits of superheat of pure liquids - Continued
Substance p T J Kethod Reference [MPa] [K] [nuclei/(c.3 .s»)
70. C6 H14 0.101 446.4 lE+06 BCl 33 2,3-Dimethyl-butane
71. C6 H14 0.101 453.5 lE+02 CT2 67,69,76,77 N-Hexane 0.101 454.9 1E+05 BCl 42,73,84
0.101 459.2 lE+13 PH 56,72,77 0.101 463.7 lE+20 PH 56 0.290 465.2 lE+15 PH 75 0.420 461.7 lE+06 BCl 71 0.490 459.3 lE+02 CT2 67,69,76,77 0.490 468.2 lE+22 PH 56 0.760 466.7 1E+06 BC1 71 0.980 467.0 ·lE+02 CT2 67,69,76,77 0.980 475.2 lE+23 PH 56 1.080 471.7 lE+06 Bel 71 1.120 478.2 lE+15 PH 75 1.280 474.7 lE+06 BCl 71 1.420 475.7 lE+06 BCl 71 1.590 479.7 1E+06 B_Cl 71 1.600 486.2 lE+16 PH 75 1.720 481.7 1E+o6 BCl 71 1.960 487.7 1E+17 PH 56 2.060 493.2 lE+16 PH 75 2.390 496.7 lE+06 BCl 71 2.570 501.2 1E+16 PH 75
72. C6H140 0.101 551.7 1E+04 BCI 11 N-Hexanol
73. C,Fa 0.101 485.3 lE+Ol CT3 66 Octafluoro- 0.490 489.7 lE+01 CT3 66 toluene 0.980 499.8 lE+Ol CT3 66
74. C,F16 0.101 434.8 lE+06 BC1 36 Perfluoro- 0.230 436.9 1E+06 BCl 36 heptane 0.400 440.5 IE+06 Bel 36
0.570 444.4 IE+06 BC1 36 0 .. 770 448 .. 3 lE+06 BCl 36 0.920 452~7 1E+06. BC1 36 1.070 456.1 lE+06 BCI 36 1.150 459.0 lE+06 BCl 36 1.280 461.3 lE+06 BCl 36
75. C/Ra 0.101 526.7 lE+02 CT3 66 Toluene
76. C1HILt 0.101 510.4 lE+06 BCl 33 Methylcyclo-hexane
J. Phya. Chem. Ref. Data, Vol. 14, No.3, 1985
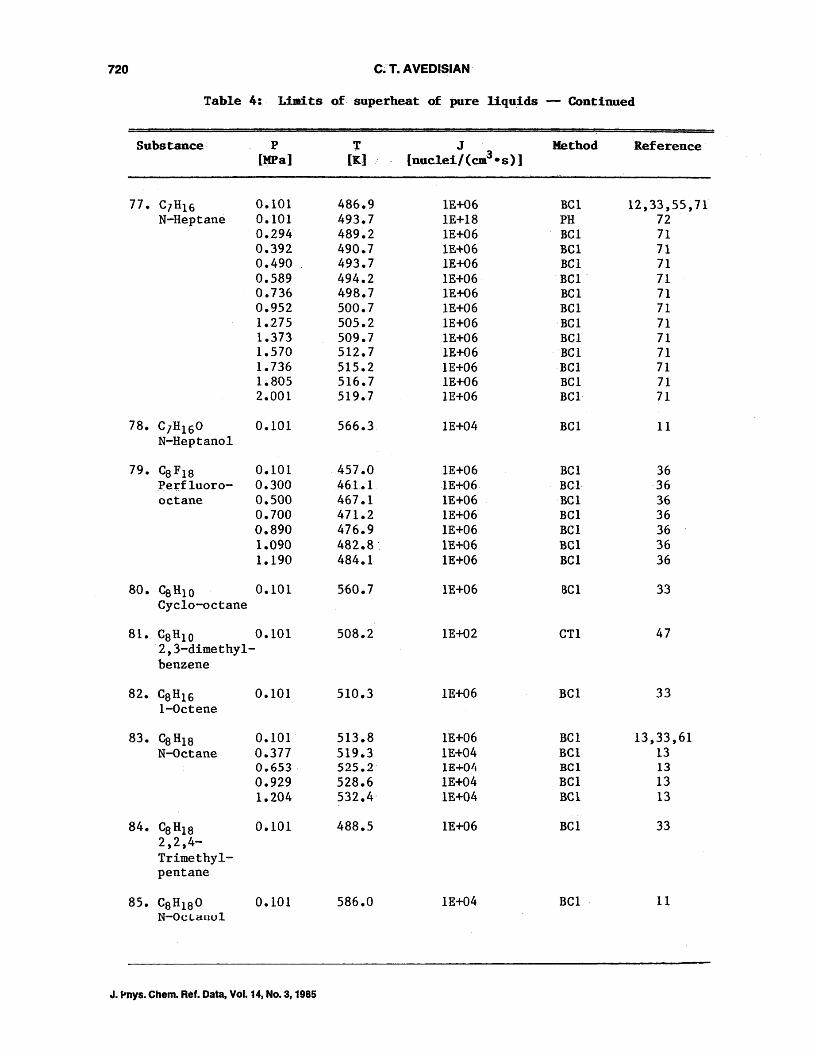
720 C.T. AVEDISIAN
Table 4: Limits of· superheat of· pure liquids - Continued
Substance P T J Method Reference [MPa] [K] [nuclei/(cui3·s) ]
77. C,H16 0.101 486.9 1E+06 BC1 12,33,55,71 N-Heptane 0.101 493.7 lE+18 PH 72
0.294 489.2 IE+06 BC1 71 0.392 490.7 1E+06 BC1 71 0.490 493.7 1E+06 BC1 71 0.589 494.2 1E+06· ·BC1· 71 0.736 498.7 IE+06 BCl 71 0.952 500.7 1E+06 BC1 71 1.275 505.2 1E+06 ·BC1 71 1.373 509.7 1E+06 BCl 71 1.570 512.7 lE+06 BCl 71 1.736 515.2 IE+06 BCI 71 1.805 516.7 lE+06 BC1 71 2.001 519.7 lE+06 BCI 71
78. C,H160 0.101 566.3 lE+o4 BC1 11 N-Heptanol
79. CSFlS 0.101 457.0 lE+06 BCI 36 .Perf luoro- 0.300 461.1 -lE+06 BCI 36 octane 0.500 467.1 1E+06 BC1 36
0.700 471.2 IE+06 BCI 36 0.890 476.9 lE+06 BCI 36 1.090 482.8· lE+06 Bel 36 1.190 484.1 lE+06 BCI 36
80. Ca HIO 0.101 560.7 1E+06 BCl 33 Cyclo-octane
81. CeHIO 0.101 508.2 lE+02 CTI 47 ·2,3-dimethyl-benzene
82. Ce H16 0.101 510.3 lE+06 BCl 33 l-Octene
83. CaHIS 0.101 513.8 IE+06 BCI 13,33,61 N-Octane 0.377 519.3 lE+o4 BCl 13
0.653 525.2 lE+04 Bel 13 0.929 528.6 IE+o4 BCl 13 1.204 532.4· IE+04 BCI 13
84. CeHla 0.101 488.5 lE+06 BCl 33 2,2,4-Trimethyl-pentane
85. CaRISO 0.101 586.0 IE+04 BCl 11 N-OcLanul
J.~nys. Chem. Ref. Data, Vol. 14, No.3, 1985

THE HOMOGENEOUS NUCLEATION LIMITS OF LIQUIDS 721
Table 4: Limits of superheat of pure liquids - Continued
Substance P T J Method Reference [MPa] [K] [nuclei/{c.3 ·s)]
86. CgF20 0.101 478.5 lE+06 BCl 36 Perfluoro- 0.300 484.4 lE+06 BCl 36 nonane 0.500 489.3 lE+06 BCl 36
0.700 493.3 lE+06 BCl 36 0.890 499.7 lE+06 BCl 36 1.090 . 505.7 1E+06 BCl 36
87. C9H20 0.101 . 538.5 lE+06 BCl 33 N-Nonane
88. CIOF22 0.101 497.1 lE+06 Bel 36 Perfluoro- 0.300 503.2 lE+06 Bel 36 decane 0.500 508.6 lE+06 BCl 36
0.700 515.6 lE+06 Bel 36 0.890 521.2 lE+06 BCl 36 1.090 527.7 lE+06 BCl 36
89. C1OH22 0.101 558.3 lE+06 BCl 33 N-Decane
90. C12HIO O O.IUI 703.2 lE+17 PH 72 Diphenyl- 0.101 708.7 lE+19 PH 72 ether
J. Phys. Chern. Ref. Data, Vol. 14, No.3, 1985

722 c. T. AVEDISIAN
Table 5: Limits of superheat of binary ·mixtures
Substance X P T J Method Reference [MPa] [K] [nuclei/(c .. 3.s»)
1. CHCI3/CSH12 0.270 0.101 429.6 lE+05 BCl 27 Chloroform/ N-pentane
2. CH40/C2H402 0.500 0.101 481.0 lE+04 BCl 54 Methanol/ Acetic acid
3. COz/CICHF2 0.820 0.095 309.0 IE+04 BCl 52 Carbon 0.820 0.350 311.7 lE+04 BCl 52 Dioxide(Gas)/ 0.820 0.510 312.9 IE+04 BCl 52 Freon 22 0.820 0.610 313.6 lE+04 BCI 52
0.820 0.710 314.1 1E+04 BCI 52 0.820 0.810 315.0 lE+o4 BCI 52 0.820 0.910 315.5 IE+04 Bel 52 0.820 1.020 316.2 1E+04 BC1 52 0.870 0.110 314.3 lE+04 BCl 52 0.870 0.250 315.2 lE+04 BCl 52
. 0.870 0.350 316.6 1E+04 BCI 52 0.870 0.460 - 317.1 1E+04- BCl 52 0.870 0.530 317.5 lE+04 BCl 52 0.870 0.650 318.2 1E+04 BCl 52
. 0.870 0.770 319.1 1E+04 BC1 52 0.870 0.850 319.4 lE+04 BCl 52 0.870 0.910 319.7 1E+04 BCl 52 0.870 0.990 320.1 lE+04 BCl 52 0.910 0.095 319.0 1E+04 BC1 52 0.910 0.193 319.8 1E+04 BCI 52 0.910 0.460 321.2 1E+04 Bel 52 0.910 0.490 321.8 lE+04 Bel 52 0.910 0.610 322.5 1E+04 BCl 52 0.910 0.740 323.5 lE+04 BCl 52 0.910 0.810 324.1 lE+04 BCl 52 0.910 0.850 324.5 lE+04 BCI 52 0.910 0.910 324.7 lE+04 BCl 52 0.910 0.960 325.4 lE+04 BCl 52 0.910 1.010 326.0 1E+04 BCl 52 0.970 0.095 323.5 lE+04 BC1 52 0.970 0.148 323.9 lE+04 BCl 52 0.970 0.182 324.4 lE+04 BCI 52 0.970 0.230 324.9 lE+04 BCI 52 0.970 0.280 325.2 lE+04 Bel 52 0.970 0.370 325.6 lE+04 BCI 52 0.970 0.400 325.9 lE+04 BCI 52 0.970 0.560 327.4 lE+04 BCl 52 0.970 0.740 329.2 lE+04 BCl 52 0.970 0.810 329.5 - lE+04 BCI 52 0.970 0.910 330.1 lE+04 BCI 52 0.970 1.010 330.8 lE+04 Bel 52
J. Phys.Chem. Ref. Data, Vol. 14, No.3, 1985

THE HOMOGENEOUS NUCLEATION LIMITS OF LIQUIDS 723
Table 5: Liudts· of superheat of binary mixtures~ontinued
Substance X P T J Method Reference [MFa] [K] [nuclei/ (cm3 • s)]
4. C02/C3HS 0.700 0.106 307.1 lE+04 BCl 52 Carbon 0.700 0.302 309.0 lE+04 BCl 52 Dioxide(Gas)/ . 0.700 0.410 310.2 1E+04 BCl ;2 N-Propane 0.700 0.509 312.0 lE+04 BCl j2
0.700 0.715 314.8 1E+04 BCl 52 0.700 0.810 316.2 lE+04 BC1 52 0.700 1.014 318.3 1E+04 BCl 52 0.780 . 0.106 313.6 lE+04 BCl 52 0.780 0.302 315.0 lE+04 Bel 52 0.780 0.410 316.6 1E+04 BCI. 52 0.780 0.509 318.2 lE+04 BCl 52 0.780 0.7115 320.1 1E+04 BC1 52 0.780 0.810 320.8 1E+04 BC1 52 0.780 0.912 321.8 lE+04 BCl 52 0.780 1.014 324.3 1E+04 BCl 52 0.850 0.106 319.7 1E+04 BCl 52 0.850 0.302 321.5 lE+04 BC1 52 0.850 0.410 322.2 1E+04 BCl 52 0.850 0.715 325.5 lE+04 BCI 52 0.850- -0.810 327-.5 lE+04 BCl 52 0.850 1.014 329.7 lE+04 BCl 52 0.910 0.106 324.3 lE+04 BCl 52 0.910 0.208 324.5 lE+04 BCI 52 0.910 0.302 325.9 1E+04 BCl 52 0.910 0.410 326.6 lE+04 BCl 52 0.910 0.509 327.5 1E+04 BC1 52 0.910 0.715 330.5 IE+04 BCl 52 0.910 0.810 332.0 1E+04 BC1 52 0.910 0.912 332.8 1E+04 BCl 52 0.910 1.014 . 334.1 lE+04 BC1 52
5. COz/CltH1O 0.670 0.101 314.3 1E+04 Bel 52 Carbon 0.670 0.208 315.0 1E+04 BCl 52 Dioxide(Gas)/ 0.670 0.301 315.8 1E+04 BCl 52 Isobutane 0.670 0.407 316.6 1E+04 BC1 52
0.670 0.611 319.3 lE+04 BC1 52 0.670 0.712 320.4 lE+04 BCl 52 0.670 0.813 321.7 lE+04 BCl 52 0.670 1.070 326.3 lE+04 BCI 52 0.740 0.208 326.3 lE+04 BCl 52 0.740 0.301 327.1 lE+04 BCl 52 0.740 0.407 327.4 lE+04 BCl 52 0.740 0.514 329.4 lE+04 BCl 52 0.740 0.611 330.3 lE+04 BCl 52 0.740 0.718 331.7 lE+04 BCl 52 0.740 0.818 333.7 lE+04 BCl 52 0.740 0.910 334.6 1E+04 BCl 52 0.740 1.020 335.9 lE+04 BCl 52 0.740 1.070 336.9 1E+04 BCl 52 0.740 1.120 337.3 1E+04 BCI 52
J. Phys. Chern. Ref. Data, Vol. 14, No.3, 1985

724 c. T. AVEDISIAN
Table 5: Limits of superheat of binary mixtures--Continued
Substance X P T J Method Reference [HPa] [X] [nuclei/(c .. 3.s)]
5. C02/CltHIO 0.800 0.101 330.3 lE+04 BC1 52 Carbon 0.800 0.208 332.5 1E+04 BCl 52 Dioxide(Gas)/ 0.80 0.329 333.7 lE+04 BCl 52 Isobutane 0.80 0.611 337.8 lE+04 BCI 52 (Contd.) 0.80 0.818 342.1 lE+04 BCl 52
0.80 0.910 342.4 lE+04 BC1 52 0.80 1.020 345.2 1E+04 BCl 52
6. C2H3N/C3H3N 0.180 0.101 492.0 1E+06 BCl 54,55 Acetonitrile/ 0.510 0.101 491.2 1E+06 BC1 54,55 acrylonitrile· 0.810 0.101 489.0 1E+06 BC1 54,55
7. C2 H6/C3Ha 0.040 0.101 269.8 1E+05 BC1 59 Ethane/ 0.140 0.101 275.1 1E+05 BCI 59 N-Propane 0.210 0.101 280.7 1E+OS BCl 59
·0.360 0.101 285.1 1E+05 BCI 59 0.620 0.101 302.1 1E+05 BCl 59 0.720 0.101 304.6 1E+05 BCI 59 0.830 0.101 312.2 lE+05 BCI 59 0.900- 0.101 317.7 lE+05 BCl 59
8. C2H6/Clt HIO 0.060 0.101 271.4 lE+05 BCl 59 Ethane/ .0.090 0.101 276.7 lE+05 BC1 59 N-Butane 0.170 0.101 282.3 1E+05 BCl 59
0.650 0.101 333.9 lE+05 BCl 59 0.740 0.101 348.1 1E+05 BC1 59 0.880 0.101 360.1 1E+05 BC1 59
9. C2H60/c3HaO 0.080 0.101 468.1 1E+05 Bel 11 Ethanol/ 0.251 0.101 471.6 1E+05 BC1 11 N-Propanol 0.439 0.101 475.7 lE+05 BCI 11
0.646 0.101 480.2 1E+OS Bel 11 0.875 0.101 484.3 lE+05 BCl 11
10. C2H60/C6H6 0.249 0.101 465.2 1&+01 CT2 28,29 Ethanol/ 0.249 0.980 472.5 1E+Ol CT2 28,29 Benzene 0.503 0.101 470.7 1E+01 CT2 28,29
0.503 0.980 477.4 1E+Ol CT2 28,29 U.742 0.101 479.5 lE+Ol CT2 28,29 0.742 0.980 488.2 lE+Ol CT2 2.8,29 0.904 0.101 488.7 1E+01 CT2 28,29 0.904 0.980 500.6 1E+01 CT2 28,29
11. C3H60/C4HIOO 0.350 0.101 474.8 lE+02 CT2 28,29 Aee-.ton£!/ 0.500 0.101 483.7 1E+02 CT2 28,29 N-Butanol 0.500 0.980 491.7 lE+01 CT2 29
0.650 0.101 492.2 1E+02 CT2 28,29 0·.650 0.980 500.7 lE+01 CT2 29
J. Phys. Chem. Ref. Data, Vot 14, No.3, 1985
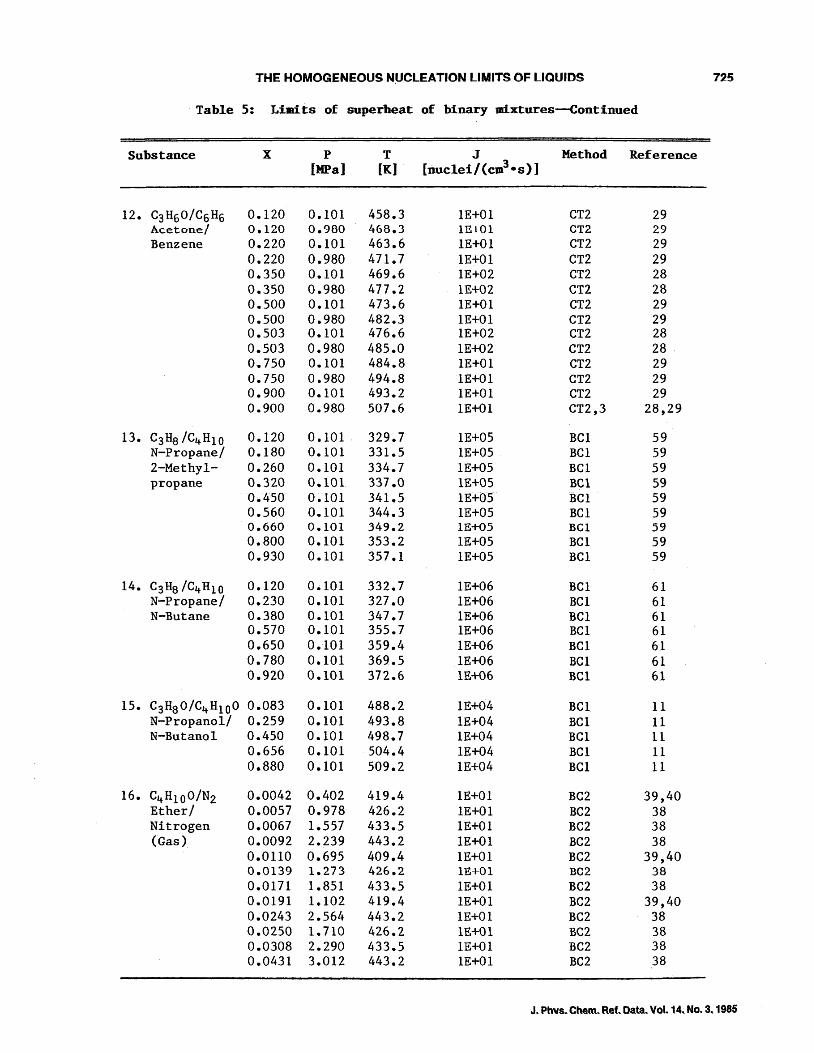
THE HOMOGENEOUS N.UCLEATION LIMITS OF LIQUIDS 725
Table 5: Limits of superheat of binary mixtures--Continued
Substance X P T J Method Reference [MPa] [K] [nuclei/(cm3·s)]
12. C3 H60/C6H6 0.120 0.101 458.3 lE+01 CT2 29 Acetone! 0..120. 0..980. 468.3 1£+0.1 CT2 29 Benzene 0.220 0.101 463.6 1E+01 CT2 29
0.220 0.980 471.7 lE+Ol CT2 29 0.350 0.101 469.6 1E+02 CT2 28 0.350 0.980 477.2 1£.+02 CT2 28 0.500 0.101 473.6 lE+01 CT2 29 0.500 0.980 482.3 lE+Ol CT2 29 0.503 0.101 476.6 lE+02 CT2 28 0.503 0.980 485.0 IE+02 CT2 28 . 0·.750 0.101 484.8 lE+01 CT2 29 0.750 0.980 494.8 lE+01 CT2 29 0.900 0.101 493.2 1E+Ol CT2 29 0.900 0.980 507.6 lE+Ol CT2,3 28,29
13. C3 HS /C4 HIO 0.120 0.101 329.7 lE+05 BCl 59 N-Propane/ 0.180 0.101 331.5 lE+05 BCI 59 2-Methyl- 0.260 0.101 334.7 lE+05 BCl 59 propane 0.320 0.101 337.0 1£.+05 BCl 59
. 0.450 0.101 341.5 IE+05 BCI 59 0.560 0.101 344.3 1E+05 BCI 59 0..660. 0..10.1 349.2 1E+05 Bel 59 0.800 0.101 353.2 lE+05 BCl 59 0.930 0.101 357.1 lE+05 BC1 59
14. C3 HS /C4 HIO 0.120 0.101 332.7 1E+06 BCl 61 N-Propane/ 0.230 0.101 327.0 lE+06 BCl 61 N-Butane 0.380 0.101 347.7 lE+06 BCl 61
0.570 0.101 355.7 lE+06 BCl 61 0.650 0.101 359.4 lE+06 BCl 61 0.780 0.101 369.5 1E+06 BCI 61 0.920 0.101 372.6 1E+06 BCl 61
15. C3HS O/C4 H100 0.083 0.101 488.2 lE+04 BCl 11 N-Propanol/ 0.259 0.101 493.8 1E+04 BC1 11 N-Butanol 0.450 0.101 498.7 1E+04 BCl II
0.656 0.101 ·504.4 lE+04 BC1 11 0.880 0.101 509.2 lE+04 BCl 11
16. C4 H1OO/N2 0.0042 0.402 419.4 1E+Ol BC2 39,40 Ether/ 0.0057 0.978 426.2 1E+01 BC2 38 Nitrogen 0.0067 1.557 433.5 lE+01 BC2 38 (Gas) 0.0092 2.239 443.2 1E+01 BC2 38
0.0110 0.695 409.4 1E+01 BC2 39,40 0..0.139 1.273 426.2 1E+o.1 BC2 38 0.0171 1.851 433.5 1E+01 BC2 38 0.0191 1.102 419.4 1E+01 BC2 39,40 0.0243 2.564 443.2 lE+Ol BC2 38 0.0250 1.710 426.2 1£.+01 BC2 38 0.0308 2.290 433.5 lE+01 BC2 38 0.0431 3.012 443.2 lE+01 BC2 38
J. Phvs. Chern. Ref. Data. Vol. 14. No.3, 1985

"26 C. T. AVEDISIAN
Table 5: Limits of superheat of binary udxtures--COntinued
Substance X P T J Method Reference [MPa] [Kl (nuclei/(cm3.s)]
17. C4 HIOO/ 0.086 0.101 511.6 1E+04 BCl 11 C5Hl-OO 0.266 0.101 513.2 1E+04 Bel 11 N-Butanol/ 0.458 0.101 518.7· 1E+04 BCl 11 N-Pentanol 0.664 0.101 525.2 lE+04 Bel 11
0.884 0.101 529.2 IE+04 BCl 11
18. Cs H12 /C6 H12 0.130 0.101 436.7 lE+06' BCl 33 N-Pentane/ 0.290 0.101 445.7 . lE+06 BCl 33 Cyclo- 0.450 0.101 453.2 1E+06 BCl 33 hexane 0.600 0.101 463.2 IE+06 BCI 33
0.730 0.101 473.2 lE+06 BCl 33 0.850 0.101 483.2 lE+06 BCl 33
19. CSH12/C6H14 0.200 0.101 424.9 IE+04 BCI 42 N-Pentane/ 0.250 0.101 426.8 1E+06 BCI . 77 N-Hexane 0.400 0.101 432.5 IE+04 BCI 42
0.500 0.101 435.8 lE+06 BCl 77 0.600 0.101 439.4 IE+04 BCI 42 0.800 0.101 446.5 lE+04 BCl 42 0.900 0.101 449.2 IE+06 BCl 77
20. CSH12/C,HI6 0.209 0.101 434.0 lE+04 BCl 12 N-Pentane/ 0.209 0.653 441.3 1E+04 BCI 12 N-Heptane 0.209 1.204 453.2 lE+04 BCI 12
0.209 2.032 463.9 lE+04 BCI 12 0.442 0.101 451.4 lE+04 BCI 12 0.442 0.377 456.8 lE+04 BCI 12 0.442 0.653 462.0 lE+04 BCI 12 0.442 0.929 46';.9 lE+04 .BGl 12 0.442 1.204 470.3 lE+04 BCI 12 0.442 1.480 475.3 1E+04 BCI 12 0.442 1.756 478.4 lE+04 Bel 12 0.442 2.032 482.0 lE+04 BCl 12 0.442 2.308 486.7 lE+04 BCl 12 0.442 2.583 489.9 lE+04 BCl 12 0.745 0.101 471.5 lE+04 BCl 12 0.745 0.239 473.7 1E+04 BCI 12 0.745 0.377 476.8 1E+04 BCI 12 0.745 0.653 481.9 lE+04 BCl 12 0.745 0.929 486.0 1E+04 BCl 12 0.745 1.204 491.1 1E+04 BCl 12 0.745 1.480 494.4 lE+04 BCI 12 0.745 1.756 498.9 lE+04 BCl 12 0.745 2.032 501.6 IE+04 BCI 12 0.745 2.308 508.4 lE+04 BCl 12
21. C s H 12 / Cs HIS 0.250 0.101 442.2 lE+05 BC1 12 N-Pentane/ 0.250 0.653 451.7 lE+04 BCI 12 N-Octane 0.250 1.204 460.5 lE+04 BCl 12
0.350 0.101 450.4 lE+06 BCl 61 0.500 0.653 478.4 lE+04 BCI 12 0.500 1.204 487.8 1E+04 BCI 12
J. Phvs. Chem. Ref. Data. Vol. 14. No. a.1AA!i

THE HOMOGENEOUS NUCLEATION LIMITS OF LIQUIDS 727
Table 5: Limits of superheat of binary mixtures--Continued
Substance X P T J Method Reference [MFa] [K] [nuclei/(cm3.~)]
21. CsH12/CaH18 0.550 0.101 469.0 lE+06 BCl 61 N-Pentane/ 0.700 0.101 484.3 1E+06 BCl 61 N .... Octane 0.750 0.101 491.1 lE+04 BCl 12 (Contd. ) 0.750 0.646 501.2 1E+04 BCl 12
0.750 1.204 510.4 lE+04 BCl 12 0~830 0.101 496.7 1E+06 BC1 61
22. CsH12/C12H26 0.150 0.101 450.8 1E+06 BCl 33 N-Pentane/ 0.290 0.101 473.2 lE+06 BCl 33 N-Dodecane 0.450 0.101 510.0 lE+06 BC1 33
0.600 0.101 532.4 1E+06 BCl 33 0.730 0.101 560.0 lE+06 BCI 33
,3. CsH12/C16H34 0.040 0.101 430.7 lE+06 BCl 22 N-Pentane/N- 0.070 0.101 439.2 lE+06 BCl 22 Hexadecane 0.100 0.101 443.2 iE+04 Bel 12
0.100 0.377 447.0 lE+04 BCl 12 0.100 0.653 451.4 lE+04 BCl 12 0.100 0.929 454.8 lE+04 BCI 12 0.100 1.204 459.7 lE+Olt BC1 12 0.130 0.101 453.2 lE+Ob Bel 22 0.150 0.101 458.2 1E+06 Bel 22 0.200 0.101 467.3 ' lE+04 BCl 12 0.200 0.377 470.6 1E+04 BCl 12 0.200 0.653 475.6 lE+04 BCl 12 0.200 0.929 480.2 lE+04 BCI 12 0.200 1.204 484.5 lE+04 Bel 12 0.220 0.101 470.7 lE+06 Bel 22 0.300 0.101 494.0 lE+04 BCI 12,.33 0.300 0.377 497.9 lE+04 BCl 12 0.300 1.204 519.7 ·lE+04 BCl 12 0.400 0.101 515.7 lE+06 BC1 33 0.452 0.101 532.2 ' lE+06 Bel 33 0.532 0.101 552.5 lE*06 BCl 33 0.571 0.101 562.2 lE+06 BCl 33
24. C6H6/C6H12 0.045 0.310 498.4 lE+OO CT2 70 Benzene- 0.110 0.310 497.4 lE+OO CT2 70 Cyclo- 0.200 0.101 493.1 lE+04 BCl 42 hexane 0.226 0.310 495.8 lE+OO CT2 70
0.340 0.310 493.7 lE+OO CT2 70 0.400 0.101 490.4 lE+04 BCl 42 0.489 0.310 493.6 lE+OO CT2 70 0.600 0.101 489.8 IE+04 BCI 42 0.608 0.310 492.5 lE+OO CT2 70 0.765 0.310 492.1 lE+OO CT2 70 0.800 0.101 489.7- lE+04 BCI 42
25. C6 H6/C6H14 0.200 0.101 477.8 lE+04 Bel 42 Benzene/ 0.400 0.101 466.8 lE+04 Bel 42 N-Hexane 0.600 0.101 462.0 lE+04 BCl 42
0.800 0.101 456.9 lE+04 BCl 42
J. Phys. Chem. Ref. Data, Vol. 14, No.3, 1985

728 C. T. AVEDISIAN
Table 5: Limits of superheat of binary mixtures--COntinued
Substance X P T J Method Reference [MPa] [I{] [nuclei/(cm3·s)]
26. C6 H6/C6H14 0.200 0.101 459.8 lE+04 BCl 42 Cyclohexane/ 0.400 0.101 466.9 1E+04 BCl 42 N-Hexall.e 0.600 0.101 473.4 lE+04 Bel 42
0.800 0.101 481.6 1E+04 BCl 42
27. C6H14/C,H16 '0.250 0.101 463.2 1E+07 BCl 73 N-Hexane! 0.500 O~ 101 471.1 1E+07 BCl 73 N-Heptane 0.750 0.101 479.3 1E+07 BCl 73
Table 6: Limits of superheat of ternary mixtures
Substance X(C2) X(C3> p T J Method Reference [MPa] [I{]
1~- C2H6/C3Ha/ '0;806 0.155 O~lOl -27 8. 4~2 81-~-2- 1E+05 BCl 59 C4HIO 0.806 0.073 0.101 280.8-283.4 lE+05 BCl 59 Ethane/ 0.092 0.811 0.101 324.0-329.8 lE+05 Bel 59 N-Propane/ 0.100 0.771 0.101 326.0-331.0 lE+05 BCl 59 N-Butane 0.235 0.433 0.101 324.8-344.2 lE+05 BCl 5.9
0.113 0.652 0.101 329.4-334.8 1E+05 BCl 59 0.160 0.299 0.101 337.8-354.4 lE+05 BCl 59 0.076 0.403 0.101 342.4-353.0 lE+05 BCl 59 0.135 0.160 0.101 344.6-355.8 1E+OS BC1 59
7. Nomenclature T temperature
G defined as .d lP * I KT Tc critical temperature
J bulk nucleation rate (nuc1ei/cm3·s) Tk kinetic limit of superheat at Po [Eq. (4)] Tr reduced temperature (= T ITc)
k Boltzmann constant T" saturation temperature at Po [Eq. (2)]
kr molecular evaporation rate (molecules/s) Tt thermodynamic limit of superheat at Po m molecular mass T' minimum liquid temperature below which n unit outward normal to nucleus ambient pressure around nucleus is extensive
surface (Fig. 3) (Fig. 3) No number density of single activated molecules
VI liquid specific volume P gas pressure in nucleus
ar liquid thermal diffusivity Po ambient pressure
0- surface tension of superheat liquid with Ps saturation pressure at Tk respect to its own vapor r radius of nucleus
0"12 interfacial tension between test and field liquids R gas constant
J. Phys. Chem. Ref. Data, Vol. 14, No.3, 1985

THE HOMOGENEOUS NUCLEATION LIMITS OF LIQUIDS 729
8. Acknowledgments The author thanks Mr. Mahmoud Fatehi for assistance
in carrying out the extensive literature search that formed a major effort of the present work. He also thanks Professor Robert E. Apfel of Yale University for several constructive comments. This work was supported by the Office of Basic Energy Sciences of the Department of Energy through National Bureau of Standards-Office of Standard Reference Data under Grant No. NB82NADA3001, with Dr. Howard J. White, Jr. as project monitor. Additional support was received from the National Science Foundation through Grant No. CPE-8106348 (Dr. Robert M. Wellek, Program Director). This support is greatly appreciated.
9. References Many more papers exist than were included in this ref
erence list on the subject of homogeneous nucleation in liquids. Those· sources dealing exclusively with theoretical method~ and mea~urement of unrelated properties of super-
. heated liquids (e.g., specific volume, sound speed, compressibility, etc.) were not of direct relevance to the intent of the present work. Most of the literature in the final listing contained superheat limit data of direct relevance to this work, or contained information which bore on the·criteria for inclusion of these data in Tables 4-6. IR. E. Apfel, Nature (London) Phys. Sci. 238, 63 (1972).
_ 2R.E.Apfel, Nature (London) Phys. Sci.233,119~(1911). 3R. E. Apfel, J. Acoust. Soc. Am. 49, 145 (1971). 4R. E. Apfel, Sci. Am. 227,58 (1972). sR. E. Apfel and J. P. Harbison, J. Acoust. Soc. Am. 57, 1371 (1975). 6R. E. Apfel, Technical Memorandum No. 62, Acoustics Research Labo-ratory, Harvard University, Cambridge, MA (1970).
7R. E. Apfel, J. Chern. Phys. 54, 62 (1971). 8R. E. Apfel, J. Appl. Phys. 48, 2077 (1977). 9C. T. AvedisianandR. P. Andres,J. Colloid Interface Sci. 64, 438 (1978). IOC. T. Avedisian and I. Glassman, Int. J. Heat Mass Transfer 24, 695
(1981). HC. T. Avedisian and J. R. Sullivan, Chern. Eng. Sci. 39,1033 (1984). 12C. T. Avedisian and I. Glassman, J. Heat Transfer 103, 272 (1981). 13C. T. Avedisian, J. Heat Transfer lOS, 750 (1982). 14y. G. Baidakov, Y. P. Skripov, and A. M. Kaverin, SOy. Phys. JETP 38,
557 (1974). I:)Y. G. Baidakov and Y. P. Skripov, Russ. J. Phys. Chem. 56, 499 (1982). 16G. S. Bankoff, in Proceedings of the 6th International Heat Transfer Con-
ference (Hemisphere, Toronto, 1978), p. 355. 17D. K. Basu and D. B. Sinha, Indian J. Phys. 42, 198 (1968). 18J. W. Beams, Phys. Fluids 1,1 (19"9). . I~. L. Beegle, M. Modell, and R. C. Reid, AIChE J. 20, 1200 (1974). 2<M. Berthelot, Ann. Chem. (phys.) 30,232 (1850). up. Blake, Technical Memorandum No.9, Acoustics Research Laborato
lY, Han,ud University, Cambridge, MA (1949). 22M. Blander, D. Hengstenberg, and J. L. KatZ, J. Phys. Chern. 75(23), 3613
(1971). 23M. Blander and J. L. Katz, AIChE J. 21,833 (1975). 24L. J. Briggs, J. Appl. Phys. 21, 721 (1950). 2SL. J. Briggs, J. Chem. Phys. 19,970 (1951). 26L. C. Brodie, D. N. Sinha, J. S. Semura, and C. E. Sanford, J. Appl. Phys.
48,2882 (1982). 27M. G. Buivid and M. V. Sussman, Nature 275,203 (1978). 28N. N. Danilov and Ye. N. Sinitsyn, Heat Transfer Sov. Res. 12, 71 (1980). 2~. N. Danilov, Yeo N;Sinitsyn, and Y. P. Skripov, "Spontaneous Vapor
Nuclei Formation in Superheated Liquid Solutions," in Gidrodinamika i Teploobmen v Energeticheskih Ustanovkakh (Academy of Sciences ofthe USSR, 1975), p. 3.
30A. Yeo Dianov, V. G. Mal'tsev, V. G. Baydakov, and V. Skripov, Heat Transfer SOY. Res. 12, 75 (1980).,
31M. L. Dufour, C. R. Acad. Sci. 52, 986 (1861). 32M. L. Dufour, C. R. Acad. Sci. 53, 846 (1861).
33J. G. Eberhart, W. Kremsner, and M. Blander, J. Colloid Interface Sci. 50, 369 (1975).
34J. G. Eberhart, E. J. Hathaway, and M. Blander, J. Colloid Interface Sci. 44,389 (1973).
3SG. V. Ermakov and V. P. Skripov, Russ. J. Phys. Chern. 43, 1242 (1969). 36G. V. Ermakov and Y. P. Skripov, Russ. J. Phys. Chern. 41, 39 (1962). 37G. Y. Ermakov, V. G. Baidakov, and V. P. Skripov, Russ. J. Phys. Chern.
47, 582. (1973). 3~. W. Porest and C. A. Ward, ASME Paper No. 77-HT-58 (1977). 3~. W. Porest and C. A. Ward, J. Chem. Phys. 66, 2322 (1977) .. '"7. W. Porest and C. A. Ward, J. Chem. Phys. 69, 2221 (1978). 41J. W. Gibbs, The Collected Works of J. Willard Gibbs (Longmans, Green, .
New York, 1928), Vol. 1. 42B. S. Holden and J. L. Katz, AIChE J. 24, 260 (1978). 43B. S. Holden, M.S. thesis (Clarkson College of Technology, Potsdam, NY,
1976). 44J. Hord, R. B. Jacobs, C. C. Robinson, and L. L. Sparks, J. Eng. Power 86,
485 (1964). 4sT. J. Jarvis, M. D. Donohue, and J. L. Katz, J. Colloid Interface Sci. SO,
359 (1975). 46W. M. Jones, G. D. N. Overton, and D. H. Trevena, J. Phys. D 14, 1283
(1981). 47p. B. Kenrick, C. S. Gilbert, and K. L. Wismer, J. Phys. Chem. 28, 1297
(1924). . 48p. O. Biney, W. Dong, and J. H. Lienhard, paper presented at the 23rd
ASME/AIChE National Heat Transfer Conference, 1985 (to be published).
49J. H. Lienhard and A. H. Karimi, J. Heat Transfer 100, 492 (1978). 30!,. L. Marston, J. Low Temp.!'hys. 25, j~3 (1976). SIG. R. Moore, AIChE J. 5, 458 (1959). S2y. Mori, K. Hijikata, and T. Nagatani, Int. J. Heat Mass Transfer 19,
1153 (1976). s3K. Nishigaki and Y. Saji, Jpn. J. Appl. Phys. 20, 849 (1981). _54LR.Patrick-Yeboah, Ph.D.thesis (MIT, Cambridge, MA,1979). 55J. R. Patrick-Yeboah and R. C. Reid, Ind. Eng. Chem. Fundam. 20, 315
(1981). S6p. A. Pavlov and V. P. Skripov, High Temp. (USSR) 8, 540 (1970). s7D. Yu. Peng and D. B. Robinson, Ind. Eng. Chern. Pundam. 15, 59 (1976). s8H. T. Pham, S. M. thesis (MIT, Cambridge, MA, 1977). 5~. Porteous and M. Blander, AIChE J. 21,560 (1975). ~. C. Reid, Adv. Chern. Eng. 12, 105 (1983). 61T. A. Renner, G. H. Kucera, and M. Blander, J. Colloid Interface Sci. 52,
319 (1975). 62J. E. Shepherd and B. Sturtevant, J. Fluid Mech. 21,379 (1982). 63D. 'B. Sinha and A. K. Jalaluddin, Indian J. Phys. 35, 311 (1961). MD. N. Sinha, Ph.D. thesis (Portland State University, Portland, OR,
1982). 6sD. H. Sinha, J. S. Semura, and L. C. Brodie, Phys. Rev. A 26, 1048 (1982). 66Ye. N. Sinitsyn and N. N. Danilov, Heat Transfer SOY. Res. 12, 66 (1980). o'Ye. N. Sinitsyn and Y. P. Skripov, Russ. J. Phys. Chem. 42,440(1968). 68Ye. N. Sinitsyn and V. P. Skripov, Pribory Tekh. Eksp. 4, 178 (1966). 69ye. N. Sinitsyn and Y. P. Skripov, Ukr. Phys. 1.12, 100 (1967). 7~. N. Sinitsyn, N. N. Danilov, and Y. P. Skripov, Teplofizika 425,22
(1911). 7ty. P. Skripov and G. Y. Ermakov, Russ. J. Phys. Chem. 38, 208 (1964). 72y. P. Skripovand P. A. Pavlov, High Temp. (USSR) 8, 782 {1970}. 73y. P. Skripovand Y. L. Kukushkin, Russ. J. Phys. Chem. 35,139 (1961). 74V. P. Skripov, V. O. Daic4lkov, and A. M. Kaverin, Phys. Sci. 95 A, 169
(1979). 7SV. P. Skripov, P. A. Pavlov, and E. N. Sinitsyn, High Temp. (USSR) 3,670
(1965). 76y. P. Skripovand Yeo N. Sinitsyn, Russ. J. Phys. Chem. 42,167 (1968). 77y. P. Skripov, Metastable Liquids (Wiley, New York, 1974). 78y. P. Skripovand G. V. Ermakov, Russ. J. Phys. Chern. 37, 1047 (1963). 79J. R. Sullivan, M. Eng. project report (Cornell University, Ithaca, NY,
1982). 80JI. N. Y. Ternpedey, Proc. Phys. Soc. London 49,203 (1947). 8tD. H. Trevena, Conternp. Phys.17, 109 (1976). 82S. J. D. Van Stralen and R. Cole, Boiling Phenomena (Hemisphere, New
York, 1979), Vol. 1, Chap. 4. 83V. E. Vinogradov, E. N. Sinitsyn, and Y. P. Skripov, Art. Acad. Sci. White
Russ. SSR (Physics-Energetics Science Series), No. 1 (UDC 536.423.18) (1977), p. 17.
MH. Wakeshlma and K. Takata, J. Phys. Soc. Jpn. 13, 1398 (1958). 8sK. L. Wismer, J. Phys. Chern. 26, 301 (1922).
J. Phys.Chem. Ref. Data, Vol. 14, No.3, 1985