Embed Size (px)
Citation preview
Puerco RiverEducation Projecta special project ofSouthwest Research and Information Center
June 17, 1987
Mr.,,Larry Wriest, Chief/>ttC Alan Tavenner, Project OfficerMs. Ursula Lennox, Project OfficerSuper fund Enforcement SectionU.S. Environmental Projection Agency — Region VI1445 Ross AvenueDallas, TX 75202
Re: Wa^er Wells Near United Nuclear Corp., Nt:Kinley County, N.M.
Dear Mr. Wright, Mr. Tavenner, and Ms. Lennox:
Thank you for the opportunity o review ERA's records on water wells near theUnited. Nuclear Corporation uraniun mill and tailings facility in McKinleyCounty, New Nfexico. This letter and the enclosed information constitutes SRIC'sinitial response to EPA's request.
As you know, Southwest Research and Information Center has been collectinginformation on ground water resources in the Puerco River Valley in support ofthe efforts of its Puerco River Education Project, to help local Navajocommunities develop new, clean and dependable water supplies. Our data base, areference list for which appears a-*- the end of this letter, comes from avariety of published and unpublished governmental documents, interviews withlocal officials and residents, and our own field surveys.
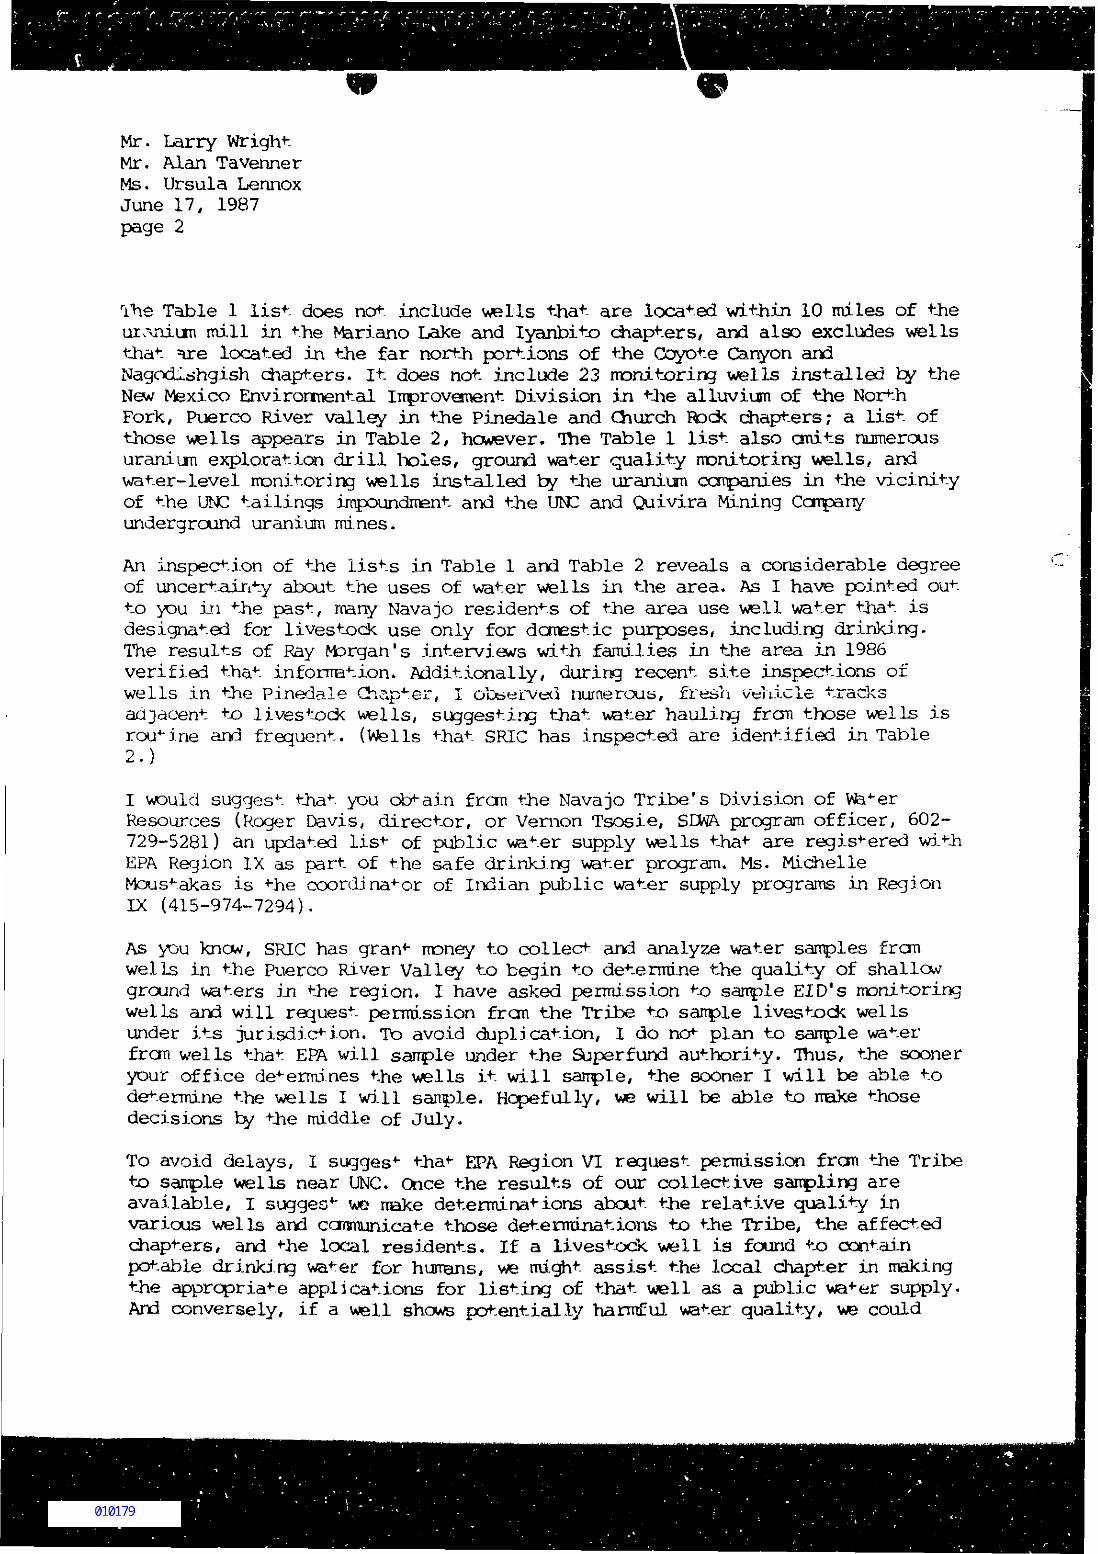
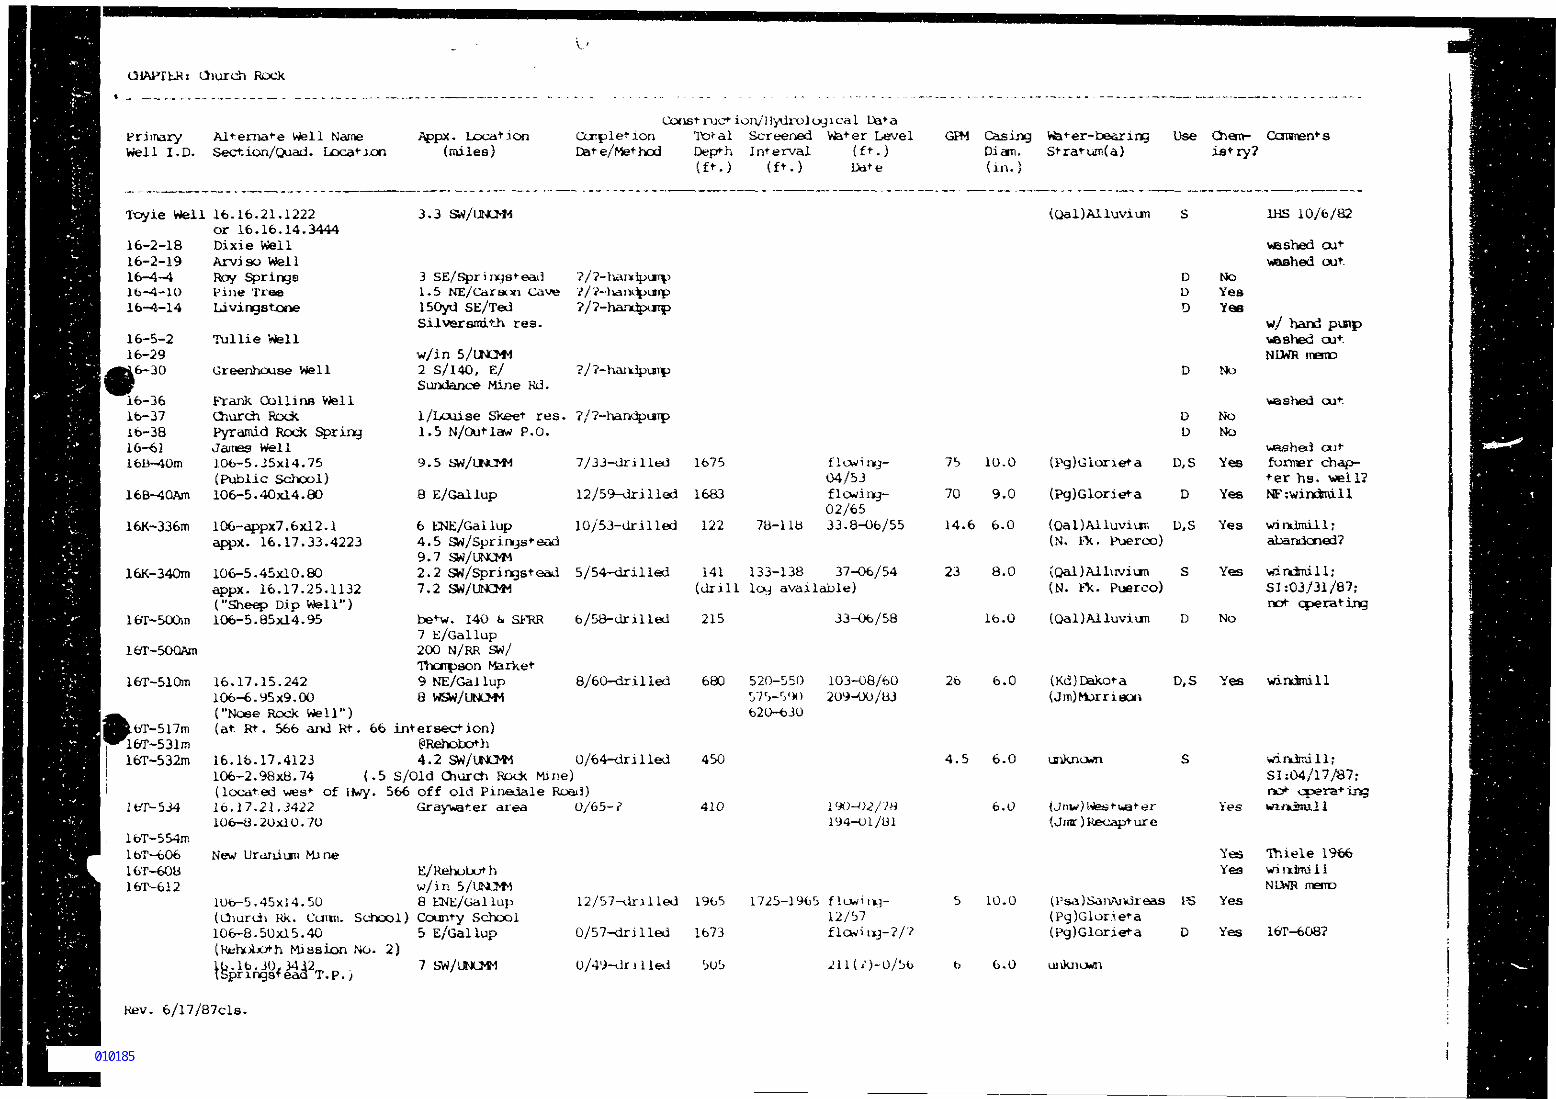
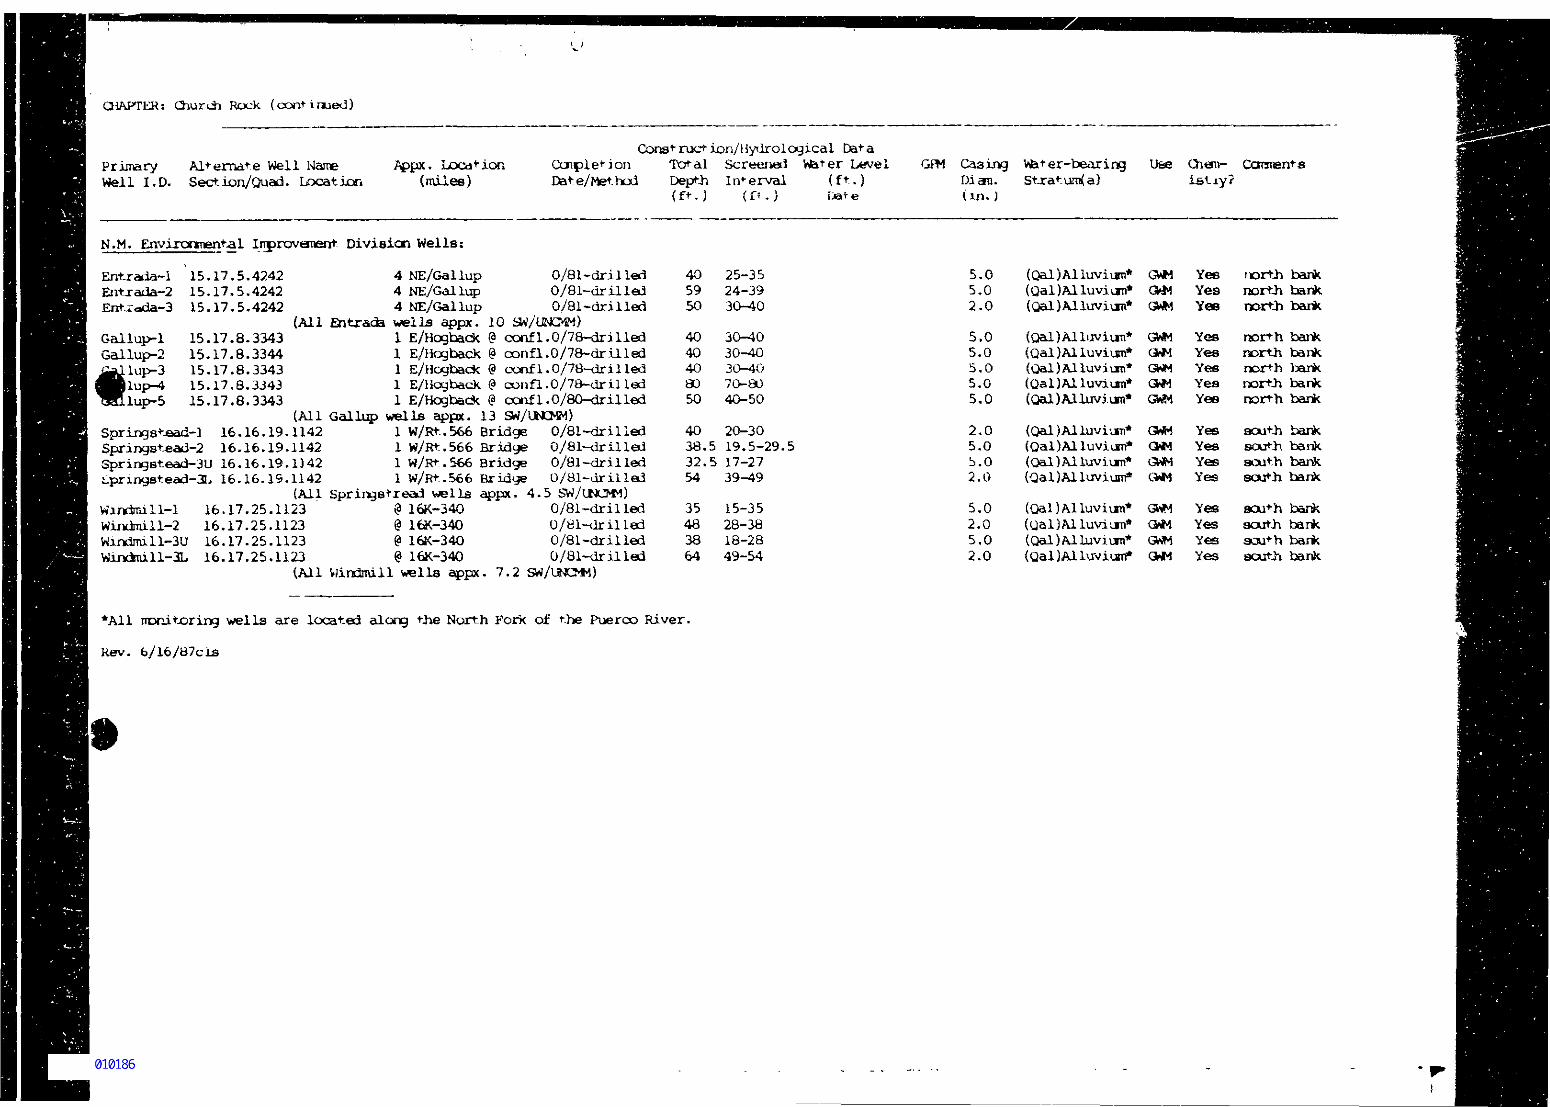
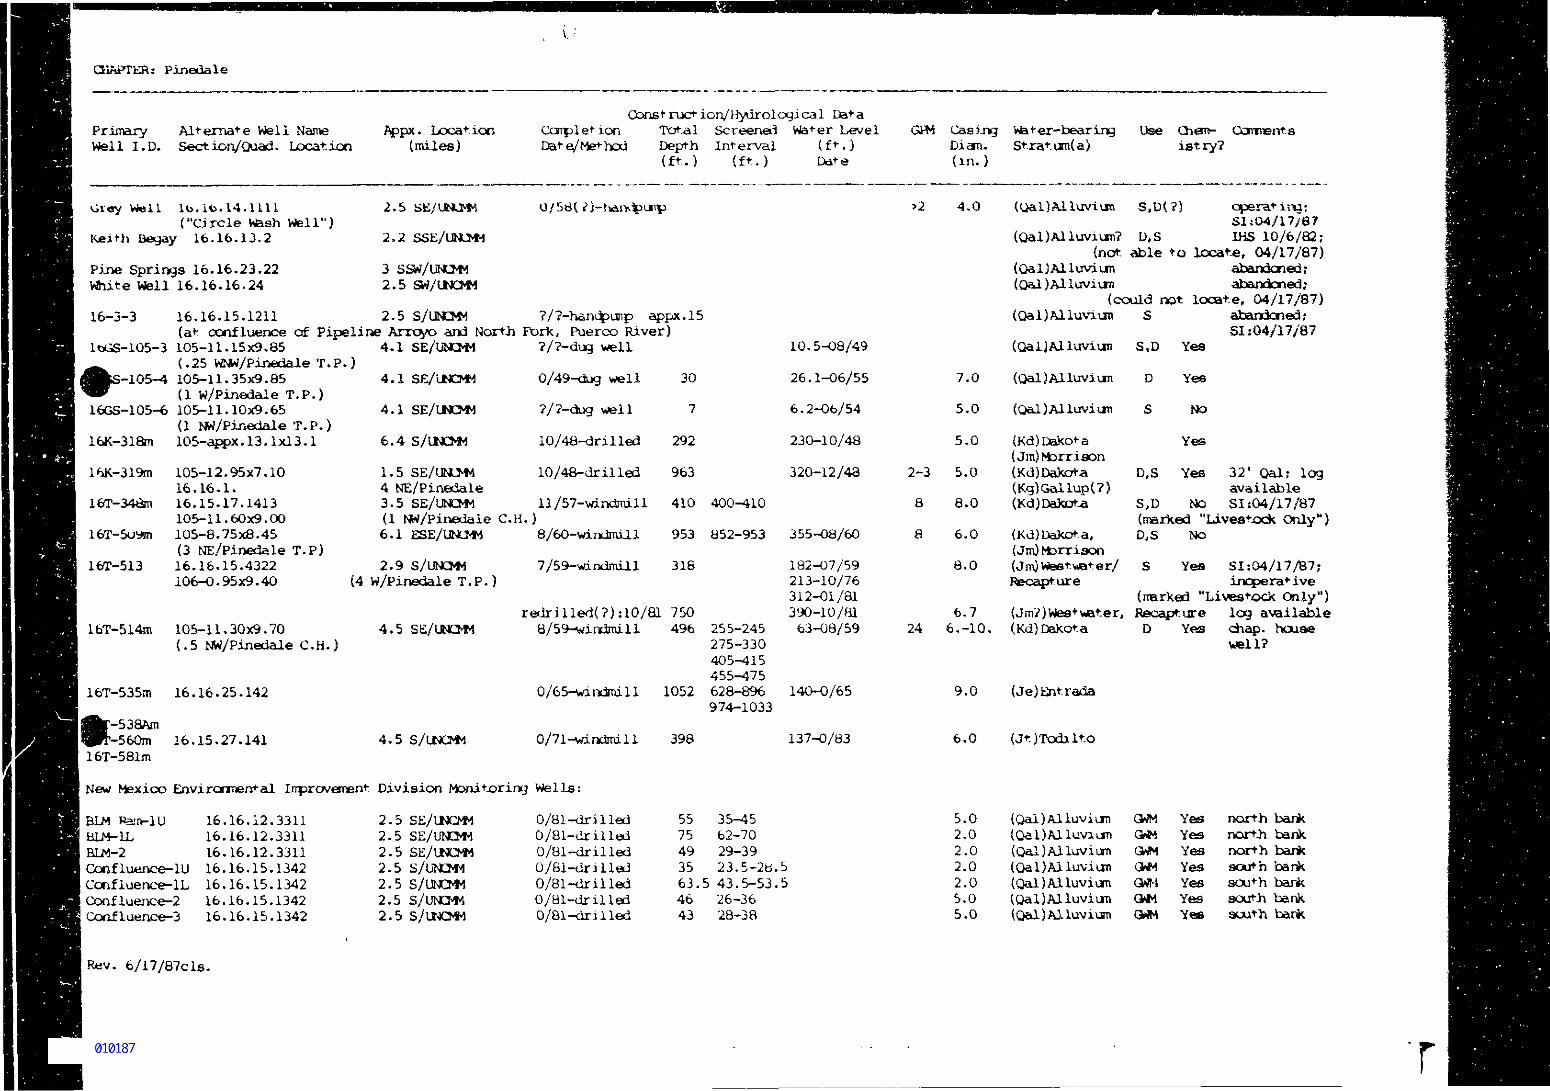
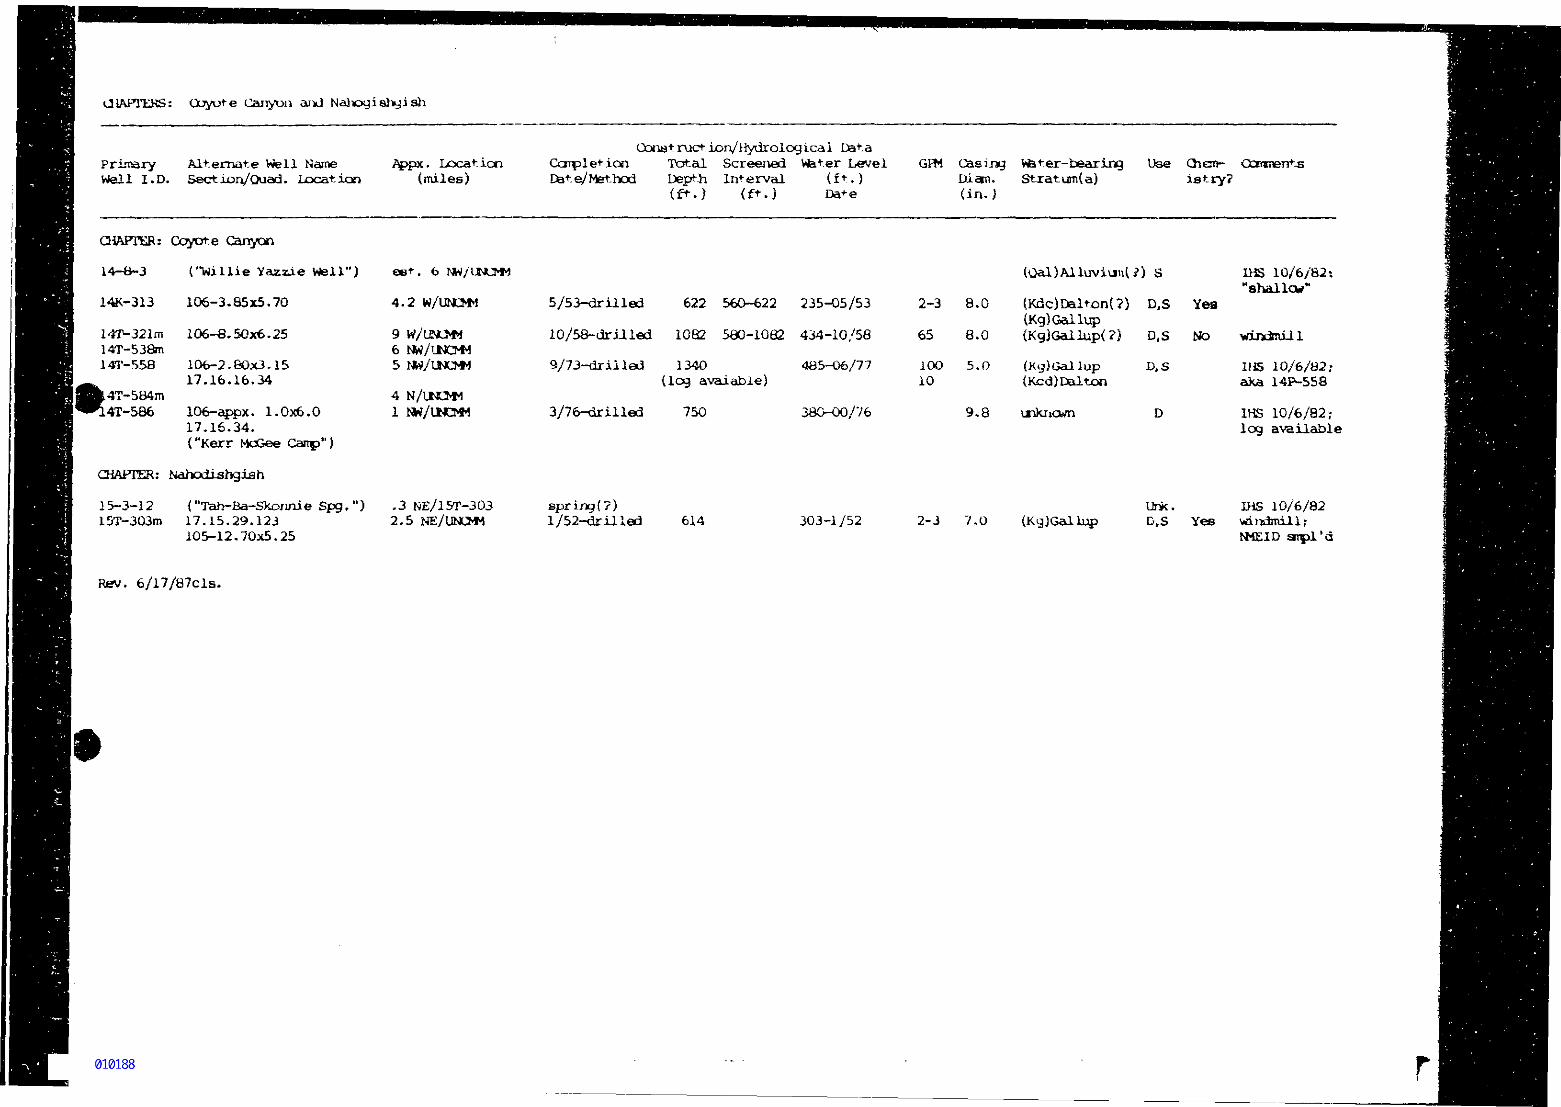
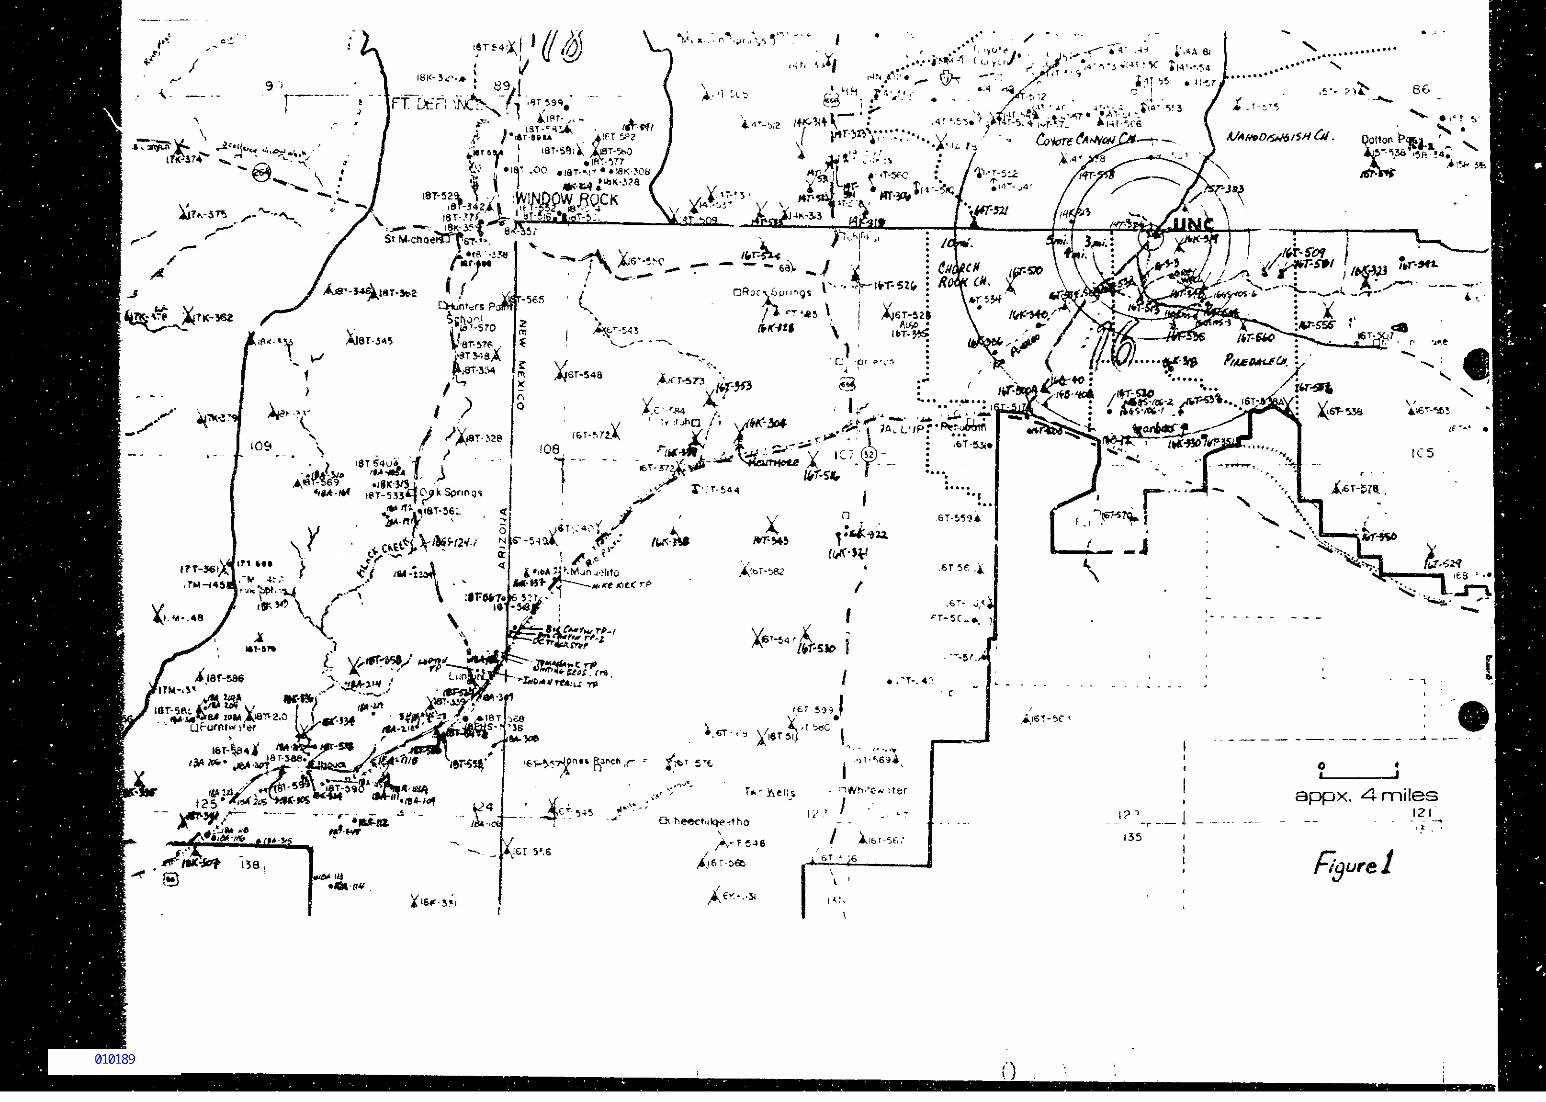
The attached Table 1 is a list of water wells that are located within 3, 4, 5and 10 miles of the UNC facility in four different chapters of the NavajoNation: Church Rock, Pinedale, Nahodishgish, and Coyote Canyon. The attachedFigure 1 is a map of the area showing the location of water wells in the area,and attached Table 2 is a conpendiun of data on wells within the four rnajorchapters near the UNC facility.
Figure 1, the well location map, is adapted frcm a copy of a portion of theNavajo Tribe's reservationwide well location nap* I have augmented the originaltribal map with locations of additional wells, concentric circles that denotedistances from the UNC site, and boundaries of the four chapters that surroundUNC. In future months, I will supply you with a map that shows the boundariesof all Navajo chapters in the river valley.
(continued)
Chris Shuey, Coordinator, SRIC Office, P.O. Box 4524, Albuquerque, A/A/ 87106 (505) 262-1X62Raymond Morgan. Community Liaison, P.O. Box 155. Ft. ttwgate, \M 87316 (505) 862-7202
00000498
Mr. Larry WrightMr, Man TavennerMs. Ursula LennoxJune 17, 1987page 2
The Table 1 list does not include wells that are located within 10 miles of theur.vu.un null in the Mariano Lake and lyanbito chapters, and also excludes wellsthat =ure located in the far north portions of the Coyote Canyon andNagodishgish chapters. It does not include 23 monitoring wells installed by theNew Mexico Environnental Improvement Division in the alluvium of the NorthFork, Puerco River valley in the Pinedale and Church Rock chapters; a list ofthose wells appears in Table 2, however. The Table 1 list also emits numerousuranium exploration drill holes, ground water quality monitoring wells, andwater-level monitoring wells installed by the uraniun conpanies in the vicinityof the UMC tailings impoundment and the UNC and Quivira Mining Ccrpanyunderground uranium mines.
An inspection of the lists in Table 1 and Table 2 reveals a considerable degreeof uncertainty about the uses of water wells in the area. As I have pointed outto you in the past, many Navajo residents of the area use well water tliat isdesignated for livestock use only for domestic purposes, including drinking.The results of Ray Morgan's interviews with families in the area in 1986verified that information* Additionally, during recent site inspections ofwells in the Pinedale Chapter, I observe*} numerous, fresh vehicle tracksad3acent to livestock wells, suggesting that water hauling frcni those wells isroutine and frequent. (Wells that SRIC has inspected are identified in Table2.)
I would suggest that you obtain frcm the Navajo Tribe's Division of Wa^erResources (Roger Davis, director, or Vernon Tsosie, SDWA program officer, 602-729-5281) an updated list of public water supply wells that are registered withEPA Region IX as part of the safe drinking water program* Ms. MichelleMous -akas is the coordinator of Indian public water supply programs in RegionIX (415-974-7294).
As you know, SRIC has gran* money to collect and analyze water samples frcmwells in the Puerco River Valley to begin to determine the quality of shallowground waters in the region. I have asked permission to sample EID's monitoringwells and will request permission frcm the Tribe to sanple livestock wellsunder its jurisdiction. To avoid duplication, I do no plan to sample waterfrcm wells that EFA will sample under the Super fund authority. Thus, the sooneryour office determines the wells it will sample, the sooner I will be able todetermine the wells I will sample. Hopefully, vje will be able to make thosedecisions ty the middle of July.
To avoid delays, I sugges4- tha* EPA Region VT request permission frori the Tribeto sample wells near UNC. Once the results of our collective sampling areavailable, I sugges*" we make determinations about the relative quality invarious wells and ccmnunicate those determinations to the Tribe, the affectedchapters, and the local residents. If a livestock well is found to containpotable drinking water for humans, we might assist the local chapter in makingthe appropriate applications for listing of that well as a public wa*er supply-And conversely, if a well shows potentially harmful water quality, we could
Mr. Larry WrightMr, Alan TavennerMs. Ursula LennoxJune 17, 1987page 3
recornnend its closure.
In regard to the data included is\ Mr, Mahler's letter of October 6, 1982, thereis at least one apparent error: On the first page of the letter, well 14K-313is said to be located vasst of U.S. HAT/. 666* Figure 1 indeed shows a welllabeled 14K-313 located about 3 miles west of H*ry. 666. However, all availablelocation information for v^ll 14K-313 shews that it is located in Quad 106, no*-.Quad 107. TVius, the Navajo Tribe's location map apparently is incorrect, I haveplaced the approximate location of w?ll 14K-313 on Figure 1.
For your information, I have enclosed copies of two scientific reports tha*dascuss hydrogeology and geochemistry in the vicinity of the UNC tailingsfacility. Please also note that I have corpiled historic water quality data forabout 25 percent of the the 346 ironitoring wells at the UNC site (see referencelist); that infonration, which is current through 1985, is on conputer files.EID's ground water staff has also computerized all water quality data formonitoring wells at UNC.
SRJC has supplied these well lists to EPA in the spirit of cooperation. Ourcooperation and involvement; however, does not suggest that w& agree with EPA'sapparent determination to sample only those wells that are located within 3miles of the UN^ site. That determination contradicts conmitments for wellsampling that Mr. Tavenner and Mr. Wright made at the April 6, 1987, publicmeeting in Church Rock, and apparently was made without consideration of therequests for sampling made by a dozen local Navajo elected officials in a May22, 1987, letter to your office. SRIC is compelled to support the positiontaken cy the officials, at leas4- un^il EPA provides a factual and legalrationale for its determination to sample only those wells that are locatedwithin 3 miles of UNC, and un4"!! SRIC has had an opportunity to review andGarment on that rationale.
As I stated to Mr. Tavenner yesterday, I have provided a copy of this letterand its attachments to Mr. Jim Anal la of the Bureau of Indian Affairs. I amalso supplying copies to Roger Davis, Michelle Moustakas, and S^eve Gary, EID'sSuperfund coordinator, and Harry Pettengj.ll/ NRC's licensing officer. Asalways, please feel free *o call or write if you have questions abou*- theenclosed informsion.
Sincerely,
Chris Shuey, CoordinatorPuerco River Education Project
Attachments.
(continued)
Mr, Larry weightMr. Alan TavennerMs. Unsula LennoxJune 17, 1987page 4
xc: S eve Gary, EIDRoger Davis, NDWRRay Morgan, PREPMichelle Mous^akas, EPA/IXHarry Pettengill, NRC
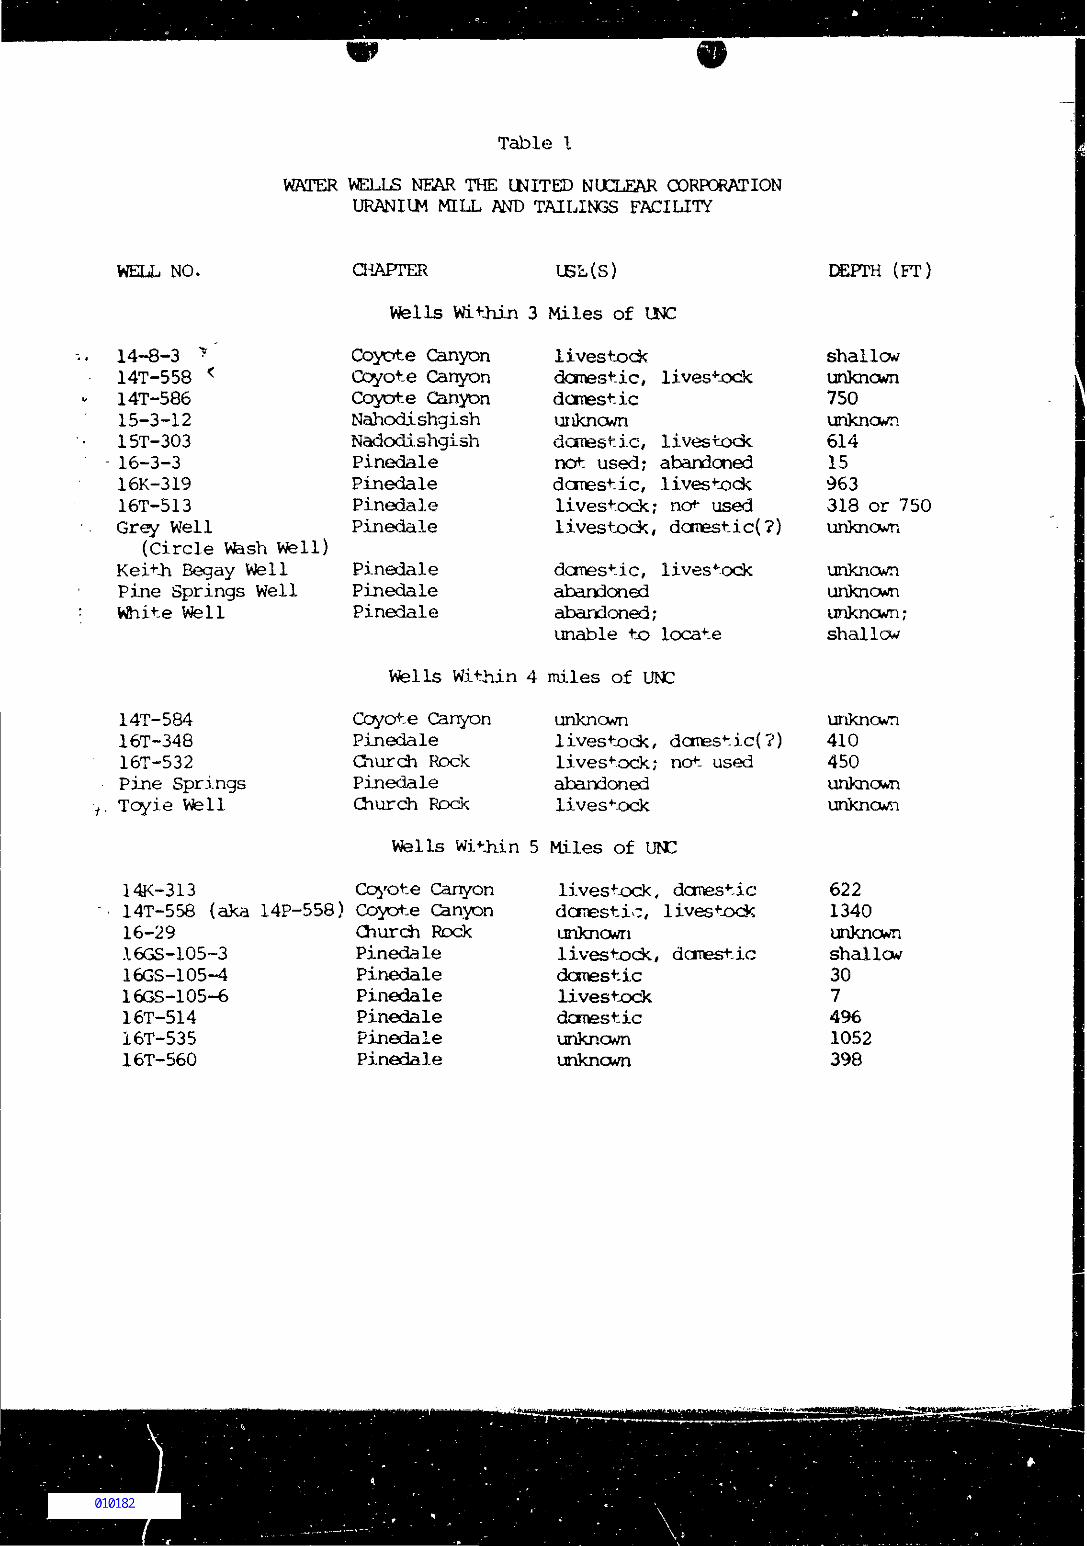
Table I
WOTER WELLS NFAR THE INITED NUCLEAR CORPORATIONURANIIM MILL AND TAILINGS FACILITY
WELL NO. CHAPTER USb(S) DEPTH (FT)
14-8-3 *14T-558 <14T-58615-3-1215T-30316-3-316K-31916T-513Grey Well
(Circle Wash Well)Keith Begay WellPine Springs WellWhite Well
14T-58416T-34816T-532Pine SpringsToyie Well
Wells Within 3 Miles of LNC
Coyote CanyonCoyote CanyonCoyote CanyonNahodishgishNadodishgishPinedalePinedalePinedalePinedale
PinedalePinedalePinedale
livestockdomestic, livestockdonest icunknowndomestic,not used;domestic,livestock;
livestockabandonedlivestockno*- used
livestock, danestic(?)
domestic, livestockabandonedabandoned;unable to locate
Wells Within 4 miles of UNC
Coyote CanyonPinedaleChurch RockPinedaleChurch Pock
unknownlivestock,livestockabandonedlivestock
dorestic(?)not used
Wells Within 5 Miles of
14K-313 Coyote Canyon14T-558 (aka 14P-558) Coyote Canyon16-29 Church Rock.16GS-105-3 Pinedale16GS-105-4 Pinedale16GS-105-6 Pinedale16T-514 Pinedale16T-535 Pinedale16T-560 Pinedale
livestock, domesticdcmestivr, livestockunknownlivestock, domesticdomesticlivestockdomesticunknownunknown
shallowunknown750unknown61415963313 or 750unknown
unknownunknownunknown;shallow
unknown410450unknownunknown
6221340unknownshallow3074961052398
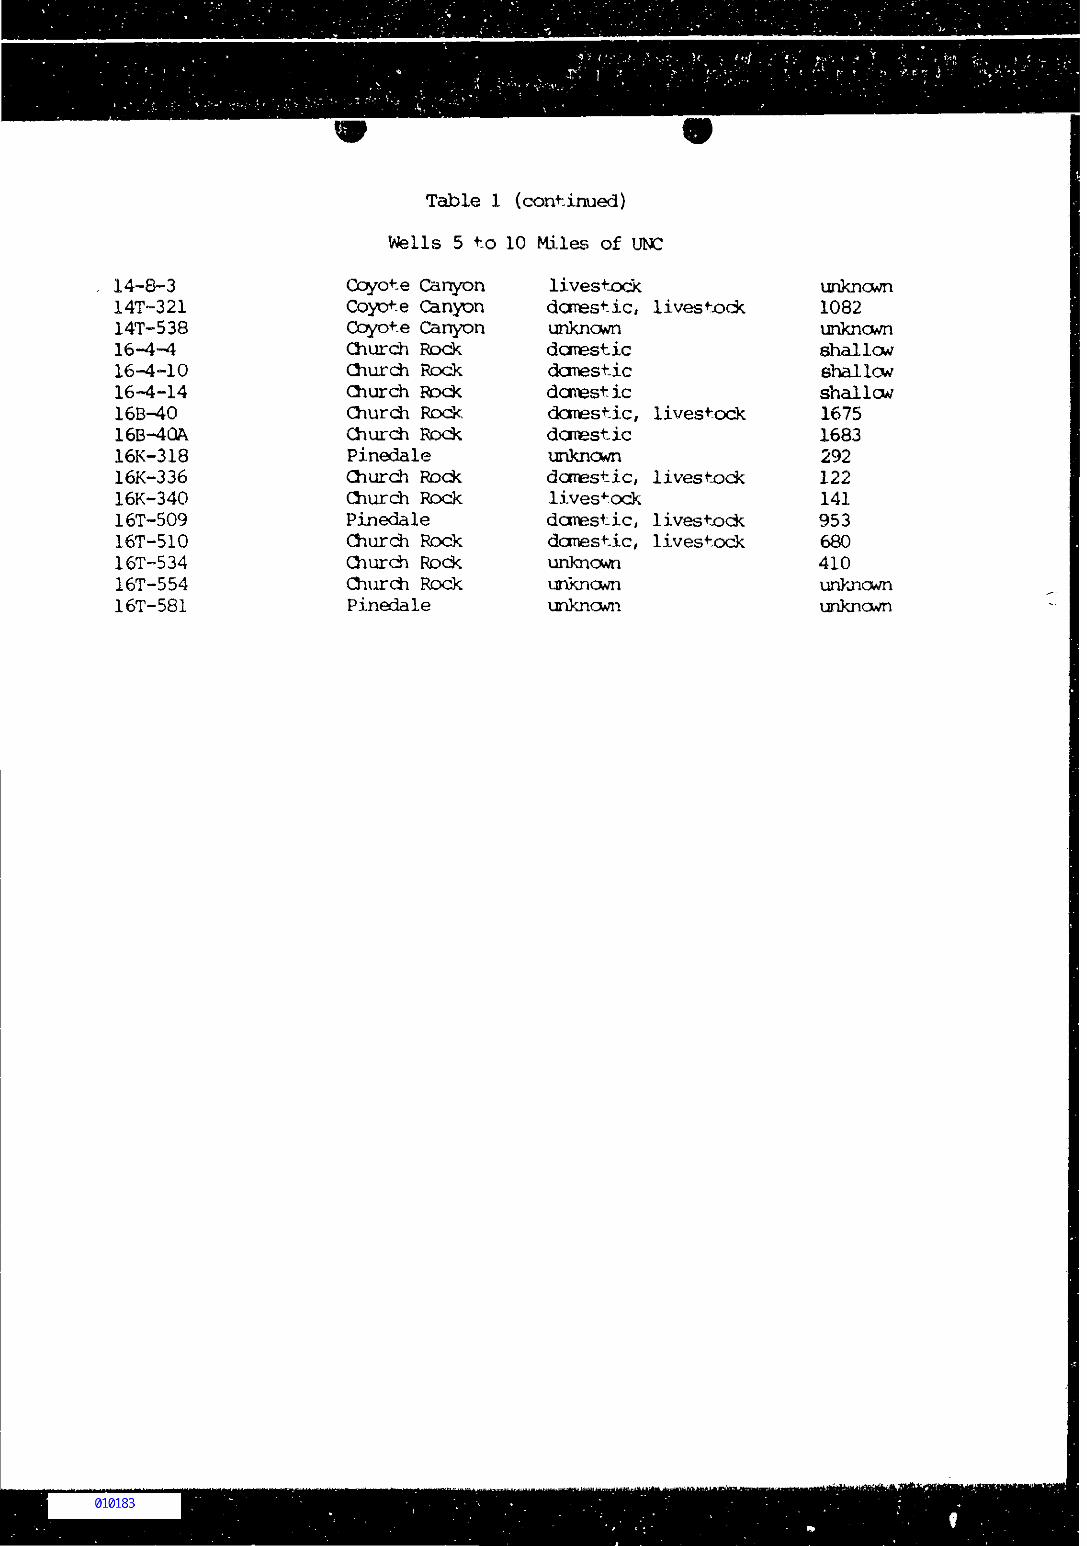
Table 1 (continued)
Wells 5 to 10 Miles of UNC
14-8-314T-32114T-53816-4-416-4-1016-4-1416B-4016B-4QA16K-31816K-33616K-34016T-50916T-51016T-53416T-55416T-581
Coyote CanyonCoyote CanyonCoyote CanyonChurch RockChurch RockChurch RockChurch Rock,Church RockPinedaleChurch Roc&Church RockPinedaleChurch RockChurch RockChurch RockPinedale
livestockdomestic,unknowndomesticdomesticdomesticdomestic,domesticunknowndomestic,livestockdomestic,domestic,unknownunknownunknown
livestock
livestock
livestock
livestocklivestock
unknown1082unknownshallowshallowshallow16751683292122141953680410unknownunknown
Table 2
LISTS OF WATER WELLS IN THECHURCH ROCK, PINEEftLE, COYOTE CANYON, AND NAHQDISHGISH CHAPTERS
NAVAJO NATION, McKINLEY COUNTY, NEW MEXICO
Rock
Const ruc*-ion/Hyilroloyical Da* aPrimaryWell I.D.
Tqyie Well
16-2-1816-2-1916-4-41 6-4-1 016-4-14
16-5-216-29»6-30
16-3616-3716-3816-61IfcB-^Om
16B-4QAm
16K-336m
16K-340m
l&r-500sn
l&r-50QAm
16T-510TO
i.tyr-517m16T-531m16T-532m
ltfr-534
16T-554ir.1 6T-60616T-60816T-6i2
Alternate Well NameSect ion/Quad . Locat j,on
16.16.21.1222or 16.16.14.3444Dixie WellArviso WellRoy SpringsPine TreeLivingst-one
Tullie Well
Greenhouse Well
Frank Collins WellChurch RockPyramid Rock SpringJames Well106-5. 35x1 4. 75(Public School)106-5.40x14.80
I06-appx7. 6x12.1appx. 16.17.33.4223
106-5.45x10.80appx. 16.17.25.1132("Sheep Dip Well")106-5.85x14.95
16.17.15.242106-6-95x9.00("Nose Rock Well")(at Rt. 566 and Rt . 66
16.16. 17. 4123106-2.98x8.74 {.5(located west of ifc/y.16.17.21.3422106-8.20x10,70
New UrdJiiui Mine
106-5.45x14. 50
^>px . Locat j on(miles)
3.3 SW/UNOM
3 SE/Sprintjs*-ead1.5 NE/Carstxi Cave150yd SE/TedSilversmith res.
w/in 5/LTOW2 S/140, E/Sundance Mine Rd.
1 /Louise Skeet res.1.5 N/Outlaw P.O.
9.5 SW/LWJW
8 E/Gallup
6 ENfc/Gailup4.5 SW/Spr ings* e-ad9.7 SW/UNOW2.2 SW/Springstaid7.2 SW/UNOM
betw. I4O i- SFRR7 E/Gallup200 N/RR SW/"Hianpson Market9 NE/Gallup8 WSW/UNOM
intersection)@Rehoboth4.2 SW/INCMM
S/Old Qiurch Rock Mine)
CcrpletionDate/Method
7/7-haix^xjrvV/'j'-lianv.^uiTp?/?-handpunp
?/?-"hai*ipunv
7/?-handpuTfp
7/33-drilled
12/59-drilled
10/53-drilled
5/54-drilled
6/58- drilled
8/60-drilled
0/64-drilled
T^J-al Screened Water Level GEM CasingDepth Interval ( f t . ) Diaru( f t . ) ( f t . ) Ddte ( in.)
1675 flowing- 7S 10.004/53
1683 flowing- 70 9.002/65
122 78-118 33.8-06/55 14.6 6.0
141 133-138 37-06/54 23 8.0(drill loy available)
215 33-06/58 lb.0
680 520-550 103-O8/60 26 6.0y;r>-VK> 209-00/83620-630
450 4.5 6.0
Water-bearing Use Qian-St rat unit a ) ijgt ry3
(Qal)Alluvium S
D NoD YesD Yea
D No
D NoD No
(Pg)Giorieta D,S Yes
(Pg)Glorieta D Yes
(Qal)Alluviun; D,S Yes(N, 1 . Puerco)
(Qal)Allxiviun S Yes(N. t"V- Puerco)
(Qal)Alluvium D No
(Kd)Dakota D,S Yes(Jm)MorriBon
unknown S
Ccranentsi
1HS 10/6/82
washed cutwashed out.
w/ hand punpwashed out.NLWR mano
washed cut
washed outfonner chap-ter hs. well?NF:windbnill
windmill;abandoned?
windmill;51:03/31/87;not operating
windmill
windmill;51:04/17/87;
566 off old Pinedale Road) no*- cperatirsgGray\ieter area
E/Rehobothw/in 5/UNL>M8 KNE/Gallup
0/65- ?
12/57-UrUled
410 !9O-^/;8 6.0194-U1/01
190S 1725-1965 f luwh^- 5 10.0
iJnwJl-test wa^er YestJinr) Recapture
YesYea
(PsaJSanAndreas l^ Yes
windmiil
T^iele 1966wimlmiliNl>flR meru
(Ghurtii Rk. Comi. School) County School106-8.50x15.40 5 E/Gallup
Mission No. 2)..30,3432 . 7 SW/UNLMM
0/57-drHled
U/49-diJ1 led
1673
bUrj
12/^7flcwiixj-?/? (Pg)Glorieta D Yes 16T-608?
b 6.O
Kev. 6/l7/87cls.
CR: Owriii Rock (continued)
Primary Alternate Well NameWell I.D. Section/Quad. Location
Const ruction/Hydrologicai DataLocation Completion Total Screened Water Level
(miles) Date/Method Depth Interval ( f t . )
N.M. Environmental Inprovsnent Division Wells:
Entrada-1Entxada-2Entroda-3
Gallup-1Gallup-2
lup-3lup—4lup-5
15.17.5,424215.17,5.424215.17.5.4242
(All15.17.8.334315.17.8.334415.17.8.334315.17.8.3J4315.17.8.3343
(All16.16.19.114216.16.19.1142
Spr ing s t-ead-]Springst^ad-2Springstead-3U 16.16.19.1342i,prir>gstead-3L 16.16.19.1142
(AllWindmill-1 16.17.25.1123Wiiidmill-2 16.17.25.1123Wireimil1-3U 16.17.25.1123Windknill-3L 16.17.25.1123
(All
0/81-drilled0/81-drilled0/81-drilled
10 SW/UNCMM)confl.O/78-drilledconfl.O/78-drilledconfl.O/78-drilledconfl.O/78-drilled
1 E/Hogback @ confl.O/80-drilledwells appx. 13 SW/UNCNM)1 W/Rt.566 Bridge 0/81-drilled1 W/Rt.566 Bridge 0/81-drilled1 W/Rt.566 Bridge 0/81-drilled1 W/Rt.566 Bridge
Springstread wells appx. 4£ 16K-340
4 NE/Gallup4 NE/Gallup4 NE/Gallup
Entraaa wells appx.1 E/Hogbacfc1 E/Hogback1 E/Hogbac*1 E/!iogbacK
0/81-drilled
@ 16K-340£ 16K-34Q$ 16K-340
V(indnu.ll wells appc
0/81-drilled0/til-drilled0/81-drilled0/81-drilled
7.2 SW/UNCT-M)
( f t . ) .)
405950
4040408050
25-3524-3930-40
30-4030-4030-4O70-8040-50
40 20-3038.5 19.5-29.532.S 17-2754 39^49
35 15-3548 28-3838 18-2864 49-54
*A11 mDnitoring wells are located along the North Fork of the Pueroo River.
Rev. 6/16/87cis
Casing Water-bearingDian. Stratum(a>
Use Cherv-i&iiy?
5.0 (Qal)Alluvivan* GWM Yes north banX5.0 (Qal)AlluviLin* GVW Yes north bank2.0 (Qal)Alluvion* GWM Yee north bark
5.0 (QaljAlluviun* GWM Yes north bank5.0 (Qal)Alluviurrt* GWM Yes north bank5.0 (Qal)AlluviLm* GWN Yes north bark5,0 (Qal)Alluviun* GtW Yea north bank5.0 (Qal)AlluvJum* GWM Yes north bank
2,0 (Qal)Alluvion* GWM Yes south bank5,0 (Qal)AlluvijTi* OJM Yes south bankb.O (Oal)Alluviijn* GWH Yes south bank2.0 (Qal)Alluvium* CWM Yes sou*h bank
5.0 (Oal)Alluvium* GWM Yes sau*h bank2.0 (ual)Alluvion* GWM Yes south bank5.0 (Qal)Alluviun* GWM Yes sou*h bank2.0 (Qal)AlluviLSrt* G>« Yes south bank
CHAPTERS Pinedale
Primary Alternate Well NameWell I.D. Section/Quad. Location
Const ructioiVlIydrological DataLocation Conpletion Total Screened Wa^er Level
(miles) Date/Method Depth Interval ( f t . )( f t . ) {f t . )
GfM Casing Water-bearing Use Chsn- GarmentsDian. Stratun(a) iatry?(in.)
Or«y Well lo.ib.14.1111("Circle Wash Well")
Keith Begay 16.16.13.2
Pine Springs 16,16.23.22White Well 16.16.16.24
16-3-3
2.5
2,2 SSE/UNLM-1
3 SSW/UNOW2.5 SW/UNCMM
0/58( ?)-
16.16.15.1211 2.5 S/Utt>W ?/?-handpunp appx.15(at confluence of Pipeline Arroyo and North Fork, Puerco River)
10GS-105-3 105-11.15x9.85 4.1 SB/UNO-M(.25 WNW/Pir»edale T.P.)
i-105-4 105-11.35x9.85(1 W/Pinedale T.P.)
16GS-105-6 105-11.10x9.65(1 NW/Pinedale T.P.)
16K-318m 105-appx. 13.1x13.1
4.1 SE/UNOW
4.1 SE/UNOW
6.4 S/INOW
l*>K-319m 105-12.95x7,1016.16.1.
16T-348m 16.15.17.1413105-11.60x9.00
16T-5uym 105-8.75x8.45(3 NE/Pinedale T.P)
16T-513 16.16,15.4322106-0.95x9.40
16T-5l4m 105-11.30x9.70(.5 NW/Pinedale C.H.)
16T-535m 16.16.25.142
:-538AmV560m 26.15.27.141
16T-581m
1.5 SE/UNLM44 NE/Pinedale3.5 SE/UNCM4(1 NW/Pinedale C.K.)6.1 ESE/UNCMM
2.9 S/UNOM(4 W/Pinedale T.P. )
4.5 SE/UOM
?/7-dug well
0/49-dug well
?/?-dug well
10/48-drilled
10/48-drilled
11/57-windmill
8/60-windmm
7/59-windmill
4.5
rtxirUled(?): 10/81 7508/59-windmill 496
0/65-windnull 1052
0/71-windmill 398
New Mexico Environmental Irrprovement Division Monitoring WelLs:
BLM ?is;rHLM-LLBLM-2Cccfluence-lUConfluence-lL
Confluence-3
16.16.12.331116.16.12.331116.16.12.331116.16.15.134216.16.15.134216.16.15.134216.16.15.1342
2.5 SE/UOM2.5 SE/LfNOW2.5 SE/UNOW2.5 S/UNCJW2.5 S/UNOW2.5 S/UW^fi2.5 S/UOW
0/81-drilled0/81-drilled0/81-drilled0/81-drilleJ0/81-drilled0/81-drilled0/81-drilled
255-245275-330405-415455-475628-896974-1033
63-08/59
140-0/65
137-0/83
5575 62-7049 29-3935 23.5-2b.563.5 43.5-53.546 26-3643 28-38
4.0
30
7
292
963
410 400-410
953 852-953
318
10.5-08/49
26,1-06/55
6.2-06/54
230-10/48
320-12/43
355-08/60
182-07/59213-10/76312-01/81
7.0
5.0
5.0
2-3 5.0
8 8.0
a 6.08.0
6.724 6.-10,
6.0
5.02.02.02.02.05.05.0
operating:<Qal)AUuviun
(Qal)Alluviun? D,S IKS 10/6/82;{not able to locate, 04/17/87)
(Gal) Alluvium abandoned;(Qal)Alluvion abandoned;
(could not locate, 04/17/87)abandoned;51:04/17/87
(Qal)Alluvian
(Qal)Alluvium
(Qal)Alluvium
(Qal) Alluvion
(Kd) Dakota(Jm)Morrison(Kd) Dakota(Kg)Gallup(?)
S
S,D
D
S
D,S
Yes
Yes
No
Yes
Yes
(Kd) Dakota,(Jm) htorriaon(JjiO Weetwater/Recapture
S,D ^(narked "D,S NO
S Yes
32' Qalr logavailable31:04/17/87
SI:04/17/B7;inopera*ive
(narked "Livestock Only")(Jirtf)Westwater, Recapture log available(Kd)Dakota D Yes chap, house
well?
9.0 (Je)Entrada
(Jt)Todilto
(Qai) Alluvion(Qal)Alluvaum(Qai)Alluviun(Oal)Alluviun(Qal)Alluvium(Qal)Alluviun(Oed) Alluvium
YesYes
GWM YesGWM YesGWM YesO l YesGWM Yea
north
northsouthsouthsouthsouth
bankbankbankbarkbankbankbank
Rev. 6/17/87cls.
(J1APTEKS: Cuyu^e Canyon Naiiogi ahy J sh
Prirsary Alternate Well NameWell I.D. Section/Quad. Location
Locat icn(miles)
Ooiistruci-iorVliy^ological DataCcrpletion Total Screened Vfater LevelDate/Method Dep^h Int-erval ( f t . )
(ft.) (f t . ) Da+e
GfW Casing water-bearingDiam. Stratum(a)(in.)
Use Chem- Comnent-sistry7
CHAPTER*
14-8-3
14K-313
14T-321in14T-538m14T-558
Coyote Canyon
("Willie Yazzde Well")
106-3.85x5.70
106-8.50x6.25
106-2.60x3.1517.16.16.34
106-appx. 1.0x6.017.16.34.("Kerr MoGee Carp")
CHAPTER: Nahodishgiflh
15-3-12 ("Tah-Ba-Skoxinie Spg.")!5T-303m 17.15.29.123
105-12,70x5.25
4.2 W/UtOM
9 W/UNCMM6 NW/HOW5 NW/UO*i
4 N/UNCM11 NW/l*O«
.3 NE/15T-3032.5 NE/UNO*1
5/53-drilled 622 56O-622 235-05/53
10/58-drUled 1082 580-1062 434-10/58
485-O6/779/73-driileJ 1340(log avaiabie)
3/76-drilled 750 380-00/76
spr ing{?)1/52-drilled 614 303-1/52
2-3
65
8.0
8.0
100 5,010
9,8
,*) S
(Kdc)DalU>n(?) D,S Yea
(Kg)Gallup(?) D.S No
D,S(Kg) Gal lup(Kca)Dalton
2-3 7,0 (Kg)Gallup
D
Urk,D»S Yes
1HS 10/6/82;
lliS 10/6/82;aXa 14P-558
IHS 10/6/82;log available
IBS 10/6/82wintJmillfEWE1D aipl'd
Rev. 6/17/87cls.
\ !8T-.*7V^-—^ I8K-55
St M.cft ae
JftF$5$* 'tvi?^""
appx. A miles
figure /
PDR WATER WELL INFORMATIONPIEROO RIVER VALLEY, NBtf MEXIOD AND ARIZONA
Agenbraad, L. D. Hydrogeology of the Spurlock Ranch, ^>ache County, Arizona.Prepared for the Navajo-Hopi Indian Relocation Goranission (Flagstaff), August1985,
Agenbroad, L. D. Hydrogeology of the Wallace Ranch, ^pache County, Arizona.Prepared for CH2-1-Hill Consultants (Portland). May 1985,
Qiurch Rock Chapter, Navajo Nation. Memorandum to C. Shuey regardingidentifications and locations of vyater wells in the Church fock Chapter,McKinley County, New Mexico. Spril 9, 1986.
Ccoley, M. E., Akers, J. P, t and Stevens, P. R. Gechyirologic Data in theNavajo and Hqpi Indian Reservations, Arizona, New Mexico, and Utah — Part III,Selected Lithologic Logs, Drillers Logs, and Stratigraphic Sections. ArizonaState Lard Department and U.S. Geological Survey (Tucson), Water ResourcesReport Nunt^er Twelve-C. October 1964.
Cocper, J. B., and John, E. C. Geology and Ground-Vfeter Occurrence inSoutheastern McKinley County, New Mexico. New Mexico State Engineer Office(Santa Fe), Technical Report 35. 1968.
Davis, G. E. , Hardt, W. F. , Thomson, L. K. , and Ccoley, M. E. GechydrologicData in the Navajo and Hcpi Indian Reservations, Arizona, New Mexico, and Utah— Part I, Records of Ground-Vfater Supplies. Arizona State Land Department ardU.S. Geological Survey (Tucson), Vfeter Resources Report Nuriber Twelve-A.
Frenzel, P. T. , Craigg, S. D. , and Padgett, E, T, Preliminary Data Report forthe San Juan Basiii-Crownpoint Surveillance Stud/. U.S. Geological Survey andU.S. Bureau of Indian Affairs (Albuquerque), C£en-File Report 81-484. torch1981.
Gallaher, B. M. , and Gary, S. J. Irrpacts of Urariiun Mining on Surface andShallow Ground Welters, Grants Mineral Belt, New Mexico. New MexicoErrvirconental Inprovanent Division (Santa Fe) , EID/QWH-86/2. September 1986.
Hackrran, R. J*, and Olson, A. B. Geology, Structure, and Uranium Deposits ofthe Gallup 1° x 2° Quadrangle, New Mexico and Arizona. U.S. GeologicalSurvey (Denver), Miscellaneous Invest igaticrus Series, tep 1-981, 1977.
Hiss i W. L. Evaluation and Prcpoeed Study of Potential Ground-Vfeter Supplies,Gallup Area, New Mexico. U*S. Geological Survey (Alfcuquenque), Open-File Report75-522. 1975.
Kister, L. R. , and Hatchett, J. L. Gechydrologic Data in the Navajo and HqpiIndian Reservations, Arizona, New Mexico, and Utah — Part II, SelectedChemical Analyses of the Ground Wkter. Arizona State Land Department and U.S.Geological Survey (Tucaon), Water Resources Report T^jelve-B. 1963*
Link, R- L. , and Kelly, T. E. Aquifers Associated with Strippable Cbal, SanJuan Basin, New Mexico. Prepared for New Mexico Energy and Minerals Department,Mining and Minerals Division (Santa Fe) , fcy Gechydrology Associates
(Albuquerque). 1980.
Manuelito Chapter, Navajo Nation. Memorandum to C. Shuey regardingidentifications and locations of water vrells in the Manuelito Chapter, McKinieyCounty, New Maxico. pril 28, 1986.
McGavodc, E. H, , Ednvmds, R. J. , Gillespie, E. L. , and Halpenny, P. C.Geohydrologic Data in the Navajo and Hcpi Indian Reservations, Ariaona, NewMexico, and Utah — Part I-A, Supplemental Records of Ground-Water Supplies.Arizona State Land Department and U.S. Geological Survey (Ilicson), WaterResources Report fcfcmber TWelve-E. November 1966.
Mercer, J. W.( and Qxper, J. B. Availability of Ground Water in the Gallup-Tchatdii Area, McKiniey County, New Maxico, U.S. Geological Survey, WaterResources Division (Albuquerque), Cpen-Flle Report- 1970.
Mdhler, Wayne (Indian Health Service). Letter to Steve Rcmanow (U,S.Environmental Protection Agency)* October 6, 1982,
Navajo Nation, tep of water wells on the Navajo and Hcpi Iteservations. Divisionof Water Resources (Ft. Defiance). Ubdated (circa 1975).
Raymondi, R. R. , and Oonrad, R. C. Hydrogeology of Pipeline Canyon, NearGallup, New Mexico. Grouitf Water, 21:2, ^tarch-J^^ril 1983.
Shomaker, J. W. Water Resources of Fbrt Wingate Array Depot and Adjacent Areas.U.S. Geological Survey, Vfater Resources Division (Albuquerque), C£en-FileRepor4:.. September 1971.
Shuey, C. Vbter Quality Data for Ground Vfeter Monitoring Vtells in aixi aroundthe Ln>C Mining and Milling Uranium Mill Tailings Inpoundment. Unpublishedccrrpilation of water quality data. Southwest Research an3 Information Center(Albuquerque). September 1986.
Shuey, C. , Morgan, R. , RDbinson, W. P., ar*l Hancodc, D. Report to the PublicWelfare Foundatiicn en the Activities of the Puerco River Edi*^ation Project(July 1985-October 1986). Southwest Research an3 Information Center(Mbuguertjue). October 31, 1986.
Shuey, C., arid Robinson, W. P. Characterization of Ground Vfater Quality Ntear aUranium Mill Tailings Facility, cind Ccnpariaon to Background Levels and NewMexico Standards. In; Selected papers on water quality and pollution in NewMexico. New Mexico Bureau of Mines and Mineral Jtesouroes (Socorro), HydrologicReport 7. J^ril 1984.
Stone, W. J., lyford, F. P., FVenzel, P, F., Mizell, N. H. , and Padgett, E. T,Hydrogeology and Vfeter Reaources of San Jioan Basin, New Mexico. New MexicoBureau of Mines and Mineral Resources (Socorro), Hydrologic Report 6. 1983.
Tariq, N, H. Vtella within radius of five (5) miles frcra (luted NuclearCorporation. Manorandun to G. C. George (Navajo *feter G*ronissicn) . NavajoNation, Division of Vfeter Resources (Ft. Defiance). January 1983.
Thiele, H. J. Navajo Vfeter Resources, Supplies and tenagement and the ProposedNavajo Tribal Vfater Authority. Prepared for Navajo Nation, Office of theChairman (Window Rock). July 15, 1966-
U.S. Geological Survey. Qanputer printout of gecfcydroiogic artf water qualitydata for water wells in the Puerco River Valley of teKinley County, New Mexico,Water Resources Division (Albuquerque). June 30, 1986.
Webb, R. H, i Rink, G* L. B,, Favor, B. 0. Distribution of Radionuclide andTrace-Elements in Ground Vfeter, Grasses, arxi Surficial Sediirvents AssociatedWith the Alluvial Aquifer Along the Puerco River, Northeastern Arizona — AReconnaissance Sartpling Program. U.S. Geological Survey, V&ter ttesourcesDivision (Tucaon), Cpen-File Report 87-206. March 1987.
A T T A C H M E N T A
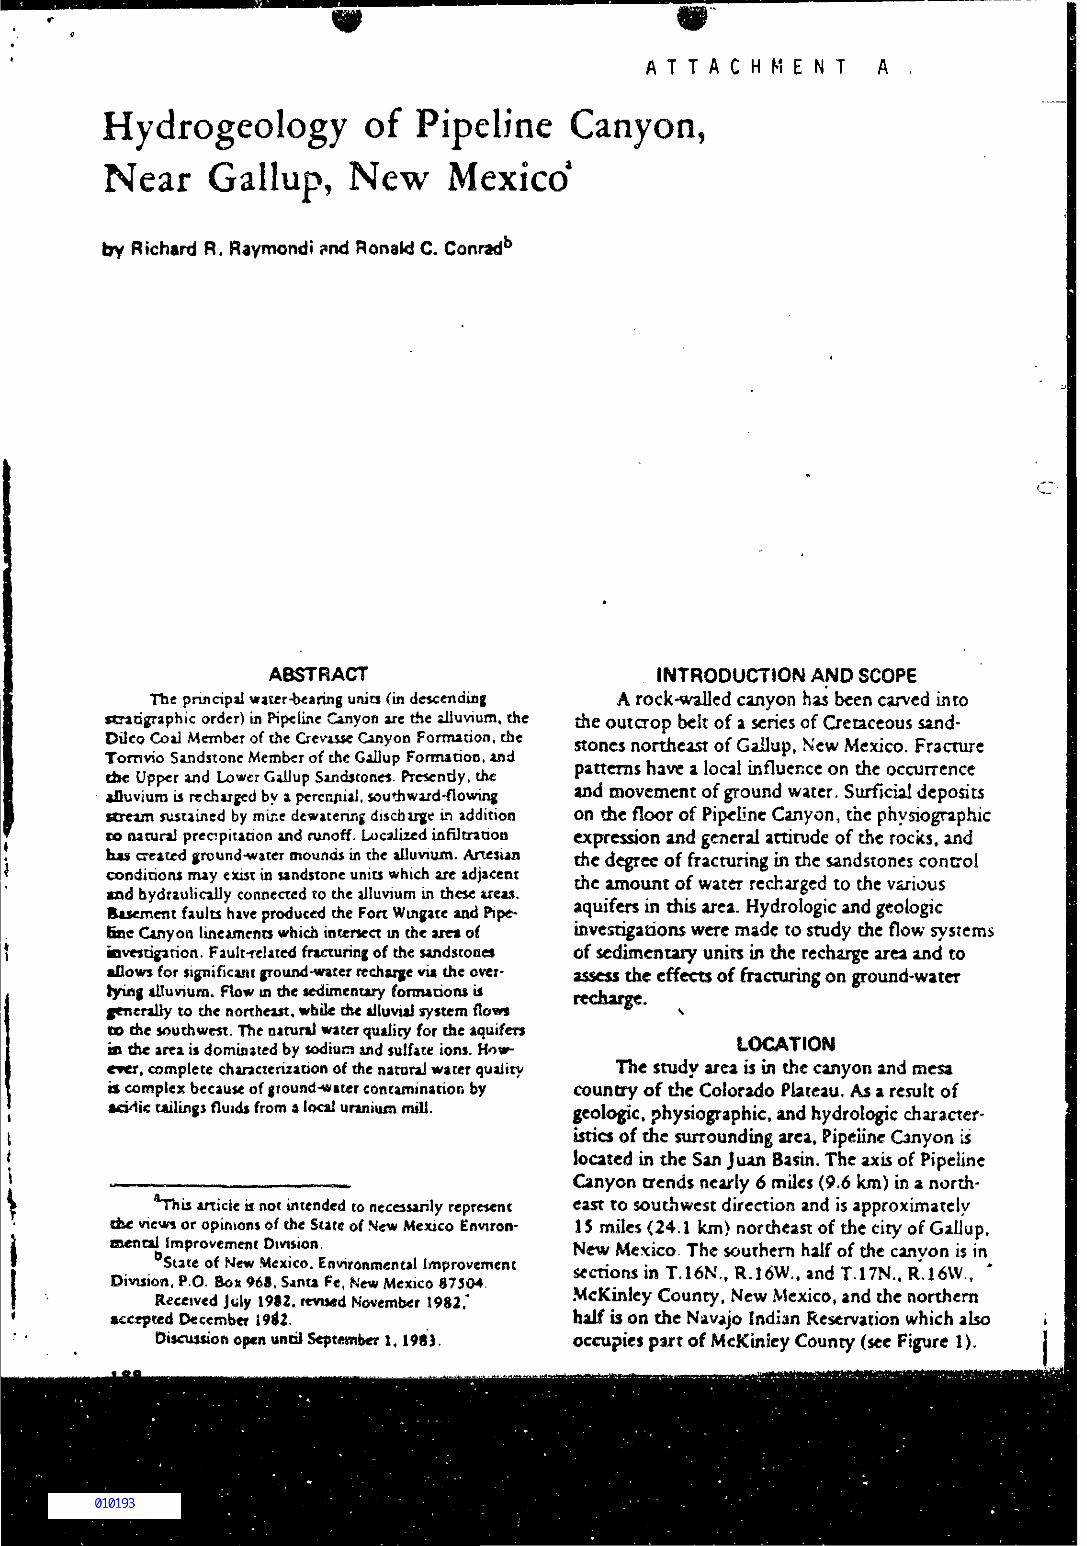
Hydrogeology of Pipeline Canyon,Near Gallup, New Mexico1
by Richard R. Raymondi ?nd Ronald C. Conradb
ABSTRACTThe pruicipil water-bearing units (in descending
ttratigraphic order) in Pipeline Canyon are the alluvium, theDilco Coal Member of the Crevuse Cmyon Formation, theTomvio Sandstone Member of the Gallup Formation, andthe Upper and Lower GiiJup Sandstone*. Presently, th€ifluvjum i* recharged by a perennial, sou toward-flowingstream 5ustatned by mir.e dewatenng discfau^ge in additionto natural precipitation and runoff. Localized infiltrationhas created ground-water mounds in the alluvium. Artesianconditions may exist in sandstone units which are adjacentand hydraulicaily connected to the alluvium in these area*.Btsemem faults have produced the Fort Win gate and Pipe-fine Canyon lineaments which intersect in the am ofinvestigation. Fault-related fracturing of the sandstonesallows for significant ground-water recharge via the over-tying alluvium. Flow in the sedimentary fonnaeioru i*generally to the northeast, while the alluvial system flowsco the southwest. The natural water quality for the aquifersit) the area is dominated by sodiuno and sulfate ions. How-ever, complete characterization of the natural water qualityis complex because of ground-water contamination by
tfic tailings fluids from a local uranium mill.
HThis article ix not intended to necessanly representview* or opinions of the Stare of New Mexico Environ-
mental Improvement Division.State of New Mexico. Environmental Improvement
Division, P.O. Boa 968. Santa Fe, New Mexico 87504Received July 19*2. revised November 1982/
acctpted December 1942.Discussion open until September 1,198).
INTRODUCTION AND SCOPEA rock-walled canyon has been carved into
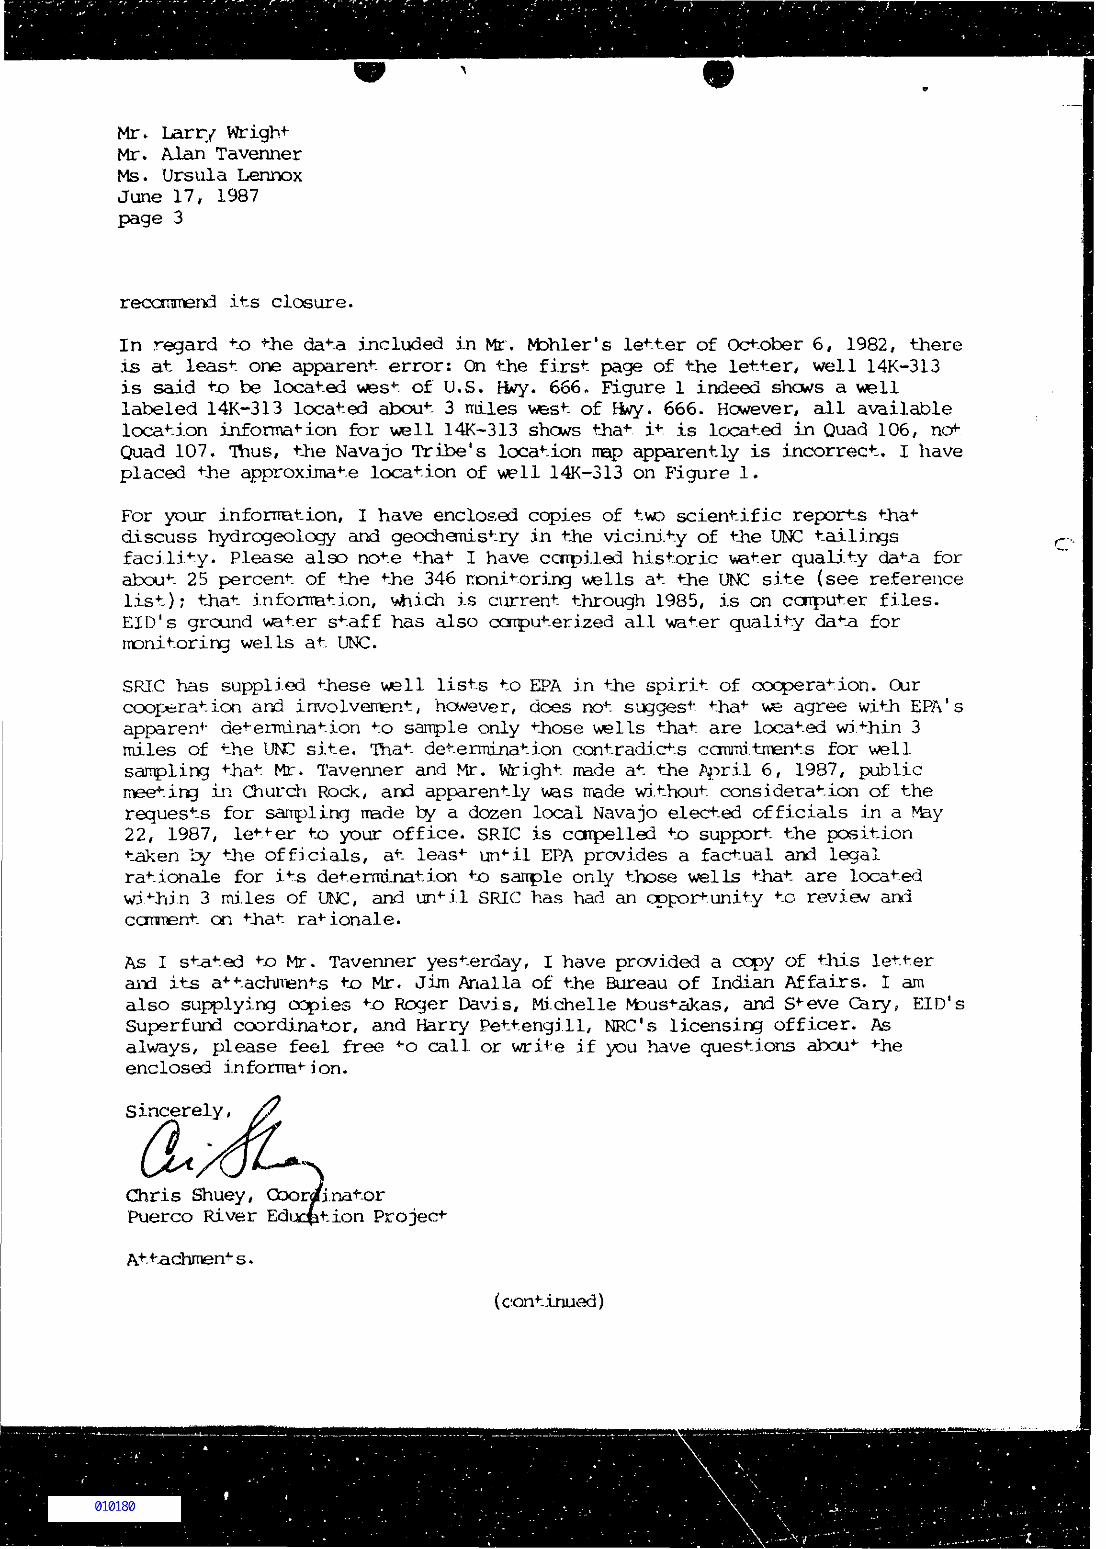
the outcrop belt of a scries of Cretaceous sand-stones northeast of Gailup, N'ew Mexico. Fracturepatterns have a local influence on the occurrenceand movement of ground water. Surficial depositson the floor of Pipeline Canyon, the physiographicexpression and general attitude of the rocks, andthe degree of fracturing in the sandstones controlthe amount of water recharged to the variousaquifers in this area. Hydrologic and geologicinvestigations were made to study the flow systemsof sedimentary units in the recharge area and toassess the effects of fracturing on ground-waterrecharge.
LOCATIONThe study area is in the canyon and mesa
country of the Colorado Plateau. As a result ofgeologic, physiographic, and hydrologic character-istics of the surrounding area. Pipeline Qnyon islocated in the San Jiun Basin. The axis of PipelineCanyon trends nearly 6 miles (9.6 km) in a north-east to southwest direction and is approximately15 miles (24.1 km) northeast of the city of Gallup,New Mexico. The southern half of the canyon is insections in T.16N., R.I6W.. and T.17N., R.16W., *McKinley County, New Mexico, and the northernhalf is on the Navajo Indian Reservation which alsooccupies part of McKinicy County (see Figure 1),
CLIMATEPipeline Canyon and the surrounding mesas
and ridges are characterized by semiarid climaticconditions. Daytime temperatures generally reacha high between 80° and 90*F (26,6* and 32.2°C)in the summer and are between 40* and 50° F (4.4*and 10*O in the winter. The mean annual temper-ature is approximately 48.5*F (9.2*C), accordingto the United States Weather Bureau at Gallup,New Mexico.
In the area of investigation, the annual pre-cipitation generally occurs during two seasons.
Summer rainfall is mostly between July andAugust, and winter precipitation occurs betweenDecember and Februaiy (Hiatt, 1953). Localconvectional thunderstorms provide most of thesummer precipitation, whereas winter precipitationresults Trom frontal activity and is generallydistributed over a large area. The mean annualprecipitation at GaOup is 10*65 inches (0.27 m)(U.S. Weather Bureau, 1938-60). Limited datafrom a mechanical weather station installed at theUnited Nuclear milling facility in Pipeline Canyonshow that annual precipitation may exceed that atGallup by as much as 4 inches (0.1 m).
PHYSICAL SETTINGThe landforms in the area surrounding Pipe-
line Canyon are a result of ero'sional processesacting upon alternating weak and resistant sedi-mentary units. Resistant beds have formed ledges,cliffs, mesast and rock benches that arc separatedby slopes and valleys carved in weak shaly beds(Cooley and others. 1969). The Point LookoutSandstone, the Upper Dalton Sandstone, theLower Dalton Sandstone, sandstone lenses in theDilco Coal Member, the Upper Gallup Sandstone,and the Lower Gailup Sandstone are the cliff orridge formers in Pipeline Canyon. The slopes andcanyon floor are primarily carved in the GibsonCoal Member, the Upper Mulatto Tongue of theMancos Shale, the Lower Mulatto Tongue of theMancos Shale, coal and shale lenses of the DilcoCoal Member, the Upper D-Cross Tongue of theMancos Shale, and the Lower D-Cross Tongue ofthe Mancos Shale. The lower part of PipelineCanyon is flanked by Ram Mesa to the east, andMesa de Los Lobos bounds the canyon to thenorth. Elevations are between 6,840 and 7,100ft on the canyon floor and rise to over 7,400 ft onthe surrounding mesas.
SEDIMENTARY ROCKSSedimentary rocks in the study area are pan
of the Upper Cretaceous Mesa Verde Group de-posited near the margin of a widespread epeiro-genic sea under conditions of constantly changingshorelines (Beaumont, 1971). Based on lithologyand sedimentary features, the sedimentarysequence in the area can be characterized by threemajor environmental fades: offshore marinedeposits; coastal barrier sandstones; and nonmarinedeposits (Gibbons, 1980). A summary of thelithology and depositional environment of thesedimentary units in Pipeline Canyon is presentedin Table 1. Other sedimentary units occur at depth
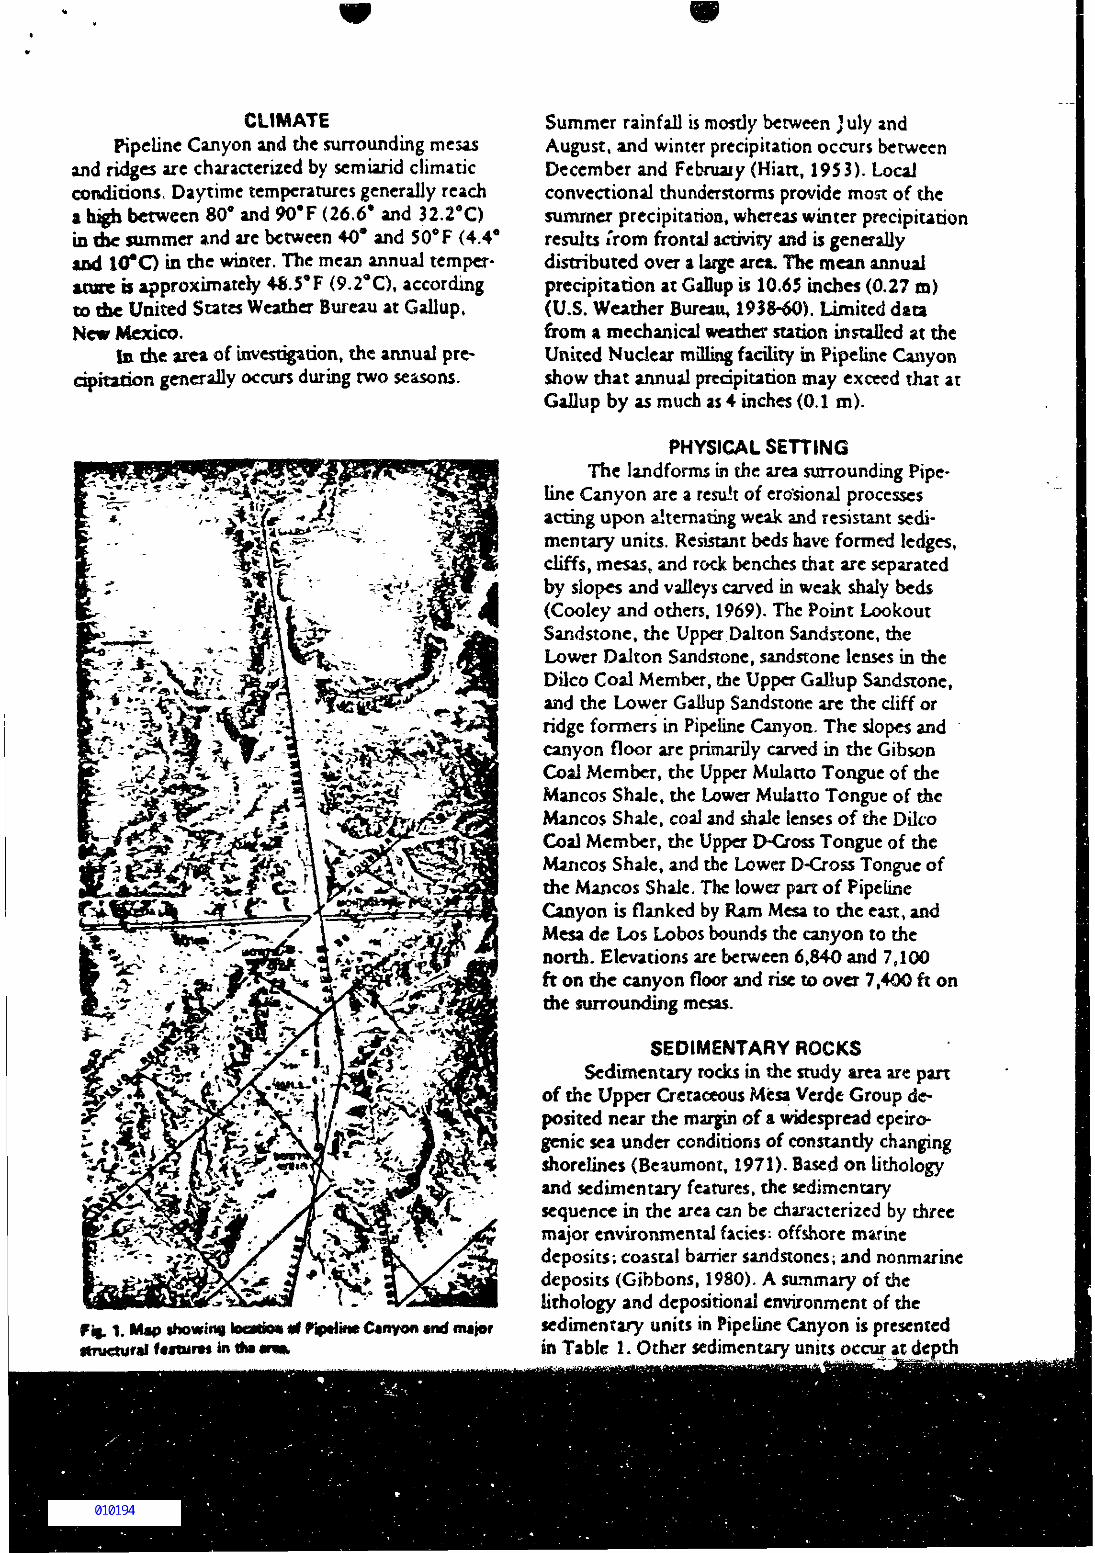
Fig. 1. Mop showing location ** Uptime Canyon end majorstructural I«*tur*« in th» en*
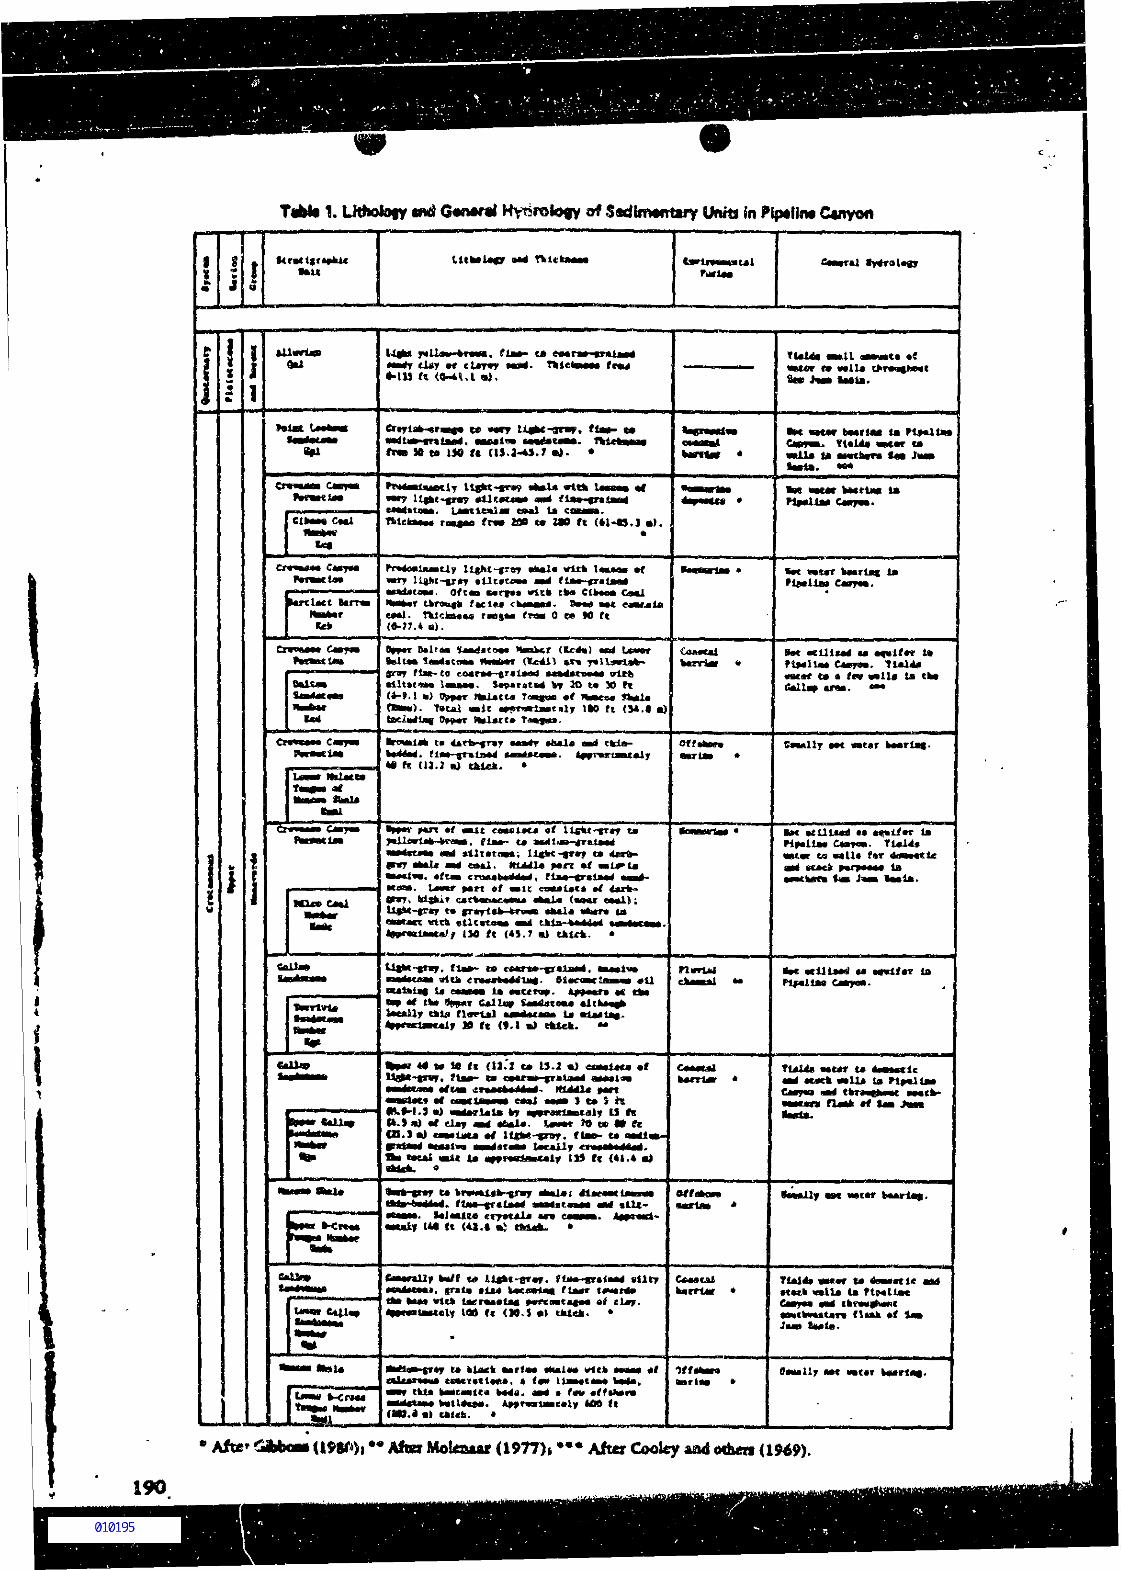
Tubte 1. Uthotogy **d G«n*r«< Hydrology of SsdinMntvy IMtt in Pippin* C«nyon
MU
Ujfc* ytlUx >T»M.M^T tl T *r cl*r*r•-I13 fc (0-41.1 a).
uf»
fit*
toixt t*
SO ta 130 f t (M.a-0.7 •). * wlU U
tmu
««• J«M
*•«••«*••ll«fct-«r«? m«U with
. L«Btiettl«v CM! i* COMVB.trm t» t* ZW ft <*!-», 3 •)
«**
*•!«•£ tO»rv*« *1E* Ctea Clb«e« Gaol
•••*. D**« ••ro* 0 c* M ft
fiftJXM
Kerf
2O M 30 ftf ftaKM «
frM). TvtAl «BiC «»«)T4riaHieal7 1*0 ft (54.1 •}
tot wlllcW u M>if«r t»MTM. TUX4*
e» * fcv mile u eh*
eteta- Offtten
4« f« (11.; Bj titci. •
afTWilt
c*
to
BM KtiltMri u ft««iJ*r IB. Tt*14s
ir to «•!!• t«ria
*«rt of «
e»
ISO ft (i).
. ITtU ««ura».
M MT«if«r la
20 ft (f.l
44 M Ifl ft (U.I e* 13.2 *) e«Mi«u ml
•fUB gTMtlHJrt- Mi*41* »*rt
?UU» wur t*Mrf cuck wwll* la
tell*IH.9-1.9 •) wterUU H *9**xlMtal9 U fsC*. 5 n) 9f «UT Mrf •&•!«- WM« JO C* •• ffeCfl.J k) <OT«tM« •/ lUW-tn>T. flao- t*
•wrfArvM teuXlyi«i< t* ^»na*M«ly 115 ft (41.4 mi
ekte*. «
t* MCMT
MMM. M«MU Cf7*tAi« W«Muir iM ft (u.t •) r»K*. »
ll«kt-er«f.fta«* MKfe
t*ta
fi (M.) *f !«•
MnU t* kldck taria* Mwl4N» wit* MM* «f(•limn*** tcMr«ct«««, * <*w ti«MC«B« tote,
.d •» MO ft
* Afe" ibfcooi UW)i ** <1977)» *"* After Cooky
MOCKS
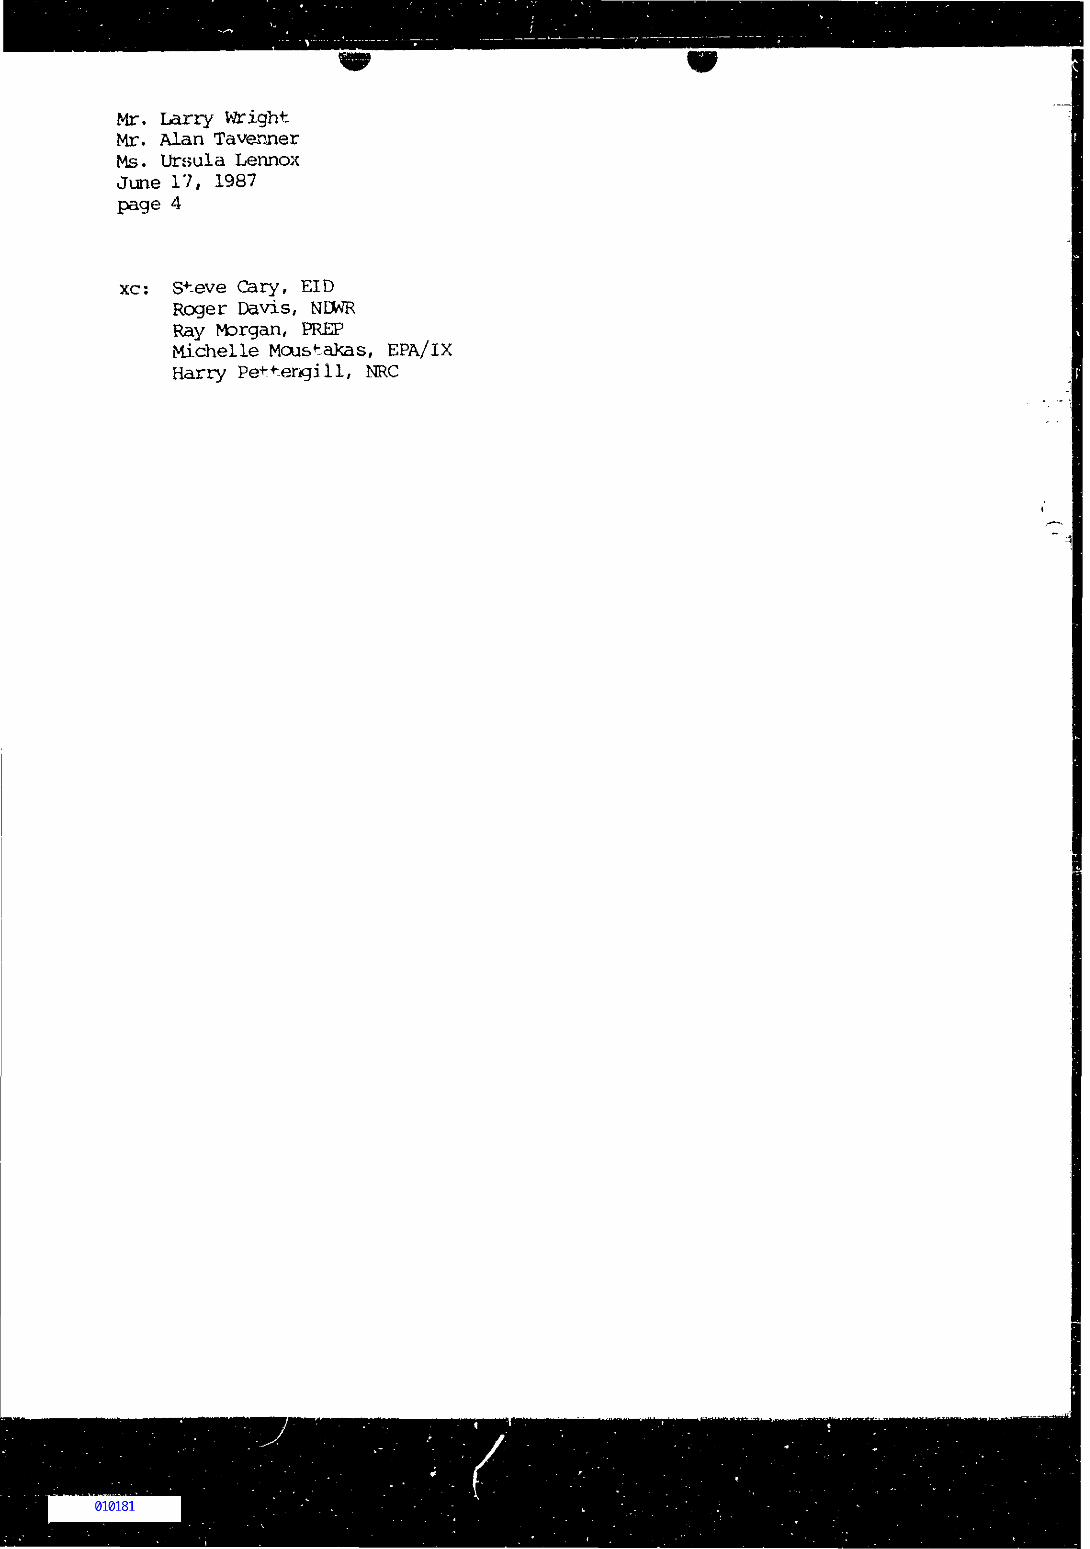
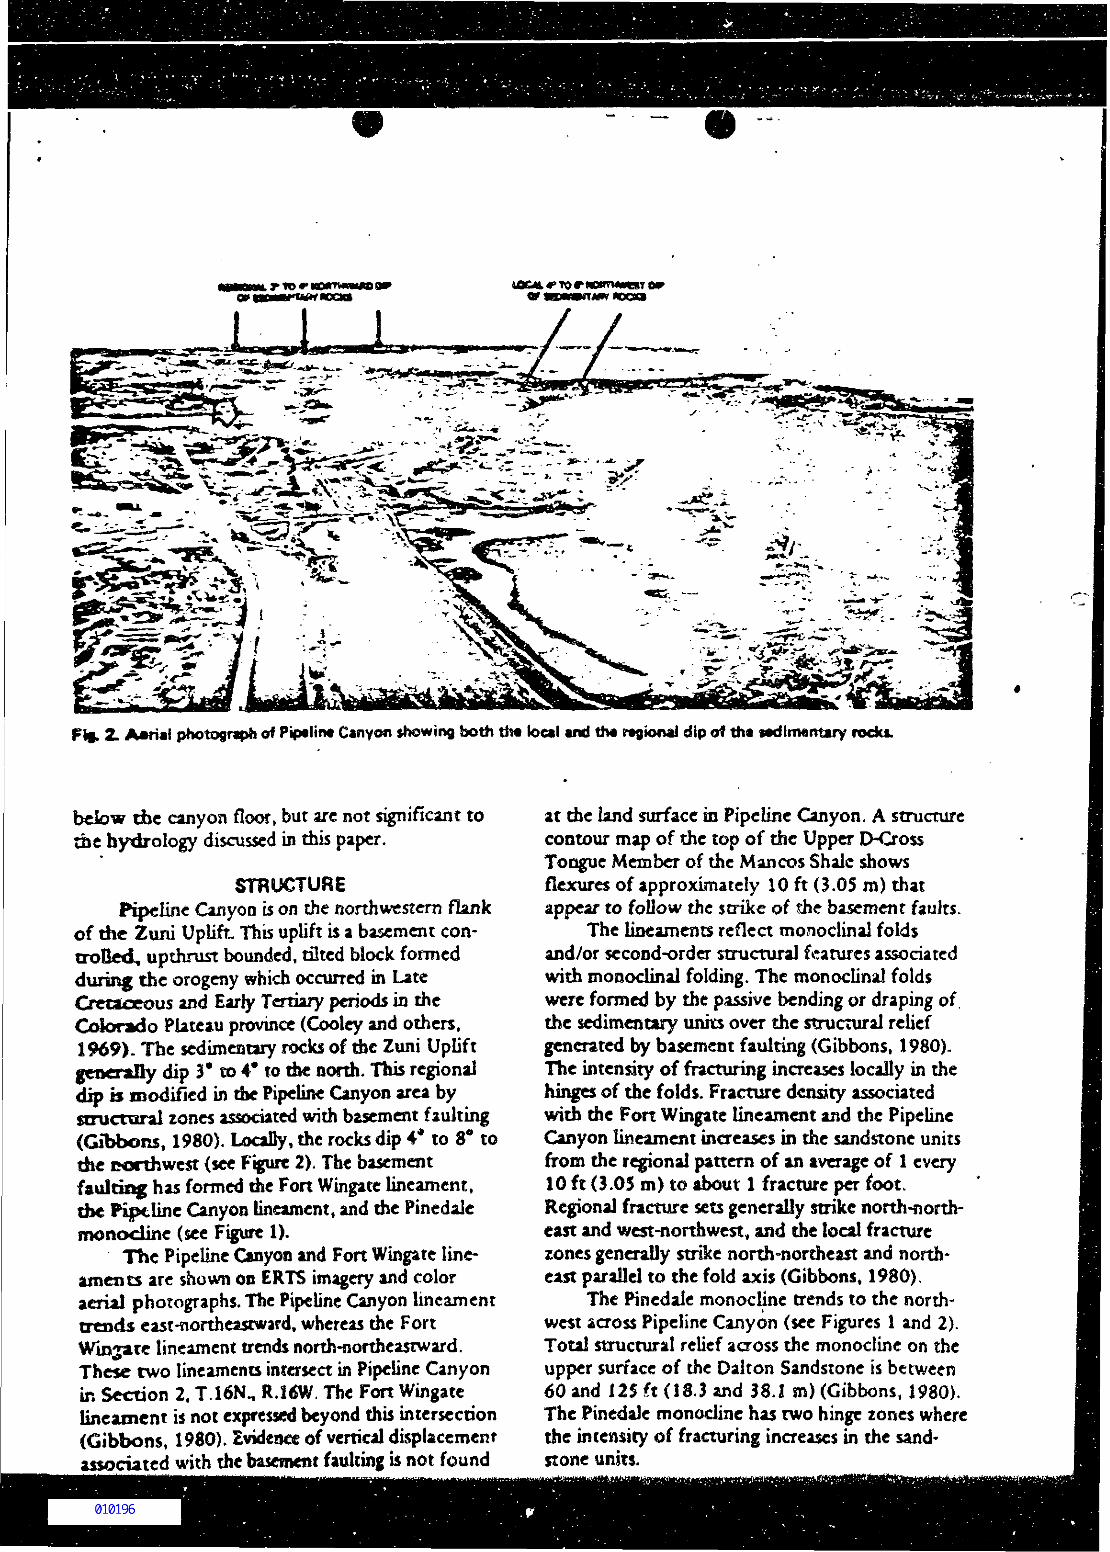
2. Aftrial photograph of PiptlifW Canyon showing both tfo« local and the regional dip of tftt sedimentary rock*.
below the canyon floor, but arc not significant tothe hydrology discussed in this paper.
STRUCTUREPipeline Canyon is on the northwestern flank
of the Zuiii Uplift. This uplift i$ a basement con-troQed, upthrust bounded, tilted block formedduring the orogeny which occurred in LateCretaceous and Early Tertiary periods in theColorado Plateau province (Cooley and others,1969). The sedimentary rocks of die Zuni Upliftgenerally dip 3* co 4* to the north. Tnis regionaldip is modified in Ac Pipeline Canyon area bystructural zones associated with basement faulting(Gibbons, 1980). Locally, the rocks dip 4* to 8° tothe northwest (see Figure 2), The basementfaulting has formed the Fort Wingate lineament,tbe Kptlinc Canyon lineament, and the Pinedalemonocline (see Figure 1).
The Pipeline Canyon and Fort Wingate line-aments are shown on ERTS imagery and coloraerial photographs. The Pipeline Canyon lineamenttrends east-northeastward, whereas the FortWinjate lineament trends north-northeastward.These rwo lineaments intersect in Pipeline Canyonin Section 2. T.16N., R.ltiW. The Fort Wingatelineament is not expressed beyond this intersection(Gibbons, 1980), Evidence of vertical displacementassociated with the basement faulting is not found
at the land surface in Pipeline Canyon. A structurecontour map of the top of the Upper D-CrossTongue Member of the Mancos Shale showsflexures of approximately 10 ft (3.05 m) thatappear to follow the strike of she basement faults.
The lineaments reflect monoclinal foldsand/or second-order structural features associatedwith monodinal folding. The monoclinal foldswere formed by the passive bending or draping ofthe sedimentary units over the structural reliefgenerated by basement faulting (Gibbons, 1980).The intensity of fracturing increases locally in thehinges of the folds. Fracture density associatedwith the Fort Wingate lineament and the PipelineCanyon lineament increases in the sandstone unitsfrom the regional pattern of an average of 1 every10 ft (3.05 m) to about 1 fracture per foot.Regional fracture sets generally strike north-north-east and west-northwest, and the local fracturezones generally strike north-northeast and north-east parallel to the fold axis (Gibbons, 1980),
The Pinedale monocline trends to the north-west across Pipeline Canyon (see Figures 1 and 2).Total structural relief across the monocline on theupper surface of the Dalton Sandstone is between60 and 125 ft (18.3 and 38.1 m) (Gibbons, 1980).The Pinedale monocline has two hinge zones wherethe intensity of fracturing increases in the sand*stone units.
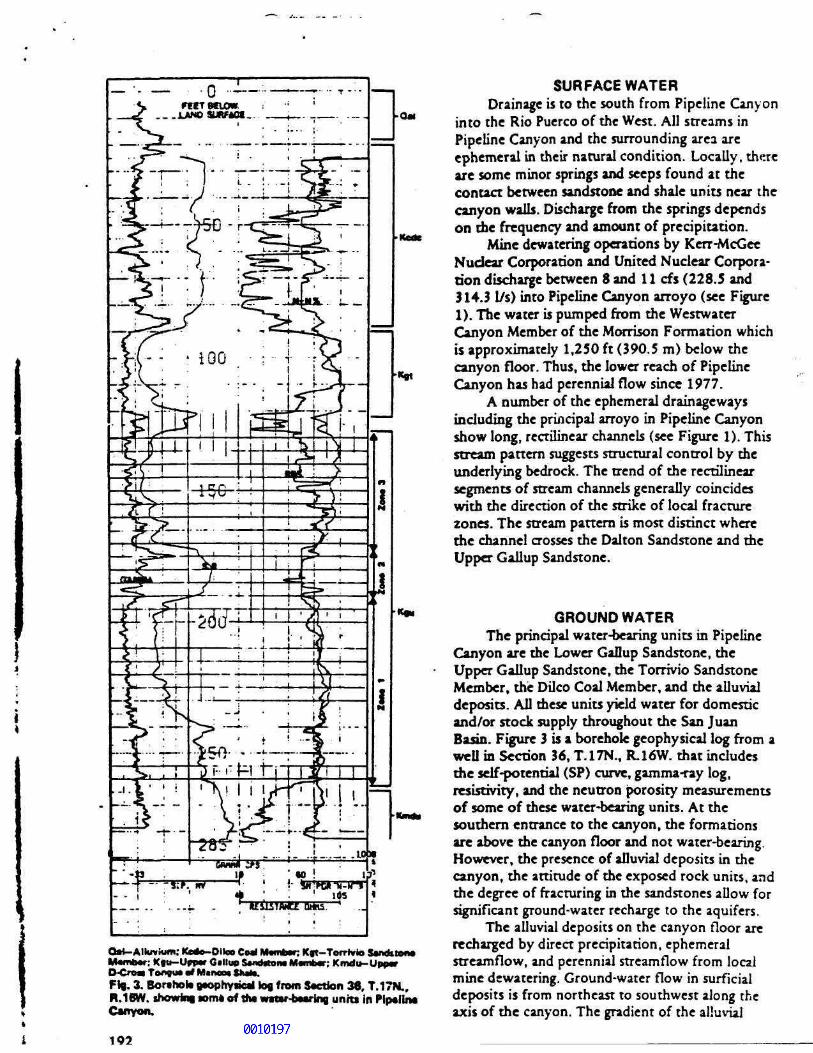
Otrf-AHuvkim: Kcde-DIIco Cod Mwntor; Kgt-Torrivie SwMfelWMM«mb«f; Kfu-Uppw Gallup SwidtteiM M«mb«r; Kmdo-UpfMrDO«« Toogu* of Manax Ska**.F«9.3. Borthok gtttphytkd (09 from Section 38, T.17N..R.16W. ihowini torn* of th« wrar-bMring unto in PipelineCanyon.
102
SURFACE WATERDrainage is to the south from Pipeline Canyon
into the Rio Puerco of the West. All streams inPipeline Canyon and the surrounding area areephemeral in their natural condition. Locally, thereare some minor springs and seeps found at thecontact between sandstone and shale units near thecanyon walls. Discharge from the springs dependson the frequency and amount of precipitation.
Mine dewatering operations by Kerr-McGeeNuclear Corporation and United Nuclear Corpora-tion discharge between 8 and 11 cfs (228.5 and314.3 1/s) into Pipeline Canyon arroyo (see Figure1). The water is pumped from the WestwaterCanyon Member of the Morrison Formation whichis approximately 1,250 ft (390.5 m) below thecanyon floor. Thus, the lower reach of PipelineCanyon has had perennial flow since 1977.
A number of the ephemeral drainagewaysincluding the principal arroyo in Pipeline Canyonshow long, rectilinear channels (see Figure 1). Thisstream pattern suggests structural control by theunderlying bedrock. The trend of the rectilinearsegments of stream channels generally coincideswith the direction of the strike of local fracturezones. The stream pattern is most distinct wherethe channel crosses the Dalton Sandstone and theUpper Gallup Sandstone.
GROUND WATERThe principal water-bearing units in Pipeline
Canyon are the Lower Gallup Sandstone, theUpper Gallup Sandstone, the Torrivio SandstoneMember, the Dilco Coal Member, and the alluvialdeposits. All these units yield water for domesticand/or stock supply throughout the San JuanBasin. Figure 3 is a borehole geophysical log from awell in Section 36, T.17N., R.16W. that includesthe self-potential (SP) curve, gamma-ray log,resistivity, and the neutron porosity measurementsof some of these water-bearing units. At thesouthern entrance to the canyon, the formationsare above the canyon floor and not water-bearing.However, the presence of alluvial deposits in thecanyon, the attitude of the exposed rock units, andthe degree of fracturing in the sandstones allow forsignificant ground-water recharge to the aquifers.
The alluvial deposits on the canyon floor arerecharged by direct precipitation, ephemeralstreamflow, and perennial streamflow from localmine dewatering. Ground-water flow in surficialdeposits is from northeast to southwest along theaxis of the canyon. The gradient of the alluvial
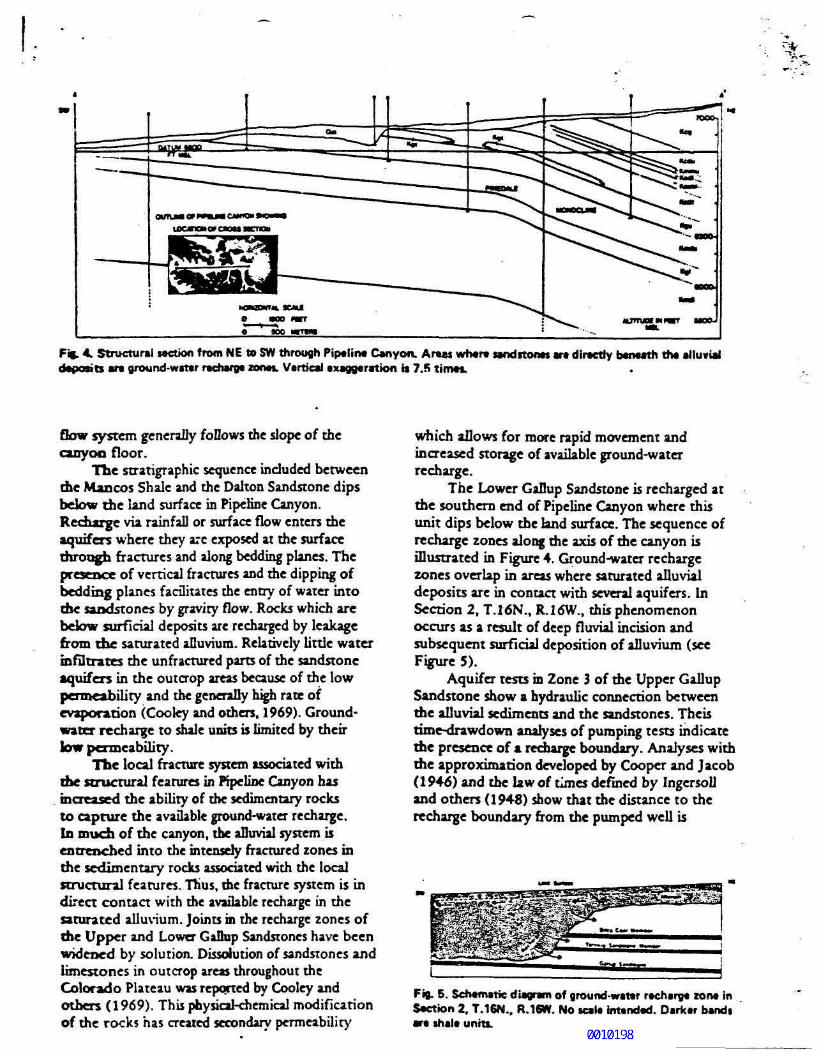
Fig. 4. Structural section from NE to SYV through Pipeline Canyon. A raw where sandstones art directly beneath tha alluvialdeposits art ground-water lecharge zone*. Vertical exaggeration is 73 time*.
flow system generally foDows the slope of thecanyon floor.
The stratigraphic sequence included betweenthe Mancos Shale and the Dalton Sandstone dipsbelow the land surface in Pipeline Canyon.Recharge via rainfall or surface flow enters theaquifers where they arc exposed at the surfacethrough fractures and along bedding planes. Thepresence of vertical fractures and the dipping ofbedding planes facilitates the entry of water intothe sandstones by gravity flow. Rocks which arebelow surficial deposits are recharged by leakagefrom the saturated alluvium. Relatively little waterinfiltrates the unfractured parts of the sandstoneaquifers in the outcrop areas because of the lowpermeability and the generally high rate ofevaporation (Cooky and others, 1969). Ground-water recharge to shale units is limited by theirlow permeability.
The local fracture system associated withthe structural features in Pipeline Canyon hasincreased the ability of the sedimentary rocksto capture the available ground-water recharge.In much of the canyon, the alluvial system isentrenched into the intensely fractured zones inthe sedimentary rocks associated with the localstructural features. Thus, me fracture system is indirect contact with the available recharge in thesaturated alluvium. Joints in the recharge zones ofthe Upper and Lower GaOnp Sandstones have beenwidened by solution. Dissolution of sandstones andlimestones in outcrop areas throughout theColorado Plateau was reported by Cooley andothers (1969). This physical-chemical modificationof the rocks has created secondary permeability
which allows for more rapid movement andincreased storage of available ground-waterrecharge.
The Lower Gallup Sandstone is recharged atthe southern end of Pipeline Canyon where thisunit dips below the land surface. The sequence ofrecharge zones along the axis of the canyon isillustrated in Figure 4. Ground-water rechargezones overlap in areas where saturated alluvialdeposits are in contact with several aquifers. InSection 2, T.16N., R.16W., this phenomenonoccurs as a result of deep fluvial incision andsubsequent surficial deposition of alluvium (seeFigure 5).
Aquifer tests in Zone 3 of the Upper GallupSandstone show a hydraulic connection betweenthe alluvial sediments and the sandstones. Theistime-drawdown analyses of pumping tests indicatethe presence of a recharge boundary. Analyses withthe approximation developed by Cooper and Jacob(1946) and the law of times defined by Ingersolland others (1948) show that the distance to therecharge boundary from the pumped well is
Fig. S. Schematic diagram of ground-water recharge zone inSection 2. T.16N.. R.16W. No scale intended. Darker bandsare shale units.
approximately equal to the distance to thesaturated stream channel alluvium of PipelineCanyon arroyo. The shape of the resulting cone ofdepression is similar to die generalized flow netpresented by Ferris and others (1962) for a dis-charging wefl near a recharge boundary.
Water-cable conditions prevail in areas whereaquifers are recharged in Pipeline Canyon. How-ever, infiltration from perennial streamflow hascreated ground-water mounds in the local alluvialdeposits along the main arroyos. Artesian condi-tions may exist in sandstone units which areadjacent and hydraulically connected to thealluvium in these areas. In general, the dip of theFinedale monocline causes the flow systems tochange from water-table to artesian conditions inPipeline Canyon. On the upthrown side of themonocline, water levels in wells tapping the UpperGallup Sandstone in T.17N., R16W., Section 36are near the top of the aquifer. A well in the sameformation on die downthrown side of the mono-dine shows the water level is 175 ft (53.3 m) abovethe top of die unit. The distance between wellswhich shows the change from water-table toartesian conditions is approximately 7,100 ft(2160 m). The Pinedale monocline is shown inFigure 4.
The volume of natural ground-water rechargeto die aquifers in Pipeline Canyon is difficult toestimate because of die lack of historical measure-ments of ground-water elevations and surface flowin die arroyos. However, die perennial streamflowresulting from local mine dewatering has beenmeasured at two locations approximately 1.2 miles(1.9 km) apart (see Figure 1). Weir measurementsof average dafly flows are presented in Table 2.
Weir measurements, local aquifer coefficients,and water-level data were used in a water budget toestimate recharge to aquifers under present condi-tions. The Upper Gallup Sandstone, die TorrivioSandstone Member, and sandstone lenses of dieDilco Coal Member underh/ die principal arroyo in
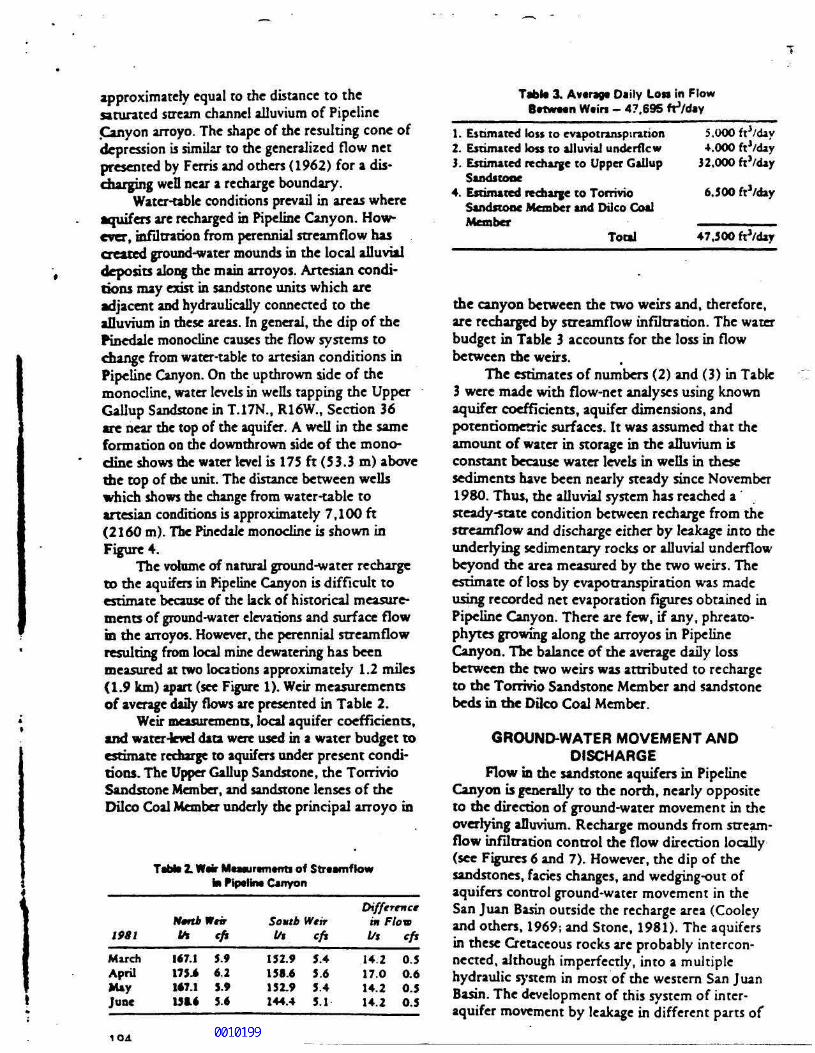
Table Z. Weir Meawrtments of Streamf towIN Pipeline Canyon
Table 3. Average Daily Lon in FlowBetween Weirs - 47,695 frVday
Difference
1981
MarchAprilMayJune
N*nb iIH
1*7.1175J1*7.115«.«
Weir
<fi
5.96.25.95.6
Southl/t
152.9158.6152.9144.4
Weireft
5.45.65.45.1
m Flowl/t
14.217.014.214.2
eft
0.50.60.50.5
1. Estimated lost to evapotranspiration 5.000 ft3/day2. Estimated loss to alluvial underflow 4.000 ftVday3. Estimated recharge to Upper Gallup 32.000 ftj/day
Sandstone4. Estimated recharge to Torrivio 6.500 ft'/day
Sandstone Member and Dilco CoalMember
Total 47.500 ft'/day
die canyon between die two weirs and, dierefore,are recharged by streamflow infiltration. The waterbudget in Table 3 accounts for die loss in flowbetween die weirs.
The estimates of numbers (2) and (3) in Table3 were made widi flow-net analyses using knownaquifer coefficients, aquifer dimensions, andpotenrJometric surfaces. It was assumed that dieamount of water in storage in die alluvium isconstant because water levels in wells in diesesediments have been nearly steady since November1980. Thus, die alluvial system has reached asteady-state condition between recharge from diestreamflow and discharge eidicr by leakage into dieunderlying sedimentary rocks or alluvial underflowbeyond die area measured by die two weirs. Theestimate of loss by evapotranspiration was madeusing recorded net evaporation figures obtained inPipeline Canyon. There are few, if any, phreato-phytes growing along die arroyos in PipelineCanyon. The balance of die average dafly lossbetween die two weirs was attributed to rechargeto die Torrivio Sandstone Member and sandstonebeds in die Dilco Coal Member.
GROUND-WATER MOVEMENT ANDDISCHARGE
Flow in die sandstone aquifers in PipelineCanyon is generally to die north, nearly oppositeto die direction of ground-water movement in dieoverlying alluvium. Recharge mounds from stream-flow infiltration control die flow direction locally(see Figures 6 and 7). However, die dip of thesandstones, fades changes, and wedging-out ofaquifers control ground-water movement in dieSan Juan Basin outside die recharge area (Cooleyand odiers, 1969; and Stone, 1981). The aquifersin diese Cretaceous rocks are probably intercon-nected, although imperfectly, into a multiplehydraulic system in most of die western San JuanBasin. The development of this system of inter-aquifer movement by leakage in different parts of
1O4
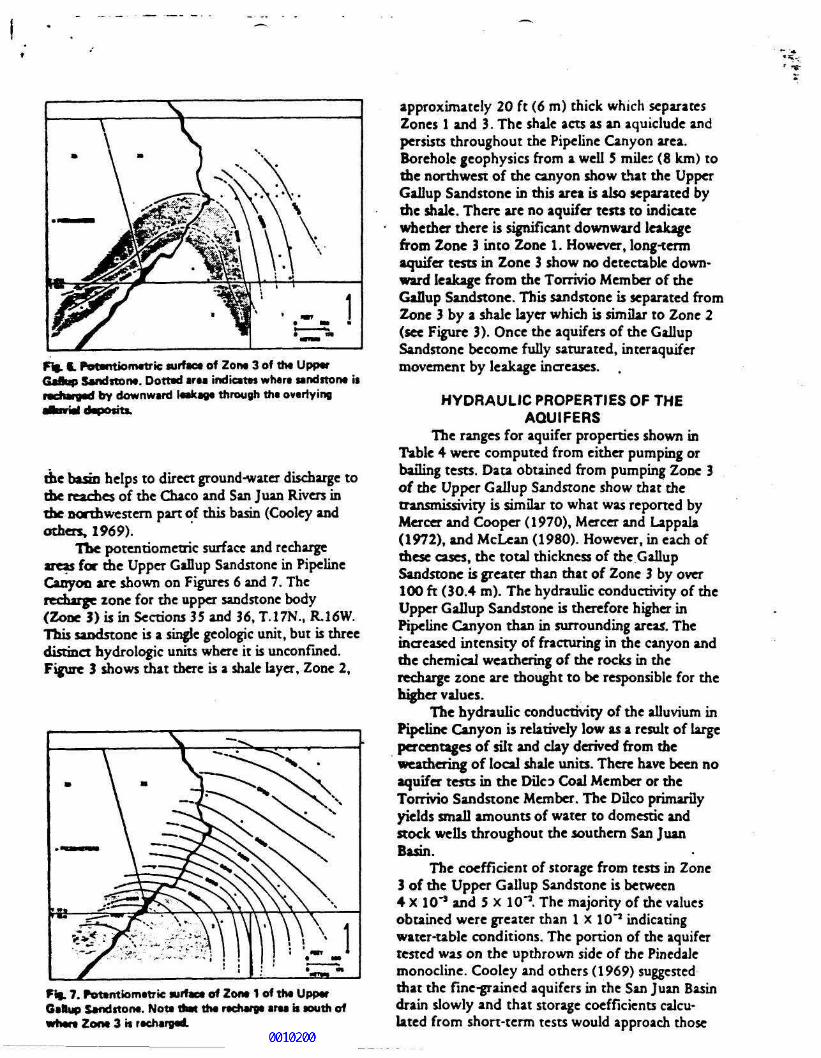
Fit, •. PotMrtiometric surface of ZOM 3 of tht UpperGaflup Sandstone. Dotted area indicates whera sandstone isrecharged by downward leakage through the overlyingattune! deposits.
the basin helps to direct ground-water discharge tothe reaches of the Chaco and San Juan Rivers inthe northwestern part of this basin (Cooley andothers, 1969).
The potentiometric surface and rechargeareas for the Upper Gallup Sandstone in PipelineCanyon are shown on Figures 6 and 7. Therecharge zone for the upper sandstone body(Zone 3) is in Sections 35 and 36, T.17N., R.16W.This sandstone is a single geologic unit, but is threedistinct hydrologic units where it is unconfined.Figure 3 shows that there is a shale layer, Zone 2,
Fift. 7. Potentiometric surface of Zone 1 of the UpperGallup Sandstone. Note tfeat the recharge area b south ofwhere Zone 3 is recharged.
approximately 20 ft (6 m) thick which separatesZones 1 and 3. The shale acts as an aquiclude andpersists throughout the Pipeline Canyon area.Borehole geophysics from a well 5 miles (8 km) todie northwest of the canyon show that the UpperGallup Sandstone in this area is also separated bythe shale. There are no aquifer tests to indicatewhether there is significant downward leakagefrom Zone 3 into Zone 1. However, long-termaquifer tests in Zone 3 show no detectable down-ward leakage from the Torrivio Member of theGallup Sandstone. This sandstone is separated fromZone 3 by a shale layer which is similar to Zone 2(see Figure 3). Once the aquifers of the GallupSandstone become fully saturated, interaquifermovement by leakage increases.
HYDRAULIC PROPERTIES OF THEAQUIFERS
The ranges for aquifer properties shown inTable 4 were computed from either pumping orbailing tests. Data obtained from pumping Zone 3of the Upper Gallup Sandstone show that thetransmissivity is similar to what was reported byMercer and Cooper (1970), Mercer and Lappala(1972), and McLean (1980). However, in each ofthese cases, the total thickness of the GallupSandstone is greater than that of Zone 3 by over100 ft (30.4 m). The hydraulic conductivity of theUpper Gallup Sandstone is therefore higher inPipeline Canyon than in surrounding areas. Theincreased intensity of fracturing in the canyon andthe chemical weathering of the rocks in therecharge zone are thought to be responsible for thehigher values.
The hydraulic conductivity of the alluvium inPipeline Canyon is relatively low as a result of largepercentages of silt and clay derived from theweathering of local shale units. There have been noaquifer tests in the DilcD Coal Member or theTorrivio Sandstone Member. The Dflco primarilyyields small amounts of water to domestic andstock wells throughout the southern San JuanBasin.
The coefficient of storage from tests in Zone3 of the Upper Gallup Sandstone is between4 X 10"1 and 5 X 10"7. The majority of the valuesobtained were greater than 1 X 10"7 indicatingwater-table conditions. The portion of the aquifertested was on the upthrown side of the Pinedalemonocline. Cooley and others (1969) suggestedthat the fine-grained aquifers in the San Juan Basindrain slowly and that storage coefficients calcu-lated from short-term tests would approach those
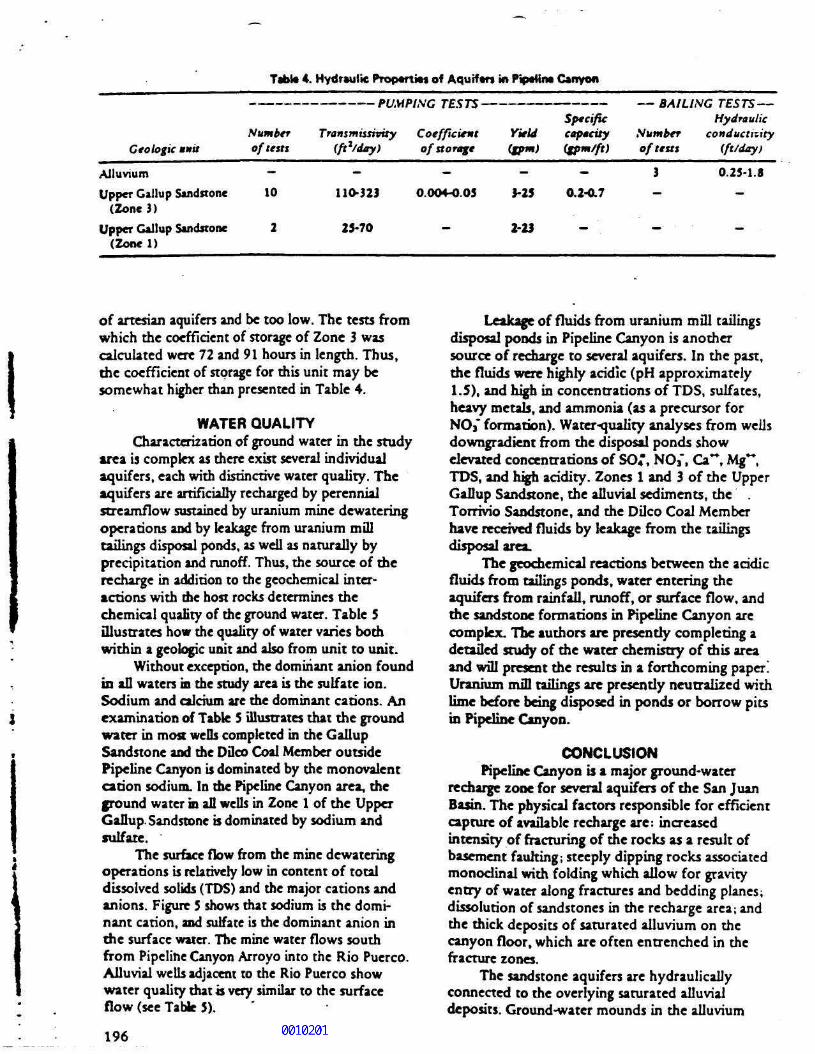
Table 4. Hydraulic Propartias of Aqurfar* in Pipatina Canyon
C to logic unit
Alluvium
Upper Gallup Sandstone(Zone 3)
Upper Gallup Sandstone(Zonel)
Numberof tent
-
10
2
Transmisirpity Coefficient(ft*/day) of storage
-
110-323
25-70
-
0.004-0.05
~
Yield(fpm)
—3-25
2-23
Specificcapacity(fpm/ft)
—0.2-0.7
-~
a A ti i\if TFCTCHydraulic
Number conductivityof teat (ft/day)
3
—
™ •
0.25-1.8
—
—
of artesian aquifers and be too low. The tests fromwhich the coefficient of storage of Zone 3 wascalculated were 72 and 91 hours in length. Thus,die coefficient of storage for this unit may besomewhat higher than presented in Table 4.
WATER QUALITYCharacterization of ground water in the study
area is complex as there exist several individualaquifers, each with distinctive water quality. Theaquifers are artificially recharged by perennialstreamflow sustained by uranium mine dewateringoperations and by leakage from uranium mflltailings disposal ponds, as well as naturally byprecipitation and runoff. Thus, the source of therecharge in addition to the geochemical inter-actions with me host rocks determines thechemical quality of die ground water. Table 5illustrates how die quality of water varies bodiwithin a geologic unit and also from unit to unit.
Without exception, die dominant anion foundin all waters m die study area is die sulfate ion.Sodium and calcium are die dominant cations. Anexamination of Table 5 illustrates diat die groundwater in most weOs completed in die GallupSandstone and die Dflco Coal Member outsidePipeline Canyon is dominated by die monovalentcation sodium. In die Pipeline Canyon area, dieground water m all wells in Zone 1 of die UpperGallup Sandstone is dominated by sodium andsulfate.
The surface flow from die mine dewateringoperations is relatively low in content of totaldissolved solids (TDS) and die major cations andanions. Figure 5 shows diat sodium is die domi-nant cation, and sulfate is die dominant anion indie surface water. The mine water flows southfrom Pipeline Canyon Arroyo into the Rio Pucrco.Alluvial wells adjacent to die Rio Puerco showwater quality diat is very similar to the surfaceflow (see Tabk 5).
196
Leakage of fluids from uranium mill tailingsdisposal ponds in Pipeline Canyon is anothersource of recharge to several aquifers. In die past,die fluids were highly acidic (pH approximately1.5), and high in concentrations of TDS, sulfates,heavy metals, and ammonia (as a precursor forNO/ formation). Water-quality analyses from wellsdowngradient from die disposal ponds showelevated concentrations of SO4", NO3", Ca**, Mg~,TDS, and high acidity. Zones 1 and 3 of die UpperGallup Sandstone, die alluvial sediments, die .Torrivio Sandstone, and die Dilco Coal Memberhave received fluids by leakage from die tailingsdisposal area.
The geochemical reactions between die acidicfluids from taflings ponds, water entering dieaquifers from rainfall, runoff, or surface flow, anddie sandstone formations in Pipeline Canyon arecomplex. The authors are presently completing adetailed study of die water chemistry of diis areaand wfll present die results in a forthcoming paper!Uranium miD tailings are presendy neutralized withlime before being disposed in ponds or borrow pitsin Pipeline Canyon.
CONCLUSIONPipeline Canyon is a major ground-water
recharge zone for several aquifers of die San JuanBasin. The physical factors responsible for efficientcapture of available recharge are: increasedintensity of fracturing of die rocks as a result ofbasement faulting; steeply dipping rocks associatedmonodinal widi folding which allow for gravityentry of water along fractures and bedding planes;dissolution of sandstones in die recharge area; anddie diick deposits of saturated alluvium on diecanyon floor, which arc often entrenched in diefracture zones.
The sandstone aquifers are hydraulicallyconnected to die overlying saturated alluvialdeposits. Ground-water mounds in die alluvium
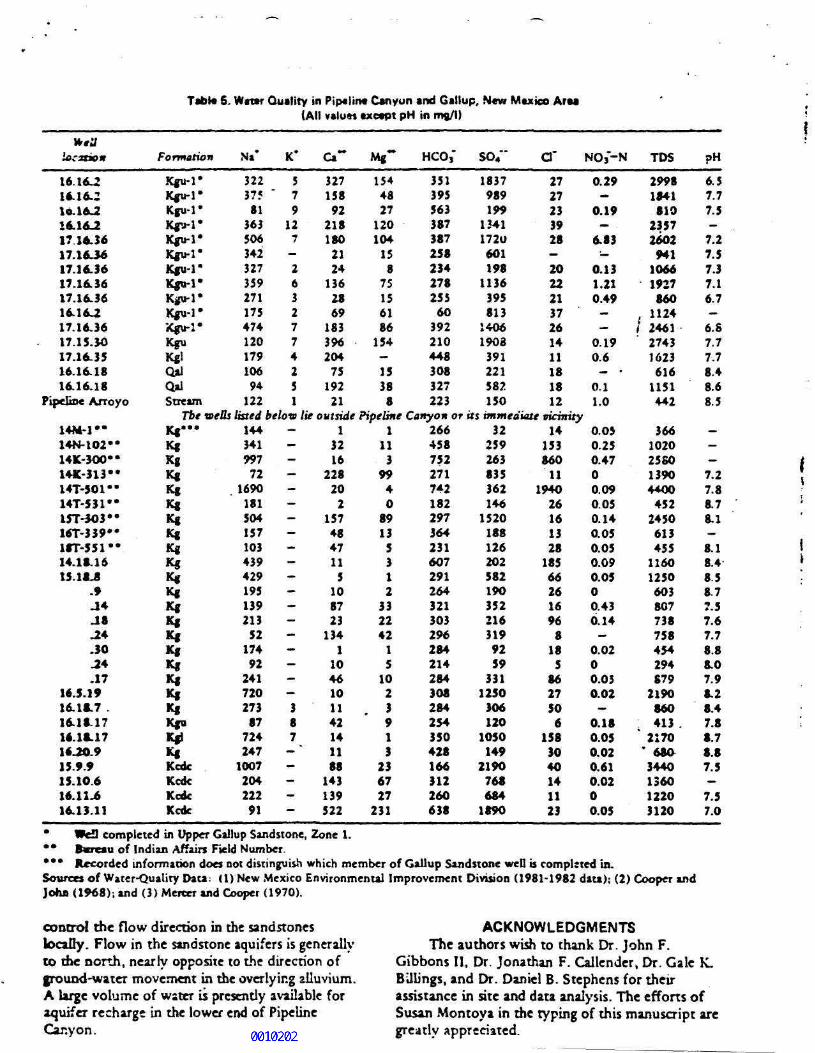
Table 6. Warn Quality in Pip«lint Canyon and Gallup, New Mtxioo Area(All valum axcapt pH in mg/l)
location
1616-216.16.21 0.16-216.16-217.16.3617.16-3617.16.3617.16.3617.16.3616.16.217.16.3617.15.3017.16-3516.16.1816.16.18
Pipeline Arroyo
14M-1"14N-102"14K-3OO-*14K-313**14T-501**14T-531**15T-303**16T-339**18T-551**14.18.1615.18u£
.9-14J8.24.30.24.17
16.5.1916.18.7 .16.18.1716.18.1716.20.915.9.915.10.616.11.616.13.11
Formation Na*
Kgu-1*Kgu-1*Kgu-1*Kgu-1*Kgu-1*Kgu-1*Kgu-1*Kgu-1*Kgu-1*Kgu-1*Kgu-1*KguKglQalQalStream
TbeKg***KgKgKgKgKgKgKgKgKgKgKgKgKgKgKgKgKgKgKgKguKglKgKcdcKcdcKcdcKcdc
3223758136350634232735927117547412017910694122
veUs listed14434199772
1690181504157103439429195139213521749224172027387724247100720422291
K*
5" 7
9127
—2632774251
below lie
——-
—————-—--
—————-
—387— "
——-
—
Ca~
32715892218180212413628691833962047519221
outside13216228202
157484711510872313411046101142141188143139522
«,-154482712010415875156186154
-15388
Pipeline111399408913531233224215102
. *913236727231
HCO,*
35139556338738725823427825560392210448308327223
Canyon or266458752271742182297364231607291264321303296284214284308284254350428166312260638
S04"
1837989199
13411720601198
11363958131406190839122158?150
a' NO^-N2727233928
-20222137261411181812
0.29
-0.19
—6.83•—
0.131.210.49-
—0.1906— •0.11.0
TDS
2998184181023572602941106619278601124
/ 2461274316236161151442
PH
6.57.77.5-7.27.57.37.16.7-6.87.77.78.48.68.5
its immediate vicinity32259263835362146152018812620258219035221631992593311250306120105014921907686841890
1415386011
1940261613281856626169681858627506
1583040141123
0.050.250.4700.090.050.140.050.050.090.0500.430.14
-0.0200.050.02
—0.180.050.020.610.0200.05
36610202580139044004522450613455116012506038077387584542948792190860413 .
' 2170' 6843440136012203120
-
——7.27.88.78.1
—8.18.48.58.77.57.67.78.88.07.98.28.47.88.78.87.5
—7.57.0
* Wefl completed in Upper Gallup Sandstone, Zone 1.** Btereau of Indian Affairs Field Number.*** Recorded information does not distinguish which member of Gallup Sandstone wen is completed in.Source* of Water-Quality Data: (1) New Mexico Environmental Improvement Division (1981-1982 data); (2) Cooper andJohn (1968). and (3) Mercer and Cooper (1970).
control the flow direction in the sandstonesVocally. Flow in the sandstone aquifers is generallyto the north, nearly opposite to the direction ofground-water movement in the overlying alluvium.A large volume of water is presently available foraquifer recharge in the lower end of PipelineCar.yon.
ACKNOWLEDGMENTSThe authors wish to thank Dr. John F.
Gibbons II, Dr. Jonathan F. Callender, Dr. Gale K.Billings, and Dr. Daniel B. Stephens for theirassistance in site and data analysis. The efforts ofSusan Montoya in the typing of this manuscript aregreatly appreciated.
REFERENCESBeaumont, E. C 1971. Stratigraphic distribution of coal in
the San Juan Basin. In Shomaker, J. W., E. C.Beaumont, and F. E. Kottlowski (eds.). New MexicoBureau of Mines and Mineral Resources Memoir 25.
Cooley. M. E.. J. W. Harshbarger, J. P. Akers. and W. F.Hardt. 1969. Regional hydrogeology of the Navajoand Hopi Indian Reservations, Arizona. New Mexico,and Utah. U.S. Geol. Survey Prof. Paper 521-A.
Cooper, H. S.. Jr., and C. E. Jacob. 1946. A generalizedgraphical method for evaluating formation constantsand summarizing well-field history. Trans. Am.Geophys. Union, v. 27, no. 4.
Ferris, J. G., D. B. Knowles. R. H. Brown, and R. W.Stallman. 1962. Theory of aquifer tests. U.S. Geol.Survey Water-Supply Paper 1536-E.
Gibbons, J. F., II. 1980. Geology of the Church Rock area.New Mexico. Unpublished report prepared for UnitedNuclear Corporation by Science Applications, Inc.and Bearpaw Geosciences.
tfiatt, W. E. 1953. The analysis of precipitation data. InSubsurface facilities of water management andpatterns of supply-Type area studies, pt. 4 o/Thephysical and economic foundation of naturalresources. Int. and Insular Affairs Comm., HouseRep.. U.S. Cong. pp. 186-206.
tegersoll. L. R.. O. J. Zobel, and A. C Ingenoll. 1948. HeatConduction with Engineering and Geological Applica-tions. McGraw-Hill Book Company, New York.
McLean, J. S. 1980. Aquifer tests in the Gallup Sandstonenear Yah-Ta-Hey, New Mexico. U.S. Geol. SurveyWater Res. Investigations 80-25.
Mercer. J. W. and J. B. Cooper. 1970. Availability ofground wacer in the Gallup-Tohatchi area, McKinleyCounty, New Mexico. U.S. Geol. Survey Open-FileReport.
Mercer, j. W. and E. G. Lappala. 1972. Erwin-1 productionwell, city of Gallup. McKinley County, New Mexico.U.S. Geol. Survey Open-File Report.
Stone, W. J. 1981. Hydrogeology of the Gallup Sandstone.San Juan Basin, northwest New Mexico. GroundWater, v. 19.no. 1.
U.S. Weather Bureau. 1938-1960. dimatological Data,Annual Summary. U.S. Dept. of Commerce, Gallup.New Mexico.
Richard R. Raymondi received a 0.5. in Conservationfrom Kent State University m 1976, and a M.S. in Hydrol-ogy from the Unroertity of Arizona in 1980. From 1977 to1918 be held a technical assistant position at the Ohio Agri-cultural Research and Development Center. O.S. U. campusin Coumbus. In 1980, be joined f be Water PollutionControl Bureau of the New Mexico EnvironmentalImprovement Division, and bis research interests are thedynamics of flow systems and the movement of con-taminants in ground water.
Ronald C. Conrad received a flJS. i* Chemistry fromBethany College, 1962, and a Ph.D. in Inorganic Chemistryfrom the University of Hawaii, 1966. Fttrtber educationand job history: Research Specialist for the New JerseyZinc Co., 1967-1969; Postdoctoral Research Fellow,University of Arizona, 1970-1972; National Institute ofHealth Postdoctoral Research Fellow, University of Wis-consin and New Mexico State University, 1972-1975;Chief, Air and Metals Division of New Mexico LaboratoryDivision, 1976, 1977; Air Chemist, Environmental Protec-tion Agency, 1977, 1978; Environmental Scientist andWater Resource Specialist, New Mexico EnvironmentalImprovement Division, 1978-present.
A T T A C H M E N T B
Hydrologic Report 7
New Mexico Bureau of Mines A Mineral Resources
A DIVISION OFNEW MEXICO INSTITUTE OF MINING A TECHNOLOGY
Selected papers onwater quality and pollution in New Mexico
Proceedings of a Symposium onWater Quality and Pollution in New Mexico
April 12, 1984, Socorro, NM
Compiled by William J. StoneNew Mexico Bureau of Mines and Mineral Resources
Sponsored byWater Pollution Control Bureau, New Mexico Environmental Improvement Division
New Mexico Bureau of Mines and Mineral ResourcesGeophysical Research Center, Research and Development Division,
New Mexico Institute of Mining and Technology
SOCORRO 1984
184
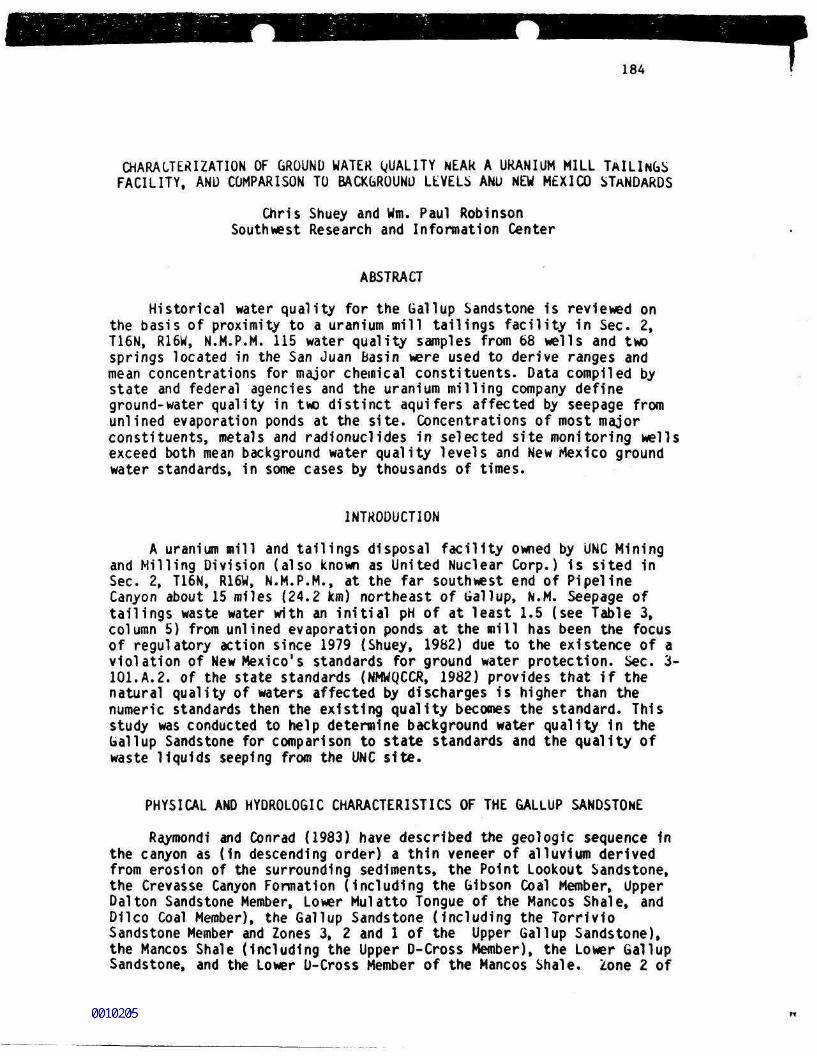
CHARACTERIZATION OF GROUND WATER QUALITY NEAR A URANIUM MILL TAlLlN&SFACILITY, AND COMPARISON TO BACKGROUND LEVELS ANU NEW MEXICO STANDARDS
Chris Shuey and Wm. Paul RobinsonSouthwest Research and Information Center
ABSTRACT
Historical water quality for the Gallup Sandstone is reviewed onthe basis of proximity to a uranium mill tailings facility in Sec. 2,T16N, R16W, N.M.P.M. 115 water quality samples from 68 wells and twosprings located in the San Juan basin were used to derive ranges andmean concentrations for major chemical constituents. Data compiled bystate and federal agencies and the uranium milling company defineground-water quality in two distinct aquifers affected by seepage fromunlined evaporation ponds at the site. Concentrations of most majorconstituents, metals and radionuclides in selected site monitoring wellsexceed both mean background water quality levels and New Mexico groundwater standards, in some cases by thousands of times.
INTRODUCTION
A uranium mill and tailings disposal facility owned by UNC Miningand Milling Division (also known as United Nuclear Corp.) 1s sited inSec. 2, T16N, R16W, N.M.P.M., at the far southwest end of PipelineCanyon about 15 miles (24.2 km) northeast of Gallup, N.M. Seepage oftailings waste water with an initial pH of at least 1.5 (see Table 3,column 5) from unlined evaporation ponds at the mill has been the focusof regulatory action since 1979 {Shuey, 1982) due to the existence of aviolation of New Mexico's standards for ground water protection. Sec. 3-101.A.2. of the state standards (NMWQCCR, 1982) provides that if thenatural quality of waters affected by discharges is higher than thenumeric standards then the existing quality becomes the standard. Thisstudy was conducted to help determine background water quality in theGallup Sandstone for comparison to state standards and the quality ofwaste liquids seeping from the UNC site.
PHYSICAL AND HYDROLOGIC CHARACTERISTICS OF THE GALLUP SANDSTONE
Raymondi and Conrad (1983) have described the geologic sequence 1nthe canyon as (In descending order) a thin veneer of alluvium derivedfrom erosion of the surrounding sediments, the Point Lookout Sandstone,the Crevasse Canyon Formation (Including the Gibson Coal Member, UpperDal ton Sandstone Member, Lower Mulatto Tongue of the Mancos Shale, andD1lco Coal Member), the Gallup Sandstone (including the TorrlvioSandstone Member and Zones 3, 2 and 1 of the Upper Gallup Sandstone),the Mancos Shale (including the Upper D-Cross Member), the Lower GallupSandstone, and the Lower U-Cross Member of the Mancos Shale. Zone 2 of
185
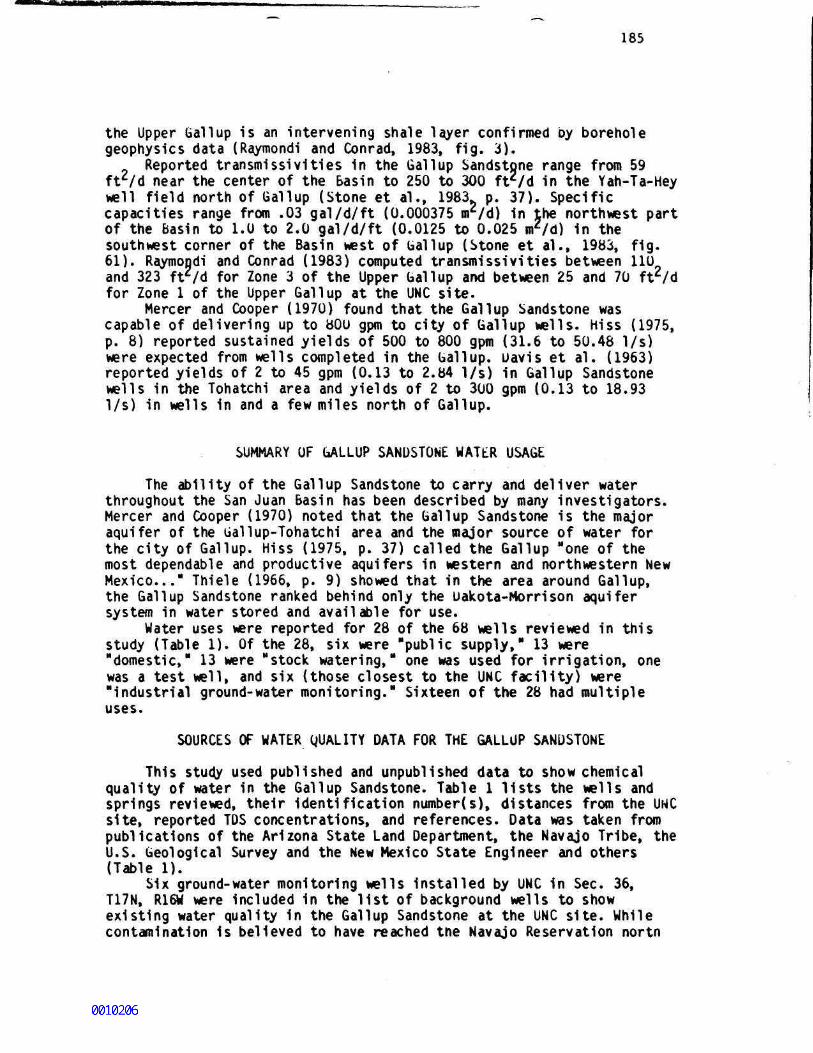
the Upper Gallup is an intervening shale layer confirmed by boreholegeophysics data (Raymondi and Conrad, 1983, fig. 3).
Reported transmissivities in the Gallup Sandstone range from 59ftz/d near the center of the Basin to 250 to 300 ftz/d in the Yah-Ta-Heywell field north of Gallup (Stone et al., 1983. p. 37). Specificcapacities range from .03 gal/d/ft (0.000375 mz/d) in the northwest partof the Basin to 1.0 to 2.0 gal/d/ft (0.0125 to 0.025 mz/d) in thesouthwest corner of the Basin west of Gallup (Stone et al., 1983, fig.61). Raymondi and Conrad (1983) computed transmissivities between 110and 323 ftz/d for Zone 3 of the Upper Gallup and between 25 and 70 ftz/dfor Zone 1 of the Upper Gallup at the UNC site.
Mercer and Cooper (1970) found that the Gallup Sandstone wascapable of delivering up to 800 gpm to city of Gallup wells. Hiss (1975,p. 8) reported sustained yields of 500 to 800 gpm (31.6 to 50.48 1/s)were expected from wells completed in the Gallup, uavis et al. (1963)reported yields of 2 to 45 gpm (0.13 to 2.84 1/s) in Gallup Sandstonewells in the Tohatchi area and yields of 2 to 300 gpm (0.13 to 18.931/s) in wells in and a few miles north of Gallup.
SUMMARY OF GALLUP SANDSTONE WATER USAGE
The ability of the Gallup Sandstone to carry and deliver waterthroughout the San Juan Basin has been described by many investigators.Mercer and Cooper (1970) noted that the Gallup Sandstone is the majoraquifer of the ballup-Tohatchi area and the major source of water forthe city of Gallup. Hiss (1975, p. 37) called the Gallup "one of themost dependable and productive aquifers in western and northwestern NewMexico..." Thiele (1966, p. 9) showed that in the area around Gallup,the Gallup Sandstone ranked behind only the Dakota-Morrison aquifersystem in water stored and available for use.
Water uses were reported for 28 of the 68 wells reviewed in thisstudy (Table 1). Of the 28, six were "public supply," 13 were"domestic," 13 were "stock watering," one was used for irrigation, onewas a test well, and six (those closest to the UNC facility) were"industrial ground-water monitoring." Sixteen of the 28 had multipleuses.
SOURCES OF WATER QUALITY DATA FOR THE GALLUP SANDSTONE
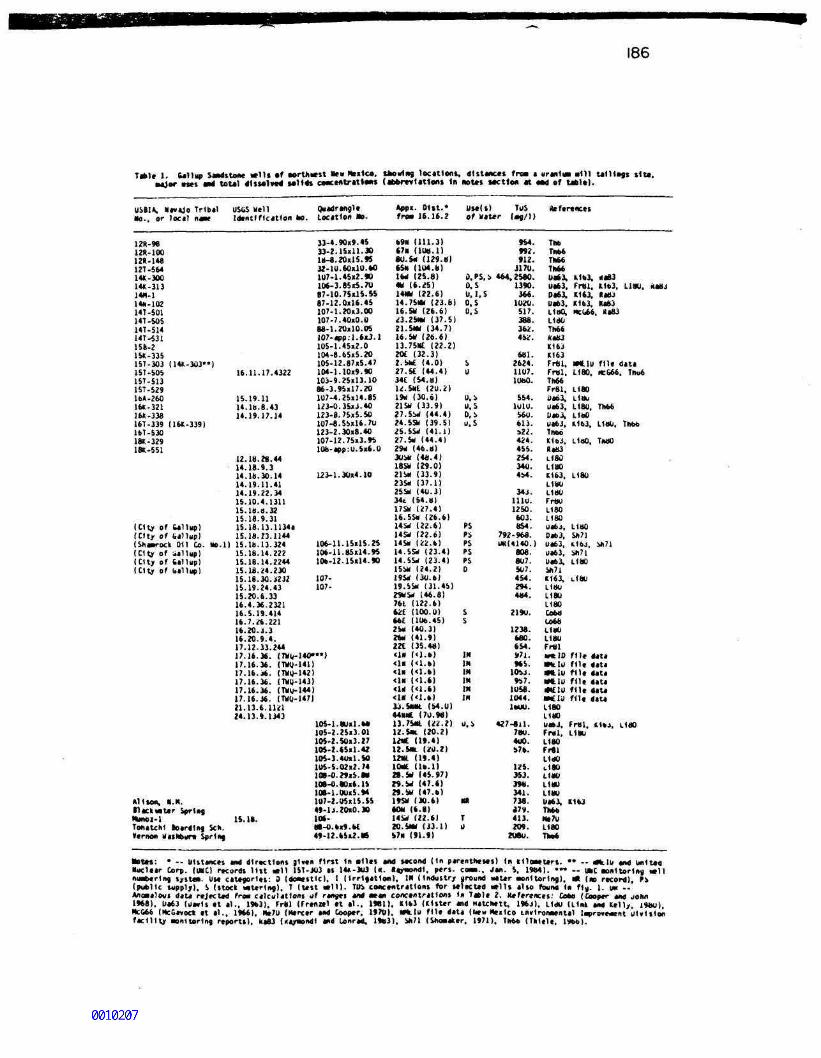
This study used published and unpublished data to show chemicalquality of water in the Gallup Sandstone. Table 1 lists the wells andsprings reviewed, their identification number(s), distances from the UNCsite, reported TDS concentrations, and references. Data was taken frompublications of the Arizona State Land Department, the Navajo Tribe, theU.S. Geological Survey and the New Mexico State Engineer and others(Table 1).
Six ground-water monitoring wells installed by UNC in Sec. 36,T17N, R16W were included in the list of background wells to showexisting water quality in the Gallup Sandstone at the UNC site. Whilecontamination is believed to have reached the Navajo Reservation nortn
186
Table 1. tallup S«ndstMjor «es mi tot
USBI*. Navajo TribalNo., or locil n«K
12R-98120-100120-14812T-56414(-30014K-31314M-11411-10214T-S01141-50514T-51414T-S31158-2151-33515T-303 (14H-303**)15T-S0515T-51315T-S2916A-26016* -32116K-33616T-339 (16K-339)16T-5301 W -32918K-551
(City of Salliip)(City of fcjllup)(Shwocx 011 Co. Mo.l)(City of *aUup)(City of Sill up)(City of (.ill up)
All Km, N.K.•lackMter 5pr1*gMunoi-1TonaUn! toardlft) Sen.•ernon VasNwni Spring
MC »11t »f lorthttst Heir Ne.tce. staving locations, dlstwil «• U»1«t4 wild* cMC**tr*U«» (*t*re»1«t1o«» In notes »
USttS Hell QMadranoleIdentification ho. Location No.
33-4.90x9.45J3-2.15xll.30lft-8. 20x15. «32-10. 60x10.60HI7-1. 45.2.90106-3.85«5.7087-10. 75x15. S587-12.0x16.45107-1.20x3.00107-7.40x0.088-1.20x10.05107-app:1.6O.l105-1.45x2.0104-8.65x5.20105-12.87xS.47
16.11.17.4322 104-1.10x9.90103-9.25x13.1086-3.95x17.20
15.19.11 107-4.25x14.8514. IB. 8. 43 123-0. 35x3. 4014.19.17.14 123-8.75x5.50
107-8.55x16. 70123-2.30x8.40107-12.75x3.95IflO-appiU. 5x6.0
12. IB. 28. 4414 18.9.314. IB. 30.14 123-1.30x4.1014.19.11.4114.19.22.3415.10.4.131115. IB. B. 32IS. 18. 9. 31IS. 16. 13. 1134*IS. 18. 13. 11441S.1B.13.324 106-11.15x15.2515.18.14.222 106-11.85x14.9515.18.14.2244 106-12.15x14.9015.18.24.23015.18.30.3232 107-15.19.24.43 107-15.20.6.3316.4.36.232116.5.19.41416.7.26.22116.20.3.316.20.9.4.17.12.33.24417.16.36. <nn,-140*"l17.16.36. (TWU-141)17.16.36. (TUg-142)17.16.36. (TXO.-143)17.16.36. <T¥g-144>17.16.36. (TkH|-147)21.13.6.112124.13.9.1343
105-l.80ll.UI105-2.25x3.01105-2.50x3.27105-2.65x1. 42105-3.40x1.50105-5.02x2.74108-0. 29x5.811108-0.80x6.14I0e-l.00x5.94107-2.05x15.5549-13. 20.0.30
15. 18. 10*-08 -0.6x9. 6C49-12.65.2.16
Appx. Oltt.*fro» 16.16.2
69* (111.3)67» (lUB.l)80.5* (129.8)65* (104.1))1M (25.8)4U (6.25)14NH (22.6)14.75* (23.6)16.SU 126.6)23.25M (37.5)21. SW (34.7)16.5V (26.6)13.7SME (22.2)20C (32.3)2.6*£ (4.0)27.5E (44.4)34£ (54. B)U.Stt (2U.2)1M (30.6)21SW (33.9)27.SU (44.4)24.5* (39.5)2S.5SW (41.1)27. SK (44.4)2M (46. B)30* (48.4)185V (29.0)21!* (33.9)23U 137.1)25SM (40.3)34t (S4.KI17SV (27 .4 )16.5SM (26.6)14U (22.6)14» (22.6)14SH (22.6)14.5SM (23.4)14.SU (23.4)1SU (24.2)19U (30.6)19.SSK (31.45)29MU (46.8)761 (122.6)6it (100.0)66E (106.45)25* (40.3)2t* (41.9)221 (35.48)<1» (<1.6)<U (<1.6)<1N (<1.6)<1« (<1.6)<U (<1.6)<1« (<1.6)U.SlWt. (54.0)44HX (70.98)1J.7S*. (22.2)12.5*. (20.2)12tC (19.4)12.5K (20.2)Utt (19.4)10KC (U.I)28. SK (45.97)29.W (47.6)».M (47.6)19SV (30.6)tOH (6.8)14U (22.6)20.5* (33.1)57> (91.9)
c« fro* aKt1o« at i
Use(s) TuSof Water lag/l)
0, PS, 50,50,1,5O.S0.5
iL)
0.50.50,5U.S
PSPSPSPSP5D
55
IN1MININ1MIM
u. :>
N*
Ta
954.992.912.
3170.464,2580.
1390.366.
1020.517.388.362.452.
681.2624.1107.10BO.
554.lulu.560.613.»22.424.455.254.340.454.
343.111U.1250.603.854.
792-968.UKI4140.)
808.807.507.454.29*.4«4.
219U.
1238.660.654.»7l.96S.
105J.957.
1058.1044.1MM.
427-811.780.400.576.
125.353.3M.341.7M.«7l>.413.2O9.
2080.
uran1« (111 U111»jt site,•d of tafclt).
Deferences
Th6Th66Th66ThttUa63, (163, <«83u*63, Frtl, (163, L180, kaH3Da63, (163. laBJUa63, (163, Ra83L1BO, Ncd66, 11*83L140Th66K*B3(163(163Frtl, NHLlu file dataFrtl, L180, MC&66. Tho6TH66Frtl. L180U«63, Uauua63, L180. Tn66Uat)3, L1BOUa63. (163, L1BO, Th66TDM(163, LlaO, TndO0*B31.1801.180(163, 1180
L180
L1BO
FrBOL180
L180
Ua63, L1BO0*63. SA71Ua63, (163, i»71ua63, Sh71U*63. L1BO»7l(163, L<BUL1BOLI801180COML068LIDOL180
FrtlMtlO file dataNHtlu file data•NLiu file data•Ntlu file dataaMCIO file data•Clu file data1180L180
uadJ. Frtl, (163, 1.180Frtl. LtBUL180
FrtlL1dO
t!80
L1MJ
L1BO
L1WJ
U*63, (163Tn*tNt7UL180
Th»6
Met**: • -- U1it«K«t •* d1r«ct1on» |1«" Hr»t 1n •«!« MM Mcon4 (In p wen them) In tnoxtteri. •• — Mtlv *nd United•ucl.ir Cor,. (MCI rKord. 11tt -11 15T-303 .. 14»-3u3 («. Uym*. I**1-*- co-.. Jw- 5. 19H4). •« " »C nnltorlnj «11nurturing lyst» Uw ciUforln: 9 (dOK.tlcl. I I1rr1»«t10«>. 1* (InduUry around «iter •onlurlnj). * (•» rtcord). P»(public wppl/1. i Utock .Iiur1n9). T (U»t •11). TUi concentritlon. for "Itcted »1H jHo founa In f ». 1. UK --AnoxlMt diU rejected fro. cllcuUtloni of r.»ge. tfld •>« concentrittoni 1n Title 2. References. COM (Cooper «M John19»8). U«63 (»M1> it •!.. 1963). Frtl (Frenzel et •».. 1981). (163 UUUr <nd M»un«tt, 1»6J). LI* (link M ull/. l»*o).Hc06t (HcGwort rt «1. l»6t). »«7U (M»re»r t*d Cooper. l»70). Wklu fll* d<t« (t»« Heilco tn»1roi»ent»l l«pre»«ent U1»l»1on
n1Ur1n« r»poru). k<83 |««^o«d1 Did Lonr»d, l»B3). 1*71 (SnoBlktr. 1971). Tn*« (Tfctele.
187
of the tailings site (a distance of approximately 3,10U ft [945.1 m]) inZone 3 of the Upper Gallup Sandstone (R. Raymondi, New MexicoEnvironmental Improvement Division, memorandum, Oct. 24, 1983), Zone 1wells at the reservation boundary are not believed to have been affectedby seepage flows. We note, however, that these six Zone 1 wells liewithin a few hundred feet of the Pipeline Canyon Arroyo (fig. 2) and maybe influenced by recharge of fair-to-good quality mine-discharge waterthrough an intervening alluvial ground-water system {Raymond! and Conrad(1983).
RANGES AND MEANS OF MAJOR CONSTITUENTS IN GALLUP SANDSTONE WATER
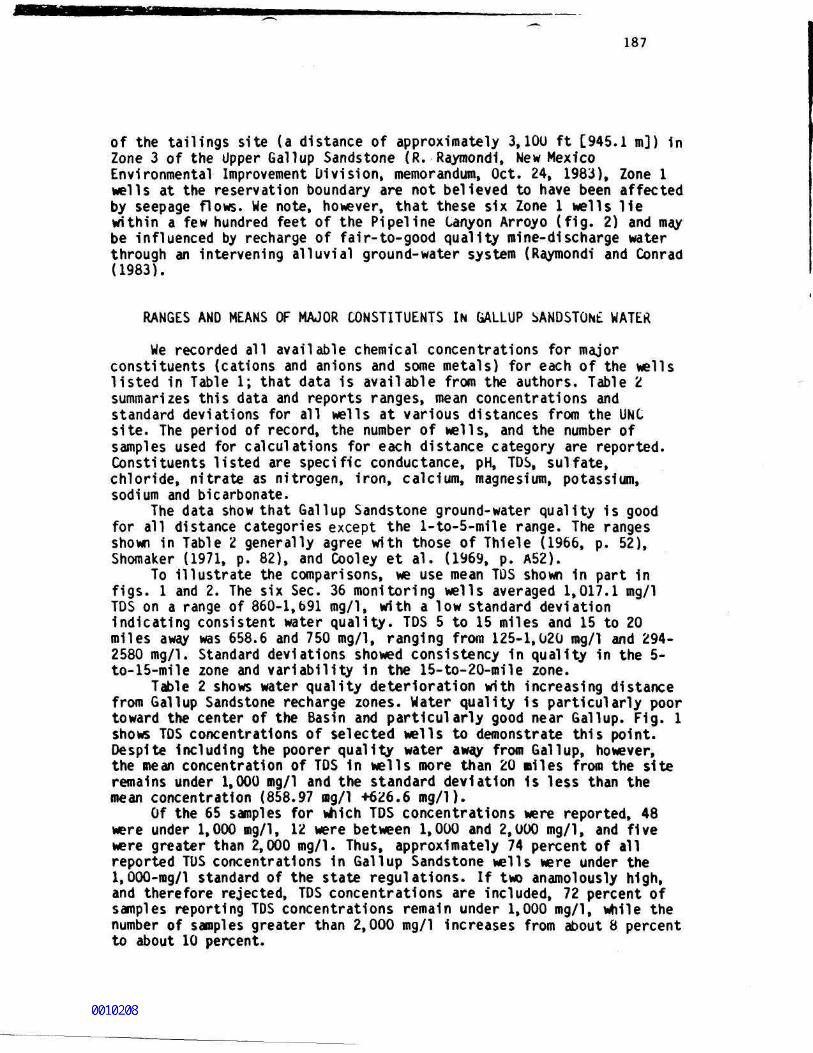
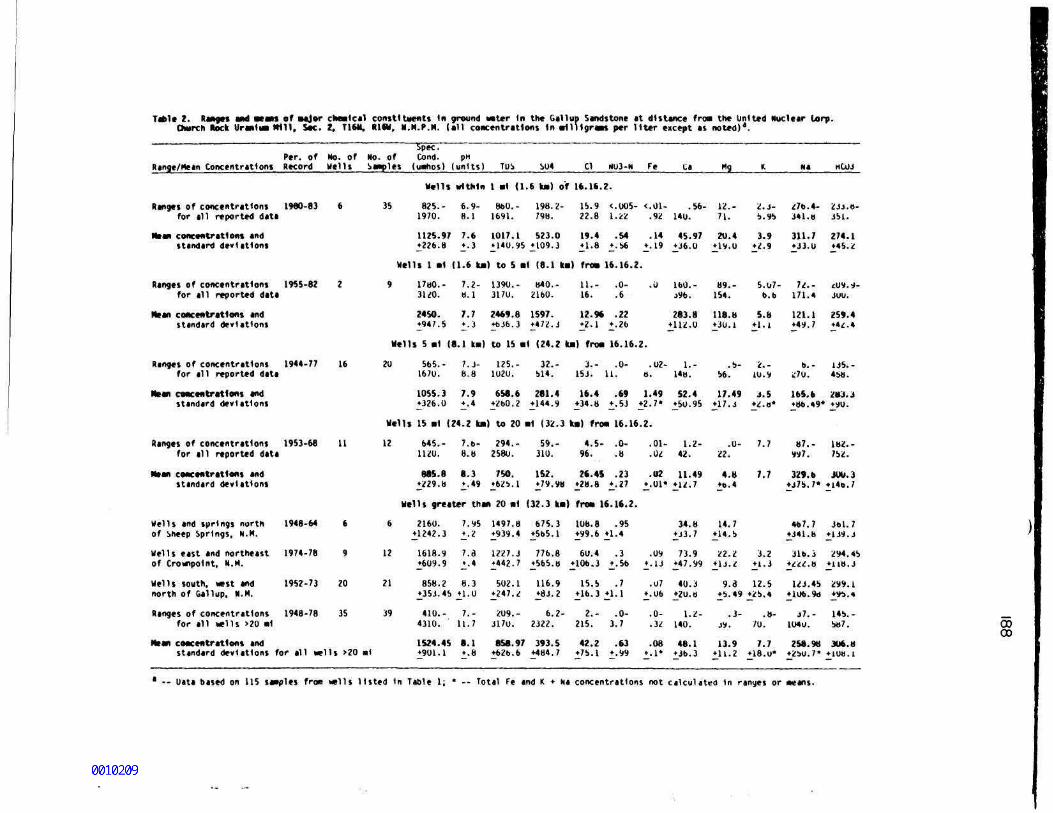
We recorded all available chemical concentrations for majorconstituents (cations and anions and some metals) for each of the wellslisted in Table 1; that data is available from the authors. Table 2summarizes this data and reports ranges, mean concentrations andstandard deviations for all wells at various distances from the UNCsite. The period of record, the number of wells, and the number ofsamples used for calculations for each distance category are reported.Constituents listed are specific conductance, pH, TDS, sulfate,chloride, nitrate as nitrogen, iron, calcium, magnesium, potassium,sodium and bicarbonate.
The data show that Gallup Sandstone ground-water quality is goodfor all distance categories except the l-to-5-mile range. The rangesshown in Table 2 generally agree with those of Thiele (1966, p. 52),Shomaker (1971, p. 82), and Cooley et al. (1969, p. A52).
To illustrate the comparisons, we use mean TDS shown in part infigs. 1 and 2. The six Sec. 36 monitoring wells averaged 1,017.1 mg/1TDS on a range of 860-1,691 mg/1, with a low standard deviationindicating consistent water quality. TDS 5 to 15 miles and 15 to 20miles away was 658.6 and 750 mg/1, ranging from 125-1,020 mg/1 and 294-2580 mg/1. Standard deviations showed consistency in quality in the 5-to-15-mile zone and variability in the 15-to-20-mile zone.
Table 2 shows water quality deterioration with increasing distancefrom Gallup Sandstone recharge zones. Water quality is particularly poortoward the center of the Basin and particularly good near Gallup. Fig. 1shows TDS concentrations of selected wells to demonstrate this point.Despite Including the poorer quality water away from Gallup, however,the mean concentration of TDS in wells more than 20 Biles from the siteremains under 1,000 mg/1 and the standard deviation 1s less than themean concentration (858.97 mg/1 +626.6 mg/1).
Of the 65 samples for which TDS concentrations were reported, 48were under 1,000 mg/1, 12 were between 1,000 and 2,000 mg/1, and fivewere greater than 2,000 mg/1. Thus, approximately 74 percent of allreported TDS concentrations 1n Gallup Sandstone wells were under the1,000-rag/l standard of the state regulations. If two anamolously high,and therefore rejected, TDS concentrations are included, 72 percent ofsamples reporting TDS concentrations remain under 1,000 mg/1, while thenumber of samples greater than 2,000 mg/1 Increases from about 8 percentto about 10 percent.
Tafele I. Ranges and wans of sajor chenlcal constituents 1n ground inter 1n the Gallup Sandstone at distance froai the United Nuclear lorp.Owrch Rock Urania Mil. S«c. 2. T16H. RlfU, N.M.P.N. (all concentrations In Milligram per liter except as noted)'.
Per. of Mo. ofRange/Hean Concentrations Record Wel ls
Ranges of concentrations 1990-83 6for all reported data
Mean concentrations andstandard deviations
Ranges of concentrations 1955-82 Zfor all reported data
Mean concentrations andstandard deviations
Ranges of concentrations 1944-77 16for all reported data
Mean concentrations andstandard deviations
Ranges of concentrations 1953-68 11for all reported data
Mtan concentrations andstandard deviations
Wells and springs north 1948-64 6of Sheep Springs, N.M.
Wells east and northeast 1974-78 9of Crowpolnt, N.M.
Wells south, test and 1952-73 20north of Gallup. N.H.
Ranges of concentrations 1948-78 35for all tells >20 ml
Mean concentrations andstandard deviations for all wells >20
Spec.No. of Cond. pHSamples (umhos) (units) TUS SU4 Cl M03-N
Hells within 1 *1 (1.6 ka) of 14.16.2.
35 825.- 6.9- 860.- 198.2- lb.9 <.005-1970. 8.1 1691. 79B. 22.8 1.22
1125.97 7.6 1017.1 523.0 19.4 .54»226.8 + .3 +140.95 «109.3 «1.8 +.S6
Wells 1 «1 (1.6 kji) to 5 •< (8.1 k>) fro* 16.16.2
9 17«0.- 7.2- 1390.- 840.- 11.- .0-3120. H.I 317U. 2160. 16. .6
2450. 7.7 24*9.8 1597. 12.96 .22+947.5 ^.3 +6.16.3 +472.3 +2.1 ^.26
Mel Is 5 nl (8.1 kn) to 15 «1 (24.2 U) fron 16.16.
20 565.- 7.J- 125.- 32.- 3.- .0-1670. 8.8 1020. 514. 153. 11.
1055.3 7.9 658.6 281.4 16.4 .69O26.0 ^.4 +260.2 + H4.9 +34.8 +,.53
Wells 15 Hi (24.2 ba) to 20 »1 (32.3 kn) fron 16.16
12 645.- 7.6- 294.- 59.- 4.5- .0-1120. 8.b 258U. 310. 96. .8
885.8 8.3 750. 1S2. 26.4S .23+229. H j>.49 +62S.I +79. 90 +28.8 ^.27
Wells greater than 20 »1 (32.3 ka) frwa 16.16.2.
6 2160. 7.95 1497.8 675.3 108.8 .95+1242.3 ^.2 +939.4 _+565.1 +99.6+1.4
12 1618.9 7.3 1227.3 776.8 6U.4 .3+609.9 +.4 +442.7 +565. b +106.3 +.56
21 858.2 8.3 502.1 116.9 15. b .7+353.45 +1.0 +247. 2 +8J. 2 +16.3+1.1
39 410.- 7.- 209.- 6.2- 2.- .0-4310. 11.7 3170. 2322. 215. 3.7
1524.45 8.1 8S8.97 393.5 42.2 .63•1 +901.1 +.8 +626.6 +484.7 +75.1 +.99
ft
<.OU.92
.14+.19
•
.0
2.
.02-0.
1.49+2.7*
.2.
.01-
.02
.02+ .01*
.09+ .1J
.07+ .06
.0-
.32
.08_». 1*
Ca
140.
45._»36.
160.,>96.
283.+ 112.
1.14«.
52._»50.
1.42.
11.M2.
34._+J3.
73.+47.
40.j+20.
1.140.
48.+36.
M9
56-
970
-
80
-
495
2-
497
87
999
30
i-
13
1271
20
I1"
89154
118+30
56
17+17
22
4
±*
14+14
22+_U
9+S
3tt
13ni
.-
.4
.0
.-
.8
.1
.5-
.49
.J
.0-
.8
.4
.7
.b
.2
.i
.3
.49
.3-
.9
.2
H
25
3+ 2
5
5+1
210
4+2
7
7
3+1
12+25
70
7+_18
. J-
.95
.9
.9
.07-6.6
.8
.1
.9
.5
.0*
.7
.7
.2
.3
.5
.4
.»-
.7
.u*
Na
276.341.
311.+33.
72.171.
121.+49.
6.^70.
16S.+W>.
87.997.
329.
+^J75.
467.+341.
316.+ttt.
123.+ 106.
37.1040.
258.+2bU.
4-0
70
4
17
-
649*
-
b7«
7U
3b
459d
987*
Mt03
23J.8-3bl.
274.1MS. 2
i09.9-JUU.
259.4+4^.4
135.-458.
2»3.3+90.
182.-7b2.
300.3«l4e.7
361.7+139.3
294. 4b+118.3
299.1+9^.4
145.- _5«7. 00
OD306.8
+10M. 1
' -- Oata based on 115 samples from wells listed 1n Table 1; • -- Total Fe and K + Na concentrations not calculated 1n ranyes or neans.
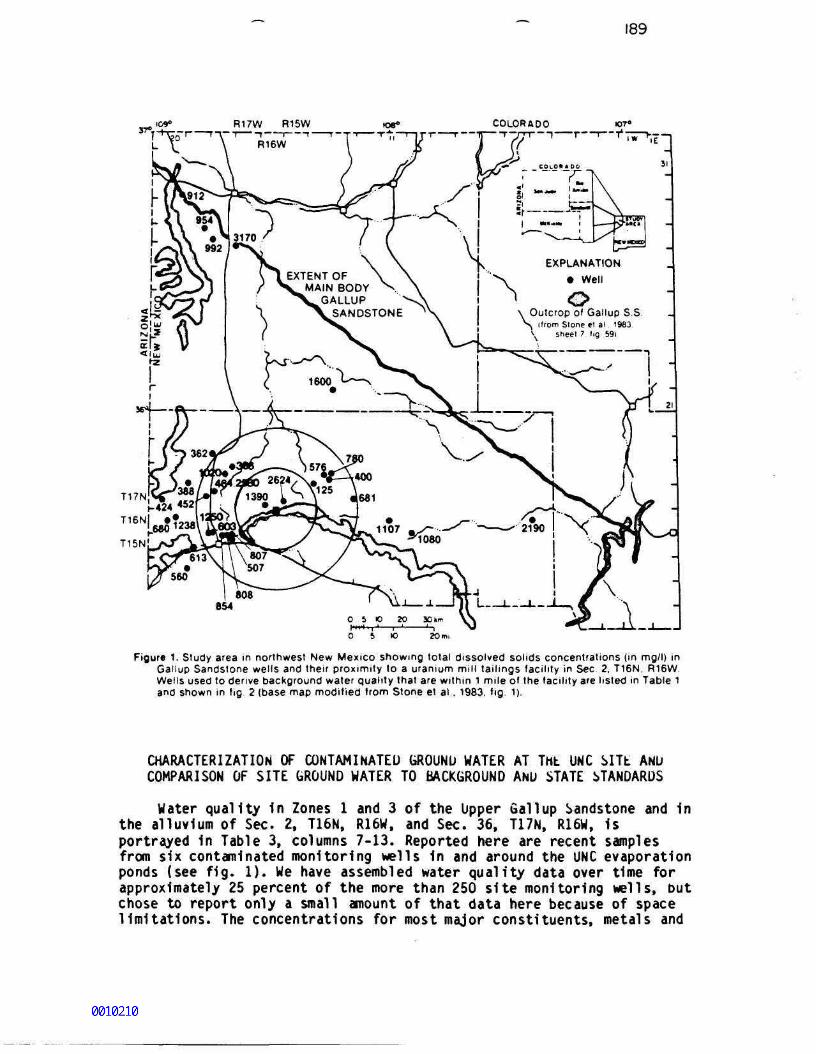
189
, '09° R17W R15W'I r-
R16W
K36» COLORADO1 r-
T17N
T16N
T15N
EXPLANATIONEXTENT OF
MAIN BODYGALLUP
SANDSTONE
Well
oOutcrop of Gallup S.S
(from Stone el al 1983\ sheet 7 lig 59)
B54
2O mi
Figure 1. Study area in northwest New Mexico showing total dissolved solids concentrations (in mg/l) inGallup Sandstone wells and their proximity to a uranium mill tailings facility in Sec 2, T16N, R16W.Wells used to derive background water quality that are within 1 mile of the facility are listed in Table 1and shown in fig 2 (base map modified from Stone et al . 1983. fig. 1).
CHARACTERIZATION OF CONTAMINATED GROUND WATER AT THE UNC SITE ANUCOMPARISON OF SITE GROUND WATER TO BACKGROUND AND STATE STANDARDS
Water quality In Zones 1 and 3 of the Upper Gallup Sandstone and 1nthe alluvium of Sec. 2, T16N, R16W, and Sec. 36, T17N, R16W, Isportrayed In Table 3, columns 7-13. Reported here are recent samplesfrom six contaminated monitoring wells 1n and around the UNC evaporationponds (see fig. 1). We have assembled water quality data over time forapproximately 25 percent of the more than 250 site monitoring wells, butchose to report only a small amount of that data here because of spacelimitations. The concentrations for most major constituents, metals and
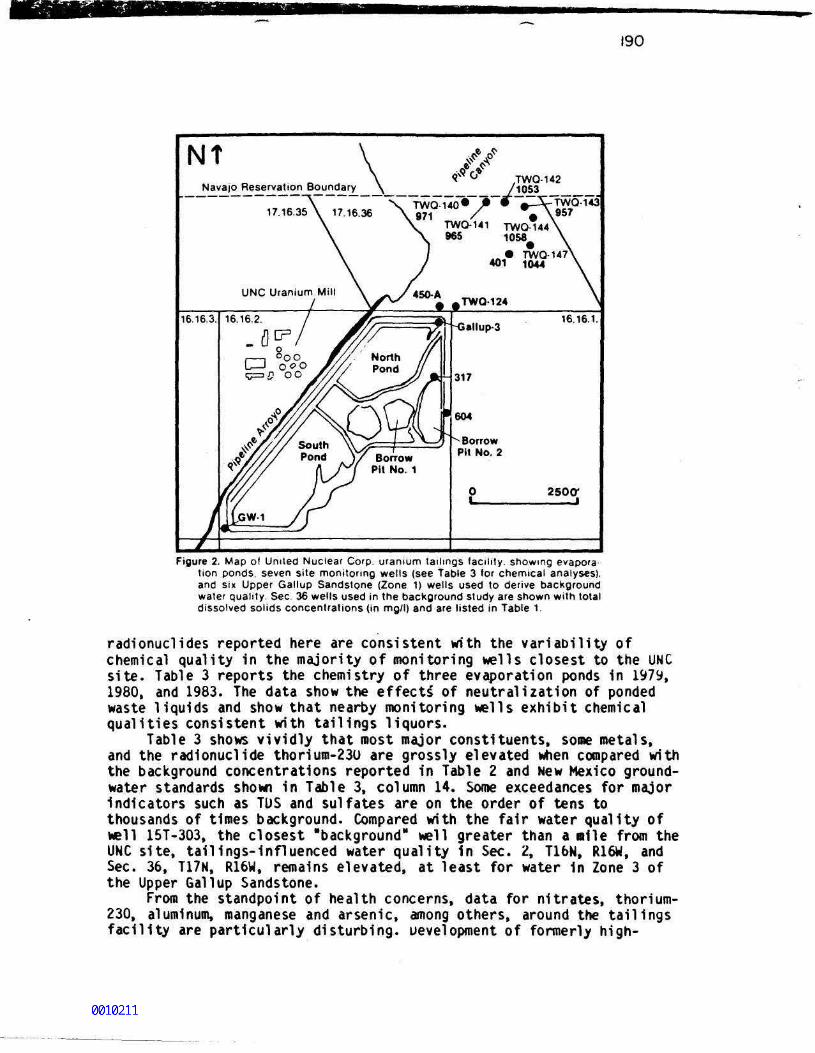
190
Navajo Reservation Boundary
TWQ-140 „971 / 0 \957
TWQ-141 TWQ-144965 1058
Figure 2. Map of United Nuclear Corp. uranium tailings facility, showing evaporation ponds, seven site monitoring wells (see Table 3 for chemical analyses),and six Upper Gallup Sandstone (Zone 1) wells used to derive backgroundwater quality. Sec 36 wells used in the background study are shown with totaldissolved solids concentrations (in mg/l) and are listed in Table 1.
radionuclides reported here are consistent with the variability ofchemical quality in the majority of monitoring wells closest to the UNCsite. Table 3 reports the chemistry of three evaporation ponds in 1979,1980, and 1983. The data show the effects of neutralization of pondedwaste liquids and show that nearby monitoring wells exhibit chemicalqualities consistent with tailings liquors.
Table 3 shows vividly that most major constituents, some metals,and the radionuclide thorium-23U are grossly elevated when compared withthe background concentrations reported in Table 2 and New Mexico ground-water standards show in Table 3, column 14. Some exceedances for majorindicators such as TUS and sulfates are on the order of tens tothousands of times background. Compared with the fair water quality ofwell 15T-303, the closest "background" well greater than a mile from theUNC site, tailings-influenced water quality In Sec. 2, T16N, R16W, andSec. 36, T17N, R16W, remains elevated, at least for water 1n Zone 3 ofthe Upper Gallup Sandstone.
From the standpoint of health concerns, data for nitrates, thorium-230, aluminum, manganese and arsenic, among others, around the tailingsfacility are particularly disturbing. Development of formerly high-
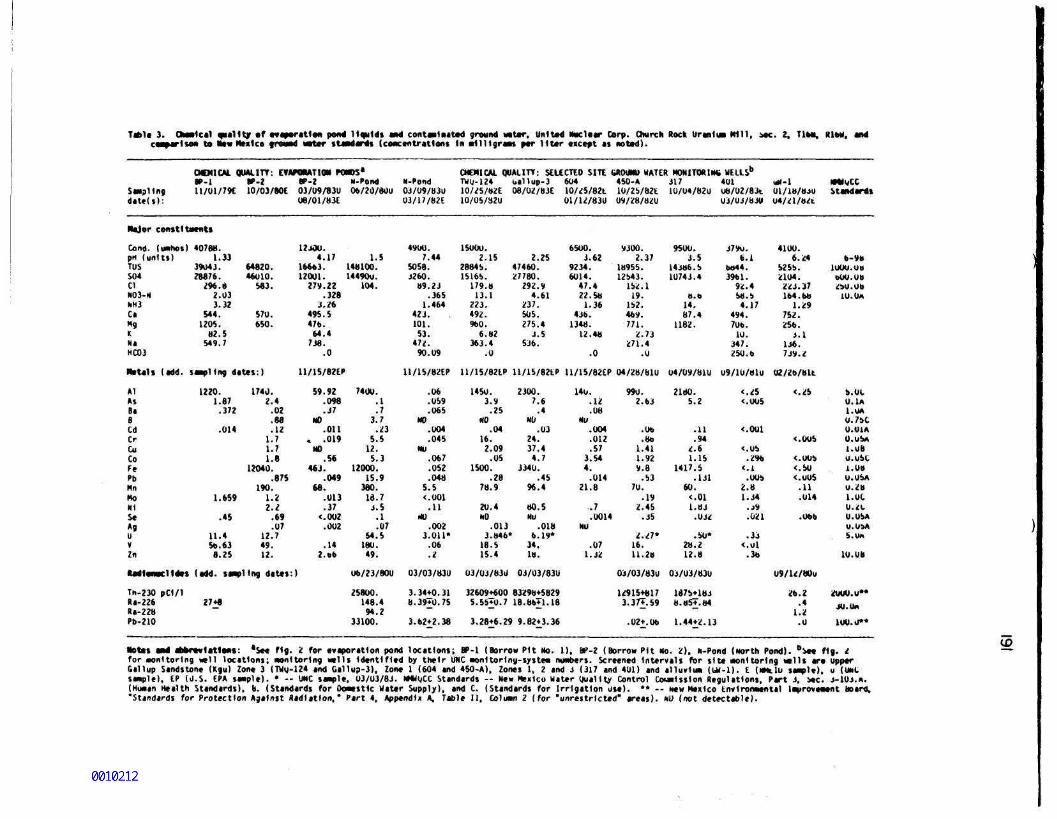
Table 3. Chealcal opallty of evaporation pen* liquid* and contaminated ground water. United Nuclear Corp. Church Rock Uranlw Mill, Me. Z. Tl**. RIM. andcomparison to How Mexico iro«»< tarter standards (concentrations In milligrams per liter except at noted).
Samplingdate(s):
CHEMICAL QUALITY: EVAFOMTIOM PONDS*•P-l V-l BP-2 N-Pond11/01/79E 10/03/80E 03/09/83U 06/20/800
08/01 /83E
N-Pond03/09/83U03/17/S2E
CHEMICAL QUALITY: SELECTED SITE WtOOMU WATER MONITORllMi WELLSb
TWU-124 t.allup-3 604 450-A 317 40110/25/82E 08/02/83E 10/25/82t 10/25/82E 10/04/82U o8/02/83t10/05/82U 01/12/83U 09/28/820 03/OJ/83W
01/18/84U04/21/821
NMJuCCStandards
Major constituents
Cond. (umhos)pH (units)TOSS04ClN03-HNH3CaMgKNlHC03
Natals (add.
AlAsBaBCdCrCuCoFePbMnMoHISe*guyZn
Udlonmclldes
Tn-230 pd/1Ra-226Ra-228Pb-210
40788.1.33
39043.28876.
296.82.033.32
544.1205.
82.5549.7
64820.46010.
583.
570.650.
sampling dates:)
1220.1.87
.372
.014
1.659
.45
11.456.63
8.25
1740.2.4
.02
.88
.121.71.71.8
12040..875
190.1.22.2
.69
.0712.749.12.
12400.4.17
16663.12001.
279.22.328
3.26495.5476.64.4
738..0
11/15/82EP
59.92.098.37
NO.011
. .019NO
.56463.
.04968.
.013
.37<.002.002
.142.«6
(odd. sampling dates:)
27+8
1.5148100.144900.
104.
7400..1.7
3.7.23
5.512.5.3
12000.15.9
380.18.74.5.1.07
54.5180.49.
06/23/800
25800.148.494.2
33100.
4900.7.44
5058.3260.
89.23.365
1.464423.101.53.
472.90.09
11/15/82EP
.06
.059
.065NO
.004
.045NU
.067
.052
.0485.5<.001.11
*.0023.011*
.06
.2
03/03/83U
3.34+0.318.39+0.75
3.62+2.38
15000.2.15 2.25
28845. 47460.15165. 27780.
179.8 292.913.1 4.61
223. 237.492. 505.960. 275.4
6.82 3.5363.4 536.
.0
11/15/821P 11/15/82EP
1450. 2300.3.9 7.6
.25 .4NO NO
.04 .0316. 24.2.09 37.4
.05 4.71500. 3340.
.28 .4578.9 96.4
20.4 80.5NO NU
.013 .0183.846* 6.19*
18.5 34.15.4 18.
03/03/83U 03/03/830
32609+600 83298+58295.55+0.7 18. 0671.18
3.28+6.29 9.82+3.36
65OO.3.62
9234.6014.
47.422.58
1.36436.
1348.12.48
.0
11/15/82CP
140..12.08
Nu.004.012.57
3.544.
.01421.8
.7
.0014NU
.071.32
9300.2.37
18955.12543.
152. 119.
152.469.771.
2.73271.4
.0
04/28/81U
990.2.63
.06
.801.411.929.8.53
70..19
2.45.35
2.27*16.11.28
03/03/830
12915+8173. 37*. 59
.02+^.06
9500.3.5
14386.510743.4
8.014.87.4
1182.
04/09/81U
2180.5.2
.11
.942.61.15
1417.5.131
60.<.011.83.042
.50*28.212.8
03/03/830
1875+184tt.M57.B4
1.44+2.13
379o.6.1
6044.3961.
92.458.54.17
494.706.10.
347.250.6
09/10/81U
<.2S<.005
<.001
<.05.2%
<-l.005
2.81.34.49
.021
.33<.ol.30
4100.6.24
5255.2104.223.37164. 68
1.29752.256.
4.1136.749.2
02/26/8U
<.2S
<.005
«.U05<.50<.005.11.014
.066
09/12/80U
26.2.4
1.2.0
6-901OOO.OB
OOO.OB2*0. Ob10. OH
s.Ot0.1*
1.0*0.7bC0.01AO.Ob*1.08U.obC1.08O.ObA0.28l.OC0.21.O.ObA0.04Ab.UM
10.08
2000.0**
40. OA
loo.o**
•otes and abbreviations: 'See fig. 2 for evaporation pond locations; BP-1 (Borrow PH No. 1), 8P-2 (Borrow Pit No. 2). N-Pond (North Pond), "see fig. lfor oonltortng well locations; Monitoring wills Identified by their UNC nonltortny-syste* numbers. Screened Intervals for site Monitoring veils are upperGallup Sandstone (Kgu) Zone 3 (TWg-124 and Oallup-3). Zone 1 (604 and 450-A). Zones 1, 2 and 3 (317 and 401) and alluvlw (hW-1). £ (NMtlu sarnie), u (outsample). EP (U.S. EPA simple). * -- UNC sample, 03/03/83. NHMO.CC Standards -- New Mexico Water Uuallty Control Cowtsslon Regulations. Part 3. Me. 4-104.«.(Huaan Health Standards), b. (Standards for Oowstlc Water Supply), and C. (Standards for Irrigation use). ** -- New Mexico Environmental lavrovefwnt board.'Standards for Protection Against Radiation,* Part 4, Appendix A, Table II, Coluttn 2 (for "unrestricted" areas). NU (not detectable).
192
quality water supplies within 150 to 250 ft of the surface appears to beprecluded near the tailings due to the presence these toxic materials.
CONCLUSIONS
This study shows that ground water in the Gallup Sandstone rangesfrom fair to good quality throughout the San Juan Basin with the bestwater available near the recharge zones shown in fig. 1. Backgroundwater quality compares favorably with New Mexico's ground-waterprotection standards; 72-74 percent of background IDS concentrations inthe Gallup Sandstone are less than the 1,000-mg/l state standard.
Upper Gallup ground-water chemistry near the UNC mill is grosslydistorted when compared with background and state standards. Theexistence of the tailings facility near an outcrop area in a rechargezone compounds the severity of the contamination problem. Greatlyelevated nitrate, arsenic and thorium-230 levels represent potentialpublic health concerns.
ACKNOWLEDGEMENTS
The authors express their appreciation for the technical assistanceprovided by Richard R. Raymondi, Bruce Gallaher and Dennis McQuillan,NMEID, and Masud Zaman and Najam Tariq, Navajo Water Resources. Supportfor this study was provided in part Dy a grant from the ShalanFoundation, the General Fund of Southwest Research and InformationCenter, and the donations of Mr. Patrick u'Meara.
REFERENCES
Cooley, M. E., Harshbarger, J. W., Akers, d. P., and Hardt, W. F., 1969,Regional hydrogeology of the Navajo and Hopi Indian Reservations,Arizona, New Mexico and Utah: U.S. Geological Survey, Prof. Paper521-A.
Cooper, J. B., and John, E. C., 1968, Geology and ground-wateroccurrence in southeast McKinley County, New Mexico: New MexicoState Engineer, Tech. Rept. 35.
Davis, G. E., Hardt, W. F., Thompson, L. K., and Cooley, M. E., 19b3,Geohydrologic data in the Navajo and Hopi Indian Reservations,Arizona, New Mexico, and Utah, pt. I -- records of ground-watersupplies: Arizona State Land Department, Water Resources Rept.l2-A.
Frenzel, P. F., Craigg, S. D., and Padgett, E. T., 1981, Preliminarydata report for the San Juan Basin-Crownpoint Surveillance Study:U.S. Geological Survey, Open-file Rept. 81-484.
Hiss, W. L., 1975, Evaluation and proposed study of potential ground-
193
water supplies, Gallup area, New Mexico: U.S. Geological Survey,Open-file Rept. 75-522.
Kister, L. R., and Hatchett, J. L., 1963, beohydrologic data in theNavajo and hopi Indian Reservations, Arizona, New Mexico, and Utah,pt. II -- selected chemical analyses of the ground water: ArizonaState Land Department, Water Resources Rept. 12-b.
Link, R. u., and Kelly, T. E., 1980, Aquifers associated with strippablecoal, San Juan Basin, New Mexico: prepared for Mining and MineralsDivision, Energy and Minerals Department, State of New Mexico, byGeohydrology Associates, Inc., Albuquerque, New Mexico.
McGavock, E. H., Edmonds, R. J., Gillespie, E. L., and Halpenny, P. C.,1966, Geohydrologic data in the Navajo and Hopi IndianReservations, Arizona, New Mexico, and Utah, pt. I-A, supplementalrecords of ground-water supplies: Arizona State Land Department,Water Resources Rept. 12-L.
Mercer, J. W., and Cooper, J. B., 1970, Availability of ground water inthe Gallup-Tohatchi area, McKinley County, New Mexico: U.S.Geological Survey, Open-file Kept.
New Mexico Environmental Improvement Division, 1976-1983, Ground-waterquality monitoring files for United Nuclear Corp. Northeast ChurchRock Uranium Mill, Ground Water Quality and Hazardous Waste Bureau.
New Mexico Water Quality Control Commission, 1982, New Mexico WaterQuality Control Commission Regulations, rev. Sept. 20, 1982.
Raymondi, R. R., and Conrad, R. C., 1983, Hydrogeology of PipelineCanyon, near Gallup, New Mexico: Ground Water, v. 21, no. 2.
Shomaker, J. W., 1971, Water resources of Fort Wingate Army L/epot andadjacent areas, McKinley County, New Mexico: U.S. GeologicalSurvey, Open-file Rept. MK-32.
Shuey, C., 1982, Accident left long-term contamination of Rio Puerco,but seepage problem consumes New Mexico's response: Mine Talk(Southwest Research and Information Center), v. 2, nos. 1-2.
Stone, W. J., Lyford, F. P., Frenzel, P. F., Mizell, N. H., and Padgett,E. T., 1983, Hydrogeology and water resources of San Juan Basin,New Mexico: New Mexico Bureau of Miners and Mineral Resources,Hydrologic Rept. 6.
Thiele, H. J., 1966, Navajo water resources, supplies and management,and the proposed Navajo Tribal Water Authority (NTWA): prepared forNavajo Tribal Council.


![[RIO PUERCO MONITORING PROGRAM EXECUTIVE SUMMARY] · 2020. 11. 15. · Puerco at the border is predominantly determined by the mine dewatering discharges. Analyses of Rio Puerco water](https://img.pdfslide.net/doc/110x75/60d3f5680c2e0768544e8e80/rio-puerco-monitoring-program-executive-summary-2020-11-15-puerco-at-the.jpg)


![Ciencia y Tecnología de Alimentos IV [Laboratorio "QUESO DE PUERCO"]](https://img.pdfslide.net/doc/110x75/557eadb1d8b42ab1018b5062/ciencia-y-tecnologia-de-alimentos-iv-laboratorio-queso-de-puerco.jpg)