Embed Size (px)
Citation preview

Pull, Push, Pipes: Sustainable Capital Flows for a New World Order
Mark Carney
Governor, Bank of England
6th June 2019
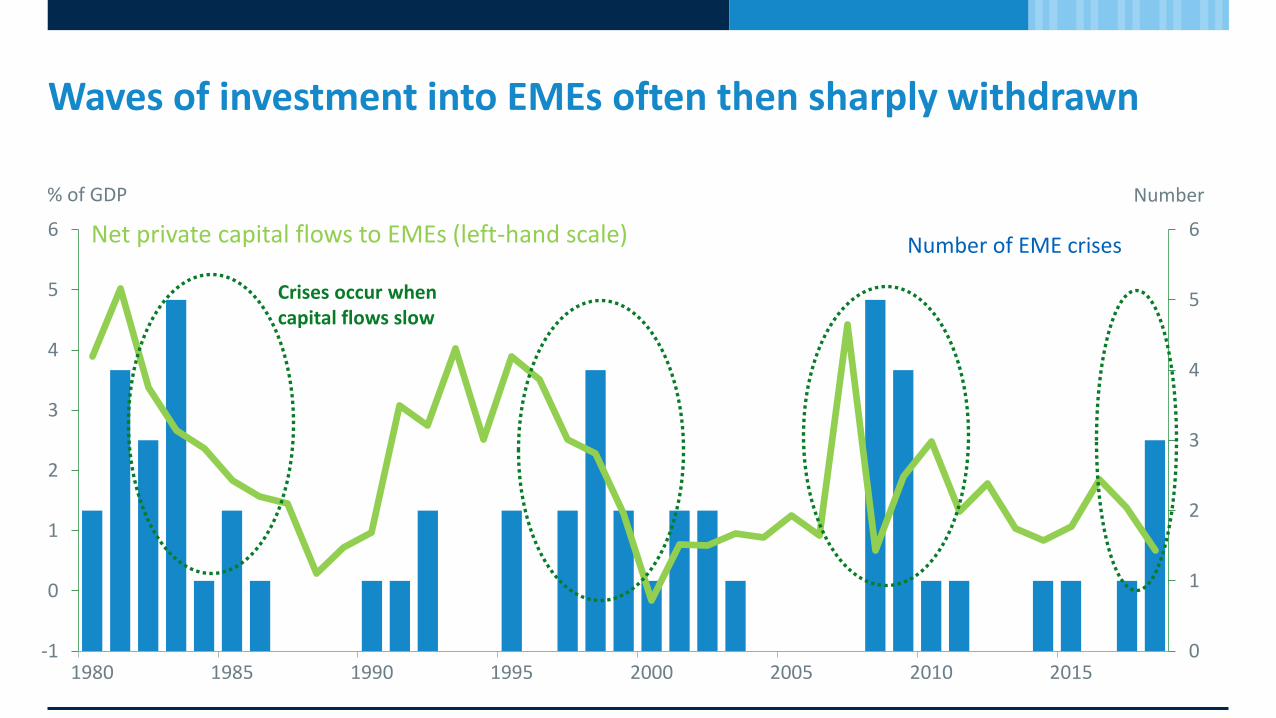
Waves of investment into EMEs often then sharply withdrawn
-1
0
1
2
3
4
5
6
0
1
2
3
4
5
6
1980 1985 1990 1995 2000 2005 2010 2015
Number% of GDP
Crises occur when capital flows slow
Number of EME crisesNet private capital flows to EMEs (left-hand scale)

EMEs have increased financial openness by considerably less than AEs
0
50
100
150
200
250
300
1980 1985 1990 1995 2000 2005 2010 2015
External liabilities as % of GDP
Emerging market economies
Advanced economies

A holistic Capital Flows-at-Risk frameworkPull, Push, Pipes
Pull factorsDomestic institutional frameworks
The PipesStructure of the global financial system
Push factorsDeterminants of global risk appetite and conditions

The distribution of capital flows to emerging market economies
Negative pull shock
Unconditional distribution
Probability density
Capital flows as a % of GDP
-8 -6 -4 -2 0 2 4 6 8 10 12 14 16 18
0.00
0.02
0.04
0.06
0.08
0.10
0.12
AB

Reducing reliance on foreign investors and foreign currency borrowing dampens capital flow volatility
0.0
0.5
1.0
1.5
2.0
0 5 10 15 20 25 30 35 40 45 50
Volatility of capital flows
Share of non-financial corporate debt denominated in $
Higher share of $ debt is associated with greater volatility
NFC dollar debt (% of NFC total debt)

-4
-2
0
2
1996 1999 2002 2005 2008 2011 2014 2017
Capital Flows-at-Risk as a % of GDP
Improving Pull Factors have reduced Capital Flows-at-RiskG
ross
infl
ow
sG
ross
ou
tflo
ws
Contribution of pull factors
Average Capital Flows-at-Risk

Share of FX-denominated debt has increased sharply
12
13
14
15
16
17
18
19
20
21
22
95 97 99 01 03 05 07 09 11 13 15 17
Per cent of GDPEM (excluding China) – FX debt of non-bank borrowers
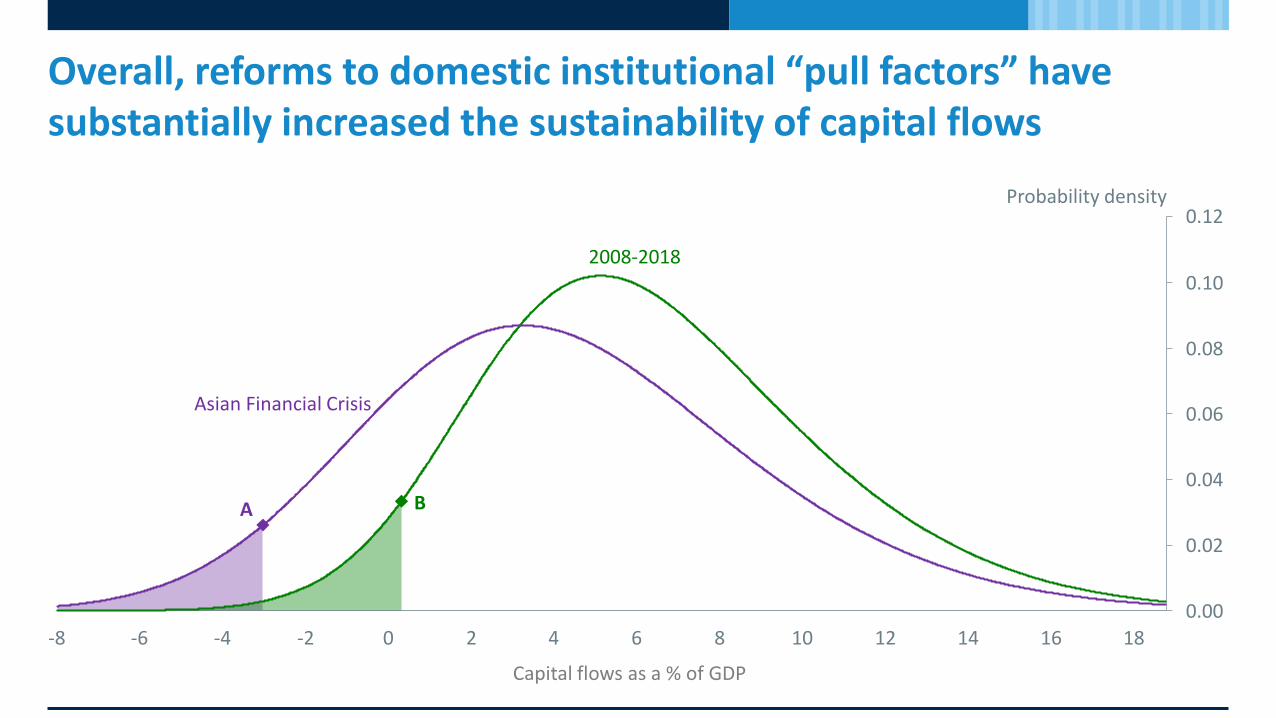
Overall, reforms to domestic institutional “pull factors” have substantially increased the sustainability of capital flows
Probability density
Capital flows as a % of GDP
-8 -6 -4 -2 0 2 4 6 8 10 12 14 16 18
0.00
0.02
0.04
0.06
0.08
0.10
0.12
Asian Financial Crisis
2008-2018
A B

Global economy is rapidly becoming multi-polar, while the transition of the international monetary financial system has barely begun
US dollar share of global markets
US share of the global economy

-8
-6
-4
-2
0
2
1996 1999 2002 2005 2008 2011 2014 2017
Capital Flows-at-Risk as a % of GDP
Impact of push factors has increasedG
ross
infl
ow
sG
ross
ou
tflo
ws
Contribution of pull factors
Contribution of push factors
Total Capital Flows-at-Risk

Push factors weighed more heavily over the past decade, offsetting some of the improvement in pull factors
Probability density
Capital flows as a % of GDP
-8 -6 -4 -2 0 2 4 6 8 10 12 14 16 18
0.00
0.02
0.04
0.06
0.08
0.10
0.12
2008-2018 distribution
Negative push shock
AB

Market-based finance accounted for all the increase in foreign lending to EMEs since crisis as bank lending has declined
Bank
36.4%
18.5%
4.6%
40.5%
Market-basedFund
Market-basedNon-Fund
Bank
FDI
24.0% 23.0%
9.4%
43.6%
Market-basedFund
Market-basedNon-Fund
Bank
FDI
FDI Market-based Non-fund Market-based Fund
20172008

Market-based finance and investment fund flows more volatile than other types of flows
Market-based finance
-5
-4
-3
-2
-1
0
FDI Banking MBF of which: Mutual funds
Median
5th percentile
% of GDP
of which: investment funds

Structural changes in the global financial system are increasing Capital Flows-at-Risk
-4
-3
-2
-1
1
2006 2018 2030a 2030b
Capital Flows-at-Risk as a % of GDP
Pre-crisis baseline
∆ FX share
∆ Flow composition
∆ Mutual funds
Total
Impact of the increasing role of investment funds
Impact of the shift towards market-based finance
Impact of a higher share of FX-denominated debt in EMs
Total
2030 excluding growth in EME external balance
sheets
2030 including growth in EME external balance
sheets

Global financial safety net more fragmented and less reliable
0
2
4
6
8
10
12
0
1
2
3
1980 1982 1984 1986 1988 1990 1992 1994 1996 1998 2000 2002 2004 2006 2008 2010 2012 2014 2016
IMF Permanent IMF Temporary
RFAs FX Reserves (lhs)
Per cent of global external liabilities
Per cent of global external liabilities (rhs)
(rhs)(rhs)

Macroprudential policy in EMEs can reduce Capital Flows-at-Risk
Probability density
Capital flows as a % of GDP
-8 -6 -4 -2 0 2 4 6 8 10 12 14 16 18
0.00
0.02
0.04
0.06
0.08
0.10
0.12
Average macro-prudential stance
AB
Tighter macro-prudential stance

Pull, Push, Pipes: Sustainable Capital Flows for a New World Order
Mark Carney
Governor, Bank of England
6th June 2019