Embed Size (px)
Citation preview
Please cite this article in press as: Carpenter et al., Pulling out the 1%: Whole-Genome Capture for the Targeted Enrichment of Ancient DNASequencing Libraries, The American Journal of Human Genetics (2013), http://dx.doi.org/10.1016/j.ajhg.2013.10.002
ARTICLE
Pulling out the 1%: Whole-Genome Capturefor the Targeted Enrichmentof Ancient DNA Sequencing Libraries
Meredith L. Carpenter,1 Jason D. Buenrostro,1,14 Cristina Valdiosera,2,3,14 Hannes Schroeder,2
Morten E. Allentoft,2 Martin Sikora,1 Morten Rasmussen,2 Simon Gravel,4 Sonia Guillen,5
Georgi Nekhrizov,6 Krasimir Leshtakov,7 Diana Dimitrova,6 Nikola Theodossiev,7 Davide Pettener,8
Donata Luiselli,8 Karla Sandoval,1 Andres Moreno-Estrada,1 Yingrui Li,9 Jun Wang,9,10,11,12
M. Thomas P. Gilbert,2,13 Eske Willerslev,2,15 William J. Greenleaf,1,15,* and Carlos D. Bustamante1,15,*
Most ancient specimens contain very low levels of endogenous DNA, precluding the shotgun sequencing of many interesting samples
because of cost. Ancient DNA (aDNA) libraries often contain<1% endogenous DNA, with the majority of sequencing capacity taken up
by environmental DNA. Here we present a capture-based method for enriching the endogenous component of aDNA sequencing
libraries. By using biotinylated RNA baits transcribed from genomic DNA libraries, we are able to capture DNA fragments from across
the human genome. We demonstrate this method on libraries created from four Iron Age and Bronze Age human teeth from Bulgaria,
as well as bone samples from seven Peruvian mummies and a Bronze Age hair sample from Denmark. Prior to capture, shotgun
sequencing of these libraries yielded an average of 1.2% of reads mapping to the human genome (including duplicates). After capture,
this fraction increased substantially, with up to 59% of reads mapped to human and enrichment ranging from 6- to 159-fold. Further-
more, we maintained coverage of the majority of regions sequenced in the precapture library. Intersection with the 1000 Genomes
Project reference panel yielded an average of 50,723 SNPs (range 3,062–147,243) for the postcapture libraries sequenced with 1 million
reads, compared with 13,280 SNPs (range 217–73,266) for the precapture libraries, increasing resolution in population genetic analyses.
Our whole-genome capture approach makes it less costly to sequence aDNA from specimens containing very low levels of endogenous
DNA, enabling the analysis of larger numbers of samples.
Introduction
With the advent of next-generation sequencing tech-
niques and the rapidly declining cost of sequencing, the
field of hominin paleogenetics has begun to transition
from focusing on PCR-amplified mitochondrial DNA and
Y chromosomal markers to shotgun sequencing of the
whole genome.1–8 The use of autosomal DNA is advan-
tageous because it provides information about the genome
as a whole, whereas the mitochondrial DNA (mtDNA)
and Y chromosome, as nonrecombining markers, repre-
sent only a single maternal or paternal lineage. Whole-
genome sequencing of single ancient genomes, including
Neandertals,1 Denisovan,7,9 a Paleo-Eskimo,2 the Tyro-
lean Iceman,4 and an Australian Aborigine,3 have trans-
formed our understanding of human migrations and
revealed previously unknown admixture among ancient
populations.
Importantly, most of these specimens were exceptional
in their levels of preservation: the Neandertal and Deniso-
1Department of Genetics, Stanford University School of Medicine, Stanford
Denmark, Copenhagen 1350, Denmark; 3Department of Archaeology, Environ
La Trobe University, Melbourne, VIC 3086, Australia; 4Department of Hum
Montreal, QC H3A 0G1, Canada; 5Centro Mallqui, Calle Ugarte y Moscoso 165
tute of Archaeology, Sofia 1000, Bulgaria; 7Department of Archaeology, Sofia Un
Biologiche, Geologiche e Ambientali (BiGeA), Universita di Bologna, Via Selmi
Abdulaziz University, Jeddah 21589, Saudi Arabia; 11Department of Biology, Un
of Science and Technology, Taipa, Macau 999078, China; 13Ancient DNA Lab14These authors contributed equally to this work15These authors contributed equally to this work and are co-senior authors
*Correspondence: [email protected] (W.J.G.), [email protected] (C.D.B.
http://dx.doi.org/10.1016/j.ajhg.2013.10.002. �2013 by The American Societ
The Am
AJHG 1
van bones, found in caves, contained ~1%–5%1 and
70%7,9 endogenous DNA, respectively, and the Paleo-
Eskimo and Aborigine genomes were obtained from
hair specimens, which generally contain lower levels of
contamination10 but are not available in most archaeolog-
ical contexts. Indeed, sequencing libraries derived from
bones and teeth from temperate environments typically
contain <1% endogenous DNA,6 with the remaining
~99% primarily consisting of DNA from environmental
contaminants such as bacteria and fungi. Although some
samples with 1%–2% endogenous DNA can still, with
sufficient sequencing, yield enough information for
population genetic analyses,5,6 the required amount of
sequencing of specimens with less endogenous DNA is
costly and thus untenable for many researchers. Ancient
DNA (aDNA) researchers have begun to address this issue
for hominin genomes by using targeted capture to enrich
for only the mtDNA, selected regions of the genome,
or a single chromosome.8,11–13 However, because of the
highly fragmented nature of aDNA, an ideal enrichment
, CA 94305, USA; 2Centre for GeoGenetics, Natural History Museum of
ment, and Community Planning, Faculty of Humanities and Social Sciences,
an Genetics and Genome Quebec Innovation Centre, McGill University,
, San Isidro, Lima 27, Peru; 6Bulgarian Academy of Sciences, National Insti-
iversity St. Kliment Ohridski, Sofia 1504, Bulgaria; 8Dipartimento di Scienze
3, 40126 Bologna, Italy; 9BGI-Shenzhen, Shenzhen 518083, China; 10King
iversity of Copenhagen, Copenhagen 2200, Denmark; 12Macau University
oratory, Murdoch University, South Street, Perth, WA 6150, Australia
)
y of Human Genetics. All rights reserved.
erican Journal of Human Genetics 93, 1–13, November 7, 2013 1
537

Figure 1. Schematic of the Whole-Genome In-Solution Capture ProcessTo generate the RNA ‘‘bait’’ library, a human genomic library is created via adapters containing T7 RNA polymerase promoters (greenboxes). This library is subjected to in vitro transcription via T7 RNA polymerase and biotin-16-UTP (stars), creating a biotinylatedbait library. Meanwhile, the ancient DNA library (aDNA ‘‘pond’’) is prepared via standard indexed Illumina adapters (purple boxes).These aDNA libraries often contain <1% endogenous DNA, with the remainder being environmental in origin. During hybridization,the bait and pond are combined in the presence of adaptor-blocking RNA oligos (blue zigzags), which are complimentary to the indexedIllumina adapters and thus prevent nonspecific hybridization between adapters in the aDNA library. After hybridization, the bio-tinylated bait and bound aDNA is pulled downwith streptavidin-coatedmagnetic beads, and any unboundDNA is washed away. Finally,the DNA is eluted and amplified for sequencing.
Please cite this article in press as: Carpenter et al., Pulling out the 1%: Whole-Genome Capture for the Targeted Enrichment of Ancient DNASequencing Libraries, The American Journal of Human Genetics (2013), http://dx.doi.org/10.1016/j.ajhg.2013.10.002
technique would target as much of the endogenous
genome as possible so as not to discard any potentially
informative sequences.
In the present study, we use a method we call whole-
genome in-solution capture (WISC) as an unbiased means
to increase the proportion of endogenous DNA in aDNA
sequencing libraries. To target as much of the remaining
endogenous DNA as possible, we created human genomic
DNA ‘‘bait’’ libraries from a modern reference individual
with adapters containing T7 RNA polymerase promoters
(see Material and Methods). We then performed in vitro
transcription of these libraries with biotinylated UTP, pro-
ducing RNA baits covering the entire human genome.
Analogous to current exome capture technologies,14 these
baits were hybridized to aDNA libraries in solution and
2 The American Journal of Human Genetics 93, 1–13, November 7, 2
AJHG 1537
pulled down with magnetic streptavidin-coated beads.
The unbound, predominantly nonhuman DNA was then
washed away, and the captured endogenous human DNA
was eluted and amplified for sequencing. Figure 1 shows
a schematic overview of the WISC process, including the
creation of the RNA bait libraries. By using both baits
and adaptor-blocking oligos made from RNA, we were
able to remove any residual baits and blockers by RNase
treatment prior to PCR amplification.
Material and Methods
Ancient SpecimensThe four Bulgarian teeth used in this study were obtained from
four different excavations.
013
Please cite this article in press as: Carpenter et al., Pulling out the 1%: Whole-Genome Capture for the Targeted Enrichment of Ancient DNASequencing Libraries, The American Journal of Human Genetics (2013), http://dx.doi.org/10.1016/j.ajhg.2013.10.002
Sample P192-1 was found at the site of a pit sanctuary near
Svilengrad, Bulgaria, excavated between 2004 and 2006.15 The
pits are associated with the Thracian culture and date to the Early
Iron Age (800–500 BC) based on pottery found in the pits. A
total of 67 ritual pits, including 16 pits containing human skele-
tons or parts of skeletons, were explored during the excavations.
An upper wisdom tooth from an adult male was used for DNA
analysis.
Sample T2G2 was found in a Thracian tumulus (burial mound)
near the village of Stambolovo, Bulgaria. Two small tumuli dating
to the Early Iron Age (850–700 BC) were excavated in 2008.16 A
canine tooth from an inhumation burial of a child (c.12 years
old) inside a dolium was used for DNA analysis.
Sample V2 was found in a flat cemetery dating to the Late
Bronze Age (1500–1100 BC) near the village of Vratitsa, Bulgaria.
Nine inhumation burials were excavated between 2003 and
2004.17 A molar from a juvenile male (age 16–17) was used for
DNA analysis.
Sample K8 was found in the Yakimova Mogila Tumulus, which
dates to the Iron Age (450–400 BC), near Krushare, Bulgaria. An
aristocratic inhumation burial containing rich grave goods was
excavated in 2008.18 A molar from one individual, probably
male, was used for DNA analysis.
Other specimens are as follows.
Sample M4 is an ancient hair sample obtained from the Borum
Eshøj Bronze Age burial in Denmark. The burial comprised three
individuals in oak coffins, commonly referred to as ‘‘the woman,’’
‘‘the young man,’’ and ‘‘the old man.’’ The M4 sample is from the
latter. The site was excavated in 1871–1875 and the coffins dated
to c.1350 BC.19
Samples NA39-50 were obtained from pre-Columbian Chacha-
poyan and Chachapoya-Inca remains dating between 1000 and
1500 AD. They were recovered from the site Laguna de los
Condores in northeastern Peru.20 Bone samples were used for
DNA analysis.
DNA Extraction and aDNA Library PreparationAll DNA extraction and initial library preparation steps (prior to
amplification) were performed in the dedicated clean labs at the
Centre for GeoGenetics in Copenhagen, Denmark, via established
procedures to prevent contamination, including the use of in-
dexed adapters and primers during library preparation.2,21,23 The
lab work was conducted over an extended time period and by a
number of different researchers, which is why the exact protocols
vary somewhat between samples.
Bulgarian Samples
The surface of each tooth was wiped with a 10% bleach solution
and then UV irradiated for 20 min. Part of the root was then
excised and the inside of the tooth was drilled to produce approx-
imately 200 mg of powder. DNA was isolated with a previously
described silica-based extraction method.24 The purified DNA
was subjected to end repair and dA-tailing with the Next End
Prep Enzyme Mix (New England Biolabs) according to the manu-
facturer’s instructions. Next, ligation to Illumina PE adapters (Illu-
mina) was performed by mixing 25 ml of the end repair/dA-tailing
reaction with 1 ml of PE adapters (5 mM) and 1 ml of Quick T4 DNA
Ligase (NEB). The mixture was incubated at 25�C for 10 min and
then purified with a QIAGEN MinElute spin column according
to the manufacturer’s instructions (QIAGEN). Finally, the libraries
were amplified by PCR by mixing 5 ml of the DNA library template
with 5 ml 103 PCR buffer, 2 ml MgCl2 (50 mM), 2 ml BSA
(20 mg/ml), 0.4 ml dNTPs (25 mM), 1 ml each primer (10 mM,
The Am
AJHG 1
inPE þ multiplex indexed23), and 0.2 ml of Platinum Taq High Fi-
delity Polymerase (Invitrogen/Life Technologies). The PCR condi-
tions were as follows: 94�C/5min; 25 cycles of 94�C/30 s, 60�C/20s, 68�C/20 s; 72�C/7min. The resulting libraries were purified with
QiaQuick spin columns (QIAGEN) and eluted in 30 ml EB buffer.
Peruvian Bone Samples
DNA was isolated from seven bone samples via a previously
described silica-based extraction method.24 DNA was further con-
verted into indexed Illumina libraries with 20 ml of each DNA
extract with the NEBNext DNA Library Prep Master Mix Set for
454 (NEB) according to the manufacturer’s instructions, except
that SPRI bead purificationwas replaced byMinElute silica column
purification (QIAGEN). Illumina multiplex blunt end adapters
were used for ligation at a final concentration of 1.0 mM in a final
volume of 25 ml. The Bst Polymerase fill-in reaction was inacti-
vated after 20 min of incubation by freezing the sample. Library
preparation was followed by a two-step PCR amplification. Ampli-
fication of purified libraries was done with Platinum Taq High
Fidelity DNA Polymerase (Invitrogen) with a final mixture of
103 High Fidelity PCR Buffer, 50 mM magnesium sulfate,
0.2 mM dNTP, 0.5 mMMultiplexing PCR primer 1.0, 0.1 mMMulti-
plexing PCR primer 2.0, 0.5 mM PCR primer Index, 3% DMSO,
0.02 U/ml Platinum Taq High Fidelity Polymerase, 5 ml of template,
and water to 25 ml final volume.23 Three PCR reactions were done
for each library with the following PCR conditions: a 3 min activa-
tion step at 94�C, followed by 14 cycles of 30 s at 94�C, 20 s at
60�C, 20 s at 68�C, with a final extension of 7 min at 72�C. Allthree reactions per library were purified with QIAGEN MinElute
columns and pooled into one single reaction. A second PCR was
performed with the same conditions as before but with 22 cycles.
One reaction per library was then performed with 10 ml from the
purified pool of the three previous reactions. Libraries were run
on a 2% agarose gel and gel purified with a QIAGEN gel extraction
kit according to the manufacturer’s instructions.
Danish Hair Sample
DNA was extracted from 70 mg of hair with phenol-chloroform
combined with MinElute columns from QIAGEN as previously
described.3 While fixed on silica filters, the DNA was purified
sequentially with AW1/AW2 wash buffers (QIAGEN Blood and
Tissue Kit), Salton buffer (MP Biomedicals), and PE buffer, before
being eluted in 60 ml EB buffer (both QIAGEN). Then, 20 ml of
DNA extract was built into a blunt-end NGS library with the
NEBNext DNA Sample PrepMaster Mix Set 2 (E6070) and Illumina
specific adapters.23 The libraries were prepared according to man-
ufacturer’s instructions, with a few modifications outlined below.
The initial nebulization step was skipped because of the frag-
mented nature of ancient DNA. End-repair was performed in
25 ml reactions with 20 ml of DNA extract. This was incubated for
20 min at 12�C and 15 min at 37�C and purified with PN buffer
with QIAGEN MinElute spin columns and eluted in 15 ml. After
end-repair, Illumina-specific adapters (prepared as in Meyer and
Kircher23) were ligated to the end-repaired DNA in 25 ml reactions.
The reaction was incubated for 15 min at 20�C and purified with
PB buffer on QIAGEN MinElute columns before being eluted in
20 ml EB Buffer. The adaptor fill-in reaction was performed in a
final volume of 25 ml and incubated for for 20 min at 37�C fol-
lowed by 20 min at 80�C to inactivate the Bst enzyme. The entire
DNA library (25 ml) was then amplified and indexed in a 50 ml PCR
reaction, mixing with 5 ml 103 PCR buffer, 2 ml MgSO4 (50 mM),
2 ml BSA (20 mg/ml), 0.4 ml dNTPs (25 mM), 1 ml of each primer
(10 mM, inPE forward primer þmultiplex indexed reverse primer),
and 0.2 ml Platinum Taq High Fidelity DNA Polymerase
erican Journal of Human Genetics 93, 1–13, November 7, 2013 3
537
Please cite this article in press as: Carpenter et al., Pulling out the 1%: Whole-Genome Capture for the Targeted Enrichment of Ancient DNASequencing Libraries, The American Journal of Human Genetics (2013), http://dx.doi.org/10.1016/j.ajhg.2013.10.002
(Invitrogen). Thermocycling was carried out with 5 min at 95�C,followed by 25 cycles of 30 s at 94�C, 20 s at 60�C, and 20 s at
68�C, and a final 7 min elongation step at 68�C. The amplified
library was then purified with PB buffer on QIAGENMinElute col-
umns, before being eluted in 30 ml EB.
Preparation of RNA Bait LibrariesCreation of Human Genomic DNA Libraries with T7 Adapters
Five micrograms of human DNA (HapMap individual NA21732, a
Masai male) was sheared on a Covaris S2 instrument with the
following conditions: 8 min at 10% duty cycle, intensity 5, 200
cycles/burst, frequency sweeping. The resulting fragmented DNA
(~150–200 bp average size, range 100–500) was subjected to end
repair and dA-tailing by a KAPA library preparation kit (KAPA)
according to the manufacturer’s protocol. Ligation was also per-
formed with this kit, but with custom adapters. T7 adaptor oligos
1 and 2 (50-GATCTTAAGGCTAGAGTACTAATACGACTCACTATA
GGG*T-30 and 50-P-CCCTATAGTGAGTCGTATTAGTACTCTAGCC
TTAAGATC-30) were annealed by mixing a 12.5 ml of each
200 mM oligo stock with 5 ml of 103 buffer 2 (NEB) and 20 ml of
H2O. This mixture was heated to 95�C for 5 min, then left on
the bench to cool to room temperature for approximately 1 hr.
One microliter of this T7 adaptor stock was used for the ligation
reaction, again according to the library preparation kit instruc-
tions (KAPA). The libraries were then size selected on a 2% agarose
gel to remove unligated adapters and select for fragments ~200–
300 bp in length (inserts ~120–220 bp). After gel extraction with
a QIAquick Gel Extraction kit (QIAGEN), the libraries were PCR
amplified in four separate reactions with the following compo-
nents: 25 ml 23 HiFi HotStart ReadyMix (KAPA), 20 ml H2O, 5 ml
PCR primer (50-GATCTTAAGGCTAGAGTACTAATACGACTCAC
TATAGGG*T-30, same as T7 oligo 1 above, 10 mM stock), and 5 ml
purified ligation mix. The cycling conditions were as follows:
98�C/1 min, 98�C/15 s; 10 cycles of 60�C/15 s, 72�C/30 s; 72�C/5 min. The reactions were pooled and purified with AMPure XP
beads (Beckman Coulter), eluting in 25 ml H2O.
In Vitro Transcription of Bait Libraries
To transcribe the bait libraries into biotinylated RNA, we assem-
bled the following in vitro transcription reaction mixture: 5 ml
amplified library (~500 ng), 15.2 ml H2O, 10 ml 53 NASBA buffer
(185 mM Tris-HCl [pH 8.5], 93 mM MgCl2, 185 mM KCl, 46%
DMSO), 2.5 ml 0.1 M DTT, 0.5 ml 10 mg/ml BSA, 12.5 ml 10 mM
NTP mix (10 mM ATP, 10 mM CTP, 10 mM GTP, 6.5 mM UTP,
3.5 mM biotin-16-UTP), 1.5 ml T7 RNA Polymerase (20 U/ml,
Roche), 0.3 ml Pyrophosphatase (0.1 U/ml, NEB), and 2.5 ml
SUPERase-In RNase inhibitor (20 U/ml, Life Technologies). The
reaction was incubated at 37�C overnight, treated for 15 min at
37�C with 1 ml TURBO DNase (2 U/ml, Life Technologies), and
then purified with an RNeasy Mini kit (QIAGEN) according
to the manufacturer’s instructions, eluting twice in the same
30 ml of H2O. A single reaction produced ~50 mg of RNA. The
size of the RNA was checked by running ~100 ng on a 5% TBE/
Urea gel and staining with ethidium bromide. For long-term stor-
age, 1.5 ml of SUPERase-In was added, and the RNA was stored
at �80�C.Preparation of RNA Adaptor-Blocking Oligos
All of the aDNA libraries that we used for testing the enrichment
protocol contained indexed multiplex adapters (see ‘‘DNA Extrac-
tion and Library Preparation’’ above). To block these sequences
and prevent nonspecific binding during capture, we created
adaptor-blocking RNA oligos, which can be produced in large
amounts and are easy to remove by RNase treatment when capture
4 The American Journal of Human Genetics 93, 1–13, November 7, 2
AJHG 1537
is complete. The following oligonucleotides were annealed as
described above: T7 universal promoter (50-AGTACTAATACGACT
CACTATAGG-30)þ eitherMultiplex-block-P5 (50-AGATCGGAAGA
GCGTCGTGTAGGGAAAGAGTGTAGATCTCGGTGGTCGCCGTA
TCATTCCTATAGTGAGTCGTATTAGTACT-30) or Multiplex-block-
P7 (50-AGATCGGAAGAGCACACGTCTGAACTCCAGTCACNNN
NNNATCTCGTATGCCGTCTTCTGCTTGCCTATAGTGAGTCGTA
TTAGTACT-30), the latter containing random nucleotides at the
site of the index sequence, which allows the same adaptor-block-
ing oligos to be used for all libraries.
For each of these double-stranded oligonucleotide solutions,
700 ng was subjected to in vitro transcription with a T7 High-Yield
RNA Synthesis kit (NEB) according to the manufacturer’s instruc-
tions. After treatment with 1 ml of TURBO DNase (37�C/15 min),
the RNA was purified with an RNeasy Mini kit according to the
manufacturer’s instructions, except that 675 ml of ethanol (instead
of 250 ml) was added at step 2 of the protocol to ensure the reten-
tion of small RNAs. The RNA was eluted in 30 ml H2O, to which
1.5 ml of SUPERase-In was added prior to storage at �80�C.
DNA CaptureHybridization
The in-solution capture method was adapted from a protocol for
exome capture.14 For the ancient DNA ‘‘pond’’ (the mixture to
which the RNA bait will be hybridized), 27 ml of each aDNA library
(81–550 ng depending on the library) was mixed with 2.5 ml
humanCot-1 DNA (1mg/ml, Life Technologies) and 2.5 ml salmon
sperm DNA (10 mg/ml, Life Technologies) in 200 ml PCR tubes.
The RNA baits and adaptor-blocking oligos were mixed in a sepa-
rate 1.5 ml tube as follows: for each capture, 1 ml (500 ng) bio-
tinylated RNA bait library, 3 ml SUPERase-In, 2 ml P5 multiplex
block RNA (100 mM stock, see above), and 2 ml P7 multiplex block
RNA (100 mM stock, see above). The DNA pond was heated in a
thermal cycler to 95�C for 5 min, followed by 65�C for 5 min.
When the DNA had been at 65�C for 2.5 min, the RNA bait mix
was heated to 65�C for 2.5 min in a heat block. After the pond
DNA had been at 65�C for 5 min, 26 ml of prewarmed hybridiza-
tion buffer (103 SSPE, 103 Denhardt’s, 10 mM EDTA, 0.2% SDS,
and 0.01% Tween 20) was added, followed by 8 ml RNA bait/block
mix to produce a 66 ml total reaction. The reaction was mixed by
pipetting, then incubated at 65�C for ~66 hr.
Pulldown
For each capture reaction, 50 ml of Dynabeads MyOne Streptavi-
din C1 beads (Life Technologies) was mixed with 200 ml bead
wash buffer (1 M NaCl, 10 mM Tris-HCl [pH 7.5], 1 mM EDTA,
and 0.01% Tween 20), vortexed for 30 s, then separated on a mag-
netic plate for 2 min before supernatant was removed. This wash
step was repeated twice and after the last wash the beads were
resuspended in 134 ml bead wash per sample. Next, 134 ml of
bead solution was added to the 66 ml DNA/RNA hybridization
mix, the solution was vortexed for 10 s, and the mix was incu-
bated at room temperature for 30 min, vortexing occasionally.
The mixture was then placed on a magnet to separate the beads
and the supernatant was removed. The beads were incubated in
165 ml low-stringency buffer (13 SSC/0.1%SDS/0.01% Tween
20) for 15 min at room temperature, followed by three 10 min
washes at 65�C in 165 ml prewarmed high-stringency buffer
(0.13 SSC/0.1% SDS/0.01% Tween 20). Hybrid-selected DNA
was eluted in 50 ml of 0.1 M NaOH for 10 min at room tempera-
ture, then neutralized by adding 50 ml 1 M Tris-HCl (pH 7.5).
Finally, the DNA was concentrated with 1.83 AMPure XP beads,
eluting in 30 ml H2O.
013

Please cite this article in press as: Carpenter et al., Pulling out the 1%: Whole-Genome Capture for the Targeted Enrichment of Ancient DNASequencing Libraries, The American Journal of Human Genetics (2013), http://dx.doi.org/10.1016/j.ajhg.2013.10.002
Amplification
The captured pond was PCR amplified by combining the 30 ml of
captured DNA with 50 ml 23 NEB Next Master Mix, 0.5 ml each
primer (200 mM stocks of primer P5, 50-AATGATACGGCGAC
CACCGA-30, and P7, 50-CAAGCAGAAGACGGCATACGA-30),0.5 ml RNase A (7,000 U/ml, QIAGEN), and 18.5 ml H2O. Cycling
conditions were as follows: 98�C/30 s; 15–20 cycles of 98�C/10 s,
60�C/30 s, 72�C/30 s; 72�C/2 min. The reactions were purified
with 1.83 (180 ml) AMPure XP beads and eluted in 30 ml H20.
Library Pooling and Multiplex SequencingCaptured libraries were pooled in equimolar amounts (determined
by analysis on an Agilent Bioanalyzer 2100) and sequenced on
either a MiSeq (postcapture Bulgarian libraries, 2 3 150 bp reads)
or HiSeq (precapture Bulgarian libraries (2 3 90 bp reads) and all
other libraries (2 3 101 bp reads). For the postcapture libraries,
10% PhiX (a viral genome with a balanced nucleotide represen-
tation) was spiked in to compensate for the low complexity of
the libraries, which can cause problems with cross-talk matrix
calculation, cluster identification, and phasing during the
sequencing run.
Mapping and Data AnalysisPrior tomapping, paired-end reads weremerged and adapters were
trimmed with the program SeqPrep with default settings,
including a length cutoff of 30 nt. The merged reads and trimmed
unmerged reads were mapped separately to the human reference
genome (UCSC Genome Browser hg19) with BWA v.0.5.9,25
with seeding disabled (-l 1000). Duplicates were then removed
from the combined bam file with samtools26 (v.0.1.18) and reads
were filtered for mapping qualities R30.
For the postcapture libraries, we noted that there were a small
number of fragments with the exact same lengths and mapping
coordinates (primarily mapping to the mtDNA) in multiple
libraries. Because we performed the captures and amplifications
separately for each library prior to sequencing, the most parsimo-
nious explanation for this observation is that the high clonality of
the libraries led to mixed clusters on the sequencer and some
misassignments of index sequences, despite the spike-in of PhiX
described above. This phenomenon has been previously reported
for multiplexed libraries and is probably exacerbated by high
levels of clonality.27 To correct for this issue, any potentially
cross-contaminating fragments (defined as those with the same
lengths and mapping coordinates in more than one library) were
removed bioinformatically with an in-house bash script and
BEDTools.28
For downsampling experiments, the initial fastq file was
reduced to the desired number of reads and then the reads were
mapped as described above. Overlap between the pre- and post-
capture libraries was assessed with BEDTools. Coverage plots
were created with Integrative Genomics Viewer.29 DNA damage
tables were generated with mapDamage 2.0.30 Overlap with
repetitive regions of the genome was determined by intersecting
with the RepeatMasker table for hg19 (UCSC Genome Browser)
via BEDTools. For mtDNA haplogroup assignments, all trimmed
and merged reads were separately aligned to the revised Cam-
bridge reference sequence (rCRS)31 with the same pipeline
described above for the full genome. Mutations were identified
with MitoBamAnnotator32 and haplogroups were assigned with
mthap v.0.19a based on PhyloTree Build 15.33 Sex identification
was performed with a previously published karyotyping tool for
shotgun sequencing data.34
The Am
AJHG 1
Variant Calling and Principal Component AnalysisFor variant calling, sites were overlapped with SNPs from the 1000
Genomes Project Phase 1 data set (v.3), filtering for base qual-
ities R30 in the ancient samples and removing related individ-
uals from 1000 Genomes. For PCAs with Native Americans,
low-coverage sequenced genomes from ten additional individuals
(Mayan individuals HGDP00854, HGDP00855, HGDP00856,
HGDP00857, HGDP00860, HGDP00868, HGDP00877; Karitiana
individuals HGDP00998 and BI16; and Aymara individual
TA6) were also included in the intersection (M. Raghavan,
M. DeGiorgio, O.E. Cornejo, S. Rasmussen, S. Shringarpure, A.
Eriksson, A. Albrechtsen, I. Moltke, K. Harris, D. Meltzer,
M. Metspalu, M. Karmin, K. Tambets, M.W. Sayres, A.M.-E., K.S.,
H. Rangel-Villalobos, D.P., D.L., P. Norman, P. Parham, M.R., T.S.
Korneliussen, P. Skoglund, T.V.O. Hansen, F.C. Nielsen, T.L. Pierre,
M. Crawford, T. Kivisild, R. Malhi, R. Villems, M. Jakobsson,
F. Balloux, A. Manica, C.D.B., R. Nielsen, E.W., unpublished
results). Because of low coverage in the ancient samples, most
positions were covered by 0 or 1 read; for positions covered by
more than one read, a random read was sampled and the site
was made homozygous. For PCA analysis, SNPs were filtered for
minor allele frequencies R5% and PCAs were constructed with
smartpca.35 Principal components were computed with only the
modern samples, and the ancient individual was then projected
onto the PCA. PCA plots were created with R v.2.14.2.
Results
We testedWISC on 12 human aDNA libraries derived from
non-frozen-preserved specimens: four Iron and Bronze Age
human teeth from Bulgaria, seven pre-Columbian human
mummies from Peru, and one Bronze Age human hair
sample from Denmark. The DNA was extracted and the
libraries built in a dedicated clean room (see Material and
Methods). Shotgun sequencing prior to capture indicated
that all libraries contained low levels of endogenous DNA
(average 1.2%, range 0.04%–6.2%; see Table 1). To allow
for direct comparison, the numbers of reads in the pre-
and postcapture libraries were adjusted to be equal prior
to mapping by taking the first n reads from the respective
raw fastq files (Table 1). In the case of the hair and bone
libraries, the results for 1 million reads are shown for ease
of comparison with the tooth libraries. Prior to mapping,
the paired-end reads were merged where possible, any re-
maining adaptor sequence was trimmed from the merged
and unmerged reads, and reads containing only adaptor
sequence (i.e., adaptor dimers) were discarded. As shown
in Table 1, whole-genome capture decreased the number
of reads discarded at this step, reducing the sequencing
capacity taken up by these uninformative sequences,
which are common contaminants in aDNA sequencing
libraries.
After capture, we observed enrichments ranging from
6-fold to 159-fold for number of reads mapping to the
human genome at MAPQ R 30, resulting in 1.6%–59.2%
of reads mapping after capture. For unique fragments, we
observed enrichments of 2-fold to 13-fold (Table 1); how-
ever, the fraction of unique reads changes with different
erican Journal of Human Genetics 93, 1–13, November 7, 2013 5
537
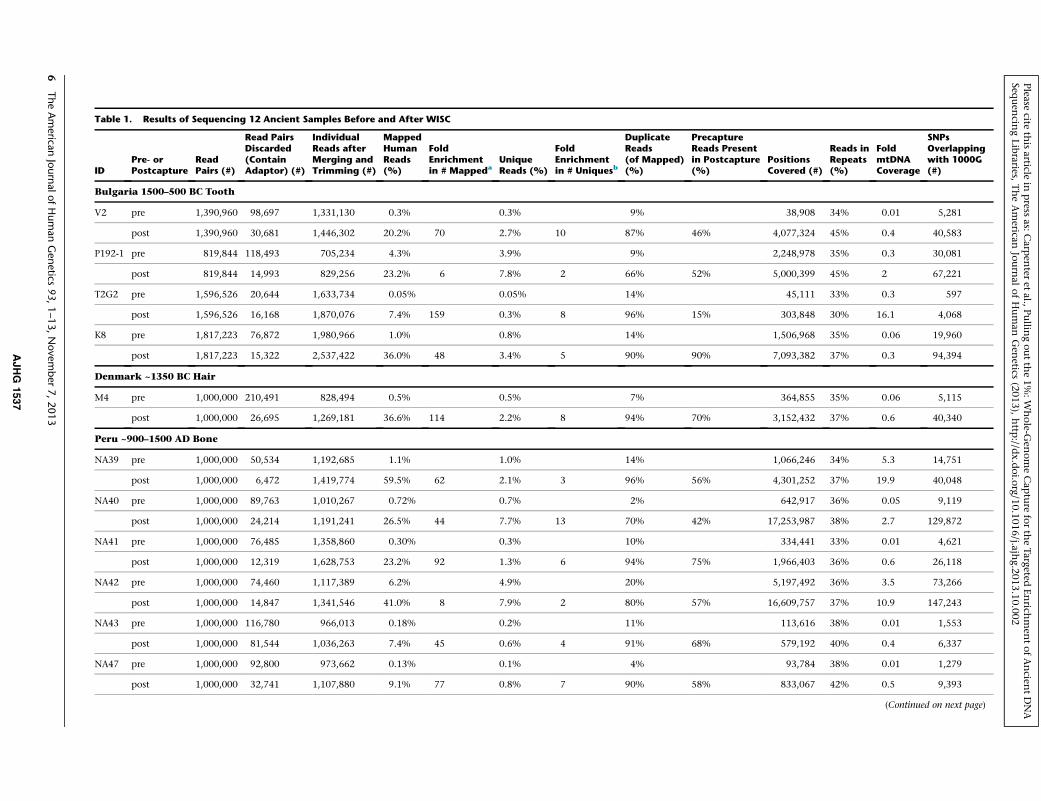
Table 1. Results of Sequencing 12 Ancient Samples Before and After WISC
IDPre- orPostcapture
ReadPairs (#)
Read PairsDiscarded(ContainAdaptor) (#)
IndividualReads afterMerging andTrimming (#)
MappedHumanReads(%)
FoldEnrichmentin # Mappeda
UniqueReads (%)
FoldEnrichmentin # Uniquesb
DuplicateReads(of Mapped)(%)
PrecaptureReads Presentin Postcapture(%)
PositionsCovered (#)
Reads inRepeats(%)
FoldmtDNACoverage
SNPsOverlappingwith 1000G(#)
Bulgaria 1500–500 BC Tooth
V2 pre 1,390,960 98,697 1,331,130 0.3% 0.3% 9% 38,908 34% 0.01 5,281
post 1,390,960 30,681 1,446,302 20.2% 70 2.7% 10 87% 46% 4,077,324 45% 0.4 40,583
P192-1 pre 819,844 118,493 705,234 4.3% 3.9% 9% 2,248,978 35% 0.3 30,081
post 819,844 14,993 829,256 23.2% 6 7.8% 2 66% 52% 5,000,399 45% 2 67,221
T2G2 pre 1,596,526 20,644 1,633,734 0.05% 0.05% 14% 45,111 33% 0.3 597
post 1,596,526 16,168 1,870,076 7.4% 159 0.3% 8 96% 15% 303,848 30% 16.1 4,068
K8 pre 1,817,223 76,872 1,980,966 1.0% 0.8% 14% 1,506,968 35% 0.06 19,960
post 1,817,223 15,322 2,537,422 36.0% 48 3.4% 5 90% 90% 7,093,382 37% 0.3 94,394
Denmark ~1350 BC Hair
M4 pre 1,000,000 210,491 828,494 0.5% 0.5% 7% 364,855 35% 0.06 5,115
post 1,000,000 26,695 1,269,181 36.6% 114 2.2% 8 94% 70% 3,152,432 37% 0.6 40,340
Peru ~900–1500 AD Bone
NA39 pre 1,000,000 50,534 1,192,685 1.1% 1.0% 14% 1,066,246 34% 5.3 14,751
post 1,000,000 6,472 1,419,774 59.5% 62 2.1% 3 96% 56% 4,301,252 37% 19.9 40,048
NA40 pre 1,000,000 89,763 1,010,267 0.72% 0.7% 2% 642,917 36% 0.05 9,119
post 1,000,000 24,214 1,191,241 26.5% 44 7.7% 13 70% 42% 17,253,987 38% 2.7 129,872
NA41 pre 1,000,000 76,485 1,358,860 0.30% 0.3% 10% 334,441 33% 0.01 4,621
post 1,000,000 12,319 1,628,753 23.2% 92 1.3% 6 94% 75% 1,966,403 36% 0.6 26,118
NA42 pre 1,000,000 74,460 1,117,389 6.2% 4.9% 20% 5,197,492 36% 3.5 73,266
post 1,000,000 14,847 1,341,546 41.0% 8 7.9% 2 80% 57% 16,609,757 37% 10.9 147,243
NA43 pre 1,000,000 116,780 966,013 0.18% 0.2% 11% 113,616 38% 0.01 1,553
post 1,000,000 81,544 1,036,263 7.4% 45 0.6% 4 91% 68% 579,192 40% 0.4 6,337
NA47 pre 1,000,000 92,800 973,662 0.13% 0.1% 4% 93,784 38% 0.01 1,279
post 1,000,000 32,741 1,107,880 9.1% 77 0.8% 7 90% 58% 833,067 42% 0.5 9,393
(Continued on next page)
6TheAmerica
nJournalofHumanGenetics
93,1–13,November7,2013
AJHG
1537
Please
citeth
isarticle
inpress
as:Carp
enter
etal.,
Pullin
goutth
e1%:W
hole-G
enomeCap
ture
forth
eTarg
etedEnrich
men
tofAncien
tDNA
Sequen
cingLibraries,
TheAmerican
Journ
alofHuman
Gen
etics(2013),http
://dx.doi.o
rg/10.1016/j.ajh
g.2013.10.002
Table
1.
Continued
IDPre
-or
Postcaptu
reRead
Pairs(#
)
ReadPairs
Discard
ed
(Conta
inAdapto
r)(#
)
Individual
Readsafter
Merg
ingand
Trimming(#
)
Mapped
Human
Reads
(%)
Fold
Enrichment
in#Mappeda
Unique
Reads(%
)
Fold
Enrichment
in#Uniquesb
Duplicate
Reads
(ofMapped)
(%)
Pre
captu
reReadsPre
sent
inPostcaptu
re(%
)Positions
Covere
d(#
)
Readsin
Repeats
(%)
Fold
mtD
NA
Covera
ge
SNPs
Overlapping
with1000G
(#)
NA50
pre
1,000,000
126,605
1,001,135
0.035%
0.03%
3%
15,135
40%
0217
post
1,000,000
37,653
1,292,570
1.7%
61
0.3%
10
78%
24%
377,875
43%
0.5
3,062
Thefirstfoursampleswere
adjustedto
have
identicaln
umbersofpre-andpostcapture
reads,basedonthenumberofreadsobtainedfrom
MiSeqsequencingofthepostcapture
libraries.Thelasteightsampleswere
adjusted
to1millionreadseach
forease
ofco
mparisonwiththefirstfoursamples.Priorto
mapping,overlappingpaired-endreadswere
computationally
merged,andadapterswere
trim
medfrom
both
mergedandunmergedreads
(note
thatthenumberofreadslistedaftermergingandtrim
mingincludesboth
forw
ard
andreversereadsforpairsthatwere
notmerged).Mappedreadswere
filteredformappingqualitiesR30.Overlapwithrepeatswas
determ
inedbyintersectionwiththeRepeatM
askerannotationofhumangenomerepeats.1000G:1000Genomesreference
panel.
aDoesnotvary
withamountofsequencing
bVarieswithlib
rary
complexityandamountofsequencing
The
AJH
Please cite this article in press as: Carpenter et al., Pulling out the 1%: Whole-Genome Capture for the Targeted Enrichment of Ancient DNASequencing Libraries, The American Journal of Human Genetics (2013), http://dx.doi.org/10.1016/j.ajhg.2013.10.002
Am
G 1
amounts of sequencing and also is sensitive to the level
of complexity of the original library (Figures 2A and 2B
and Figure S1 available online). The level of enrichment
was negatively correlated with the amount of endogenous
DNA present in the precapture library—the higher the
amount prior to capture, in general, the lower the degree
of enrichment (e.g., samples P192-1 andNA42; see Table 1).
This phenomenon has previously been observed for the
enrichment of pathogen DNA in clinical samples.36 The
number of unique reads increased in all cases; however,
even after sequencing of 1 million reads, most of the
unique molecules in the postcapture libraries had already
been observed, as evidenced by the high levels of clonality
(66%–96%) in these libraries. We generally captured a large
proportion (15%–90%) of the endogenous fragments
observed in the precapture libraries (Table 1). This number
also increased with additional sequencing (see Figure 2C
and discussion below). We observed only a slight increase
in the percent of fragments falling within known repeti-
tive regions of the genome (Table 1), with the average
increasing from 36% precapture to 39% postcapture. There
was no obvious correlation with the amount of starting
DNA in the sample. Thus, at least for libraries containing
very low levels of endogenous DNA, biased enrichment
of repetitive sequences does not appear to be a problem.
In the postcapture libraries, the unmapped fraction had a
similar composition of environmental (primarily bacterial)
sequences to the precapture library (data not shown).
Importantly for aDNA studies, which have historically
relied on identifying mtDNA haplogroups from ancient
samples, >13 coverage of the mtDNA was achieved
with 1 million reads for 5 of the 12 postcapture libraries
(Table 1). For these five samples, we were able to tentatively
call mtDNA haplogroups (Table S1). Intersection with
the 1000 Genomes Project reference panel37 demonstrated
that capture increased the number of unique SNPs
between 2- and 14-fold (Table 1), increasing the resolution
of principal component analysis plots involving these
individuals (see Discussion below). We did not observe
any bias in X chromosome capture resulting from the use
of a male Masai individual (NA21732) for the capture
probes: the proportion of reads mapped to the X chromo-
some remained approximately the same before and after
capture (Table S2). Furthermore, for the 17 total SNPs
that changed alleles between the eight pre- and postcap-
ture libraries sequenced to higher levels (0–6 SNPs per
sample), only ten SNPs changed from not matching to
matching NA21732 after capture (Table S3). Thus, at least
for modern humans, divergence between the probe and
target on the population level does not appear to produce
significant allelic bias in the postcapture library. However,
it is possible that more noticeable effects could be seen for
indels or copy number variants if high enough coverage
were obtained.
To determine how many new unique fragments are
discovered with increasing amounts of sequencing, we
sequenced the hair and bone libraries to higher coverage
erican Journal of Human Genetics 93, 1–13, November 7, 2013 7
537
A B NA40 (bone)M4 (hair)
C D
E F
15,895
136,978
53,524
Captureefficiency
(no. of unique fragments retained)
NA40 precapture
NA40 postcapture
M4 precapture
M4 postcapture
NA40 precapture
NA40 postcapture
chr1
10 mb
coverage plot
NA40 (bone) NA40 (bone)
0.0
2.0
4.0
6.0
8.0
10.0
12.0
14.0
0
5,000
10,000
15,000
20,000
25,000
30,000
35,000
40,000
0.E+00 5.E+06 1.E+07 2.E+07 2.E+07
Fol
d en
richm
ent (
uniq
ues)
Num
ber
of u
niqu
e fr
agm
ents
Amount of sequencing (reads)
precapturepostcapturefold enrichment
0.0
5.0
10.0
15.0
20.0
0
20,000
40,000
60,000
80,000
100,000
120,000
140,000
160,000
180,000
200,000
0.E+00 4.E+06 8.E+06 1.E+07
Fol
d en
richm
ent (
uniq
ues)
Num
ber
of u
niqu
e fr
agm
ents
Amount of sequencing (reads)
precapturepostcapturefold enrichment
0
0.02
0.04
0.06
0.08
0.1
0.12
0.14
30-3
940
-49
50-5
960
-69
70-7
980
-89
90-9
910
0-10
911
0-11
912
0-12
913
0-13
914
0-14
915
0-15
916
0-16
917
0-17
918
0-18
919
0-19
9
Fra
ctio
n of
rea
ds
Insert size (bp)
precapturepostcapture
0.00
0.01
0.02
0.03
0.04
0.05
0 10 20 30 40 50 60 70 80 90 100
Fra
ctio
n of
rea
ds
% GC
precapturepostcapture
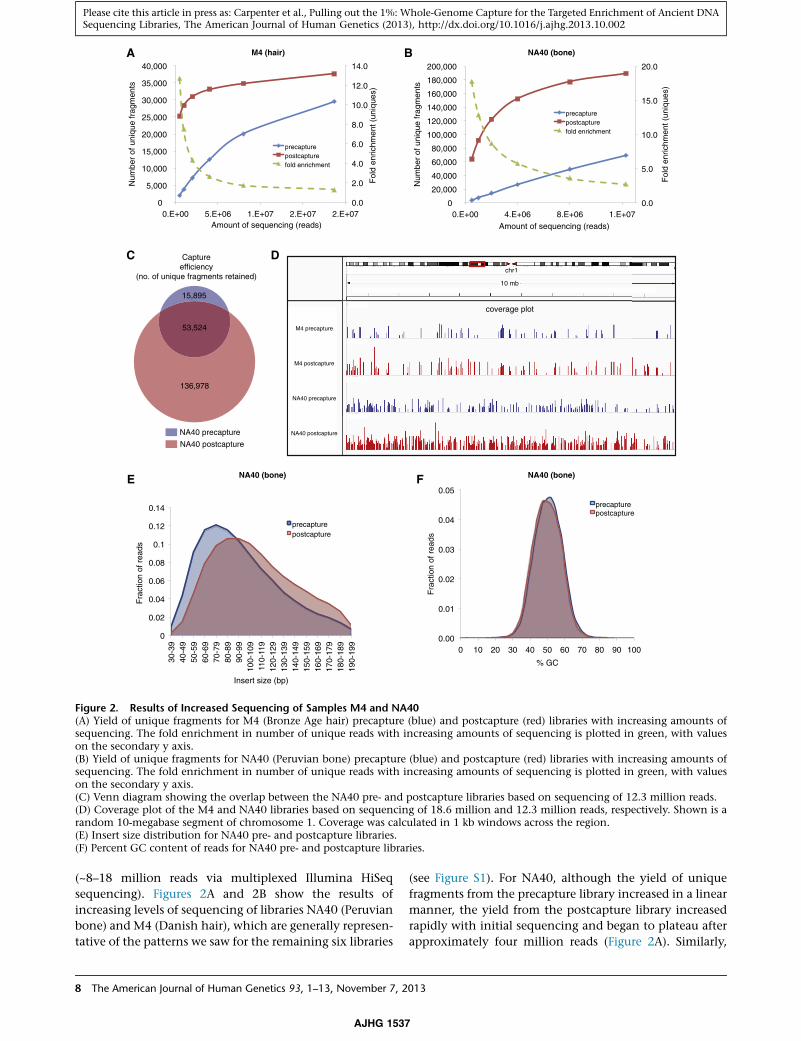
Figure 2. Results of Increased Sequencing of Samples M4 and NA40(A) Yield of unique fragments for M4 (Bronze Age hair) precapture (blue) and postcapture (red) libraries with increasing amounts ofsequencing. The fold enrichment in number of unique reads with increasing amounts of sequencing is plotted in green, with valueson the secondary y axis.(B) Yield of unique fragments for NA40 (Peruvian bone) precapture (blue) and postcapture (red) libraries with increasing amounts ofsequencing. The fold enrichment in number of unique reads with increasing amounts of sequencing is plotted in green, with valueson the secondary y axis.(C) Venn diagram showing the overlap between the NA40 pre- and postcapture libraries based on sequencing of 12.3 million reads.(D) Coverage plot of the M4 and NA40 libraries based on sequencing of 18.6 million and 12.3 million reads, respectively. Shown is arandom 10-megabase segment of chromosome 1. Coverage was calculated in 1 kb windows across the region.(E) Insert size distribution for NA40 pre- and postcapture libraries.(F) Percent GC content of reads for NA40 pre- and postcapture libraries.
Please cite this article in press as: Carpenter et al., Pulling out the 1%: Whole-Genome Capture for the Targeted Enrichment of Ancient DNASequencing Libraries, The American Journal of Human Genetics (2013), http://dx.doi.org/10.1016/j.ajhg.2013.10.002
(~8–18 million reads via multiplexed Illumina HiSeq
sequencing). Figures 2A and 2B show the results of
increasing levels of sequencing of libraries NA40 (Peruvian
bone) and M4 (Danish hair), which are generally represen-
tative of the patterns we saw for the remaining six libraries
8 The American Journal of Human Genetics 93, 1–13, November 7, 2
AJHG 1537
(see Figure S1). For NA40, although the yield of unique
fragments from the precapture library increased in a linear
manner, the yield from the postcapture library increased
rapidly with initial sequencing and began to plateau after
approximately four million reads (Figure 2A). Similarly,
013

Please cite this article in press as: Carpenter et al., Pulling out the 1%: Whole-Genome Capture for the Targeted Enrichment of Ancient DNASequencing Libraries, The American Journal of Human Genetics (2013), http://dx.doi.org/10.1016/j.ajhg.2013.10.002
there was a rapid initial increase in unique fragments up
to approximately five million reads sequenced for both
the pre- and postcapture M4 libraries; this increase then
slowed with sequencing up to 18.7 million reads
(Figure 2B). The results from the remaining six libraries
are shown in Figure S1. These plots also demonstrate that
the fold enrichment in unique reads decreases with
increasing amounts of sequencing (Figures 2A, 2B, and
S1), as the precapture library begins to be sampled more
exhaustively. Thus, WISC allowed us to access the majority
of unique reads present in the postcapture library with
even low levels of sequencing, such as those obtainable
with a single run on an Illumina MiSeq.
We next examined how efficiently we were able to
capture endogenous molecules present in the precapture
library with higher levels of sequencing. As shown in
Figure 2C, for library NA40, 77% (53,524) of unique frag-
ments in the precapture library were also sequenced in
the postcapture library with 12,285,216 reads sequenced;
note that this fraction was 42% for 1 million reads
sequenced (Table 1). Furthermore, an additional 136,978
unique fragments were sequenced after capture with the
same amount of sequencing (Figure 2C). These fragments
were generally evenly distributed across the genome;
Figure 2D shows a coverage plot for libraries M4 and
NA40 at a random 10 Mb region of chromosome 1. The
size of the fragments in the postcapture libraries tended
to be slightly larger (Figure 2E), probably because of the
stringency of the hybridization and wash steps—which
could be decreased but would, we predict, result in lower
levels of enrichment—and some loss during purifications,
resulting in the preferential retention of longer fragments.
Because aDNA is highly fragmented compared to modern
contaminants, we tested whether the overall DNA damage
patterns (an increase in C-to-T and G-to-A transitions
at the ends of fragments, diagnostic of ancient DNA38)
also changed with the change in fragment size after cap-
ture. We observed that the overall DNA damage patterns
remained similar in the pre- and postcapture libraries
(Table S4), both for the libraries as a whole and when
they were partitioned by size (<70 bp and >70 bp). The
patterns for libraries V2, K8, and M4 are not typical of
ancient DNA, possibly because of favorable preservation
conditions, sample contamination prior to capture, or
both (Table S4). Finally, the GC content of reads in the
postcapture library was slightly decreased (Figure 2F), as
previously observed for in-solution exome capture.14
The ultimate goal of sequencing DNA from ancient
samples is usually to identify informative variation for
population genetics analyses. We used the SNPs identified
by intersections with the 1000 Genomes reference panel
(see Table 1 and discussion above) to perform principal
component analysis (PCA). Only SNPs with a minor allele
frequencyR5% were used for this analysis. Figure 3 shows
the pre- and postcapture PCAs for samples V2 (Bulgarian),
M4 (Danish hair), and NA40 (Peruvian mummy); the
PCAs for the remaining samples are shown in Figure S2.
The Am
AJHG 1
As expected, the two European samples fell into the Euro-
pean clusters on the PCA both before capture (Figures 3A
and 3C) and after capture (Figures 3B and 3D). However,
the increased number of SNPs after capture allows for
improved resolution of the subcontinental affiliation of
each ancient sample (Figures 3B and 3D). PCAs with
only the European populations in 1000 Genomes further
resolve the placement of some of these samples after
capture (Figure S3). For the Peruvian mummies, we also
included 10 Native American individuals from Central
and South America in the PCA (Figures 3E and 3F). Inter-
estingly, all of the mummies fell between the Native
American populations (KAR, MAY, AYM) and East Asian
populations (JPT, CHS, CHB), as would be expected for a
nonadmixed Native American individual (Figures 3E, 3F,
and S2). These mummies belonged to the pre-Columbian
Chachapoya culture, who, by some accounts, were
unusually fair-skinned,39 suggesting a potential for pre-
Columbian European admixture. However, based on our
preliminary results, these individuals appear to have
been ancestrally Native American.
Discussion
We have developed a whole-genome in-solution capture
method, WISC, that can be used to highly enrich the
endogenous contents of aDNA sequencing libraries, thus
reducing the amount of sequencing required to sample
the majority of unique fragments in the library.
Previous methods for targeted enrichment of aDNA
libraries have focused only on a subset of the genome (e.g.,
the mitochondrial genome, a single chromosome, or a sub-
set of SNPs).8,11–13 Although these methods have generated
useful informationwhile reducing sequencingcosts, theyall
involve discarding a large proportion of potentially infor-
mative sequences, often from samples that already contain
a reduced representation of the genome.
Excluding initial library costs (which are the same for all
methods) and sequencing, the cost to perform WISC is
approximately $50/sample, primarily because of the cost
of the streptavidin-coated beads used for capture. In
contrast, in-solution exome capture via a commercial kit
is approximately $1,000/sample, and we calculate the pre-
viously reported chromosome 21 capture method8 to have
an initial cost of approximately $5,000 (to purchase the
nine one-million-feature DNA arrays used to generate the
RNA probes), plus a cost of ~$50/sample for the actual cap-
ture experiments. Finally, if one desired to array-synthesize
probes tiled across the entire genome—i.e., a similar
approach to the chromosome 21 capture but for the whole
genome—we calculate that it would cost ~$300,000–
$400,000 to purchase the necessary arrays. All of these
methods would reduce sequencing costs to a large extent
compared to sequencing the precapture library, but, as
noted above, several do so at the cost of discarding poten-
tially informative sequences.
erican Journal of Human Genetics 93, 1–13, November 7, 2013 9
537

-0.04
-0.02
0.00
0.02
0.04
-0.06 -0.04 -0.02 0.00 0.02Principal component 1
Prin
cipa
l com
pone
nt 2
-0.04
-0.02
0.00
0.02
0.04
-0.06 -0.04 -0.02 0.00 0.02Principal component 1
Prin
cipa
l com
pone
nt 2
-0.06
-0.04
-0.02
0.00
0.02
0.04
-0.06 -0.04 -0.02 0.00 0.02Principal component 1
Prin
cipa
l com
pone
nt 2
-0.04
-0.02
0.00
0.02
0.04
-0.06 -0.04 -0.02 0.00 0.02Principal component 1
Prin
cipa
l com
pone
nt 2
-0.04
-0.02
0.00
0.02
0.04
-0.06 -0.04 -0.02 0.00 0.02Principal component 1
Prin
cipa
l com
pone
nt 2
-0.04
-0.02
0.00
0.02
0.04
-0.06 -0.04 -0.02 0.00 0.02Principal component 1
Prin
cipa
l com
pone
nt 2
M4 precapture841 SNPs
M4 postcapture6,872 SNPs
A B
NA40 postcapture21,593 SNPs
NA40 precapture1,536 SNPs
C D
E F
V2 precapture923 SNPs
V2 postcapture9,676 SNPs
Ancient
ASWLWKYRI
AfricaCEUFINGBRIBSTSI
EuropeCHBCHSJPT
AsiaCLMMXLPUR
Americas
Ancient
ASWLWKYRI
AfricaCEUFINGBRIBSTSI
EuropeCHBCHSJPT
AsiaCLMMXLPUR
KARAYM
MAY
Americas
Ancient
ASWLWKYRI
AfricaCEUFINGBRIBSTSI
EuropeCHBCHSJPT
AsiaCLMMXLPUR
KARAYM
MAY
Americas
Ancient
ASWLWKYRI
AfricaCEUFINGBRIBSTSI
EuropeCHBCHSJPT
AsiaCLMMXLPUR
Americas
Ancient
ASWLWKYRI
AfricaCEUFINGBRIBSTSI
EuropeCHBCHSJPT
AsiaCLMMXLPUR
Americas
Ancient
ASWLWKYRI
AfricaCEUFINGBRIBSTSI
EuropeCHBCHSJPT
AsiaCLMMXLPUR
Americas
Figure 3. Principal Component Analysis of Pre- and Postcapture Samples Based on Sequencing One Million Reads EachPrincipal component analysis of SNPs overlapping between the 1000 Genomes reference panel and each ancient individual, with NativeAmerican individuals also included in (E) and (F). The principal components were calculated with the modern individuals only, and theancient individual was then projected onto the plot. Shown are (A) V2 (Bulgarian tooth) precapture and (B) postcapture; (C) M4 (BronzeAge hair) precapture and (D) postcapture; and (E) NA40 (Peruvian bone) precapture and (F) postcapture. Population key: ASW, Americansof African ancestry in SW USA; AYM, Aymara from the Peruvian Andes; CEU, Utah residents (CEPH) with Northern and Western
(legend continued on next page)
10 The American Journal of Human Genetics 93, 1–13, November 7, 2013
AJHG 1537
Please cite this article in press as: Carpenter et al., Pulling out the 1%: Whole-Genome Capture for the Targeted Enrichment of Ancient DNASequencing Libraries, The American Journal of Human Genetics (2013), http://dx.doi.org/10.1016/j.ajhg.2013.10.002
Please cite this article in press as: Carpenter et al., Pulling out the 1%: Whole-Genome Capture for the Targeted Enrichment of Ancient DNASequencing Libraries, The American Journal of Human Genetics (2013), http://dx.doi.org/10.1016/j.ajhg.2013.10.002
With regard to the data generated, the most similar
method to WISC for aDNA capture is chromosome 21 cap-
ture.8 That method was performed on libraries from a single
specimen from the Tianyuan Cave in China that contained
0.01%–0.03% endogenous DNA. Prior to collapsing dupli-
cates, the chromosome 21-capture libraries contained
46.8% endogenous DNA (~4.4 million out of ~9.4 million
reads R35 bp; the five libraries were sequenced on an
entire lane of IlluminaGAIIx, but the exact number of reads
generated is not stated).8WISC-enriched libraries contained
1.6%–59.2% endogenous DNA after capture, although it
shouldbenoted thatmostofour libraries startedwithhigher
levels of endogenous DNA than did the Tianyuan libraries.
After the removal of duplicate reads, the Tianyuan libraries
had 8.4% uniques (789,925), whereas the WISC libraries
contained 0.3%–7.9% unique reads. It is difficult to directly
compare these numbers because the underlying complex-
ities of the libraries differ; however, at least with regard to
the total yield of target DNA, these two methods appear to
perform similarly. Future studies directly comparing these
methods will be required to determine which one retrieves
the highest number of informative variants with the least
amount of sequencing.
Our test libraries, like many aDNA libraries created from
similar specimens,5,6 did not contain sufficient endoge-
nous DNA to cover the entire genome, making it impos-
sible to call genotypes for these samples; indeed, >99.9%
of sites were covered by 0 or 1 read. Identifying SNPs
from these samples is further complicated by the presence
of DNA damage, specifically C-to-T and G-to-A transi-
tions.38 Thus, in order to more confidently identify
SNPs, we intersected our data set with a list of known
SNPs from the 1000 Genomes reference panel. The like-
lihood that a damaged SNP will be found at the exact
same position and with a matching allele as a SNP from
the reference set is quite low, and thus we were able to
leverage the identified SNPs to perform informative popu-
lation genetics analyses without filtering out large subsets
of the data (Figures 3, S2, and S3). A similar approach was
taken by two previous studies.5,6 It should be noted that a
reference panel, preferably with full genome sequence
data (although this is not essential), is required for this
type of analysis of poorly preserved specimens with low
levels of genome coverage. However, because WISC re-
duces the required amount of sequencing required per
library, multiple individuals from the same population
can be analyzed, a key consideration for studies focusing
on the spatial and temporal distribution of ancient
populations.
As shown in Table 1, we also obtained >13 coverage of
the mtDNA for five of the libraries. This number is lower
than the typical enrichment achieved when targeting
European ancestry; CHB, HanChinese in Beijing, China; CHS, SoutheFinnish in Finland; GBR, British in England and Scotland; IBS, Iberianfrom the Brazilian Amazon; LWK, Luhya inWebuye, Kenya; MAY, MaPUR, Puerto Ricans from Puerto Rico; TSI, Toscani in Italy; YRI, Yoru
The Am
AJHG 1
the mtDNA alone via capture,11 but this is not surprising
given that a wider range of sequences is being targeted. A
similar phenomenon was observed in the capture of
nuclear and organellar DNA from ancient maize.40 We
were able to tentatively call mtDNA haplogroups for these
samples (Table S1). The two Bulgarian Iron Age individuals
(P192-1 and T2G5) fell into haplogroups U3b and
HV(16311), respectively. Haplogroup U3 is especially
common in the countries surrounding the Black Sea,
including Bulgaria, and in the Near East, and HV is also
found at low frequencies in Europe and peaks in the
Near East.41 The three Peruvian mummies fell into hap-
logroups B2, M (an ancestor of D), and D1, all derived
from founder Native American lineages and previously
observed in both pre-Columbian and modern populations
from Peru.42
In our experiments, capture yield was limited by the
degree of complexity of the starting libraries and could
potentially be increased by improved aDNA extraction
and library preparation methods.9,43,44 A recently pub-
lished novel method for single-stranded aDNA library
preparation has enabled researchers to obtain high-
coverage ancient genomes from ancient hominins9,44 by
retaining many small, damaged DNA fragments that
would have been lost in conventional library preparation
methods. Although this method is a breakthrough for
the field of aDNA, it does not necessarily decrease the
cost of sequencing samples with low endogenous DNA
contents, because the single-stranded library still contains
high levels of contaminating DNA. We predict that the
combination of this method and WISC may substantially
increase the complexity and endogenous DNA contents
of aDNA libraries. However, it will probably be necessary
to reduce the stringency of the WISC hybridization condi-
tions in order to retain more of these smaller fragments
during capture.
Finally, because it is not necessary to design an array for
our method (i.e., a sequenced genome is not required),
WISC could also be used to capture DNA from specimens
of extinct species by creating baits from the genome of
an extant relative. The effect of sequence divergence
between species on capture efficiency remains to be deter-
mined, but chimpanzee-targeted probes have successfully
been used to capture human and gorilla sequences.45 In
addition, WISC has applications in other contexts, such
as the enrichment of DNA in forensic, metagenomic, and
museum specimens.
Supplemental Data
Supplemental Data include three figures and four tables and can
be found with this article online at http://www.cell.com/AJHG/.
rn HanChinese; CLM, Colombians fromMedellin, Columbia; FIN,population in Spain; JPT, Japanese in Tokyo, Japan; KAR, Karitianayan fromMexico; MXL, Mexican ancestry from Los Angeles, USA;ba in Ibadan, Nigeria.
erican Journal of Human Genetics 93, 1–13, November 7, 2013 11
537

Please cite this article in press as: Carpenter et al., Pulling out the 1%: Whole-Genome Capture for the Targeted Enrichment of Ancient DNASequencing Libraries, The American Journal of Human Genetics (2013), http://dx.doi.org/10.1016/j.ajhg.2013.10.002
Acknowledgments
The authors would like to thank members of the C.D.B. lab, espe-
cially P. Underhill and S. Shringarpure, for helpful discussion, and
M.C. Yee and A. Adams for assistance with experiments. Support
for this work was provided by National Institutes of Health grants
HG005715 and HG003220 and an NRSA Postdoctoral Fellow-
ship (NHGRI) to M.L.C. The sample M4 was obtained and DNA
extracted as part of ‘‘The Rise’’ project funded by the European
Research Council under the European Union’s Seventh Frame-
work programme (FP/2007-2013)/ERC Grant Agreement n.
269442 - THE RISE. Portions of this manuscript are subject to
one or more patents pending. C.D.B. consults for Personalis,
Inc., Ancestry.com, Invitae (formerly Locus Development), and
the 23andMe.com project ‘‘Roots into the Future.’’ None of these
entities played any role in the design of the research or interpre-
tation of the results presented here.
Received: August 3, 2013
Revised: September 27, 2013
Accepted: October 2, 2013
Published: October 25, 2013
Web Resources
The URLs for data presented herein are as follows:
1000 Genomes Phase 1 data set, ftp://ftp.1000genomes.ebi.ac.uk/
vol1/ftp/release/20110521
mthap, http://dna.jameslick.com/mthap/
SeqPrep, https://github.com/jstjohn/SeqPrep
UCSC Genome Browser, http://genome.ucsc.edu
References
1. Green, R.E., Krause, J., Briggs, A.W., Maricic, T., Stenzel, U.,
Kircher, M., Patterson, N., Li, H., Zhai, W., Fritz, M.H.-Y.,
et al. (2010). A draft sequence of the Neandertal genome.
Science 328, 710–722.
2. Rasmussen, M., Li, Y., Lindgreen, S., Pedersen, J.S., Albrecht-
sen, A., Moltke, I., Metspalu, M., Metspalu, E., Kivisild, T.,
Gupta, R., et al. (2010). Ancient human genome sequence of
an extinct Palaeo-Eskimo. Nature 463, 757–762.
3. Rasmussen, M., Guo, X., Wang, Y., Lohmueller, K.E., Rasmus-
sen, S., Albrechtsen, A., Skotte, L., Lindgreen, S., Metspalu, M.,
Jombart, T., et al. (2011). An Aboriginal Australian genome re-
veals separate human dispersals into Asia. Science 334, 94–98.
4. Keller, A., Graefen, A., Ball, M., Matzas, M., Boisguerin, V.,
Maixner, F., Leidinger, P., Backes, C., Khairat, R., Forster, M.,
et al. (2012). New insights into the Tyrolean Iceman’s origin
and phenotype as inferred by whole-genome sequencing.
Nat Commun 3, 698.
5. Sanchez-Quinto, F., Schroeder, H., Ramirez, O., Avila-Arcos,
M.C., Pybus, M., Olalde, I., Velazquez, A.M., Marcos, M.E.,
Encinas, J.M., Bertranpetit, J., et al. (2012). Genomic affinities
of two 7,000-year-old Iberian hunter-gatherers. Curr. Biol. 22,
1494–1499.
6. Skoglund, P., Malmstrom, H., Raghavan, M., Stora, J., Hall, P.,
Willerslev, E., Gilbert, M.T., Gotherstrom, A., and Jakobsson,
M. (2012). Origins and genetic legacy of Neolithic farmers
and hunter-gatherers in Europe. Science 336, 466–469.
7. Reich, D., Green, R.E., Kircher, M., Krause, J., Patterson, N.,
Durand, E.Y., Viola, B., Briggs, A.W., Stenzel, U., Johnson,
12 The American Journal of Human Genetics 93, 1–13, November 7,
AJHG 1537
P.L., et al. (2010). Genetic history of an archaic hominin group
from Denisova Cave in Siberia. Nature 468, 1053–1060.
8. Fu, Q., Meyer, M., Gao, X., Stenzel, U., Burbano, H.A., Kelso, J.,
and Paabo, S. (2013). DNA analysis of an early modern human
from Tianyuan Cave, China. Proc. Natl. Acad. Sci. USA 110,
2223–2227.
9. Meyer, M., Kircher, M., Gansauge,M.T., Li, H., Racimo, F., Mal-
lick, S., Schraiber, J.G., Jay, F., Prufer, K., de Filippo, C., et al.
(2012). A high-coverage genome sequence from an archaic
Denisovan individual. Science 338, 222–226.
10. Gilbert, M.T., Tomsho, L.P., Rendulic, S., Packard, M., Drautz,
D.I., Sher, A., Tikhonov, A., Dalen, L., Kuznetsova, T., Kosint-
sev, P., et al. (2007). Whole-genome shotgun sequencing of
mitochondria from ancient hair shafts. Science 317, 1927–
1930.
11. Maricic, T., Whitten, M., and Paabo, S. (2010). Multiplexed
DNA sequence capture of mitochondrial genomes using PCR
products. PLoS ONE 5, e14004.
12. Burbano, H.A., Hodges, E., Green, R.E., Briggs, A.W., Krause, J.,
Meyer, M., Good, J.M., Maricic, T., Johnson, P.L., Xuan, Z.,
et al. (2010). Targeted investigation of the Neandertal genome
by array-based sequence capture. Science 328, 723–725.
13. Briggs, A.W., Good, J.M., Green, R.E., Krause, J., Maricic, T.,
Stenzel, U., Lalueza-Fox, C., Rudan, P., Brajkovic, D., Kucan,
Z., et al. (2009). Targeted retrieval and analysis of five
Neandertal mtDNA genomes. Science 325, 318–321.
14. Gnirke, A., Melnikov, A., Maguire, J., Rogov, P., LeProust, E.M.,
Brockman,W., Fennell, T., Giannoukos, G., Fisher, S., Russ, C.,
et al. (2009). Solution hybrid selection with ultra-long oligo-
nucleotides for massively parallel targeted sequencing. Nat.
Biotechnol. 27, 182–189.
15. Nekhrizov, G., and Tzvetkova, J. (2012). Ritual Pit Complexes
in Iron Age Thrace: The Case Study of Svilengrad. In Anatolian
Iron Ages 7 The Proceedings of the Seventh Anatolian
Iron Ages Colloquium Held at Edirne, 19-24 April 2010. pp.
177–209.
16. Nekhrizov, G. (2009). Nekropol ot rannata zhelyazna epoha
pri s. Stambolovo, Haskovsko. Arheologicheski otkritiya i
razkopki prez 2008 g Sofia, pp. 266–271.
17. Leshtakov, K., Hristova, R., and Mihailov, Y. (2010). Nekropol
ot kasnata bronzova epoha pri s. Vratitsa, obshtina Kameno.
Yugoiztochna Bulgaria prez II - I hilyadoletie pr Hr Varna,
pp. 22–37.
18. Dimitrova, D. (2012). 5th-4th c. BC Thracian Orphic Tumular
Burials in Sliven Region (Southeastern Bulgaria). In Tumuli
Graves – Status Symbol of the Dead in the Bronze and Iron
Ages in Europe (Oxford: Archaeopress), pp. 77–84.
19. Mounds with preserved oak coffins dendrochronologically
investigated. Acta Archaeologica 77, 190–233.
20. Guillen, S. (2012). Momies Chachapoyas du Perou ancien. In
La prehistoire des autres, Perspectives archeologiques et
anthropologiques, N. Schlanger and A.-C. Taylor, eds. (Paris:
Inrap), pp. 321–336.
21. Willerslev, E., and Cooper, A. (2005). Ancient DNA. Proc. Biol.
Sci. 272, 3–16.
23. Meyer, M., and Kircher, M. (2010). Illumina sequencing
library preparation for highly multiplexed target capture and
sequencing. Cold Spring Harb Protoc 2010, pdb prot5448.
24. Yang, D.Y., Eng, B., Waye, J.S., Dudar, J.C., and Saunders, S.R.
(1998). Technical note: improved DNA extraction from
ancient bones using silica-based spin columns. Am. J. Phys.
Anthropol. 105, 539–543.
2013
Please cite this article in press as: Carpenter et al., Pulling out the 1%: Whole-Genome Capture for the Targeted Enrichment of Ancient DNASequencing Libraries, The American Journal of Human Genetics (2013), http://dx.doi.org/10.1016/j.ajhg.2013.10.002
25. Li, H., and Durbin, R. (2009). Fast and accurate short read
alignment with Burrows-Wheeler transform. Bioinformatics
25, 1754–1760.
26. Li, H., Handsaker, B., Wysoker, A., Fennell, T., Ruan, J., Homer,
N., Marth, G., Abecasis, G., and Durbin, R.; 1000 Genome
Project Data Processing Subgroup. (2009). The Sequence
Alignment/Map format and SAMtools. Bioinformatics 25,
2078–2079.
27. Kircher, M., Sawyer, S., and Meyer, M. (2012). Double index-
ing overcomes inaccuracies in multiplex sequencing on the
Illumina platform. Nucleic Acids Res. 40, e3.
28. Quinlan, A.R., and Hall, I.M. (2010). BEDTools: a flexible suite
of utilities for comparing genomic features. Bioinformatics 26,
841–842.
29. Thorvaldsdottir, H., Robinson, J.T., and Mesirov, J.P. (2013).
Integrative Genomics Viewer (IGV): high-performance geno-
mics data visualization and exploration. Brief. Bioinform.
14, 178–192.
30. Jonsson, H., Ginolhac, A., Schubert, M., Johnson, P.L., and Or-
lando, L. (2013). mapDamage2.0: fast approximate Bayesian
estimates of ancient DNA damage parameters. Bioinformatics
29, 1682–1684.
31. Andrews, R.M., Kubacka, I., Chinnery, P.F., Lightowlers, R.N.,
Turnbull, D.M., and Howell, N. (1999). Reanalysis and revi-
sion of the Cambridge reference sequence for human mito-
chondrial DNA. Nat. Genet. 23, 147.
32. Zhidkov, I., Nagar, T., Mishmar, D., and Rubin, E. (2011).
MitoBamAnnotator: A web-based tool for detecting and
annotating heteroplasmy in human mitochondrial DNA
sequences. Mitochondrion 11, 924–928.
33. van Oven,M., and Kayser, M. (2009). Updated comprehensive
phylogenetic tree of global human mitochondrial DNA varia-
tion. Hum. Mutat. 30, E386–E394.
34. Skoglund, P., Stora, J., Gotherstrom, A., and Jakobsson, M.
(2013). Accurate sex identification of ancient human remains
using DNA shotgun sequencing. J. Archaeol. Sci. 40, 4477–
4482.
35. Patterson, N., Price, A.L., and Reich, D. (2006). Population
structure and eigenanalysis. PLoS Genet. 2, e190.
36. Melnikov, A., Galinsky, K., Rogov, P., Fennell, T., Van Tyne,
D., Russ, C., Daniels, R., Barnes, K.G., Bochicchio, J.,
Ndiaye, D., et al. (2011). Hybrid selection for sequencing
pathogen genomes from clinical samples. Genome Biol.
12, R73.
The Am
AJHG 1
37. Abecasis, G.R., Auton, A., Brooks, L.D., DePristo, M.A., Dur-
bin, R.M., Handsaker, R.E., Kang, H.M., Marth, G.T., and
McVean, G.A.; 1000 Genomes Project Consortium. (2012).
An integrated map of genetic variation from 1,092 human
genomes. Nature 491, 56–65.
38. Briggs, A.W., Stenzel, U., Johnson, P.L.F., Green, R.E., Kelso, J.,
Prufer, K., Meyer, M., Krause, J., Ronan, M.T., Lachmann, M.,
and Paabo, S. (2007). Patterns of damage in genomic DNA
sequences from a Neandertal. Proc. Natl. Acad. Sci. USA 104,
14616–14621.
39. Church, W. (2006). Chachapoya Indians. In Encyclopedia of
Anthropology, H.J. Birx, ed. (Thousand Oaks: Sage Publica-
tions, Inc.), pp. 469–477.
40. Avila-Arcos, M.C., Cappellini, E., Romero-Navarro, J.A.,Wales,
N., Moreno-Mayar, J.V., Rasmussen, M., Fordyce, S.L., Mon-
tiel, R., Vielle-Calzada, J.P., Willerslev, E., and Gilbert, M.T.
(2011). Application and comparison of large-scale solution-
based DNA capture-enrichment methods on ancient DNA.
Sci. Rep. 1, 74.
41. Karachanak, S., Carossa, V., Nesheva, D., Olivieri, A., Pala, M.,
Hooshiar Kashani, B., Grugni, V., Battaglia, V., Achilli, A., Yor-
danov, Y., et al. (2012). Bulgarians vs the other European pop-
ulations: a mitochondrial DNA perspective. Int. J. Legal Med.
126, 497–503.
42. Fehren-Schmitz, L., Warnberg, O., Reindel, M., Seidenberg, V.,
Tomasto-Cagigao, E., Isla-Cuadrado, J., Hummel, S., and Herr-
mann, B. (2011). Diachronic investigations of mitochon-
drial and Y-chromosomal genetic markers in pre-Columbian
Andean highlanders from South Peru. Ann. Hum. Genet. 75,
266–283.
43. Dabney, J., Knapp, M., Glocke, I., Gansauge, M.T., Weihmann,
A., Nickel, B., Valdiosera, C., Garcıa, N., Paabo, S., Arsuaga,
J.L., and Meyer, M. (2013). Complete mitochondrial genome
sequence of a Middle Pleistocene cave bear reconstructed
from ultrashort DNA fragments. Proc. Natl. Acad. Sci. USA
110, 15758–15763.
44. Gansauge, M.T., and Meyer, M. (2013). Single-stranded DNA
library preparation for the sequencing of ancient or damaged
DNA. Nat. Protoc. 8, 737–748.
45. Good, J.M.,Wiebe, V., Albert, F.W., Burbano, H.A., Kircher, M.,
Green, R.E., Halbwax, M., Andre, C., Atencia, R., Fischer, A.,
and Paabo, S. (2013). Comparative population genomics of
the ejaculate in humans and the great apes. Mol. Biol. Evol.
30, 964–976.
erican Journal of Human Genetics 93, 1–13, November 7, 2013 13
537