Embed Size (px)
Citation preview

NAT'L INST. OF STAND & TECH
A111DS T7M3D1 NBS
PUBLICATIONS
*o*T 0F c0a.
o*
z
\
\
,.— /NBS TECHNICAL NOTE 1199
U.S. DEPARTMENT OF COMMERCE/National Bureau of Standards
Pulse-Echo Method for
Flaw Detection in Concrete

NATIONAL BUREAU OF STANDARDS
The National Bureau of Standards' was established by an act of Congress on March 3, 1901.
The Bureau's overall goal is to strengthen and advance the Nation's science and technology
and facilitate their effective application for public benefit. To this end, the Bureau conducts
research and provides: (1) a basis for the Nation's physical measurement system, (2) scientific
and technological services for industry and government, (3) a technical basis for equity in
trade, and (4) technical services to promote public safety. The Bureau's technical work is per-
formed by the National Measurement Laboratory, the National Engineering Laboratory, and
the Institute for Computer Sciences and Technology.
THE NATIONAL MEASUREMENT LABORATORY provides the national system of
physical and chemical and materials measurement; coordinates the system with measurement
systems of other nations and furnishes essential services leading to accurate and uniform
physical and chemical measurement throughout the Nation's scientific community, industry,
and commerce; conducts materials research leading to improved methods of measurement,
standards, and data on the properties of materials needed by industry, commerce, educational
institutions, and Government; provides advisory and research services to other Government
agencies; develops, produces, and distributes Standard Reference Materials; and provides
calibration services. The Laboratory consists of the following centers:
Absolute Physical Quantities 2 — Radiation Research — Chemical Physics —Analytical Chemistry — Materials Science
THE NATIONAL ENGINEERING LABORATORY provides technology and technical ser-
vices to the public and private sectors to address national needs and to solve national
problems; conducts research in engineering and applied science in support of these efforts;
builds and maintains competence in the necessary disciplines required to carry out this
research and technical service; develops engineering data and measurement capabilities;
provides engineering measurement traceability services; develops test methods and proposes
engineering standards and code changes; develops and proposes new engineering practices;
and develops and improves mechanisms to transfer results of its research to the ultimate user.
The Laboratory consists of the following centers:
Applied Mathematics — Electronics and Electrical Engineering2 — Manufacturing
Engineering — Building Technology — Fire Research — Chemical Engineering2
THE INSTITUTE FOR COMPUTER SCIENCES AND TECHNOLOGY conducts
research and provides scientific and technical services to aid Federal agencies in the selection,
acquisition, application, and use of computer technology to improve effectiveness and
economy in Government operations in accordance with Public Law 89-306 (40 U.S.C. 759),
relevant Executive Orders, and other directives; carries out this mission by managing the
Federal Information Processing Standards Program, developing Federal ADP standards
guidelines, and managing Federal participation in ADP voluntary standardization activities;
provides scientific and technological advisory services and assistance to Federal agencies; and
provides the technical foundation for computer-related policies of the Federal Government.
The Institute consists of the following centers:
Programming Science and Technology — Computer Systems Engineering.
'Headquarters and Laboratories at Gaithersburg, M D, unless otherwise noted;
mailing address Washington, DC 20234.!Some divisions within the center are located at Boulder, CO 80303.
' JJATXONAL BtJF.EATl
OF STiUTDAtlDS
Pulse-Echo Method for FlawDetection In Concrete
Nicholas J. Carino
Mary Sansalone
Structures Division
Center for Building TechnologyNational Engineering Laboratory
National Bureau of Standards
Gaithersburg, Maryland 20899
Ke*f01=
C(o.
U.S. DEPARTMENT OF COMMERCE, Malcolm Baldrige, Secretary
NATIONAL BUREAU OF STANDARDS, Ernest Ambler, Director
Issued July 1 984
National Bureau of Standards Technical Note 1 1 99Natl. Bur. Stand. (U.S.), Tech. Note 1 199, 39 pages (July 1984)
CODEN: NBTNAE
U.S. GOVERNMENT PRINTING OFFICE
WASHINGTON: 1984
For sale by the Superintendent of Documents, U.S. Government Printing Office, Washington, DC 20402
TABLE OF CONTENTS
Page
ABSTRACT 1
1.0 I NTRODUCT I ON 1
2.0 PRINCIPLES OF THE METHOD 2
2.
1
Wave Propagation 2
2.2 Wave Modes 3
2.3 Wave Characteristics 3
2.4 Wave Velocity 4
2.5 Reflection 5
2.6 Diffraction at Crack Tips2.7 Attenuation and Divergence 8
3.0 INSTRUMENTATION 10
3.1 Pulse Source 10
3.2 Transducer 10
3.3 Oscilloscope 11
3.4 Pu I se-echo Signal Traces 12
4.0 PAST RESEARCH 13
4.1 Pavements and Bridge Decks 13
4.2 Dams 14
4.3 Piles 15
4.4 Reactor Structures 15
4.5 Refractory Concrete 15
4.6 Submerged Structures 16
5.0 RESEARCH NEEDS 16
6.0 REFERENCES 18
iii


PULSE-ECHO METHOD FOR FLAW DETECTION IN CONCRETE
Nicholas J. Car I no and Mary Sansalone
National Bureau of StandardsWashington, D.C. 20234
The basic principles of the pulse-echo method for the detectionof Internal flaws in concrete are presented. As theheterogeneous nature of concrete poses prob I ems not encounteredIn pulse-echo evaluation of metals, progress In this area ofconcrete nondestructive testing has been slow. A review of pastresearch shows that pulse-echo techniques have been usedsuccessful ly to detect flaws within concrete; however, nostandardized method currently exists for pulse-echo evaluation ofconcrete structures. Based on the current state of knowledge,areas of needed research are outlined.
Keywords: Acoustics; concrete; integrity testing; nondestructivetesting; pulse-echo method; wave propagation.
1. INTRODUCTION
Despite recent advances In concrete technology, there Is nosatisfactory method for detecting Internal defects In hardened concrete.The need for this capabi I Ity Is Increasing with the current emphasis onrehabll Itatlon of existing structures and on qua I Ity acceptance systems for
new construction. The routine method for verifying the existence of defectswith In a concrete structure Is the tak Ing of dr I I I ed core samp I es. Th Is
approach has several disadvantages: 1) It Is expensive; 2) It Is
destructive and requires subsequent repair of the holes; and 3) It samplesonly a smal I portion of the concrete In a structure.
Whl I e It Is posslb I e to "look" Inside concrete using X-ray or gammaradiography, such methods are expensive and cumbersome and they may pose
health hazards. Thus, there Is an urgent need to develop a reliablenondestruct I ve system for f I aw detection that Is economlca I and easy tooperate. The pulse-echo method, which Is based on the principle thatInternal defects wl I I Interact with stress waves, has the potential to f I I I
this need.
With the exception of visual Inspection, the use of acoustic methods
Is the o I dest form of nondestruct I ve testing. Str Ik Ing an object w 1th a
hammer and I Istenlng to the "ringing" sound Is a common way of detectingthe presence of Internal voids, cracks or de I amlnat Ions. This form of
acoustic Inspection Is known formal ly as "resonant frequency testing." Its
disadvantage is that it Is primarily a qualitative and subjective test.
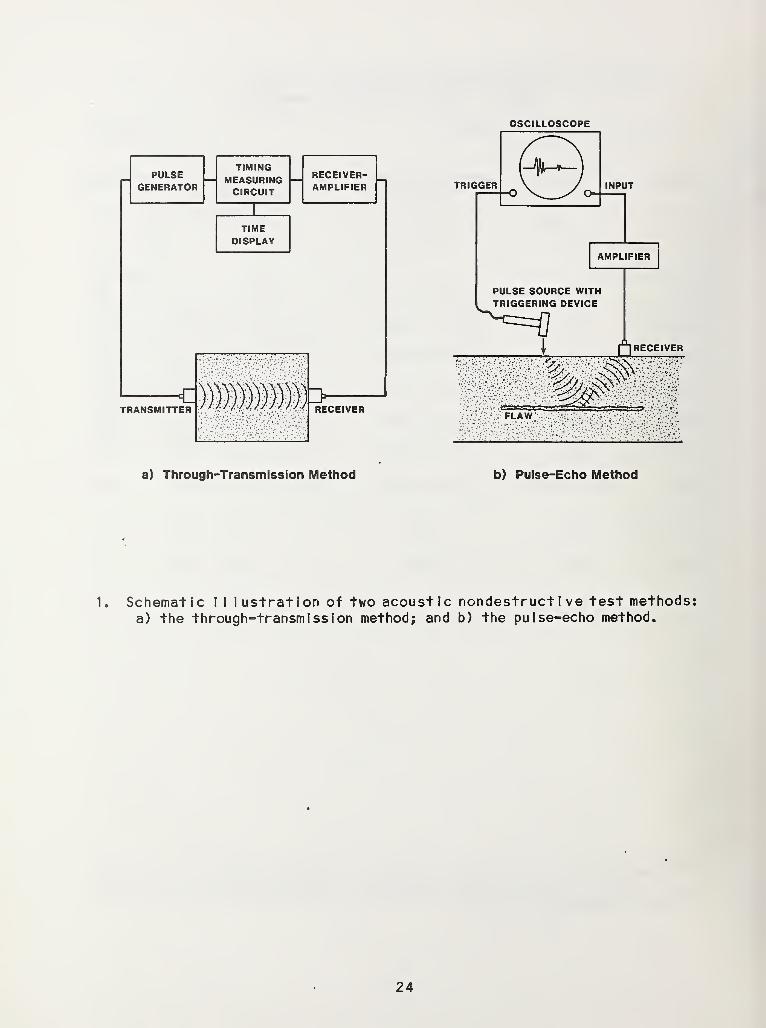
With the advent of sophisticated electronic Instrumentation In theI940's, two nondestructive test methods based upon acoustic waves weredeveloped: the through-transmission method and the pulse-echo method.Figure 1 Illustrates the basic principles and differences of the twoapproaches. In the through-transmission method, one measures the time It
takes for a pulse, which Is defined as a short wave train, to travel from a
transmitting transducer to a receiving transducer. From the measured
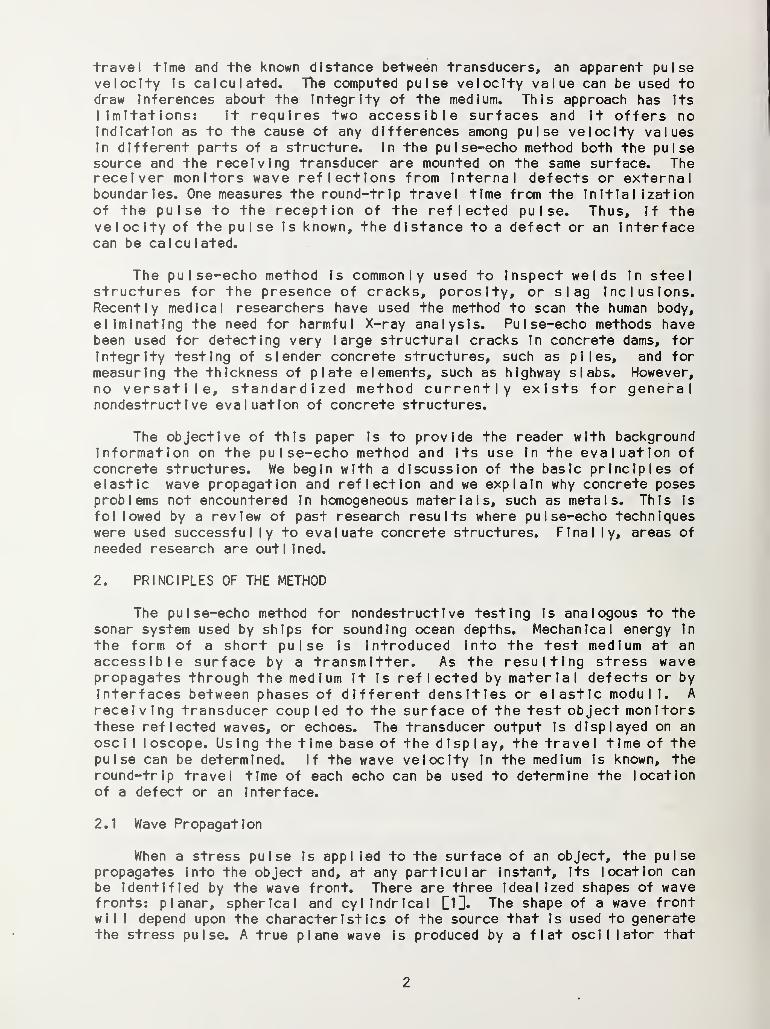
travel time and the known distance between transducers, an apparent pulsevelocity Is calculated. The computed pulse velocity value can be used todraw Inferences about the Integrity of the medium. This approach has Its
limitations: It requires two accessible surfaces and It offers noIndication as to the cause of any differences among pulse velocity valuesIn different parts of a structure. In the pulse-echo method both the pulsesource and the receiving transducer are mounted on the same surface. Thereceiver monitors wave reflections from Internal defects or externalboundaries. One measures the round-trip travel time from the Initializationof the pulse to the reception of the reflected pulse. Thus, If thevelocity of the pulse Is known, the distance to a defect or an Interfacecan be calcu lated.
The pulse-echo method Is commonly used to Inspect welds In steelstructures for the presence of cracks, porosity, or slag Inclusions.Recently medical researchers have used the method to scan the human body,
eliminating the need for harmful X-ray analysis. Pulse-echo methods havebeen used for detecting very large structural cracks In concrete dams, for
Integrity testing of slender concrete structures, such as piles, and for
measuring the thickness of plate elements, such as highway slabs. However,no versatile, standardized method currently exists for generalnondestructive evaluation of concrete structures.
The objective of this paper Is to provide the reader with backgroundInformation on the pulse-echo method and Its use In the evaluation ofconcrete structures. We begin with a discussion of the basic principles ofelastic wave propagation and reflection and we explain why concrete posesproblems not encountered In homogeneous materials, such as metals. This Is
fol lowed by a review of past research results where pulse-echo techniqueswere used successful ly to evaluate concrete structures. Final I y, areas of
needed research are out I Ined.
2. PRINCIPLES OF THE METHOD
The pulse-echo method for nondestructive testing Is analogous to thesonar system used by ships for sounding ocean depths. Mechanical energy In
the form of a short pulse Is Introduced Into the test medium at anaccessible surface by a transmitter. As the resulting stress wavepropagates through the medium It Is reflected by material defects or byInterfaces between phases of d I f f erent dens it les or e I ast Ic modu I I. A
recei v ing transducer coup I ed to the surface of the test object mon Itorsthese reflected waves, or echoes. The transducer output Is displayed on an
osci I loscope. Using the time base of the display, the travel time of thepulse can be determined. If the wave velocity in the medium Is known, theround-trip travel time of each echo can be used to determine the locationof a defect or an interface.
2.1 Wave Propagation
When a stress pulse is applied to the surface of an object, the pulsepropagates Into the object and, at any particular Instant, Its location canbe Identified by the wave front. There are three Idealized shapes of wavefronts: planar, spherical and cylindrical DD. The shape of a wave frontwll I depend upon the characteristics of the source that is used to generatethe stress pulse. A true plane wave Is produced by a flat osci I I ator that

Is mounted In a rigid wa I I and which radiates Into a I Iquld [2], When a
stress pulse Is Introduced Into a solid object using a point source (e.g.,
by Impacting the surface of the object over a sma I I contact area) theresulting wave front Is spherical. A cylindrical wave front Is generatedby a I Ine source; the I Ine forms the axis of the cy I Indrlcal wave. Thewave fronts of spherical or cylindrical waves diverge as they travel awayfrom their source. However, at far distances from the source the wavefronts of divergent waves become nearly planar, and their acousticproperties become very slml lar to those of plane waves [2].
2.2 Wave Modes
There are three primary modes of stress wave propagation throughIsotropic elastic media. These wave modes are characterized by theoscl I latlon path of the particles transmitting the wave. The first mode ofvibration Is the longitudinal or compression wave mode, In which theparticles transmitting the wave vibrate about their equl
I
Ibrlum position In
a direction parallel to the direction of wave propagation. Althoughcompression waves (commonly referred to as P-waves) propagate In a I I typesof media, a second mode of vibration, the transverse or shear wave mode,can propagate only In media with shear stiffness, I.e., In solids. In
shear waves (S-waves) particle vibration Is perpendicular to the directionof wave propagation. Where there Is a sol ld/1 Iquld or a solid/gasInterface, Raylelgh or surface waves (R-waves) can propagate over theInterface. In this mode of vibration the oscl I latlon path of the particlesIs el I Iptlc. The amp I Itude of particle motion In a surface wave decreasesexponential ly with distance away from a free boundary C3U. Figure 2aII lustrates the propagation of the wave fronts corresponding to the threewave modes In a plate. The stress pulse was Introduced Into the topsurface of the plate by a point source; thus the resulting wave fronts of
the P and S-waves are spherical.
2.3 Wave Characteristics
The major parameters associated with stress waves, along with theircorresponding symbols and units, are given In Table 1. The fol lowingrelationship between frequency, f, wavelength, X, and wave velocity, C, Is
val Id for a I I types of waves.
f X = C (1)
Other characteristics of stress waves are amplitude of particle motion, A,
acoustic pressure, P, and acoustic Intensity, I. (Acoustic intensity Is
the average rate of flow of energy through a unit area normal to thedirection of wave propagation DID. For compression or shear waves, theamp I Itude of particle motion depends on the Intensity and the wavelength of
the propagating wave and on the physical properties of the material in
which the wave Is propagating [4]:
(2)
where is the mass dens I ty of the materia I . The amp I I tude of part ic I emotion is extremely sma I L For a compression wave in concrete, with anintensity of 10 Watts/cm (a very high value for pu I se-echo testing ofmater la I s [2]), the amp I itude of particle motion is on the order of one-thousandth of a millimeter or less. Displacement amplitude is related toacoustic pressure by the fol lowing equation [2]:
P = p C u A (3)
where w Is the angular frequency of the wave. For compression wavesacoustic pressure is the normal stress paral lei to the direction ofpropagation. For shear waves acoustic pressure Is the shear stressassociated with the propagating wave.
2.4 Wave Velocity
The propagation of stress waves through a heterogeneous bounded solid,such as a structural concrete member, is a complex phenomenon. However, a
basic understanding of the relationship between the physical properties ofa material and the velocity of wave propagation can be acquired from thetheory of wave propagation In infinite isotropic elastic media [5],
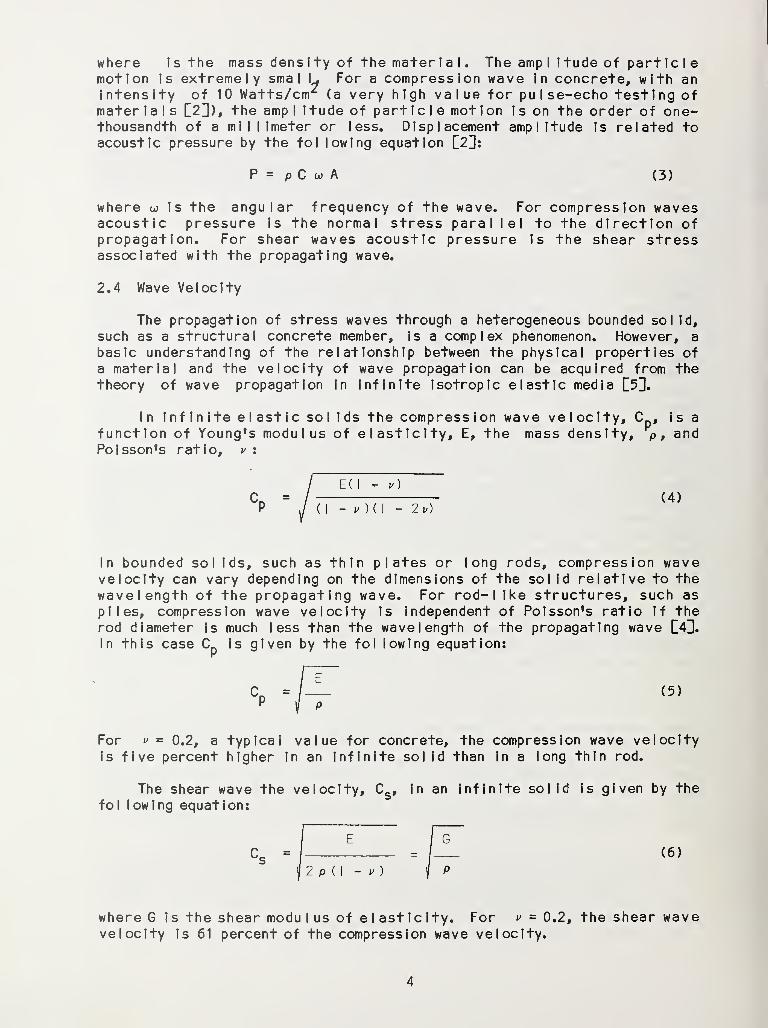
In infinite elastic sol Ids the compression wave velocity, C_, is a
function of Young's modulus of elasticity, E, the mass density, p, andPoisson's ratio, v :
E(l - u)
C = / (4)P ,/ (I - y)(\ - 2v)
In bounded sol ids, such as thin plates or long rods, compression wavevelocity can vary depending on the dimensions of the solid relative to thewavelength of the propagating wave. For rod-like structures, such aspiles, compression wave velocity is independent of Poisson's ratio If therod diameter is much less than the wavelength of the propagating wave [4U.In this case C_ is given by the fol lowing equation:
xCP
=
For v = 0.2, a typical value for concrete, the compression wave velocityIs five percent higher In an infinite solid than In a long thin rod.
The shear wave the velocity, Cs , In an Infinite solid is given by the
fol lowing equation:
cs
=|
|
2 p ( I- v )
where G is the shear modu I us of el ast Iclty. For v = 0.2, the shear wavevelocity Is 61 percent of the compression wave velocity.
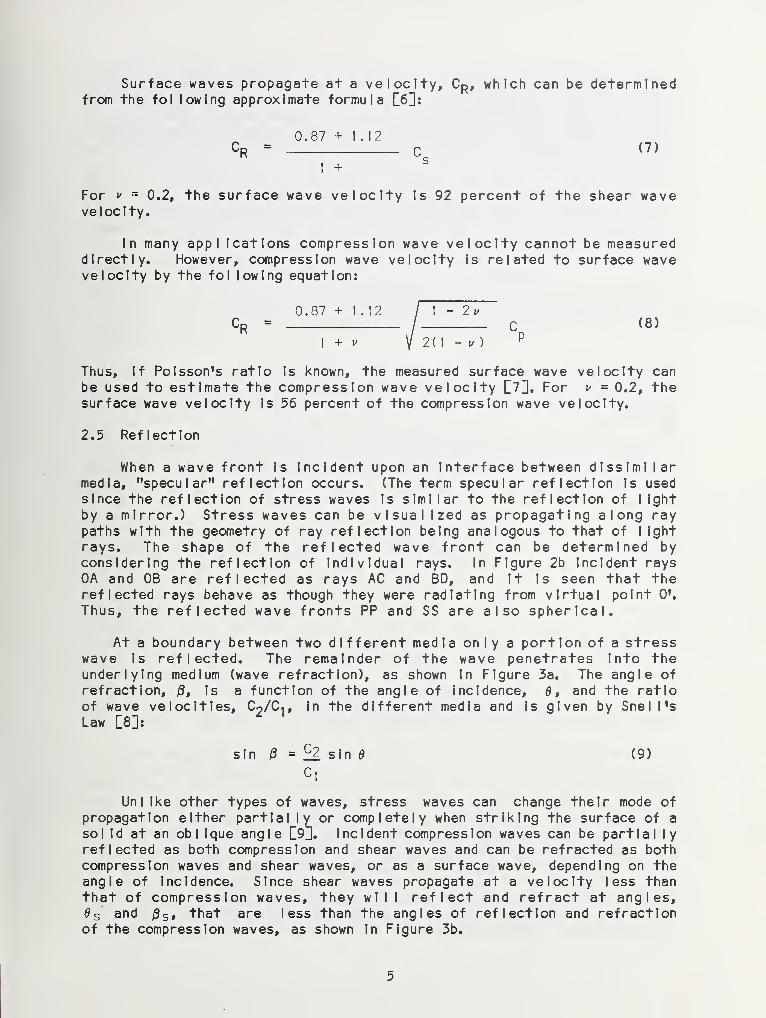
Surface waves propagate at a velocity, CR , which can be determinedfrom the fol lowing approximate formula C6U:
0.87 + 1.12Cr = C (7)
I +S
For v = 0.2, the surface wave velocity Is 92 percent of the shear wavevelocity.
In many app
I
Icatlons compression wave velocity cannot be measureddirectly. However, compression wave velocity Is related to surface wavevelocity by the fol lowing equation:
0.87 +1.12 \ \ - 2vCR =
/I+ v V 2(1 - v )
P
Thus, If Polsson's ratio Is known, the measured surface wave velocity canbe used to estimate the compression wave velocity C7H. For v = 0.2, thesurface wave velocity Is 56 percent of the compression wave velocity.
2.5 Reflection
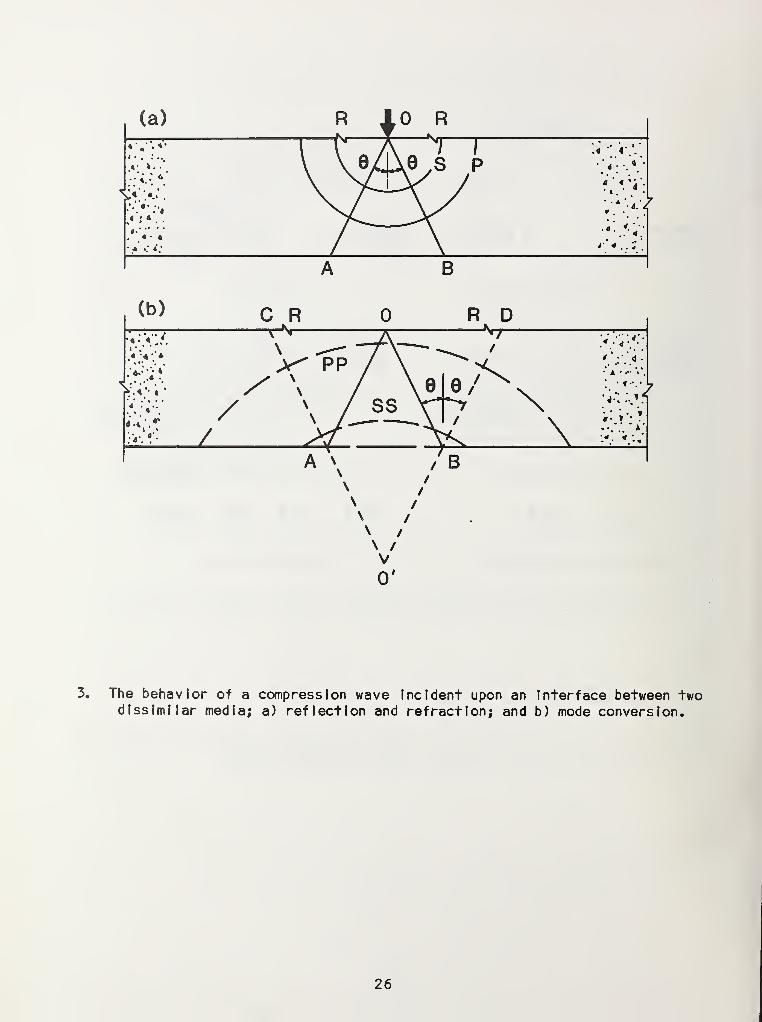
When a wave front Is Incident upon an Interface between dlsslml I armedia, "specular" reflection occurs. (The term specular reflection Is usedsince the reflection of stress waves Is similar to the reflection of lightby a mirror.) Stress waves can be visualized as propagating along raypaths with the geometry of ray reflection being analogous to that of I Ight
rays. The shape of the reflected wave front can be determined byconsidering the reflection of Individual rays. In Figure 2b Incident rays0A and OB are reflected as rays AC and BD, and It Is seen that thereflected rays behave as though they were radiating from virtual point 0'.
Thus, the reflected wave fronts PP and SS are also spherical.
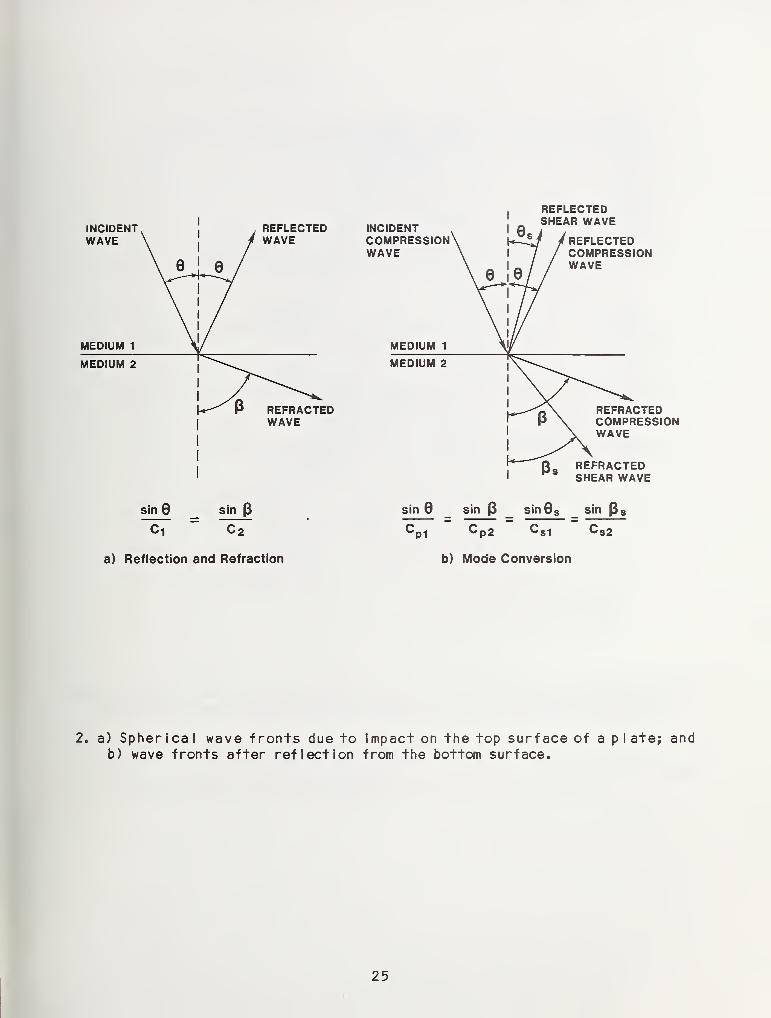
At a boundary between two different media on I y a portion of a stresswave Is reflected. The remainder of the wave penetrates Into theunderlying medium (wave refraction), as shown In Figure 3a. The angle ofrefraction, /3, Is a function of the angle of Incidence, 0, and the ratioof wave velocities, Co/Ci, In the different media and Is given by Snell'sLaw [8]:
sin (8 = £2 sin d (9)
C|
Unlike other types of waves, stress waves can change their mode ofpropagation either partial ly or completely when striking the surface of a
sol Id at an obi Ique angle [9]. Incident compression waves can be partial ly
reflected as both compression and shear waves and can be refracted as bothcompression waves and shear waves, or as a surface wave, depending on theangle of Incidence. Since shear waves propagate at a velocity less thanthat of compression waves, they will reflect and refract at angles,6 S and /3 S » that are less than the angles of reflection and refractionof the compression waves, as shown In Figure 3b.

The relative amplitude of reflected echoes depends on the mismatch In
specific acoustic Impedances at an Interface, the angle of Incidence, thesize, shape, and or I entat Ion of a f I aw or an Interface, the distance of adlscont Inu Ity from the pu I se source, and the attenuation a long the wavepath. The Influence of each of these factors Is considered In thefol i owing discussion.
The portion of an Incident plane compression wave that Is reflected atan Interface between two media of different densities or elastic modu I I
depends on the specific acoustic Impedances of each medium. The specificacoustic Impedance, Z, of a medium Is
Z = p Cp
(10)
Since C_ Is approximately equal to J E/p
F P (11)
Specific acoustic Impedance values for compression waves In selectedmaterials are given In Table 2. Equation (10) Is also val Id for shearwaves If the shear wave velocity, C
s , Is used to calculate acousticImpedance,
The Intensity of reflected energy, l
p , Is maximum when the angle ofIncidence Is normal to the Interface and Is determined from the followingequation £4]:
" Z2
2
l
r=lj[
I
:
i
+Z2
where I
f
Is the Intensity of the Incident energy. As shown by equation(2), the amp I Itude of the returning echo wl I I be proportional to the squareroot of I
p. At an Interface between a sol Id and a gas, such as between
concrete and air, the specific acoustic Impedance of the sol Id Is so muchlarger than that of the gas that virtual ly a I I the Incident energy Is
reflected producing a strong echo. For cases of oblique Incidence theamp I Itude of the reflected waves wl I I depend on the angle of Incidence as
we I I as on the acoustic Impedance mismatch [2]. If mode conversion occurs,the reflected energy wl I I be sp I It between the different wave modes.
Coefficients of reflection for the amplitude of a reflected wave as a
function of the angle of Incidence can be determined using the formulas In
Reference [23, wh Ich are app I I cab I e for p I ane waves Inc I dent upon p I aneboundaries. These formulas were used to calculate the reflection coeffi-cients for a concrete/air Interface. Figure 4 shows reflectioncoefficients for an Incident P-wave, and Figure 5 shows reflection coeffi-cients for an Incident S-wave. It Is assumed that each Incident wave hasan amplitude equal to unity. Each figure Is composed of three graphs. Thegraph in the upper left gives the reflection coefficients for the wave withthe same mode as the Incident wave; for example, in Figure 4, which Is for
an Incident P-wave, the upper left graph shows the reflection coefficientsfor a reflected P-wave. The graph In the lower right gives the reflection

coefficients for the mode-converted wave. The lower right graph in Figure4 shows the reflection coefficients for the S-wave produced by modeconversion of the incident P-wave. The graph in the upper right gives theangular relationship between the Incident wave and the mode-converted wave,which is determined using Sne I Ms Law. The drawing in the lower left givesan il lustratlve example. In Figure 4 the lower left drawing shows a P-wave(amplitude equal to unity) incident on a concrete/air interface at an angleof 30°. The ang I e of the ref I ected P-wave,
p, Is equa I to the ang I e of
the incident P-wave; thus a horizontal line can be drawn fromp
= 30° tothe graph of the reflection coefficients for the reflected P-wave. In thiscase R. Is equa I to 0.56, I.e., the amp I itude of the refl ected P-wave is
56/K of the amp I Itude of the Incident P-wave. If a second I ine Is drawnhorizontal ly from dp = 30° to the graph representing Sne I I 's Law, the angleof the shear wave produced by mode conversion of the Incident P-wave can beobtained (0 S = 18°). Subsequently, the reflection coefficient for themode-converted shear wave, R
s , can be determined. In this example R_ is
equal to 0.62, I.e., the shear wave has an amp I itude equal to 62$ of theIncident P-wave.
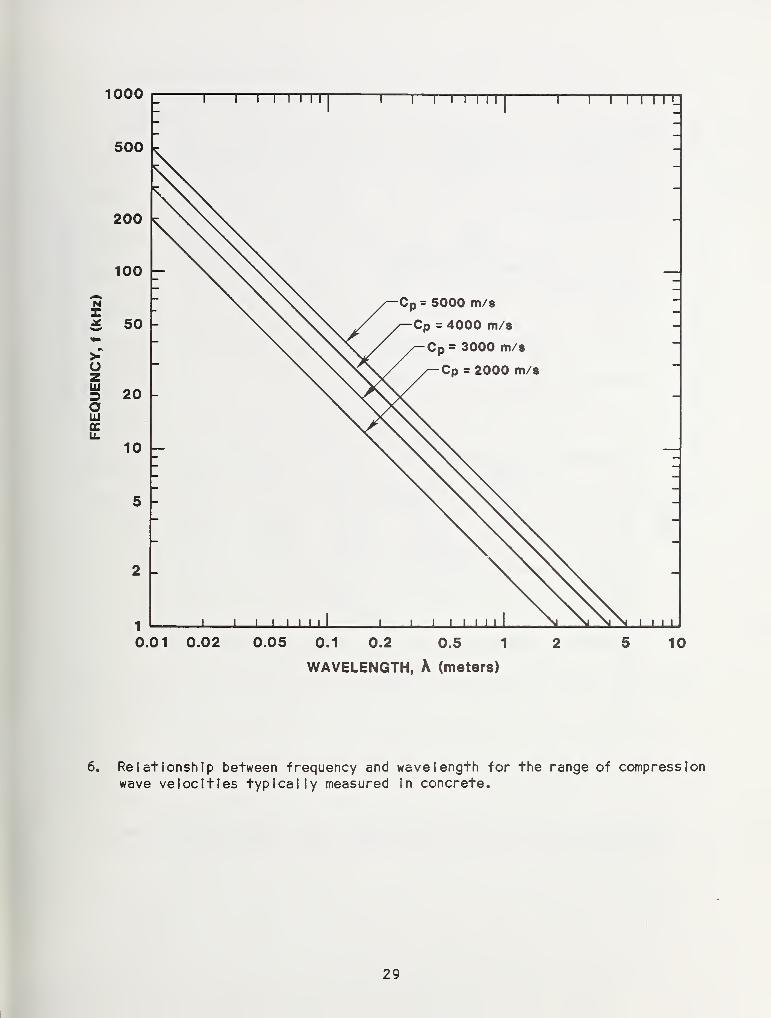
In the previous discussion It was assumed that reflection andrefraction of wave fronts occurred at planar Interfaces between twodissimilar media. This analysis Is also applicable to flaws ordiscontinuities within a medium. The ability of the pulse-echo method todetect flaws or discontinuities (sensitivity) depends on the wavelength ofthe propagating wave and on the size and orientation of the flaw ordiscontinuity. Waves wi I I diffract or bend around the edges ofdiscontinuities if the size of the discontinuity Is approximately equal toor less than the wavelength; therefore, no reflection occurs for flaws thathave lateral dimensions less than the wavelength. Figure 6 shows therelationship between frequency and wavelength for the range of compressionwave velocities typical ly measured In concrete. To be able to detect flawson the order of 0.1 meters It would be necessary to Introduce Into theconcrete a stress pulse that contains frequencies greater than 20 kHz.
2.6 Diffraction at a Crack Tip
When a stress wave Is incident upon a crack within a solid, thepattern of re-radiated energy Is determined by four processes [10U:
1. Specular reflection from the crack face,
2. Raylelgh waves which travel along the crack surfacesand radiate energy when reaching the crack tips,
3. Diffracted spherical waves which originate from the
crack tip, and4. Mode conversion.
Specular reflection, produces the strongest echo signals and Is the easiestto analyze; however, this reflection has a strong angular dependence and
can only be detected If the crack Is oriented at a favorable angle to thepropagating wave and receiving transducer. If a crack Is not oriented at a
favorable angle for detection of specularly reflected waves, the signalsreceived from diffracted waves can be used to detect the presence of cracks
DID. Figure 7a shows the specularly reflected wave front (PP) produced by
a spherical P wave incident upon a crack C12], Ray 0A, which intersectsthe crack tip will be diffracted, producing an additional spherical wave

(P^), as shown In Figure 7b. Note that diffraction permits the stress waveto penetrate the "shadow zone" behind the crack. (A similar situationwould occur for an incident S wave.) Researchers have been able to recordphotographic Images of diffraction using photoelastlcity C13, 14], Whichconfirm the conditions depicted In Figure 7b. The amp I Itude of particlemotion In a diffracted wave varies with direction and, according totheoretical calcu I atlons,. the amplitude In the diffracted wave is an
order of magnitude less than the amplitude of specularly reflected wavesDo].
2.7 Attenuation and Divergence
As a wave propagates through a solid the acoustic pressure (and thusthe amplitude of particle motion) decreases with path length due toattenuation (scattering and absorption) and divergence.
In a heterogeneous solid, scattering Is the result of wave reflection,refraction, diffraction, and mode conversion at each Interface betweendissimilar media. In ordinary concrete the density and the elastic modulusof the coarse aggregates are general ly higher than those of the mortar;thus, from equation (11), the specific acoustic Impedance of the coarseaggregate Is higher than that of the mortar. If the wavelength of thepropagating wave Is less than the size of the aggregate, this mismatch In
impedances causes scattering of the incident wave and returning echoes as
the waves undergo reflection and refraction from each mortar-aggregateInterface C7], For higher quality concrete the specific acousticImpedance of the mortar approaches that of the coarse aggregate andscattering Is reduced. In pulse-echo evaluation of concrete lowerfrequency waves must be used (I.e., the wavelength-to-aggregate-size ratiomust be increased C15]) to reduce the attenuation of wave energy due toscattering. However use of lower frequency waves reduces the sensitivityof the propagating wave to sma I I flaws. Thus there Is an Inherentlimitation In the flaw size that can be detected within concrete.
Although attenuation of wave energy In heterogeneous solids Is
primarily due to scattering, part of the wave energy Is absorbed and turnedInto heat (hysteretic damping) £<?!!• In solids damping is mainly caused by
internal friction.
Due to attenuation, the acoustic pressure of a plane wave decreasesexponent! a I ly with path length and can be determined from the fo I I owingequation ZZl:
P = Po e- ad (13)
where PQ is the initial acoustic pressure, a Is the aftenuatlon coefficient
CdB/m], and d Is the length of the wave path [m]. Since scattering is theprinciple cause of attenuation, the value of a depends upon the wavelengthof the propagating wave. Thus, the higher the frequency of the wave thatis used to probe a given material, the larger wi I I be the value of a for
that material. The published data on a -values for concrete are scant.
'Quality in this context refers to the density and elastic modulus of themortar phase. Higher quality Is synonymous with higher density and greaterelastic modulus or both.
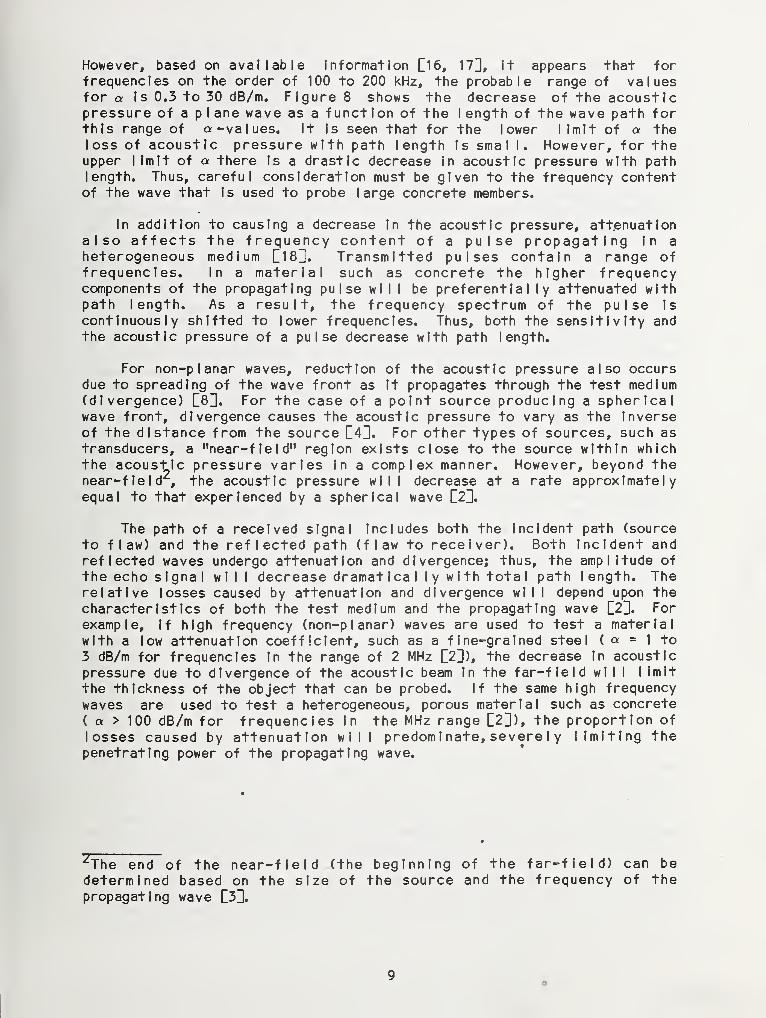
However, based on available Information D6, 17], It appears that forfrequencies on the order of 100 to 200 kHz, the probable range of valuesfor a Is 0.3 to 30 dB/m. Figure 8 shows the decrease of the acousticpressure of a plane wave as a function of the length of the wave path forthis range of a-values. It Is seen that for the lower limit of a theloss of acoustic pressure with path length Is sma I I. However, for theupper I Imlt of a there Is a drastic decrease In acoustic pressure with pathlength. Thus, careful consideration must be given to the frequency contentof the wave that Is used to probe large concrete members.
In addition to causing a decrease In the acoustic pressure, attenuationalso affects the frequency content of a pulse propagating In a
heterogeneous medium [18^. Transmitted pulses contain a range offrequencies. In a material such as concrete the higher frequencycomponents of the propagating pulse wl I I be preferential ly attenuated withpath length. As a result, the frequency spectrum of the pulse Is
continuously shifted to lower frequencies. Thus, both the sensitivity andthe acoustic pressure of a pulse decrease with path length.
For non-planar waves, reduction of the acoustic pressure also occursdue to spreading of the wave front as It propagates through the test medium(divergence) C83. For the case of a point source producing a sphericalwave front, divergence causes the acoustic pressure to vary as the Inverseof the distance from the source C4l. For other types of sources, such astransducers, a "near-field" region exists close to the source within whichthe acoustic pressure varies In a complex manner. However, beyond thenear-field , the acoustic pressure will decrease at a rate approximatelyequal to that experienced by a spherical wave C2D.
The path of a received signal Includes both the Incident path (source
to flaw) and the reflected path (flaw to receiver). Both incident andreflected waves undergo attenuation and divergence; thus, the amplitude of
the echo signal wl I I decrease dramatical ly with total path length. Therelative losses caused by attenuation and divergence wl I I depend upon thecharacteristics of both the test medium and the propagating wave [2U. For
example, If high frequency (non-planar) waves are used to test a material
with a low attenuation coefficient, such as a fine-grained steel ( a = 1 to
3 dB/m for frequencies In the range of 2 MHz [2]), the decrease In acousticpressure due to divergence of the acoustic beam In the far-field wl I I I Imlt
the thickness of the object that can be probed. If the same high frequency
waves are used to test a heterogeneous, porous material such as concrete( a > 100 dB/m for frequencies In the MHz range [2]), the proportion of
losses caused by attenuation will predominate, severe I y limiting thepenetrating power of the propagating wave.
zThe end of the near-field (the beginning of the far-field) can be
determined based on the size of the source and the frequency of thepropagating wave [3D.
3. INSTRUMENTATION
A typical pulse-echo testing system consists of three essential units:
a pulse source, a receiving transducer, and a cathode-ray oscl I loscope, asshown In Figure 1.
3.1 Pulse Source
Electro-acoustic transducers and mechanical Impact are the two commonmethods used to Introduce a stress pulse Into a test object. The selectionof a pulse source for a specific application depends upon the size of theflaws to be detected and on the characteristics of the test medium. In theInspection of metals, high-frequency, short-duration, pulses are IntroducedInto a test object by an electro-acoustic transducer. The transducer Is
shock-excited by a short, high voltage pulse, which causes It to vibrate(ring) at Its own resonant frequency for a few cycles and transmit a pulseInto the test object C9D. No commercial transducers are satisfactory forpulse-echo testing of concrete, thus a mechanical Impact source normal ly Is
used to generate a stress pulse with sufficient acoustic energy to overcomethe effects of attenuation and divergence. The type of mechanical Impactsource that Is used will determine the energy and the frequency content ofthe pulse. The force-time function of the Impact can be approximated as a
half-sine curve. The amplitude of the force-time function wl I I affect theamplitude of particle motion (and thus the acoustic pressure) as the pulsetravels through the test object, and the contact time of the force-timefunction wl I I affect the frequency content of the pulse. The notion offrequency content arises from the principle of Fourier series, whereby thepulse shape can be approximated by the sum of a number of sine functions ofdifferent frequencies. Many sine curves are required to approximate thepulse shape produced by a short contact time, and thus the Input energy Is
distributed over a wider frequency range. This frequency range willcontro I the mini mum f I aw s I ze that will be capab I e of ref I ect I ng the pu I se:
the higher the frequency range, the smal ler Is the flaw that wl I I reflectacoustic energy.
3.2 Transducer
The transducer Is the critical element In any testing system based on
acoustic wave transmission and reception. Transducer response must beaccurate and reliable. Ideal ly a transducer should respond faithfully toonly one physical parameter (e.g., the normal component of surfacedisplacement or velocity) so that the response can be correctlyInterpreted. However, conventional transducers usually do not measure a
single parameter because of the effects of the coupling between transducerand test object, the electronics, and the characteristics of thetransducer itself D9]].
The majority of electro-acoustic transducers used In high-frequencypulse-echo systems utilize piezoelectric crystals In the generation and
reception of stress waves. A piezoelectric material Is one which generatesan electrical charge when subjected to a mechanical stress or deformation.Single crystals of many compounds exhibit piezoelectricity. Traditional ly
natural crystals, such as Roche I le salt and quartz, were used in theconstruction of crystal transducers. Although still used In specific
10
applications, natural crystals have been almost completely replaced bymanufactured ceramic materials.
If the elastic I Imlt of the piezoelectric material Is not exceeded, thecharge densities produced by the piezoelectric effect are directlyproportion a I to the strain of the crysta I . Converse I y, a plezoe I ectrlccrystal subjected to an electrical charge will produce mechanicaldeformation (vibration) [203. Thus, a single piezoelectric transducer canbe used for both generation and reception of stress waves In pulse-echosystems. However, when a single transducer Is used, transmitted pulsesmust be of short duration, otherwise the ringing of the transducer crystalwill render It Insensitive to echoes returning from flaws or Interfaces.
In addition a transducer must have the capabll Ity to separate echoes whichare close together (resolution). If a second signal arrives while a
crystal Is stl I I vibrating due to an earlier excitation, the second signalwl I I either be mixed In with the first signal making the signal recorddifficult to Interpret or It wl I I go unnoticed, depending on the relativestrength of the echo signals C8H. Thus, a crystal Is "b I Ind" for a shorttime after each excitation. To prevent ringing and to reduce blind-time a
transducer must be heavily damped [9]. However, damping decreases a
transducer's sensitivity £8l» The more a transducer Is damped, thestronger must be the returning echo that wll I cause It to vibrate. Smal I
flaws may not reflect sufficient energy to excite the transducer and nosignal wl I I be produced on the oscl I loscope screen. Thus, an acceptablebalance between resolution and sensitivity must be achieved In the designand construction of a piezoelectric transducer.
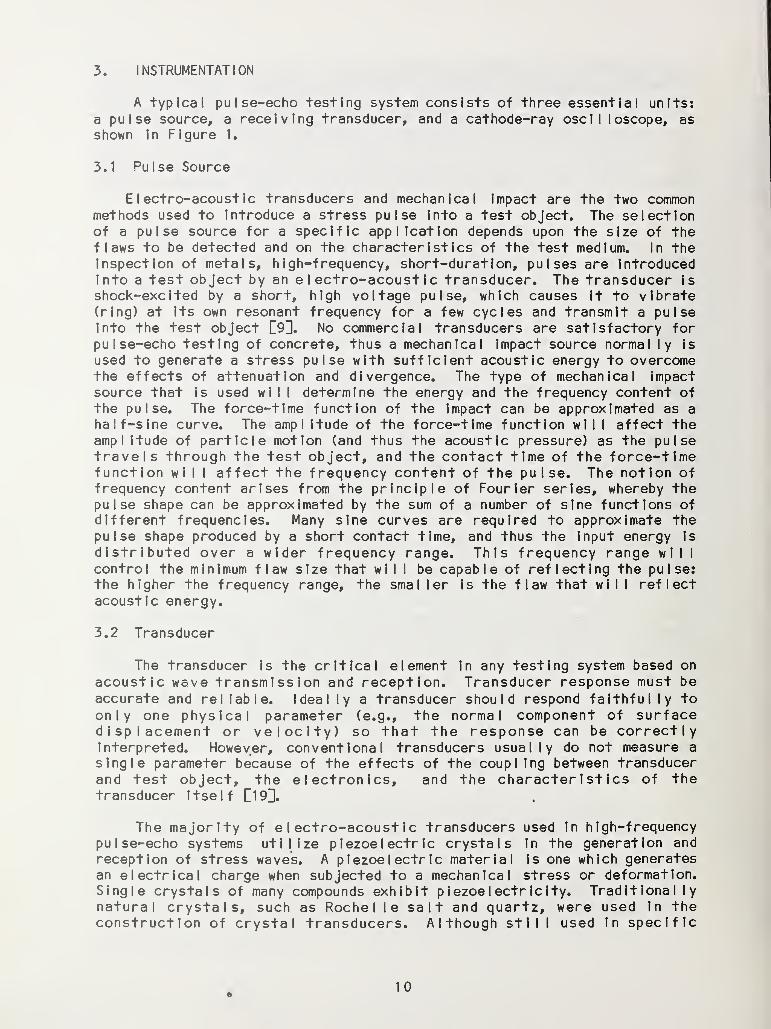
The ratio of the transducer diameter, d, to the wavelength of thetransmitted waves, X, determines the shape of the acoustic beam. Figure 9
C2, 21] shows the directional characteristics for d << X , d/X = 1, and for
d/x= 4. Most of the energy In an acoustic beam Is contained within a
cone-shaped region which has Its apex at the transducer. As d/X decreasesthe apex angle of the cone Increases, I.e., the directionality of theacoustic beam becomes less pronounced. A transducer's "f lei d-of- view" Is
determined by Its directional characteristics, and It Is this f lei d-of-vlewthat wl I I determine the Interrogation pattern that Is requ tred to f u I I
y
probe the Interior of a test object. Increasing d/X reduces the fleld-of-vlew by focusing most of the acoustic energy Into a narrow compressionwave beam. A transducer that emits a focused beam (Figure 9a) can be used
much more effectively to probe a test object as It a I lows flaws orInterfaces to be located more precisely.
3.3 Oscl I loscope
The Introduction of the pulse Into the test object triggers theoscilloscope's time base circuit, which provides a linear traverse of the
cathode-ray beam from left to right across the screen. The transmittedpulse and returning echoes are displayed as vertical offsets from thehorizontal traverse (see Figure 1b). ( I n mu 1 1 1-channe I oscilloscopestransmitted pulses and returning echoes can be displayed on separatetraces.) Using the time base on the display, the time from the start of
the pulse to echo arrival can be determined. In research applications a
digital storage oscilloscope Is preferred to enable detailed analyses of
the received signals.
11
3.4 Pulse-echo Signal Traces
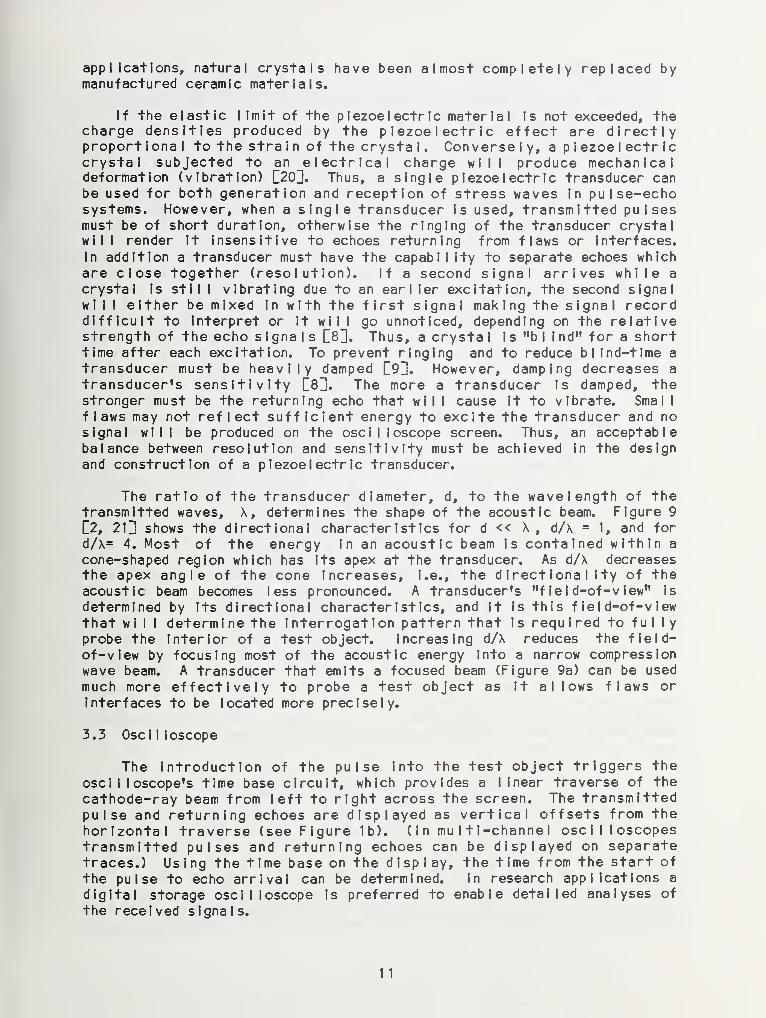
As an II lustration of the pulse-echo technique for concrete, selectedecho signals are shown In Figures 10a and 11. These signals were obtainedby using a transducer recently developed at the National Bureau ofStandards which accurately measures normal surface displacement [22U.Figure 10a Is a plot of a portion of a signal recorded by a digitaloscl I I oscope during a test on a 0.25-m thick, 1.12- by 1.12-m concreteslab. The receiver was located at the slab center on the top surface. Thestress pulse was generated by dropping a 8-mm steel ba I I onto the slab froma height of 0.19 m. The separation between the Impact point and receiverwas 0.125 m. In this case It can be assumed that the Impact of the steelba I I acts as a point source emitting a pulse of acoustic energy Into theslab In a I I directions. Figure 10a also Indicates the theoretical arrivaltimes of various acoustic rays which were calculated based on a measuredcompression wave velocity of 3980 m/s and an assumed Polsson's ratio of0.2. The paths of selected acoustic rays are I I lustrated In Figure 10b.
The first rays to arrive are the direct P, S, and R-waves, which travelalong the top slab surface. The signal due to the arrival of the R-wave Is
very strong; thus, clear Identification of the arrival of the PP-ray (a
reflected compression wave due to a compression wave Incident on the bottomslab surface) Is not possible In this signal record. Mode conversion of a
compression wave Incident upon the bottom slab surface results In a
reflected shear wave (PS) which arrives after the PP-ray since the velocityof a shear wave Is only 61 percent of the velocity of the compression wave.The subsequent peaks in Figure 10a are due to the reception of multiplyreflected compression waves. There Is excel lent agreement between thesignal maxima and the computed arrival times of the 4P and 6P-rays.
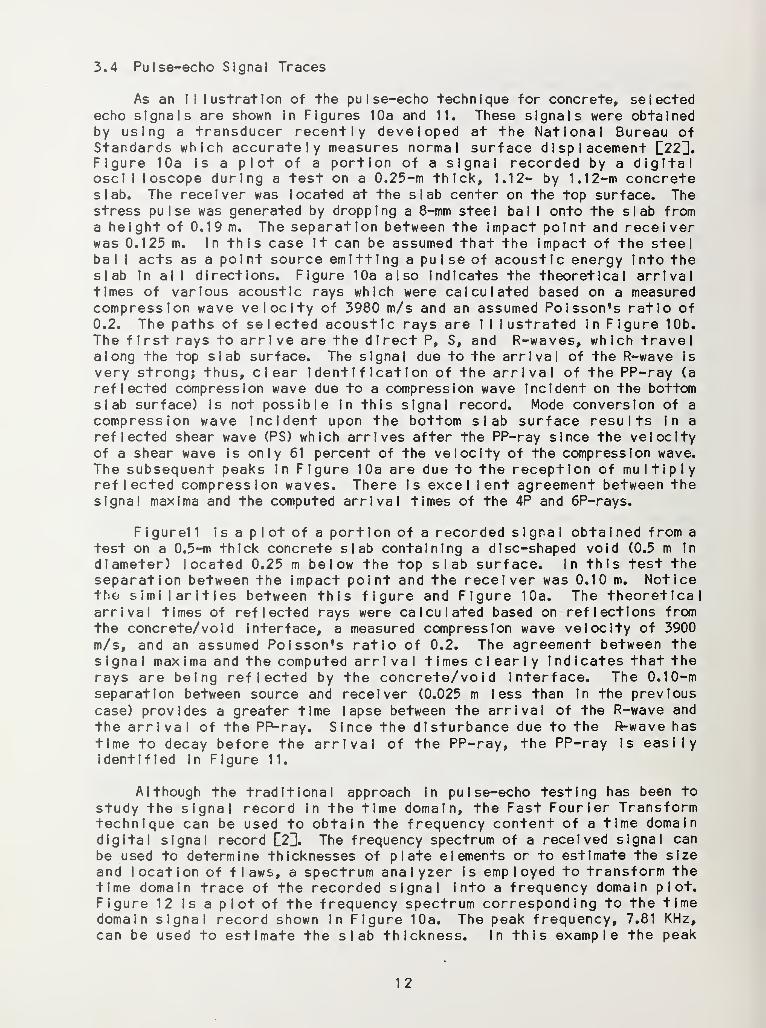
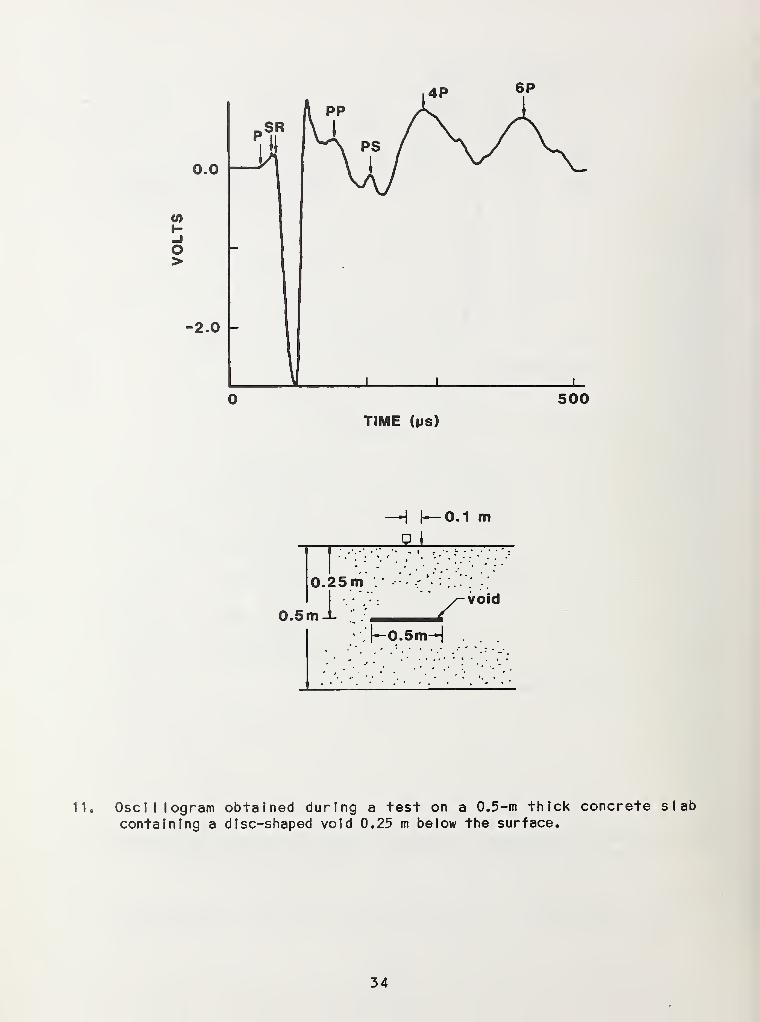
Figurel 1 is a p I ot of a portion of a recorded slgna I obtained from a
test on a 0.5-m thick concrete slab containing a disc-shaped void (0.5 m In
diameter) located 0.25 m below the top slab surface. In this test theseparation between the Impact point and the receiver was 0.10 m. Noticethe similarities between this figure and Figure 10a. The theoreticalarrival times of reflected rays were calculated based on reflections fromthe concrete/void Interface, a measured compression wave velocity of 3900
m/s, and an assumed Polsson's ratio of 0.2. The agreement between thesignal maxima and the computed arrival times clearly Indicates that therays are being reflected by the concrete/void Interface. The 0.10-mseparation between source and receiver (0.025 m less than in the previouscase) provides a greater time lapse between the arrival of the R-wave and
the arrival of the PP-ray. Since the disturbance due to the R-wave has
time to decay before the arrival of the PP-ray, the PP-ray Is easilyIdentified In Figure 11.
Although the traditional approach In pulse-echo testing has been tostudy the signal record In the time domain, the Fast Fourier Transformtechnique can be used to obtain the frequency content of a time domaindigital signal record C2H. The frequency spectrum of a received signal can
be used to determine thicknesses of plate elements or to estimate the size
and location of flaws, a spectrum analyzer is employed to transform thetime domain trace of the recorded signal Into a frequency domain plot.Figure 12 Is a plot of the frequency spectrum corresponding to the timedomain signal record shown In Figure 10a. The peak frequency, 7.81 KHz,can be used to estimate the slab thickness. In this example the peak
12

frequency predicts a s I ab thickness of 0.255 m which agrees we I I with theactual thickness of 0.25 m.
4. PAST RESEARCH
The use of acoustic waves for the detection of flaws In solids datesback to 1929, when Sokolov of Russia first suggested the use of ultrasonicwaves to find defects in metal objects Q9j. Development of practicalnondestructive test methods was slow; It was not until the nearlysimultaneous introduction of pulse-echo flaw detectors in 1942 by Firestoneof the University of Michigan and by Sproule of England that significantprogress was made. Since that time ultrasonic pulse-echo testing ofmet a Is, p I ast Ics, and other homogeneous materia Is has developed into anefficient, reliable, and versatile nondestructive test method. Theextension of acoustic pulse-echo principles to less Ideal materials, suchas concrete, has been hindered by the difficulties Inherent In obtainingand interpreting a signal record from a heterogeneous material, althoughsome progress has been made In developing systems for measuring thethickness of plate elements and for Integrity testing of rod-likestructures such as p'les.
4.1 Pavements and Bridge Decks
Resonance and pulse-echo techniques have been used to measure thethickness of concrete pavements and to detect de I ami nations in bridgedecks. In the early 1960's, Muenow E23] developed a technique to measurepavement thickness that was based on determining the frequency of thefundamental mode of vibration of the slab In the thickness dimension.Continuous compression waves were Introduced Into the slab by a
transmitter. The frequency of these waves was systematical ly varied until
a resonance condition^ was obtained. Slab response was monitored by a
receiving transducer which was located adjacent to the transmitter.Transmitted and received signals were displayed separately on a two channeloscilloscope. The fundamental mode of longitudinal resonance wasidentified by noting the frequency, f, at which a marked increase In theamplitude of the received signal occurred and by measuring the phase anglebetween the transmitted and received signals. If the P-wave velocity In
the slab is known, the thickness of the slab, t, which equals one-half thewavelength of the propagating wave, could be calculated (t = A/2 = C/2f).
Resonance methods have also been used to detect de
I
aminat ions In
concrete bridge decks. A technique developed In 1 973 by researchers at
Texas A & M University [24] used an oscl I latlng steel plunger to excite the
characteristic vibrations of a de laminated area. As the plunger oscl I I ates
at 60 Hz, the vibrations of the bridge deck were monitored by a receivingtransducer. The location and extent of de laminated areas could bedetermined from the relative amplitude of the received signal. The use of
this technique has been I Imlted by the fact that it cannot be used whereconcrete decks have asphaltic overlays exceeding approximately five cm.
JA resonance condition Is produced when standing waves are set up, that Is,
when waves are repeatedly reflected within a medium In such a way thattheir wavelengths are superimposed exactly in phase C9H.
13
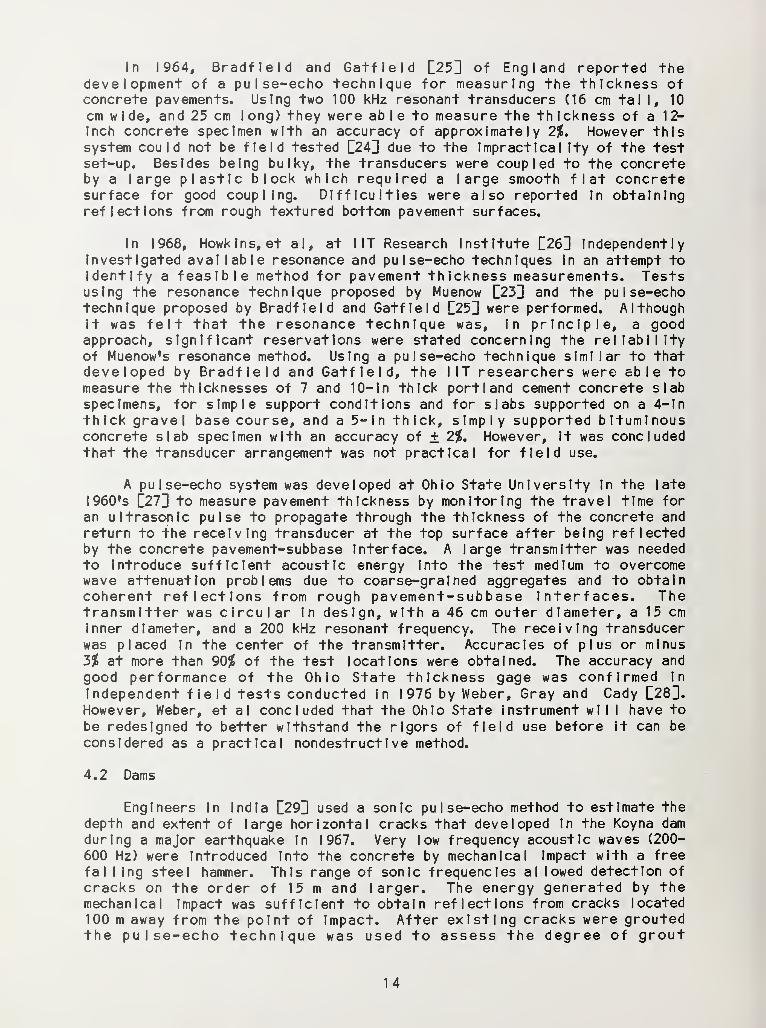
In 1964, Bradfleld and Gatfleld [25] of England reported thedevelopment of a pulse-echo technique for measuring the thickness ofconcrete pavements. Using two 100 kHz resonant transducers (16 cm tal I, 10
cm w Ide, and 25 cm I ong) they were ab I e to measure the th Ickness of a 12-
Inch concrete specimen with an accuracy of approximately 2%, However thissystem could not be field tested [24] due to the Impractical Ity of the testset-up. Besides being bulky, the transducers were coupled to the concreteby a large plastic block which required a large smooth flat concretesurface for good coupling. Difficulties were also reported In obtainingreflections from rough textured bottom pavement surfaces.
In 1968, Howklns, et al, at I IT Research Institute [26] IndependentlyInvestigated available resonance and pulse-echo techniques In an attempt toIdentify a feasible method for pavement thickness measurements. Testsusing the resonance technique proposed by Muenow [23] and the pulse-echotechnique proposed by Bradfleld and Gatfleld [25] were performed. AlthoughIt was felt that the resonance technique was, In principle, a goodapproach, significant reservations were stated concerning the reliabilityof Muenow's resonance method. Using a pulse-echo technique similar to thatdeveloped by Bradfleld and Gatfleld, the I IT researchers were able tomeasure the thicknesses of 7 and 10- In thick port I and cement concrete slabspecimens, for simple support conditions and for slabs supported on a 4-lnthick gravel base course, and a 5-ln thick, simply supported bituminousconcrete slab specimen with an accuracy of + 2%, However, It was concludedthat the transducer arrangement was not practical for field use.
A pulse-echo system was developed at Ohio State University In the late
I 960's [21~] to measure pavement thickness by monitoring the travel time for
an ultrasonic pulse to propagate through the thickness of the concrete andreturn to the receiving transducer at the top surface after being reflectedby the concrete pavement-subbase Interface. A large transmitter was neededto Introduce sufficient acoustic energy Into the test medium to overcomewave attenuation problems due to coarse-grained aggregates and to obtaincoherent reflections from rough pavement-subbase Interfaces. Thetransmitter was circular In design, with a 46 cm outer diameter, a 15 cmInner diameter, and a 200 kHz resonant frequency. The receiving transducerwas placed In the center of the transmitter. Accuracies of plus or minus
3% at more than 90$ of the test locations were obtained. The accuracy and
good performance of the Ohio State thickness gage was confirmed In
Independent field tests conducted In I 976 by Weber, Gray and Cady [28].However, Weber, et a I concluded that the Ohio State Instrument wll I nave tobe redesigned to better withstand the rigors of field use before It can be
considered as a practical nondestructive method.
4.2 Dams
Engineers In India [29] used a sonic pulse-echo method to estimate thedepth and extent of large horizontal cracks that developed In the Koyna damduring a major earthquake In 1 967. Very low frequency acoustic waves (200-
600 Hz) were Introduced Into the concrete by mechanical Impact with a free
fal I Ing steel hammer. This range of sonic frequencies al lowed detection of
cracks on the order of 15 m and larger. The energy generated by themechanical Impact was sufficient to obtain reflections from cracks located100 m away from the point of Impact. After existing cracks were groutedthe pulse-echo technique was used to assess the degree of grout
14

penetration. The assessment was made qualitatively by comparing the echoamp I Itudes In slgna I records obtained before grouting to those obtainedafter grout I ng.
4.3 Piles
Since the early I 970's pulse-echo principles have been widely usedfor Integrity testing of concrete piles \J , 30-393. The behavior ofstress waves In slender, rod- 1 Ike structures, such as piles, Is we I I known.If a pulse Is generated by mechanical Impact at one end of a rod, theresulting wave front Is Initial ly spherical but quickly becomes planar asthe pulse propagates down the long slender rod. Plane wave reflectionoccurs at the bottom surface, and the reflected wave front travels back upthe length of the rod to be picked up by the receiving transducer. Thusthe rod acts as a "waveguide." As a result, echo signal analysis Is
relatively uncomplicated. Stelnbach and Vey [7] were among the first toapply pulse-echo techniques to field evaluation of piles. A compressionpulse was Introduced Into a concrete pile at the top surface by mechanicalImpact and returning echoes were monitored by an acce I erometer mounted onthe same surface. The signal record could then be used to detect partialor complete discontinuities, such as voids, abrupt changes In crosssection, very weak concrete, and soil Intrusions, as we I I as theapproximate location where such Irregularities existed. In the absence ofmajor Imperfections the location of the bottom of a sound pile could bedetermined. However, little specific Information could be obtained as tothe extent of defects or the relative soundness of concrete at the locationof an irregularity. The success of the method is dependent upon thedamping characteristics of surrounding soil; a high degree of damping canseverely weaken returning echoes.
4.4 Reactor Structures
In 1976 Sutherland and Kent L"15H of Sandia Laboratories used theultrasonic pulse-echo method to study the safety of concrete reactorsubstructures subjected to the thermal energy of a hypothetical coremeltdown. The relative position of a concrete-gas interface subjected to a
high heat flux from a plasma jet was monitored es a function of time todetermine the erosion rate of the concrete substructure. Erosion rateswere determined successfully for plain structural concretes with aggregatesize variations from 3 to 75 mm.
4.5 Refractory Concrete
Claytor and El I ingson [16D used the pulse-echo method to measure thethickness of 30.5 cm thick refractory concrete specimens. It was foundthat for frequencies below 100 kHz the use of a single transducer as both
the transmitter and receiver was Impractical because the ringing of thetransducer obscured the echo signal. When two transducers were used In a
transmittei—receiver mode, ringing was not a problem; however, thetransmitting transducer generated strong Raylelgh waves which interferewith the reception of the echo signal by the receiving transducer. Toreduce Interference due to Raylelgh waves large-diameter (17.8 cm)
transducers were constructed. As the response of a transducer Is an
averaged phenomenon over the contact area, the sensitivity of a largerdiameter transducer to local ized surface disturbances (Raylelgh waves) wl I I
15
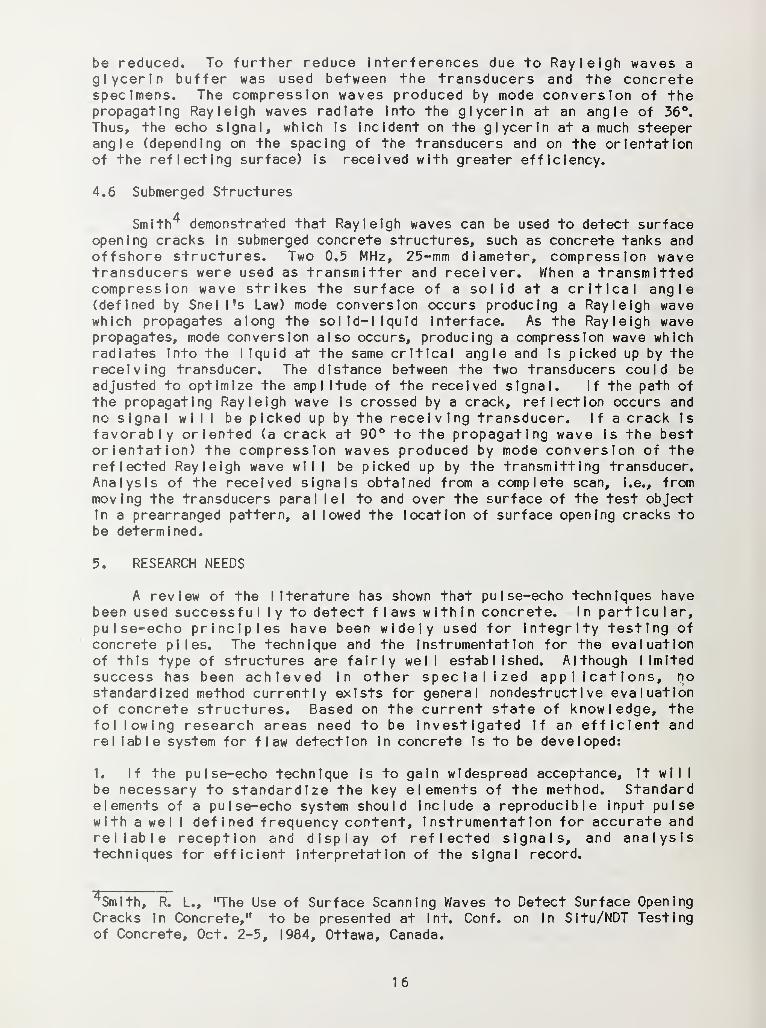
be reduced. To further reduce Interferences due to Rayleigh waves a
glycerin buffer was used between the transducers and the concretespecimens. The compression waves produced by mode conversion of thepropagating Rayleigh waves radiate Into the glycerin at an angle of 36°.
Thus, the echo signal, which is incident on the glycerin at a much steeperangle (depending on the spacing of the transducers and on the orientationof the reflecting surface) Is received with greater efficiency.
4.6 Submerged Structures
Smith4 demonstrated that Rayleigh waves can be used to detect surfaceopening cracks In submerged concrete structures, such as concrete tanks andoffshore structures. Two 0.5 MHz, 25-mm diameter, compression wavetransducers were used as transmitter and receiver. When a transmittedcompression wave strikes the surface of a solid at a critical angle(defined by Snell's Law) mode conversion occurs producing a Rayleigh wavewhich propagates along the solid-liquid Interface. As the Rayleigh wavepropagates, mode conversion also occurs, producing a compression wave whichradiates Into the liquid at the same critical angle and is picked up by thereceiving transducer. The distance between the two transducers could beadjusted to optimize the amp I itude of the received signal. If the path ofthe propagating Rayleigh wave Is crossed by a crack, reflection occurs andno signal will be picked up by the receiving transducer. If a crack is
favorably oriented (a crack at 90° to the propagating wave Is the bestorientation) the compression waves produced by mode conversion of thereflected Rayleigh wave will be picked up by the transmitting transducer.Analysis of the received signals obtained from a complete scan, I.e., frommoving the transducers para I lei to and over the surface of the test objectIn a prearranged pattern, a I lowed the location of surface opening cracks tobe determined.
5. RESEARCH NEEDS
A review of the literature has shown that pulse-echo techniques havebeen used success fu I I y to detect f I aws w ith i n concrete. In particular,pulse-echo principles have been widely used for Integrity testing ofconcrete piles. The technique and the Instrumentation for the evaluationof this type of structures are fairly well established. Although limited
success has been achieved In other specialized applications, nostandardized method currently exists for general nondestructive evaluationof concrete structures. Based on the current state of knowledge, thefol lowing research areas need to be Investigated If an efficient andre I lable system for flaw detection In concrete Is to be developed:
1. If the pulse-echo technique Is to gain widespread acceptance, It willbe necessary to standardize the key elements of the method. Standardelements of a pulse-echo system should Include a reproducible Input pulsewith a we I I defined frequency content, instrumentation for accurate andreliable reception and display of reflected signals, and analysistechniques for efficient Interpretation of the signal record.
^Smlth, R. L., "The Use of Surface Scanning Waves to Detect Surface OpeningCracks In Concrete," to be presented at Int. Conf. on In SItu/NDT Testingof Concrete, Oct. 2-5, 1 984, Ottawa, Canada.
16
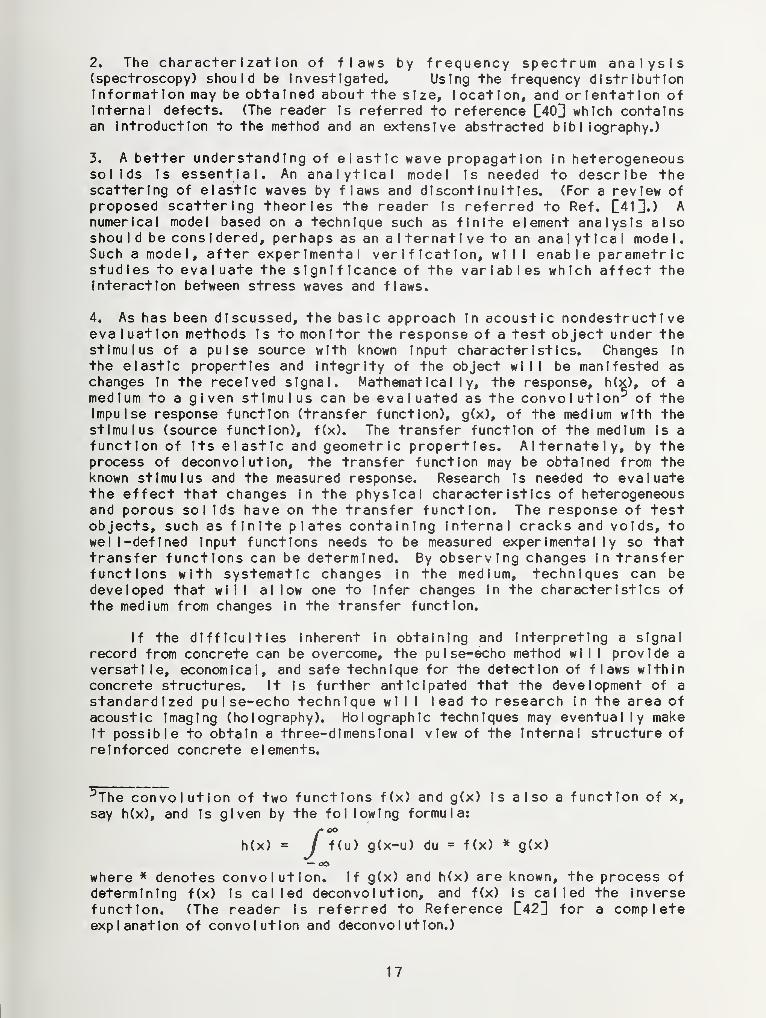
2. The characterization of flaws by frequency spectrum analysis(spectroscopy) should be Investigated. Using the frequency distributionInformation may be obtained about the size, location, and orientation ofInternal defects. (The reader Is referred to reference [40]] which containsan Introduction to the method and an extensive abstracted bibliography.)
3. A better understanding of elastic wave propagation In heterogeneoussolids Is essential. An analytical model Is needed to describe thescattering of elastic waves by flaws and discontinuities. (For a review ofproposed scattering theories the reader Is referred to Ref. [413. ) Anumerical model based on a technique such as finite element analysis alsoshou I d be cons Idered, perhaps as an alternative to an analytical mode I
.
Such a model, after experimental verification, wl I I enable parametricstudies to evaluate the significance of the variables which affect theInteraction between stress waves and flaws.
4. As has been discussed, the basic approach In acoustic nondestructiveeva I uat Ion methods is to mon I tor the response of a test object under thestimulus of a pulse source with known Input characteristics. Changes In
the elastic properties and Integrity of the object will be manifested aschanges In the received signal. Mathematically, the response, h(xj, of a
medium to a given stimulus can be evaluated as the convolution 5 of theImpulse response function (transfer function), g(x), of the medium with thestimulus (source function), f(x). The transfer function of the medium Is a
function of Its elastic and geometric properties. Alternately, by theprocess of deconvol utlon, the transfer function may be obtained from theknown stimulus and the measured response. Research Is needed to evaluatethe effect that changes In the physical characteristics of heterogeneousand porous sol Ids have on the transfer function. The response of testobjects, such as finite plates containing Internal cracks and voids, towell-defined Input functions needs to be measured experimentally so thattransfer functions can be determined. By observing changes In transferfunctions with systematic changes In the medium, techniques can bedeveloped that wl I I a I low one to Infer changes In the characteristics of
the medium from changes In the transfer function.
If the difficulties Inherent in obtaining and Interpreting a signal
record from concrete can be overcome, the pulse-echo method wl I I provide a
versatile, economical, and safe technique for the detection of flaws withinconcrete structures. It Is further anticipated that the development of a
standardized pulse-echo technique wl I I lead to research in the area ofacoustic Imaging (holography). Holographic techniques may eventually makeIt possible to obtain a three-dimensional view of the Internal structure of
reinforced concrete elements.
DThe convol utlon of two functions f(x) and g(x) Is also a function of x,
say h(x), and Is given by the fol lowing formula:
f(u) g(x-u) du = f(x) * g(x)
where * denotes convolution. If g(x) and h(x) are known, the process of
determining f(x) Is called deconvol utlon, and f(x) Is called the Inversefunction. (The reader Is referred to Reference C42H for a completeexplanation of convolution and deconvol utlon.)
17

REFERENCES
1. KInsler, L., Frey, A., Coppens, A., and Sanders, J., Fundamenta I s ofAcoustics, 3rd ed., John Wiley and Sons, Ltd, New York, 1982, 480 pp.
2. Krautkramer, J. and Krautkramer, H„ Ultrasonic Testing Fundamentals,Sprlnger-Ver lag Inc., New York, 1969, 521 pp.
3. BrekhovskI Ich, L. M., Waves In Layered Media,. Trans. D. Lleberman, ed.
R. Beyer, Academic Press, New York, 1980, 561 pp.
4. Banks, B., Oldfleld, G., and Rawdlng, H., Ultrasonic Flaw Detection In
Meta I s f Prentice-Hal I, Inc., New Jersey, 1 962, 256 pp.
5. Tlmoshenko, S. P. and Goodler, J. N., Theory of E I astlclty r 3rd ed.,McGraw-H I I I Book Co., New York, 1 970, 567 pp.
6. VIktorov, I. A., Raylelgh and Lamb Waves , Trans. W. P. Mason, PlenumPress, New York, 1 967, 154 pp.
7. Stelnbach, J. and Vey, E., "Caisson Evaluation by Stress WavePropagation Method," Journal of the Geotechnlcal Engineering Division,ASCE, Vol. 101, No. GT4, Apr I I, I 975, pp. 361-378.
*
8. Smith, A. L., Ultrasonic Testing Fundamentals , Metals EngineeringInstitute, Battel le Northwest, 1 977, 1 9 pp.
9. Sz I I ard, J., ed., U I trasonlc Testing , John Wl I ey and Sons, Ltd., newYork, I 982, 648 pp.
10. Ogl I vy, J. A. and Temp I e, J. A. G., "Diffraction of E I astlc Waves byCracks: Application of Tlme-of-F I Ight Inspection," Ultrasonics, Vol.
21, No. 6, Nov., I 983, pp. 259-269.*
11. Gardner, W. E. and Hudson, J. A., "Ultrasonic Inspection of ThickSection Pressure Vessel Steel by the Time of Flight DiffractionMethod," Proc. of 5th Int. Conf. on NDE In Nuclear Industry, SanDiego, CA, May, 1 982, pp. 250-257.
12. Silk, M., "Sizing Crack-like Defects by Ultrasonic Means," Chapter 2
In Research Techniques In Nondestructive Testing, Vol. 111, R. S.
Sharpe, ed., Academic Press, New York, 1 977, pp. 51-98.
13. Sachse, W. and Golan, S., "The Scattering of Elastic Pulses and theNondestructive Evaluation of Materials," Elastic Waves and Non-Destructive Testing of Materials, Y. H. Pao, ed., ASME, AMD, Vol. 29,
I978, pp. 11-31.
14. Hal I, K. G., "Observing Ultrasonic Wave Propagation by StroboscoplcVisualization Methods," Ultrasonics, Vol. 20, No. 4, July, 1 982, pp.
159-167.
18
15. Sutherland, H. J. and Kent, L. A., "Erosion Rate Measurements Using an
Acoustic Technique," Review of Scientific Instruments, Vol. 48, No. 8,Aug., 1977, pp. 1010-1016.
16. Claytor, T. and Elllngson, W. A., "Development of Ultrasonic Methodsfor the Nondestructive Inspection of Concrete," Ultrasonics SymposiumProceedings, Halifax, Nova Scotia, July, 1983.
17. Rothig, H., "Influence of the Radiation Pattern on UltrasonicAttenuation Measurements of Concrete," Materials Evaluation, April,1974, pp. 69-74.
18. Serablan, S., "Implication of the Attenuation Produced PulseDistortion upon the Ultrasonic Method of Nondestructive Testing,"Materials Evaluation, September, 1 968, pp. 173-179.
19. Sachse, W. and Hsu, N. N., "Ultrasonic Transducers for MaterialsTesting and Their Characterization," Chapter 4, Physical Acoustics,Vol. 14, W. P. Mason and R. N. Thurston, eds., Academic Press, NewYork, 1 979, pp. 277-405.
20. Bond, L., Jayasundere, N., Sinclair, D., and Smith, I., "Investigationof Ultrasonic Transducers as used for Non-destructive Testing," In
Review of Progress In Quantitative Non-destructive Evaluation, Vol. 1,
D. Thompson and D. Chlmentl, eds., Plenum Press, New York, I 982, pp.691-701.
21. Roderick, R., "The Radiation Pattern from a Rotational ly SymmetricStress Source on a Semi- I nf In Ite Solid," Part II of Ph.d. Thesis,Graduate Division of App I led Mathematics, Brown U., 1951, pp. 1-29.
22. Proctor, T. H., Jr., "Some Detal Is on the NBS Conical Transducer,"Journal of Acoustic Emission, Vol. 1, No. 3, pp. 173-178.
23. Muenow, R., "A Sonic Method to Determine Pavement Thickness," Journalof the PCA Research and Development Laboratories, Vol. 5, No. 3,
Sept., 1963, pp. 8-21.
24. Moore, W., Swift, G. and Mi Iberger, L., "An Instrument for DetectingDelamlnatlon In Concrete Bridge Decks," Highway Research Record, No.
451, I 973, pp. 44-52.
25. Bradfleld, G. and Gatfleld, E., "Determining the Thickness of
Concrete Pavements by Mechanical Waves: Directed Beam Method,"Magazine of Concrete Research, V. 16, No. 46, March, 1 964, pp. 49-53.
26. Howklns, S. D., et a I , "Measurement of Pavement Thickness by Rapid andNondestructive Methods," NCHRP Report 52, 1 968, 82 pp.
27. Mailer, H., "Pavement Thickness Measurement Using UltrasonicTechniques," Highway Research Record, No. 378, 1 972, pp. 20-28.
28. Weber, W., Jr., Grey, R. L., and Cady, P. D., "Rapid Measurement ofConcrete Pavement Thickness and Reinforcement Location - Field Evalua-tion of Nondestructive Systems," NCHRP Report 168, 1 976, 63 pp.
19

29. Nand, K., Desal, P., Marwadi, S., Wedpathak, A., and Guha, S., "ASonic Method for the Detection of Deep Cracks In Large Structures,"Indian Concrete Journal, March, 1974, pp. 98-102.
30. Alexander, A. M., "Feasibility of Sonic Pulse-Echo Technique," Misc.Paper C-77-11, U.S. Army Engineer Waterway Experiment Station,VIcksburg, Miss., April, I980, 25 pp.
31. Hearne, T., Jr., Stokoe, K., and Reese, L., "Drilled Shaft Integrityby Wave Propagation Method," Journal of the Geotechnlcal EngineeringDivision, ASCE, Vol. 107, No. GT10, Oct., 1981, pp. 1327-1344.
32. Bredenberg, H., ed.. Proceedings of the International Seminar on theApplication of Stress-Wave Theory on Piles, Stockholm, June, I980, 344pp.
33. Forrest, J., "In-Sltu Measuring Techniques for Pile Length," TN-1475,Civil Engineering Laboratory, Naval Construction Batta I Ian Center,
Port Hueneme, California, March, 1 977, 26 pp.
34. Hlggs, J. S., "Integrity Testing of Piles by Shock Method," Concrete,Oct., 1979, pp. 31-33.
35. Stain, R. T., "Integrity Testing," CI vl I Engineering (London), April,I 982, pp. 53-59.
36. Paquet, J. et Br lard, M., "Controle non destrucht des pleux en beton,"Annales de L'lnstltut Technique du Batlment et des travaux Publics,No. 337, March, I 976, pp. 49-80.
37. Frlstch, D., "Auscultation des pleux et des parols moulees en beton,"
Bui I I ten de Liaison des Laboratories des Ponts et Chaussees, Vol. 78,
Jul.-Aug., I 975, pp. 65-69.
38. Prelss, K., Weber, H., and Calserman, A., "Integrity Testing of BoredPiles and Diaphragm Wa I Is," The Civil Engineer In South Africa, Vol.
20, No. 8, Aug., 1978, pp. 191-196.
39. Vankuten, H. and Mlddendorp, P., "Testing of Foundation Piles," Heron,
Vol. 26, No. 4, 1981, pp. 3-42.
40. Fitting, D. and Ad I er, L., Ultrasonic Spectral Analysis loxNondestructive Evaluation, Plenum Press, New York, 1981, 354 pp.
41. Kraut, E. A., "Review of Theories of Scattering of Elastic Waves by
Cracks," IEEE Transactions on Sonlcs and Ultrasonics, Vol. SU-23, No.
3, May, 1976, pp. 162-166.
42. Bracewell, R. N., The Fourier Transform and Its App I Icatlons. 2nd
ed., McGraw-Hill Book Co., 1978, 444 pp.
43. Carl In, B., Ultrasonics , 2nd ed., McGraw-HM I Book Co., New York,
I960, 309 pp.
20

44. Bel I, F., ed. Foundation Eng I neer 1 ng In Difficult 6/rpun.d, Butterworthand Co., Ltd., London, 1978, 598 pp.
45. Bowles, J., Foundation Analysis and Design,. 2nd ed., McGraw-Hill Book
Co., New York, 1977, 750 pp.
21

TABLE 1. Parameters of Acoustic Waves
Quantity
Mass Density of Material
Acoustic Wave Velocity
Wavelength
Frequency
Angular Frequency (2irf)
Amplitude of Particle Motion
Particle Velocity
Acoustic Pressure
Acoustic Intensity
Symbol Units
p kg/m3
c m/s
X m
f 1/s or Hz
CO rad/s
A m
V m/s
P N/m2
1 W/m2
22

TABLE 2. Specific Acoustic Impedances
Material Density
P
(kg/m3 )
Compression WaveVelocity
C(m/§)
Spec ific AcousticImpedance
(kg/(mz-s))
Air 1.205 343 0.413
Concrete 2300 3000 to 4500 6.9 to 10.4 x 10⁶
Granite 2750 5500 to 6100 15.1 to 16.8 x 10⁶
Limestone 2690 2800 to 7000 7.5 to 18.8 x 10⁶
Marble 2650 3700 to 6900 9.8 to 18.3 x 10⁶
Quartz I te 2620 5600 to 6100 14.7 to 16.0 x 10⁶
Soils 1400 to 2150 200 to 2000 0.28 to 4.3 x 10⁶
Structuralsteel 7850 5940 46.6 x 10
6
Water 1000 1480 1.48 x 10⁶
Reference
43
44
44
44
44
45
2
2
°The mass density of concrete depends on the mix proportions and thespecific gravities of the mix Ingredients. The given density is for anaverage, norma I weight concrete.
23
OSCILLOSCOPE
PULSEGENERATOR
TIMING
MEASURINGCIRCUIT
RECEIVER-AMPLIFIER
TIMEDISPLAY
TRIGGER
PULSE SOURCE WITHTRIGGERING DEVICE
RECEIVER
aFLAWmm
a) Through-Transmission Method b) Pulse-Echo Method
1. Schematic I I lustration of two acoustic nondestructive test methods:a) the through-transmission method; and b) the pulse-echo method.
24
INCIDENTWAVE
REFLECTEDWAVE
INCIDENTCOMPRESSIONWAVE
REFRACTEDWAVE
REFLECTEDSHEAR WAVE
REFLECTEDCOMPRESSIONWAVE
REFRACTEDCOMPRESSIONWAVE
REFRACTEDSHEAR WAVE
sin e sin P sin 6 sin P sin s sin P<
Ci C2
a) Reflection and Refraction
'p1 ^p2 ^s1
b) Mode Conversion
s2
2. a) Spherlca I wave fronts due to impact on the top surface of a p I ate; andb) wave fronts after reflection from the bottom surface.
25
(a) R JLO R«•'.«'
\ "' 1:<* - «••.'
«• ».•"
V \ eA-\9ys p •«••.«-v- • «'«';•
4 ; « • . .•
#•« • 4
•'•.'«7
' * *.'*",' *'. *:*.
A B
3. The behavior of a compression wave incident upon an interface between twodissimilar media; a) reflection and refraction; and b) mode conversion.
26

1 1 1 1 I T
Reflected P-wave
pd.o),no562)
30°
4. Reflection coefficients at a concrete/a tr Interface for an Incident P waveas a function of the Incidence angle (Potsson's ratio = 0.2).
27

5. Reflection coefficients at a concrete/air interface for an incident S waveas a function of the incidence angle (Poisson's ratio = 0.2).
28
1000
500
200
100 -
Nz5 50
OzHIDoHIa,Li.
20 -
10 -
5 -
2 -
1
0.01
I III I I 1
1
1 I I I I I I 1
1
1 I I 1 MIIL
-
N. \^ \\ /—Cp = 5000 m/s -
>v \ \/\ / /— Cp = 4000 m/s -
— ^v^ N^^Ov / /~ Cp = 3000 m/s
—
—
\ \VsV x-Cp = 2000 m/s
—
I III ' ' i ' I i i 1 \i \j n\ l i i i
0.02 0.05 0.1 0.2 0.5 1
WAVELENGTH, A (meters)
10
6. Relationship between frequency and wavelength for the range of compressionwave velocities typically measured In concrete.
29
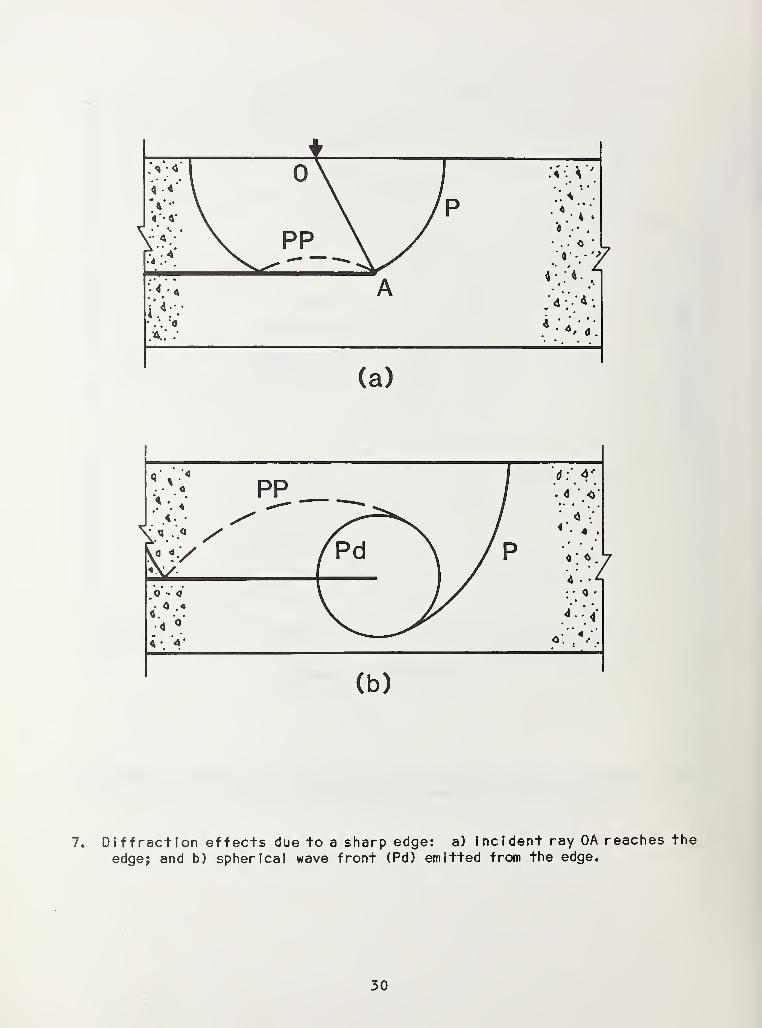
7. Diffraction effects due to a sharp edge: a) incident ray OA reaches the
edge; and b) spherical wave front (Pd) emitted from the edge.
30

-I 1 1
—
a =0.3 dB/m
J I L
0.4 0.8 1.2 1.6 2.0 2.4 2.8
PATH LENGTH (m)
8. Attenuation of plane waves in concrete for frequencies in the range of 100
to 200 kHz.
31

9. Directional characteristics of transducers with various ratios of diameter
to wavelength; a) d/X = 4; b) d/x = 1; and c) d << X ; (Polsson's ratio =
0.2).
32

0.02 -
w
O>
-0.03 -
a) Oscillogram
TIME (us)
f-h 0.125 m
, . . .9
"rsp
500
0.25 m
b) Ray paths
10. Pulse-echo results due to impact of a steel bal I on the top surface of a
0.25-m thick concrete slab; a) oscillogram; and b) ray paths.
33
0.0
V)
o>
-2.0 -
500TIME (us)
0.25m
0.5ml
—H h-0.1 m_SJ -
void
|—0.5mH
11. Oscillogram obtained during a test on a 0.5-m thick concrete slabcontaining a disc-shaped void 0.25 m below the surface.
34

7.81 kHz
HIQ
ZO<
10 20
FREQUENCY (kHz)
12. Frequency spectrum from the transformation of the time domain sign,
shown In Figure 10a.
35

NBS.114A (REV. 2-8C)
U.S. DEPT. OF COMM.
BIBLIOGRAPHIC DATASHEET (See instructions)
1. PUBLICATION ORREPORT NO.
NBS TN 1199
2. Performing Organ. Report No 3. Publication Date
July 1984
4. TITLE AND SUBTITLE
Pulse-echo Method for Flaw Detection in Concrete
5. AUTHOR(S)
Nicholas J. Carino and Mary Sansalone
6. PERFORMING ORGANIZATION (If joint or other than NBS. see instructions)
NATIONAL BUREAU OF STANDARDSDEPARTMENT OF COMMERCEWASHINGTON, D.C 20234
7. Contract/Grant No.
8. Type of Report & Period Covered
Final
9. SPONSORING ORGANIZATION NAME AND COMPLETE ADDRESS (Street. City. State. ZIP)
Same as item 6
10. SUPPLEMENTARY NOTES
2 Document describes a computer program; SF-185, FlPS Software Summary, is attached.
11. ABSTRACT (A 200-word or less factual summary of most significant information. If document includes a significantbibliography or literature survey, mention it here)
The basic pr
of internalous nature o
echo evaluatnondestructishows that p
detect flaws
currently ex
Based on the
are outlined
inciples of the pulse-echo method for the detection
flaws in concrete are presented. As the heterogene-
f concrete poses problems not encountered in pulse-
ion of metals, progress in this area of concrete
ve testing has been slow. A review of past research
ulse-echo techniques have been used successfully to
within concrete; however, no standardized method
ists for pulse-echo evaluation of concrete structures
current state of knowledge, areas of needed research
12. KEY WORDS (Six to twelve entries; alphabetical order; capitalize only proper names; and separate key words by semicolons)
acoustics; concrete; integrity testing; nondestructive testing;
pulse-echo method; wave propagation.
13. AVAILABILITY
[A] Unlimited
| |For Official Distribution. Do Not Release to NTIS
[~y~] Order From Superintendent of Documents, U.S. Government Printing Office, Washington, D.C.^ 20402.
12 Order From National Technical Information Service (NTIS), Springfield, VA. 22161
14. NO. OFPRINTED PAGES
39
15. Price
USCOMM-DC 6043-P80

NBS TECHNICAL PUBLICATIONS
PERIODICALS
JOURNAL OF RESEARCH—The Journal of Research of the
National Bureau of Standards reports NBS research and develop-
ment in those disciplines of the physical and engineering sciences in
which the Bureau is active. These include physics, chemistry,
engineering, mathematics, and computer sciences. Papers cover a
broad range of subjects, with major emphasis on measurement
methodology and the basic technology underlying standardization.
Also included from time to time are survey articles on topics
closely related to the Bureau's technical and scientific programs.
As a special service to subscribers each issue contains complete
citations to all recent Bureau publications in both NBS and non-
NBS media. Issued six times a year. Annual subscription: domestic
$18; foreign $22.50. Single copy, $550 domestic; $6. 90 foreign.
NONPERIODICALS
Monographs— Major contributions to the technical literature on
various subjects related to the Bureau's scientific and technical ac-
tivities.
Handbooks— Recommended codes of engineering and industrial
practice (including safety codes) developed in cooperation with in-
terested industries, professional organizations, and regulatory
bodies.
Special Publications— Include proceedings of conferences spon-
sored by NBS, NBS annual reports, and other special publications
appropriate to this grouping such as wall charts, pocket cards, and
bibliographies.
Applied Mathematics Series— Mathematical tables, manuals, andstudies of special interest to physicists, engineers, chemists,
biologists, mathematicians, computer programmers, and others
engaged in scientific and technical work.
National Standard Reference Data Series— Provides quantitative
data on the physical and chemical properties of materials, com-piled from the world's literature and critically evaluated.
Developed under a worldwide program coordinated by NBS under
the authority of the National Standard Data Act (Public Law90-396).
NOTE: The principal publication outlet for the foregoing data is
the Journal of Physical and Chemical Reference Data (JPCRD)published quarterly for NBS by the American Chemical Society
(ACS) and the American Institute of Physics (AIP). Subscriptions,
reprints, and supplements available from ACS, 1 155 Sixteenth St.,
NW, Washington, DC 20056.
Building Science Series— Disseminates technical information
developed at the Bureau on building materials, components,
systems, and whole structures. The series presents research results,
test methods, and performance criteria related to the structural and
environmental functions and the durability and safety charac-
teristics of building elements and systems.
Technical Notes—Studies or reports which are complete in them-
selves but restrictive in their treatment of a subject. Analogous to
monographs but not so comprehensive in scope or definitive in
treatment of the subject area. Often serve as a vehicle for final
reports of work performed at NBS under the sponsorship of other
government agencies.
Voluntary Product Standards— Developed under procedures
published by the Department of Commerce in Part 10, Title 15, of
the Code of Federal Regulations. The standards establish
nationally recognized requirements for products, and provide all
concerned interests with a basis for common understanding of the
characteristics of the products NBS administers this program as a
supplement to the activities of the private sector standardizing
organizations.
Consumer Information Series— Practical information, based on
NBS research and experience, covering areas of interest to the con-
sumer. Easily understandable language and illustrations provide
useful background knowledge for shopping in today's tech-
nological marketplace.
Order the above NBS publications from: Superiniendem of Docu-
ments. Government Printing Office, Washington, DC 20402.
Order the following NBS publications—FIPS and NBSIR s—fromthe National Technical Information Service , Springfield, VA 22161.
Federal Information Processing Standards Publications (FIPS
PUB)— Publications in this series collectively constitute the
Federal Information Processing Standards Register. The Register
serves as the official source of information in the Federal Govern-
ment regarding standards issued by NBS pursuant to the Federal
Property and Administrative Services Act of 1949 as amended,
Public Law 89-306 (79 Stat. 1127). and as implemented by Ex-
ecutive Order 11717(38 FR 12315, dated May II, 1973) and Part 6
of Title 15 CFR (Code of Federal Regulations).
NBS Interagency Reports (NBSIR)—A special series of interim or
final reports on work performed by NBS for outside sponsors
(both government and non-government). In general, initial dis-
tribution is handled by the sponsor; public distribution is by the
National Technical Information Service , Springfield, VA 22161,
in paper copy or microfiche form.

U.S. Department of CommerceNational Bureau of Standards
Gaithersburg, Md. 20899
Official Business
Penalty for Private Use $300