Embed Size (px)
Citation preview

Pulse of the industryDifferentiating differently
Medical technology report 2014

In the last three issues, we have described how the drive to value in health care, combined with the growing power of patients, is transforming the sector. This year, our opening article, “Differentiating differently,” focuses on an additional risk that has emerged: the commoditization of many medtech product segments. For medtech developers, the specter of commoditization upends their business models and creates a scenario in which competition is no longer based on historical value drivers — brand, quality and design — but on a single element, price.
To understand how commoditization is playing out now and in the future, we surveyed medtech companies’ main customers in four major markets: the US, the UK, Germany and Spain. Through interviews and case studies, we also explored the various strategies medtech companies can adopt to differentiate their products in an increasingly difficult health care market.
Not all of the strategies we outline in this report will apply to every company; nor are any of these strategies mutually exclusive. What we can say is that the
old ways of differentiating products appear less valuable to customers. This means that medtechs must transition to differentiating differently, placing greater emphasis on mechanisms that allow them to distinguish products based on value and outcomes.
We recognize that differentiating differently will require changes to medtech business models and can only be accomplished in conjunction with other strategic financial objectives. With that in mind, we have drawn linkages, where applicable, to noteworthy financial performance, financing and M&A trends that surfaced over the past 12 months.
As ever, we are grateful for the insights, opinions and perspectives of some of the industry’s leading insiders in helping us develop this year’s Pulse of the industry. We hope this report offers plenty of food for thought and discussion. We look forward to continuing the conversation with you in one-on-one discussions and via social media. Please visit our blog (lifesciencesblog.ey.com) and our Twitter feed (@EY_LifeSciences) for more.
— EY Global Life Sciences Sector
To our clients and friends,Welcome to the 2014 edition of Pulse of the industry, EY’s annual report on the medical technology industry.
Connect with us@EY_LifeSciences lifesciencesblog.ey.com

ContentsPerspectives
Appendix
Industry performance
05 Point of view: Differentiating differently11 To improve medtech R&D, take a system-wide approach
Dr. Olaf Schermeier, Fresenius Medical Care14 Building a better model for health care
Brent Shafer, Philips North AmericaDr. James V. Rawson, Georgia Regents Medical Center
18 Collaborative contractingMark West, SharedClarity
20 Sea change in China’s medtech industry
21 Why medtech should embrace commoditizationRob ten Hoedt, Eucomed and Medtronic
22 Taking a new approachJosé Almeida, AdvaMed and Covidien
23 Strength, resilience and energyJohn J. Greisch, Hill-Rom
24 Charting a new courseJoseph M. DeVivo, AngioDynamics
70 Scope of this report: defining medical technology
71 Acknowledgments
72 Data exhibit index
74 Contacts
26 Financial performance | Holding steady
41 Financing | Financing the future
56 Mergers and acquisitions | Seeking scale68 Medtronic/Covidien: Emblematic of what medtech is buying now

PerspectivesPart 1
Part
1
| Pe
rspe
ctiv
es
As a result of these two trends, patients and payers are more influential, and companies must respond with new approaches and business models to succeed. At a minimum, companies must now measure health outcomes and demonstrate the value of their products to payers and providers. To accomplish this, they may also have to expand their traditional offerings by moving beyond the product (expanding into services and solutions), beyond the hospital (enabling care delivery wherever patients happen to be) and beyond treatment (providing prevention, remote monitoring and more).
But medtech companies’ strategies will also need to account for an additional risk emerging from this confluence of trends: the threat of commoditization in many product segments. How to address this challenge is a central theme of this year’s Pulse report.
Commoditization Commoditization is the process by which products become undifferentiated and therefore interchangeable in customers’ perceptions. For manufacturers, this
process fundamentally changes the nature of competition in a business segment. Instead of competing on attributes such as brand, quality and design, products in a commoditized industry compete largely along just one dimension: price. Generally speaking, the journey to commoditization and price competition takes place in three steps: (1) a shift in customer perception; (2) lowered barriers to market entry; and (3) full-on price competition.
This process is beginning to play out in medtech, in several ways.
A shift in customer perceptionThe first step to commoditization is for products to become undifferentiated in the eyes of consumers. This can result when products are functionally identical — for instance, high octane and low octane gasoline. But commoditization can also occur when products still have distinguishing attributes, but customers become unwilling to pay a premium price for these features. This happened in the 1990s with desktop personal computers. Until the mid-1980s, IBM computers commanded a premium price because of Big Blue’s reputation and its long history in computing. Over time, the features distinguishing one PC from another became less and less important to customers, and the market was driven by narrow margins and aggressive price competition. By 2004, the industry had become so commoditized that
IBM sold its PC division to the Chinese manufacturer Lenovo.
To evaluate the extent to which this dynamic is playing out in medtech, we conducted a survey of US and European health care buyers in four major markets: the US, the UK, Germany and Spain. In particular, we focused on two constituencies within these organizations: practicing physicians and procurement officers.1 Providers, of course, have traditionally been the main buyers of medical devices. This remains true even in an outcomes-driven world where payers have more influence and the physicians themselves have become the salaried employees of health care systems. To get a sense of the direction and momentum of change, we asked these respondents questions about buying patterns today as well as their perceptions of how buying decisions will be made three years from now.
The survey reveals some clear attitudinal shifts, with potential implications for the nature of competition and how customers’ perceptions of medtech products will change. When asked about the biggest pressures on their institutions, for instance, respondents indicated that simple cost-cutting issues will become relatively less important over the next three years. Instead, they expect a significant increase in the importance of health care reform initiatives focused on value and outcomes (e.g., value-based purchasing and pay-for-performance).
1 The survey, conducted in August 2014, was taken by 162 respondents in total — 71 in the US, 33 each in the UK and Germany and 25 in Spain. Of those, 85 occupied clinical roles (chief of cardiology, department head, etc.) and 77 were in administrative or managerial roles (purchasing, supply chain, etc.).
Differentiating differently
For several years, we have written about two trends in health care that are transforming the medical technology business. The first of these — an increasing emphasis on value and the concomitant need to demonstrate improved outcomes — was something we explored in our 2011 Pulse of the industry report. The following year, we discussed the second transformative trend: patient-empowering, information-leveraging technologies (PI technologies) such as connected devices, smartphone apps, sensor-embedded objects and social media platforms.
Perspectives
5Medical technology report 2014

As shown in Chart 1, 34% of respondents expect these measures to be among the three factors placing the most pressure on hospitals in three years’ time (up from 21% today). Meanwhile, respondents expect a relative decline in the focus on cost-cutting (down from 44% today to 37% in three years), imaging costs (22% today, 12% in three years) and other such issues.
Respondents also see a clear shift in the most important influencers of purchasing decisions over the next three years. As shown in Chart 2, physicians are expected to become significantly less influential, while the influence of hospital managers and administrators (e.g., the CFO/finance department or procurement/purchasing department) is expected to rise. Insurers and other payers are expected to see the most significant increase in influence, albeit from a low base — this constituency is the least influential category by far, and this will remain the case in three years. Meanwhile, as indicated in Chart 3, procurement decisions are becoming more centralized in many major markets.
These shifts have clear implications for the ways in which medtech companies market their wares and how customers perceive their products. If individual physicians become less influential, and purchasing decisions are instead increasingly made by managers and administrators — whose prime focus is on measuring and rewarding value — then it seems likely that companies will need to demonstrate the value of their devices in terms of measurable improved outcomes for patients and lower total system costs if they are to make the cut.
Indeed, this is exactly what we see in Chart 4 and Chart 5 on page 8. As we have discussed in past issues of Pulse, medtech companies have traditionally “innovated at the bedside,” working in close conjunction with practicing
Perspectives
Higher scores indicate influencers who are more influential — today or in three years’ time — in hospitals’ purchasing decisions. Source: EY Pulse Hospital Survey.
2.5
2.0
1.5
1.0
0.5
0Physicians
2.4
1.9
1.7
1.9
CFO, finance department
0.2
0.5
Payers, insurers
1.61.7
Procurement, purchasing department
Chart 2. Physicians are becoming less important influencers of purchasing decisions
Today In three years
Declining: Simple cost-cutting
1 e.g., Value-based purchasing, pay-for-performance
Numbers show percentage of respondents who selected each factor in response to the following question: “Please select the three factors that place the most pressure on your institution today, and the three factors that you anticipate will place the most pressure on your institution three years from now.”
Source: EY Pulse Hospital Survey.
50%
40%
30%
20%
10%
0%
21%
34%
Cost-cutting
44%
37%
Increasing: Value/outcomes
41% 40%
Cost of upgrading or
maintaining IT systems
Health care reform
initiatives1
22%
12%
Imaging costs
33%
27%
Rising drug costs
38%37%
High-end medical technology costs
(non-imaging)
Chart 1. Hospitals’ pressures are shifting from simple cost-cutting to valueToday In three years
Rank
ing
6 EY | Pulse of the industry

physicians and surgeons to develop new variants of products that met the specific needs and preferences of these end users. But as individual doctors become less influential over the next three years, survey respondents expect that features targeted at these buyers will become less important in purchasing decisions. As shown in Chart 4, “physician preference for specific device,” “user-friendly design” and “training in use” are all expected to become less important in purchasing decisions.
Instead, respondents expect that measures that target value and outcomes (e.g., “data demonstrating clinical outcomes,” “data demonstrating value,” “beyond-the-product services,” “risk-sharing agreements”) will become significantly more important influencers of purchasing decisions.
And, as we show in Chart 5, when medtech purchasers were asked about the economic outcomes they see as most important when differentiating new products, the leading metric was
“reduced total costs of care.” Indeed, purchasers ranked this as much more important than other factors, including reduced hospital stays or increased surgical efficiency.
For medtech companies, the repercussions are clear: to succeed, firms will need to design and market their products to appeal not just to the preferences of physicians in the field, but also to the value-driven considerations that are becoming top-of-mind for administrators and managers.
Perspectives
Chart 3. The reimbursement landscape
CountryProcurement of medical devices carried out at the national level
Availability of national list of approved medical devices for procurement or reimbursement
Remarks
UK Yes No
NHS trusts can purchase products through one of five main routes: 1. Directly from suppliers using National Framework Contracts2. From the NHS Supply Chain which provides end-to-end supply chain services
incorporating procurement, logistics, e-commerce, and customer and supplier support
3. Collaborative Procurement Hubs/Confederations (regional multi-trust purchasing)
4. Local contracts managed by individual trusts5. Pan-government National Framework Contracts
France No Yes
The French Government is promoting the formation of regional procurement collectives, as a cost-cutting measure. Ten such collectives are currently in operation in France. The RESAH-IDF network, one of the largest procurement collectives in France, is in the process of establishing a European collective procurement platform known as Healthy Ageing in Public Procurement Innovation (HAPPI), through which more than €3 billion of purchases may be made annually.
Germany N/A N/A Procurement hubs are common in Germany. They have been consolidating in recent years: there are around 35 hubs, down from 100 in the early 2000s.
Spain No Yes Procurement is being centralized at the provincial level (for several hospitals).
Italy No YesProcurement is being rationalized in Italy. Four procurement regions are planned (North-East, North-West, Central and South), which will replace several agencies at local and regional levels.
US No No
Purchasing decision-making is shifting from individual clinicians to central purchasing staff focused on economic cost/benefits. Hospitals are also seeking preferred provider contracts and/or deploying standardized purchasing initiatives. Group purchasing organizations continue to negotiate contracts with suppliers.
China Yes Yes
The National Health and Family Planning Commission is responsible for procurement of medical equipment at the provincial level, including overseeing the bidding and tendering process for medical devices sold to state-run hospitals. High-value medical devices are increasingly purchased through a centralized purchasing system.
Japan No Yes
Private hospitals dominate the market and make their own purchasing decisions. Public hospitals procure equipment through invitations to tender using an approved list system. Hospitals are increasingly collaborating to raise procurement efficiencies by forming group purchasing organizations.
Source: EY.
7Medical technology report 2014

However, this will not always be easy to pull off, for a couple of reasons.
• Iterative innovation. In the search for value, payers and providers are most interested in highly differentiated medtech products that represent a significant improvement over the standard of care. The reality, however, is that such breakthroughs are rare. Innovation in this sector is often an iterative process that yields relatively small improvements over existing products. So far, this approach has worked for medtech companies as long as the physicians for whom new iterations were designed valued these improvements.
Demonstrating the value of these products to payers and procurement departments may not be as easy. While the process of iterative innovation has often generated huge improvement in health outcomes over time, any one iteration may not be enough of an advance to be valued by buyers. In many cases, purchasers will prefer a “good enough” product with fewer features at a lower price point.
• Different product segments. In our 2014 report Progressions: navigating the payer landscape, we warned that companies ought not regard payers as monolithic in their approaches. As medtechs seek to understand the changing purchaser landscape, they will find that buyers may have very different attitudes to products depending on the deployment of those technologies in the care spectrum. Differentiation will be more difficult depending on where medtechs aim their products.
Perspectives
1 e.g., patient support
Numbers show percentage of respondents who selected each factor in response to the following question: “Please select the three most important factors in your medical device purchasing decisions today, and three factors you anticipate will be most important three years from now.”
Source: EY Pulse Hospital Survey.
Respondents were asked to rank the three economic outcomes that are most important in differentiating new medical devices. The lower the score, the more important the economic outcome in differentiating a medtech product.
Source: EY 2014 Pulse Hospital Survey.
100%
80%
60%
40%
2.5
2.0
1.5
1.0
0.5
0
20%
0%
77% 77%
Price of device
55%
27%
Physician preference
for specific device
32%
22%
User-friendly design
31%35%
“Beyond the
product” services1
22%18%
Training in use
6%
25%
Risk- sharing
agreements
51%
62%
Data demonstrating
clinical outcomes
27%
35%
Data demonstrating
value
Price remains the top factor
Old ways of differentiation are less relevant
Differentiation will have to be based on data and value
Chart 4. Differentiate differently — or become commoditized?
Chart 5. Health care purchasers prioritize devices that reduce the total cost of care
Today In three years
Reduced total costs
of care
Reduced hospital
stay
Improved surgical
efficiency
Reduced pharmaceutical
utilization
Reduced readmission
rates
1.6
2.02.1
2.4 2.4
Rank
ing
8 EY | Pulse of the industry

The reality, therefore, is that many products may find themselves caught in no man’s land. The features medtech companies have traditionally emphasized in order to differentiate their products may no longer be valued by customers, and in many segments, it may not be easy to make the transition to “differentiating differently” — distinguishing products based on value and outcomes. In these situations, products will be left with only one variable on which to compete: price.
Low barriers to market entryThe pressure on price becomes even greater when the barriers to market entry are low. To return to the example of the personal computer industry in the 1990s, for instance, the move to price competition was accelerated by the ease with which other manufacturers were able to reverse-engineer the IBM PC and develop computers that were functionally equivalent. The same process has repeated itself with various information technology products, from semiconductors to hard drives to tablet computers.
This is relevant for medtech because medical devices are also engineered products with shorter product cycles. Western manufacturers who decide to compete on price will be in a business with razor-thin margins. Some might decide to apply “reverse innovation” — developing relatively inexpensive, stripped-down products for emerging markets and then deploying them in the West as well. But companies should also prepare for the possibility of an additional challenge — competition from new entrants with the ability to deliver products at far lower price points. China’s medtech industry, for instance, is in a relatively early stage of development, but there is no reason why such manufacturers would not be able to learn quickly, improve quality to meet global regulatory standards and create products that would meet the needs of most patients at much lower price points than in the West. Chinese firms in other engineering and manufacturing-based industries have already followed precisely this path, and there is little reason to think that medtech will be much different. (For more, see “Sea change in China’s medtech industry” on page 20.)
Full-on price competitionOnce a segment has been commoditized, a company must choose one of three directions:
1. Move downstream into the lower-margin, price competition space and compete aggressively on price. Strategies to remain competitive could include partnering with companies in emerging markets, reverse innovation or acquiring scale to gain bargaining power and economies of scale.
2. Move upstream into a higher-value segment, innovating within existing product lines or adding new products. This is the preferred approach for companies with products that are already well differentiated and that want to continue to demonstrate that their products add value and merit premium pricing.
3. Create stickiness. Explore other ways to create customer loyalty and differentiate your offering. This could include expanding into services, solutions and complementary product categories.
9Medical technology report 2014

New bases of competitionIf the old ways of differentiation are becoming less relevant, companies must develop strategies for competition on these new bases of differentiation. Broadly speaking, these tactics fall into one of four categories:
1. Achieve superior outcomes via technological advances
2. Increase scope through services and solutions
3. Increase scope by adding product offerings (within a disease area or across multiple disease areas)
4. Take costs out of the health care system
Of course, these strategies will not apply equally to every medtech company. Whether they apply will depend on a range of factors, including the company’s therapeutic focus and stage of development. Moreover, to be successful, companies may find it beneficial to develop a strategic plan that incorporates multiple differentiation mechanisms.
As medtechs consider which tactics to prioritize, one commonality is how each helps address the needs of its customers.
Meeting those needs will require medtech firms to engage with health care buyers on the buyers’ terms, spending time on-site to understand concerns such as workflow efficiency or the ways in which current devices are used to deliver care.
This is the path Fresenius Medical Care took when it restructured its R&D operations in 2013. As Dr. Olaf Schermeier, the company’s Chief Officer for Global Research and Development, explains on page 11, Fresenius mandated that every one of the company’s engineers spend a minimum of two days annually in the clinic, working alongside medical teams to gain a first-hand understanding of how to optimize the care delivery for renal patients.
As they reconsider their strategic priorities to adopt one or more of the new bases for competition, companies are likely to consider reallocating their R&D spending. Philips Healthcare, for example, which has embarked on a 15-year project with Georgia Regents Medical Center aimed at improving clinical outcomes, has already done so. Brent Shafer, Chief Executive Officer of Philips North America, explains that tackling initiatives such as improving patient experience requires redistributing resources. “In the past, Philips might spend about 8% of our total health care sales on
product research and development,” he says. “Now, it might be 5%, with 3% going toward R&D for commercial innovation, working with our customers to develop better solutions that they can implement in their protocols for delivering care.” (See “Building a better model for health care” on page 14.)
1. Achieve superior outcomes via technological advances
In certain therapeutic areas, it has become difficult to improve upon existing devices — at least in ways that buyers care most strongly about. That said, there are green field areas where new product R&D can catalyze a new standard of care.
Second Sight Medical Products’ Argus II retinal prosthesis system is a case in point. The device — a retinal implant accompanied by a wireless processing unit, glasses and a video camera — can partially restore vision to people blinded by the rare genetic condition retinitis pigmentosa (RP). The device was approved for use in Europe in 2011, and in February 2013, it won approval from the U.S. Food and Drug Administration (FDA).
Sophisticated devices such as Argus II, which represent a technological step-change, don’t come cheaply. As the company’s Vice-President of Business Development, Brian Mech, told Reuters in February, getting Argus II to the market took 14 years, US$200 million and “intestinal fortitude.” Second Sight is now working with insurers, the US Centers for Medicare & Medicaid Services and governments in Europe to underwrite the device’s US$100,000 price tag. In August, the French Ministry of Health approved financial support for the system, which is also available in Germany, the Netherlands, Switzerland, Italy, Saudi Arabia and the UK.
Perspectives
To be successful, companies may find it beneficial to develop a strategic plan that incorporates multiple differentiation mechanisms.
10 EY | Pulse of the industry

Fresenius Medical Care’s success is based on great inventions. Polysulfone fiber, for example, was key to creating the first truly effective dialyzer. This kind of innovation was driven by creative engineers, many of whom are still with the company, and this is still one of our biggest assets.
of the overall treatment, not just the cost of a specific product. Thus, reducing the overall cost of therapy must be one of our key innovation targets. Vertical integration — from a complete renal product portfolio to owning the dialysis center network — has been a clear benefit for Fresenius Medical Care, not only in developing new products but also for the overall economies of scale.
A key differentiator for Fresenius Medical Care is the way that R&D interacts with the clinical part of the business. Our 3,200 dialysis centers not only provide an incredible data pool, they also offer an opportunity for our R&D engineers to visit a clinic, where they can get an in-depth understanding of the optimization potential that can then be addressed in the technology and in the development process. In fact, every one of our engineers worldwide is required to spend a minimum of two days per year in a clinic, observing therapies and processes and discussing them with clinic staff and patients. This enables them to get an in-depth understanding of the optimization potential they can address in new technology developments.
Our clinics treat around 280,000 ESRD patients worldwide, three times per week, and we conduct regular surveys to learn how we can help to improve their quality of life. On questions of care, the patients play an increasingly important role in the overall decision-making process. Therefore, it is crucial for us to understand their needs. Home patients,
for example, are unwilling to use bulky and complex clinical machines. We have to understand that we cannot simply take a clinical system, adapt it slightly and assume the patient will be happy to have it in his or her home. What is the impact on patients’ flexibility? Can they use the system when they travel? How simple is the user interface? These are huge decision points for all home patients, and our engineers have to incorporate this kind of thinking in the product development process.
The renal care space is still growing, but the logical question is, where to go from here? Many of our patients have comorbidities: more than 40% of dialysis patients have diabetes, 70% have high blood pressure, and nearly all have some kind of cardiovascular disease.
For us, this is clearly an opportunity to expand our services into chronic care coordination, by incorporating elements of general practice, cardiology, diabetology and even psychology to improve our overall patient care. This makes sense not only from a service perspective, by making use of our clinical infrastructure, but also from a product and technology perspective.
Guest article
To improve medtech R&D, take a system-wide approachDr. Olaf Schermeier
CEO Global R&D, Member of the Management Board, Fresenius Medical Care
As engineers, we have long been accustomed to innovating by looking at individual products — the best-in-class dialyzer, for example. But we now understand that even more value is created when we try to improve a specific therapeutic system in its entirety, by taking a more holistic view of a therapy. We now ask: What is the outcome for patients? What is the reimbursement structure? What kind of therapy can I apply, and how can I make it as cost-effective as possible?
This approach goes beyond individual products. It clearly represents the biggest innovation potential in dialysis.
The various elements of Fresenius Medical Care’s portfolio — dialysis machines, disposables, drugs, dialyzers and IT solutions — all interact with each other to create value and improved therapies for end-stage renal disease (ESRD). A good example is our Online hemodiafiltration (HDF) therapy. HDF is based on the ultrafiltration of large amounts of plasma across the dialyzer membrane. The removed volume is then replaced by ultra-pure substitution fluid. Developed by engineers working very closely with medical doctors, Online HDF therapy is a big advance in care that provides clear advantages to patients. As a result, many countries have increased their reimbursement for this specific therapy.
When it comes to reimbursement, the key decision-makers are increasingly basing their decisions on the cost-effectiveness
Perspectives
Key decision-makers are increasingly
basing their decisions on the cost-
effectiveness of the overall treatment,
not just the cost of a specific product.
11Medical technology report 2014

Second Sight’s highly specialized technology represents innovation as medtech has typically defined it: a new therapeutic device to help solve an important unmet medical need. Another kind of technological advance is embodied by AliveCor, a much different kind of company. In 2012, the privately-held San Francisco company introduced a smartphone case that doubles as an electrocardiogram (ECG) for people suffering from heart disease. Sensors on the case turn electrical impulses in the user’s body into ultrasound signals, which are then recorded via an app and allow real-time monitoring.
Since early 2013, AliveCor has collected anonymous ECG data, building a database of more than 1 million recordings, with more data being gathered each month. Using these data, the company has developed an algorithm, approved by the FDA in August 2014, to detect in real time atrial fibrillation, the most common form of cardiac arrhythmia. The algorithm moves AliveCor’s product beyond monitoring to facilitating intervention, so that providers can take action before a patient suffers a more serious and costly event, such as a stroke.
It’s hardly surprising that these innovations came out of smaller, venture-backed endeavors. Rob ten Hoedt, Chairman of Eucomed and President
EMEA & Canada at Medtronic, notes, “Innovation in medtech will continue to be driven primarily by small to medium-sized enterprises (SMEs) and start-ups.” That said, these companies aren’t immune to the challenges of commoditization affecting larger medtechs. “SMEs need to be extremely careful to remain competitive and to differentiate their products from those of larger companies,” says ten Hoedt. Put another way, SMEs need to make sure they have a solution that not only addresses a need in the marketplace but can easily be tucked into a larger entity.
2. Increase scope through services and solutions
As bundled payments become one of the leading strategies for reducing health care costs, an increasingly obvious tactic for medical technology companies is to try to “own” more of the bundle. Medtech companies have, for some time, offered additional services alongside their products as an incentive to purchasers. That’s a problem, according to Dr. James Rawson, Chair of Radiology at Georgia Regents Medical Center in Atlanta. “Many of the services developed by vendors are focused on transactions, rather than relationships and partnerships,” he says. “The endpoint of the relationship between a medtech company and a care provider
is no longer a sale. The endpoint is an improved patient outcome. That’s where the industry has to go.”
Proving his point, Georgia Regents last year embarked upon a 15-year, US$300 million agreement with Philips Healthcare in which Philips is paid for supplying and maintaining equipment — including that of rival firms — as well as for improving patient care. (See “Building a better model for health care” on page 14.) Philips has embarked on a similar agreement with the Karolinska University Hospital, in Sweden. As part of that 14-year agreement, which Philips won in May 2014 after a Europe-wide tender, the conglomerate will invest in R&D and a provider education program, while also overseeing the procurement, installation and maintenance of the imaging equipment at the Karolinska’s new site in Solna.
As Philips’ collaborations with Georgia Regents and the Karolinska suggest, beyond-the-product services must serve a clear purpose, for instance addressing operational efficiencies, if they are to succeed. Medtechs also need to be willing to manage and support the service well beyond the life of an individual product, while being agnostic about where the technology originated.
12 EY | Pulse of the industry

To date, the companies that have embarked on the most ambitious attempts to own more of the bundle are the largest medtechs. The big imaging specialists such as Philips and GE Healthcare led the way, in part because they had to. They were among the first to come under pressure from cost-conscious hospital systems given the centralization of big capital equipment purchases.
Therapeutic device companies are now moving in this direction as well. In December 2013, Stryker bought Patient Safety Technologies for US$120 million in order to gain access to traceability software and hardware that reduce the possibility of post-surgery complications caused by medical errors.
Meanwhile, Medtronic’s US$200 million acquisition in 2013 of Cardiocom, a telehealth company that provides home monitoring, shows how Medtronic is expanding its cardiovascular franchise beyond implantable devices to the provision of services. Just a month after the acquisition, Medtronic established a new business unit, Medtronic Hospital Solutions, to partner directly with hospitals to increase the quality and efficiency of service delivery. And in August this year, the company pushed further into the hospital sector when it acquired NGC Medical, an Italian
company that offers services such as hospital infrastructure design and equipment management.
3. Increase scope by adding product offerings
The move from volume to value means medical technology firms that offer health care buyers an end-to-end solution in a given disease area may have a competitive edge. By having a suite of offerings designed to address the continuum of care in a given disease area, medtechs provide their customers additional value in two related ways. First, by providing a full range of clinically tested products, medtechs assist in ensuring provider groups can meet important care metrics that are now a necessary precursor for their own reimbursement. Second, by offering a spectrum of solutions in a given disease area, medtechs with the right portfolio of offerings can help simplify the contracting complexity health care buyers face.
Surveys of health care payers and purchasers we conducted in 2014 suggest that they have so many strategic priorities to accomplish in the near term that they don’t have the bandwidth to engage with multiple medical technology makers in meaningful conversations about value — especially if that value won’t be realized
within the current budgetary cycle. By establishing relationships with fewer suppliers, these health care buyers can begin to address the issue, negotiating new payment contracts that provide their organizations with improved pricing around the total cost of care.
The deeper a medtech supplier is in a therapeutic area, the more development, regulatory and marketing costs it can leverage across its various departments. Further out, one can imagine how these deep relationships might shift, such that a medtech developer contracts to provide devices for a fixed fee, whether the device is a simpler hip joint or a more complicated total hip replacement. Such innovative contracts are, for now, just talk, but senior medtech executives should start to understand how owning a disease could enable their companies to move away from unit-based pricing to a payment system that enables market access.
In many ways, the service-plus relationships struck by Philips Healthcare and Fresenius illustrate how increasing product scope (broadly defined) might facilitate new commercial models that are less transactional at the unit level and more relationship-driven. The question is how such a model will be applied in the therapeutic device category, especially implants.
Medical technology firms that offer health care buyers an end-to-end
solution in a given disease area may have a competitive edge.
13Medical technology report 2014

Guest article
We’ve partnered with many hospitals around the world, but those partnerships have been based more on managed equipment services. This is different. It has a managed services component, but it is also tied in with a very strategic risk-sharing component and other financial factors.
Under the terms of our relationship, the first thing Georgia Regents was able to do was reduce their cost of procurement. They didn’t have to bid for equipment with three different vendors; they didn’t have to schedule on-site visits. And we manage all the equipment, whether it’s our equipment or a competitor’s. We guarantee certain performance metrics, but at the core of the risk-sharing component of the relationship, our common goals are improved patient outcomes, shorter length of stay and greater patient satisfaction.
Our contract is for 15 years. There are three areas of focus tied to patient satisfaction. The first is based on patients’ experience once they get to the institution. Second, we are partnering
with Cerner to integrate electronic medical records. And third, we will work on our hospital-to-home strategy, developing and deploying remote monitoring capabilities and other solutions for home care.
Philips is in a good position to tackle these initiatives. It’s just a matter of how we want to use our resources. In the past, Philips might spend about 8% of our total health care sales on product research and development. Now, it might be 5%, with 3% going toward R&D for commercial innovation, working with our customers to develop better solutions that they can implement in their protocols for delivering care.
We want to establish many more of these partnerships, but they won’t necessarily work everywhere. We have to look at what is in the best interests of the customer and in the best interests of Philips, and at what strengths we hope to achieve through a partnership. Our relationship with Georgia Regents means that we can do what we do best — innovate, deliver and manage equipment capable of gauging, diagnosing and recording everything from a patient’s vitals to remarkably detailed images, giving the clinicians more time to deliver expert one-on-one care for each patient.
We expect this type of model to become very attractive to hospitals across the world. Each hospital is going to have different needs, but this is a model from which we can build.
Building a better model for health care
Brent ShaferChief Executive Officer Philips North America
In 2013, Philips Healthcare and Georgia Regents Medical Center entered into a 15-year, US$300 million agreement to improve outcomes and deliver care more efficiently to patients. Here, Brent Shafer, Chief Executive Officer of Philips North America, and Dr. James Rawson, Chair of Radiology at Georgia Regents, discuss the rationale behind the deal, and its ambitions.
We’ve partnered with many hospitals around the world, but those partnerships have been based more on managed equipment services. This is different.
Philips’ alliance with Georgia Regents leverages our joint strengths — Philips’ equipment, services and revenue cycle management and Georgia Regents’ ability to serve patients and provide better outcomes. With Georgia Regents, we were looking at a partnership from a much broader perspective than just a hospital entity. We were able to bring Philips’ whole portfolio, from dental care to lighting, not just to the hospital and the university, but also to the community.
Perspectives
14 EY | Pulse of the industry

Guest article
Dr. James RawsonProfessor and Chair of Radiology, Georgia Regents Medical Center
The relationship between Georgia Regents and Philips is based on common values. When we compared our priorities, we saw an overlap in the areas of improving patient health, lowering costs and increasing efficiency. We both wanted to build a better model for health care.
One challenge we had was in teaching people that this wasn’t just a big equipment deal, but something very different. But it is now part of our day-to-day operations across the organization, not the responsibility of a single team.
What Philips saw in us was alignment. In many hospitals, there is a lack of alignment between hospital staff and physicians. In our case, rather than having different departments fight over types of equipment to be used, or workflow, our departments work collaboratively and have done so for decades. In that type of environment, Philips doesn’t get stuck in the middle of a debate between what the doctors want or what different specialists want.
The success of the partnership, in my view, is working with a partner on the good days and the bad days, helping to move the ball forward to improve health. It’s no longer about being sold a piece of equipment or a technology. I no longer look at projects as being completed; I look at them as journeys. We installed a new Philips IntelliSpace PACS system for storing and viewing and processing image data six months ago, and we continue to innovate and improve that process. It is now hard-wired into our operations. The time we used to spend on buying and selling equipment we can now reinvest into innovation and improving the care given to each patient.
When we installed the PACS system, we decided this was not going to be a radiology project, but an enterprise-wide project. We thought a great deal about the methods our physicians would use to access images in the hospital, in the clinic and at external locations, and how easily they needed to be able to interact with that image data to make patient care decisions. It was about changing the way images would move in the entire health system for everybody.
Because we have Philips and our patient advisors sitting at the design
table with us, I think we’re able to make much better decisions.
We’re both learning — from each other, from our patients and from our staff. Georgia Regents was an early pioneer in patient- and family-centered care. We look at new equipment from an efficiency and care delivery point of view, but also from the patient’s perspective. How do we make getting a scan a good experience for the patient, and how does that fit into a larger context of the patient’s overall experience in our hospital? Because we have Philips and our patient advisors sitting at the design table with us, I think we’re able to make much better decisions.
We went live in January with the first phase of the PACS project, and we’re continuing to improve that workflow. Entering year two, we plan to accelerate the pace of innovation. As we keep at this for the remainder of the 15 years, we are creating a very different model of care delivery in which innovations are built on previous learnings. We expect this to lower costs and to improve outcomes, efficiency and, most important, the patient experience.
Perspectives
15Medical technology report 2014

Creating scope in a single disease areaTwo deals in the 12-month period ending 30 June 2014 showcase how therapeutic device companies are broadening the scope of their product offerings.
The first is Zimmer Holdings’ proposed acquisition of Biomet; the second is the Medtronic/Covidien megadeal, which is an even more ambitious effort to create scale across multiple disease areas.
The US$13.4 billion Zimmer/Biomet deal creates an orthopedic player with the critical mass to rival Johnson & Johnson’s DePuy Synthes. As Pulse went to press, European regulators were assessing the anti-trust implications of the Zimmer/Biomet deal. Assuming it proceeds, the transaction will combine the number two orthopedics player by revenue (Zimmer) with the fourth-ranked firm to create a new entity with revenues of nearly US$8 billion. Importantly, the deal promises to position Zimmer as a leader in the musculoskeletal sector, with particular depth in knee and hip implants. Biomet’s sports medicine products, meantime, will give Zimmer additional depth in the trauma market, an area where Johnson & Johnson currently dominates because of its 2011 megadeal with Synthes.
The Zimmer/Biomet transaction is expected to trigger even more deal-making in the orthopedic space, as smaller firms seek scale to remain competitive. Moreover, we may see similar deals to deepen product offerings in other therapeutic areas — especially those with an abundance of competitors. Indeed, as we were writing Pulse, news broke that Danaher was to acquire Nobel Biocare Holding for US$2.2 billion to create the leading dental-focused medtech based on sales of consumables and equipment.
In some cases, the push to add product scope may turn buyers into sellers. As we have witnessed in the pharma business, or with Johnson & Johnson’s divestiture of its Ortho-Clinical Diagnostics division, larger companies may realign their portfolios to create fewer business units with competitive scale. (See “Seeking scale” on page 57.)
Creating scope in multiple disease areasIf the Zimmer/Biomet and Danaher/Nobel Biocare mergers are motivated by deepening product scope, Medtronic/Covidien takes the argument to a new level. In essence, executives championing that megamerger argue that depth in one particular disease area is no longer sufficient. To change conversations with hospital purchasers, especially as vendor consolidation continues, medtech developers must have breadth across multiple disease areas. Call it the über-scope approach.
It’s too soon to say whether the Medtronic/Covidien transaction will have a positive impact on the ways in which the combined entity brokers contracts with hospital purchasers, or whether scale at this level is required to achieve greater leverage with health care buyers. That said, there is no doubt that Medtronic/Covidien has already altered the conversation about the role of medtech M&A in creating entities that can survive in today’s tougher health care climate.
As we note on page 68, the US$42.9 billion merger joins two leading medtech companies to create a new entity that will rival Johnson & Johnson’s medtech division in annual sales. Medtronic and Covidien offer complementary product portfolios: Medtronic supplies a range of devices for the cardiology, neurology
and diabetes markets, while Covidien specializes in hospital supplies. Together, the combined entity will be one of the leading medtech distributers in six of the top 10 hospital purchasing categories, according to Medtronic.
“The addition of Covidien broadens our footprint,” Medtronic Chairman and CEO Omar Ishrak told an interviewer after the announcement of the merger. “The value proposition of Covidien’s technology is primarily to deliver hospital efficiency, while Medtronic’s chronic disease therapies deliver value in post-acute settings. When these two are combined, in a world in which integrated health franchises will be more common, we become a very attractive partner — we can deliver value in the hospital, in a measurable fashion, and value that is realized outside the hospital.”
In an era when health care buyers are inundated with must-dos, it may well be that the scale of a Medtronic/Covidien makes such entities more attractive suppliers during contract negotiations. Indeed, the emergence of a new initiative in the US, SharedClarity, which is sponsored by the payer UnitedHealth Group in conjunction with multiple provider groups, underscores why medtech executives see scaling their businesses as an important strategic priority.
The dearth of comparative data has long vexed medtech customers who argue the rate and volume of the research hasn’t kept pace with the introduction of new products. SharedClarity was created at least partially to rectify that situation, as well as to deliberately correlate existing research with value claims. As SharedClarity’s President, Mark West, explains on page 18, the company recruits physicians from its member hospitals to review the published literature and
Perspectives
16 EY | Pulse of the industry
establish which technologies provide better health outcomes. SharedClarity then takes the process one step further: its sourcing group also negotiates purchasing agreements with product manufacturers based on the evidence amassed. In March 2014, SharedClarity announced the results of its first review and awarded contracts for drug-eluting and bare metal stents.
Apart from offering benefits to purchasers, the SharedClarity model presents opportunities for medtech companies. The first is the most obvious — a stable channel to the market. The second advantage is validation by an independent third party. The final advantage is the goodwill that results from cooperatively participating in the negotiation process. Presumably, a company the size of a combined
Medtronic/Covidien is better positioned to negotiate those purchasing agreements because its economies of scale mean it can be more disciplined about its own costs, thereby passing along price savings to customers like SharedClarity while still maintaining reasonable margins.
Success in one purchasing negotiation is likely to breed further success, not simply with the original buyer but with other purchasing organizations. Thus, medtechs that have participated, and won contracts, with groups like SharedClarity develop relationships as trusted partners, setting the stage for further positive negotiations.
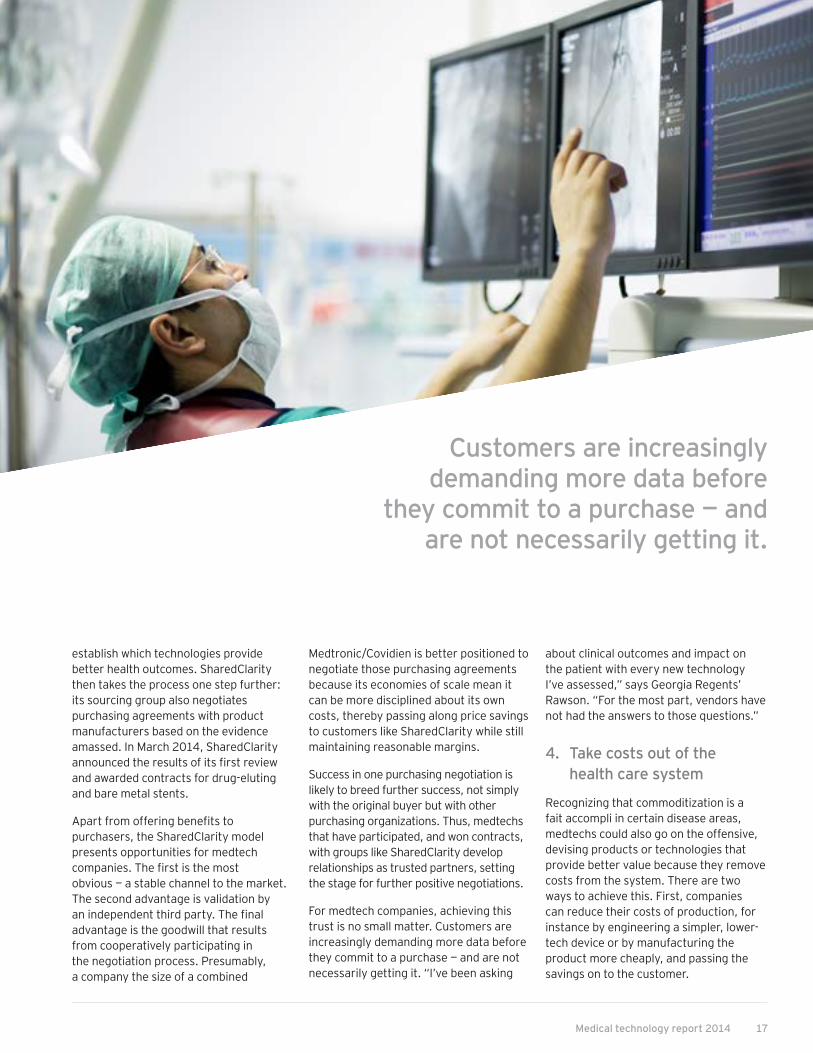
For medtech companies, achieving this trust is no small matter. Customers are increasingly demanding more data before they commit to a purchase — and are not necessarily getting it. “I’ve been asking
about clinical outcomes and impact on the patient with every new technology I’ve assessed,” says Georgia Regents’ Rawson. “For the most part, vendors have not had the answers to those questions.”
4. Take costs out of the health care system
Recognizing that commoditization is a fait accompli in certain disease areas, medtechs could also go on the offensive, devising products or technologies that provide better value because they remove costs from the system. There are two ways to achieve this. First, companies can reduce their costs of production, for instance by engineering a simpler, lower-tech device or by manufacturing the product more cheaply, and passing the savings on to the customer.
Perspectives
Customers are increasingly demanding more data before
they commit to a purchase — and are not necessarily getting it.
17Medical technology report 2014

Guest article
The concept stemmed from business reviews carried out by UnitedHealthcare — the largest commercial payer in the US — and Dignity Health. The theme of medical devices kept coming up, in particular the lack of independent knowledge of how these products perform, and their affordability. I was head of supply chain at the Cleveland Clinic and was asked to develop some business models, one of which is SharedClarity. Over the last four years, we have taken the concept to business plan, to investment, to operations, and now we are achieving results.
The business model is two-fold. One side of it is understanding how medical devices perform, and the other is collaborative contracting within our own membership, which now includes Baylor Scott & White Health, Advocate Health Care and McLaren Health Care, as well as UnitedHealthcare and Dignity.
On the clinical side, we have identified 30 product families on which to focus — high-cost, high-technology, high-clinical-impact products, such as pacemakers, defibrillators, stents, knees, hips and urological slings. Together, these 30 product families account for about US$35 billion a year in the US market. We assign those products a clinical review team, and we go through a structured clinical product review for each. We also tap into Optum, which is owned by UnitedHealth, for comparative effectiveness work. We believe that if you really want to understand how a product performs, you have to follow the patient, and you have to have data that go from
diagnosis to procedure to after-care. What differentiates us is that we have the data that follow that longitudinal activity.
We recently completed the clinical review and contracting process for our first three products — drug-eluting stents, bare metal stents and peripheral stents — a process that took six months. Clinical review teams first look at existing research on the product. They survey specialists who use the product to get input on product attributes and performance. Then we see if there’s consensus on how the products perform. If there isn’t, we ask: why not? What information and data are lacking? What holes in our clinical knowledge base do we need to fill? This could lead us to more surveys, more reviews of existing research or a customized study.
Once the clinical review team has done its work, we go to a collaborative contracting process on behalf of our members. Here, our strategy is simple: first, we take the output from the clinical review teams and their findings. Second, our members commit to purchasing a significant portion of their volume off SharedClarity contracts. And third, we use the findings of our clinical review team to help us to rationalize the number of products that we use.
The clinical review and contracting process went very well for our first three products. Every one of our members achieved double-digit cost savings on the contracts — it was the type of quantum leap of improved affordability that we were hoping for.
Our credibility with device manufacturers is based on the fact that the physicians are engaged not only in the process of evaluating the product, but also in its implementation. We don’t charge administration fees, and we are not structured like a group purchasing organization. And we have a committed model. When our supplier for drug-eluting stents signed the contract, they notified us it was the largest committed contract in the United States that they remember signing.
Something I didn’t expect is that we are a change management company, too. We are changing the processes and culture — administrative and physician engagement, joint decision-making — within our health system members and the medical device community.
Suppliers are in the process of trying to figure out the model of the future, and who they should partner with. Their relationship with physicians has changed. They realize that payers play an important new role, and they are working out how to engage with them. That is one reason why we have built a process that engages not only the payers but the providers, and creates an easy entry for them that way. They have been very receptive to what we’re doing, and we see ourselves as their future partners.
Our growth opportunities are global. UnitedHealthcare bought Amil [Brazil’s largest insurer and hospital operator]. This represents a fascinating opportunity — Amil is using some products that aren’t approved for the US. It’s good to gain some intelligence on those products, and to have an opportunity to do global contracts for medical devices. I think we’ll see more globalization of products, and the more options and competition we have, the better it is for patients.
Collaborative contracting Mark West
President, SharedClarity
The advent of SharedClarity is a very clear indication of the push that we’ve seen for some time now toward outcomes and value within health systems.
Perspectives
18 EY | Pulse of the industry

The second way is predicated on taking costs out of the system. In this scenario, how the actual medical technology is priced isn’t the main focus; what matters most is whether the product results in credible cost offsets that reduce the total cost of care.
This is the bar Johnson & Johnson’s Ethicon division is hoping to clear with Sedasys, its computer-assisted anesthetic delivery system for colon cancer and upper gastrointestinal screenings. Given the sophisticated automation underpinning Sedasys, the instrument can be used to deliver the anesthetic propofol in the absence of an anesthesiologist. (The gastroenterologist conducting the exam would oversee the drug’s delivery.) Johnson & Johnson estimates this will allow health care groups to cut colon cancer screening costs significantly, from an estimated US$600-US$2,000 to around US$150. Uptake of Sedasys, which launched in early 2014, has been modest, in part because Ethicon has deliberately chosen to make sure physicians are properly trained in how and when the device should be used before rolling it out more broadly.
Creating a new device like Sedasys requires companies assume significant manufacturing, engineering and R&D costs — it took over a decade to develop the instrument. But medtechs can also either refine their engineering processes to create simpler products that can be sold more cheaply, or shift manufacturing to markets where labor costs are lower. In fact, such cost-saving strategies are already in evidence in India and China, where both domestic and multinational medtechs are devising lower-cost, affordable products to treat the new and rapidly growing middle class in each country. (See “Sea change in China’s medtech industry” on page 20.) “The fact that the Chinese Government wants to
create a socialized health care system for 1.5 billion people is the largest opportunity in the world for medtech firms,” says Rob ten Hoedt of Eucomed and Medtronic.
As companies redesign and adapt their portfolios to develop products for emerging markets, they may take advantage of this “reverse product flow” to build no-frills, lower-cost products for use in developed markets. That’s what Smith & Nephew is doing via Syncera, an orthopedics-focused pilot that reduces the need for on-site technicians and other services associated with two key hip and knee replacement products. As a result of these changes, Smith & Nephew believes it can reduce implant costs by as much as 50%. The company first introduced the Syncera pilot in emerging markets; in August 2014, it launched a similar experiment in the US.
At the time of the US launch, CEO Olivier Bohuon told investors that the ultimate idea behind Syncera was to maintain margins by reducing prices on its orthopedic products in tandem with less intensive marketing, a process that was expected to play out over at least a year. So far, health care buyers are responding positively to the experiment: Bohuon noted that several customers were poised to sign multi-year Syncera contracts, despite its relative newness. “If you take a hospital that has 700 implants a year, over the three-year contract this hospital will enjoy net cash flow benefit of well over US$4 million,” he said.
The shape of things to comeIn an effort to stave off commoditization, companies must also rethink their branding strategies. They will need to move beyond product-specific branding
to developing messages that emphasize their customer-centricity, reliability and partnering capabilities. In essence, this beyond-the-product style of branding is a natural evolutionary step in an environment where the differences between individual products are perceived to be small or non-existent.
Moving forward, it will be interesting to see how — or if — medtechs will position themselves as brand builders. In other words, can the medtechs, via their products and services, help providers achieve top-quality care metrics that allow these care teams to attract more patients and build share in their own respective markets? By directly empowering care providers, medtechs that enhance the bottom lines of their customers give those buyers a very compelling reason to be loyal to specific medtech brands.
When it comes to charting a new course to differentiation, medtech companies have a range of options to consider, and a growing number of peers to emulate. Whatever strategies for differentiating differently companies ultimately adopt, they need to give themselves time to assess and analyze not just the nature of changing purchasing habits in their core markets, but the implications of those changes for their products.
The strategies we have set out here offer a good starting point for medtech companies as they consider the next steps they should take to grow their markets. If their products already demonstrate superior outcomes, for example, there is less pressure to embark on strategies that increase scope, whether that is through additional products or services. Note that superior outcomes alone may no longer be enough to sway buyers — especially if the innovation does not also fulfil a purchaser’s key objective to take costs out of the system.
Perspectives
19Medical technology report 2014

Case study
A sea change is occurring in China’s medtech industry. Since 2008, the Chinese market for medical devices has nearly doubled in size, and at US$16.1 billion is now second only to the US. Double-digit growth rates for medtech sales have put China at the forefront of multinational medtech companies’ strategies. But their enthusiasm comes with a note of caution: an evolving regulatory environment and government policies aimed at boosting the domestic industry mean that the path to market — already complicated — is not likely to become simpler. Meanwhile, many Chinese medtech companies have stepped up their investment in innovation, with an eye on the global market.
High-end in vitro diagnostics specialist Mindray Medical International, for instance, invests around 10% of its
revenues in R&D. Time Medical Systems, meantime, is a pioneer in the development of high-temperature superconducting (HTS) coil technology for use in clinical MRI scanners, while MicroPort is developing its own drug-eluting stents.
These companies, and a growing number of others, offer stiff competition for multinational companies’ products in China — and not just in terms of product sales. They are actively seeking M&A opportunities, both at home and internationally, in order to boost the quality of their product lines. In June 2013, Mindray acquired California company Zonare Medical Systems, an ultrasound technology specialist in the high-end radiology segment with sales teams in the US, Canada, Scandinavia and Germany. In the same month, MicroPort Scientific acquired OrthoRecon, the hip
and knee implant business of Tennessee-based Wright Medical Group, and announced that it would base its global orthopedic business in Tennessee.
Dr. Olaf Schermeier, Chief Officer for Global R&D at Fresenius Medical Care, understands the potential risks to his business model. “We are one of the largest renal care product providers in China, but competition will certainly come,” he says. “We should never underestimate local [Chinese] engineers.”
But equally, the skills learned by multinational companies in developing low-cost products for the Chinese market — and the agility they have had to maintain in keeping up with policy changes — will also add value in their home markets, where health reform and commoditization are now facts of life.
Sea change in China’s medtech industry
20 EY | Pulse of the industry
Perspectives
20 EY | Pulse of the industry

Why medtech should embrace commoditization
Rob ten HoedtChairman, Eucomed Executive Vice President & President EMEA & Canada, Medtronic
Guest article Perspectives
Western Europe currently spends €110 billion on health care. It has become clear that growth in health care spending cannot continue to outpace the growth of gross national product. If we don’t find a way to provide care in a completely innovative way, fewer people will have access to adequate care.
The drive to value in health care is behind the commoditization of medtech. And while only a small portion of spending currently goes to medical devices, the medtech industry will soon have a major role to play in care delivery if the drive to value transforms care in the way it should. There is massive potential in remote patient management, using smart IT and decision-making platforms to allow patients to live a healthy life at home. There are opportunities in data management and analysis to improve the consistency and quality of care. There are opportunities to incorporate robotics and nanotechnology. We can now deliver technologies and drug-device combinations at very small levels to precisely the places they are needed. A healthy environment for medtech is crucial for these developments.
We need to provide technologies that have clear health benefits, but we also have to prove that they have clear economic benefits. There is growing awareness that medical technology can offer value across the health system, but health care systems themselves have difficulty dealing with that. A product may be shown to decrease the cost of care after a patient is discharged, but it
may not be accepted because it slightly increases the cost of care in the hospital.
Clearly, debate and discussion need to happen between the medtech industry and health care providers to make sure that we are all focused on the total cost of care. As an industry, we can’t expect care providers to simply pay for the technology and then figure out themselves where the benefits will fall. If we are convinced of the benefits of our technologies, we may have to guarantee those benefits up front with a risk-sharing agreement. That will dramatically change our traditional business model, but it will also open up a much larger portion of the market and improve patients’ access to therapies.
We’re an engineering-driven industry, and that spirit needs to stay alive. If you only take economic values into account, you will never end up with something truly innovative. But the moment that technologies are created, all companies — whether they are small, medium or large medtech firms — need to initiate discussions about value.
If we in medtech are to genuinely improve delivery of care, we need to move beyond the transactional model and take more responsibility for patient outcomes. We should get paid when the desired outcome is achieved. The device is only part of the total solution for the patient. In diabetes, for example, patients may need an insulin pump, insulin, exercise and a healthy diet in order to get well. We need to do more than just supply the insulin pump. We need to become more active
in the delivery of care so that we can guarantee that those other activities are done properly and the maximum benefit of our technology is realized. Not only do we need to collect and share data, but we must also find ways to ensure that the appropriate care is delivered.
We can only achieve this if there is complete trust in what we do, among policy makers, payers, providers and patients. It is important for Eucomed to work with the European Commission to make sure that regulations for medtech optimize the quality of the technologies that come to market, but don’t stifle innovation, which would be equally devastating for patients.
As people start to pay more out of their own pockets for health care, they will demand more in return, at higher quality. Although we believe that patients should have a bigger say, medtech industry business models are predominantly focused on care providers, payers and regulators. One of our objectives at Eucomed is to create a dialog with patients so that we can build relationships, understand patients’ expectations and understand the language that we as an industry should start to use to communicate with patients.
Commoditization is a natural trend in any technology-based industry. But the medtech industry should not regard it as a threat. I would rather ask: How will medtech benefit from the opportunities this trend is creating?
We need to provide technologies that have clear health benefits, but we
also have to prove that they have clear economic benefits.
21Medical technology report 2014
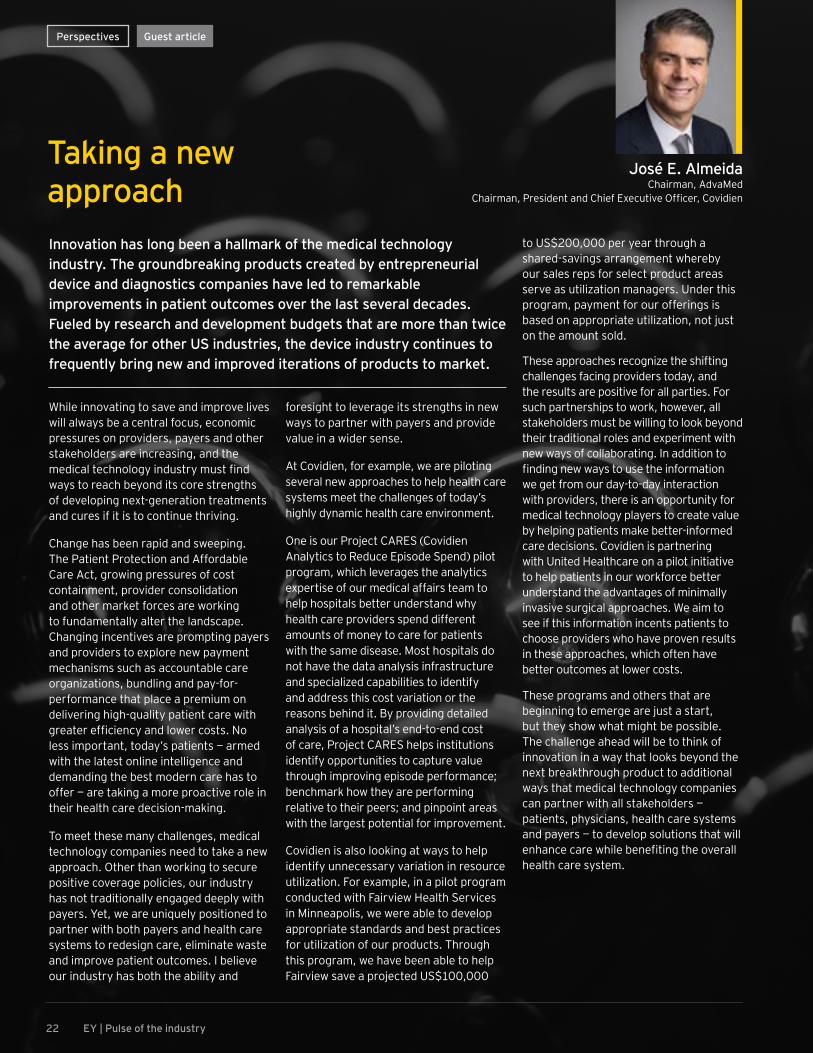
Taking a new approach
José E. AlmeidaChairman, AdvaMed
Chairman, President and Chief Executive Officer, Covidien
Guest articlePerspectives
While innovating to save and improve lives will always be a central focus, economic pressures on providers, payers and other stakeholders are increasing, and the medical technology industry must find ways to reach beyond its core strengths of developing next-generation treatments and cures if it is to continue thriving.
Change has been rapid and sweeping. The Patient Protection and Affordable Care Act, growing pressures of cost containment, provider consolidation and other market forces are working to fundamentally alter the landscape. Changing incentives are prompting payers and providers to explore new payment mechanisms such as accountable care organizations, bundling and pay-for-performance that place a premium on delivering high-quality patient care with greater efficiency and lower costs. No less important, today’s patients — armed with the latest online intelligence and demanding the best modern care has to offer — are taking a more proactive role in their health care decision-making.
To meet these many challenges, medical technology companies need to take a new approach. Other than working to secure positive coverage policies, our industry has not traditionally engaged deeply with payers. Yet, we are uniquely positioned to partner with both payers and health care systems to redesign care, eliminate waste and improve patient outcomes. I believe our industry has both the ability and
foresight to leverage its strengths in new ways to partner with payers and provide value in a wider sense.
At Covidien, for example, we are piloting several new approaches to help health care systems meet the challenges of today’s highly dynamic health care environment.
One is our Project CARES (Covidien Analytics to Reduce Episode Spend) pilot program, which leverages the analytics expertise of our medical affairs team to help hospitals better understand why health care providers spend different amounts of money to care for patients with the same disease. Most hospitals do not have the data analysis infrastructure and specialized capabilities to identify and address this cost variation or the reasons behind it. By providing detailed analysis of a hospital’s end-to-end cost of care, Project CARES helps institutions identify opportunities to capture value through improving episode performance; benchmark how they are performing relative to their peers; and pinpoint areas with the largest potential for improvement.
Covidien is also looking at ways to help identify unnecessary variation in resource utilization. For example, in a pilot program conducted with Fairview Health Services in Minneapolis, we were able to develop appropriate standards and best practices for utilization of our products. Through this program, we have been able to help Fairview save a projected US$100,000
to US$200,000 per year through a shared-savings arrangement whereby our sales reps for select product areas serve as utilization managers. Under this program, payment for our offerings is based on appropriate utilization, not just on the amount sold.
These approaches recognize the shifting challenges facing providers today, and the results are positive for all parties. For such partnerships to work, however, all stakeholders must be willing to look beyond their traditional roles and experiment with new ways of collaborating. In addition to finding new ways to use the information we get from our day-to-day interaction with providers, there is an opportunity for medical technology players to create value by helping patients make better-informed care decisions. Covidien is partnering with United Healthcare on a pilot initiative to help patients in our workforce better understand the advantages of minimally invasive surgical approaches. We aim to see if this information incents patients to choose providers who have proven results in these approaches, which often have better outcomes at lower costs.
These programs and others that are beginning to emerge are just a start, but they show what might be possible. The challenge ahead will be to think of innovation in a way that looks beyond the next breakthrough product to additional ways that medical technology companies can partner with all stakeholders — patients, physicians, health care systems and payers — to develop solutions that will enhance care while benefiting the overall health care system.
Innovation has long been a hallmark of the medical technology industry. The groundbreaking products created by entrepreneurial device and diagnostics companies have led to remarkable improvements in patient outcomes over the last several decades. Fueled by research and development budgets that are more than twice the average for other US industries, the device industry continues to frequently bring new and improved iterations of products to market.
22 EY | Pulse of the industry

Strength, resilience and energyJohn J. Greisch
President and Chief Executive Officer, Hill-Rom
In the Belgium contest, Tim Howard made a World Cup record-setting 16 saves. His performance, gritty determination and commitment to the game — and to his team — made for great drama. Howard has a reputation for playing through pain; his resilience, strength and energy serve as a metaphor for what it will take for medical technology companies to succeed in the future.
The environment for medical technology companies continues to be challenging. The uneasy global economy and volatile health care market mean our customers face unprecedented pressure.
In our more mature markets, hospitals everywhere are looking for ways to reduce costs. More than ever before, hospitals are being thoughtful about the level of service they want to provide, deciding what is essential and what isn’t; they are looking for what truly will make a difference in outcomes, and discarding what will be merely incremental. In developing markets, the circumstances are different, but governments and payers are asking the same question: How can they deliver optimal care to the most people for the least cost?
To be successful in the coming years, the medical technology industry must be laser-focused and bring the strength, resilience and energy Tim Howard embodies to the health care arena. In particular, we must:
Retain strong focus on what’s best for patients and caregivers. Intense business and regulatory pressures can sometimes divert our attentions from
the premier reason we exist — to improve the lives of patients and caregivers through our innovative technologies. If we keep our focus where it should be, the associated metrics on cost, quality (including patient engagement and patient satisfaction) and outcomes are likely to be more easily addressed. For example, numerous studies show that encouraging patient mobility not only helps improve patient outcomes, but also has a positive effect on a hospital’s bottom line. At Hill-Rom, we’ve designed a progressive mobility program to help make it easier for hospitals to get ICU patients moving as quickly as possible. The program is built on the most recent clinical evidence, checked by national thought leaders, and provides the practical tools necessary to improve patient mobility.
Empathize with the customer. The reimbursement landscape has changed fundamentally. Hospitals and clinicians everywhere resonate with the mantra of “doing more with less.” In more developed markets, the payment incentive structure emphasizes quality, access and choice — but generally not volume. This paradigm shift is taking place where the difference between “victory and defeat” is a margin of 2% or less, so workflow efficiency is a key area of strategic focus. Today, more than ever, medtech partners will distinguish themselves by fully appreciating, articulating and responding to their customers’ needs. One big need: reducing hospital-acquired infections, which in the US are estimated to cost up to US$45 billion annually. To help hospitals, Hill-Rom has created a software program using locating technology to help
providers track and record hand washing opportunities and measure compliance based on existing hygiene protocols. The data can be viewed in real time at the individual, unit or hospital level to facilitate infection control.
Exhibit leadership. In this challenging landscape, leadership and management will separate successful medtech companies from the pack. The voices speaking about health care are many and varied, and all have important messages. As an industry, we must redouble our commitment to aggressively and distinctly speak to the important contributions medtechs make, not only for patients, but also as engines for economic growth. We must continue to work toward an environment that promotes investment in innovation and job creation.
In short, inspired by this summer’s performance by Tim Howard and his team, we’ll need to play through a bit of pain. The medtech industry will need to call upon similar strength, resilience and energy to successfully navigate today’s health care environment. In particular, we need to focus on patients and caregivers, respond to our customers and lead — to the last whistle.
In 2014, goalie Tim Howard and the US Men’s Soccer Team captured the hearts of Americans — and soccer fans around the globe — in an exciting bid for the World Cup. Here in Chicago, the 1 July 2014 game with Belgium drew 28,000 fans to a viewing event at Soldier Field!
Governments and payers are asking
the same question: How can they deliver
optimal care to the most people for the
least cost?
Guest article Perspectives
23Medical technology report 2014
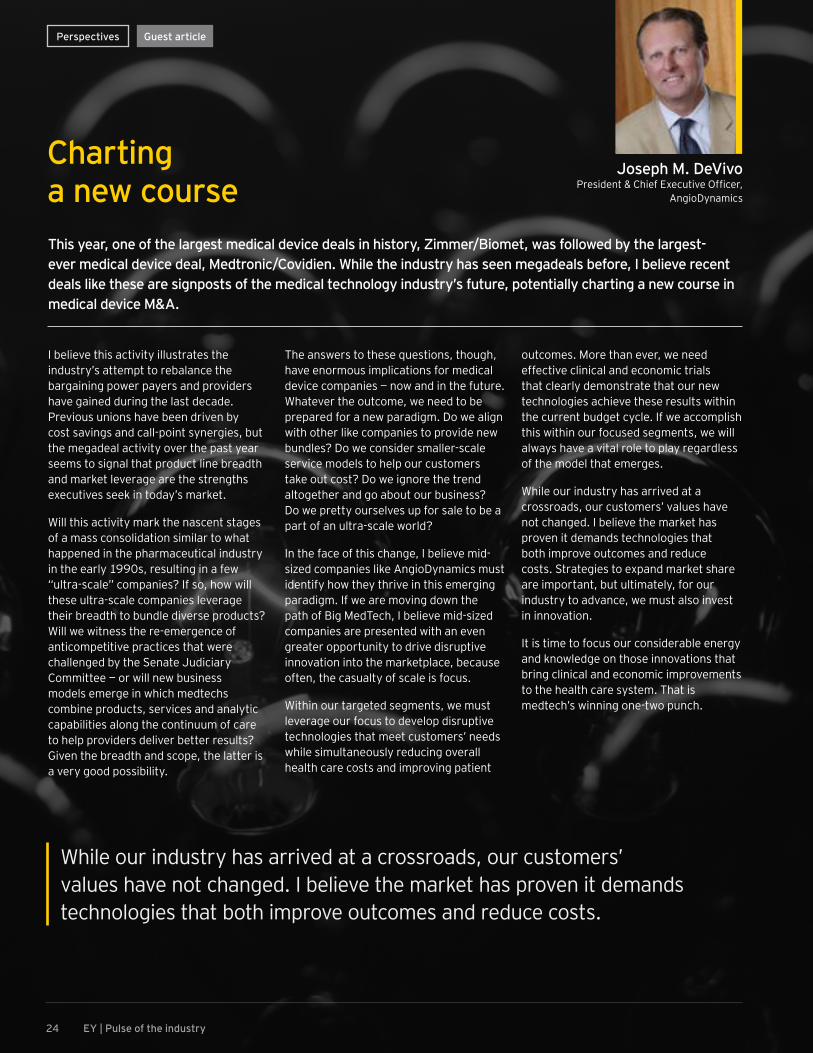
Charting a new course
Joseph M. DeVivoPresident & Chief Executive Officer,
AngioDynamics
Guest articlePerspectives
I believe this activity illustrates the industry’s attempt to rebalance the bargaining power payers and providers have gained during the last decade. Previous unions have been driven by cost savings and call-point synergies, but the megadeal activity over the past year seems to signal that product line breadth and market leverage are the strengths executives seek in today’s market.
Will this activity mark the nascent stages of a mass consolidation similar to what happened in the pharmaceutical industry in the early 1990s, resulting in a few “ultra-scale” companies? If so, how will these ultra-scale companies leverage their breadth to bundle diverse products? Will we witness the re-emergence of anticompetitive practices that were challenged by the Senate Judiciary Committee — or will new business models emerge in which medtechs combine products, services and analytic capabilities along the continuum of care to help providers deliver better results? Given the breadth and scope, the latter is a very good possibility.
The answers to these questions, though, have enormous implications for medical device companies — now and in the future. Whatever the outcome, we need to be prepared for a new paradigm. Do we align with other like companies to provide new bundles? Do we consider smaller-scale service models to help our customers take out cost? Do we ignore the trend altogether and go about our business? Do we pretty ourselves up for sale to be a part of an ultra-scale world?
In the face of this change, I believe mid-sized companies like AngioDynamics must identify how they thrive in this emerging paradigm. If we are moving down the path of Big MedTech, I believe mid-sized companies are presented with an even greater opportunity to drive disruptive innovation into the marketplace, because often, the casualty of scale is focus.
Within our targeted segments, we must leverage our focus to develop disruptive technologies that meet customers’ needs while simultaneously reducing overall health care costs and improving patient
outcomes. More than ever, we need effective clinical and economic trials that clearly demonstrate that our new technologies achieve these results within the current budget cycle. If we accomplish this within our focused segments, we will always have a vital role to play regardless of the model that emerges.
While our industry has arrived at a crossroads, our customers’ values have not changed. I believe the market has proven it demands technologies that both improve outcomes and reduce costs. Strategies to expand market share are important, but ultimately, for our industry to advance, we must also invest in innovation.
It is time to focus our considerable energy and knowledge on those innovations that bring clinical and economic improvements to the health care system. That is medtech’s winning one-two punch.
This year, one of the largest medical device deals in history, Zimmer/Biomet, was followed by the largest-ever medical device deal, Medtronic/Covidien. While the industry has seen megadeals before, I believe recent deals like these are signposts of the medical technology industry’s future, potentially charting a new course in medical device M&A.
While our industry has arrived at a crossroads, our customers’ values have not changed. I believe the market has proven it demands technologies that both improve outcomes and reduce costs.
24 EY | Pulse of the industry

Industry performance
Part 2Part 2
| Industry perform
ance

1 | Financial performanceIndustry performance
26 EY | Pulse of the industry

Taking advantage of health care’s warming financial climate and a pronounced uptick in market capitalization, medtech companies strengthened their cash positions and charted modest revenue growth. Even so, in the wake of a years-long period of financial restrictions, most medtech players were reluctant to invest their cash in activities that set the stage for future growth. Thus, while R&D investment and headcount expanded 7% and 5%, respectively, from 2012 to 2013, these increases were unexceptional compared to the additional cash companies added to their balance sheets or the money they returned to shareholders during the same period.
Context is also critical when evaluating the 16% year-on-year increase in net income. On the surface, the double-digit percentage growth in net income is a welcome change from the 24% decrease in net income that took place from 2011 to 2012. However, the picture changes when one realizes 2013’s net income growth was boosted by a series of charges incurred by Boston Scientific in 2012. Normalizing for these charges, net income actually fell by 2.6%.
The global numbers only tell part of the story. Grasping the full picture requires parsing the data to understand which companies — and this year, which types of medtech companies — drove the overall trends, as well as how currency fluctuations impacted overall financial performance. Once again, the strengthening dollar had a material
Holding steady
Public company data 2013 2012 % change
Revenues $336.2 $323.6 4%
Conglomerates $153.8 $149.1 3%
Pure-play companies $182.4 $174.5 5%
R&D expense $13.5 $12.7 7%
SG&A expense $60.6 $57.9 5%
Net income $16.5 $14.2 16%
Cash and cash equivalents and short-term investments $58.1 $46.7 24%
Market capitalization $566.7 $432.9 31%
Number of employees 671,100 641,300 5%
Number of public companies 376 381 –1%
Medical technology at a glance, 2012–13(US$b, data for pure-plays except where indicated)
Numbers may appear to be inconsistent due to rounding. Data shown for US and European public companies.Market capitalization data is shown for 31 December 2013 and 31 December 2012.
Source: EY, Capital IQ and company financial statement data.
impact on companies on both sides of the Atlantic. Based on our analysis of the top 10 US-based medtechs, currency shifts dragged down their European revenues by an average of 1.5% in 2013. Meantime, those same shifts resulted in the inflation of European firms’ revenues by approximately 3%.
A modest uptick in revenuesAfter converting all results into US dollars, the 2013 revenues of US and European companies increased by 4%, an improvement over 2012, when the top line grew just 2%. Additional
In the 2013 edition of Pulse, we outlined the storms buffeting the medical technology sector, including the shift to value-based health care and growing regulatory pressures. Over the course of 2013, these headwinds didn’t abate. Still, based on the annual financial performance metrics we collect, the medtech industry, while not pressing full steam ahead, has maintained course amid changeable commercial seas.
analysis shows which medtech segments achieved the greatest annual revenue growth: pure-play businesses (e.g., non-conglomerates) in the non-imaging diagnostics and imaging sectors performed the best, each posting 7% revenue growth. The research and other equipment segment saw its year-over-year revenues expand 5%. Meantime, performance of the therapeutic device class, by far the biggest category in medtech, was roughly equal to the revenue growth for the sector.
The slight revenue growth of therapeutic device medtechs is explained by the performance of the cardiovascular and orthopedic players, which reported 3% and 4% revenue growth, respectively.
Financial performance
1 | Financial performance
27Medical technology report 2014

Such modest revenue growth is hardly a new phenomenon, but it does present a conundrum, given that the disease areas with the most potential for growth don’t have the same overall market potential as the medtech industry’s historic mainstays.
On a percentage basis, 2013 revenue growth for US and EU therapeutic device companies was strongest in the following disease categories: gastrointestinal (118%), hematology/renal (21%) and women’s health (16%). If anything, these numbers highlight why companies and analysts alike were so excited by the opportunity in renal denervation for hypertension — and so devastated when negative clinical trial data sent companies such as Medtronic and St. Jude Medical back to the drawing board in early 2014.
To accelerate top-line growth, industry players, especially those in the therapeutic device class, will need to increase their M&A activities in addition to improving their organic growth. The biggest deal announced thus far in 2014 — Medtronic/Covidien — shows how at least one pure-play medtech believes
Change in US and European therapeutic device companies’ revenue and net income by disease category, 2013 vs. 2012(US$b)
Data shown for pure-play companies only. Source: EY, Capital IQ and company financial statement data.
Net incomeRevenue
Oncology Dental Multiple Ophthalmic OrthopedicCardiovascular/
vascular$5
–$1
–$2
$1
$0
$2
$4
$3
it can improve its top line. While Wall Street analysts and mass media have focused primarily on the tax advantages Medtronic will enjoy by moving its headquarters from the US to Ireland, the companies’ complementary pipelines will
make the combined entity the leading device manufacturer in six of the top 10 hospital purchasing categories. (See “Medtronic/Covidien: emblematic of what medtech is buying now” on page 68.)
US$
b
28 EY | Pulse of the industry

Since 2009, the number of medtech commercial leaders, defined as those companies with revenues in excess of US$500 million, has remained constant thanks to the push and pull of M&A. In 2013, this pool of medtechs expanded from 56 to 58, as Masimo and Thoratec joined the leader board for the first time as a result of organic growth.
Masimo, best known for its pulse oximetry devices, is a California-based manufacturer of non-invasive patient monitoring tools, while Thoratec specializes in the development of products to treat patients with advanced heart failure. Medtronic remained the largest pure-play medtech, with US$16.6 billion in revenue, followed by research and equipment behemoth Thermo Fisher Scientific (US$13.3 billion). Covidien, meanwhile, posted US$10.2 billion in 2013 revenues, joining that elite club of medtechs with annual revenues greater than US$10 billion.
Net income inequalityNet income performance varied considerably depending on company size and type. Commercial leaders, defined as pure-play medtech companies with annual sales greater than US$500 million,
saw a 22% yearly gain in net income. This metric was heavily influenced by Boston Scientific’s improved financial performance in 2013 relative to 2012. When the data were normalized for Boston Scientific’s results, the commercial leaders’ net income declined 1.5% relative to the year before.
Net income for “other” smaller medtechs also fell, decreasing 100% from 2012 to 2013. This decline was partially fueled by the 2013 performance of Wright Medical,
which saw its net income fall US$279 million as a result of charges associated with its acquisition of BioMimetic Therapeutics. Four other companies saw their net incomes drop at least US$50 million from 2012 to 2013.
Of the different medtech categories, companies in the therapeutic device segment saw the biggest uptick in net income (21%), while imaging businesses reported the largest drop, falling 8% year-over-year.
US and European commercial leaders, 2009–13
Source: EY, Capital IQ and company financial statement data.
> US$10b
US$5b–US$10b
US$2.5b–US$5b
US$1b–US$2.5b
US$0.5b–US$1b
20112009 2010 2012 2013
60
0
20
10
30
50
40
16 15 13 14 14
26 26 27 25 27
118 9 9 9
45 6 6 5
23 2 2 3
Commercial leaders hold steady
Num
ber o
f com
pani
es
29Medical technology report 2014

In addition to being influenced by outliers like Boston Scientific, these numbers are at least partially explained when one looks at R&D investment by medtech category. Increases in R&D spending outpaced net income growth for imaging, diagnostics and research and equipment businesses by 15, nine and two percentage points, respectively; meantime, the net income of therapeutic device firms outpaced their R&D spend by 15 percentage points.
Strengthening the balance sheet Whatever the metric, the medtech sector has always been populated by “haves” and “have-nots.” That trend continued to hold true in 2013, particularly in terms of cash on the books. (See “Financing the future” on page 42.)
An analysis of the US medtech sector shows that in 2013, a growing number of companies populated either end of the spectrum — e.g., those with more than five years of cash or those with less than one year of cash. Indeed, the pool of US companies with more than five years of cash expanded 42% year-over-year to 14%, while one of out of every two publicly traded medtechs has less than one year of financing.
In Europe, the opposite was true, as the number of companies in the middle pools — those with two to five years of cash — grew compared to those at either end of the spectrum. Indeed, 49% of all publicly traded European medtechs fall into this category compared to 45% a year ago.
US public medtech cash index, 2011–13
More than 5 years 3–5 years 2–3 years 1–2 years Less than 1 year
2011
10% 8% 14%8% 9%
11%11% 10%
7%
24% 23% 17%
48% 49% 51%
2012 2013
100
80
60
40
20
0
European public medtech cash index, 2011–13
Chart excludes companies that are cash flow positive. Numbers may appear to be inconsistent due to rounding. Source: EY, Capital IQ and company financial statement data.
Chart excludes companies that are cash flow positive. Numbers may appear to be inconsistent due to rounding. Source: EY, Capital IQ and company financial statement data.
2011
14%
9%6%
17%
55%
2012
12%
11%
11%
23%
44%
2013
11%
9%
14%
26%
40%
100
80
60
40
20
0
More than 5 years 3–5 years 2–3 years 1–2 years Less than 1 year
Financial performance
Perc
enta
gePe
rcen
tage
30 EY | Pulse of the industry

Investing for the futureFrom 2012 to 2013, 60% of US and European medtechs increased their R&D spend. That’s similar to 2012, when 61% of companies expanded their R&D commitments compared to the year before. The total dollars spent on R&D grew 7% to US$13.5 billion in 2013. That’s a significant increase over the 1% upturn reported from 2011 to 2012. Of the 58 commercial leaders with annual sales greater than US$500 million, 43 increased their annual R&D spend during this period, while 56% of companies in the “other” category upped their investment in pipeline development. In contrast to 2012, when no company grew its R&D by more than US$35 million, five medtechs — Hologic, Illumina, Medtronic, Stryker and CR Bard — increased their R&D spend by more than US$60 million each.
This increase in R&D spend was likely partly driven by a more challenging regulatory and pricing environment. Based on our analysis of regulatory submissions for premarket approval (PMA) or 510(K) clearance, there were 43 original device PMA submissions in 2013 compared to
just 24 in 2012. Meantime, the number of device applications submitted for 510(K) clearance fell nearly 8% in the same period to 2,936. These data suggest medtechs are spending more to test their devices via new, more stringent — and more expensive — clinical trials in the hopes of differentiating products with provider and hospital purchasers.
Year-over-year trends in medtech R&D investment tell only part of the story, however. To understand the strategic
imperatives at work in the device industry, it’s also important to track R&D spending as a percentage of revenue over time. Based on this metric, R&D investment has held constant at 7% of the top line since 2008. Thus, even though R&D spending grew faster than revenue in 2013, it wasn’t enough to change the overall R&D-to-revenue ratio. Coming in a year when medtechs saw significant growth in their available cash, these data suggest firms are taking a measured approach to their R&D investments.
The increase in R&D spend was likely partly driven by a more
challenging regulatory and pricing environment.
31Medical technology report 2014

If medtechs as an industry didn’t double-down on R&D, how did companies spend their cash? That question is partly answered by medtechs’ need to balance the demands of longer-term growth with the shorter-term expectations of shareholders. In 2013, medtech companies returned 56% of their net cash generated through operations (US$16.7 billion) to shareholders, an increase of seven percentage points over 2012. In dollar terms, that’s US$3.5 billion more than they invested in R&D during the same period. Indeed, since 2010, the
dollars returned annually to shareholders have equaled or exceeded the dollars spent on R&D.
Moreover, while medtechs are returning more money to shareholders overall, the pool of companies doing so has shrunk since 2008, when 183 device firms either issued dividends or repurchased stock. In 2013, 162 companies returned cash to shareholders in the form of dividends or stock buybacks. Medtronic was among the most active, returning more than US$2.3 billion in cash as it increased its
dividend by 8% and repurchased more than 30 million shares of common stock. Other companies that rewarded investors via stock buybacks or dividends in 2013 included Covidien, St. Jude Medical and Intuitive Surgical.
There are important implications from these findings. Note that in the biotech sector, lengthy and expensive product development time lines can create tension with shareholders looking for nearer-term returns via share repurchases or a dividend. This tension isn’t as pronounced in the device sector, where shorter development times allow medtechs to recoup their R&D investment dollars more quickly.
That medtech companies are choosing to return more money to shareholders than they are investing in R&D therefore suggests they believe they can create more value for investors by returning cash to them than they can by investing it in R&D or M&A initiatives. In an innovation-driven industry, that’s quite telling and may be one more indication of the challenging regulatory and pricing environment.
A rising tide lifts all medtechsSince the beginning of 2012, the share prices of medtechs, like other health care companies, outpaced the broader indices in both the US and Europe. In comparison to the huge run-up seen in biotech (driven by the extraordinary revenue and profit growth of the commercial leading biotechs), medtech’s performance looks more modest. Still, even the 31% increase in market capitalization for EY’s medtech index could be viewed as extraordinary given that the medtech industry’s top line grew modestly and normalized net income declined.
Since 2010, medtechs are returning more cash to shareholders than they are investing in R&D
Source: EY, Capital IQ and company financial statement data.
Cash returned to shareholders R&D
$12
$14
$16
$18
$0
$4
$2
$6
$10
$8
US$
b
2008 2009 2010 2011 2012 2013
Returning cash to shareholders
Financial performance
32 EY | Pulse of the industry

What drove the growth?For starters, investors had extremely low expectations for the group, given the potential impact of the US medical device tax on the bottom line and ongoing reimbursement pressures. These low expectations, coupled with positive financial turnaround stories of players such as Boston Scientific, helped build a case for an undervalued medtech sector in 2013. As the calendar flipped to 2014, a bolus of late-stage products fueled optimism that 2014 would result in an emerging pipeline story that would drive top-line growth for years to come. The end result: in the medtech space, the market capitalizations of US and EU commercial leaders increased 30% from 2012 to 2013, while smaller players enjoyed a 34% uptick.
Analyzing the medtech sector by product type, it’s easier to parse which companies drove the growth in market capitalization. Indeed, this growth was largely driven by companies in the research and other equipment space; in the US, share prices for that class surged 153% from 1 January 2012 to 30 June 2014, increasing from US$34.5 billion to US$94.3 billion. In comparison, therapeutic device companies generated returns around 28%, in line with the Russell 3000 and below the NASDAQ.
0%
–40%
40%
80%
120%
160%
EY US medtech industryTherapeutic devices (total)
Research and other equipmentImaging
Non-imaging diagnostics
2012 20142013
US market capitalization by product type, 2012–14
Financial performance
0%
–20%
20%
40%
60%
80%
EY US medtech industry Big pharmaRussell 3000 NASDAQ Composite
US market capitalization relative to leading indices, 2012–14
2012 20142013
Chart includes companies that were active on 30 June 2014. Source: EY and Capital IQ.
Chart includes companies that were active on 30 June 2014. Source: EY and Capital IQ.
33Medical technology report 2014

That research and other equipment companies drove shareholder returns in the medtech sector in 2013 isn’t too surprising. Given this group sells products directly to other life sciences companies, which are themselves trying to improve their R&D efficiency, it is easy to see how read-through from the biotech boom positively impacted investors’ perceptions of these companies. Among the biggest gainers: Thermo Fisher Scientific, which showed itself to be a top player and boosted its reach and product offerings via its US$13.6 billion purchase of Life Technologies. Investors also rewarded Illumina, which posted strong revenue growth, growing margins and a solid cash position, sending its market capitalization up US$19.2 billion since the beginning of 2012.
–20%
0%
20%
40%
60%
80%
EY European medtech industry FTSE 100 Big pharmaCAC-40 DAX
European market capitalization relative to leading indices, 2012–14
2012 20142013
Growth was largely driven by companies in the research and other equipment space.
Financial performance
EY European medtech industryTherapeutic devices (total)
Research and other equipmentImaging
Non-imaging diagnostics
100%
80%
60%
40%
20%
0%
–20%2012 20142013
European market capitalization by product type, 2012–14
Chart includes companies that were active on 30 June 2014. Source: EY and Capital IQ.
Chart includes companies that were active on 30 June 2014. Source: EY and Capital IQ.
34 EY | Pulse of the industry

The 2013 financial performance of US public companies closely resembled the financial performance of the sector overall. While no major acquisitions skewed the numbers, a stronger US dollar negatively affected the results state-side by approximately 1.5%. Thus, adjusting for currency fluctuations, 2013 revenues would have increased 5.5%. Although this growth rate is below the industry’s average prior to the great recession, it is a solid result, suggesting US medtechs are holding steady in a challenging reimbursement and pricing climate.
Public company data 2013 2012 % changeRevenues $218.5 $210.5 4%
Conglomerates $85.6 $82.8 3% Pure-play companies $132.9 $127.7 4%
R&D expense $10.7 $10.1 6%SG&A expense $42.5 $41.6 2%Net income $11.4 $8.6 32%Cash and cash equivalents and short-term investments $49.8 $39.8 25%Market capitalization $422.4 $309.3 37%Number of employees 458,800 435,300 5%Number of public companies 224 231 –3%
US medtech at a glance, 2012–13(US$b, data for pure-plays except where indicated)
Numbers may appear to be inconsistent due to rounding. Market capitalization data is shown for 31 December 2013 and 31 December 2012. Source: EY, Capital IQ and company financial statement data.
2013 2012 % changeCommercial leadersRevenues $119.7 $114.2 5%R&D expense $8.8 $8.1 8%Net income (loss) $13.4 $9.7 37%Market capitalization $365.2 $266.2 37%Number of employees 405,800 379,800 7%Other companiesRevenues $13.2 $13.5 –2%R&D expense $1.9 $2.0 –3%Net income (loss) $(2.0) $(1.1) –79%Market capitalization $57.8 $43.1 34%Number of employees 53,100 55,500 –4%
US commercial leaders and other companies, 2012–13(US$b)
Commercial leaders are pure-play companies with revenues in excess of US$500 million.Numbers may appear to be inconsistent due to rounding.Market capitalization data is shown for 31 December 2013 and 31 December 2012.
Source: EY, Capital IQ and company financial statement data.
United States Financial performance
The brighter — or at least stable — revenue picture was accompanied by a 6% jump in the R&D spend to US$10.7 billion, up from the 1% and 2% increases seen in 2012 and 2011, respectively. An analysis of the data shows that 62% of US companies increased their R&D spend in 2013, down slightly from 2012, when 66% of US medtechs expanded their R&D investment. As a group, pure-play medtechs spent 8.1% of their top line on R&D efforts, with the commercial leaders turning in a steady 7.4%.
Net income grew 32% compared to 2012, a welcome change from the year prior, when it fell 37%. However, impairment charges taken by Boston Scientific in 2012 influenced the results. Normalizing for these charges, net income growth was 0%, in line with the normalized growth seen in 2012 (0.5%) and 2011 (-1%).
Renewed confidence in the medtech sector was also bolstered by strong improvement in market capitalizations, which surged 37% in 2013, compared to only a 4% growth in 2012. More than 70% of US medtechs saw their market caps increase, and nearly a quarter saw their share prices increase 100% or more.
Analyzing the US medtech industry by company size shows how much of the US performance was driven by the commercial leaders. Similar to 2012,
Financial performance US
35Medical technology report 2014

the “other” category, which includes all pure-play medical technology companies with revenues less than US$500 million, underperformed the commercial leaders in all categories except market capitalization. Indeed, revenues of US commercial leaders grew 5% year-over-year, while the “other” group saw its revenues shrink 2% in the same period. A similar trend was also seen for net income and R&D. Commercial leaders reported net income gains of 40% in 2013 even as they upped their R&D spend by 8% over 2012.
The “other” companies, however, reported a 79% increase in net loss and pulled back by 3% in their R&D investments. Note that the performance of the “other” category was not materially affected by the movement of Thoratec and Masimo to the commercial leaders category. Had they remained in the “other” category, an analysis of the normalized data shows all the financial metrics for this medtech segment would have remained the same.
Market capitalization was the only metric in which the “other” medtech companies kept pace with the commercial leaders. Both groups saw very healthy increases in market cap, symptomatic of 2013’s broader market rally and investors’ enthusiasm for health-care-related stocks.
NuVasive, the San Diego, CA-based developer of spinal products, topped the list of fastest-growing US medtechs as measured by five-year compound annual growth rate (CAGR). Eight of the top 10
Region RevenueNumber of companies
Market capitalization 31 Dec 2013 R&D Net income
Cash and cash equivalents Total assets
Massachusetts $32,500 27 $83,434 $2,328 –$28 $8,928 $74,4765% –4% 62% 4% 99% 155% 5%
Minnesota $22,736 14 $80,968 $2,349 $4,247 $13,015 $46,3642% –7% 44% 4% –4% 19% 7%
Southern California
$15,444 33 $63,318 $1,699 $1,215 $6,862 $29,8406% 0% 36% 12% 11% 11% 5%
Northern California
$12,531 29 $49,576 $1,267 $1,235 $5,074 $18,7865% –3% 7% 2% 3% 9% 4%
New Jersey $12,418 13 $35,743 $859 $1,940 $3,981 $19,1414% –8% 38% 12% 12% 19% 10%
Michigan $9,284 3 $30,154 $544 $1,035 $4,067 $16,1114% 0% 37% 14% –22% –7% 19%
Indiana $6,740 3 $18,722 $298 $830 $1,942 $11,6833% –25% 37% –7% –5% 18% 4%
Pennsylvania $6,673 9 $17,111 $256 $566 $1,107 $11,8734% –10% 45% 2% 225% 18% 6%
New York $3,315 20 $7,232 $217 $69 $437 $4,9729% –5% 25% –2% 13% 41% 5%
Ohio $3,126 5 $5,343 $114 $177 $275 $3,1871% 0% 41% 14% 31% 14% 11%
Maryland $1,916 3 $8,616 $114 $422 $1,850 $3,6753% 0% 9% –1% 2% 18% 13%
Texas $1,523 10 $5,453 $163 $36 $586 $1,9419% 11% 25% 13% –76% 31% 14%
Selected US medtech public company financial highlights by region, 2013(US$m, % change over 2012)
Data shown for pure-play companies only. Source: EY, Capital IQ and company financial statement data.
US Financial performance
US medtechs are holding steady in a challenging reimbursement and pricing climate.
36 EY | Pulse of the industry

companies in this category expanded primarily via organic growth, compared to six in 2012. New to the list were Align Technology, maker of the Invisalign clear aligner orthodontics system, Natus Medical, developer of tests to screen, treat and monitor common medical ailments, and AngioDynamics, producer of minimally invasive technologies to treat cancer and peripheral vascular disease.
Interestingly, five of the 10 fastest-growing companies on the 2013 list are developers of either diagnostic tests or research and instrumentation equipment used by life sciences companies. These companies sell products to biopharmaceutical players who, as we wrote in our 2014 biotechnology report Beyond borders: unlocking value, are interested in increasing their use of capital-efficient research strategies such as precision medicine to shorten development times and increase the probability of success of their products.
Finally, we note that in contrast to 2012, when all 10 of the fastest-growing companies expanded revenues by more than 20%, just five exceeded that
Companies 2008 2013 CAGR
NuVasive $250 $685 22%
Danaher — Life Sciences & Diagnostics and Dental $3,277 $8,951 22%
Corning Life Sciences $326 $851 21%
Intuitive Surgical $875 $2,265 21%
Illumina $573 $1,421 20%
Cepheid $170 $401 19%
Volcano $171 $391 18%
Align Technology $304 $653 17%
Natus Medical $162 $344 16%
AngioDynamics $167 $340 15%
Selected fast-growing US medtechs by revenue growth, 2008–13(US$m)
Companies in italics made significant acquisitions between 2008 and 2013.CAGR = compound annual growth rate
Source: EY, Capital IQ and company financial statement data.
benchmark in 2013. It is yet another data point demonstrating top-line growth is more difficult to achieve given the medtech industry’s current business challenges.
Financial performance US
37Medical technology report 2014

As was true in the US, currency fluctuations impacted the financial performance of European medtechs. While revenues expanded 4%, in line with results achieved in the US, these results were boosted 3% by the strong dollar. Normalizing for local currencies, revenue growth for European medtechs was just 1%. In terms of top-line growth, pure-play medtechs outperformed conglomerates by three percentage points.
Companies 2013 2012 % change Normalized % change
Revenues $117.7 $113.1 4% 1% Conglomerates $68.3 $66.3 3% 0% Pure-play companies $49.4 $46.8 6% 2%
R&D expense $2.8 $2.6 11% 7%SG&A expense $18.0 $16.4 10% 7%Net income $5.0 $5.6 –9% –12%Cash and cash equivalents and short-term investments $8.3 $6.9 19% 15%Market capitalization $144.3 $123.6 17% 13%Number of employees 212,300 206,000 3% —Number of public companies 152 150 1% —
European medtech at a glance, 2012–13(US$b, data for pure-plays except where indicated)
Numbers may appear to be inconsistent due to rounding.Market capitalization data is shown for 31 December 2013 and 31 December 2012.
Source: EY, Capital IQ and company financial statement data.
2013 2012 % changeCommercial leadersRevenues $44.1 $41.7 6%R&D expense $2.3 $2.1 11%Net income (loss) $5.2 $5.5 –5%Market capitalization $128.4 $112.3 14%Number of employees 189,800 185,100 3%Other companiesRevenues $5.3 $5.1 4%R&D expense $0.5 $0.4 8%Net income (loss) $(0.2) $0.0 –588%Market capitalization $15.7 $11.3 39%Number of employees 22,500 20,900 8%
European commercial leaders and other companies, 2012-13(US$b)
Commercial leaders are pure-play companies with revenues in excess of US$500 million.Numbers may appear to be inconsistent due to rounding.Market capitalization data is shown for 31 December 2013 and 31 December 2012.
Source: EY, Capital IQ and company financial statement data.
Europe Financial performance
In contrast to the situation in the US (where net income increased 32% in 2013), the net income of European device companies shrank by 9% to US$5 billion. This reverses a two-year trend that saw net income grow 10% in 2012 and 5% in 2011. A closer look at the numbers shows that only 50% of the companies increased net income from 2012 to 2013. Moreover, three companies saw their net income drop by more than US$100 million: Covidien, which restructured its business in 2013; Smith & Nephew, which cited pricing pressure in the orthopedics market; and Sonova Holding, which in its annual report noted costs associated with an out-of-court settlement with investors and increased product liability provisions.
While the year-over-year drop in net income is a cause for concern, any bleak predictions about the future of European medtech must be tempered by the recognition that at least some of that dip resulted from this group’s reinvestment in R&D. Indeed, European companies increased their R&D spend 11% to nearly US$3 billion from 2012 to 2013. That’s nearly double the increase seen in the US. In another positive, European companies also increased investment in personnel, expanding their employee base by 3% over the year.
EU Financial performance
38 EY | Pulse of the industry

In terms of market cap, medtech remains a tale of two continents. Market cap growth in Europe was half what was observed in the US (17% versus 37%) and below the 26% increase seen in 2012.
As was true in the US, commercial leaders in Europe contributed significantly to the overall performance of the medtech companies in that region. While Europe’s 18 commercial leaders account for only 12% of the total number of public companies, they generated 89% of the revenues, 104% of the net income and 82% of the R&D dollars invested. Once
again, smaller companies were hit harder by the continent’s austerity measures, particularly in terms of device pricing and delayed payment cycles. That said, in 2013, smaller European medtechs increased their revenue and R&D spend by 4% and 8%, respectively, over 2012. And while smaller companies saw a big year-over-year drop-off in net income, they did outpace the commercial leaders on market cap and number of employees. The sharp increase in the market cap of the European “other” companies appeared to be driven by the strong
Country RevenueNumber of companies
Market capitalization 31 Dec 2013 R&D Net income
Cash and cash equivalents Total assets
Ireland $10,280 2 $31,351 $512 $1,710 $1,890 $20,1443% 0% 13% 6% –11% –3% –10%
France $9,981 26 $28,400 $586 $894 $1,885 $14,4715% 18% 5% 8% 5% 51% 14%
Sweden $5,940 34 $15,501 $322 $507 $776 $9,96411% –3% 2% 15% –17% 11% 8%
United Kingdom $5,022 20 $14,684 $286 $573 $458 $7,0173% 5% 25% 32% –24% 50% 3%
Germany $4,230 14 $4,667 $175 $169 $300 $3,8577% –7% 30% 10% –14% 18% 10%
Switzerland $4,087 8 $14,784 $263 $319 $1,179 $5,5086% –11% 27% 3% –19% 102% 17%
Denmark $3,966 4 $19,404 $195 $725 $344 $3,85811% 0% 31% 10% 22% –33% 12%
Italy $3,022 5 $5,058 $151 $205 $506 $3,9133% 0% 13% 4% –15% 35% 4%
Netherlands $1,613 2 $6,493 $186 $10 $438 $4,7975% 0% 30% 28% –91% –15% 0%
Israel $529 20 $2,452 $86 –$82 $347 $8551% –17% 74% –5% 13% 12% 1%
Selected European medtech public company financial highlights by country, 2013(US$m, % change over 2012)
Data shown for pure-play companies only.
Source: EY, Capital IQ and company financial statement data.
performances of a few players, especially Mazor Robotics, LifeAssays and Alpha Helix Molecular Diagnostics.
In terms of the R&D spend/revenue ratio, European companies aren’t investing as heavily: European commercial leaders spent 5.2% of revenues on R&D and “other” European medtechs spent 9.4%, while their respective US counterparts spent 7.3% and 14.4% of revenues on pipeline development.
Financial performance EU
Normalizing for local currencies, revenue growth for European medtechs was just 1%.
39Medical technology report 2014
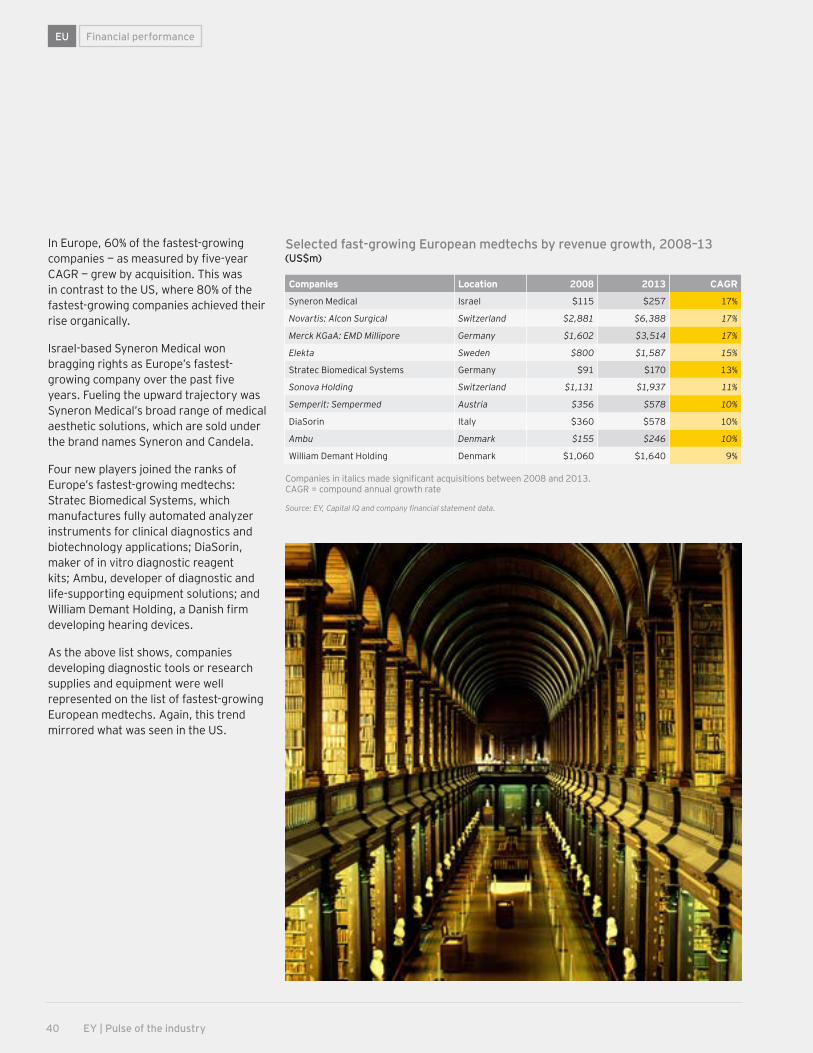
In Europe, 60% of the fastest-growing companies — as measured by five-year CAGR — grew by acquisition. This was in contrast to the US, where 80% of the fastest-growing companies achieved their rise organically.
Israel-based Syneron Medical won bragging rights as Europe’s fastest-growing company over the past five years. Fueling the upward trajectory was Syneron Medical’s broad range of medical aesthetic solutions, which are sold under the brand names Syneron and Candela.
Four new players joined the ranks of Europe’s fastest-growing medtechs: Stratec Biomedical Systems, which manufactures fully automated analyzer instruments for clinical diagnostics and biotechnology applications; DiaSorin, maker of in vitro diagnostic reagent kits; Ambu, developer of diagnostic and life-supporting equipment solutions; and William Demant Holding, a Danish firm developing hearing devices.
As the above list shows, companies developing diagnostic tools or research supplies and equipment were well represented on the list of fastest-growing European medtechs. Again, this trend mirrored what was seen in the US.
Companies Location 2008 2013 CAGR
Syneron Medical Israel $115 $257 17%
Novartis: Alcon Surgical Switzerland $2,881 $6,388 17%
Merck KGaA: EMD Millipore Germany $1,602 $3,514 17%
Elekta Sweden $800 $1,587 15%
Stratec Biomedical Systems Germany $91 $170 13%
Sonova Holding Switzerland $1,131 $1,937 11%
Semperit: Sempermed Austria $356 $578 10%
DiaSorin Italy $360 $578 10%
Ambu Denmark $155 $246 10%
William Demant Holding Denmark $1,060 $1,640 9%
Selected fast-growing European medtechs by revenue growth, 2008–13(US$m)
Companies in italics made significant acquisitions between 2008 and 2013.CAGR = compound annual growth rate
Source: EY, Capital IQ and company financial statement data.
EU Financial performance
2 | Financing
40 EY | Pulse of the industry

2 | FinancingIndustry performance
41Medical technology report 2014

Positive financial indicators included the resurgent market for initial public offerings, a marked year-over-year uptick in venture dollars in Europe and, for larger medtechs, continued access to cheap capital via the debt markets. Still, while venture dollars have held steady in recent years, the pool of capital available to smaller medtechs is significantly smaller than before the recession, raising important questions about how the medical technology industry will finance future innovation.
The 2013-14 period was also a tale of two continents. Funding in Europe increased 81% year-over-year, reaching US$5.1 billion, with percentage increases across all types of funding. In contrast, in the US, funding in three different categories — venture, follow-on and debt — declined, resulting in a 23% decrease (US$6 billion) in financing from 2012–13 to 2013–14.
The biggest declines were seen in follow-on public offerings, which slid 52% from US$4.2 billion in 2012–13 to US$2.0 billion in 2013–14. One mammoth
Financing the future
US and European medical technology companies raised a combined US$27.3 billion during the 12-month period ending 30 June 2014, a 14% decrease compared to the year prior, but still the second-highest capital raise since 30 June 2008.
follow-on — Thermo Fisher Scientific’s US$2.5 billion offering in the 12-month period ending 30 June 2013 — dramatically impacted the 2013–14 result. Normalizing for this exceptional financing, funding associated with follow-ons actually increased 18% year-over-year in 2013–14.
Debt-heavy An uptick in follow-ons, together with the 600% increase in IPO financing from 2012–13 to 2013–14, sounds like the makings of a brighter financing story. Still, it’s important to note that roughly 71% of medtech’s total financing during the 12 months ending 30 June 2014 came from the debt markets. Indeed, 2013–14 marked the third year in a row where debt financing contributed more than 70% of the total financing dollars.
As has also been true in years past, debt dollars in 2013–14 disproportionately flowed to the commercial leaders, defined as those companies with revenues greater than US$500 million. Indeed, in 2013–14,
just 14 commercial leaders raised 68% of the total debt dollars (US$13.2 billion) and there were seven debt financings worth more than US$1 billion. In the prior 12-month period, 17 commercial leaders garnered 58% (US$13.5 billion) of the debt financing and six deals eclipsed the US$1 billion mark. Notable debt deals in 2013–14 included Thermo Fisher Scientific’s US$3.2 billion offering, which helped fund its acquisition of Life Technologies, and Medtronic’s US$2 billion deal, which was intended for general corporate purposes, including dividends and stock buybacks.
While Thermo Fisher Scientific used its debt offering to fund its biggest acquisition ever, most of the proceeds from the debt raised in the 12 months ending 30 June 2014 were not used to fund growth activities such as acquisitions or investments in early-stage companies. Instead, based on EY’s estimate, at least 60% of the debt was used to refinance existing obligations or restructure balance sheets.
Financing
TypeJul 2007– Jun 2008
Jul 2008– Jun 2009
Jul 2009– Jun 2010
Jul 2010– Jun 2011
Jul 2011– Jun 2012
Jul 2012– Jun 2013
Jul 2013– Jun 2014
Venture $5,166 $4,678 $4,880 $4,107 $4,495 $4,162 $4,401
IPO $1,282 $17 $353 $820 $436 $205 $1,449
Follow-on and other $2,112 $1,807 $2,250 $2,390 $1,004 $4,205 $2,010
Debt $4,552 $6,421 $13,337 $11,764 $20,088 $23,072 $19,446
Total $13,111 $12,922 $20,820 $19,081 $26,023 $31,643 $27,306
Capital raised in the US and Europe by year (US$m)
Numbers may appear to be inconsistent because of rounding. PIPEs included in “follow-on and other.”
Source: EY, BMO Capital Markets, Dow Jones VentureSource and Capital IQ.
42 EY | Pulse of the industry

Financing
Such data, in conjunction with the US$16.7 billion in cash returned to shareholders during the same period and the sector’s modest year-over-year increase in R&D spend, reinforces the notion that larger medtechs are acting more cautiously in investing in traditional product innovation. (See “Holding Steady” on page 27.) As we discuss in this year’s Point of view, this retreat is at least partially due to the rapid shift in the medtech commercial landscape and companies’ realization that the emphasis on health care outcomes requires them to differentiate their products in new ways. With clear definitions of what constitutes value changing and the need to satisfy shareholders during a period of low industry growth, companies have prioritized the return of capital to shareholders.
Early-stage medtechs continue to struggleEven as fund-raising totals have jumped in recent years, the majority of this capital windfall has gone into the coffers of medtech’s commercial leaders. The 12-month period ending 30 June 2014 was no different. Commercial leaders generated 72% (US$19.6 billion) of the total funding raised in 2013-14, mostly via large debt deals.
Meantime, funds raised by the rest of the industry — what we refer to as “innovation capital” — climbed 31% from the prior 12-month period, to US$7.7 billion — the most innovation capital raised since 2007-08. The strong IPO market was a big reason for the year-over-year rebound in innovation capital. (Normalizing the data for IPO-sourced financings, funds raised by non-commercial leaders in 2013-14 would have totaled US$6.25 billion, a modest 4% increase over the 12 months prior.)
While the double-digit percentage growth in innovation capital in 2013-14 was a positive development, it also shouldn’t be viewed as proof that financing for smaller companies — particularly emerging, venture-backed firms — was once again flowing freely. In part, that’s because the prior 12-month period was particularly dismal for innovation capital: just US$6.0 billion, 19% of the total dollars raised, funded innovation-stage medtechs during 2012-13. Moreover, the 2013-14 financing data mark the fifth 12-month period in a row in which commercial leaders have commanded more than two-thirds of all the medtech financing. That’s very different from 2007-08, when total dollars for innovation capital exceeded those for commercial leaders by US$2.3 billion and made up nearly 60% of all medtech financing.
The numbers reinforce the notion that the 2008 recession dramatically redrew the medtech financing picture. Even with 30 new medtech listings in the US and
Europe in 2013-14, the dollars generated via IPOs comprised just 5% of the total financing dollars for the 12 months, a 4 percentage point drop compared to 2007-08. Similarly, venture commitments and follow-on offerings also made up a much smaller percentage of the total financing picture in 2013-14 than six years prior, when venture rounds and follow-on offerings accounted for 39% and 16% of all medtech financing dollars, respectively.
If this is the medtech industry’s new normal, early-stage companies have no choice but to squeeze further efficiencies out of their R&D efforts, while simultaneously searching for creative deal structures — and new kinds of investors — to finance their efforts. That fact in turn leads to some serious questions about the medtech industry’s future prospects. In particular, how will the biggest players continue to grow if their traditional wellsprings of innovation — smaller, VC-backed medtechs — remain underfunded?
Jul 2007– Jun 2008
Jul 2008– Jun 2009
Jul 2009– Jun 2010
Jul 2010–Jun 2011
Jul 2011–Jun 2012
Jul 2012– Jun 2013
Jul 2013–Jun 2014
35
30
25
20
15
10
5
0
US$
b
Driven by the resurgence of IPOs, innovation capital swelled in the US and Europe
Innovation capital is the amount of equity capital raised by companies with revenues of less than US$500 million.
Source: EY, BMO Capital Markets, Dow Jones VentureSource and Capital IQ.
Innovation capital Commercial leaders
43Medical technology report 2014

Medtechs raised US$4.4 billion in venture capital in the 12-month period ending 30 June 2014. That’s a 6% increase in investment over the prior 12-month period, but it isn’t an unalloyed positive. Recall that 2012-13 was one of the worst time spans in the past decade for venture investment. On average, from July 2008 to June 2013, venture capital firms committed 14% fewer dollars annually to medtech than they did before the recession. That figure is consistent with the amount of venture capital spent on medtechs in 2013-14, suggesting more restrained financing for early-stage medtechs is a reality for the forseeable future.
Venture’s departure from medtech comes at a time when venture capital fund-raising in general is on pace to surpass levels amassed only prior to the financial crisis. According to the National Venture Capital Association, US-based VCs are on track to raise an estimated US$33 billion by the end of 2014, a dollar threshold that hasn’t been cleared since 2006. But that uptick in overall fund-raising doesn’t appear to be filtering down to health care generally
or to medtech in particular. With the technology sector booming, health care’s share of US venture dollars has slipped from 34% in 2009 to 21% in the first half of 2014, according to Dow Jones VentureSource.
Over that same period, medtech’s share of the venture pie has also diminished. In 2009, 12.5% of total VC dollars in the US went to fund device- and diagnostic-focused start-ups. In 2013, that share tumbled to 7.5%, and, in the first half of
Financing
Venture investing’s steady stateMedtech’s share of US venture capital continues to tumble
2008 2009 2010 2011 2012 2013 H1 2014
Source: EY, Dow Jones VentureSource.
35%
30%
25%
20%
15%
10%
0%
5%
Medtech’s share of total venture funding Health care’s share of total venture funding
44 EY | Pulse of the industry

Financing
2014, it fell even further to just 6.7%. (In Europe, the trend is just as pronounced: total venture investments in European start-ups reached a seven-year high in 2013-14, but medtech’s portion of the capital deployed sank precipitously to 2.9% of all VC funding.)
Given VCs’ relative withdrawal from medtech investing in 2013-14, one might have expected a similar decline in investments in early-stage medtechs (e.g., start-ups raising seed or Series A or B financing). However, the 12-month period ending 30 June 2014 was one of the best years for early-stage medtech deals since 2009-10. In 2013-14, approximately US$1.5 billion of venture funding — roughly 40% of all VC medtech investment — went to early-stage start-ups. Compared to the prior 12-month period, that was a 28% increase in funding to early-stage medtechs.
Further analysis of the data shows the recent uptick in early-stage venture financing isn’t quite what it seems. One mammoth-sized seed round — GTCR’s US$300 million investment to create Maravai Life Sciences — disproportionately affected the financing picture. Excluding this particular financing, investments in early-stage privately held medtech would have made up 32% of the total medtech financing spent in 2013-14. That is in-line
with the average annual amount spent to finance emerging medtechs during the three prior 12-month periods.
Moreover, while the Maravai financing is technically a seed-stage round, the company being created is a far cry from a traditional medtech start-up in terms of its focus — and its investors. In March 2014, the private equity firm GTCR recruited two industry veterans, Carl Hull, the former CEO of Gen-Probe, and Eric Tardif, an ex-Morgan Stanley banker with
expertise in diagnostics M&A, to create a stand-alone diagnostics player built via rolling up smaller testing firms that already have at least US$15 million in operating earnings. In essence, Maravai isn’t focused on developing new innovative testing technologies per se; like the Zimmer/Biomet deal in orthopedics, it’s about creating scope in a disease area by gathering revenue-generating entities and housing them under one corporate roof. (See “Seeking scale” on page 57.)
Jul 2007– Jun 2008
Jul 2008– Jun 2009
Jul 2009– Jun 2010
Jul 2010– Jun 2011
Jul 2011– Jun 2012
Jul 2012– Jun 2013
Jul 2013– Jun 2014
100%
80%
90%
0%
10%
20%
30%
40%
50%
70%
60%
The share of early-stage venture investment in the US and Europe reached its highest point in four years
Source: EY, Dow Jones VentureSource and Capital IQ.
Late stage Early stage
45Medical technology report 2014

The private equity group GTCR is just one example of how the cohort of medtech investors has changed since the 2008 recession. In the years following the collapse of Lehman Brothers, poor financial returns meant traditional medtech VCs struggled to raise money from their limited partners, who themselves were reallocating their investments away from alternative investments like venture capital into publicly traded equities.
With less dry powder to invest, traditional medtech VCs reserved their capital for their portfolio companies, which faced longer and more uncertain R&D cycles thanks to increasing regulatory and reimbursement scrutiny. When making new investments, VCs still active in medtech looked for companies with devices in later stages of development, where the probability of success (both clinical and commercial) was higher and there was a greater likelihood the investment would generate the significant returns required to win back limited partners.
The end result? The pool of VCs investing in early-stage medtech changed dramatically from 2007-08 to 2013-14. Based on EY’s analysis, six years ago the most active medtech investors (based on the number of seed and first-round investments of greater
than US$5 million) were the stalwarts of the VC world: SV Life Sciences, Domain Associates, Versant Ventures, InterWest Partners and Kleiner Perkins Caufield & Byers. Fast forward to 2013-14 and the most active investors include Easton Capital Investment Group, Founders Fund, Sofinnova Partners, Domain Associates and the corporate venture arm of one pharmaceutical company — Merck Global Health Innovation Fund. Indeed, based on the analysis, only Domain Associates ranked as one of the top 10 medtech investors in both time periods.
Thus, while the pool of capital available to early-stage medtechs has shrunk in the post-recession era, were it not for groups like Easton Capital and Founders Fund, which each staked multiple emerging medtechs in 2013-14 (and none in the prior period), the financial shortfall would have been even greater. HealthQuest Capital, an investor group affiliated with Sofinnova Ventures, is another entity likely to play an important role in future medtech financings. Founded in 2013, the group made its public debut in August 2014, announcing a US$110 million fund devoted to medical technology and patient care products.
Financing
A new breed of medtech venture investors
The pool of VCs investing in early-stage medtech changed dramatically from 2007-08 to 2013-14.
VC rounds of US medtech companies with participation of corporate venture investors, by year
Capi
tal r
aise
d (U
S$m
)
Num
ber o
f fin
anci
ng ro
unds
$1,200 60
$1,000 50
$800 40
$600 30
$400 20
$200 10
$0 0
Source: Dow Jones VentureSource.
Capital raised Number of financing rounds
Jul 2010– Jun 2011
Jul 2011– Jun 2012
Jul 2012– Jun 2013
Jul 2013– Jun 2014
Jul 2009– Jun 2010
46 EY | Pulse of the industry

The participation of Merck & Co.’s Merck Global Health Innovation Fund in nine medtech or digital health investments since 1 July 2012 underscores another important point: the role of corporate venture in bankrolling future medtech innovations. From 1 July 2009 to 30 June 2012, the average annual number of medtech financings involving a corporate venture group was around 43. That annual average jumped 30% to 56 for the 2012-13 and 2013-14 periods as corporate venture groups from medtech companies such as Medtronic and Covidien and tech giants like Google and Qualcomm ramped up their medtech investment activity.
Importantly, this increased deal activity led to a dramatic uptick in medtech financing dollars. In 2009-10, corporate investors played a part in syndicating financings worth US$637 million. In 2013-14, the annual dollar total for financings that included a corporate venture investor grew to US$1 billion, a 57% increase over 2009-10. In all, since 1 July 2009, corporate venture investors have played a role in catalyzing US$4.2 billion in financing, contributing to more than 240 venture rounds. Based on our analysis, since 2009, the most active corporate venture investors in medtech have been Kaiser Permanente Ventures (45 investments), Ascension
Ventures (26), Johnson & Johnson Development Corp. (20), Medtronic (17) and Qualcomm Ventures (17).
Notable medtech deals at least partially financed by corporate venture groups in 2013-14 included Flatiron Health’s US$130 million Series B round (Google Ventures and Laboratory Corporation of America), Practice Fusion’s US$85 million Series D (Qualcomm Ventures), and ElectroCore Medical’s US$40 million Series A (Merck Global Health Innovation). (On 1 July 2014, ElectroCore Medical announced it had pulled in an additional US$10 million from its existing investors, including from Merck & Co.’s venture group.)
ElectroCore Medical, which is developing a self-administered vagus nerve stimulation therapy, is actually the
Since 1 July 2009, corporate venture investors have played a role in catalyzing US$4.2 billion
in financing, contributing to more than 240 venture rounds.
exception that proves the rule. Note that a pharmaceutical corporate venture group — not a medtech corporate venture arm — played an instrumental role in catalyzing the start-up’s Series A financing. Thus, while corporates are providing a much-needed infusion of capital into the medtech sector, they aren’t necessarily investing “ignition capital,” the dollars required to seed early-stage medtechs, to the same extent as their pharma-oriented corporate investor brethren. That’s particularly true for medtech start-ups developing novel therapeutic devices like ElectroCore Medical (as compared to emerging digital-health or diagnostic firms). Indeed, an analysis of the 2013-14 data shows that just 13 of the 81 investments made by corporate medtech investors involved early-stage medtechs developing therapeutic devices.
47Medical technology report 2014

After six lackluster years, 2013-14 was a banner 12 months for medtech IPOs, generating nearly US$1.5 billion. Most of the activity — 24 of the 31 listings in the US and Europe — occurred during the first half of 2014, as the window for medtech offerings finally widened following Tandem Diabetes Care’s November 2013 listing. That public listing, the largest IPO since 30 June 2011, helped boost investor appetite for medtech offerings as the sector benefited from the return of investors to early-stage health care deals more generally.
In terms of dollars raised and IPO volume, 2013-14 was one of the strongest years ever, rivaling the banner 2000-01 and 2004-05 time periods. Of the medtechs that debuted in the US and Europe in 2013-14, 15 companies called the US home and another 16 were located in Europe. Still, in terms of capital raised, it was the US companies that brought home the lion’s share of the capital: of the US$1.4 billion raised via medtech IPOs in 2013-14, 69% was concentrated in the US. Indeed, the European medtech cohort raised just US$444 million, and a third of that financing came from two companies, Oxford Immunotec Global and Lumenis, which listed on the US’ NASDAQ. Thus, the capital markets in Europe remain very challenging for early medtech entities seeking financing.
Therapeutic device companies were well represented in the 2013-14 medtech IPO class, accounting for 22 listings and nearly US$1 billion of the total raised. Seven diagnostics firms also went public during these 12 months, raising approximately US$375 million. Two imaging firms rounded out the IPO class, earning a combined US$75 million. An analysis by disease area shows that four
oncology-focused medtechs brought home the most IPO dollars (US$265 million), just edging out the five orthopedic firms which together raised US$260 million. As M&A in the orthopedics sector continues apace, this particular therapeutic device segment continues to remain popular with investors, who believe newly public companies can create additional value in developing innovations that, if successful,
are likely to result in lucrative acquisitions by large-cap medtechs looking to round out their portfolios. (See “Seeking scale” on page 57.)
In the four years prior to 2013–14, 15 IPOs managed to tip the US$50 million threshold. In the 12 months ending 30 June 2014, the same number of medtechs beat that figure.
Financing
Medtech IPOs: a welcome positive
US and European IPOs by year
Jul 1999–Jun
2000
Jul 2004–Jun
2005
Jul 2009–Jun
2010
Jul 2000–Jun
2001
Jul 2005–Jun
2006
Jul 2010–Jun
2011
Jul 2001–Jun
2002
Jul 2006–Jun
2007
Jul 2011–Jun
2012
Jul 2002–Jun
2003
Jul 2007–Jun
2008
Jul 2012–Jun
2013
Jul 2003–Jun
2004
Jul 2008–Jun
2009
Jul 2013–Jun
2014
Capi
tal r
aise
d (U
S$b)
Num
ber o
f dea
ls
200.8
301.2
351.4
401.6
251.0
150.6
100.4
50.2
00
The 2001-02 totals exclude Nestlé’s spin-out of Alcon, worth US$2.3 billion.
Source: EY, Capital IQ, BioCentury and Dow Jones VentureSource.
Capital raised Number of deals
After six lackluster years, 2013‑14 was a banner 12 months for
medtech IPOs, generating nearly US$1.5 billion.
48 EY | Pulse of the industry
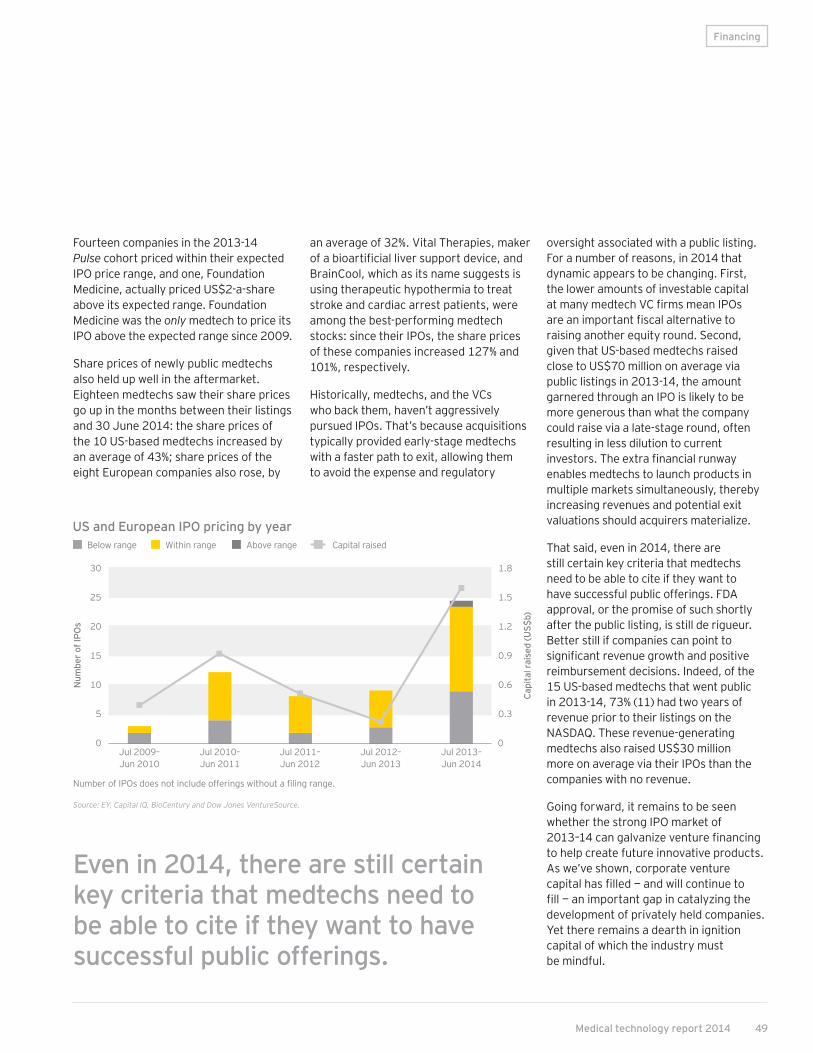
Financing
Fourteen companies in the 2013-14 Pulse cohort priced within their expected IPO price range, and one, Foundation Medicine, actually priced US$2-a-share above its expected range. Foundation Medicine was the only medtech to price its IPO above the expected range since 2009.
Share prices of newly public medtechs also held up well in the aftermarket. Eighteen medtechs saw their share prices go up in the months between their listings and 30 June 2014: the share prices of the 10 US-based medtechs increased by an average of 43%; share prices of the eight European companies also rose, by
an average of 32%. Vital Therapies, maker of a bioartificial liver support device, and BrainCool, which as its name suggests is using therapeutic hypothermia to treat stroke and cardiac arrest patients, were among the best-performing medtech stocks: since their IPOs, the share prices of these companies increased 127% and 101%, respectively.
Historically, medtechs, and the VCs who back them, haven’t aggressively pursued IPOs. That’s because acquisitions typically provided early-stage medtechs with a faster path to exit, allowing them to avoid the expense and regulatory
oversight associated with a public listing. For a number of reasons, in 2014 that dynamic appears to be changing. First, the lower amounts of investable capital at many medtech VC firms mean IPOs are an important fiscal alternative to raising another equity round. Second, given that US-based medtechs raised close to US$70 million on average via public listings in 2013-14, the amount garnered through an IPO is likely to be more generous than what the company could raise via a late-stage round, often resulting in less dilution to current investors. The extra financial runway enables medtechs to launch products in multiple markets simultaneously, thereby increasing revenues and potential exit valuations should acquirers materialize.
That said, even in 2014, there are still certain key criteria that medtechs need to be able to cite if they want to have successful public offerings. FDA approval, or the promise of such shortly after the public listing, is still de rigueur. Better still if companies can point to significant revenue growth and positive reimbursement decisions. Indeed, of the 15 US-based medtechs that went public in 2013-14, 73% (11) had two years of revenue prior to their listings on the NASDAQ. These revenue-generating medtechs also raised US$30 million more on average via their IPOs than the companies with no revenue.
Going forward, it remains to be seen whether the strong IPO market of 2013–14 can galvanize venture financing to help create future innovative products. As we’ve shown, corporate venture capital has filled — and will continue to fill — an important gap in catalyzing the development of privately held companies. Yet there remains a dearth in ignition capital of which the industry must be mindful.
Even in 2014, there are still certain key criteria that medtechs need to be able to cite if they want to have successful public offerings.
Jul 2009– Jun 2010
Jul 2010– Jun 2011
Jul 2011– Jun 2012
Jul 2012– Jun 2013
Jul 2013– Jun 2014
Num
ber o
f IPO
s
Capi
tal r
aise
d (U
S$b)
20
30
25
15
10
5
0
1.8
1.5
1.2
0.9
0.6
0.3
0
US and European IPO pricing by year
Number of IPOs does not include offerings without a filing range. Source: EY, Capital IQ, BioCentury and Dow Jones VentureSource.
Below range Within range Above range Capital raised
49Medical technology report 2014

United States Financing
In 2013‑14, US‑based companies raised US$22.2 billion, the third‑highest total since 2007‑08. With the exception of IPO financing, which increased 550% compared to 2012‑13, all other sources of financing declined, including a 24% drop in debt offerings. Even so, 2013‑14 marked the fifth‑straight 12‑month period in which large debt offerings by the industry’s commercial leaders made up the vast majority of total funding. Similar to 2012-13, debt offerings constituted nearly 75%, or US$16.2 billion, of the US industry total in 2013-14.
US medtech venture funding slid for the second consecutive 12-month period to US$3.4 billion, a 4% decline from 2012-13 and in line with the trend seen since July 2010. The companies commanding investment were primarily later-stage medtechs, such as Proteus Digital Health and Halt Medical, which respectively raised US$120 million and US$93 million. Indeed, in 2013-14, more than 60% of US medtech venture financing went to later-stage firms, including 13 of the 14 richest venture rounds. (The diagnostics roll-up play Maravai Life Sciences was the lone example of an “early-stage” deal.)
The companies commanding investment were primarily later-stage medtechs.
Jul 2007– Jun 2008
Jul 2008– Jun 2009
Jul 2009– Jun 2010
Jul 2010– Jun 2011
Jul 2011– Jun 2012
Jul 2012– Jun 2013
Jul 2013– Jun 2014
30
25
20
15
10
5
0
US$
b
US financings by year
Source: EY, BMO Capital Markets, Dow Jones VentureSource and Capital IQ.
Debt Follow-on and other IPO Venture
US venture capital by year
Tota
l am
ount
rais
ed (U
S$b)
Ave
rage
dea
l siz
e (U
S$m
)4
5
3
2
1
0
12
15
9
6
3
0
Source: EY, BMO Capital Markets, Dow Jones VentureSource and Capital IQ.
Total amount raised Average deal size
Jul 2008– Jun 2009
Jul 2009– Jun 2010
Jul 2010– Jun 2011
Jul 2011– Jun 2012
Jul 2012– Jun 2013
Jul 2013– Jun 2014
Jul 2007– Jun 2008
US Financing
50 EY | Pulse of the industry

US
As we noted, the one financing category that saw year-over-year growth in 2013-14 was the IPO sector, thanks to new listings by 15 US-based medtechs which raised US$1 billion. In terms of deal volume and dollars raised, the 2013-14 window was the strongest since 2006-07, when 15 companies also went public, raising approximately US$1 billion.
Company Location Product type (disease)Gross raised
(US$m) Quarter Round stage
Maravai Life Sciences Southern California Non-imaging diagnostics 300 Q1 2014 Early stage
Proteus Digital Health Northern California Non-imaging diagnostics 120 Q2 2014 Late stage
Halt Medical Southern California Therapeutic devices (women's health) 93 Q1 2014 Late stage
ConforMIS Massachusetts Therapeutic devices (orthopedic) 79 Q3 2013 Late stage
Apollo Endosurgery Texas Therapeutic devices (multiple) 61 Q4 2013 Late stage
DFine Northern California Therapeutic devices (orthopedic) 48 Q4 2013 Late stage
TRIA Beauty Northern California Therapeutic devices (aesthetics) 46 Q3 2013 Late stage
AqueSys Georgia Therapeutic devices (ophthalmic) 44 Q1 2014 Late stage
Holaira Minnesota Therapeutic devices (respiratory) 42 Q1 2014 Late stage
TriVascular2 Northern California Therapeutic devices (cardiovascular/vascular) 40 Q4 2013 Late stage
Invitae Northern California Non-imaging diagnostics 40 Q4 2013 Late stage
Inspire Medical Systems Minnesota Therapeutic devices (respiratory) 40 Q2 2014 Late stage
Benvenue Medical Northern California Therapeutic devices (orthopedic) 40 Q2 2014 Late stage
EarLens Northern California Therapeutic devices (ophthalmic) 40 Q1 2014 Late stage
Top US venture rounds, July 2013–June 2014
Source: EY, BMO Capital Markets, Dow Jones VentureSource and Capital IQ.
While seven of the 15 IPOs in the 2013-14 class priced within or above their range, no US-based medtech that went public after 1 March 2014 priced above its expected IPO range. Still, even if investors’ appetite for public offerings was lackluster in the latter half of 2014, once public, a majority of the 2013-14 medtech IPO class saw their share prices increase on the aftermarket. In all, 10 of the 15 US-based medtechs that debuted in 2013-14 outperformed their launch prices as of 30 June 2014.
For the third consecutive 12-month period, Massachusetts, with US$5.2 billion, led all US regions in total financing. Southern California (US$5.17 billion) and Minnesota (US$2.3 billion) claimed the second and third spots, respectively.
Jul 1999–Jun
2000
Jul 2004–Jun
2005
Jul 2009–Jun
2010
Jul 2000–Jun
2001
Jul 2005–Jun
2006
Jul 2010–Jun
2011
Jul 2001–Jun
2002
Jul 2006–Jun
2007
Jul 2011–Jun
2012
Jul 2002–Jun
2003
Jul 2007–Jun
2008
Jul 2012–Jun
2013
Jul 2003–Jun
2004
Jul 2008–Jun
2009
Jul 2013–Jun
2014
Capi
tal r
aise
d in
IPO
s (U
S$m
)
Num
ber o
f dea
ls800
15
181,200
12
1,000
9600
6400
3200
00
Source: EY, Capital IQ, BioCentury and Dow Jones VentureSource.
US IPOs by yearCapital raised Number of deals
Financing
51Medical technology report 2014

US Financing
Company Location Product type (disease)
Gross raised
(US$m)
IPO pricing range
Post-IPO performance
(as of 30 June 2014)
Tandem Diabetes Care Southern California Therapeutic devices (hematology/renal) 138 Within 8%
K2M Virginia Therapeutic devices (orthopedic) 132 Below –1%
Foundation Medicine Massachusetts Non-imaging diagnostics 122 Above 50%
TriVascular Technologies Northern California Therapeutic devices (cardiovascular/vascular) 90 Below 30%
LDR Holding Texas Therapeutic devices (orthopedic) 86 Within 67%
VeraCyte Northern California Non-imaging diagnostics 65 Within 32%
Vital Therapies Southern California Therapeutic devices (hematology/renal) 62 Below 127%
Inogen Southern California Therapeutic devices (respiratory) 56 Within 41%
TransEnterix North Carolina Therapeutic devices (non-disease-specific) 56 Within 26%
Agile Therapeutics New Jersey Therapeutic devices (women's health) 55 Below 45%
Corium International Northern California Therapeutic devices (multiple) 52 Below –3%
Quotient Biodiagnostics Connecticut Non-imaging diagnostics 40 Below 4%
Amedica Utah Therapeutic devices (orthopedic) 21 Below –22%
Biocept Southern California Non-imaging diagnostics 19 Within -40%
Semler Scientific Oregon Non-imaging diagnostics 10 Below –41%
US IPOs, July 2013–June 2014
The Massachusetts and Southern California totals were buoyed by debt offerings in excess of US$1 billion. Medtronic’s US$2 billion offering, meanwhile, made up the majority of Minnesota’s financing. When removing the impact of debt, Northern California took the honors as the region attracting the most non-debt capital (US$1.4 billion) and the most venture capital (US$1.1 billion).
As has been true in years past and is consistent with regional financing trends in the biotechnology sector, Northern California, Southern California and Massachusetts dominated the financing scene, accounting for 56% of the total non-debt financing and 64% of the total venture capital raised.
Source: EY, BMO Capital Markets, Dow Jones VentureSource and Capital IQ.
Size of bubbles shows relative number of financings per region.
Source: EY, BMO Capital Markets, Dow Jones VentureSource and Capital IQ.
200 400 600 800 1,000 1,200 1,400
2
1.6
1.2
0.8
00
0.4Tota
l equ
ity c
apita
l rai
sed
(US$
b)
Venture capital raised (US$m)
Capital raised by leading US regions excluding debt, July 2013–June 2014Northern California
New Jersey
Southern California
New York
Massachusetts
Pennsylvania
Minnesota
Texas
52 EY | Pulse of the industry

Total funding of European medtech companies soared 81% to US$5.1 billion in the 12-month period ending 30 June 2014. Although the amount represented just a quarter of what US-based medtechs raised during the same period, it was the largest sum procured by the industry since 2003-04 and was fueled by year-over-year growth across all four funding categories. Debt financing spiked 81% from 2012‑13 to US$3.2 billion and made up 63% of Europe’s total annual financing. Meanwhile, venture funding jumped 60% to just over US$1.0 billion, and follow‑on offerings increased 21% to US$414 million, a five‑year high. As in the US, IPOs made big headlines in Europe. As of 30 June 2014, funds raised through IPOs made up 9% of the 2013‑14 financing dollars, jumping 789% year‑over‑year to US$444 million.
US$
b
6
5
4
3
2
1
0Jul 2007– Jun 2008
Jul 2008–Jun 2009
Jul 2009–Jun 2010
Jul 2011– Jun 2012
Jul 2012– Jun 2013
Jul 2013– Jun 2014
Jul 2010–Jun 2011
In contrast to the US venture market, which has typically seen much more dramatic funding highs and lows, there hasn’t been a tail-off in Europe’s venture financing. Indeed, in 2013-14, European VCs committed US$1.0 billion to privately held medtechs. That’s 28% more than the annual average they spent during the prior six years. In another bit of welcome news, deal sizes also increased, with the average financing round growing from US$3.9 million in 2012-13 to US$5.2 million in 2013-14. That’s slightly above the average deal size of US$4.5 million that European medtechs commanded from July 2008 to June 2014.
Overall, early rounds accounted for approximately 45% of all European venture rounds and 33% of the venture dollars. In terms of deal volume, that compares well to 2007-08, when 48% of the venture rounds involved early-stage commitments. In terms of total venture dollars, in 2013-14, early-stage investments make up a smaller percentage of the medtech financing pie than they did in 2007-08, when 47% of VC investment went to early-stage rounds.
Tota
l am
ount
rais
ed (U
S$m
)
Ave
rage
dea
l siz
e (U
S$m
)
800
1,000
1,200
600
400
200
0
4
6
5
3
2
1
0Jul 2007– Jun 2008
Jul 2008–Jun 2009
Jul 2009–Jun 2010
Jul 2010–Jun 2011
Jul 2011– Jun 2012
Jul 2012– Jun 2013
Jul 2013– Jun 2014
European financings by year
Source: EY, BMO Capital Markets, Dow Jones VentureSource and Capital IQ.
Source: EY, BMO Capital Markets, Dow Jones VentureSource and Capital IQ.
Debt Follow-on and other IPO Venture
European venture capital achieved levels not seen since the financial crisisTotal amount raised Average deal size
Financing EU
Europe Financing
53Medical technology report 2014
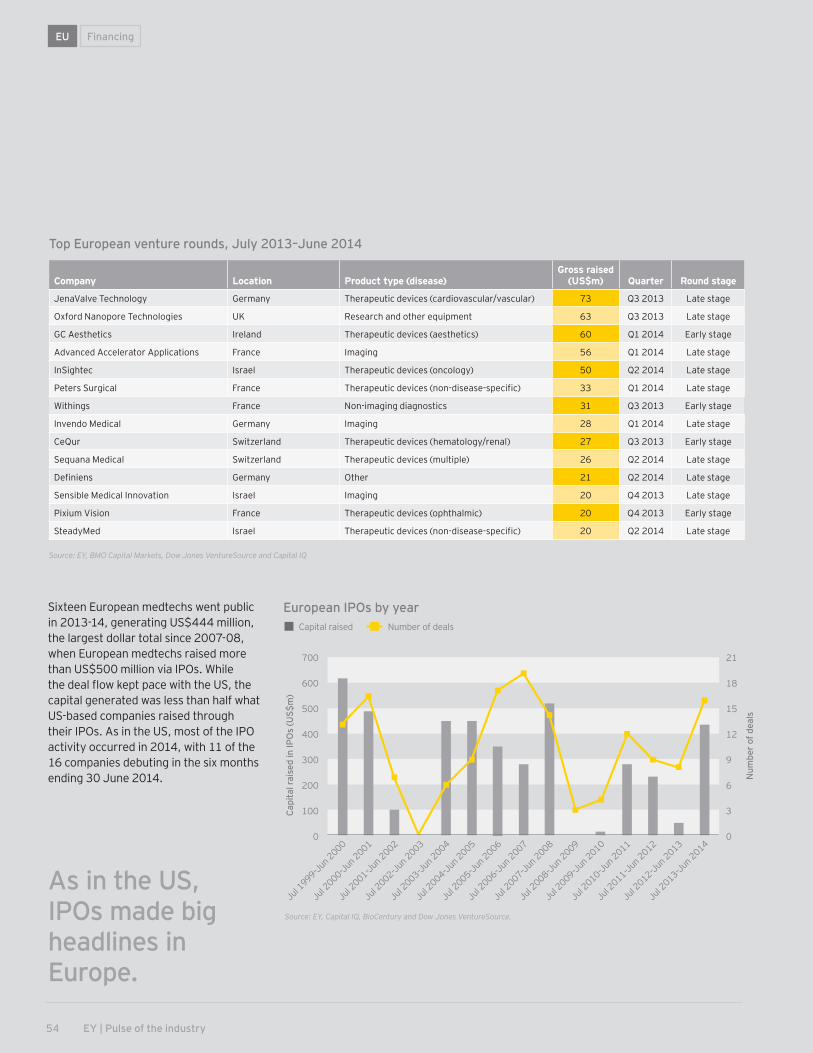
EU
Sixteen European medtechs went public in 2013-14, generating US$444 million, the largest dollar total since 2007-08, when European medtechs raised more than US$500 million via IPOs. While the deal flow kept pace with the US, the capital generated was less than half what US-based companies raised through their IPOs. As in the US, most of the IPO activity occurred in 2014, with 11 of the 16 companies debuting in the six months ending 30 June 2014.
Company Location Product type (disease)Gross raised
(US$m) Quarter Round stage
JenaValve Technology Germany Therapeutic devices (cardiovascular/vascular) 73 Q3 2013 Late stage
Oxford Nanopore Technologies UK Research and other equipment 63 Q3 2013 Late stage
GC Aesthetics Ireland Therapeutic devices (aesthetics) 60 Q1 2014 Early stage
Advanced Accelerator Applications France Imaging 56 Q1 2014 Late stage
InSightec Israel Therapeutic devices (oncology) 50 Q2 2014 Late stage
Peters Surgical France Therapeutic devices (non-disease-specific) 33 Q1 2014 Late stage
Withings France Non-imaging diagnostics 31 Q3 2013 Early stage
Invendo Medical Germany Imaging 28 Q1 2014 Late stage
CeQur Switzerland Therapeutic devices (hematology/renal) 27 Q3 2013 Early stage
Sequana Medical Switzerland Therapeutic devices (multiple) 26 Q2 2014 Late stage
Definiens Germany Other 21 Q2 2014 Late stage
Sensible Medical Innovation Israel Imaging 20 Q4 2013 Late stage
Pixium Vision France Therapeutic devices (ophthalmic) 20 Q4 2013 Early stage
SteadyMed Israel Therapeutic devices (non-disease-specific) 20 Q2 2014 Late stage
Top European venture rounds, July 2013–June 2014
Jul 1999–Jun
2000
Jul 2004–Jun
2005
Jul 2009–Jun
2010
Jul 2000–Jun
2001
Jul 2005–Jun
2006
Jul 2010–Jun
2011
Jul 2001–Jun
2002
Jul 2006–Jun
2007
Jul 2011–Jun
2012
Jul 2002–Jun
2003
Jul 2007–Jun
2008
Jul 2012–Jun
2013
Jul 2003–Jun
2004
Jul 2008–Jun
2009
Jul 2013–Jun
2014
Capi
tal r
aise
d in
IPO
s (U
S$m
)
Num
ber o
f dea
ls
15500
21700
18600
12400
9
6
300
3
200
100
00
Source: EY, BMO Capital Markets, Dow Jones VentureSource and Capital IQ
Source: EY, Capital IQ, BioCentury and Dow Jones VentureSource.
European IPOs by yearCapital raised Number of deals
As in the US, IPOs made big headlines in Europe.
Financing
54 EY | Pulse of the industry
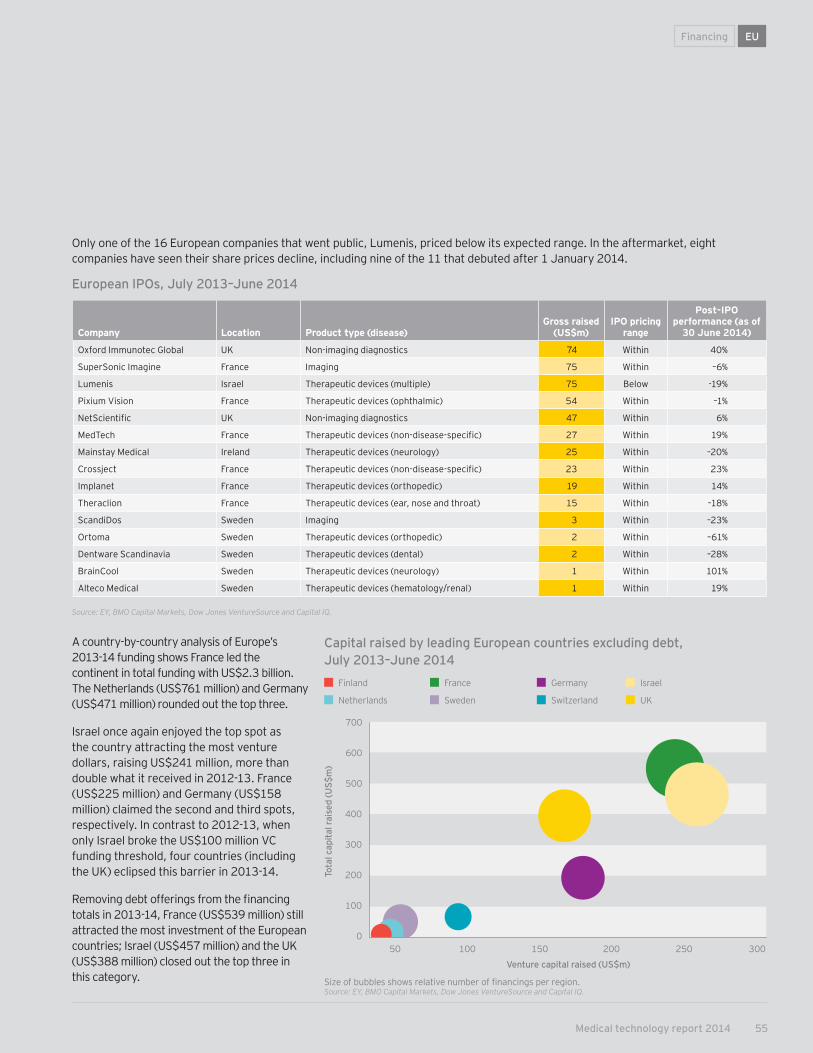
Financing EU
Only one of the 16 European companies that went public, Lumenis, priced below its expected range. In the aftermarket, eight companies have seen their share prices decline, including nine of the 11 that debuted after 1 January 2014.
A country-by-country analysis of Europe’s 2013-14 funding shows France led the continent in total funding with US$2.3 billion. The Netherlands (US$761 million) and Germany (US$471 million) rounded out the top three.
Israel once again enjoyed the top spot as the country attracting the most venture dollars, raising US$241 million, more than double what it received in 2012-13. France (US$225 million) and Germany (US$158 million) claimed the second and third spots, respectively. In contrast to 2012-13, when only Israel broke the US$100 million VC funding threshold, four countries (including the UK) eclipsed this barrier in 2013-14.
Removing debt offerings from the financing totals in 2013-14, France (US$539 million) still attracted the most investment of the European countries; Israel (US$457 million) and the UK (US$388 million) closed out the top three in this category.
Capital raised by leading European countries excluding debt, July 2013–June 2014
50 100 150 200 250 300
700
600
500
400
300
200
0
100
Tota
l cap
ital r
aise
d (U
S$m
)
Venture capital raised (US$m)
Source: EY, BMO Capital Markets, Dow Jones VentureSource and Capital IQ.
Company Location Product type (disease)Gross raised
(US$m)IPO pricing
range
Post-IPO performance (as of
30 June 2014)
Oxford Immunotec Global UK Non-imaging diagnostics 74 Within 40%
SuperSonic Imagine France Imaging 75 Within –6%
Lumenis Israel Therapeutic devices (multiple) 75 Below -19%
Pixium Vision France Therapeutic devices (ophthalmic) 54 Within –1%
NetScientific UK Non-imaging diagnostics 47 Within 6%
MedTech France Therapeutic devices (non-disease-specific) 27 Within 19%
Mainstay Medical Ireland Therapeutic devices (neurology) 25 Within –20%
Crossject France Therapeutic devices (non-disease-specific) 23 Within 23%
Implanet France Therapeutic devices (orthopedic) 19 Within 14%
Theraclion France Therapeutic devices (ear, nose and throat) 15 Within –18%
ScandiDos Sweden Imaging 3 Within –23%
Ortoma Sweden Therapeutic devices (orthopedic) 2 Within –61%
Dentware Scandinavia Sweden Therapeutic devices (dental) 2 Within –28%
BrainCool Sweden Therapeutic devices (neurology) 1 Within 101%
Alteco Medical Sweden Therapeutic devices (hematology/renal) 1 Within 19%
European IPOs, July 2013–June 2014
Size of bubbles shows relative number of financings per region.Source: EY, BMO Capital Markets, Dow Jones VentureSource and Capital IQ.
Finland
Netherlands
France
Sweden
Germany
Switzerland
Israel
UK
55Medical technology report 2014

3 | Mergers and acquisitionsIndustry performance
56 EY | Pulse of the industry
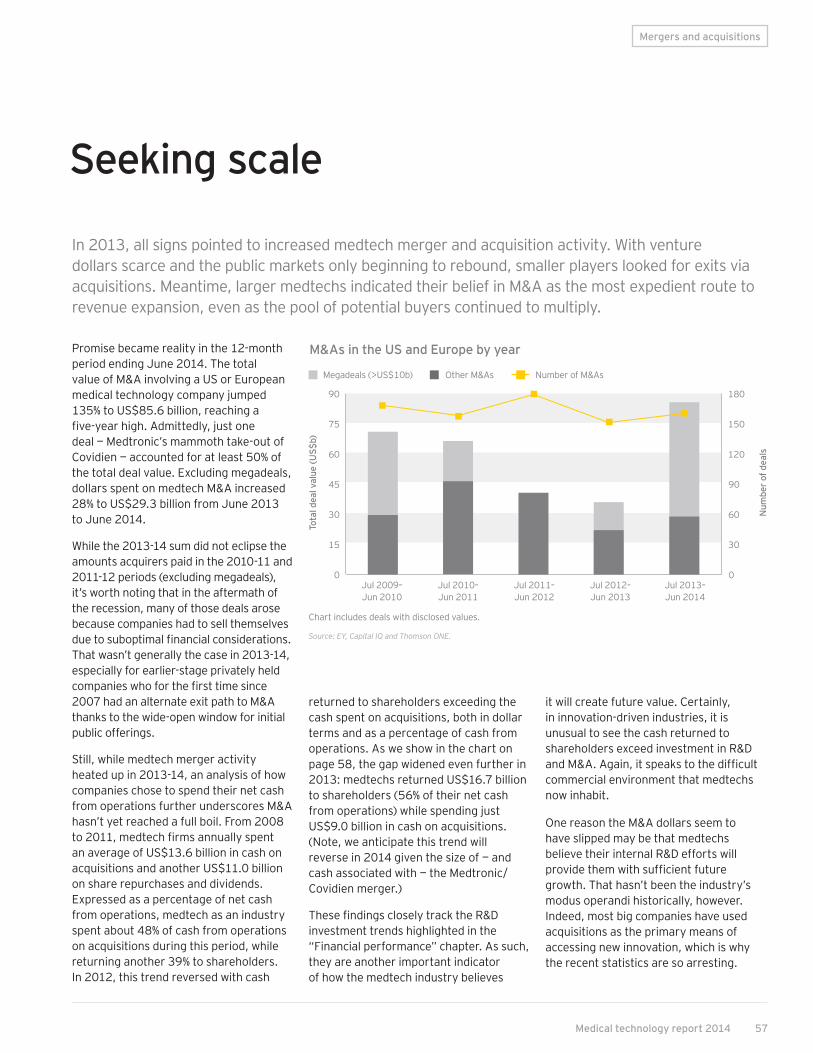
Promise became reality in the 12-month period ending June 2014. The total value of M&A involving a US or European medical technology company jumped 135% to US$85.6 billion, reaching a five-year high. Admittedly, just one deal — Medtronic’s mammoth take-out of Covidien — accounted for at least 50% of the total deal value. Excluding megadeals, dollars spent on medtech M&A increased 28% to US$29.3 billion from June 2013 to June 2014.
While the 2013-14 sum did not eclipse the amounts acquirers paid in the 2010-11 and 2011-12 periods (excluding megadeals), it’s worth noting that in the aftermath of the recession, many of those deals arose because companies had to sell themselves due to suboptimal financial considerations. That wasn’t generally the case in 2013-14, especially for earlier-stage privately held companies who for the first time since 2007 had an alternate exit path to M&A thanks to the wide-open window for initial public offerings.
Still, while medtech merger activity heated up in 2013-14, an analysis of how companies chose to spend their net cash from operations further underscores M&A hasn’t yet reached a full boil. From 2008 to 2011, medtech firms annually spent an average of US$13.6 billion in cash on acquisitions and another US$11.0 billion on share repurchases and dividends. Expressed as a percentage of net cash from operations, medtech as an industry spent about 48% of cash from operations on acquisitions during this period, while returning another 39% to shareholders. In 2012, this trend reversed with cash
Seeking scale
returned to shareholders exceeding the cash spent on acquisitions, both in dollar terms and as a percentage of cash from operations. As we show in the chart on page 58, the gap widened even further in 2013: medtechs returned US$16.7 billion to shareholders (56% of their net cash from operations) while spending just US$9.0 billion in cash on acquisitions. (Note, we anticipate this trend will reverse in 2014 given the size of — and cash associated with — the Medtronic/Covidien merger.)
These findings closely track the R&D investment trends highlighted in the “Financial performance” chapter. As such, they are another important indicator of how the medtech industry believes
In 2013, all signs pointed to increased medtech merger and acquisition activity. With venture dollars scarce and the public markets only beginning to rebound, smaller players looked for exits via acquisitions. Meantime, larger medtechs indicated their belief in M&A as the most expedient route to revenue expansion, even as the pool of potential buyers continued to multiply.
Mergers and acquisitions
it will create future value. Certainly, in innovation-driven industries, it is unusual to see the cash returned to shareholders exceed investment in R&D and M&A. Again, it speaks to the difficult commercial environment that medtechs now inhabit.
One reason the M&A dollars seem to have slipped may be that medtechs believe their internal R&D efforts will provide them with sufficient future growth. That hasn’t been the industry’s modus operandi historically, however. Indeed, most big companies have used acquisitions as the primary means of accessing new innovation, which is why the recent statistics are so arresting.
M&As in the US and Europe by year
Chart includes deals with disclosed values.
Source: EY, Capital IQ and Thomson ONE.
Megadeals (>US$10b)
Tota
l dea
l val
ue (U
S$b)
Num
ber o
f dea
ls
Other M&As Number of M&As
90
75
180
30 60
15
0
30
0Jul 2009– Jun 2010
Jul 2010– Jun 2011
Jul 2011– Jun 2012
Jul 2012– Jun 2013
Jul 2013– Jun 2014
45 90
60 120
150
3 | Mergers and acquisitions
57Medical technology report 2014

The return of the public markets in 2013 could be another reason medtech M&A from July 2013 to June 2014 wasn’t even stronger. During this period, the share prices of medtechs, like other health care companies, outpaced the broader indices in both the US and Europe. Strengthening share prices, particularly for companies in the research and other equipment and non-imaging diagnostics categories, would have made it significantly more expensive to acquire companies that a year prior might have been undervalued.
Moreover, the thawing of the market for IPOs could also have contributed. In the 12-month period ending 30 June 2014, 31 companies floated on US and European exchanges, raising nearly US$1.5 billion. (See “Financing the future” on page 42.)
How medtechs are spending their cash, 2008–13
Data shown for US and European public pure-play companies for which data were publicly disclosed. Cash returned to shareholders includes total dividends paid and stock repurchased.
Source: EY, Capital IQ and Thomson ONE.
Cash acquisitions
Ann
ual s
pend
(US$
b)
Cash returned to shareholders R&D expenses
20,000
16,000
12,000
8,000
4,000
02008 2009 2013201220112010
An analysis of how companies chose to spend their net cash from operations further underscores M&A hasn’t yet reached a full boil.
58 EY | Pulse of the industry

Mergers and acquisitions
Selected M&As, July 2013–June 2014
Source: EY, Capital IQ and Thomson ONE.
Acquiring company Location Acquired company Location Value (US$m)
Medtronic US – Minnesota Covidien Ireland $42,900
Zimmer Holdings US – Indiana Biomet US – Indiana $13,350
Carlyle Group US – District of Columbia Johnson & Johnson (Ortho-Clinical Diagnostics) US – New Jersey $4,150
Essilor International France Transitions Optical US – Pennsylvania $1,855
Smith & Nephew UK ArthroCare US – Texas $1,700
Grifols Spain Novartis (transfusion diagnostics unit) Switzerland $1,675
Stryker US – Michigan MAKO Surgical US – Florida $1,650
Cooper Companies US – California Sauflon Pharmaceuticals UK $1,200
Covidien Ireland Given Imaging Israel $860
Ansell Australia BarrierSafe Solutions International US – Illinois $615
Merz Aesthetics US – California Ulthera US – Arizona $600
Fresenius Medical Care Germany Sound Inpatient Physicians US – Washington $600
Domtar Canada Laboratorios Indas Spain $565
CareFusion US – California GE Healthcare (Vital Signs) US – Connecticut $500
Kinetic Concepts US – Texas Systagenix Wound Management UK $485
As we catalog in this year’s Point of view, medtech companies are responding to the difficult commercial environment in a variety of ways. One mechanism that was widely employed in 2013 and 2014: deals greater than US$1 billion to add capabilities en masse. Consider there were two deals worth more than US$10 billion each and another six transactions that exceeded the US$1 billion threshold in the year ending 30 June 2014. In contrast, only four deals topped the US$1billion mark in the prior 12-month period.
Given health care reform and the consolidation in the provider marketplace, certain larger medtechs are making the argument that they must have scale, both
geographically and therapeutically, in their product offerings. This potentially biases medtechs to certain kinds of acquisitions: more expensive mergers that align two complementary portfolios on the one hand, and smaller tuck-in acquisitions that create one-stop solutions providers in a particular disease segment on the other hand. In both cases, the goal is to create sufficient critical mass to fundamentally change the conversations medtechs have with health care purchasers.
In terms of its size and scope, the Medtronic/Covidien tie-up was the most notable deal in the 2013-14 time frame. Equally important, the transaction is
emblematic of one path medtechs aim to use to set the stage for future growth. With annual revenues rivaling Johnson & Johnson’s medtech division, a combined Medtronic/Covidien will be one of the leading distributors in multiple hospital purchasing categories. Its executives believe this will give the merged entity the scale required to improve its contract negotiations with health care buyers at a time when those purchasers are looking to streamline their vendor relationships. (See “Medtronic/Covidien: emblematic of what medtech is buying now” on page 68.)
In medtech M&A, scale matters
59Medical technology report 2014

Other notable medtech mergers signed in the 12-month period ending in June 2014 include Zimmer Holdings’ US$13.4 billion acquisition of Biomet and Carlyle Group’s US$4.2 billion purchase of Johnson & Johnson’s Ortho-Clinical Diagnostics division. Whereas the Medtronic/Covidien merger signified the importance of breadth in today’s health care environment, these two deals underscore the importance, respectively, of depth and focus.
Zimmer’s take-out of Biomet is the second orthopedic-focused megadeal since 2011 when Johnson & Johnson scooped up Synthes in a transaction valued at nearly US$20 billion. With worldwide revenues of US$8 billion, the combined Zimmer/Biomet entity will boast a sizeable portfolio in both joint and non-reconstructive orthopedic
products. Company executives believe this kind of therapeutic depth may provide the same advantages as the scale seen in the Medtronic/Covidien union. The hope is that health care buyers will look to Zimmer as a one-stop shop that can offer them a full spectrum of orthopedic solutions.
As such, a newly bulked up Zimmer could trigger even more deal-making in orthopedics, which has long been a hotbed of merger activity. Since 2012, there have been at least 24 orthopedic deals worth more than US$18 billion. In addition to the Zimmer/Biomet deal, two other orthopedic mergers eclipsed the US$1 billion mark during the 12-month period ending June 2014: Stryker’s acquisition of MAKO Surgical and Smith & Nephew’s purchase of ArthroCare.
If Zimmer’s acquisition of Biomet was about creating an orthopedic powerhouse, Johnson & Johnson’s tie-up with Carlyle Group was about extracting additional shareholder value from a business unit that didn’t afford the same revenue growth opportunities as the medical device giant’s other divisions. It took roughly a year for Johnson & Johnson to find the right buyer for Ortho-Clinical Diagnostics, which ranks as the fifth-largest in vitro diagnostics manufacturer but has struggled to position itself as a market leader. For Carlyle Group, the acquisition is just the latest in a string of health care investments, which include its purchases of the clinical drug testing company Pharmaceutical Product Development and the health care services play ManorCare.
The emphasis on focus is hardly surprising given that the current business climate rewards firms that are clearly and consistently able to distinguish their products from the competition. The reality is medtechs have less upside to gain from business units that don’t closely align across revenue, profitability or therapeutic area priorities. As a result, there is an increasing push to take advantage of the pool of well-funded acquirers and unlock value via portfolio rationalization.
Based on the 2013-14 data, medtech firms are taking advantage of this opportunity: in addition to the Johnson & Johnson/Carlyle Group deal, other examples of portfolio rationalization include Bayer International’s deal with Boston Scientific for the conglomerate’s Interventional unit, GE Healthcare’s agreement to sell its consumable medical products group Vital Signs to CareFusion and Endo Pharmaceuticals’ sale of its HealthTronics division to Altaris Capital Partners.
Mergers and acquisitions
Depth and focus matter, too
Portfolio rationalization
Select listing of divestitures that occurred between July 2011 and June 2014.
Source: EY, Capital IQ and Thomson ONE.
Acquired business unit Acquiring company Month Value (US$m)
Johnson & Johnson (Ortho-Clinical Diagnostics)
Carlyle Group January 2014 $4,150
Novartis (transfusion diagnostics unit) Grifols November 2013 $1,675
Becton Dickinson (Discovery Labware) Corning Life Sciences April 2012 $720
GE Healthcare (Vital Signs) CareFusion November 2013 $500
Medtronic (Physio-Control) Bain Capital November 2011 $487
Bayer (Interventional unit) Boston Scientific May 2014 $415
Wright Medical Group (OrthoRecon) MicroPort Scientific June 2013 $290
Johnson & Johnson (DePuy trauma unit) Biomet April 2012 $280
C.R. Bard (Bard Electrophysiology) Boston Scientific June 2013 $275
Kinetic Concepts (Therapeutic Support Systems)
Getinge August 2012 $275
GE Healthcare (Thomas Medical Products)
Merit Medical Systems November 2012 $167
Johnson & Johnson (Codman & Schurtleff surgical instruments business)
Symmetry Medical December 2011 $165
60 EY | Pulse of the industry

In addition to the Carlyle Group, the private equity firm Blackstone Group and the conglomerate Danaher were also reportedly interested in Johnson & Johnson’s diagnostic unit, a reminder that there is competition for well-structured medtechs. The industry’s diverse nature and its potential for growth due to demographic shifts (e.g., an aging population in mature markets and a stronger middle class in emerging markets) mean medtech remains an area of interest for a variety of buyers, from traditional device firms to conglomerates to private equity and, increasingly, pharmaceutical companies.
Since 2008, traditional medtechs have been the primary acquirers of other players in the space. From 2008 to 2010, medtech acquirers played a role in 46% of the M&A transactions (excluding megadeals), as measured by share of total dollars spent. That percentage jumped to 58% for the two-year period ending 30 June 2014, partly as increased pressures forced pure-play medtechs to use M&A as one means of bolstering the bottom line. (Including megadeals, traditional medtech acquirers accounted for 25% of the total acquisition dollars in the 2008-10 period and 82% between July 2012 and June 2014.)
From 2008–14, private equity buyers were consistently in the mix, spending 12% to 14% of the total medtech M&A dollars on acquisitions. Conglomerates, meantime, have retreated from the deal-making table — at least relative to their activity in the 2008-10 time period, when 35% of merger dollars came from this buyer category. Still, recent deals like Danaher’s two dental-focused acquisitions (Dux Dental and Vettec) and Bayer HealthCare’s bid for Conceptus show conglomerates remain interested in medtech acquisitions.
Although the dollar values are small, the buyer category that has grown the fastest from 2008 to 2014 is the pharma category. The dollars spent by pharmas on medtech acquisitions from July 2012 to June 2014 have increased more than 900% compared to the same two-year period beginning in 2008. Just as medtech has come under pressure to identify new mechanisms of growth, so has pharma. Certain pharma companies are responding by expanding into therapeutic devices or diagnostics, arguing the rise of comparative effectiveness research
and bundled payments require them to look beyond the pill for innovation. Neurostimulation, especially to treat conditions such as epilepsy, migraine pain and depression, which are frequently resistant to medication, is one area commanding the attention of pharmaceutical companies. So are diagnostic capabilities. Of the 10 pharma-medtech transactions announced during the 12 months ending 30 June 2014, four involved non-imaging diagnostics players.
Mergers and acquisitions
A stable pool of medtech acquirers
Chart excludes megadeals (>US$10b).
Source: EY, Capital IQ and Thomson ONE.
Shar
e of
tota
l dea
l val
ue
100%
80%
60%
40%
20%
0%Jul 2008–Jun 2010 Jul 2010–Jun 2012 Jul 2012–Jun 2014
US and European M&As by type of buyer (excluding megadeals)
Other Private equity Pharma Conglomerate Medtech
The industry’s diverse nature and its potential for growth due to demographic shifts mean medtech remains an area of interest for a variety of buyers.
61Medical technology report 2014

Pharmas are not the only ones pushing for this convergence of business models. Certain medtech players are also looking to adjacent sectors for opportunities. In June 2014, Fresenius Medical Care announced its US$600 million buyout of Sound Inpatient Physicians, a provider group representing 1,000 physicians practicing at more than 100 hospitals and acute care centers in the US. The dialysis player also announced its acquisition of MedSpring Urgent Care, which operates 14 urgent care centers in Illinois and Texas. These deals show how Fresenius Medical Care aims to extend its service model beyond its core businesses of dialysis clinics, vascular care centers and renal pharmaceutical products to gain additional expertise in arenas such as care coordination and patient-centered care, which have become important in the post-health care reform environment. (See “To improve medtech R&D, take a system-wide approach” on page 11.) Analysts had been expecting Fresenius to make a move like this since mid-2012, when DaVita, a competing dialysis services provider, acquired the physician group HealthCare Partners for US$4.4 billion.
Medtronic’s US$200 million acquisition of the disease management firm Cardiocom in August 2013 is another example of how medtech business models are shifting. The all-cash deal helped position Medtronic as a player in monitoring and caring for chronically ill patients who may not need the device company’s costly implants.
To assess which medtech categories were associated with the greatest number of deals, we also analyzed deal flow by disease area and market segment. Unlike our deal value analysis, where only deals with disclosed values were included in the data set, this data set includes all publicly announced mergers, whether or not a dollar value for the acquisition was disclosed.
With 105 acquisitions from 1 July 2013 to 30 June 2014, the therapeutic device sector once again took top honors as the medtech category with the most deals. Deal volume in therapeutic devices has remained constant: since July 2009, roughly 50% of all the mergers have been in this space. Thanks to Medtronic’s
purchase of Covidien and Zimmer’s take-out of Biomet, therapeutic devices’ share of the total M&A dollars increased to 92% in the 12-month period ending 30 June 2014. That’s an increase of 29 percentage points from the 2009-13 time period. The totals for these megadeals also meant no other medtech category garnered more than 3% of the total M&A dollars during the 12 months ending 30 June 2014.
Within the therapeutic device category, orthopedic deals dominated in terms of total deal value as a result of the aforementioned Zimmer/Biomet megadeal. Cardiovascular mergers were also numerous. With 21 acquisitions from 1 July 2013 to 30 June 2014,
Mergers and acquisitions
Top deal-making by disease area and market segment
Selected M&As by segment
Source: EY, Capital IQ and Thomson ONE.
Jul 2009–Jun 2013 Jul 2013–Jun 2014
Segment Number of deals
Value (US$m)
% of total deal value
Number of deals
Value (US$m)
% of total deal value
Therapeutic devices 457 $120,149 63% 105 $67,315 92%
• Ophthalmic 29 $42,902 22% 5 $1,674 2%
• Orthopedic 81 $22,842 12% 21 $15,719 21%
• Cardiovascular 70 $16,748 9% 21 $2,433 3%
• Respiratory 17 $1,147 1% 3 $10 0%
• Non-disease specific 77 $4,922 3% 16 $826 1%
• Multiple 27 $2,476 1% 11 $44,686 61%
• Hematology/renal 19 $6,939 4% 3 $286 0%
• Wound care 31 $10,520 6% 5 $664 1%
• Oncology 11 $1,229 1% 1 $15 0%
• All others 95 $10,424 5% 19 $1,002 1%
Research and other equipment
91 $37,338 20% 26 $1,225 2%
Non-imaging diagnostics 168 $23,060 12% 39 $1,557 2%
Imaging 79 $4,474 2% 14 $936 1%
Other 96 $6,044 3% 28 $2,296 3%
Deal volume in therapeutic devices has remained constant.
62 EY | Pulse of the industry

cardiovascular tied orthopedic as the most active therapeutic device sector in terms of deal number. Certain acquirers, particularly France’s Essilor International, set their sights on ophthalmology firms as well. There were five ophthalmology device mergers in the 12 months ending 30 June 2014, including two deals valued at greater than US$1 billion: Essilor’s US$1.9 billion acquisition of Transitions Optical, a division of PPG Industries, and Cooper Companies’ purchase of Sauflon Pharmaceuticals for US$1.2 billion.
Outside therapeutic devices, there were 26 mergers in the research and other equipment sector worth US$1.2 billion, and 39 deals valued at US$1.6 billion in the non-imaging diagnostics category. As we wrote in Beyond borders: unlocking
value, life sciences tools companies have focused recently on acquiring additional capabilities in order to offer their customers more comprehensive biopharmaceutical research platforms. Meantime, the twin forces of precision medicine and home-based health care have made diagnostics companies strategically more important to a range of potential acquirers.
Two 2014 mergers — Roche Holding/IQuum and St. Jude Medical/CardioMEMS — illustrate the potential breadth of technologies that buyers find interesting. Roche’s US$450 million purchase of IQuum shows how leading in vitro diagnostic players are trying to bolster their capabilities in the molecular point-of-care testing space, where rapid
testing, especially for infectious diseases, can improve health outcomes. In June 2014, St. Jude Medical exercised its option to acquire the 81% of CardioMEMS it didn’t already own. The deal, worth US$375 million, gives St. Jude Medical full ownership of CardioMEMS’ recently approved wireless implant device for monitoring and preventing heart failure.
Increasingly, health care providers are trying to shift care for chronically ill patients from the hospital or clinic to the home. Monitoring devices like the one from CardioMEMS enable early treatment of congestive heart failure and could prevent costly hospital admissions or readmissions.
63Medical technology report 2014

In 2013–14, acquirers were not just consistent in the kinds of companies they purchased. They also adhered to a given pattern when designing their deals. Since the global financial crisis, buyers have tried when possible to curb their M&A risk by structuring their acquisitions via milestones. In essence, these milestones allow acquirers to delay paying full value for a product or technology until it has proven itself, for instance by reaching an agreed-upon sales threshold. In 2009–10, the percentage of medtech acquisitions involving milestone payments was just 19%; for every 12-month period thereafter, the same metric has hovered at around 29%.
If acquirers are interested in hedging some of their M&A risk, analysis of the 2013–14 data suggests they were spending more up front to buy desirable assets than in prior 12-month periods. Thus, even though the percentage of medtech acquisitions involving milestones held steady during 2013–14, the dollar value associated with those milestones fell from US$3.7 billion in June 2013 to US$1.2 billion in June 2014. Moreover, milestones’ share of total deal value has also continued to fall. For the past two years it has hovered around 33%, off from the peak observed in June 2012, when milestones accounted for 45% of the total deal value.
The decreasing value in milestone payments could be due to a variety of factors. Given rising medtech market capitalizations and a strong field of acquirers, would-be buyers have less negotiating power and may have to pay closer to full value up front to bring desired assets in-house. In addition, acquirers during the 2013–14 period have looked to create economics of scale via bigger deals. Milestones typically
play a smaller role in such acquisitions, because the companies being acquired are of sufficient size and maturity that commercial risks are more easily
Mergers and acquisitions
While the number of deals using milestone payments holds steady ...
... the value of milestone payments continues to fall.
Number of M&As with milestones
Total value of milestones
Num
ber o
f M&A
s
Perc
enta
ge o
f M&A
s w
ith m
ilest
one
paym
ents
Number of M&As with milestones/total number of M&As
Total value of milestones/total value of all M&As with milestones
40%
10
30%
20%
0 0%
10%
20
30
40
Shar
e of
tota
l val
ue
Source: EY, Capital IQ and Thomson ONE.
Tota
l dea
l val
ue (U
S$b)
40%
0.5
1.0
30%
20%
10%
0 0
1.5
50%
2.0
2.5
Structuring the deal calculated. As a result, the de-risking that might be done via milestones is already factored in to the actual purchase price of a company or division.
Jul 2009– Jun 2010
Jul 2010– Jun 2011
Jul 2011– Jun 2012
Jul 2012– Jun 2013
Jul 2013– Jun 2014
Jul 2013– Jun 2014
Jul 2012– Jun 2013
Jul 2011– Jun 2012
Jul 2010– Jun 2011
Jul 2009– Jun 2010
64 EY | Pulse of the industry

Mergers and acquisitions
United StatesThe total value for deals involving the acquisition of a US-based medtech climbed 32% (US$30.6 billion) during the 12-month period ending 30 June 2014. In dollar terms, this was the second-largest total amassed in the past five years, ranking behind only the 2010-11 period, when the J&J/Synthes merger drove the deal total up to US$47.4 billion.
Excluding the Zimmer Holdings/Biomet megadeal, US medtech mergers in 2013-14 generated US$17.3 billion in potential dollars. That’s 79% higher than the year before, when US medtechs pulled in US$9.7 billion thanks to mergers. Still, it’s also US$10 billion less than the annual average spent from 1 July 2009 to 30 June 2012.
In terms of deal volume, the number of mergers involving a US medtech increased from 63 to 72 in 2013-14. That’s largely in line with the previous four-year average of 74 mergers. With seven deals during the 12 months ending 30 June 2014, Stryker was the US’ most active buyer. For the five mergers for which deal terms were disclosed, the orthopedic firm spent US$2.3 billion.
Europe The total value of acquisitions of Europe-based companies soared 584% to US$50.1 billion in 2013-14, thanks to Medtronic’s purchase of Covidien. It was the second-largest total since 2009-10 when Novartis acquired the ophthalmology-focused Alcon division of Swiss firm Nestlé in a transaction worth US$45.9 billion. Normalizing the data for megadeals, the merger total in 2013-14 reached US$7.2 billion. That’s 2% lower than the year before, but in line with the
The geography of medtech M&A
US M&As by year
European M&As by year
Chart includes deals with disclosed values and in which the acquired entity is a US medtech company.
Source: EY, Capital IQ and Thomson ONE.
Total deal value of megadeals (>US$10b)
Total deal value of megadeals (>US$10b)To
tal d
eal v
alue
(US$
b)
Num
ber o
f dea
ls
Total deal value of “other” M&A
Total deal value of “other” M&A
Number of M&As
Number of M&As
20 40
10 20
0 0
30 60
40 80
50 100
Jul 2009– Jun 2010
Jul 2011– Jun 2012
Jul 2012– Jun 2013
Jul 2013– Jun 2014
Jul 2010– Jun 2011
Chart includes deals with disclosed values and in which the acquired company is a European medtech company.
Source: EY, Capital IQ and Thomson ONE.
Tota
l dea
l val
ue (U
S$b)
Num
ber o
f dea
ls40
10
20
10
0 0
20
60
40
60
Jul 2009– Jun 2010
Jul 2010– Jun 2011
Jul 2011– Jun 2012
Jul 2012– Jun 2013
Jul 2013– Jun 2014
65Medical technology report 2014

Mergers and acquisitions
previous four-year average of US$8.1 billion. The number of M&A transactions with announced deal terms declined 8% year-over-year in 2013-14, but remained higher than the previous four-year average of 39.
Outside Covidien’s purchase by Medtronic, notable acquisitions of Europe-based medtechs included Covidien’s deal for Given Imaging, Grifols’ purchase of Novartis’ diagnostics division and Cooper Companies acquisition of Sauflon Pharmaceuticals.
Emerging marketsIn our 2013 Pulse report, we discussed how market pressures in the US and Europe have pushed Western medtechs to look for growth in other geographies, most notably China. As we write in this year’s Pulse report, the commoditization of devices means, increasingly, that reverse innovation coming from emerging markets may also represent a threat to Western-based medtechs. (See “Sea change in China’s medtech industry” on page 20.)
In response to these simultaneous opportunities and pressures, it is hardly surprising that Western-based medtechs have prioritized deal-making in emerging markets. A comparison of deal volume in two periods (2008–11 versus 2011–14)
shows just how important markets like China, India, Brazil and Turkey have become for medtechs based in the US and Europe. There were just 35 mergers from 2008 to 2011 in South America, Asia and Russia, and the largest publicly disclosed deal was Hospira’s purchase of India’s Orchid Chemicals & Pharmaceuticals. In contrast, from 2011 to 2014, there were 80 deals in these regions of the world, with the two largest publicly disclosed deals — Medtronic’s purchase of China Kanghui Holdings and Stryker’s
bid for Trauson Holdings — commanding price tags of US$816 million and US$764 million, respectively.
Both the Medtronic/China Kanghui Holdings and Stryker/Trauson Holdings mergers took place in the 12-month period ending 30 June 2013 and underscore how leading orthopedic players hoped to expand their footprint in China. Although the total dollars spent on China-based medtechs fell considerably in 2013-14 — there was just one merger with
Medtech company acquisitions in select developing markets
Source: EY, Capital IQ and Thomson ONE.
Jul 2011–Jun 2014
Num
ber o
f dea
ls
0Brazil China India Turkey
50
40
30
20
10
Jul 2008–Jun 2011
66 EY | Pulse of the industry

Mergers and acquisitions
a disclosed deal value of US$3.2 million — the number of deals in this market kept pace with prior 12-month periods. There were five China-based deals in 2013-14, down from eight the year prior. Indeed, of the emerging markets analyzed, China remains the hot spot for deal-making activity, with 42 acquisitions signed since July 2008. (Note, more than half that deal volume — 26 acquisitions — occurred since July 2011.)
Deal activity in Brazil was also robust from 2008 to 2014. There have been 35 acquisitions of Brazilian medtechs since July 2008, with 71% of the volume coming in the past three years. Since 2011, numerous acquirers have sought deals in this South American country, including Essilor International (four deals) and General Electric’s GE Healthcare division (two deals). In emerging markets, deal terms aren’t often publicly disclosed. The largest publicly announced deal of a Brazilian medtech was Straumann Holding’s partial acquisition of the dental implant maker Neodent for US$277.4 million in 2012.
Outside China and Brazil, India (16 acquisitions) and Turkey (nine acquisitions) also commanded significant interest from Western-based medtech buyers from 2008 to 2014. In addition to Hospira’s aforementioned acquisition
of Orchid Chemicals & Pharmaceuticals, other notable deals in India included Smith & Nephew’s 2013 deal for Adler Mediequip Private and its suite of orthopedic trauma assets and William Demant Holding’s 2012 acquisition of Otic Hearing Solutions Private. Essilor International was the most active acquirer of Turkish companies during the six-year time span, inking five deals. Notable Essilor transactions included its 2012 partial acquisitions of Yeda Tora Optik and Opak Optik.
Essilor International wasn’t only focused on Turkish medtech acquisitions. With 21 acquisitions in various emerging markets over the preceding six years, the
France-based eye company was the most active of the US and European medtech acquirers. (PerkinElmer, which acquired four medtechs based in emerging markets during this same time period, was the next-most active buyer.) Essilor International currently holds 40% of the market for prescriptive corrective lenses, making it the global leader in this product category. Expanding to emerging markets has been a key part of the company’s business strategy: having penetrated most of the Western-based markets, it has actively sought to purchase distributors in other parts of the world where a rising middle class and the need for vision correction offer the opportunity for double-digit revenue growth.
Reverse innovation coming from emerging markets may also represent a threat to Western-based medtechs.
67Medical technology report 2014

Case study
Mergers and acquisitions
The scope and scale of the Medtronic/Covidien transaction make it impossible to ignore. But it’s also worth understanding as a signpost of future medtech M&A and the ways in which device companies see deal-making as a key strategy in creating entities that are well positioned to meet the demands of the rapidly changing health care climate.
One of the largest medtech-specific deals ever announced, the Medtronic/Covidien merger, which is valued at US$42.9 billion, surpasses Novartis’ 2010 purchase of Alcon and Boston Scientific’s 2005 acquisition of Guidant. The tie-up joins two leading medtechs to create a new entity with combined revenues nearing US$27 billion, rivaling Johnson & Johnson’s medtech division in annual sales. (Analysts estimate nearly half that revenue will be generated outside the US.)
Based on company press releases, strategic and financial concerns, not the potential for cost-savings, were the primary drivers of the deal. The companies offer complementary product portfolios: Medtronic supplies a range of devices for the cardiology, neurology and diabetes markets, while Covidien specializes in hospital supplies. Together the combined entity will be one of the leading medtech distributers in multiple hospital purchasing categories. This means it will have the scale required to improve its contract negotiations with health care buyers at a time when those purchasers are looking to streamline their vendor relationships.
Just how a newly bulked up Medtronic/Covidien engages with providers and
hospital purchasers remains to be seen. If the combined company’s additional heft improves its contracting capabilities, it is highly likely the deal will put pressure on other medtechs to pursue mergers with equals as a relatively quick way to gain the scale required to remain competitive in the marketplace.
A financial rationaleIn addition to showcasing the strategic imperative of scale, the Medtronic/Covidien deal also highlights the importance of financial considerations in an environment where it is increasingly difficult to demonstrate regular top-line growth. (See page 27 for “Holding steady,” which reviews the medical technology industry’s 2013-14 financial performance.)
As a result of its purchase of Covidien, Medtronic will be domiciled in Ireland, and the combined company will be able to lower its overall corporate taxation rate. It will also be able to access cash generated from overseas operations to make additional US-based investments without incurring taxes there.
Medtronic is hardly the first life sciences company to pursue a deal target based, in part, on the potential tax advantages of an inversion, in which companies reincorporate overseas in order to reduce the tax burden on income earned abroad. Other mergers driven at least partly by the this strategy have included AbbVie’s proposed purchase of Shire, Mylan’s acquisition of Abbott’s Developed Markets branded generic pharmaceutical’s business and Pfizer’s recent bid for AstraZeneca.
Many company executives (in medtech and other industries) argue the American tax code should be overhauled to level the playing field for multinational companies headquartered in the US, as they face a competitive disadvantage compared to firms headquartered in countries with lower tax rates. However, as Pulse went to press, the U.S. Treasury Department issued new guidance to make it harder — and less profitable — for companies to accomplish these so-called inversions. The new rules, issued 22 September 2014, were effective immediately and applied to all transactions – including Medtronic/Covidien — that hadn’t yet been finalized. It’s unclear how Medtronic will respond. A clause in its contract — the Covidien material adverse effect clause — appears to allow Medtronic to end the deal in exchange for a break-up fee. In public statements, the company has only said that it is “studying Treasury’s actions.”
Future prioritiesPrior to the merger, both Medtronic and Covidien were active acquirers, especially of start-ups with promising technologies. In the near term, it seems likely that the combined entity will prioritize integrating the various businesses. That said, Medtronic has publicly stated its intention to spend an additional US$10 billion over the next 10 years on US-based investments, including acquisitions and R&D. Moreover, despite the scale of the transaction, bolt-on acquisitions that further deepen the combined entities’ commercial offering in a given therapeutic sector or geography, especially in rapidly growing emerging markets, shouldn’t be ruled out.
Medtronic/Covidien
Emblematic of what medtech is buying now
68 EY | Pulse of the industry

AppendixPart 3
Part 3 |
Appendix

Appendix
Scope of this report
Except as otherwise noted, medical technology (medtech) companies are defined for this report as companies that primarily design and manufacture medical technology equipment and supplies and are headquartered within the United States or Europe. For the purposes of this report, we have placed Israel’s data and analysis within the European market, and any grouping of the US and Europe has been referred to as “global.” This wide-ranging definition includes medical device, diagnostic, drug delivery and analytical/life science tool companies, but excludes distributors and service providers such as contract research organizations or contract manufacturing organizations.
By any measure, medical technology is an extraordinarily diverse industry. While developing a consistent and meaningful classification system is important, it is anything but straightforward. Existing taxonomies sometimes segregate companies into scores of thinly populated categories, making it difficult to identify and analyze industry trends. Furthermore, they tend to combine categories based on products (such as imaging or tools) with those based on diseases targeted by those products (such as cardiovascular or oncology), which makes it harder to analyze trends consistently across either dimension. To address some of these challenges, we have categorized medtech companies across both dimensions — products and diseases targeted.
All publicly traded medtech companies were classified as belonging to one of five broad product groups:
• Imaging: companies developing products used to diagnose or monitor conditions via imaging technologies,
including products such as MRI machines, computed tomography (CT) and X-ray imaging equipment and optical biopsy systems
• Non-imaging diagnostics: companies developing products used to diagnose or monitor conditions via non-imaging technologies, which can include patient monitoring and in vitro testing equipment
• Research and other equipment: companies developing equipment used for research or other purposes, including analytical and life science tools, specialized laboratory equipment and furniture
• Therapeutic devices: companies developing products used to treat patients, including therapeutic medical devices, tools or drug delivery/infusion technologies
• Other: companies developing products that do not fit in any of the above categories were classified in this segment
In addition to product groups, this report tracks conglomerate companies that derive a significant part of their revenues from medical technologies. While a conglomerate medtech division’s technology could technically fall into one of the product groups listed above (e.g., General Electric into “imaging” and Allergan into “therapeutic devices”), all conglomerate data is kept separate from that of the non-conglomerates. This is due to the fact that, while conglomerates report revenues for their medtech divisions, they typically do not report other financial results for their medtech divisions, such as research and development or net income.
Conglomerate companies
United States
• 3M: Health Care• Abbott: Diagnostic and Vascular
Products• Agilent Technologies: Life Sciences and
Diagnostics• Allergan: Medical Devices• Baxter International: Medical Products• Corning: Life Sciences• Danaher: Life Sciences & Diagnostics
and Dental• Endo Health Solutions: AMS• GE Healthcare• Hospira: Medication Management• IDEX: Health & Science Technologies• Johnson & Johnson: Medical Devices &
Diagnostics• Kimberly-Clark: Health Care• Pall: Life Sciences
Europe
• Agfa: HealthCare• Bayer HealthCare: Medical Care• Carl Zeiss: Meditec• DSM: Medical• Dräger: Medical• Eckert & Ziegler: Medizintechnik• Fresenius: Medical Devices• GN Store Nord: GN ReSound• Halma: Medical• Jenoptik: Medical Therapeutics• Merck KGaA: EMD Millipore• Novartis: Alcon Surgical• Philips Healthcare• Quantel Medical• Roche Diagnostics• Sanofi: Genzyme Biosurgery• Semperit: Sempermed• Siemens Healthcare• Smiths Medical
Defining medical technology
70 EY | Pulse of the industry

Acknowledgments
Project leadershipGlen Giovannetti and Gautam Jaggi once again acted as co-editors-in-chief for Pulse of the industry. Their strategic and thematic guidance were invaluable in the production of this report and ensured the report’s content explored the major themes affecting the industry.
Iain Scott, Lead Analyst in EY’s Global Life Sciences Center, and Ellen Licking, Contributing Writer, were the report’s lead authors. Through a series of external interviews, as well as primary and secondary research, Iain and Ellen developed many of the themes and elements for this year’s report. Iain was the lead author of the “Differentiating differently” article, while Ellen was responsible for writing the Industry performance articles, as well as providing editorial assistance with the “Differentiating differently” article and guest articles.
As the project manager for Pulse of the industry, Jason Hillenbach had responsibility for the entire content and quality of this publication. He was also directly accountable for the primary analysis of the report’s data, and provided insights to the Industry performance section.
Strategic directionSpecial thanks to Patrick Flochel and John Babitt, who brought their years of experience to the identification and analysis of industry trends.
Data analysisUIrike Trauth, Lisa-Marie Schulte and Nina Hahn compiled the data and conducted all the financing, financial performance and M&A analyses.
Amit Nayak, Tanushree Jain and Namrita Negi provided research and analysis support to the Differentiating differently article and Industry performance articles. Namrita also authored the “Sea change in China’s medtech industry” article.
Samir Goncalves, Jason Hillenbach and Kim Medland conducted fact-checking and quality review of the numbers throughout the publication.
Editing assistanceRussell Colton brought his incomparable skills as a copy editor and proofreader to this publication. His patience, hard work and attention to detail were unparalleled.
DesignThis publication would not look the way it does without the creativity of Mike Fine, who was the lead designer for Pulse this year — the first in which he has been involved. Additional design assistance was provided by Appu Sebastian, Liju Abraham, Arun Kumar R, Sarath CV and Rohit Kumar S (chart design).
PR and marketingPublic relations and marketing efforts related to the report and its launch were led by Angela Kyn and Sue Lavin Jones with the help of Greg Kelley from our external PR firm, Feinstein Kean Healthcare, and Katie Hanes from EY’s Global Life Sciences Center marketing team.
Appendix
71Medical technology report 2014
Hospitals’ pressures are shifting from simple cost-cutting to value 6
Physicians are becoming less important influencers of purchasing decisions 6
The reimbursement landscape 7
Differentiate differently — or become commoditized? 8
Health care purchasers prioritize devices that reduce the total cost of care 8
Medical technology at a glance, 2012–13 27
Change in US and European therapeutic device companies’ revenue and net income by disease category, 2013 vs. 2012 28
US and European commercial leaders, 2009–13 29
US public medtech cash index, 2011–13 30
European public medtech cash index, 2011–13 30
Since 2010, medtechs are returning more cash to shareholders than they are investing in R&D 32
US market capitalization relative to leading indices, 2012–14 33
US market capitalization by product type, 2012–14 33
European market capitalization relative to leading indices, 2012–14 34
European market capitalization by product type, 2012–14 34
US medtech at a glance, 2012–13 35
US commercial leaders and other companies, 2012–13 35
Selected US medtech public company financial highlights by region, 2013 36
Selected fast-growing US medtechs by revenue growth, 2008–13 37
European medtech at a glance, 2012–13 38
European commercial leaders and other companies, 2012–13 38
Selected European medtech public company financial highlights by country, 2013 39
Selected fast-growing European medtechs by revenue growth, 2008–13 40
Capital raised in the US and Europe by year (US$m) 42
Driven by the resurgence of IPOs, innovation capital swelled in the US and Europe 43
Medtech’s share of US venture capital continues to tumble 44
Appendix
Data exhibit index
72 EY | Pulse of the industry

The share of early-stage venture investment in the US and Europe reached its highest point in four years 45
VC rounds of US medtech companies with participation of corporate venture investors, by year 46
US and European IPOs by year 48
US and European IPO pricing by year 49
US financings by year 50
US venture capital by year 50
Top US venture rounds, July 2013–June 2014 51
US IPOs by year 51
US IPOs, July 2013–June 2014 52
Capital raised by leading US regions excluding debt, July 2013–June 2014 52
European financings by year 53
European venture capital achieved levels not seen since the financial crisis 53
Top European venture rounds, July 2013–June 2014 54
European IPOs by year 54
European IPOs, July 2013–June 2014 55
Capital raised by leading European countries excluding debt, July 2013–June 2014 55
M&As in the US and Europe by year 57
How medtechs are spending their cash, 2008–13 58
Selected M&As, July 2013–June 2014 59
Portfolio rationalization 60
US and European M&As by type of buyer (excluding megadeals) 61
Selected M&As by segment 62
While the number of deals using milestone payments holds steady ... 64
... the value of milestone payments continues to fall. 64
US M&As by year 65
European M&As by year 65
Medtech company acquisitions in select developing markets 66
Appendix
73Medical technology report 2014

Global Life Sciences Leader Glen Giovannetti [email protected] +1 617 585 1998
Deputy Global Life Sciences Leader Patrick Flochel [email protected] +41 58 286 4148
Global Life Sciences Assurance Leader Scott Bruns [email protected] +1 317 681 7229
Global Life Sciences Advisory Leader Kim Ramko [email protected] +1 615 252 8249
Global Life Sciences Tax Leader Mitch Cohen [email protected] +1 203 674 3244
Global Life Sciences Transaction Advisory Services Leader Jeff Greene [email protected] +1 212 773 6500
Australia Brisbane Winna Brown [email protected] +61 7 3011 3343
Melbourne Denise Brotherton [email protected] +61 3 9288 8758
Sydney Gamini Martinus [email protected] +61 2 9248 4702
Austria Vienna Erich Lehner [email protected] +43 1 21170 1152
Belgium Brussels Dick Hoogenberg [email protected] +31 88 40 71419
Brazil São Paulo Frank de Meijer [email protected] +55 11 2573 3383
Canada Montréal Sylvain Boucher [email protected] +1 514 874 4393
Lara Iob [email protected] +1 514 879 6514
Toronto Mario Piccinin [email protected] +1 416 932 6231
Vancouver Nicole Poirier [email protected] +1 604 891 8342
Czech Republic Prague Petr Knap [email protected] +420 225 335 582
Denmark Copenhagen Staffan Folin [email protected] +46 8 5205 9359
France Paris Virginie Lefebvre-Dutilleul [email protected] +33 1 55 61 10 62
Germany Düsseldorf Gerd Stürz [email protected] +49 211 9352 18622
Mannheim Siegfried Bialojan [email protected] +49 621 4208 11405
India Mumbai V. Krishnakumar [email protected] +91 22 6192 0950
M. Muralidharan Nair [email protected] +91 22 6192 0380
Hitesh Sharma [email protected] +91 22 61920620
Ireland Dublin Aidan Meagher [email protected] +353 1 221 1139
Israel Tel Aviv Eyal Ben-Yaakov [email protected] +972 3 623 2512
Italy Milan Gabriele Vanoli [email protected] +39 02 8066 9840
Rome Alessandro Buccella [email protected] +39 06 67535630
Antonio Irione [email protected] +39 06 67535746
Japan Tokyo Hironao Yazaki [email protected] +81 3 3503 2165
Korea Seoul Jeungwook Lee [email protected] +82 2 3787 4301
Netherlands Amsterdam Dick Hoogenberg [email protected] +31 88 40 71419
New Zealand Auckland Jon Hooper [email protected] +64 9 300 8124
Contacts
Appendix
74 EY | Pulse of the industry
Norway Trondheim/Oslo Willy Eidissen [email protected] +47 918 63 845
Poland Warsaw Mariusz Witalis [email protected] +48 225 577950
Russia Moscow Dmitry Khalilov [email protected] +7 495 755 9757
Singapore Singapore Swee Ho Tan [email protected] +65 6309 8238
South Africa Johannesburg Warren Kinnear [email protected] +27 11 772 3000
Sarel Strydom [email protected] +27 11 772 3420
Spain Barcelona Dr. Silvia Ondategui-Parra [email protected] +48 2 2557 7351
Sweden Uppsala Björn Ohlsson [email protected] +46 18 19 42 22
Switzerland Basel Jürg Zürcher [email protected] +41 58 286 84 03
Zürich Heinrich Christen [email protected] +41 58 286 3485
United Kingdom Bristol Matt Ward [email protected] +44 11 7981 2100
Cambridge Cathy Taylor [email protected] +44 1223 394 490
Rachel Wilden [email protected] +44 1223 394 496
Edinburgh Mark Harvey [email protected] +44 13 1777 2294
Jonathan Lloyd-Hirst [email protected] +44 13 1777 2475
London/Reading Ian Oliver [email protected] +44 11 8928 1197
United States Boston Kevin Casey [email protected] +1 617 585 1817
Michael Donovan [email protected] +1 617 585 1957
Chicago Jerry DeVault [email protected] +1 312 879 6518
James Welch [email protected] +1 312 879 3827
Houston Carole Faig [email protected] +1 713 750 1535
Minneapolis William Miller [email protected] +1 612 371 6984
New York/New Jersey John Babitt [email protected] +1 212 773 0912
Dave DeMarco [email protected] +1 732 516 4602
Orange County Dave Copley [email protected] +1 949 437 0250
Kim Letch [email protected] +1 949 437 0244
Philadelphia Howard Brooks [email protected] +1 215 448 5115
Steve Simpson [email protected] +1 215 448 5309
Raleigh Mark Baxter [email protected] +1 919 981 2966
Redwood Shores Scott Morrison [email protected] +1 650 802 4688
Chris Nolet [email protected] +1 650 802 4504
Rich Ramko [email protected] +1 650 802 4518
San Diego Dan Kleeburg [email protected] +1 858 535 7209
Appendix
75Medical technology report 2014

Notes
Appendix
76 EY | Pulse of the industry

EY | Assurance | Tax | Transactions | Advisory
About EY EY is a global leader in assurance, tax, transaction and advisory services. The insights and quality services we deliver help build trust and confidence in the capital markets and in economies the world over. We develop outstanding leaders who team to deliver on our promises to all of our stakeholders. In so doing, we play a critical role in building a better working world for our people, for our clients and for our communities.
EY refers to the global organization, and may refer to one or more, of the member firms of Ernst & Young Global Limited, each of which is a separate legal entity. Ernst & Young Global Limited, a UK company limited by guarantee, does not provide services to clients. For more information about our organization, please visit ey.com.
How EY’s Global Life Sciences Center can help your business Life sciences companies — from emerging to multinational — are facing challenging times as access to health care takes on new importance. Stakeholder expectations are shifting, the costs and risks of product development are increasing, alternative business models are manifesting, and collaborations are becoming more complex. At the same time, players from other sectors are entering the field, contributing to a new ecosystem for delivering health care. New measures of success are also emerging as the sector begins to focus on improving a patient’s “health outcome,” and not just on units of a product sold. Our Global Life Sciences Center brings together a worldwide network of more than 7,000 sector-focused assurance, tax, transaction and advisory professionals to anticipate trends, identify implications and develop points of view on how to respond to the critical sector issues. We can help you navigate your way forward and achieve success in the new health ecosystem.
© 2014 EYGM Limited. All Rights Reserved.
EYG no. FN0173 CSG no. 1407-1284232
ED 1015
This material has been prepared for general informational purposes only and is not intended to be relied upon as accounting, tax, or other professional advice. Please refer to your advisors for specific advice.
The views of third party set out in this publication are not necessarily the views of the global EY organization or its member firms. Moreover, they should be seen in the context of the time they were made.
ey.com/medtech