Embed Size (px)
Citation preview

Pulse Report for Children & FamiliesJune 2021

The goal of the Community Pulse Report is to examine key indicators as a way of taking the pulse of our community during these difficult times and to further inform policy makers, nonprofit leaders, reporters, and the public in general. This month’s report is organized into three sections:
2
Taking Our Pulse
Vaccine Rollout
Our aim is to utilize data that will give us a snapshot of what is happening in the five-county region—Allegheny, Armstrong, Butler, Fayette, and Westmoreland Counties. This report focuses on findings and data that deepen our understanding of the intersecting disparities in health care, society, and the economy and their impacts on Black and Latino/a/x children and families.
Pandemic Recovery
Summer Programming

We are committed to utilizing data that can be disaggregated by race, gender, and age.
We continue to strive to identify proxy indicators where disaggregated data is not available, and advocate for the disaggregation of data by race, gender, and age.
A Note on Disaggregated Data & Geographies
3
Where such data is available, we note that throughout the report with this symbol:
Where it is not available, we note with this symbol:
Throughout this report, the geography of analyzed data is noted in the upper left-hand corner of each chart or graph:
United States
Five-County Region (Allegheny, Armstrong, Butler, Fayette, Westmoreland)
Pennsylvania
Allegheny County (Only used rarely — where regional data is not available)

Vaccine RolloutCOVID-19 vaccinations levels continue rising, and more than half of the vaccine-eligible population in the region is now fully vaccinated. However, many residents remain unvaccinated, and disparities in vaccination rates continue, as do issues with vaccine data availability and reliability.
More evidence is also available about vaccine hesitancy among US adults. While hesitancy is decreasing for some, a considerable number of Americans remain adamantly opposed to vaccination. Those holdouts skew white and male and vary considerably by occupation.
4

In the five-county region,
909,125people have been fully vaccinated. That’s an estimated 53.3% of people 12 years and older in the region.
5
COVID-19 Vaccinations, Five-County Region
Source: Pennsylvania Department of Health, updated 6.13.21. *Philadelphia is excluded because vaccine data for Philadelphia County is not processed by the PA DOH
3%
Allegheny 56.0%Armstrong 50.0%Butler 53.0%Fayette 45.9%Westmoreland 47.3%Rest of PA(excluding Philadelphia*) 40.7%
Estimated Percent of Residents 12+ Fully Vaccinated, as of 5.18.21:

Over 109,000 of the 909,125 records for fully vaccinated residents are listed as “race unknown.”They are not shown here. 6
COVID-19 Vaccinations by (Known) Race, Five-County Region
Source: Pennsylvania Department of Health. 6.11.21. Data refer to fully vaccinated residents. “Other” includes “Multiple,” Pacific Islander, and Native American. Population numbers from Census ACS 2019 1-year estimates.
Issues remain with data quality and availability.
Both the high concentration of vaccines for which race is unknown — which are not shown in the graphic — and the relatively high number of vaccines for which race is reported as “Other” continue to be alarming and suggest the data are unreliable.
VaccinesDistribution of
vaccines by race for fully vaccinated
recipients for whom race is known as of
6.13.21.
PopulationDistribution of the total population by
race for the five-county region
according to US Census Bureau
estimates.
AAPI — 0.5%Black — 5.3%
Other
White
AAPI — 2.7%
Black
Other — 3.0%
White

The highest rates of vaccination still exist among older adults, who are the most susceptible to Covid-19 illness.
Even though all adults, and children older than 12, are now eligible for vaccination, the shorter period of eligibility for younger residents of the region probably explains some of this disparity.
The lower rates among young adults, however, remain concerning, and suggest an ongoing need for vaccine outreach.
7
COVID-19 Vaccinations by Age, Five-County Region
Source: Pennsylvania Department of Health. 6.13.21. Data refer to fully vaccinated residents.

8
Vaccine Hesitancy by Occupation
Across occupations, workers who are working from home have lower hesitancy rates than workers who work in person. As of March, 11.4% of people working from home reported hesitancy while 24.8% of people who work outside the home reported hesitancy.
Source: COVID-19 vaccine hesitancy January-March 2021 among 18-64 year old US adults by employment and occupation
Pitt/CMU Covid-19 Hesitancy Study
“Almost half of adults younger than 65 who are hesitant to receive a COVID-19 vaccine say they are concerned about side effects, with people in certain occupations reporting five-fold higher rates of hesitancy than others.”
High hesitancy occupational groups:
Farming, Fishing, Forestry: 41.2%Installation, Maintenance, Repair: 42.6%Construction and Extraction: 46.4%
Low hesitancy occupational groups:
Life, Physical, or Social Sciences: 9.6%Education: 9.7%Legal: 10.0%ComputerMathematical: 10.3%

Kaiser Family Foundation COVID-19 Vaccine Monitor
Cautious attitudes towards the vaccine (those who plan to “wait and see” before getting a vaccine) continue to decline, but approximately 20% of Americans remain steadfast in their opposition to voluntary Covid-19 vaccination, and that poses a severe, long-term public health risk.
9
Partial hesitancy is decreasing across all groups
If a similar percentage of adults in the region are opposed to getting the vaccine, that represents approximately
350,000 adult residents.
Vaccine Hesitancy in the US: Dec 2020 – Apr 2021
Source: KFF COVID-19 Vaccine Monitor | Note that bar length varies slightly based on response rate for questions.
10
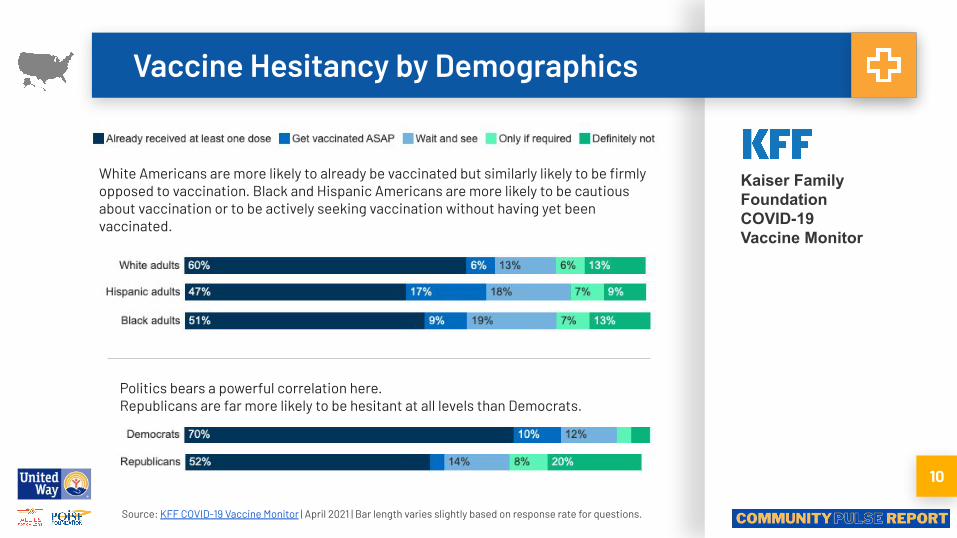
Vaccine Hesitancy by Demographics
White Americans are more likely to already be vaccinated but similarly likely to be firmly opposed to vaccination. Black and Hispanic Americans are more likely to be cautious about vaccination or to be actively seeking vaccination without having yet been vaccinated.
Politics bears a powerful correlation here. Republicans are far more likely to be hesitant at all levels than Democrats.
Source: KFF COVID-19 Vaccine Monitor | April 2021 | Bar length varies slightly based on response rate for questions.
Kaiser Family Foundation COVID-19 Vaccine Monitor

11
COVID-19 Vaccination Barriers
Source: Quote from KFF COVID-19 Vaccine Monitor | April 2021For more information on vaccination barriers by race, read this Scientific American article.
“Among those who are open to getting vaccinated but have not yet tried to get an appointment, reasons range from safety concerns to logistical barriers to questions about eligibility, and vary widely by vaccination intention.”
Specifically, barriers to vaccine access locally might include: • Access to doctors and medical facilities • Misinformation and vaccine education • Transportation and mobility • Work schedules/responsibilities • Language barriers • Child care
Identifying and addressing specific vaccine barriers is difficult without better data. That is why the Black Equity Coalition and its partners continue to advocate for more detailed and more reliable data to identify and address specific challenges and close the vaccination gap in the region.

Pandemic RecoveryEconomic Recovery from the Covid-19 Recession
Businesses and workers are showing signs of recovery, partly fueled by stimulus and public funding support, but many economic challenges remain.
Black and Hispanic workers and female workers continue to face disproportionate burdens that were likely driven by inequality.
Housing insecurity remains a vital economic challenge, and with moratoria on evictions lifting, the threat of evictions looms large. 12

207,800 | May 2020 Peak
21,400 | March 2020
33,000As of May 2021
13
Unemployment Insurance, Five-County Region
Source: Pennsylvania Department of Labor | UI Claims Dashboard
This chart does not reflect all unemployed individuals. UC program data does not cover thousands of other recipients who are receiving benefits through Pandemic Unemployment Assistance (PUA). Despite expanded coverage through the CARES Act, not all unemployed workers are eligible for UC benefits, and many who are eligible do not file claims.
The number of people receiving Unemployment Compensation (UC) benefits declined substantially since the peak early in the crisis, but there were still 33,000 open claims in the region in June — 11,600 claims higher than March 2020, before the crisis.
Ope
n UC
Cla
ims
in th
e Re
gion

14
Unemployment Insurance Claims, Five-County Region
We see widening disparity in unemployment claims for Black residents in the region.
Source: Estimates developed by Fourth Economy. Unemployment Claims by Race from PA Dept. of Labor & Industry. Claims do not include PAU claims. Workforce estimates by race based on US Census Bureau QWI data.
Estimated Unemployment Compensation (UC) Claims RateFive-County Region | May 2021
As noted, this information does not include individuals who are utilizing Pandemic Unemployment Assistance (PUA) — which is not available at a local scale.

15
Labor Force Dropout, Nationally by Race + Gender
Source: Bureau of Labor Statistics, February 2021 Employment Situation
The labor force dropout rate refers to the number of workers who leave the labor force by ceasing to work or seek work as a percentage of the prior labor force. Unlike unemployment, which disproportionately impacts men of color both locally and nationally, when it comes to labor force dropout, women have faced higher rates than men following the Covid-19 recession. But that gender disparity is far more pronounced for Black and Hispanic workers. This is likely driven by wage disparity and inequality, especially in the case of working parents.

April 28 – May 10, 2021 16
Housing Insecurity, Pennsylvania by Race/Ethnicity
Source: US Census Bureau | Household Pulse SurveyData refer to respondent households who are renters with rent due who report “no confidence” that they will be able to pay.
Covid-19 has exacerbated unaffordable housing conditions — especially for renters. Housing cost burden rates were high before the crisis, and households that have lost income continue to face unaffordable rents.
Percent of Renter Households Facing Severe Housing Insecurity

17
Housing Assistance (ERAP)
In March 2021, the State of Pennsylvania launched the Emergency Rental Assistance Program (ERAP) to support households in need. The Department of Human Services administers the program in Allegheny County. For a full list of program administrators by county, click here.
Between March 15 and May 31, 2021, the ERAP program received 8,284 applications and served 1,042 households in Allegheny County.
Between March 15 and May 31, 2021, the ERAP program paid out $5.2 million in rent to households in Allegheny County.
Between March 15 and May 31, 2021, the ERAP program paid out $233 thousand in utility assistance to households in Allegheny County.
Source: Allegheny County Department of Human Services
18
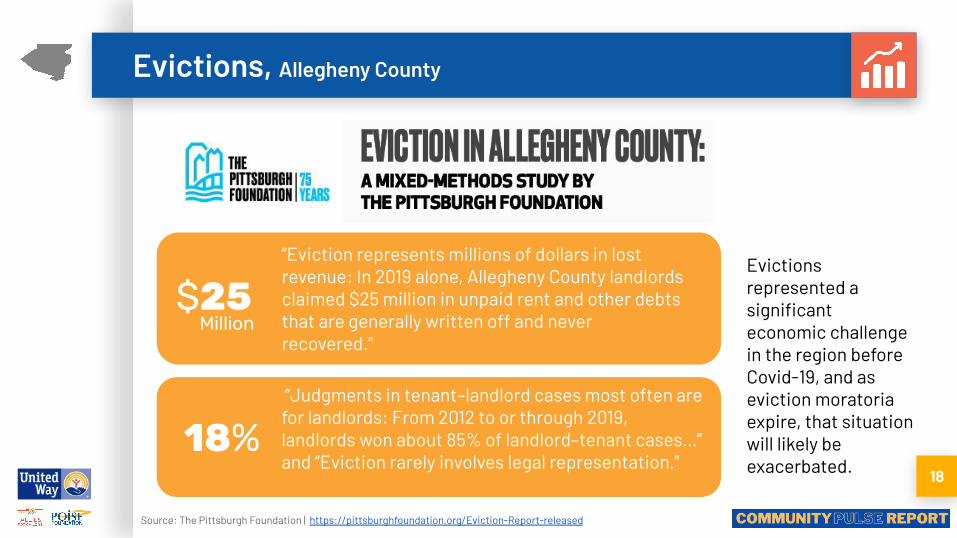
Evictions, Allegheny County
Source: The Pittsburgh Foundation | https://pittsburghfoundation.org/Eviction-Report-released
“Eviction represents millions of dollars in lost revenue: In 2019 alone, Allegheny County landlords claimed $25 million in unpaid rent and other debts that are generally written off and never recovered.”
“Judgments in tenant–landlord cases most often are for landlords: From 2012 to or through 2019, landlords won about 85% of landlord–tenant cases…” and “Eviction rarely involves legal representation.”
Evictions represented a significant economic challenge in the region before Covid-19, and as eviction moratoria expire, that situation will likely be exacerbated.
$25Million
18%

Feedback and observations from researchers provide important context to the data in this report.
19
From the Field: Evictions
“Despite the Centers for Disease Control and Prevention’s moratorium on evictions, there are over 1,100 eviction hearings scheduled in Allegheny County Magisterial District Courts. Allegheny County is aggressively paying out federal emergency rental assistance for back rent owed, but thousands are still waiting. An effort to engage landlords to use mediation in lieu of filing for eviction is also underway. If the moratorium is lifted on June 30, we can expect a surge in eviction filings. Extending the moratorium until the rental and utility assistance can be dispersed will help, but a substantial infusion of emergency resources to rehabilitate vacant housing units would help even more.”
Jane DowningSenior Program Officer, Economic and Community
DevelopmentThe Pittsburgh Foundation

Summer Programming
As we enter summer 2021, the effects of the Covid-19 pandemic continue to create challenges for local service providers and residents.
While summer meal programming demand may not be as high as it was in 2020, continued food insecurity suggests that higher-than-normal need still exists.
20

Feedback and observations from our on-the-ground providers are crucial to understanding the data we are collecting in context.
21
From the Field
“Penn Hills School District recognizes that individual and family need is not aligned with the school calendar. We also recognize the toll COVID-19 and other events this year have taken on our families, our staff, and our larger community. Accordingly, our District's K-12 summer programming will follow a special theme of community healing and recovery. Programming will be facilitated during the last 2 weeks of June to allow EVERYONE a sense of closure to this very difficult year and, again, during the first 2 weeks of August to help EVERYONE get back into the mindset of school before we officially start the new school year… We expect lasting relationships to be built based on a shared sense of community.”
Dr. Nancy HinesSuperintendent, Penn Hills School District
“While some activities have started to return to what they were before the pandemic, Summer Meals will continue to be in transition as some locations operate in-person meals and others offer Grab and Go meals. We anticipate that the need for Summer Meals will be less than in 2020, due to robust SNAP and Pandemic EBT benefits and to people returning to work; however, they are a critical support for families who don’t qualify for those benefits and in communities where they’re part of youth programming. We are so grateful for the youth organizations and school food service directors who have been working tirelessly since the beginning of the pandemic to ensure that young people have access to meals. “
Karen DreyerDirector of Child Nutrition Programs,
Greater Pittsburgh Community Food Bank

22
Food Insecurity, Pennsylvania by Race/Ethnicity
Source: US Census Bureau | Household Pulse SurveyData refer to respondent households who report “sometimes” or “often [not having] enough food to eat”
Despite some signs of economic recovery, many Pennsylvania household still face severe food insecurity, and rates are much higher among Black- and Hispanic-headed households, with more than one in six Black and Hispanic households in the state sometimes or often facing a shortage of food.
Percent of Respondents Facing Food InsecurityApril 28 – May 10, 2021

23
SNAP Enrollment, Five-county Region
Source: PA Dept. of Human Services
Additional SNAP benefits began in April 2020 to combat economic hardship during the Covid-19 crisis, and the USDA has since passed a waiver allowing Pandemic EBT throughout the summer of 2021.
With expanded access and benefits, SNAP enrollment spiked during the crisis and participation remains higher than pre-Covid-levels, despite some decrease in late 2020
SNAP
Enr
ollm
ent i
n Fi
ve-C
ount
y Re
gion

24
Summer Meals, Five-County Region
Source: PA Department of Education | Open site status data not available for 2019 SSO meals.
Mea
ls S
erve
d in
the
Five
-Cou
nty
Regi
on +247%
Demand for summer meals grew dramatically during Covid-19 through both the Summer Food Service Program (SFSP) and Seamless Summer Option (SSO) programs. In 2019, where data were available, 78% of these meals were distributed at “open” sites, meaning no prior enrollment was required for eligibility. In 2020, 97% of meals were distributed at open sites.
Looking ahead to the summer of 2021, with food insecurity still a challenge and summer programming strained, demand for meals is likely to remain high. To find meals near you check out the Greater Pittsburgh Community Food Bank’s Summer Youth Cafe.

25
Welcome Back! Summer Programming
The Welcome Back! program is sponsored by the United Way Southwestern Pennsylvania and The McEllhattan Foundation, with support from The Heinz Endowments, The Grable Foundation, The Hillman Foundation, The Pittsburgh Foundation, The Ciervo Foundation, The Jefferson Regional Foundation, The Buhl Foundation, The Richard King Mellon Foundation, The Benedum Foundation, and the Allegheny Department of Human Services.
Welcome Back!Summer Grant Program 66
Organizations
have been funded to provide summer programming; 24 are large organizations serving more than 100 kids
85% of participating organizations will primarily serve students of color
2.1 raised to support summer programming in the five-county region
$Million
This year, nearly a dozen funders came together to create Welcome Back! Summer 2021, a funding effort to support in-person summer programming for over 8,000 school-age youth in the region.

26
Summer Programming Staff Shortages
“The YMCA of Greater Pittsburgh, like many child-caring organizations, continues to be substantially impacted by the nationwide staffing shortages. Despite significant salary improvements, we have been unable to hire adequate numbers of summer staff to meet the strong demand for day and residential camps. In some locations we are operating at 50% capacity. Across our service area we have had to limit program offerings and sites. All of this hinders the Y's ability to earn revenue at a time when we traditionally experience strong performance. More importantly, we'd like to give every child the summer they deserve!
As we look towards the fall and a return to school, we continue to make every effort to secure the skilled, creative and talented staff who traditionally provide outstanding care in our Before and After School Programs. We recognize that quality childcare, that is both safe and affordable, is a critical resource to area employers and families, and essential to a successful reopening of the economy.” Kevin Bolding
President & CEO of the YMCA of Greater Pittsburgh
“Workforce is a significant challenge for the early care and education sector. It's definitely our number one issue. Our ability to provide children with meaningful early learning experiences, to support families in their development and their return to work and our economy's recovery begins and ends with a quality and stable early childhood workforce.”
Cara CiminilloExecutive Director
Trying Together

▪ Previous reports:▫ Community Pulse Report: September ▫ Community Pulse Report: October ▫ Community Pulse Report: November/December▫ Community Pulse Report: January ▫ Community Pulse Report: February▫ Community Pulse Report: April
27
More Information & Previous Reports
Report developed and designed by Fourth Economy.