Embed Size (px)
DESCRIPTION
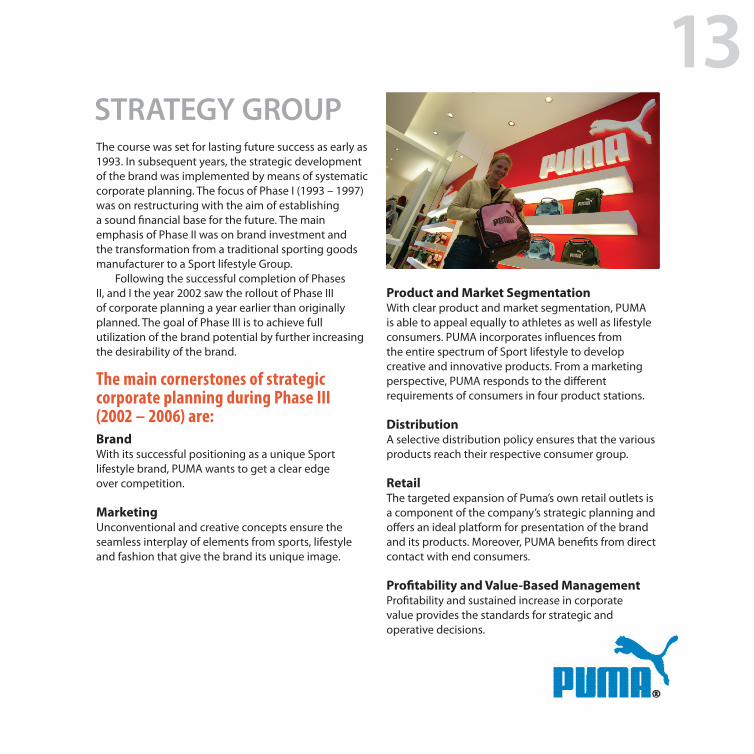
Puma Annual Report
Citation preview


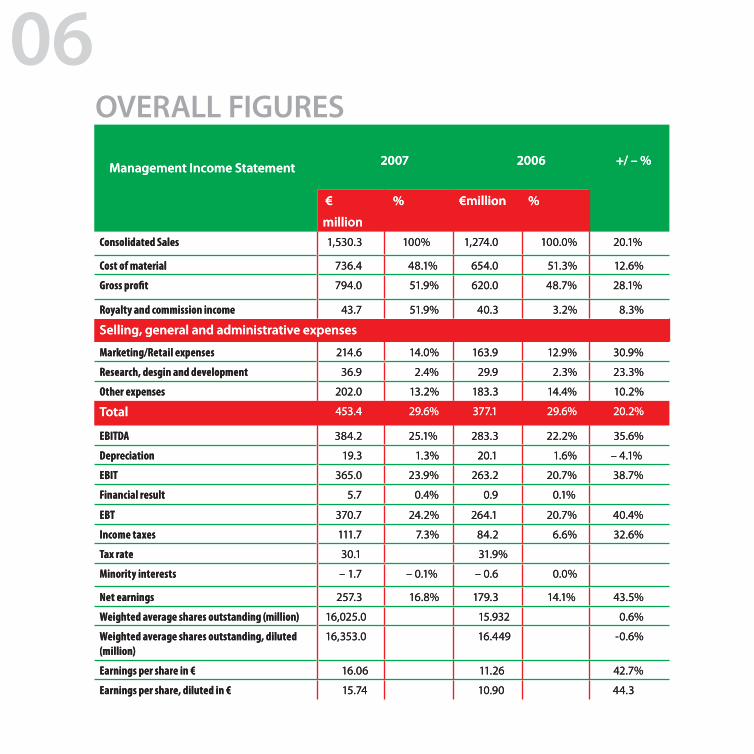
Management Income Statement 2007 2006
+/ – %
€
million
% €million %
Consolidated Sales 1,530.3 100% 1,274.0 100.0% 20.1%
Cost of material 736.4 48.1% 654.0 51.3% 12.6%
Gross profi t 794.0 51.9% 620.0 48.7% 28.1%
Royalty and commission income 43.7 51.9% 40.3 3.2% 8.3%
Selling, general and administrative expenses
Marketing/Retail expenses 214.6 14.0% 163.9 12.9% 30.9%
Research, desgin and development 36.9 2.4% 29.9 2.3% 23.3%
Other expenses 202.0 13.2% 183.3 14.4% 10.2%
Total 453.4 29.6% 377.1 29.6% 20.2%
EBITDA 384.2 25.1% 283.3 22.2% 35.6%
Depreciation 19.3 1.3% 20.1 1.6% – 4.1%
EBIT 365.0 23.9% 263.2 20.7% 38.7%
Financial result 5.7 0.4% 0.9 0.1%
EBT 370.7 24.2% 264.1 20.7% 40.4%
Income taxes 111.7 7.3% 84.2 6.6% 32.6%
Tax rate 30.1 31.9%
Minority interests – 1.7 – 0.1% – 0.6 0.0%
Net earnings 257.3 16.8% 179.3 14.1% 43.5%
Weighted average shares outstanding (million) 16,025.0 15.932 0.6%
Weighted average shares outstanding, diluted (million)
16,353.0 16.449 -0.6%
Earnings per share in € 16.06 11.26 42.7%
Earnings per share, diluted in € 15.74 10.90 44.3
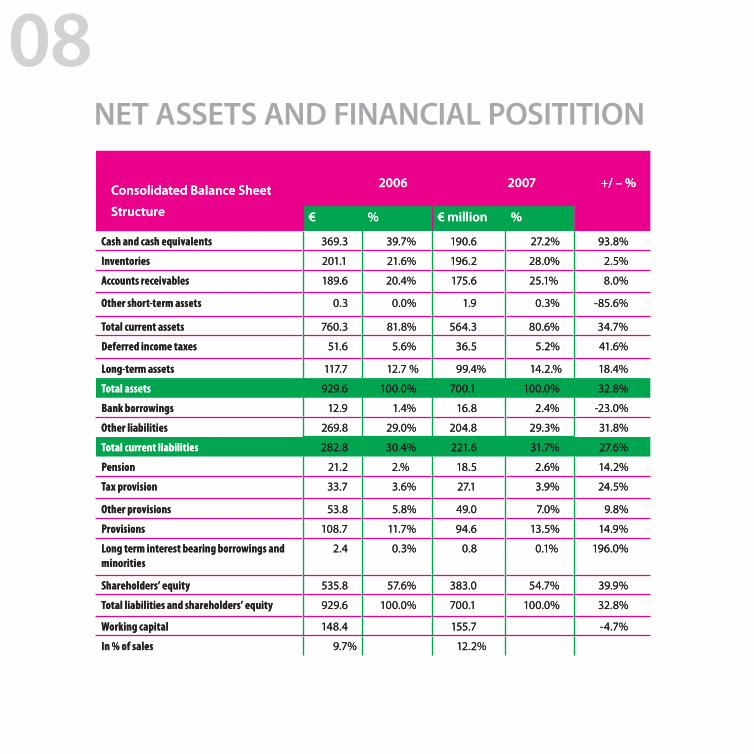
Consolidated Balance Sheet
Structure
2006 2007 +/ – %
€ % € million %
Cash and cash equivalents 369.3 39.7% 190.6 27.2% 93.8%
Inventories 201.1 21.6% 196.2 28.0% 2.5%
Accounts receivables 189.6 20.4% 175.6 25.1% 8.0%
Other short-term assets 0.3 0.0% 1.9 0.3% -85.6%
Total current assets 760.3 81.8% 564.3 80.6% 34.7%
Deferred income taxes 51.6 5.6% 36.5 5.2% 41.6%
Long-term assets 117.7 12.7 % 99.4% 14.2.% 18.4%
Total assets 929.6 100.0% 700.1 100.0% 32.8%
Bank borrowings 12.9 1.4% 16.8 2.4% -23.0%
Other liabilities 269.8 29.0% 204.8 29.3% 31.8%
Total current liabilities 282.8 30.4% 221.6 31.7% 27.6%
Pension 21.2 2.% 18.5 2.6% 14.2%
Tax provision 33.7 3.6% 27.1 3.9% 24.5%
Other provisions 53.8 5.8% 49.0 7.0% 9.8%
Provisions 108.7 11.7% 94.6 13.5% 14.9%
Long term interest bearing borrowings and minorities
2.4 0.3% 0.8 0.1% 196.0%
Shareholders’ equity 535.8 57.6% 383.0 54.7% 39.9%
Total liabilities and shareholders’ equity 929.6 100.0% 700.1 100.0% 32.8%
Working capital 148.4 155.7 -4.7%
In % of sales 9.7% 12.2%
10

12