Embed Size (px)
Citation preview
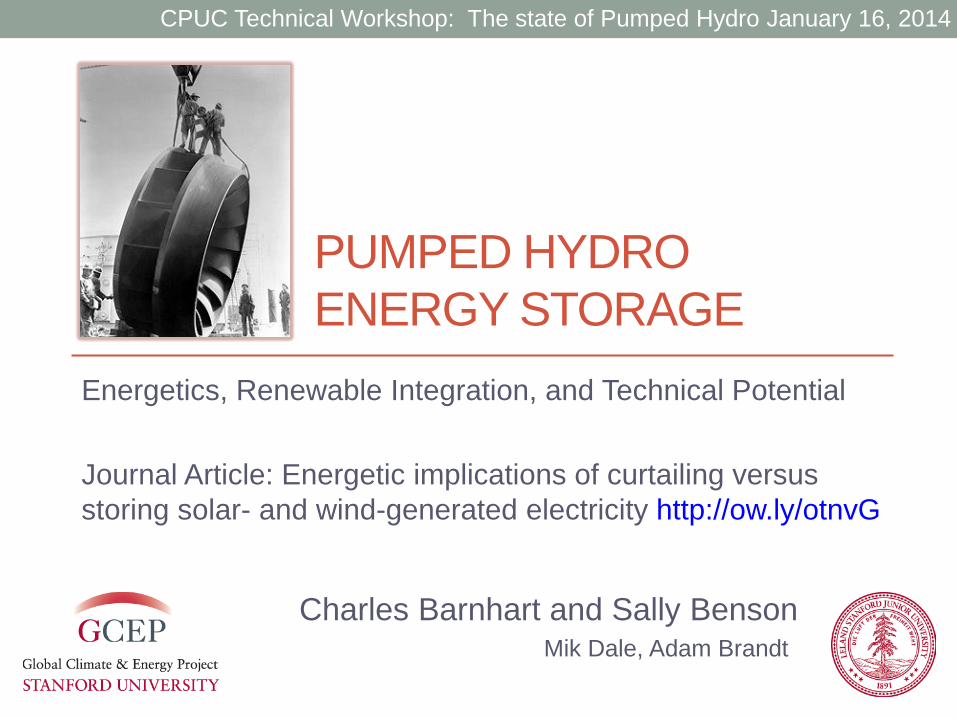
PUMPED HYDRO ENERGY STORAGE
Energetics, Renewable Integration, and Technical Potential Journal Article: Energetic implications of curtailing versus storing solar- and wind-generated electricity http://ow.ly/otnvG
Charles Barnhart and Sally Benson Mik Dale, Adam Brandt
CPUC Technical Workshop: The state of Pumped Hydro January 16, 2014
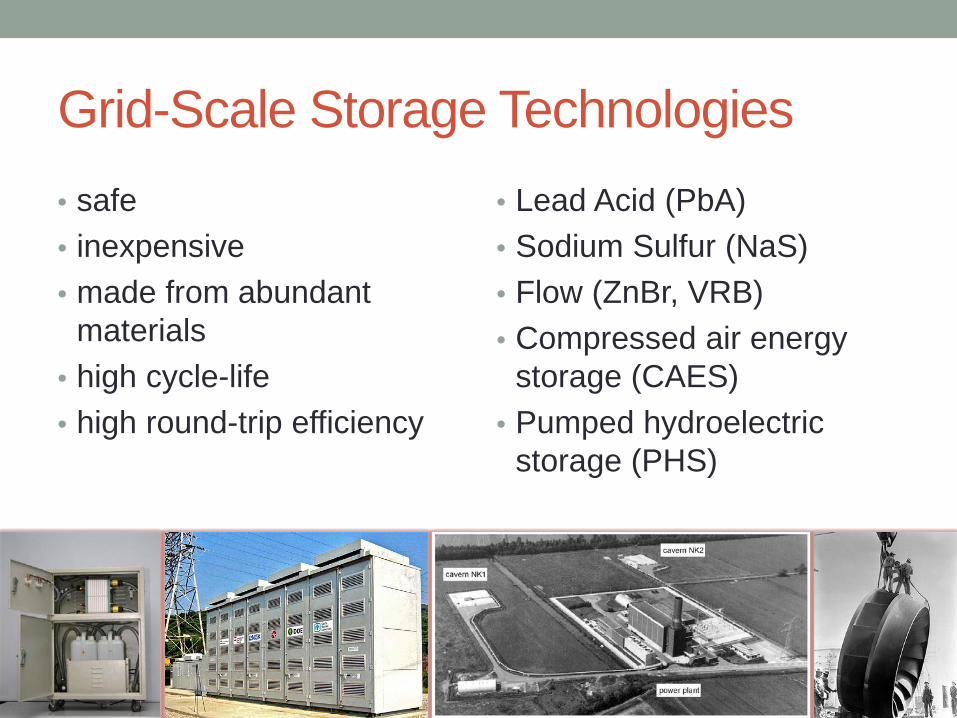
Grid-Scale Storage Technologies • safe • inexpensive • made from abundant
materials • high cycle-life • high round-trip efficiency
• Lead Acid (PbA) • Sodium Sulfur (NaS) • Flow (ZnBr, VRB) • Compressed air energy
storage (CAES) • Pumped hydroelectric
storage (PHS)
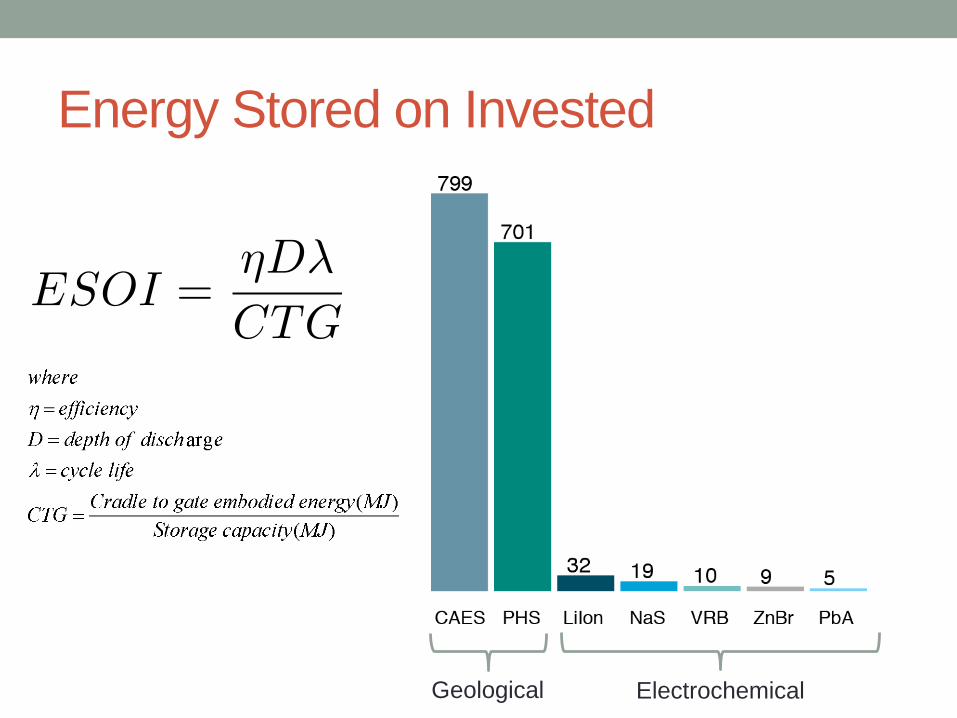
Energy Stored on Invested
Geological Electrochemical
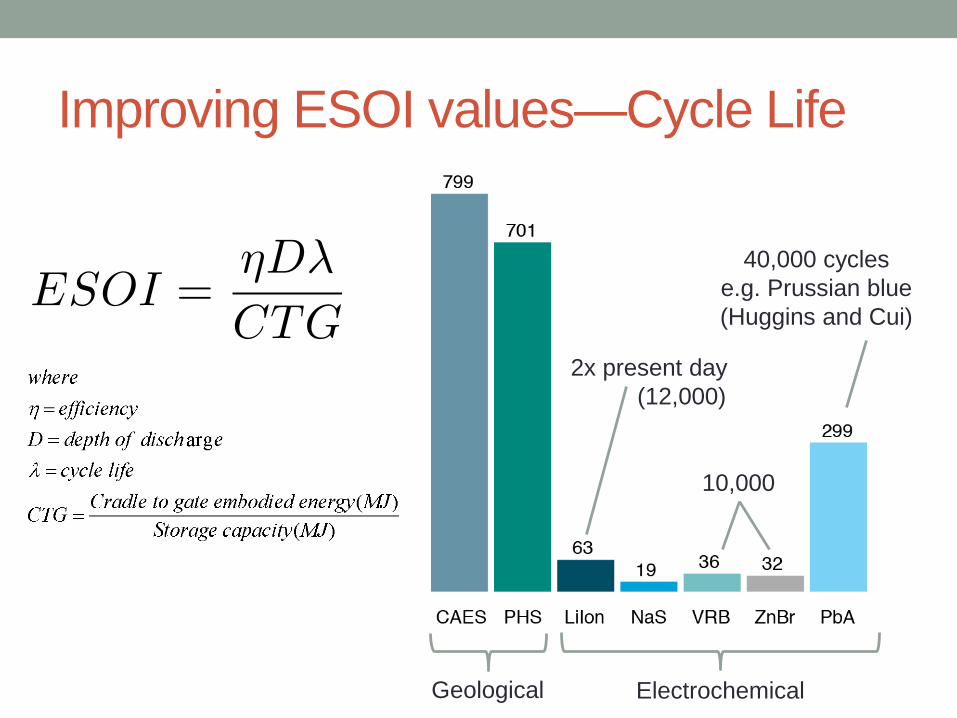
Improving ESOI values—Cycle Life
Geological Electrochemical
2x present day (12,000)
10,000
40,000 cycles e.g. Prussian blue (Huggins and Cui)
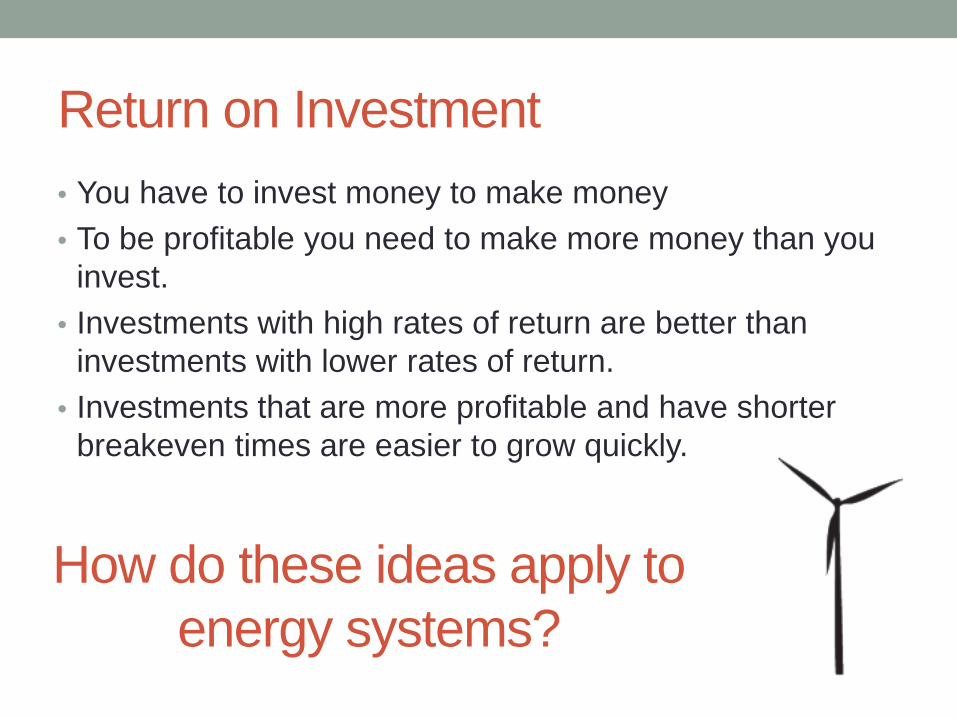
Return on Investment • You have to invest money to make money • To be profitable you need to make more money than you
invest. • Investments with high rates of return are better than
investments with lower rates of return. • Investments that are more profitable and have shorter
breakeven times are easier to grow quickly.
How do these ideas apply to energy systems?
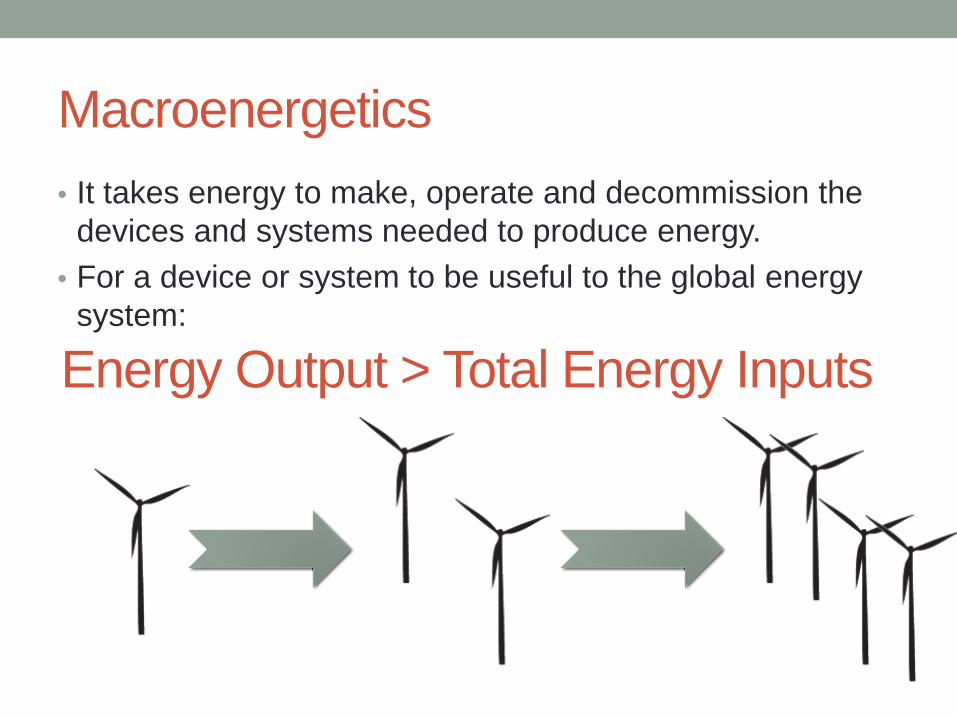
Macroenergetics • It takes energy to make, operate and decommission the
devices and systems needed to produce energy. • For a device or system to be useful to the global energy
system: Energy Output > Total Energy Inputs
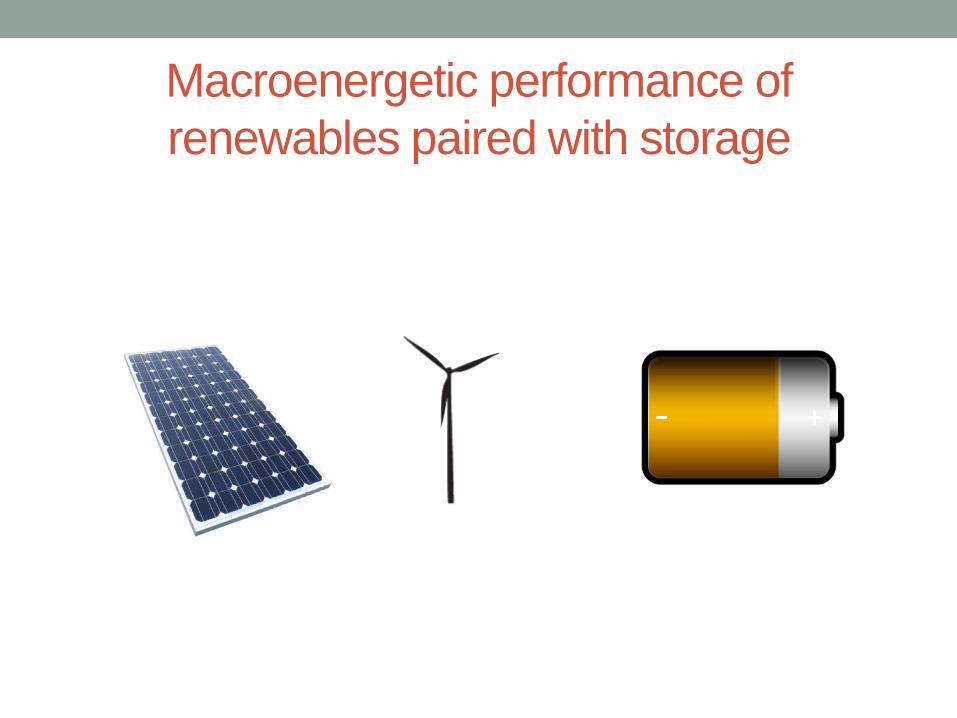
Macroenergetic performance of renewables paired with storage
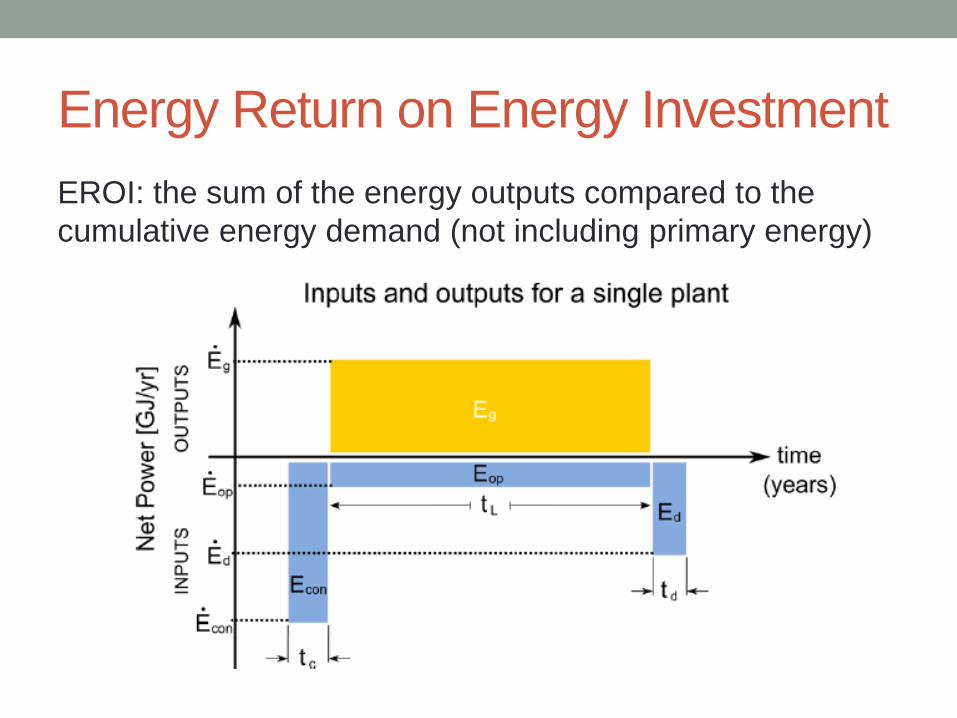
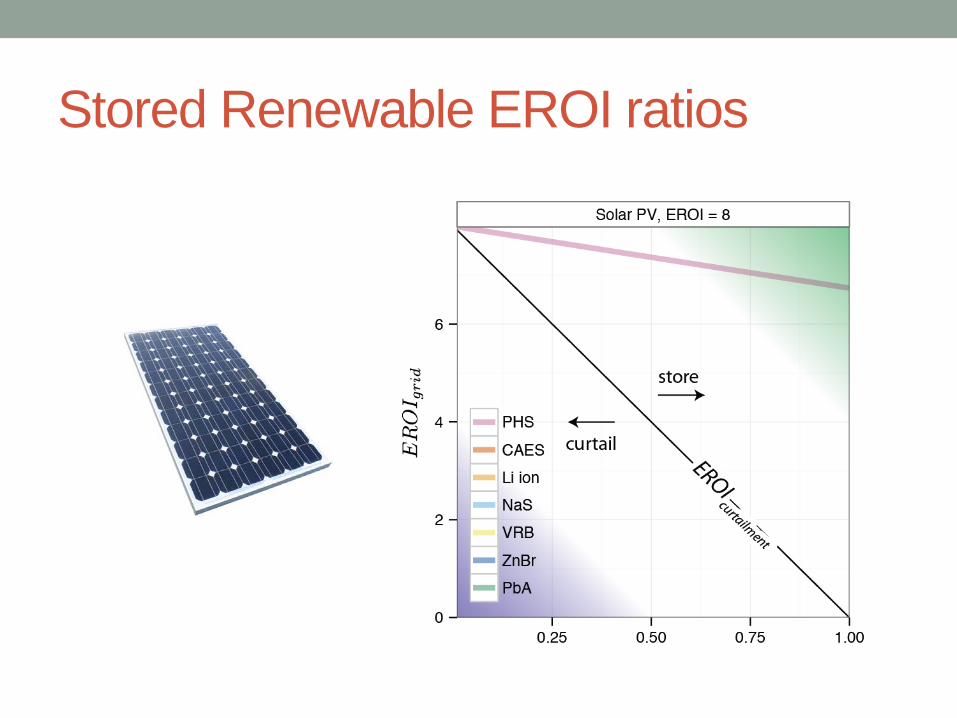
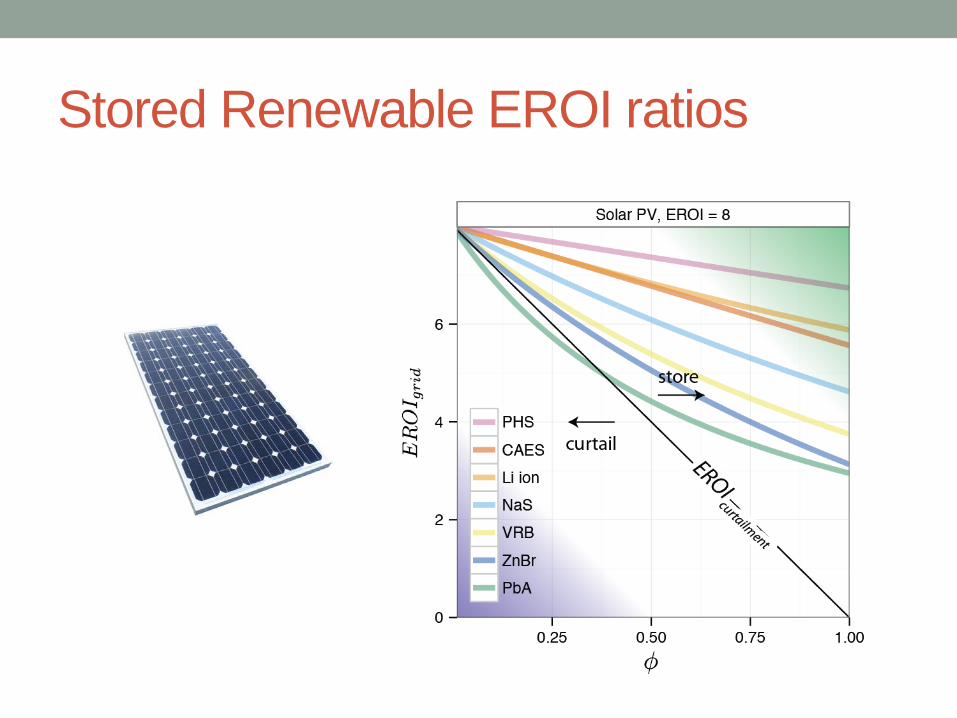
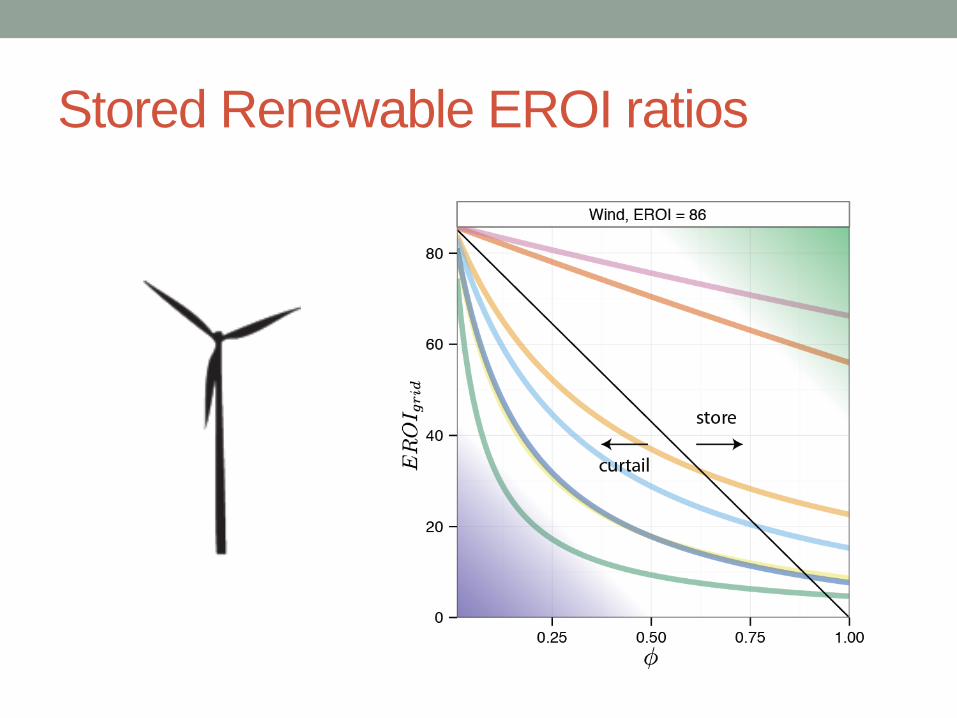
Energy Return on Energy Investment EROI: the sum of the energy outputs compared to the cumulative energy demand (not including primary energy)
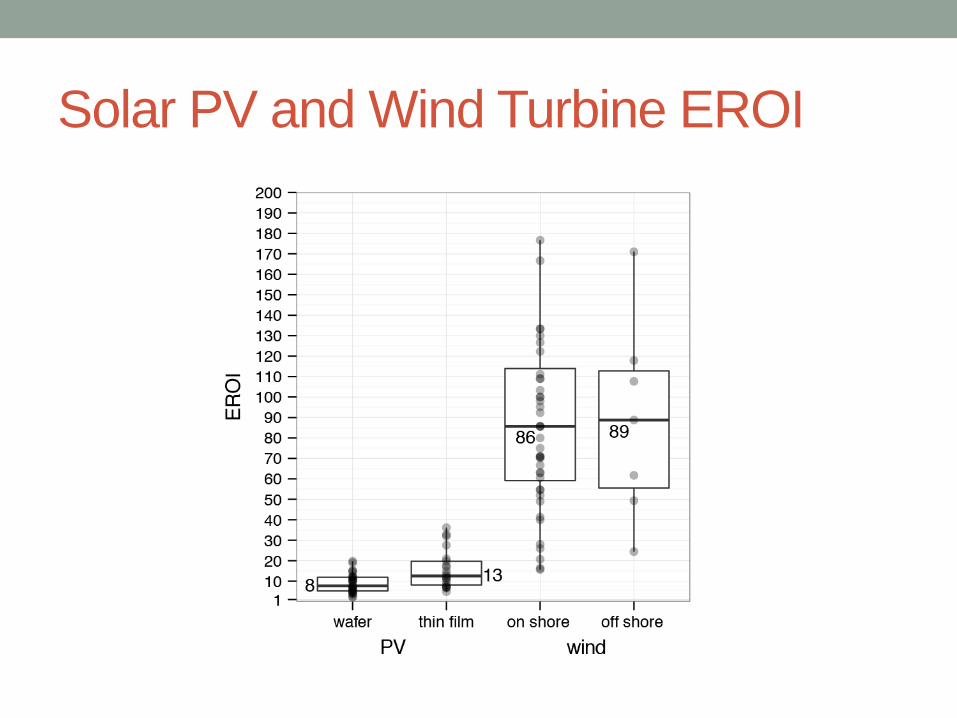
Solar PV and Wind Turbine EROI
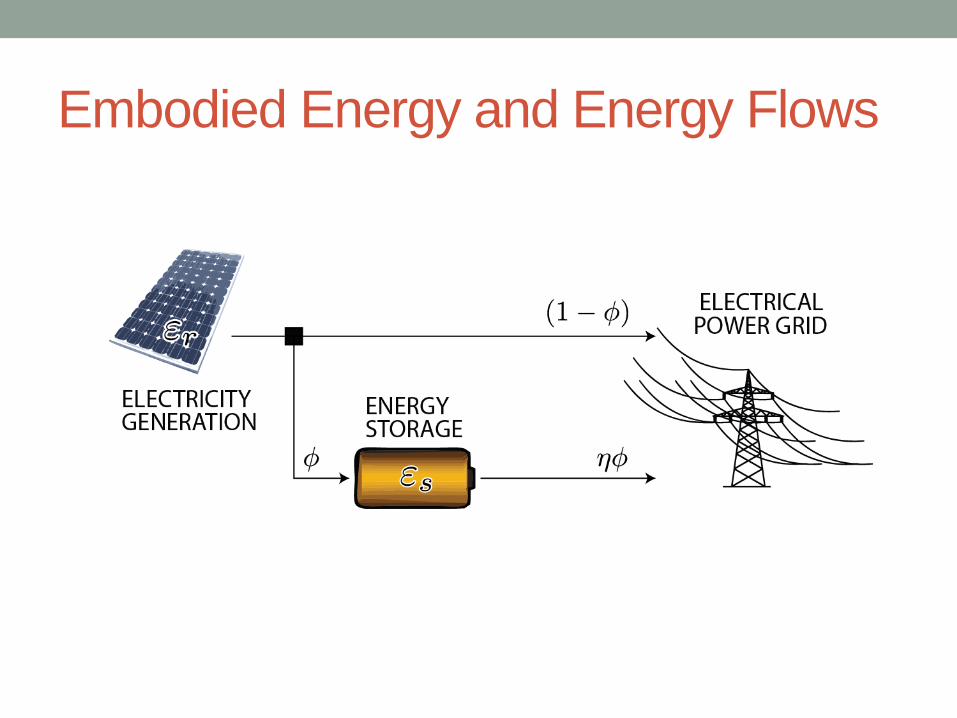
Embodied Energy and Energy Flows
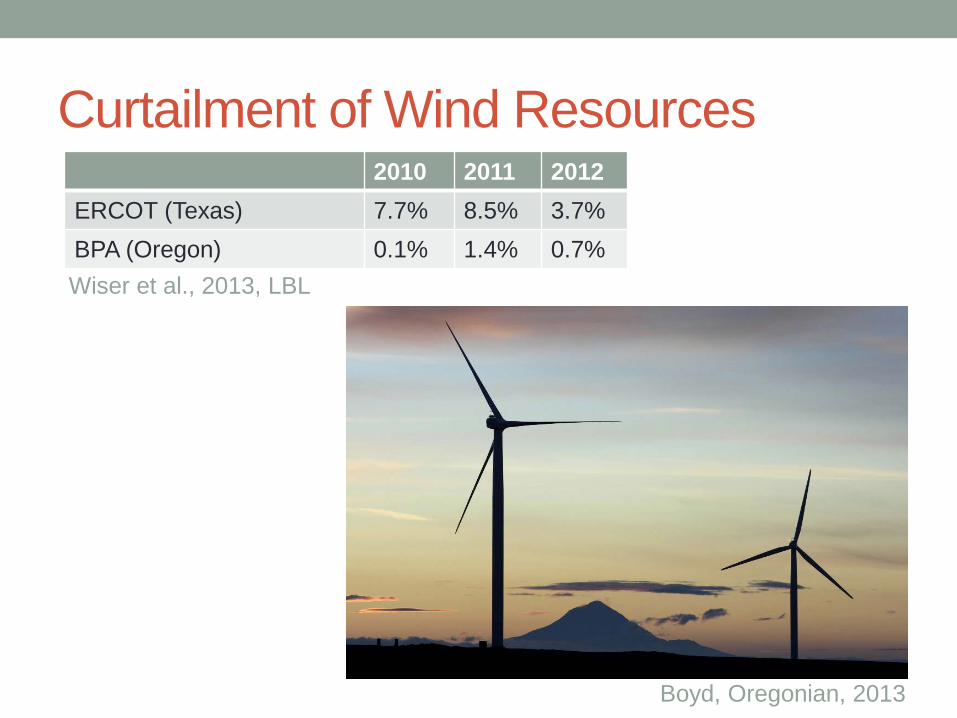
Curtailment of Wind Resources 2010 2011 2012
ERCOT (Texas) 7.7% 8.5% 3.7% BPA (Oregon) 0.1% 1.4% 0.7% Wiser et al., 2013, LBL
Boyd, Oregonian, 2013
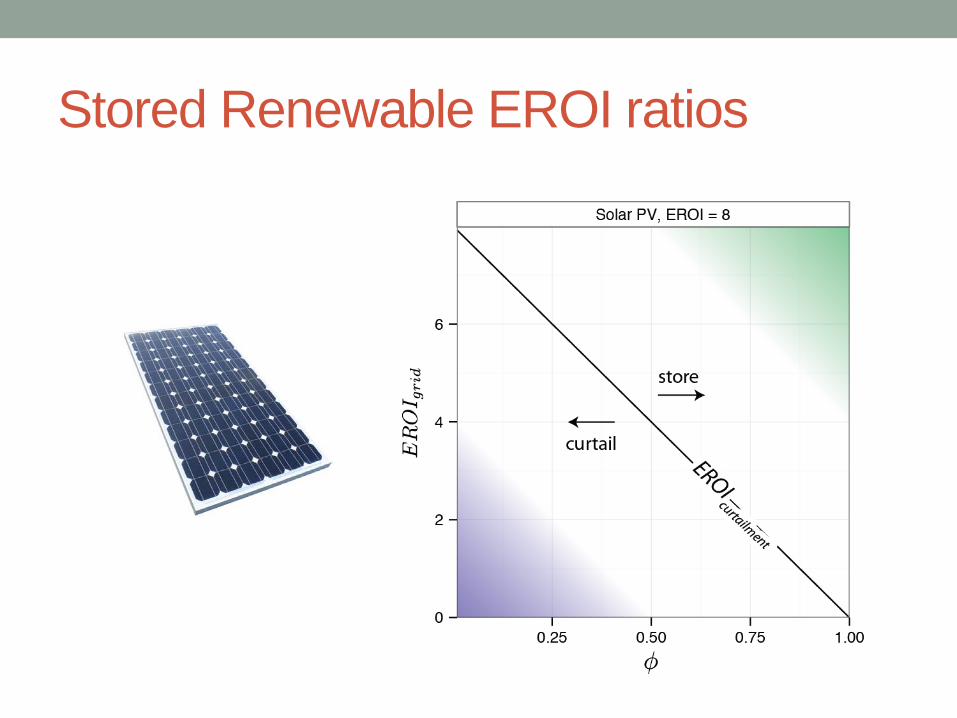
Stored Renewable EROI ratios
Stored Renewable EROI ratios
Stored Renewable EROI ratios
Stored Renewable EROI ratios
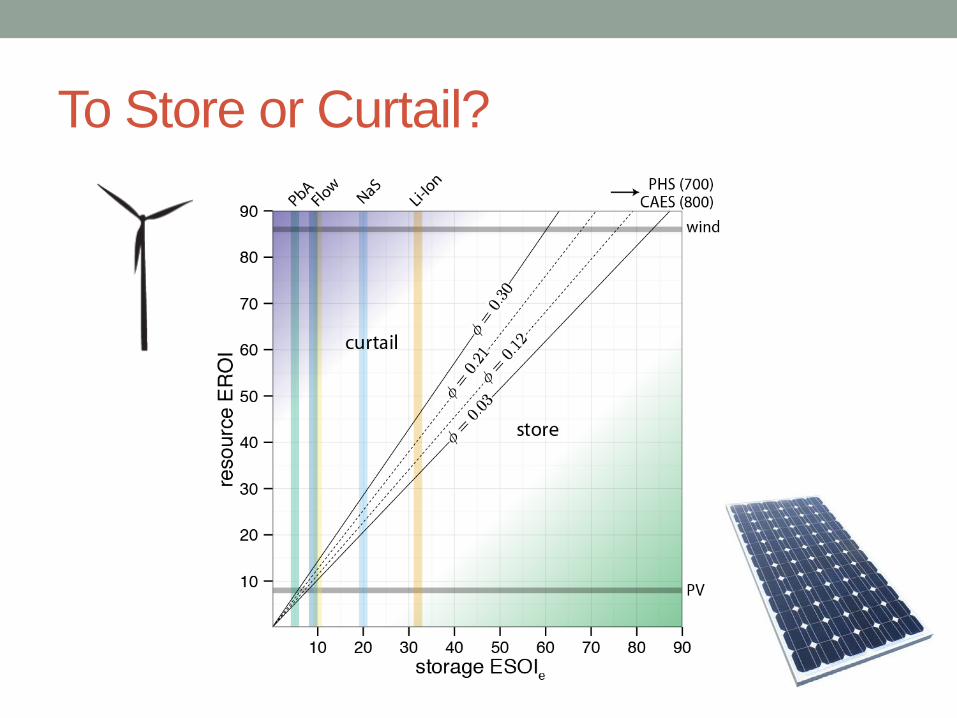
To Store or Curtail?

Geological Limits on PHS
Okinawa Yanbaru Seawater PHS, 30 MW, 235 MWh
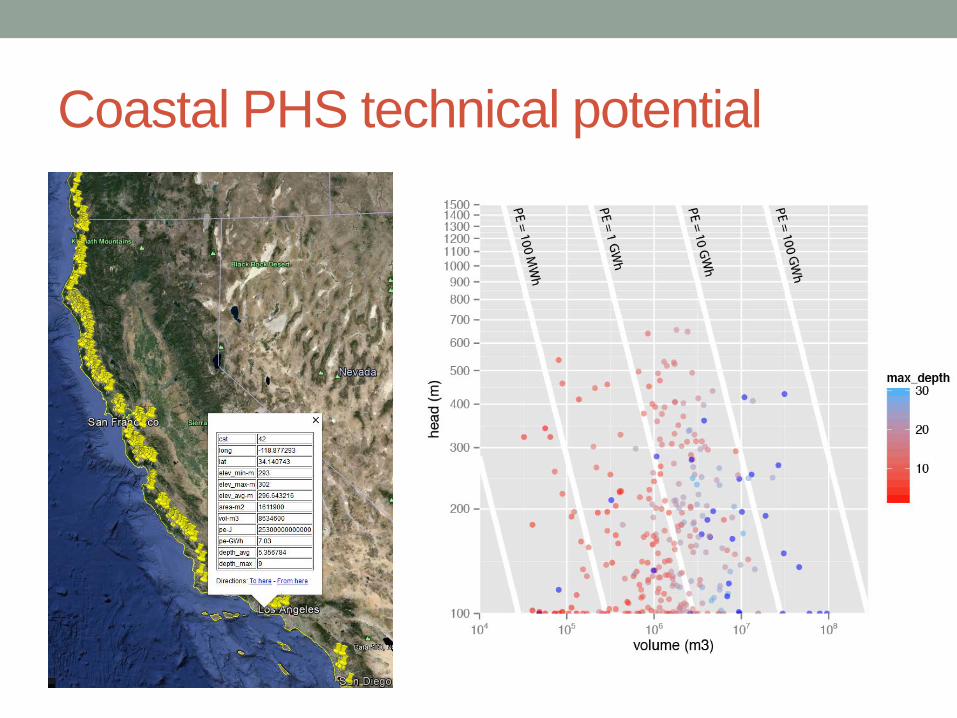
Coastal PHS technical potential
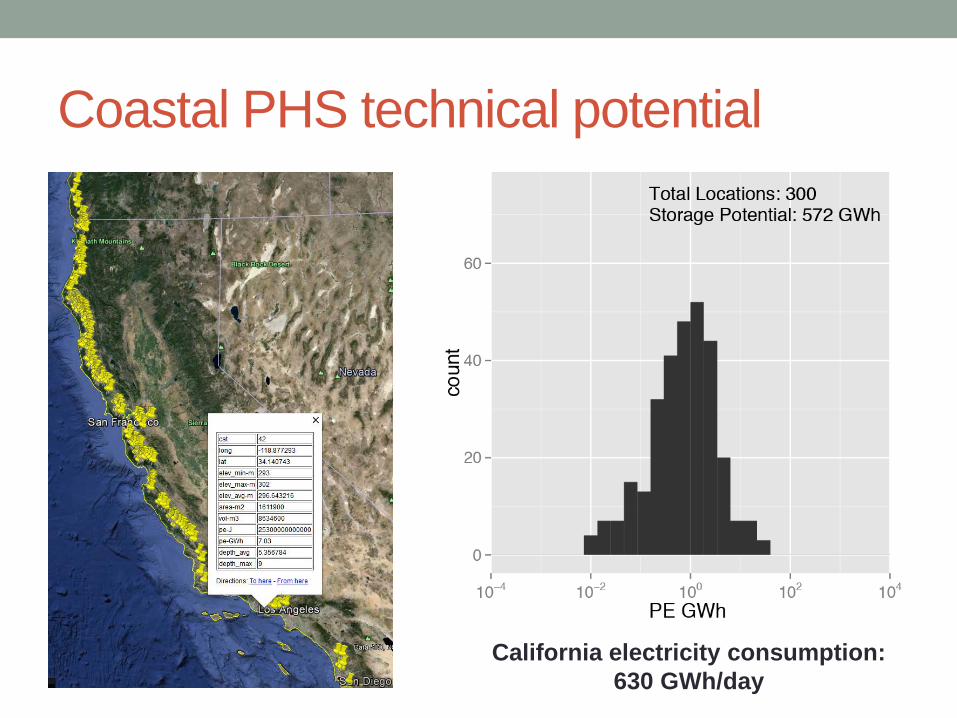
Coastal PHS technical potential
California electricity consumption: 630 GWh/day
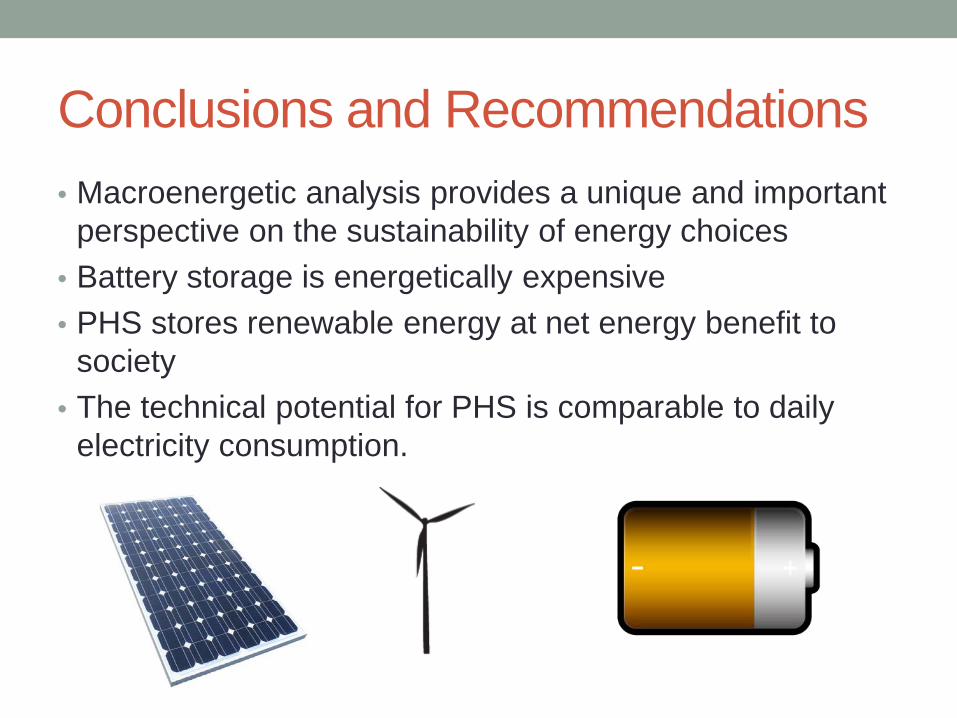
Conclusions and Recommendations • Macroenergetic analysis provides a unique and important
perspective on the sustainability of energy choices • Battery storage is energetically expensive • PHS stores renewable energy at net energy benefit to
society • The technical potential for PHS is comparable to daily
electricity consumption.
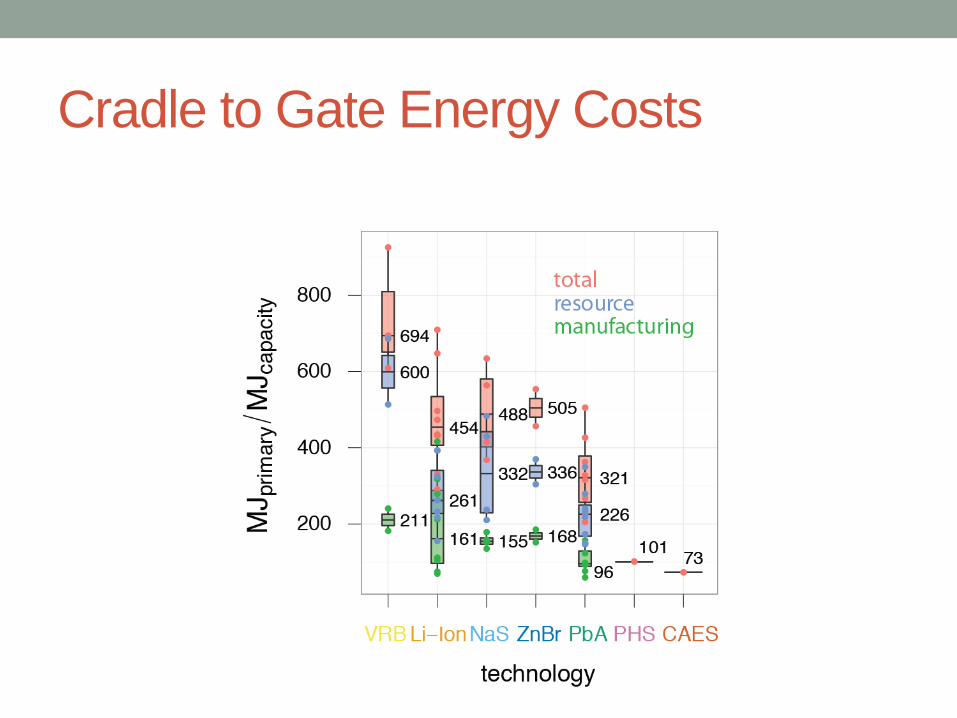
Cradle to Gate Energy Costs
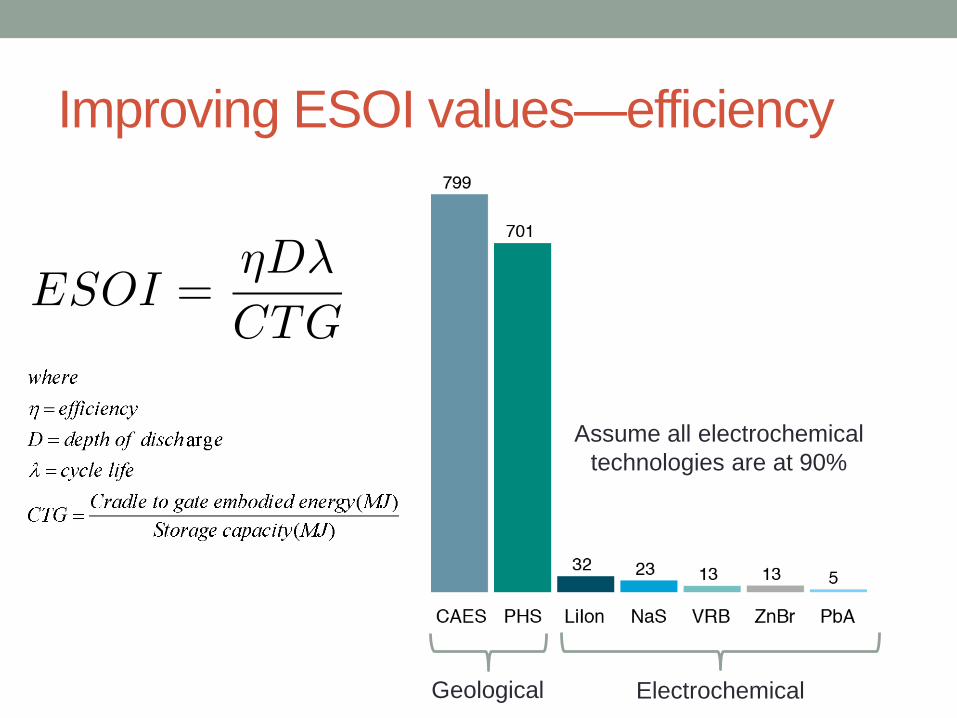
Improving ESOI values—efficiency
Geological Electrochemical
Assume all electrochemical technologies are at 90%
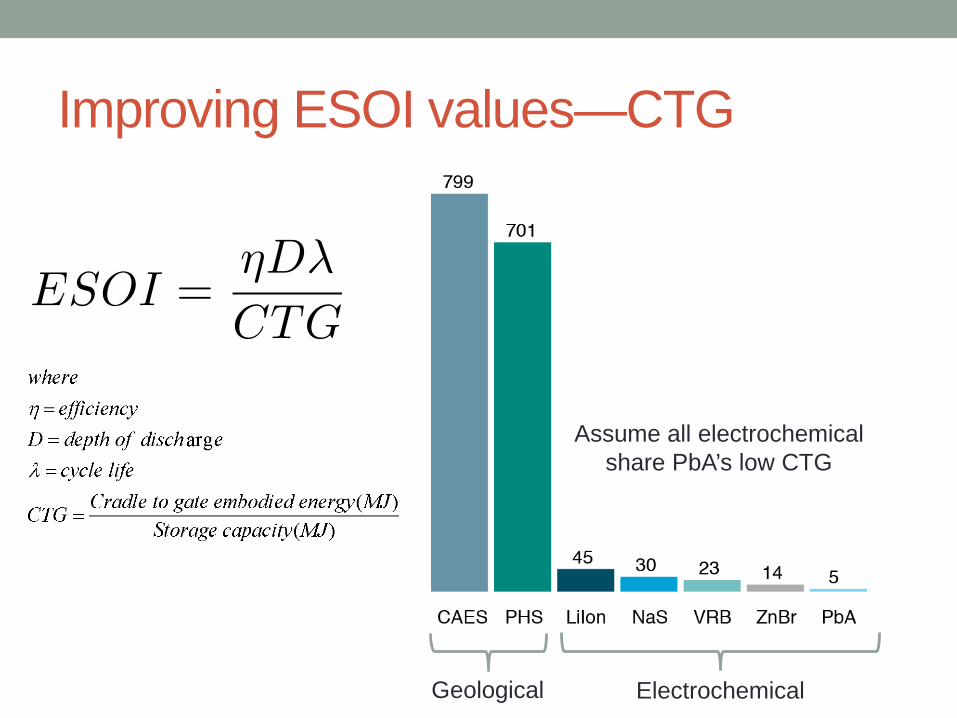
Improving ESOI values—CTG
Geological Electrochemical
Assume all electrochemical share PbA’s low CTG
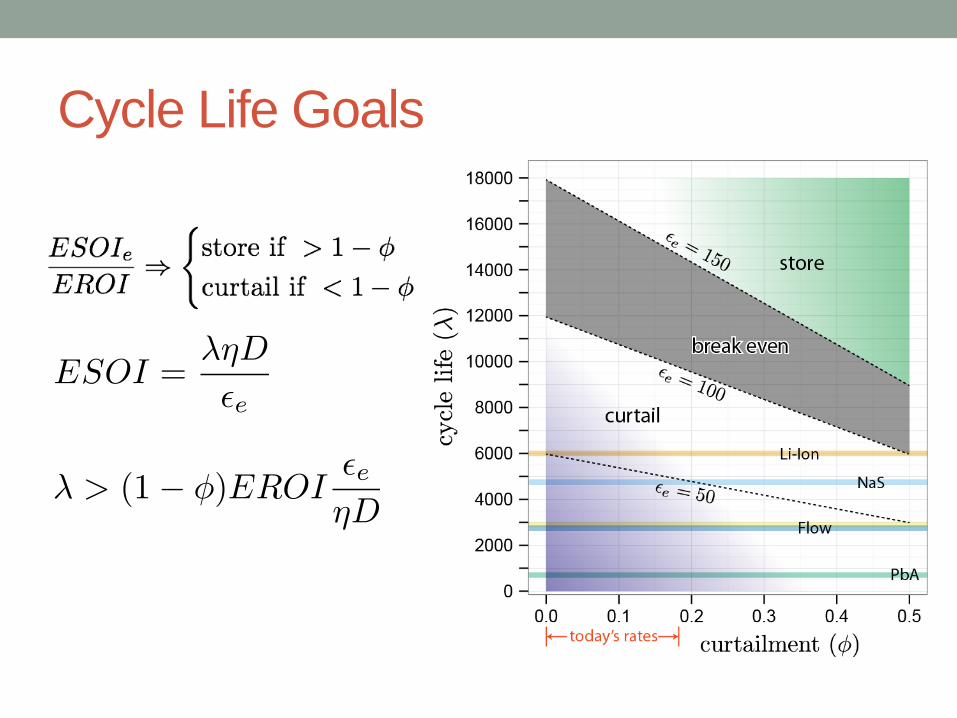
Cycle Life Goals
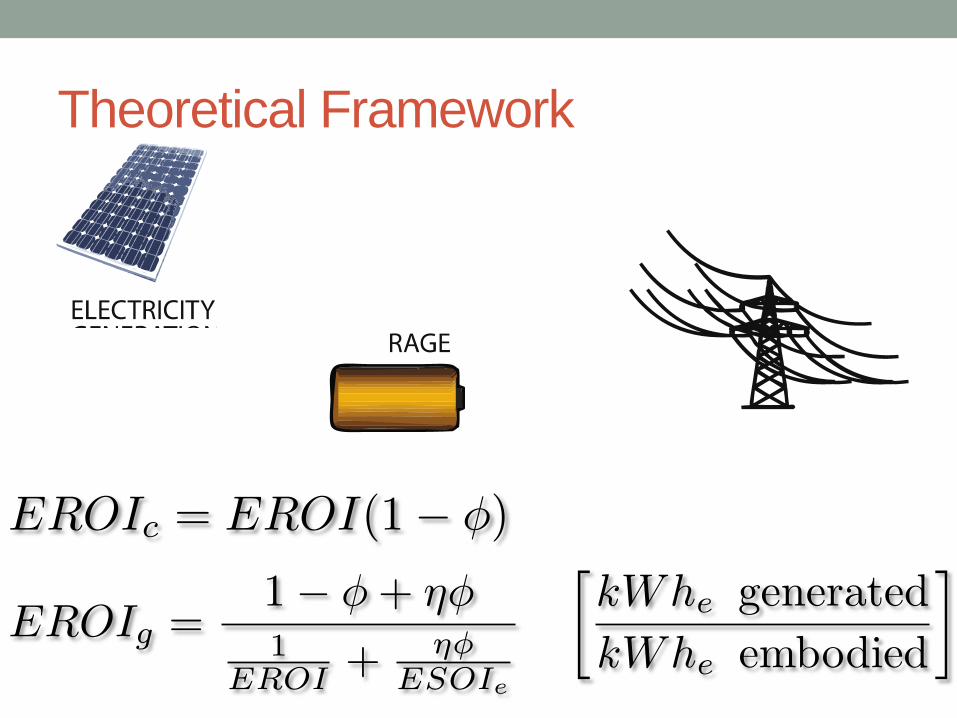
Theoretical Framework
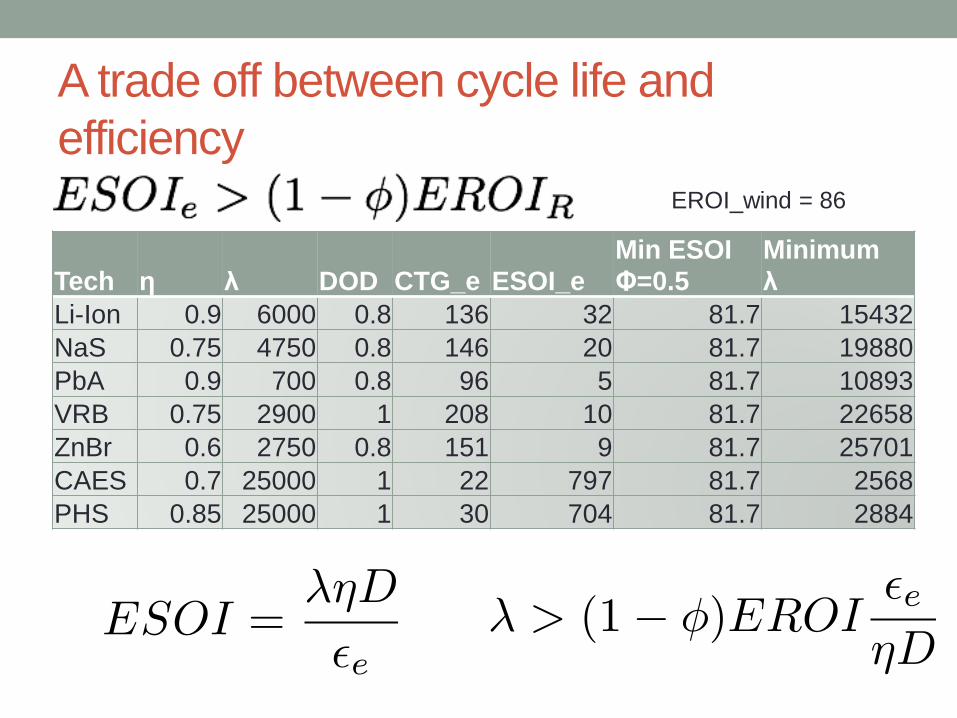
A trade off between cycle life and efficiency
Tech η λ DOD CTG_e ESOI_e Min ESOI Φ=0.5
Minimum λ
Li-Ion 0.9 6000 0.8 136 32 81.7 15432 NaS 0.75 4750 0.8 146 20 81.7 19880 PbA 0.9 700 0.8 96 5 81.7 10893 VRB 0.75 2900 1 208 10 81.7 22658 ZnBr 0.6 2750 0.8 151 9 81.7 25701 CAES 0.7 25000 1 22 797 81.7 2568 PHS 0.85 25000 1 30 704 81.7 2884
EROI_wind = 86

Topographic detection of PHS
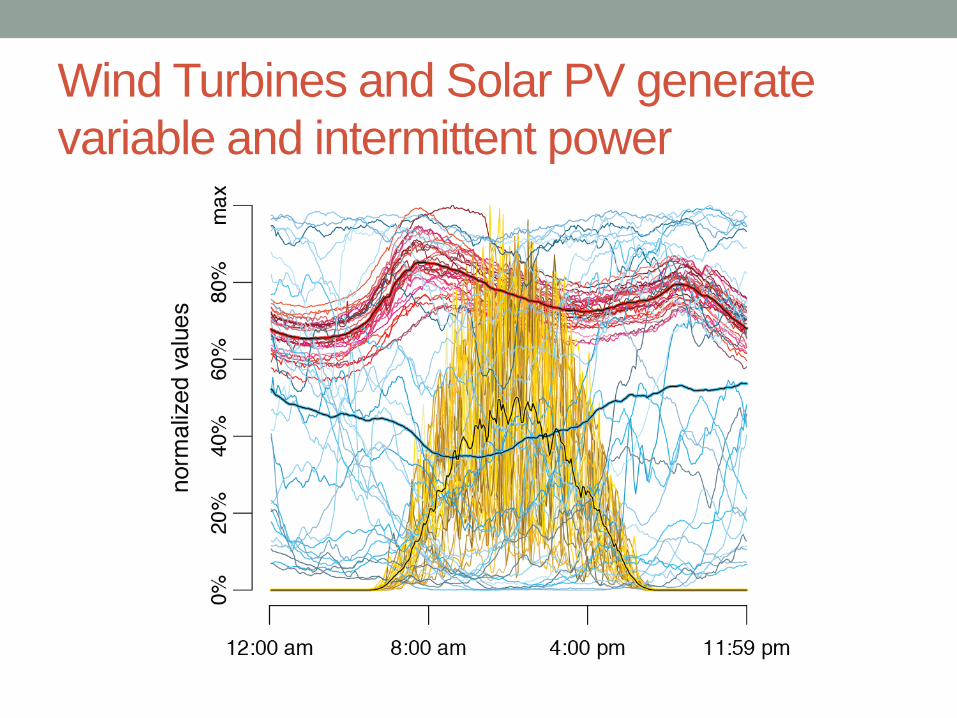
Wind Turbines and Solar PV generate variable and intermittent power
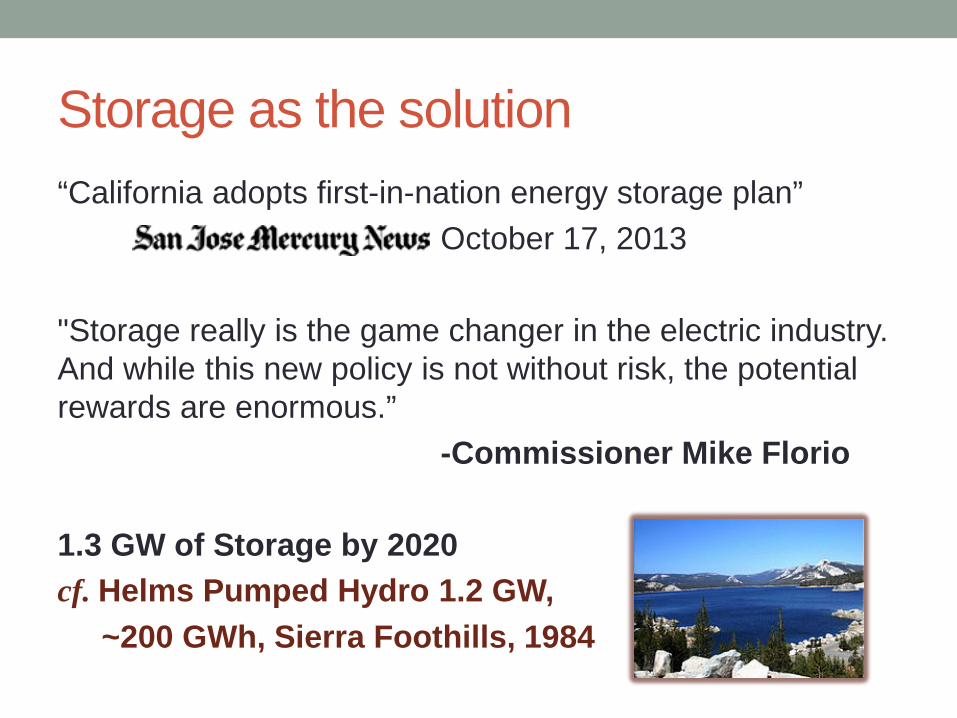
Storage as the solution “California adopts first-in-nation energy storage plan” October 17, 2013 "Storage really is the game changer in the electric industry. And while this new policy is not without risk, the potential rewards are enormous.” -Commissioner Mike Florio 1.3 GW of Storage by 2020 cf. Helms Pumped Hydro 1.2 GW, ~200 GWh, Sierra Foothills, 1984
Other options for grid flexibility
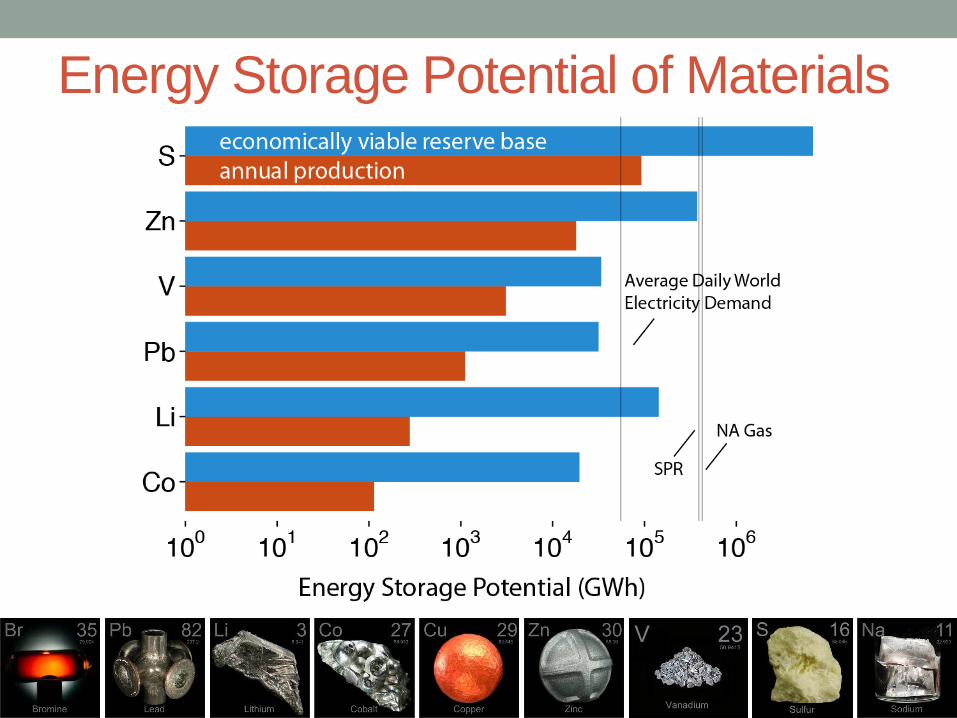
Energy Storage Potential of Materials
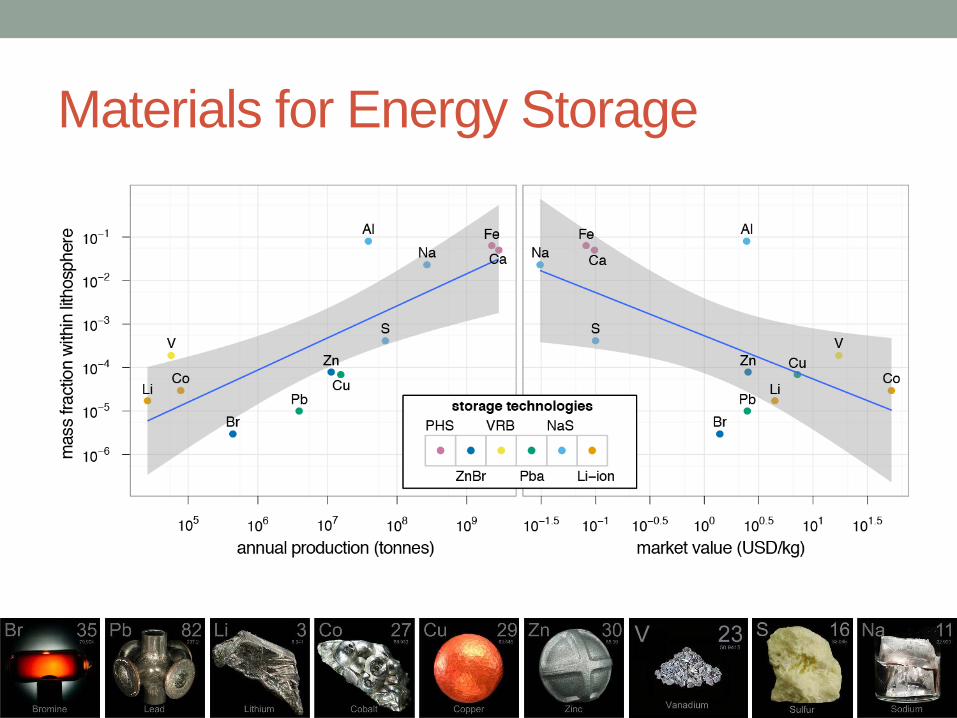
Materials for Energy Storage

Capital Cost of Storage Technologies
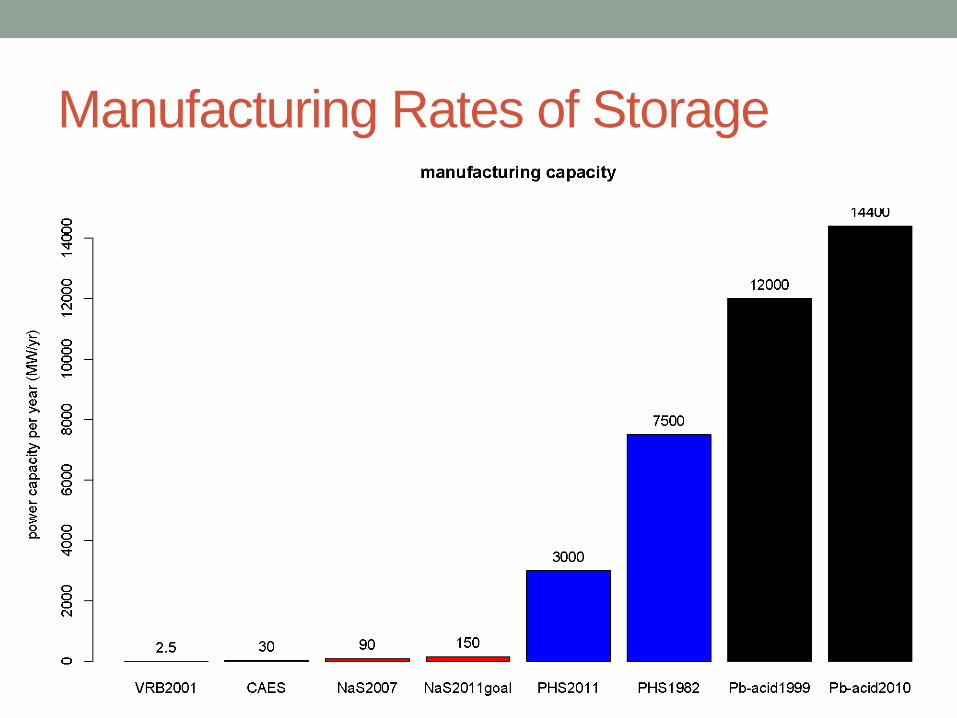
Manufacturing Rates of Storage
California Public Utilities Commission – Workshop on Pumped-storageScott Flake P.E., Director Power Generation and Project DevelopmentSacramento Municipal Utility District
January 16, 2013
Powering forward. Together.
Presentation Overview
1. Iowa Hill Project Overview
2. Project Benefits
3. Environmental and Community Issues
4. Financial and economic business cases
2
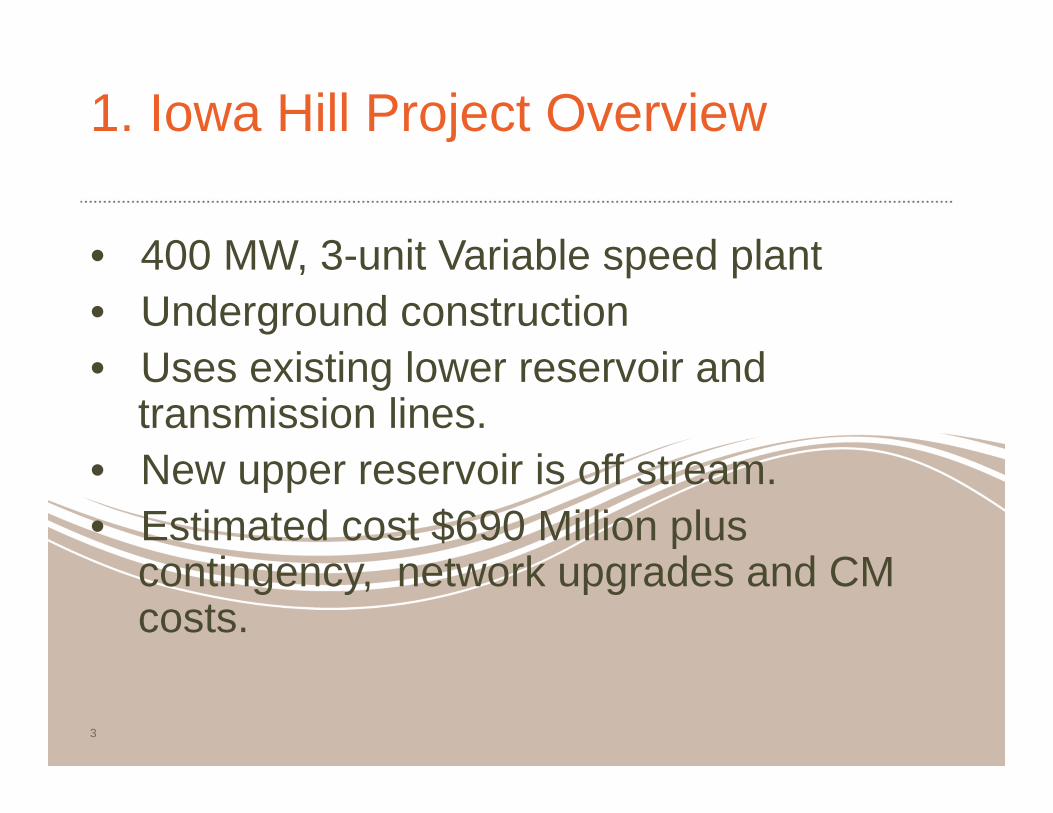
1. Iowa Hill Project Overview
• 400 MW, 3-unit Variable speed plant• Underground construction• Uses existing lower reservoir and
transmission lines.• New upper reservoir is off stream.• Estimated cost $690 Million plus
contingency, network upgrades and CM costs.
3
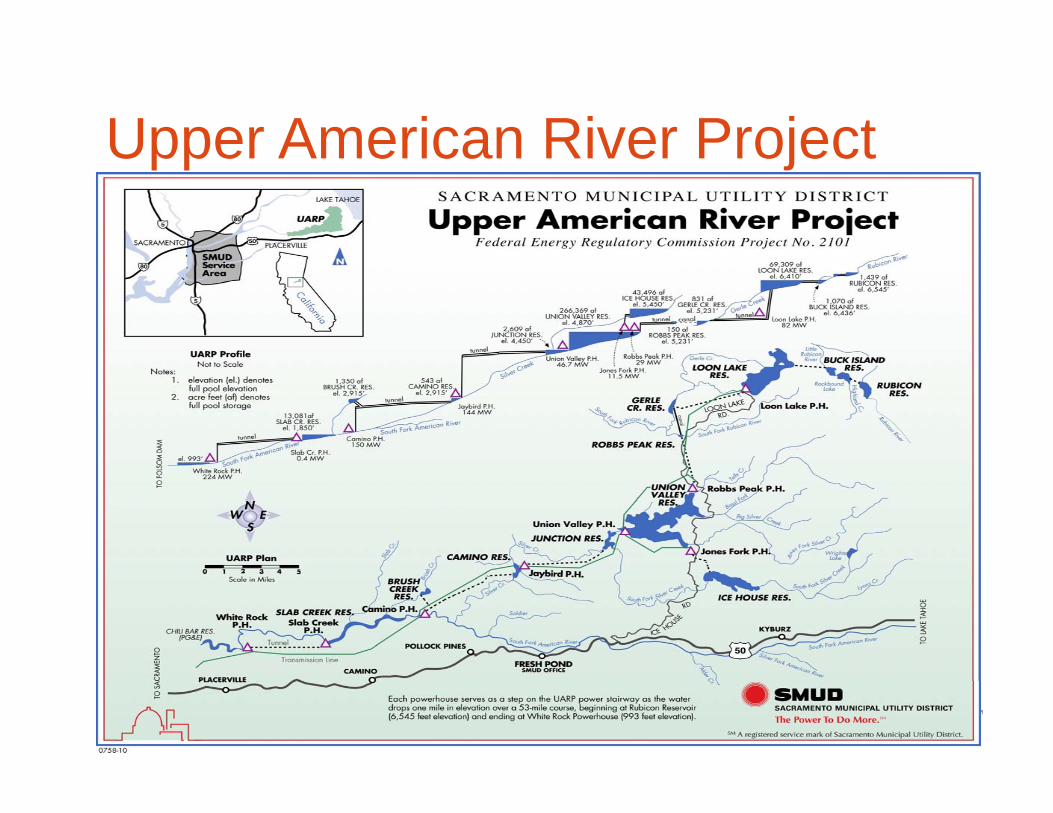
Upper American River Project
Why Iowa Hill?
• Pumped-storage provides large amounts of dispatchable capacity.
• Pumped-storage is a proven and reliable technology.
• Increased demand for dispatchable capacity is driven by intermittent resources (wind, solar) RPS and greenhouse gas legislation/regulation (reduced reliance on fossil fuels).
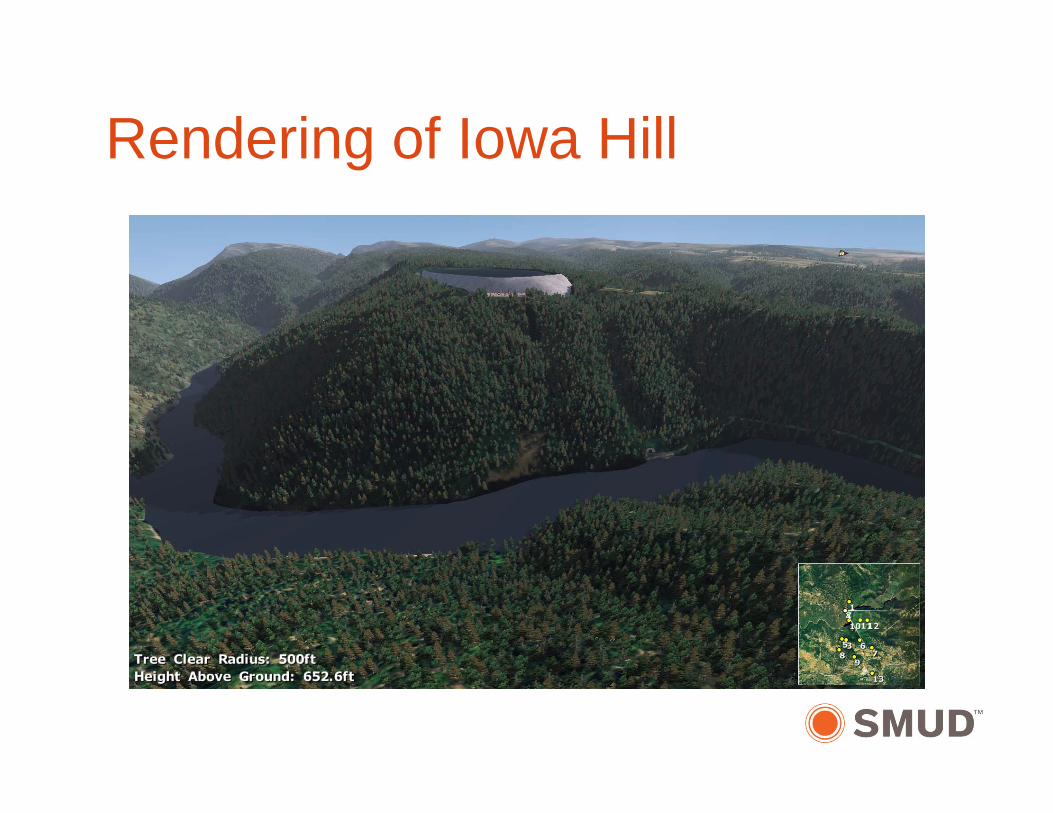
Rendering of Iowa Hill
2. Project Benefits• Iowa Hill is designed to support increasing variable
resources required by RPS regulation, with constraints on NG flexible capacity in a carbon constrained regulatory environment, while maintaining FERC/NERC grid reliability requirements.
• Provides dispatchable zero-GHG capacity and ancillary services.
• California examining GHG reduction goals beyond 2020 – target is 80% reduction
• SMUD has more aggressive goals for GHG reductions – 90% below 1990 levels by 2050.
Permitting Requirements
• FERC Licensing ($3M cost)• 401 Water Quality Certification• 404 Permit• Endangered Species Biological Opinion• Streambed Alteration Agreement• Special Use Permit(s)• Local Drilling Permits
3. Environmental and Community
• Proper siting is critical for all projects including closed loop projects.
• Some key aspects included in Iowa Hill design are:– No new dams on streams or waterways.– Use of existing facilities like the existing lower
reservoir at Slab Creek and the use of existing transmission lines.
– Commitment to a collaborative permitting process and extensive community outreach.
4. Financial and Economic Business cases• Economic business case evaluated on
market products. Payback is on the order of several decades.
• Market does not represent many of the products needed to “Keep the Lights On” –Flexible Capacity– Voltage control– Inertia– Frequency control, etc.
• Financial markets need certainty and long term contracts.
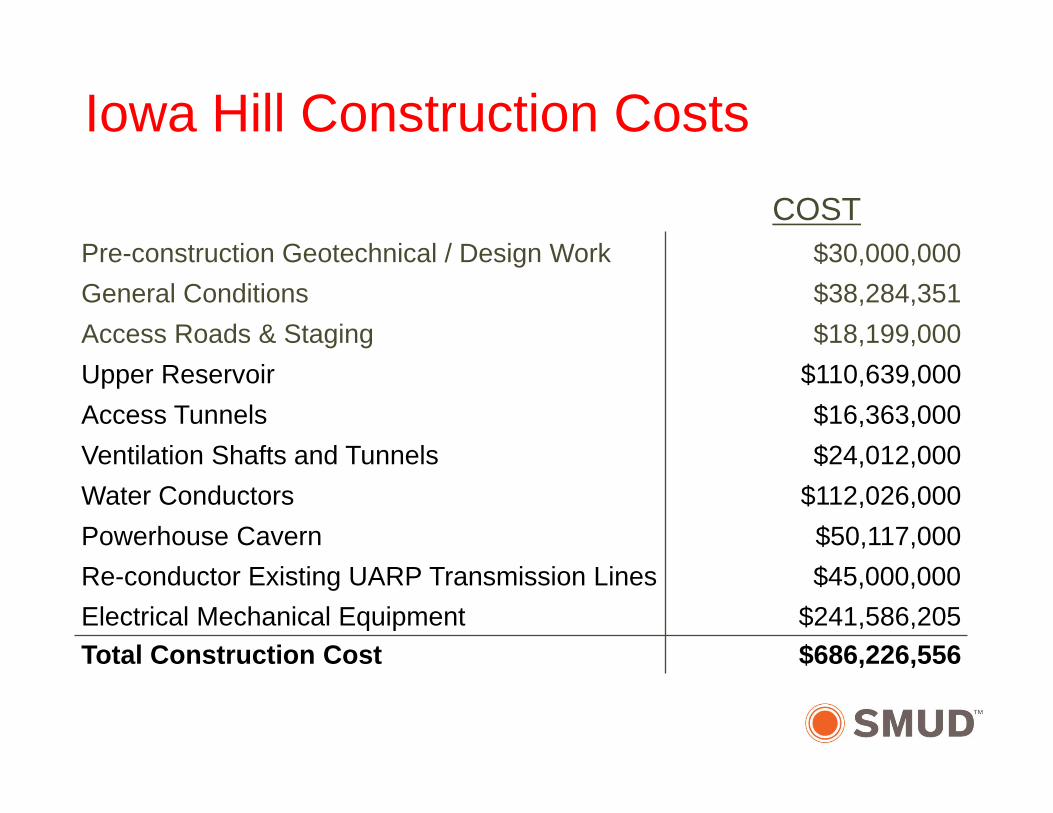
COSTPre-construction Geotechnical / Design Work $30,000,000General Conditions $38,284,351 Access Roads & Staging $18,199,000 Upper Reservoir $110,639,000 Access Tunnels $16,363,000 Ventilation Shafts and Tunnels $24,012,000 Water Conductors $112,026,000 Powerhouse Cavern $50,117,000 Re-conductor Existing UARP Transmission Lines $45,000,000Electrical Mechanical Equipment $241,586,205 Total Construction Cost $686,226,556
Iowa Hill Construction Costs
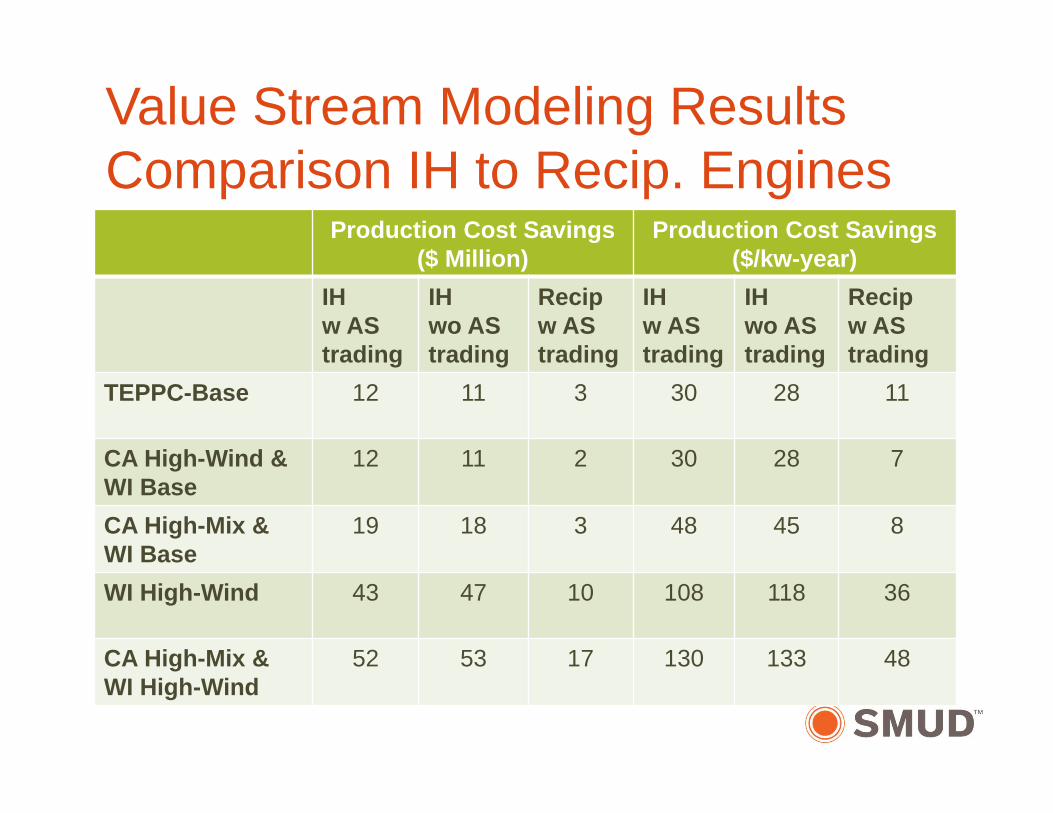
Value Stream Modeling ResultsComparison IH to Recip. Engines
Production Cost Savings($ Million)
Production Cost Savings($/kw-year)
IHw AS trading
IHwo AS trading
Recipw AS trading
IHw AStrading
IHwo AStrading
Recipw AStrading
TEPPC-Base 12 11 3 30 28 11
CA High-Wind &WI Base
12 11 2 30 28 7
CA High-Mix &WI Base
19 18 3 48 45 8
WI High-Wind 43 47 10 108 118 36
CA High-Mix & WI High-Wind
52 53 17 130 133 48
Other Benefits from Modeling
• Adjustable-speed turbines provide more benefits than fixed-speed turbines (65% more saving in High-Wind)
• Reduction in variable generation curtailment (valued up to $1.5M/year in SMUD BA and $35M/year in study area)
• Reduce reserve shortfall and increasing reliability• Reduce starts and ramping of thermal units• Improve UARP operating efficiency• Avoidance of new generation capacity• Significantly greater operational savings in dry water
years
SWAN LAKE PUMPED STORAGE PROJECT STATUS, SYSTEM BENEFITS AND BARRIERS
California Public Utilities Commission
Technical Workshop
San Francisco, CA
January 16, 2014
| |
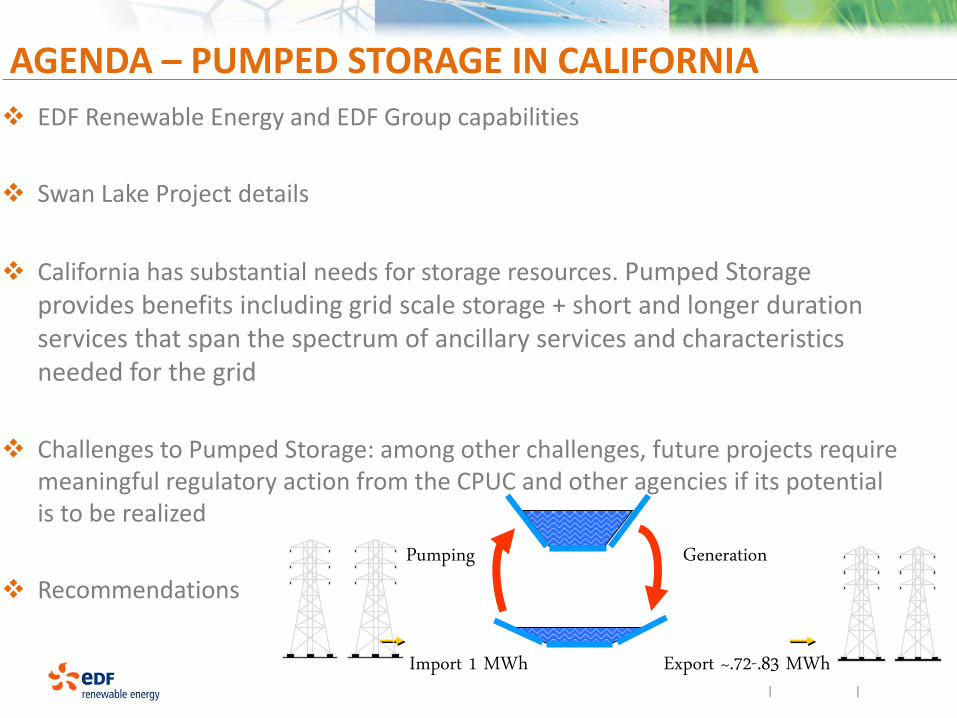
AGENDA – PUMPED STORAGE IN CALIFORNIA
EDF Renewable Energy and EDF Group capabilities
Swan Lake Project details
California has substantial needs for storage resources. Pumped Storage provides benefits including grid scale storage + short and longer duration services that span the spectrum of ancillary services and characteristics needed for the grid
Challenges to Pumped Storage: among other challenges, future projects require meaningful regulatory action from the CPUC and other agencies if its potential is to be realized
Recommendations
Import 1 MWh
Pumping Generation
Export ~.72-.83 MWh
| |
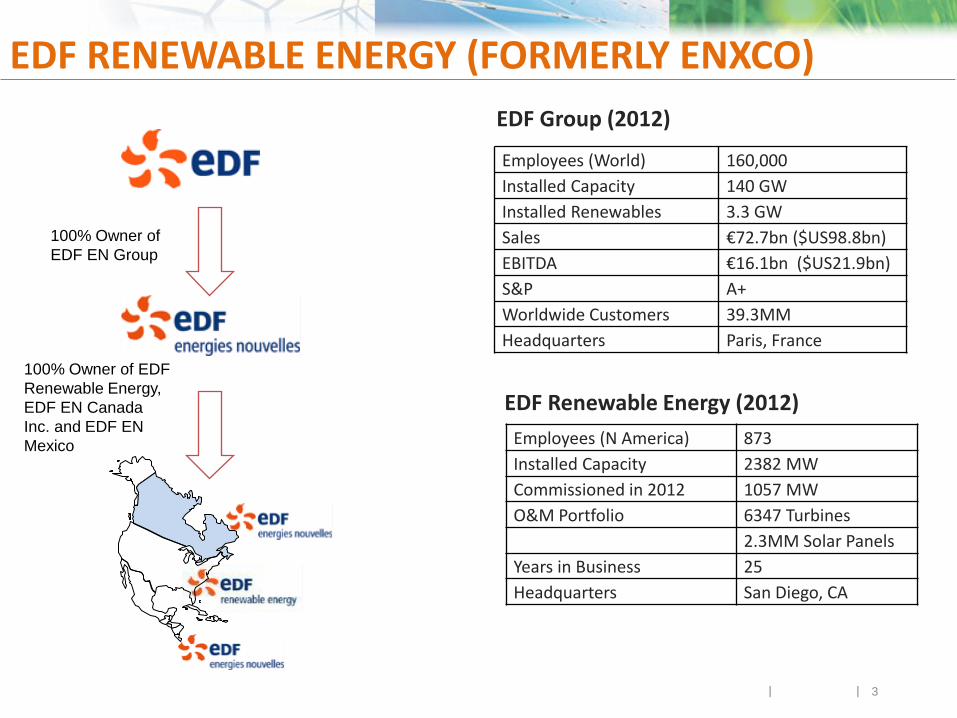
EDF RENEWABLE ENERGY (FORMERLY ENXCO)
Employees (N America) 873
Installed Capacity 2382 MW
Commissioned in 2012 1057 MW
O&M Portfolio 6347 Turbines
2.3MM Solar Panels
Years in Business 25
Headquarters San Diego, CA
EDF Renewable Energy (2012)
Employees (World) 160,000
Installed Capacity 140 GW
Installed Renewables 3.3 GW
Sales €72.7bn ($US98.8bn)
EBITDA €16.1bn ($US21.9bn)
S&P A+
Worldwide Customers 39.3MM
Headquarters Paris, France
EDF Group (2012)
3
100% Owner of
EDF EN Group
100% Owner of EDF
Renewable Energy,
EDF EN Canada
Inc. and EDF EN
Mexico
| |
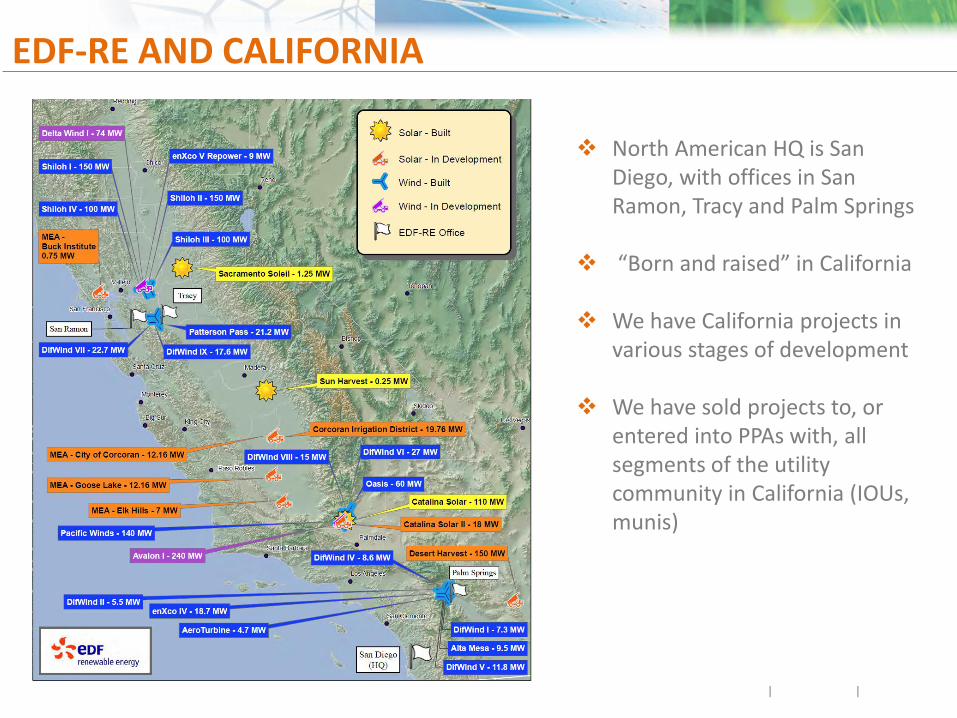
EDF-RE AND CALIFORNIA
North American HQ is San Diego, with offices in San Ramon, Tracy and Palm Springs
“Born and raised” in California We have California projects in
various stages of development We have sold projects to, or
entered into PPAs with, all segments of the utility community in California (IOUs, munis)
| |
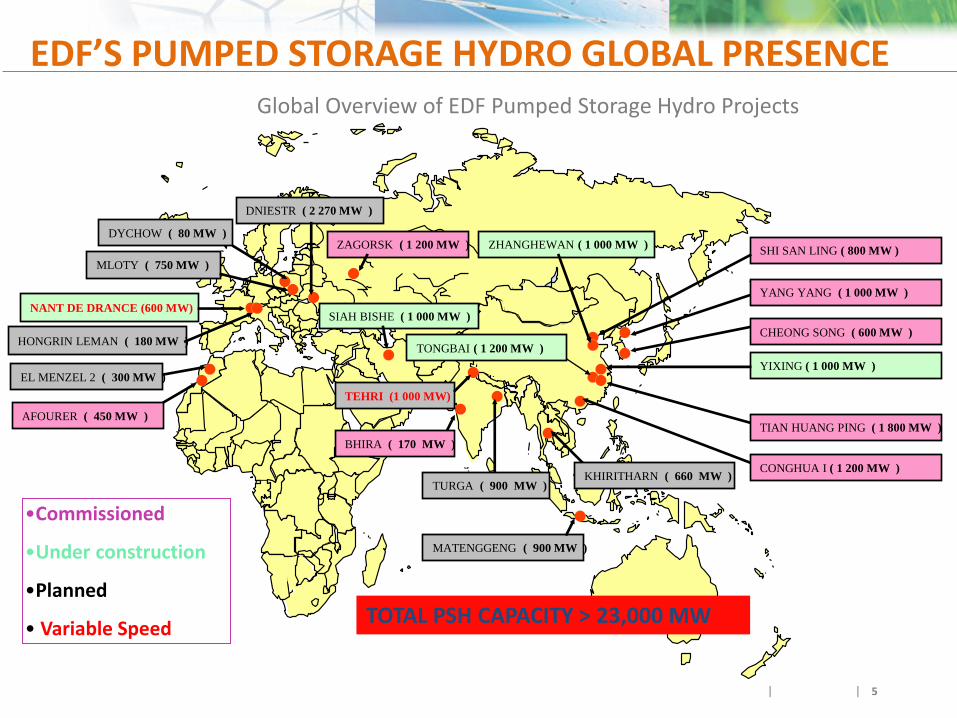
SHI SAN LING ( 800 MW ) ZHANGHEWAN ( 1 000 MW )
YIXING ( 1 000 MW )
TONGBAI ( 1 200 MW )
TIAN HUANG PING ( 1 800 MW )
CONGHUA I ( 1 200 MW )
BHIRA ( 170 MW )
TURGA ( 900 MW )
TEHRI (1 000 MW)
SIAH BISHE ( 1 000 MW )
MATENGGENG ( 900 MW )
CHEONG SONG ( 600 MW )
YANG YANG ( 1 000 MW )
MLOTY ( 750 MW )
DYCHOW ( 80 MW ) ZAGORSK ( 1 200 MW )
DNIESTR ( 2 270 MW )
KHIRITHARN ( 660 MW )
AFOURER ( 450 MW )
EL MENZEL 2 ( 300 MW )
NANT DE DRANCE (600 MW)
HONGRIN LEMAN ( 180 MW )
TOTAL PSH CAPACITY > 23,000 MW
•Commissioned
•Under construction
•Planned
• Variable Speed
EDF’S PUMPED STORAGE HYDRO GLOBAL PRESENCE Global Overview of EDF Pumped Storage Hydro Projects
5
| | 6
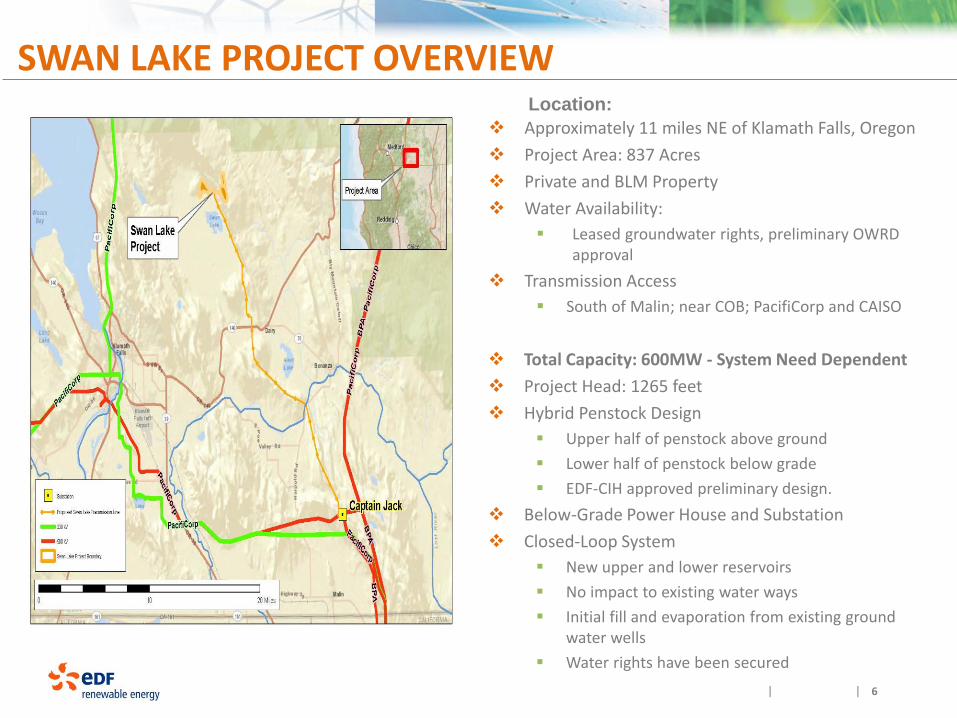
SWAN LAKE PROJECT OVERVIEW
Approximately 11 miles NE of Klamath Falls, Oregon
Project Area: 837 Acres
Private and BLM Property
Water Availability:
Leased groundwater rights, preliminary OWRD approval
Transmission Access
South of Malin; near COB; PacifiCorp and CAISO
Location:
Total Capacity: 600MW - System Need Dependent
Project Head: 1265 feet
Hybrid Penstock Design
Upper half of penstock above ground
Lower half of penstock below grade
EDF-CIH approved preliminary design.
Below-Grade Power House and Substation
Closed-Loop System
New upper and lower reservoirs
No impact to existing water ways
Initial fill and evaporation from existing ground water wells
Water rights have been secured
| |
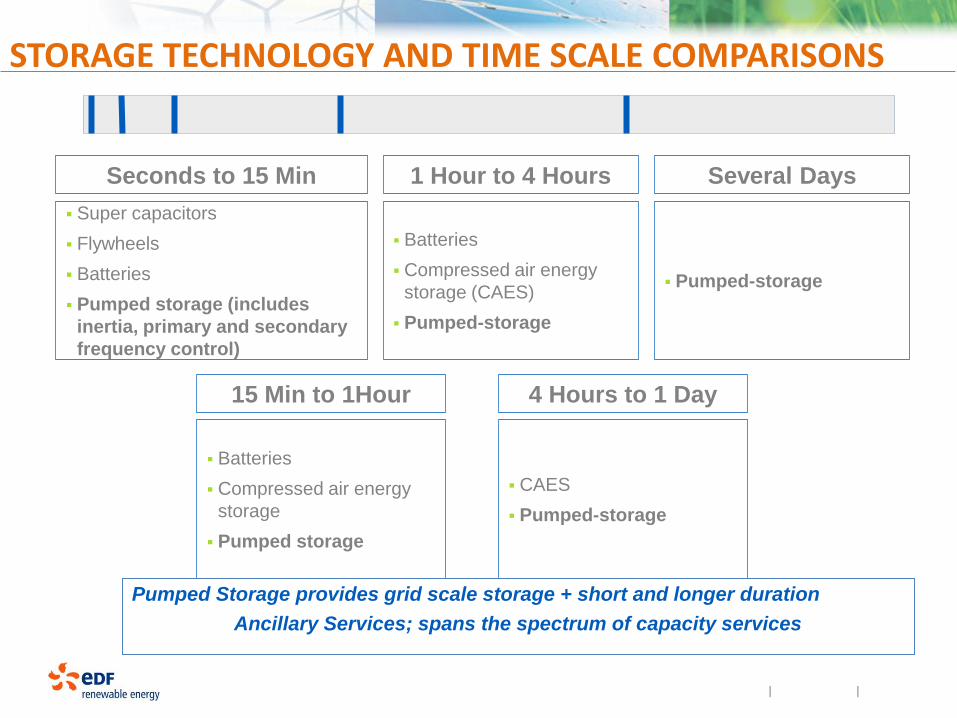
STORAGE TECHNOLOGY AND TIME SCALE COMPARISONS
Seconds to 15 Min
Super capacitors
Flywheels
Batteries
Pumped storage (includes
inertia, primary and secondary
frequency control)
15 Min to 1Hour
Batteries
Compressed air energy
storage
Pumped storage
1 Hour to 4 Hours
Batteries
Compressed air energy
storage (CAES)
Pumped-storage
4 Hours to 1 Day
CAES
Pumped-storage
Several Days
Pumped-storage
Pumped Storage provides grid scale storage + short and longer duration
Ancillary Services; spans the spectrum of capacity services
| |
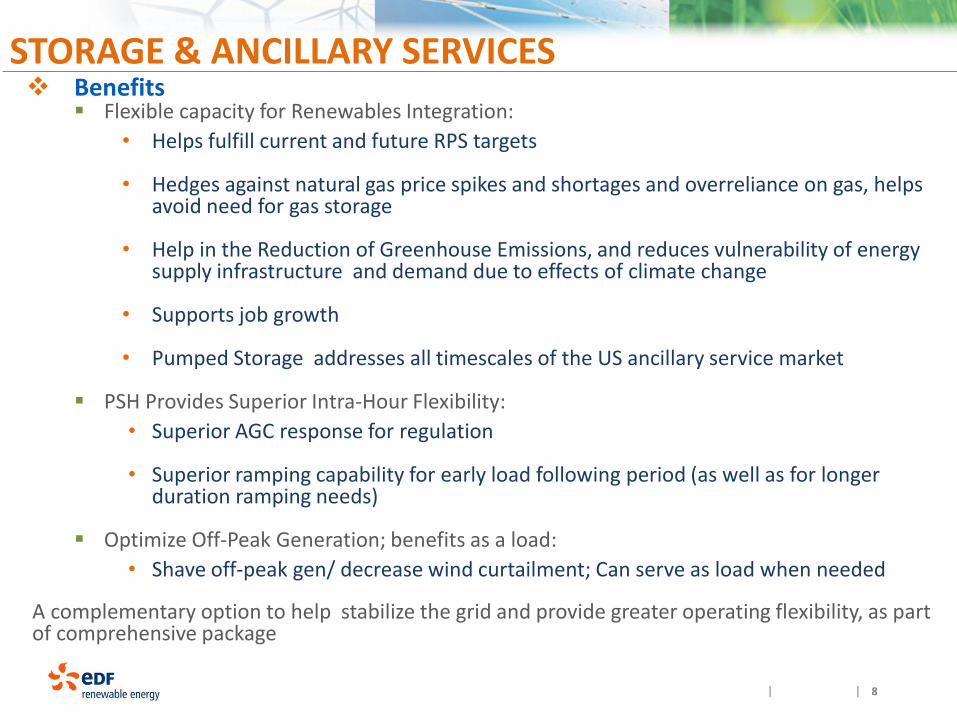
STORAGE & ANCILLARY SERVICES Benefits
Flexible capacity for Renewables Integration:
• Helps fulfill current and future RPS targets
• Hedges against natural gas price spikes and shortages and overreliance on gas, helps avoid need for gas storage
• Help in the Reduction of Greenhouse Emissions, and reduces vulnerability of energy supply infrastructure and demand due to effects of climate change
• Supports job growth
• Pumped Storage addresses all timescales of the US ancillary service market
PSH Provides Superior Intra-Hour Flexibility:
• Superior AGC response for regulation
• Superior ramping capability for early load following period (as well as for longer duration ramping needs)
Optimize Off-Peak Generation; benefits as a load:
• Shave off-peak gen/ decrease wind curtailment; Can serve as load when needed
A complementary option to help stabilize the grid and provide greater operating flexibility, as part of comprehensive package
8
| |
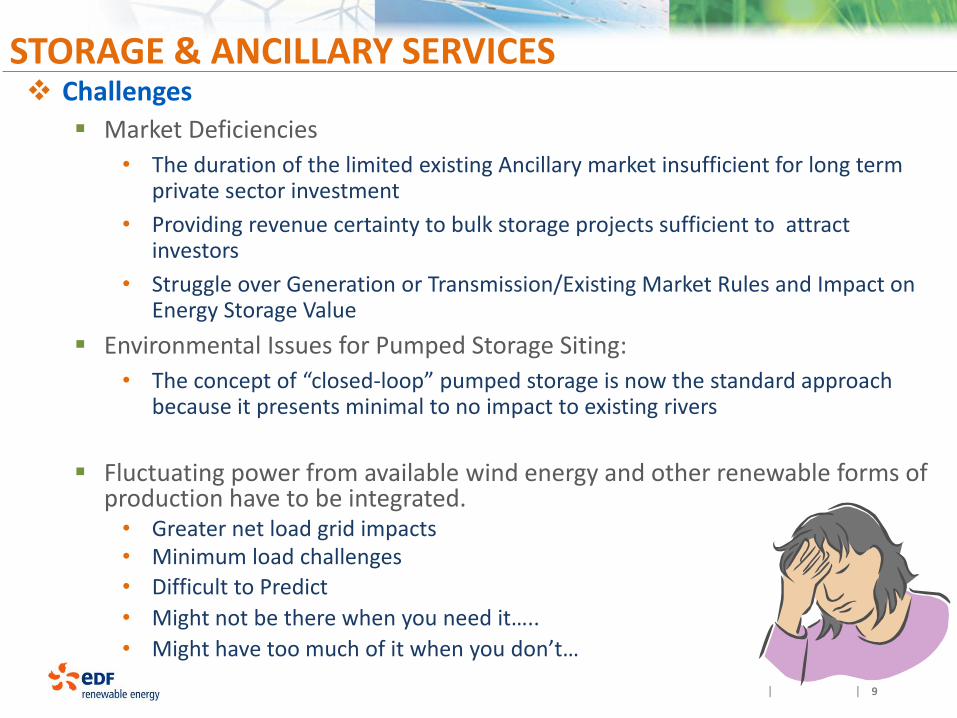
STORAGE & ANCILLARY SERVICES Challenges
Market Deficiencies
• The duration of the limited existing Ancillary market insufficient for long term private sector investment
• Providing revenue certainty to bulk storage projects sufficient to attract investors
• Struggle over Generation or Transmission/Existing Market Rules and Impact on Energy Storage Value
Environmental Issues for Pumped Storage Siting:
• The concept of “closed-loop” pumped storage is now the standard approach because it presents minimal to no impact to existing rivers
Fluctuating power from available wind energy and other renewable forms of production have to be integrated.
• Greater net load grid impacts • Minimum load challenges
• Difficult to Predict
• Might not be there when you need it…..
• Might have too much of it when you don’t…
9
| |
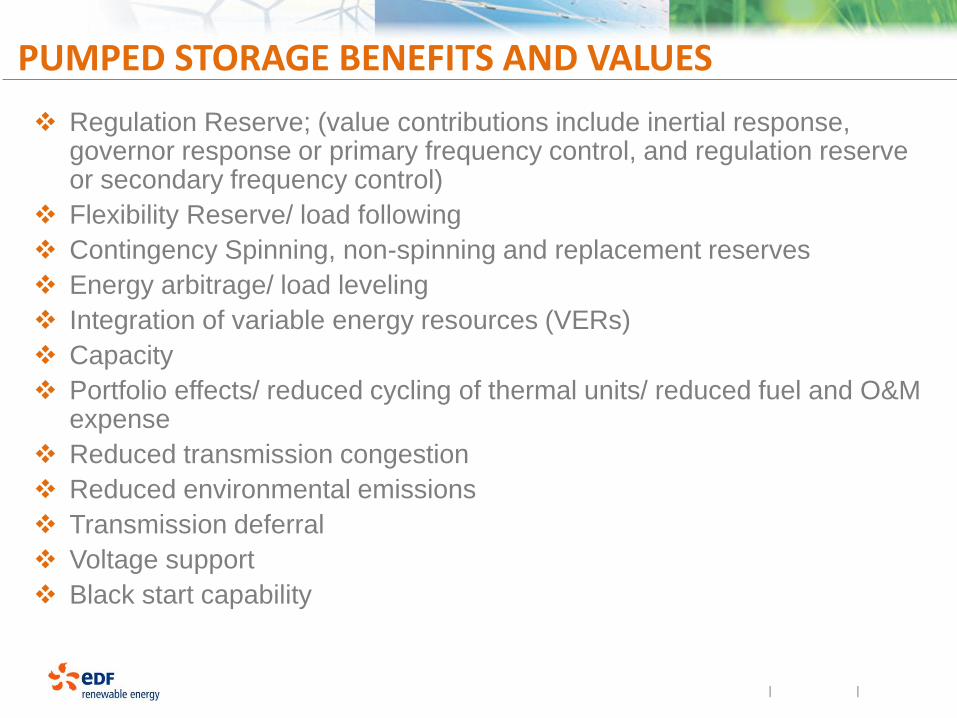
PUMPED STORAGE BENEFITS AND VALUES
Regulation Reserve; (value contributions include inertial response, governor response or primary frequency control, and regulation reserve or secondary frequency control)
Flexibility Reserve/ load following
Contingency Spinning, non-spinning and replacement reserves
Energy arbitrage/ load leveling
Integration of variable energy resources (VERs)
Capacity
Portfolio effects/ reduced cycling of thermal units/ reduced fuel and O&M expense
Reduced transmission congestion
Reduced environmental emissions
Transmission deferral
Voltage support
Black start capability
| |
EDF RE DETAIL PUMPED STORAGE MODELING Our Swan Lake project modeling is building on the approach used by Argonne National Laboratory, et
al.; we are identifying intra-hour values, portfolio values, avoiding renewable curtailment, other values so that what Pumped Storage contributes to the system in all material time frames is made clear.
Modeling the Western Interconnect and CAISO without and then with Swan Lake, using Plexos, a power system operation simulation software package by Energy Exemplar as described by ANL today.
Using 2022 as the future year for analysis, based primarily on the recent vintage 2022 WECC TEPPC data base, with careful assumption vetting.
Measuring Day Ahead (DA) and Hour Ahead (HA) measurement for all hours; Real Time (RT) 5 minute step measured for 4 typical weeks for 4 seasons, but evaluating doing for 12 typical weeks for 12 months.
Diversion from Argonne National Lab study approach:
Only base RE scenario studied (using all 2022 legal requirements in WI states); no high RE scenario All existing fixed speed Pumped Storage in base case; Swan Lake only variable speed Pumped Storage added SL direct interconnect into CAISO Nodal representation of transmission system in CA, OR,W, NV; rest of WI zonal Thermal start up costs will include not only fuel but also related incremental O&M (from Aptex) Assessing avoided GHG emissions value post-modeling Updating of TEPPC on retirements, topology, hydro system operation Additional case for head to head comparison with CCCT (600 MW @ California-Oregon Border) Adding high gas price case and low/high water year case
| |
UTILITY STORAGE RECOMMENDATIONS
Identify and measure value streams and compensate more of them.
Include intra-hour values and portfolio effects in value determination.
Focus on critical time parameters for effective integration of renewables: especially intra-hour; morning dec ramp; evening inc ramp.
Provide recognition of fast and accurate frequency regulation performance, as encouraged by FERC in order No 784, and corresponding premium incentive
Prorata with performance exceeding thermal fleet average.
Provide premium incentive for premium ramping capability
Compare PSH resource ramp speed with fleet average of resources committed HA.
Provide long term contract term availability for Pumped Storage as a preferred resource; 30 year term best.
Reward premium Pumped Storage performance over thermal fleet in time frames of particular significance to the system; i.e., intra-hour, morning dec ramp and early evening inc ramp.

| |
APPENDIX
| |
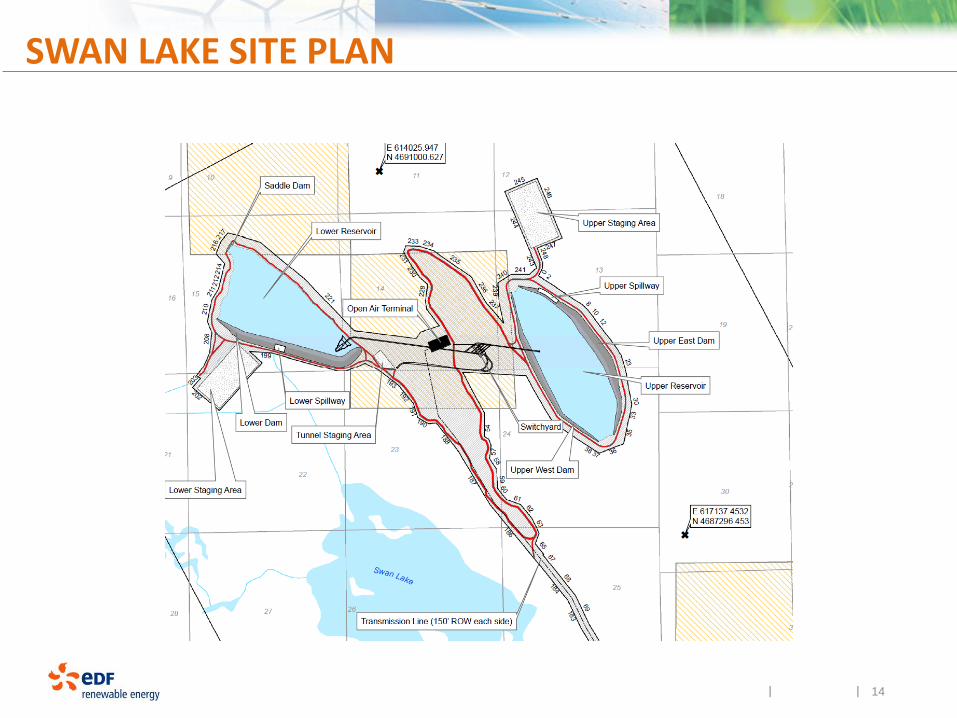
SWAN LAKE SITE PLAN
14
| |
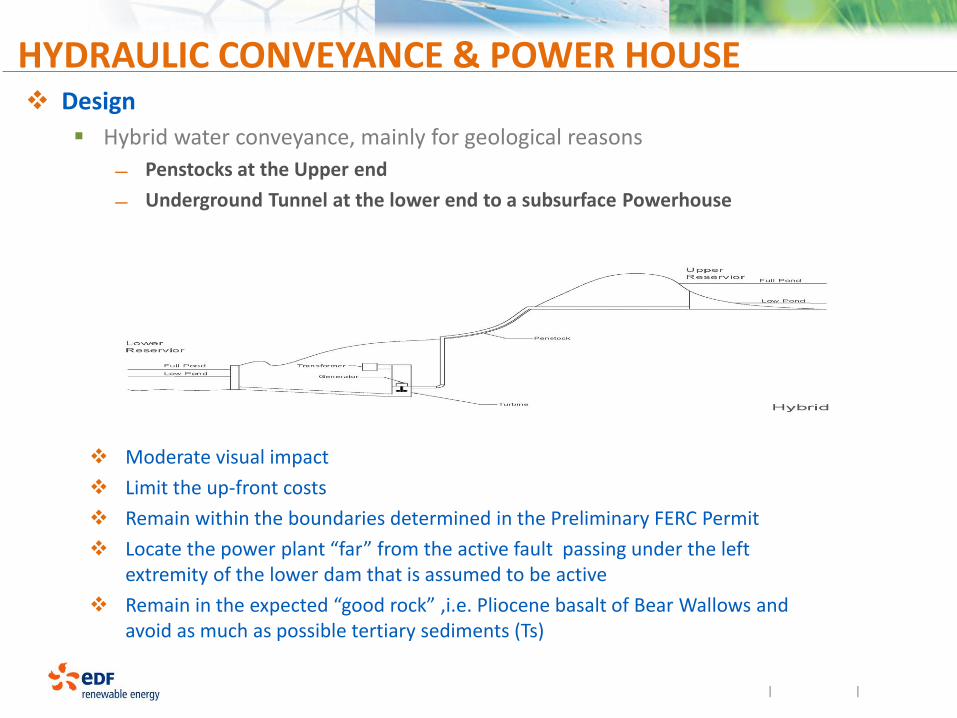
HYDRAULIC CONVEYANCE & POWER HOUSE Design
Hybrid water conveyance, mainly for geological reasons
Penstocks at the Upper end
Underground Tunnel at the lower end to a subsurface Powerhouse
Moderate visual impact
Limit the up-front costs
Remain within the boundaries determined in the Preliminary FERC Permit
Locate the power plant “far” from the active fault passing under the left extremity of the lower dam that is assumed to be active
Remain in the expected “good rock” ,i.e. Pliocene basalt of Bear Wallows and avoid as much as possible tertiary sediments (Ts)
| |
GEOPHYSICAL INVESTIGATION Swan Lake North will analyze and evaluate field data, test results and reporting to determine the
feasibility of the plant site with respect to the suitability of geophysical characteristics
Field Work for Phase 1 - Lower Reservoir - Initial Studies Complete 6 Standard Penetration Tests, ranging in depths from 35 to 65 feet 1 Core Borehole, 120 ft deep 3 Seismic Refraction Profiles , ranging in lengths from 4,211 to 6,246 feet
Objective:
Suitability of Soil – A bed of silt estimated to be up to 30 feet deep in places covers the lower reservoir floor. For some soils, potential for liquefaction to occur in the event of an earthquake. Determine depth of soils with liquifaction concern and potential for liquefaction. Initial results positive; limited to 1.5 meter shallow layer.
Evaluation of the impact of the lower escarpment fault on the primary dam and escarpment interface; pending.
Field Work for Phase 2 - Upper Reservoir, Conveyance, Shafts, Powerhouse - Pending
5 Core Boreholes, ranging in depths from 60 to 660 feet 2 Seismic Refraction Profiles at 1,981 and 6,246 feet in length
Suitable geophysical characteristics to support the Lower Reservoir will be a prerequisite for the
option to commence with Phase 2.
| |
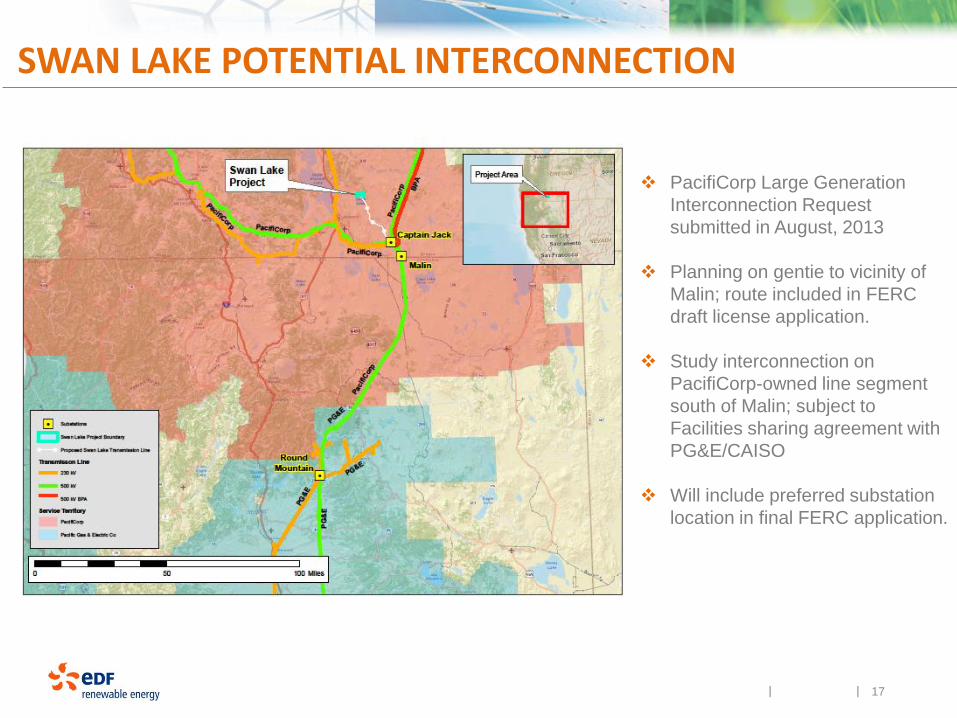
SWAN LAKE POTENTIAL INTERCONNECTION
17
PacifiCorp Large Generation
Interconnection Request
submitted in August, 2013
Planning on gentie to vicinity of
Malin; route included in FERC
draft license application.
Study interconnection on
PacifiCorp-owned line segment
south of Malin; subject to
Facilities sharing agreement with
PG&E/CAISO
Will include preferred substation
location in final FERC application.
| |
MODEL FEATURES- BIG PICTURE
Measures Benefits and Costs DA, HA, RT; adds intra-hour measurement down to 5 minute timing, captures intra-hour value.
Co-Optimizes Energy Arbitrage and Ancillary Services; evaluates Ops reserves (Reg and Flex up and down), Contingency Reserves (spin and non-spin), integration of Variable Energy Resources, capacity value, portfolio effects (e.g., reduced cycling and starts), to produce production cost reductions or AS revenue.
Captures almost all Ancillary Service benefits and portfolio effects (a couple of AS like voltage support and black start are not captured in the model but will be evaluated outside the model.)
Identifies congestion reduction, transmission deferrals, emissions reductions of SOx, NOx, CO2, other emissions, although not all are currently monetizable.
The goal is to identify and accurately quantify as many value streams as possible, and to identify which can be described as social benefits and targeted for potential policy change to support monetization.
| |
STORAGE WHITE PAPER
The purpose of the Storage White Paper is to provide a concise source for
information on the value of energy storage technologies and techniques
analysts use to quantify that value.
It is intended to accompany the Swan Lake modeling study and to provide a
summary of pertinent information and a guide to recent reports about storage,
as a tool for regulators and staff, intervening stakeholders and others who
may participate in regulatory proceedings in CA and/or the NW states, to
push forward a relatively high level discussion of storage attributes, benefits,
costs, challenges, and policy considerations, to improve recognition and
support of storage in the market.
The White Paper effort is being headed by Ken Dragoon of Ecofys, an
international sustainable energy consulting firm, with a very extensive
Advisory Panel including representatives of regional investor owned and
municipal utilities, PUC staffs, advocacy groups, Federal Laboratories,
universities, power councils and similar entities. (see appendix)
The White Paper is in draft process now, Goal is final draft by January 16,
final review and availability to follow up on January 16 CPUC workshop.

| |
WHITE PAPER ADVISORY PANEL
Advisory Panel Members:
Eddie Abadi – Bonneville Power Administration
Dick Adams – Pacific Northwest Utilities Conference Committee
Ellis Arzu - EDF Renewable Energy
Jamie Austin - Pacificorp
Mark Avery – Salt River Project
Frank Bergh – Nordex
Damian Buie - EDF Renewable Energy
Ronald Bushner - Hawaii Electric Company
Yong Cai – Sacramento Municipal Utility District
Gillian Charles – Northwest Power and Conservation Council
David Clement – Seattle City Light
Stephen Enyeart - Bonneville Power Administration
Erin Erben – Eugene Water & Electric Board
John Fazio - Northwest Power and Conservation Council
Christopher Fecke-Stoudt – K.R. Saline & Associates
Hassan Ghoujehbaklou – San Diego Gas & Electric
Michael Goggin – American Wind Energy Association
Adam Green – Solar Reserve
Tao Guo – Energy Exemplar
Douglas A. Halamay – Oregon State University
Udi Helman – BrightSource Energy
Alan Hickenbottom – Christianson Electric
Matthew Hunsaker – Western Electricity Coordinating Council
Steve Johnson – Washington Utilities and Transportation Commission
Rebecca Johnson – Western Interstate Energy Board
Brendan Kirby - Private Consultant
Ben Kujala - Northwest Power and Conservation Council
Larry La Bolle – Avista Corporation
Jimmy Lindsay – Renewable Northwest Project
Clyde Loutan – California ISO
Pavel Mardilovich – NRG Independence
Michael Milligan – National Renewable Energy Laboratory
Dora Nakafuji – Hawaii Electric Company
Rebecca O’Neil – Oregon Department of Energy
John Ollis – Portland General Electric
Rich Pagoaga, Jr. – Idaho Power Company
Leah Parks Schoinas – ElectricityPolicy.com
Glenn Patterson – Christianson Electric
Dana Peck - EDF Renewable Energy
Robert Petty - Bonneville Power Administration
Will Price - Eugene Water & Electric Board
Greg Probst - EDF Renewable Energy
Ron S. Sporseen – PK Energy Solutions
Ishwar Saini – Macquarie Group Limited
Steve Simmons - Northwest Power and Conservation Council
Andrew Speer - Bonneville Power Administration
Jun Wen – Southern California Edison
Keith White – California Public Utilities Commission
Cameron Yourkowsky - Renewable Northwest Project
Janice Zewe - Sacramento Municipal Utility District
Nan Zhang – Energy Exemplar
Carl Zichella – Natural Resources Defense Council
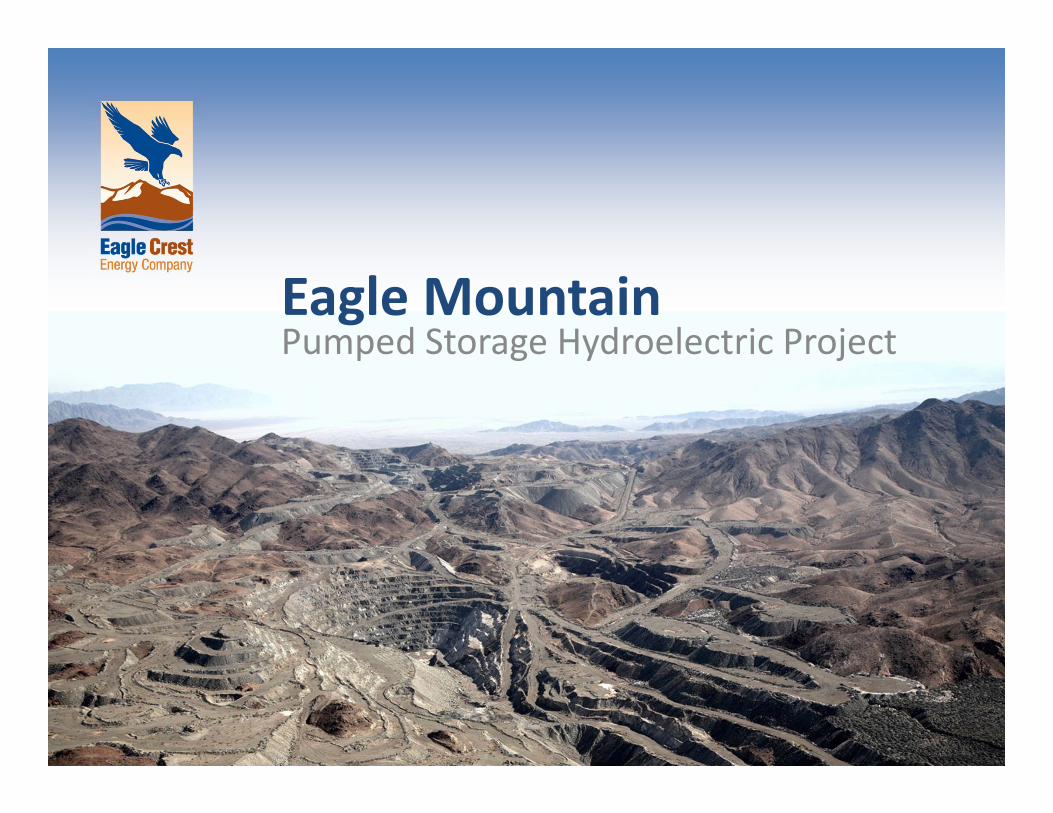
Eagle MountainPumped Storage Hydroelectric Project
Eagle Mountain Project
• Conventional, broadly used and proven technology
• Closed loop, off‐stream hydroelectric power project incorporating advanced and proven turbine and electronic control technologies which provide 1,300 MW of generating capacity
• Minimal water use and impact on water resources (unlike traditional hydroelectric development)
• Most local, state, and federal permits in hand ‐‐ expected to be fully permitted in early 2014
2
Eagle Mountain Project
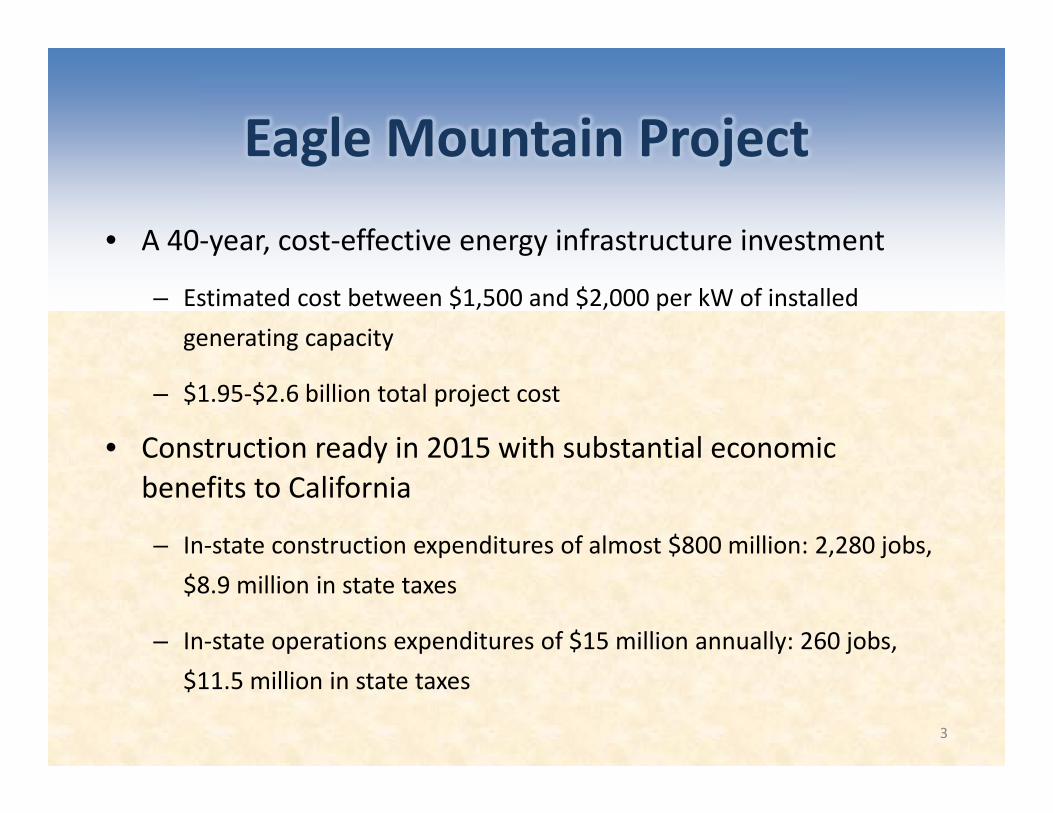
• A 40‐year, cost‐effective energy infrastructure investment
– Estimated cost between $1,500 and $2,000 per kW of installed generating capacity
– $1.95‐$2.6 billion total project cost
• Construction ready in 2015 with substantial economic benefits to California
– In‐state construction expenditures of almost $800 million: 2,280 jobs, $8.9 million in state taxes
– In‐state operations expenditures of $15 million annually: 260 jobs, $11.5 million in state taxes
3
California’s Energy Challenges
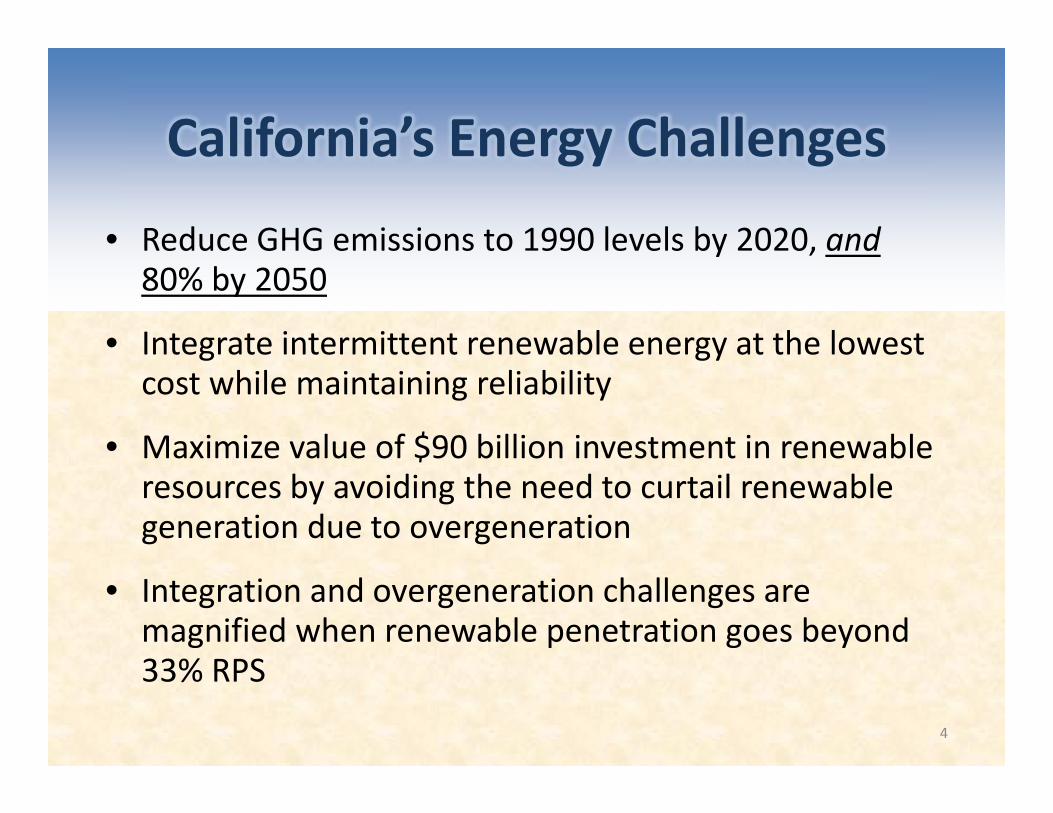
• Reduce GHG emissions to 1990 levels by 2020, and80% by 2050
• Integrate intermittent renewable energy at the lowest cost while maintaining reliability
• Maximize value of $90 billion investment in renewable resources by avoiding the need to curtail renewable generation due to overgeneration
• Integration and overgeneration challenges are magnified when renewable penetration goes beyond 33% RPS
4
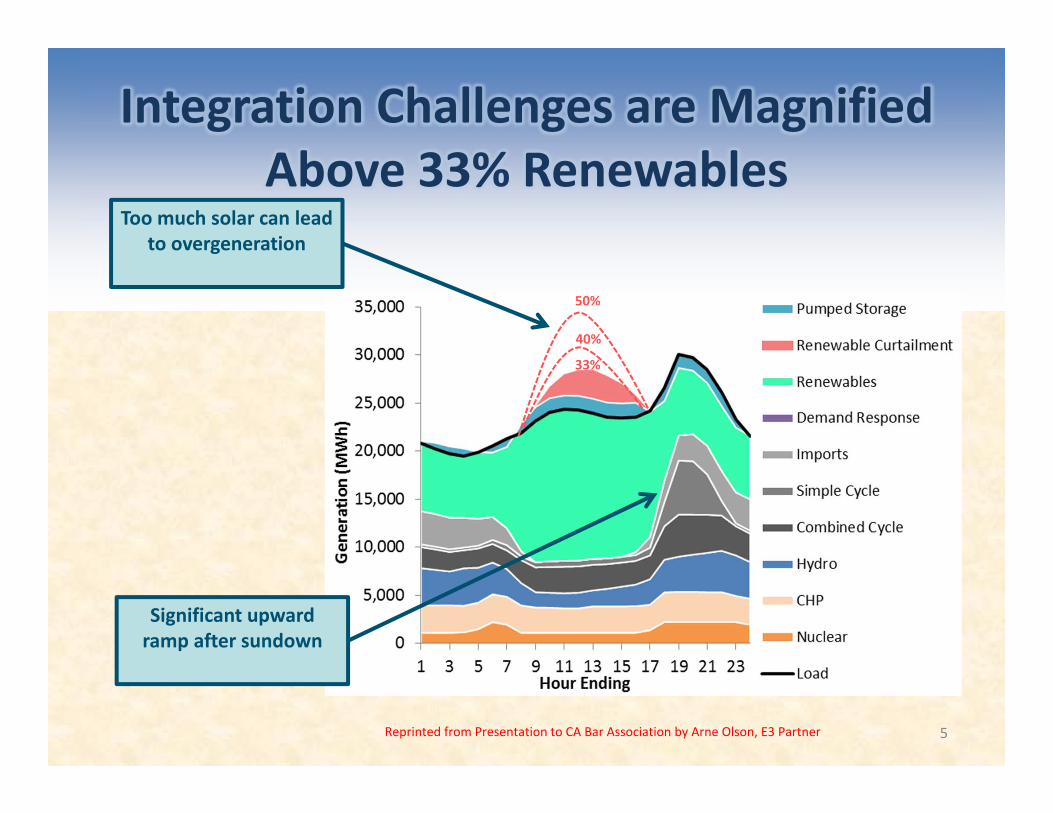
Integration Challenges are Magnified Above 33% Renewables
Too much solar can lead to overgeneration
Significant upward ramp after sundown
33%
40%
50%
Reprinted from Presentation to CA Bar Association by Arne Olson, E3 Partner 5
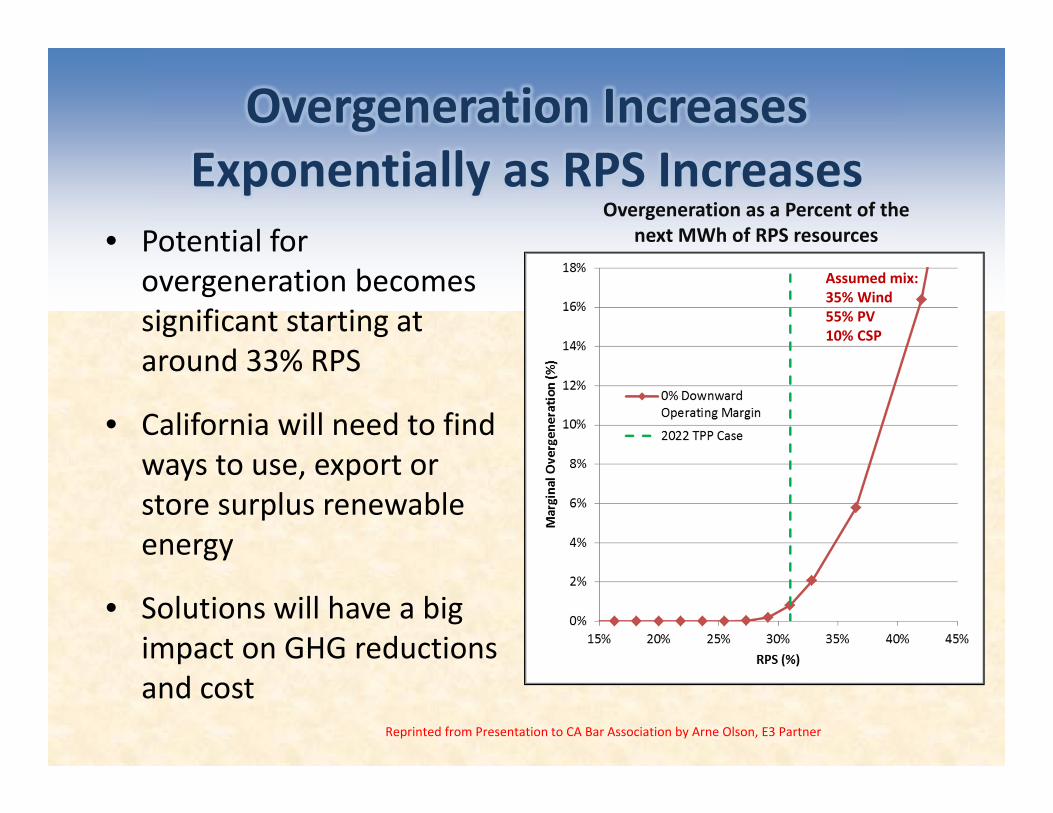
Overgeneration Increases Exponentially as RPS Increases
• Potential for overgeneration becomes significant starting at around 33% RPS
• California will need to find ways to use, export or store surplus renewable energy
• Solutions will have a big impact on GHG reductions and cost
Assumed mix: 35% Wind55% PV10% CSP
Overgeneration as a Percent of the next MWh of RPS resources
Reprinted from Presentation to CA Bar Association by Arne Olson, E3 Partner
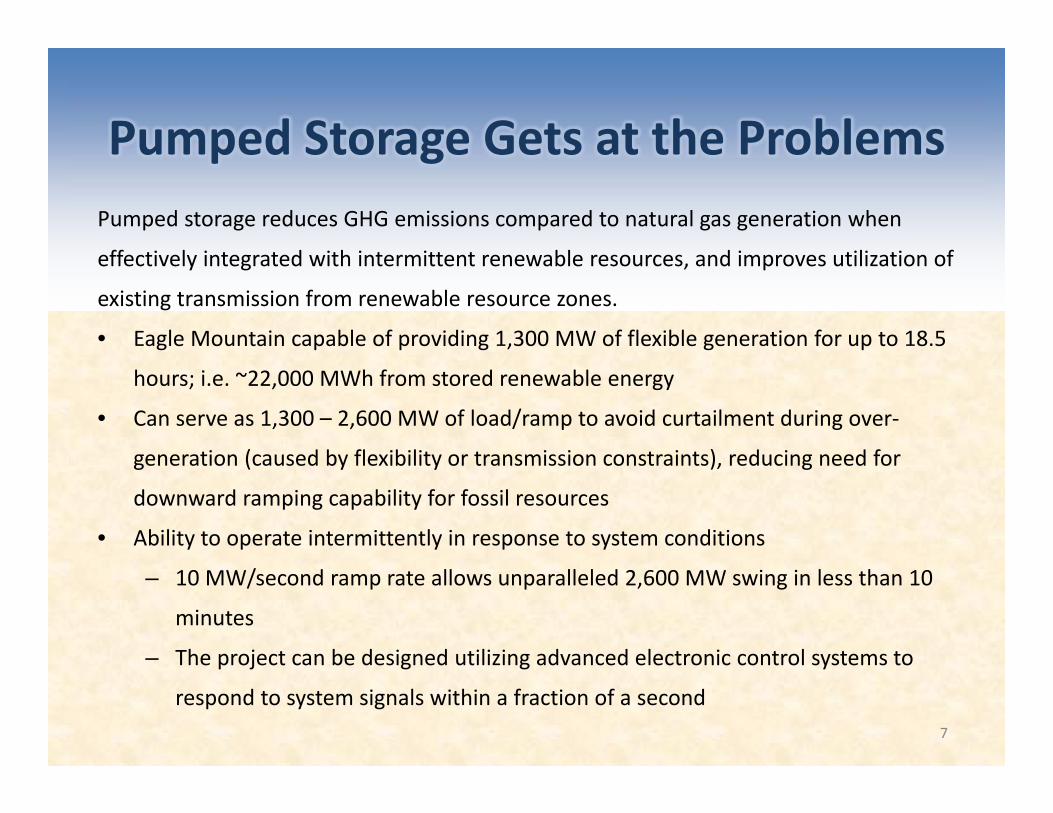
Pumped Storage Gets at the ProblemsPumped storage reduces GHG emissions compared to natural gas generation when
effectively integrated with intermittent renewable resources, and improves utilization of
existing transmission from renewable resource zones.
• Eagle Mountain capable of providing 1,300 MW of flexible generation for up to 18.5
hours; i.e. ~22,000 MWh from stored renewable energy
• Can serve as 1,300 – 2,600 MW of load/ramp to avoid curtailment during over‐
generation (caused by flexibility or transmission constraints), reducing need for
downward ramping capability for fossil resources
• Ability to operate intermittently in response to system conditions
– 10 MW/second ramp rate allows unparalleled 2,600 MW swing in less than 10
minutes
– The project can be designed utilizing advanced electronic control systems to
respond to system signals within a fraction of a second7
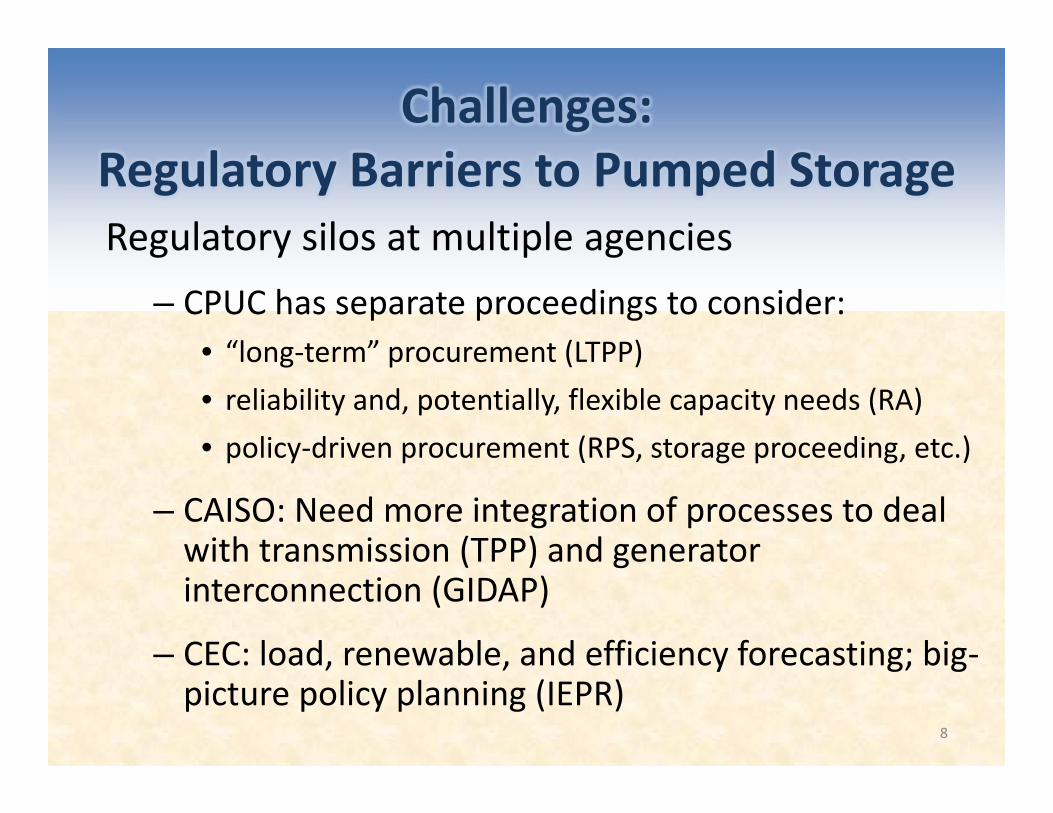
Challenges: Regulatory Barriers to Pumped StorageRegulatory silos at multiple agencies
– CPUC has separate proceedings to consider:• “long‐term” procurement (LTPP)• reliability and, potentially, flexible capacity needs (RA)• policy‐driven procurement (RPS, storage proceeding, etc.)
– CAISO: Need more integration of processes to deal with transmission (TPP) and generator interconnection (GIDAP)
– CEC: load, renewable, and efficiency forecasting; big‐picture policy planning (IEPR)
8
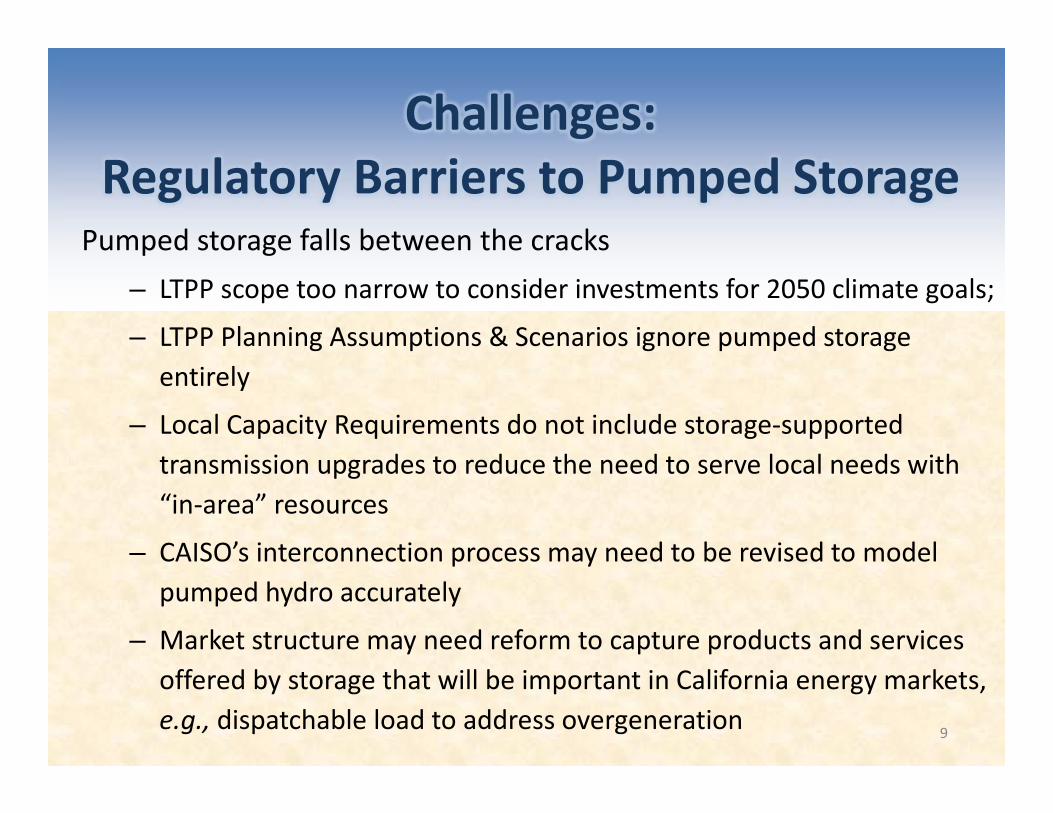
Challenges: Regulatory Barriers to Pumped Storage
Pumped storage falls between the cracks– LTPP scope too narrow to consider investments for 2050 climate goals;
– LTPP Planning Assumptions & Scenarios ignore pumped storage entirely
– Local Capacity Requirements do not include storage‐supported transmission upgrades to reduce the need to serve local needs with “in‐area” resources
– CAISO’s interconnection process may need to be revised to model pumped hydro accurately
– Market structure may need reform to capture products and services offered by storage that will be important in California energy markets, e.g., dispatchable load to address overgeneration 9
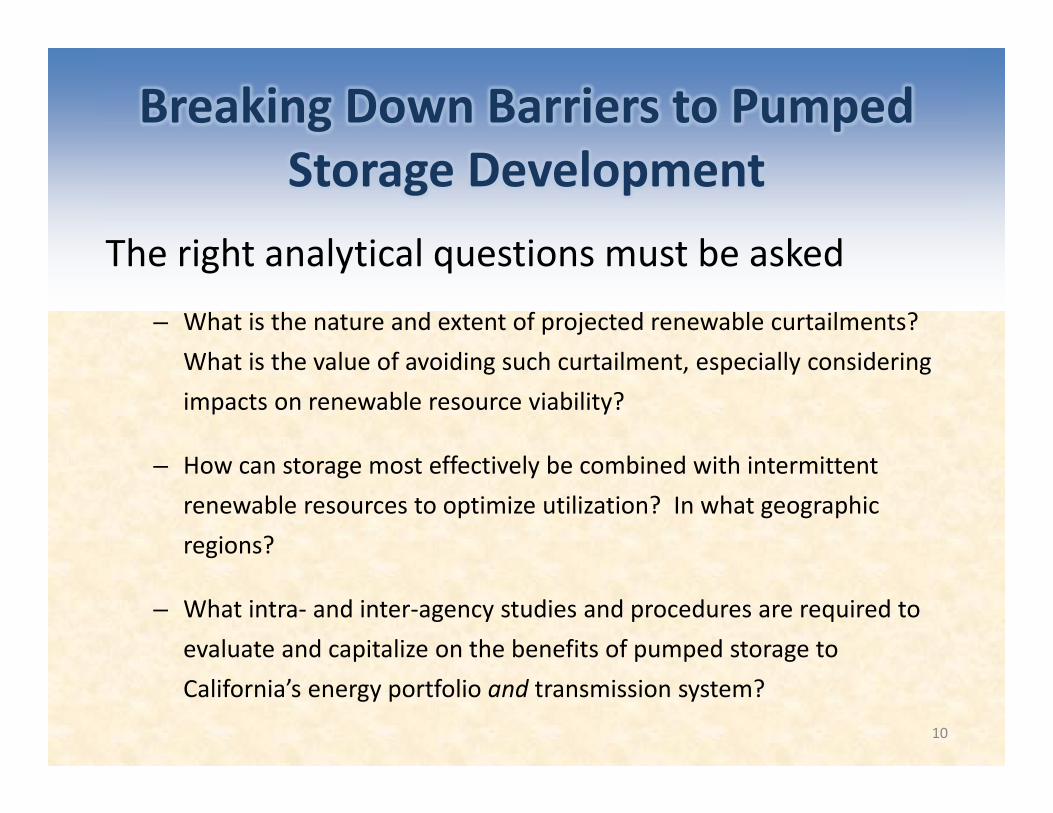
Breaking Down Barriers to Pumped Storage Development
The right analytical questions must be asked– What is the nature and extent of projected renewable curtailments?
What is the value of avoiding such curtailment, especially considering impacts on renewable resource viability?
– How can storage most effectively be combined with intermittent renewable resources to optimize utilization? In what geographic regions?
– What intra‐ and inter‐agency studies and procedures are required to evaluate and capitalize on the benefits of pumped storage to California’s energy portfolio and transmission system?
10
Breaking Down Barriers to Pumped Storage Development (cont’d)
The right models must be developed:
• CPUC should develop stochastic modeling tools which accurately evaluate the full complement of pumped storage projects’ potential benefits and evaluate the cost effectiveness of pumped storage projects over a 40‐year period.
• CPUC and CAISO should expand the time horizon out to which they model procurement and transmission needs –pumped storage facilities are necessary for the long term, not just “near term” 2020 needs.
11
Breaking Down Barriers to Pumped Storage Development (cont’d)
The models must be implemented:• Incorporate results into future LTPP and TPP processes, thus allowing cost‐effective pumped storage projects to be identified and built.
• Expand the preferred resource study to assess whether resources outside the basin combined with utility scale storage can significantly reduce the need for additional conventional generation in the basin.
• Incorporate pumped storage evaluation modeling into the CAISO interconnection process.
12
Eagle MountainPumped Storage Hydroelectric Project
For more information, contact:[email protected]
3000 Ocean Park Blvd. #1020Santa Monica, CA 90405Tel: (310) 450‐9090
www.eaglecrestenergy.com
Eagle Mountain Pumped Storage Project
APPENDIX 1REFERENCE MATERIALS
14

Resources Regarding Studying and Modeling Pumped Storage
• Energy+Environmental Economics (E3), “Investigating a Higher Renewables Portfolio Standard in California” (January 2013)
– Excerpt from Website: In an ambitious, forward‐looking study jointly sponsored by California's five largest electric utilities, E3 evaluated the operational challenges, potential solutions, and cost consequences of a higher Renewables Portfolio Standard (RPS) in California by 2030. The study benefited from technical input from the CAISO as well as independent review from a distinguished four‐member advisory panel. The study utilized E3's first‐in‐class Renewable Energy Flexibility (REFLEX) model on ECCO International's ProMaxLT production simulation platform. The report and associated materials are available below.
– Available at: http://www.ethree.com/public_projects/renewables_portfolio_standard.php
• National Renewable Energy Laboratory (NREL), “The Role of Pumped Storage Hydro Resources in Electricity Markets and System Operation” (May 2013)
– Excerpt from Abstract: “This paper will introduce some of the issues that may limit the ability to fully value pumped storage hydro plants in today’s markets and propose some solutions to those problems.”
– Available at: http://www.nrel.gov/docs/fy13osti/58655.pdf15
Resources Regarding Studying and Modeling Pumped Storage (cont’d)
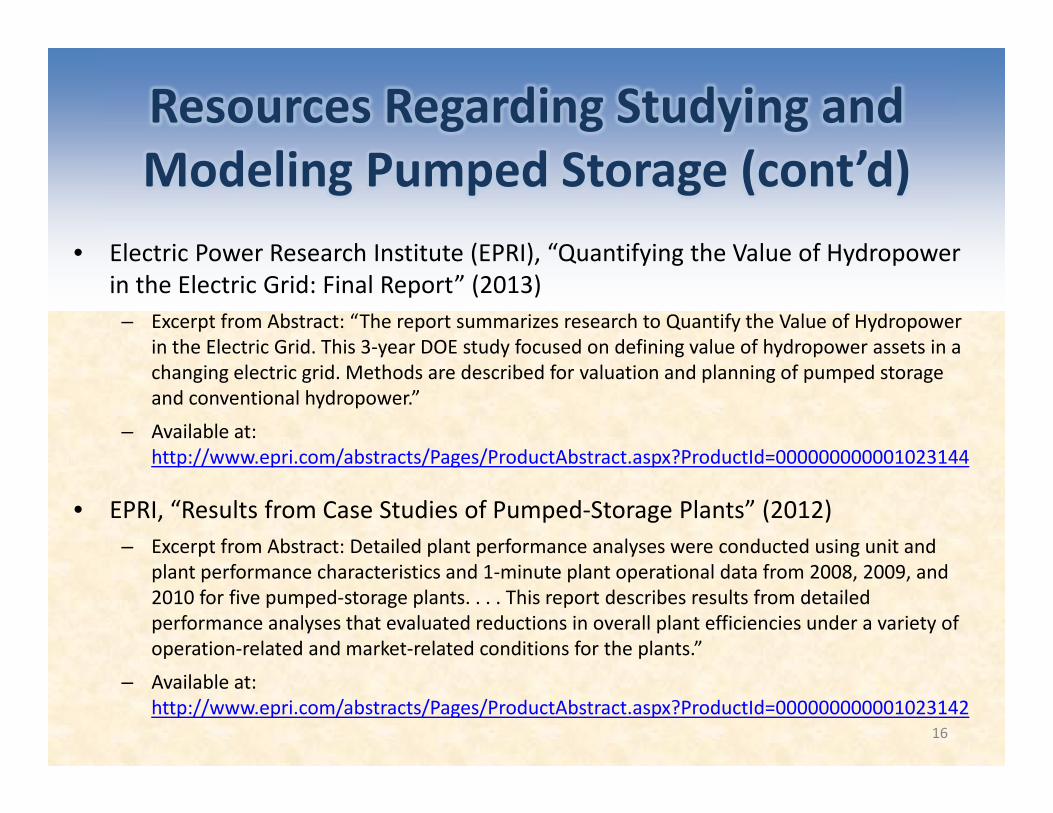
• Electric Power Research Institute (EPRI), “Quantifying the Value of Hydropower in the Electric Grid: Final Report” (2013)
– Excerpt from Abstract: “The report summarizes research to Quantify the Value of Hydropower in the Electric Grid. This 3‐year DOE study focused on defining value of hydropower assets in a changing electric grid. Methods are described for valuation and planning of pumped storage and conventional hydropower.”
– Available at: http://www.epri.com/abstracts/Pages/ProductAbstract.aspx?ProductId=000000000001023144
• EPRI, “Results from Case Studies of Pumped‐Storage Plants” (2012)– Excerpt from Abstract: Detailed plant performance analyses were conducted using unit and
plant performance characteristics and 1‐minute plant operational data from 2008, 2009, and 2010 for five pumped‐storage plants. . . . This report describes results from detailed performance analyses that evaluated reductions in overall plant efficiencies under a variety of operation‐related and market‐related conditions for the plants.”
– Available at: http://www.epri.com/abstracts/Pages/ProductAbstract.aspx?ProductId=000000000001023142
16
Resources Regarding Studying and Modeling Pumped Storage (cont’d)
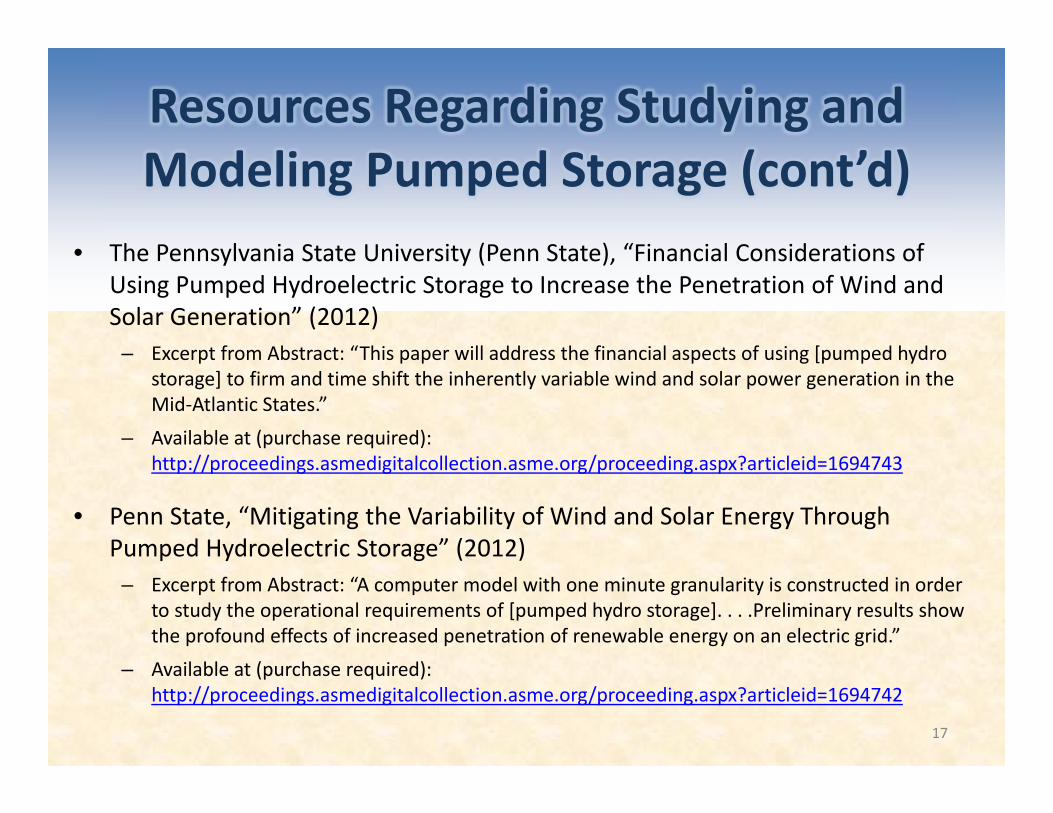
• The Pennsylvania State University (Penn State), “Financial Considerations of Using Pumped Hydroelectric Storage to Increase the Penetration of Wind and Solar Generation” (2012)
– Excerpt from Abstract: “This paper will address the financial aspects of using [pumped hydro storage] to firm and time shift the inherently variable wind and solar power generation in the Mid‐Atlantic States.”
– Available at (purchase required): http://proceedings.asmedigitalcollection.asme.org/proceeding.aspx?articleid=1694743
• Penn State, “Mitigating the Variability of Wind and Solar Energy Through Pumped Hydroelectric Storage” (2012)
– Excerpt from Abstract: “A computer model with one minute granularity is constructed in order to study the operational requirements of [pumped hydro storage]. . . .Preliminary results show the profound effects of increased penetration of renewable energy on an electric grid.”
– Available at (purchase required): http://proceedings.asmedigitalcollection.asme.org/proceeding.aspx?articleid=1694742
17
Resources Regarding Studying and Modeling Pumped Storage (cont’d)
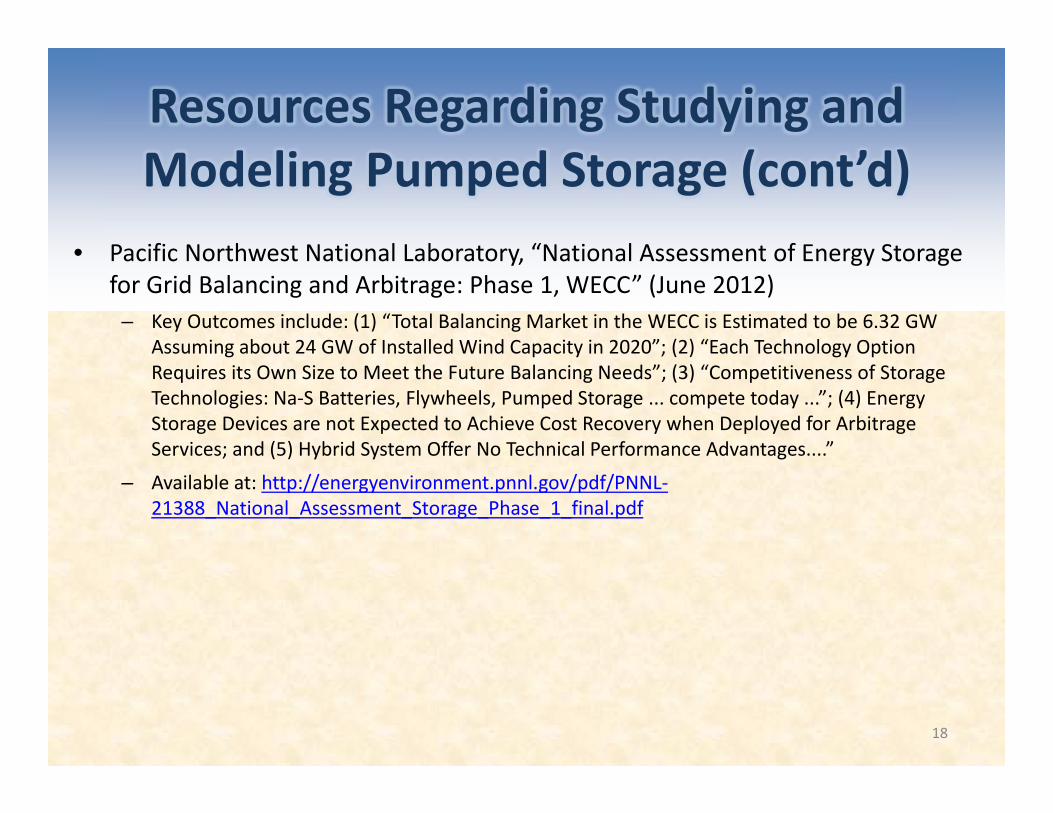
• Pacific Northwest National Laboratory, “National Assessment of Energy Storage for Grid Balancing and Arbitrage: Phase 1, WECC” (June 2012)
– Key Outcomes include: (1) “Total Balancing Market in the WECC is Estimated to be 6.32 GW Assuming about 24 GW of Installed Wind Capacity in 2020”; (2) “Each Technology Option Requires its Own Size to Meet the Future Balancing Needs”; (3) “Competitiveness of Storage Technologies: Na‐S Batteries, Flywheels, Pumped Storage ... compete today ...”; (4) Energy Storage Devices are not Expected to Achieve Cost Recovery when Deployed for Arbitrage Services; and (5) Hybrid System Offer No Technical Performance Advantages....”
– Available at: http://energyenvironment.pnnl.gov/pdf/PNNL‐21388_National_Assessment_Storage_Phase_1_final.pdf
18
Resources Regarding Studying and Modeling Pumped Storage (cont’d)
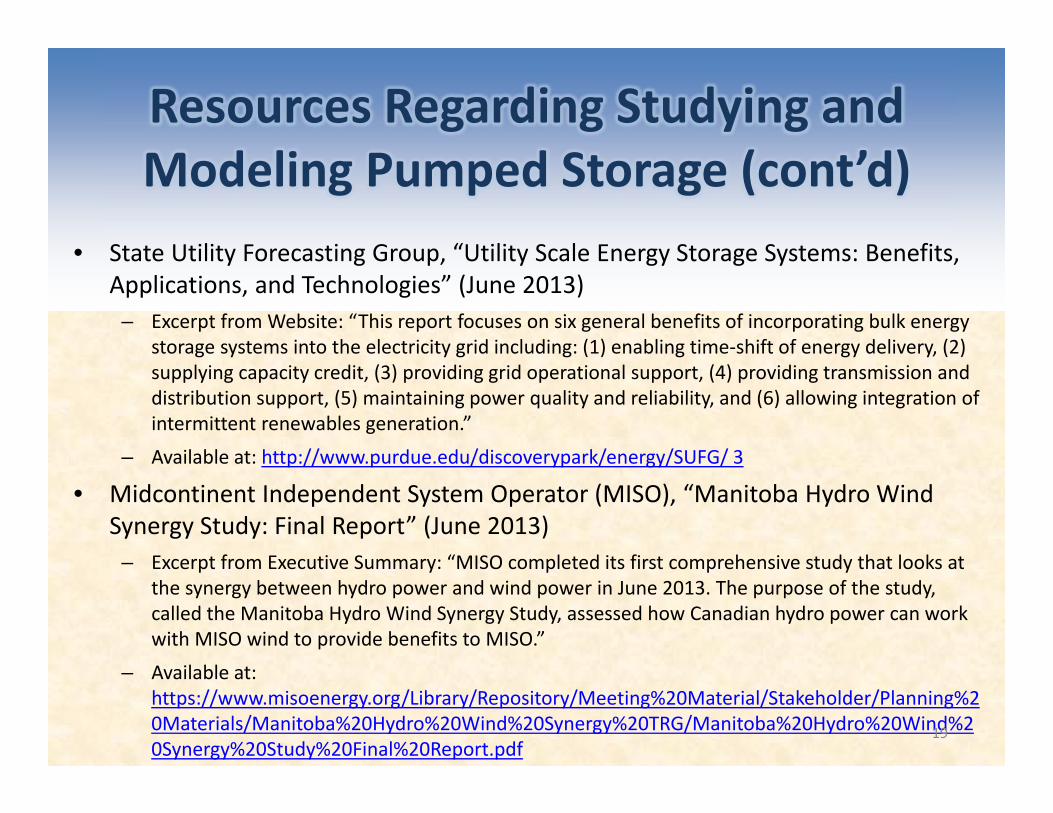
• State Utility Forecasting Group, “Utility Scale Energy Storage Systems: Benefits, Applications, and Technologies” (June 2013)
– Excerpt from Website: “This report focuses on six general benefits of incorporating bulk energy storage systems into the electricity grid including: (1) enabling time‐shift of energy delivery, (2) supplying capacity credit, (3) providing grid operational support, (4) providing transmission and distribution support, (5) maintaining power quality and reliability, and (6) allowing integration of intermittent renewables generation.”
– Available at: http://www.purdue.edu/discoverypark/energy/SUFG/ 3
• Midcontinent Independent System Operator (MISO), “Manitoba Hydro Wind Synergy Study: Final Report” (June 2013)
– Excerpt from Executive Summary: “MISO completed its first comprehensive study that looks at the synergy between hydro power and wind power in June 2013. The purpose of the study, called the Manitoba Hydro Wind Synergy Study, assessed how Canadian hydro power can work with MISO wind to provide benefits to MISO.”
– Available at: https://www.misoenergy.org/Library/Repository/Meeting%20Material/Stakeholder/Planning%20Materials/Manitoba%20Hydro%20Wind%20Synergy%20TRG/Manitoba%20Hydro%20Wind%20Synergy%20Study%20Final%20Report.pdf
19

Eagle Mountain Pumped Storage Project
APPENDIX 2PROJECT DETAILS
20
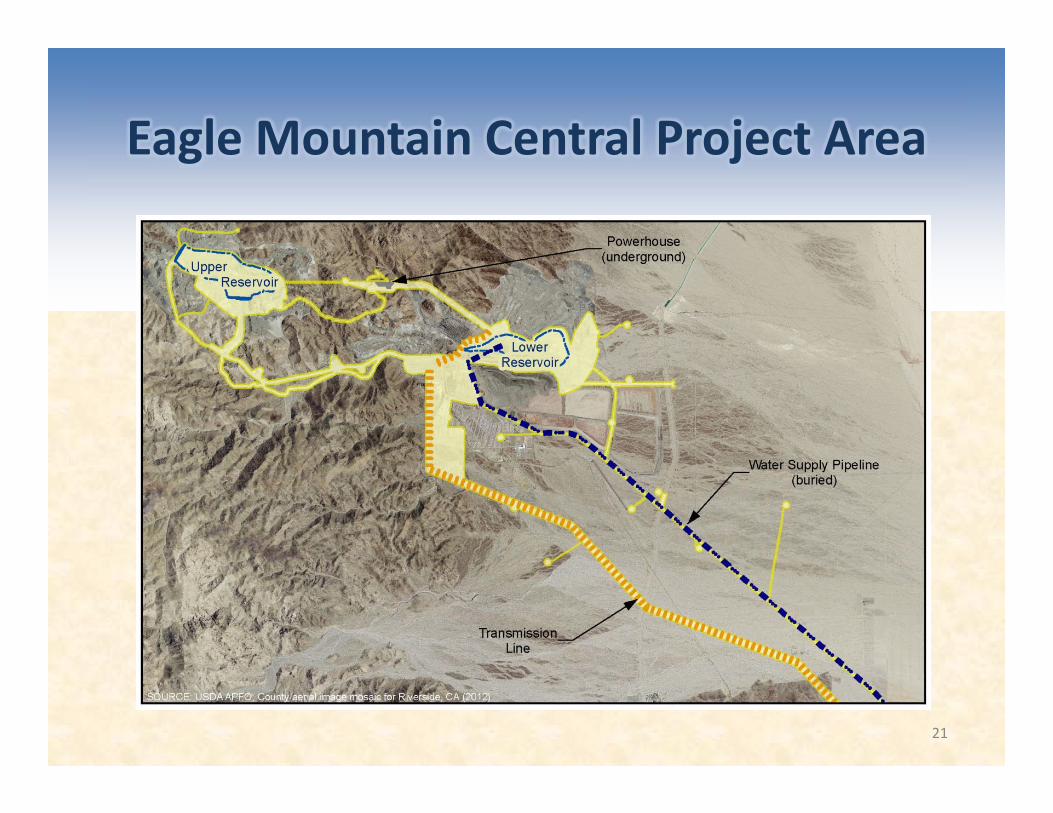
Eagle Mountain Central Project Area
21
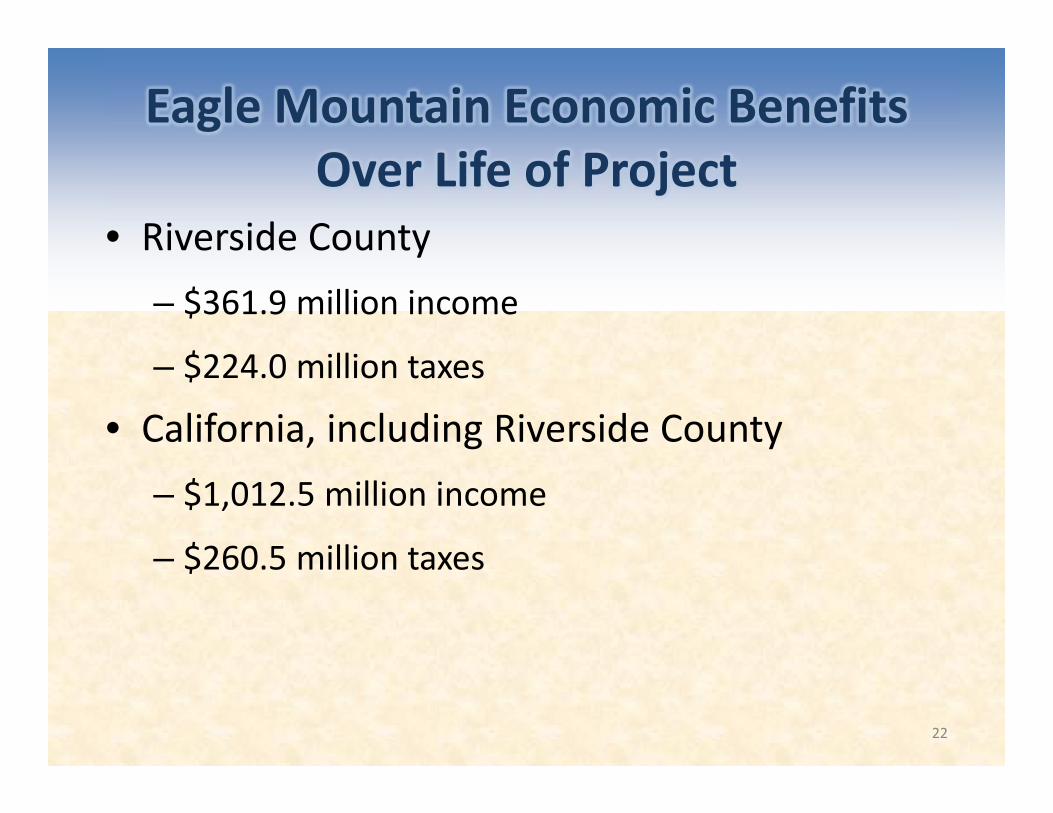
Eagle Mountain Economic Benefits Over Life of Project
• Riverside County– $361.9 million income
– $224.0 million taxes
• California, including Riverside County– $1,012.5 million income
– $260.5 million taxes
22
Environmental Mitigation
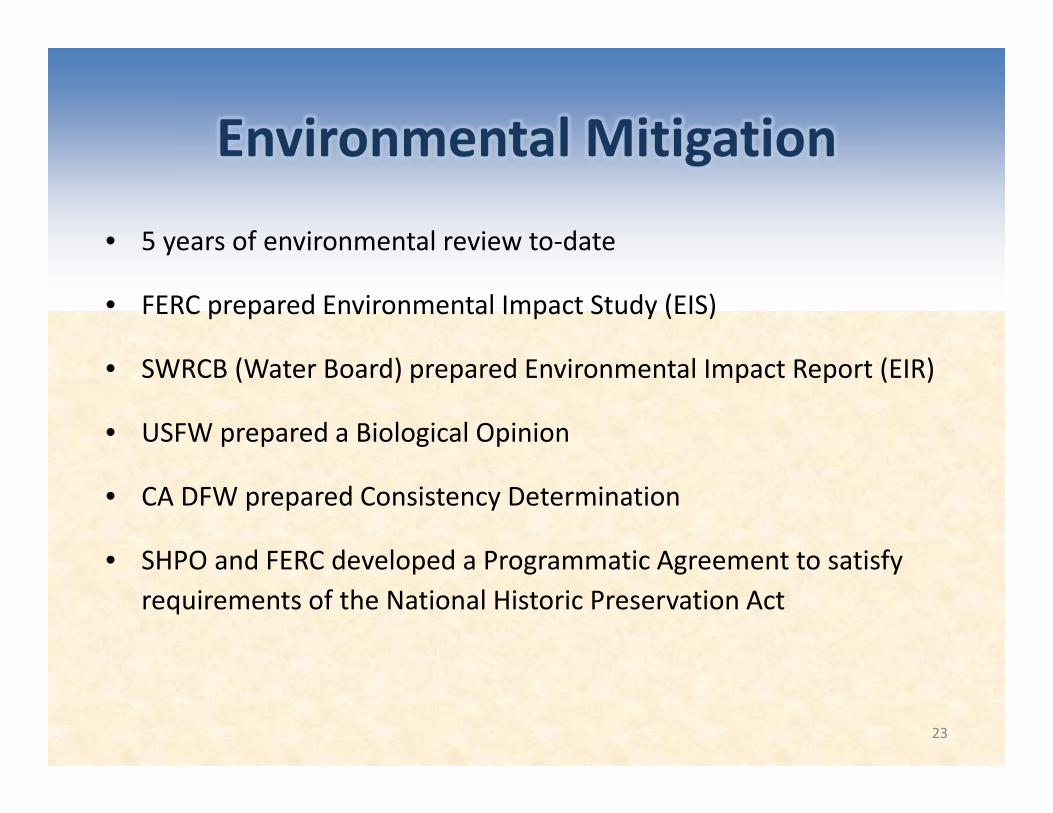
• 5 years of environmental review to‐date
• FERC prepared Environmental Impact Study (EIS)
• SWRCB (Water Board) prepared Environmental Impact Report (EIR)
• USFW prepared a Biological Opinion
• CA DFW prepared Consistency Determination
• SHPO and FERC developed a Programmatic Agreement to satisfy requirements of the National Historic Preservation Act
23
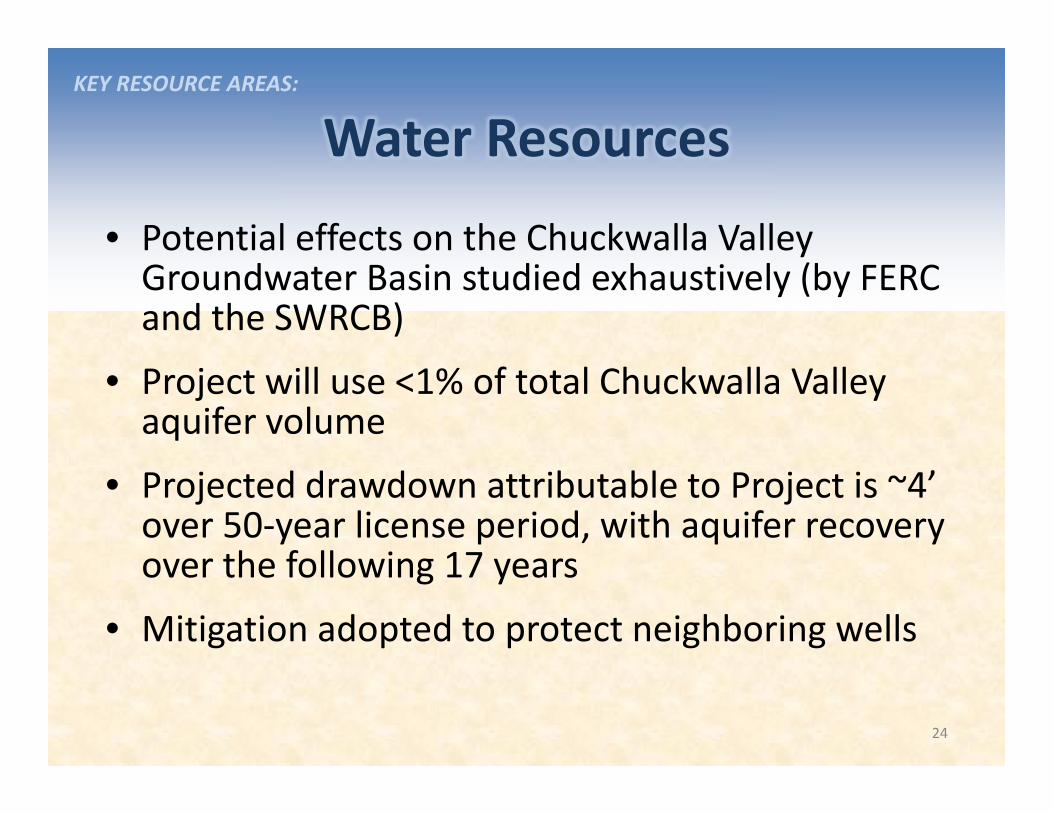
Water Resources
• Potential effects on the Chuckwalla Valley Groundwater Basin studied exhaustively (by FERC and the SWRCB)
• Project will use <1% of total Chuckwalla Valley aquifer volume
• Projected drawdown attributable to Project is ~4’ over 50‐year license period, with aquifer recovery over the following 17 years
• Mitigation adopted to protect neighboring wells
KEY RESOURCE AREAS:
24
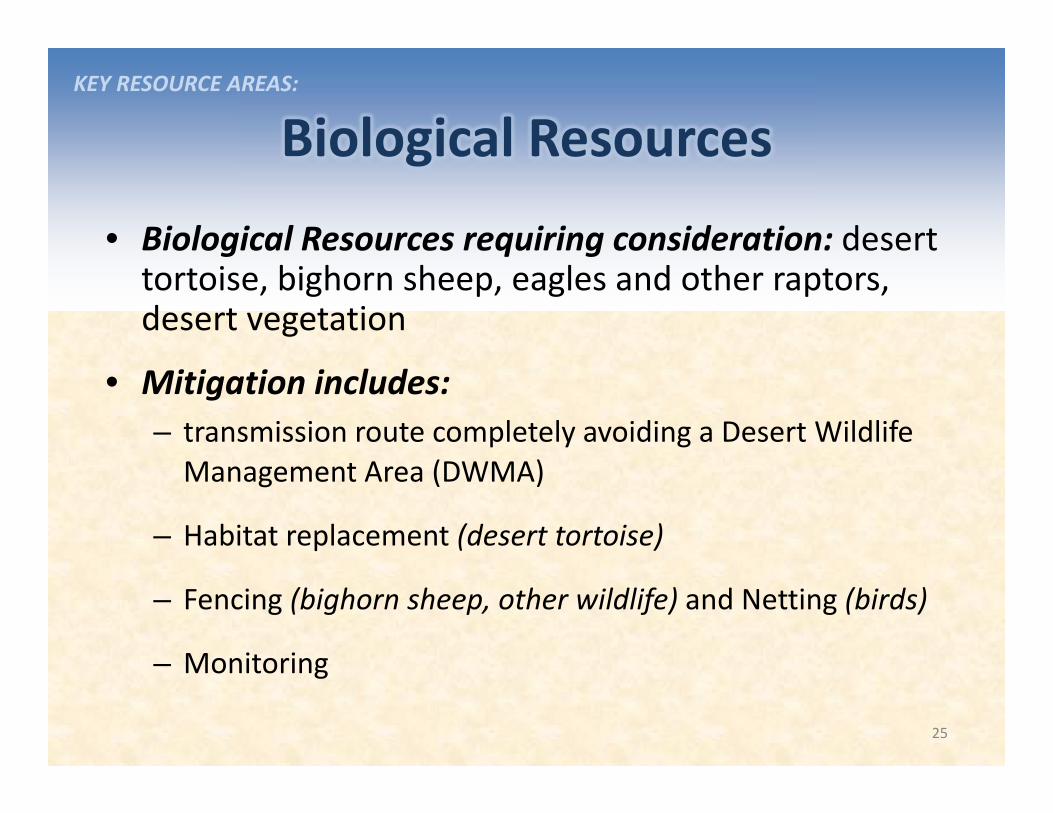
Biological Resources
• Biological Resources requiring consideration: desert tortoise, bighorn sheep, eagles and other raptors, desert vegetation
• Mitigation includes: – transmission route completely avoiding a Desert Wildlife Management Area (DWMA)
– Habitat replacement (desert tortoise)
– Fencing (bighorn sheep, other wildlife) and Netting (birds)
– Monitoring
KEY RESOURCE AREAS:
25
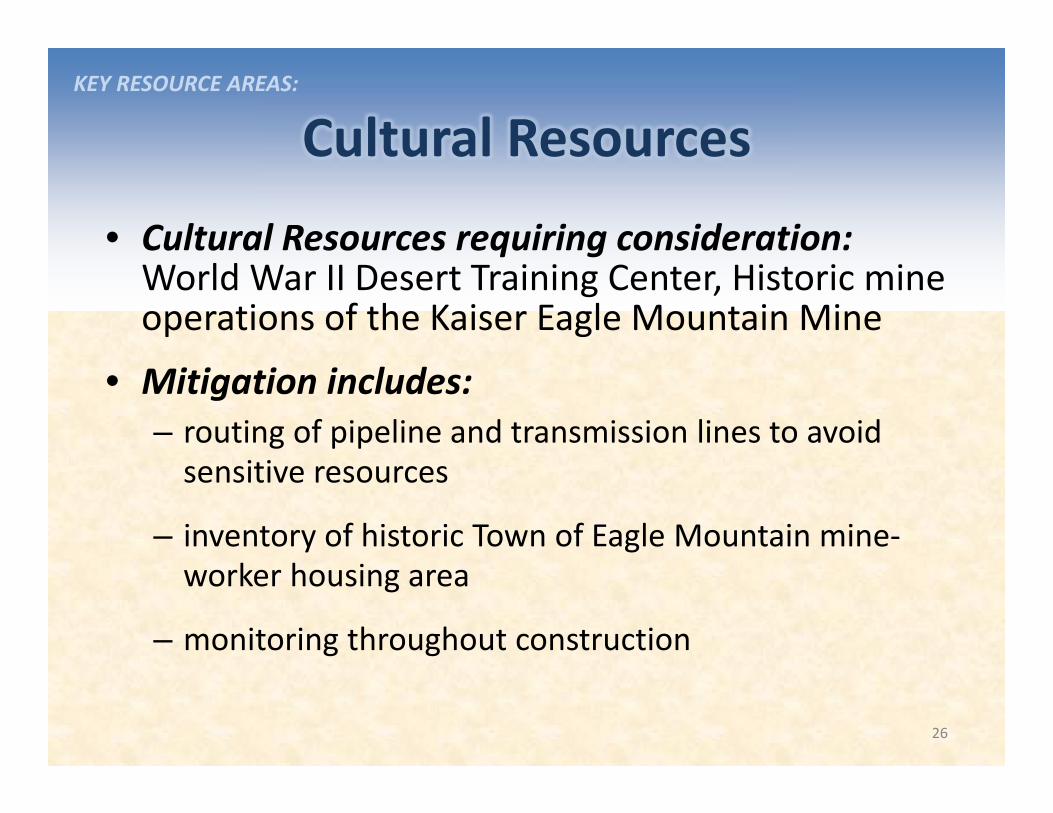
Cultural Resources
• Cultural Resources requiring consideration: World War II Desert Training Center, Historic mine operations of the Kaiser Eagle Mountain Mine
• Mitigation includes: – routing of pipeline and transmission lines to avoid sensitive resources
– inventory of historic Town of Eagle Mountain mine‐worker housing area
– monitoring throughout construction
KEY RESOURCE AREAS:
26

Air Quality/Greenhouse Gases (GHG)
• Air emissions during construction exceed Air District standards for a 3‐4 year period
– Mitigation: minimization of construction equipment emissions, use of electric‐powered equipment where feasible
• After construction, Project provides air quality benefits: (1) net reduction in emissions from regional energy generation, (2) contributes to integration of higher percentage of renewable energy generation sources, (3) reduces reliance on natural gas‐fired power plants
KEY RESOURCE AREAS:
27
Aesthetics/Visual Resources
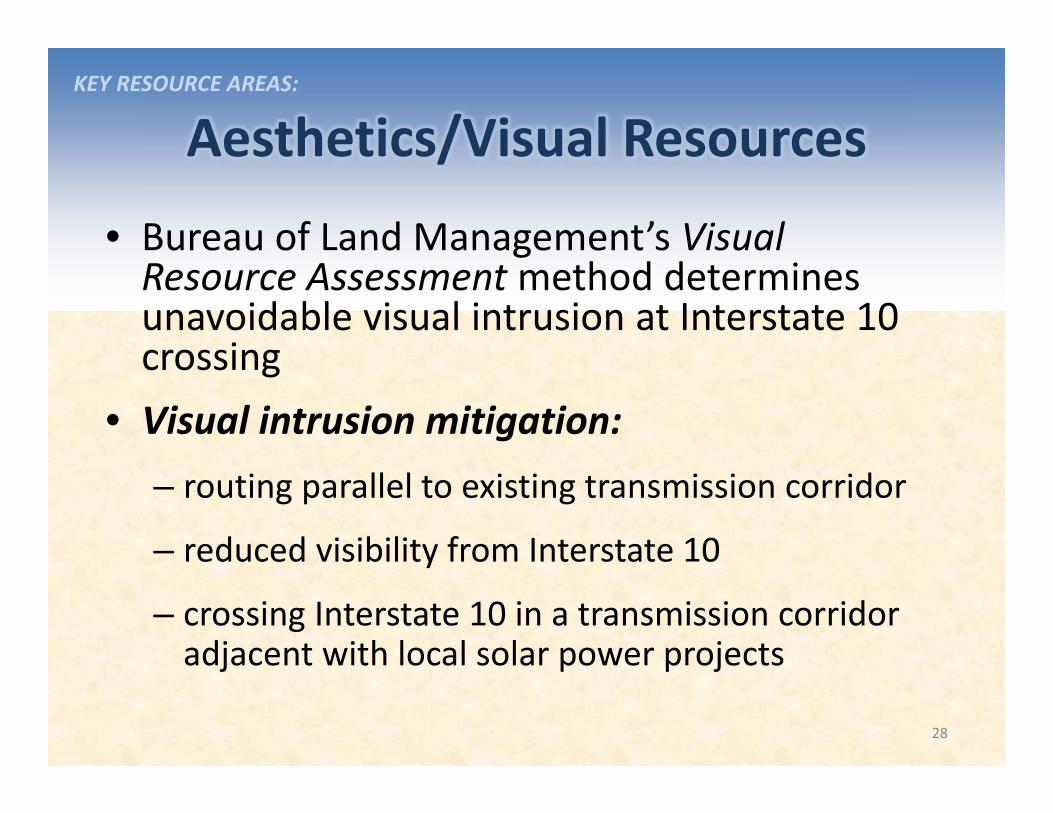
• Bureau of Land Management’s Visual Resource Assessment method determines unavoidable visual intrusion at Interstate 10 crossing
• Visual intrusion mitigation: – routing parallel to existing transmission corridor
– reduced visibility from Interstate 10
– crossing Interstate 10 in a transmission corridor adjacent with local solar power projects
KEY RESOURCE AREAS:
28
Land Use Compatibility
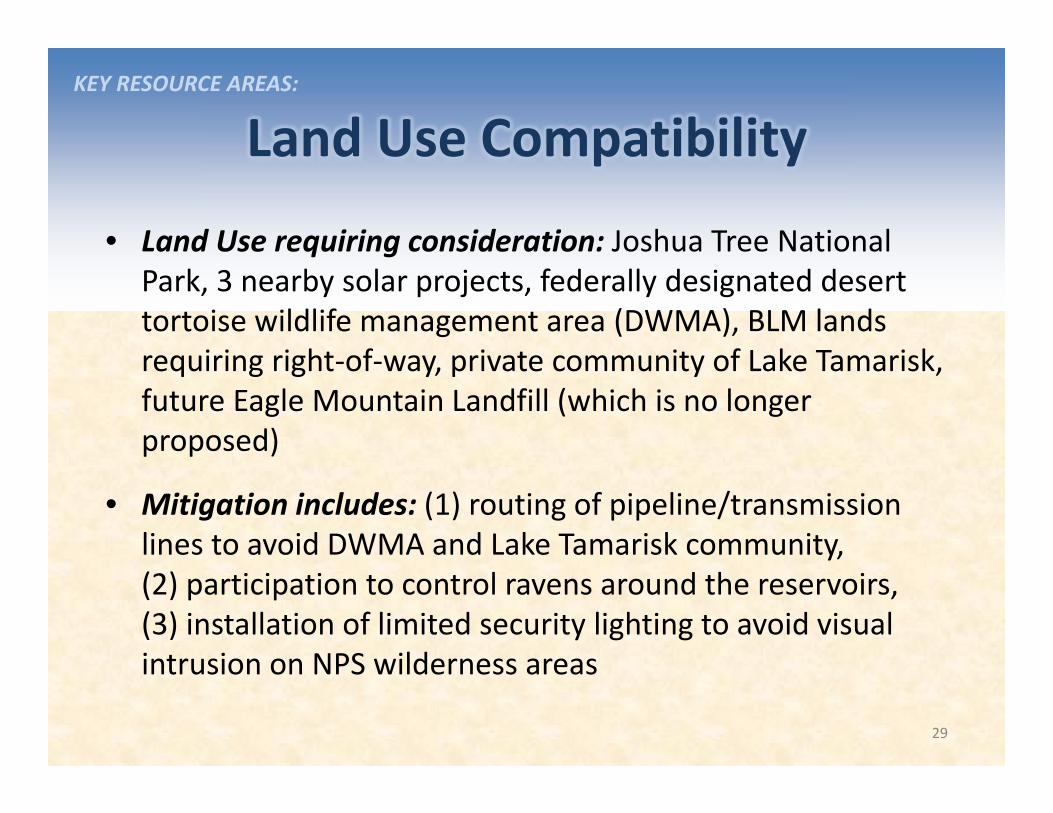
• Land Use requiring consideration: Joshua Tree National Park, 3 nearby solar projects, federally designated desert tortoise wildlife management area (DWMA), BLM lands requiring right‐of‐way, private community of Lake Tamarisk, future Eagle Mountain Landfill (which is no longer proposed)
• Mitigation includes: (1) routing of pipeline/transmission lines to avoid DWMA and Lake Tamarisk community, (2) participation to control ravens around the reservoirs, (3) installation of limited security lighting to avoid visual intrusion on NPS wilderness areas
KEY RESOURCE AREAS:
29
CPUC Technical Workshop on Pumped Storage
January 16, 2014
Modeling and Analysis of Value
of Advanced Pumped Storage
Hydropower in the U.S.
Vladimir KORITAROV
Center for Energy, Environmental, and Economic Systems Analysis
Decision and Information Sciences Division (DIS)
ARGONNE NATIONAL LABORATORY
9700 South Cass Avenue
Argonne, IL 60439
Tel: 630-252-6711
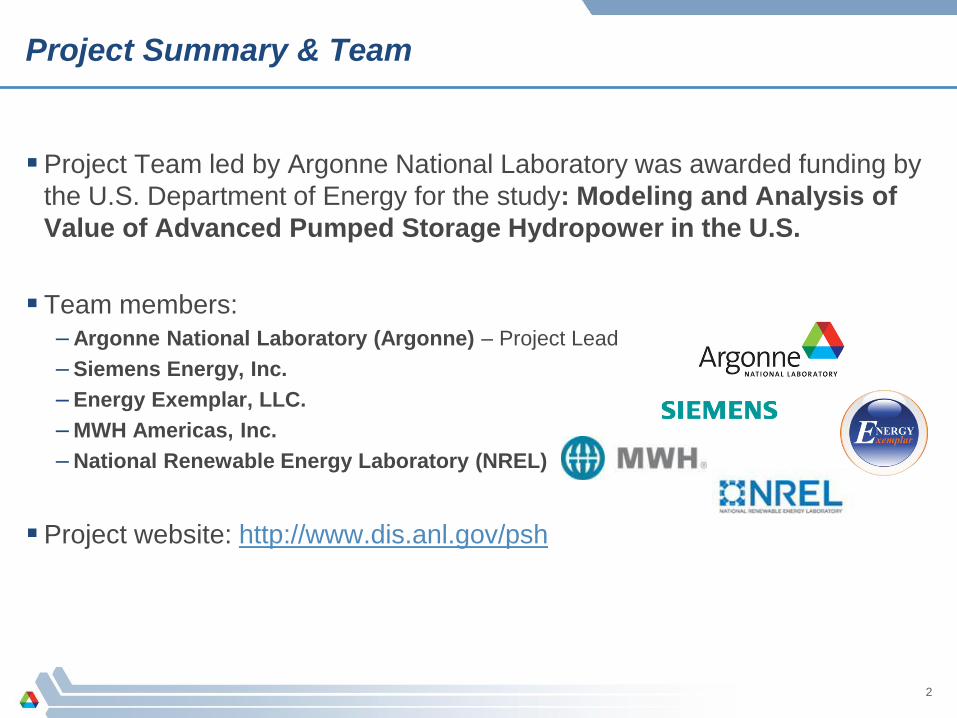
Project Summary & Team
Project Team led by Argonne National Laboratory was awarded funding by
the U.S. Department of Energy for the study: Modeling and Analysis of
Value of Advanced Pumped Storage Hydropower in the U.S.
Team members:
– Argonne National Laboratory (Argonne) – Project Lead
– Siemens Energy, Inc.
– Energy Exemplar, LLC.
– MWH Americas, Inc.
– National Renewable Energy Laboratory (NREL)
Project website: http://www.dis.anl.gov/psh
2
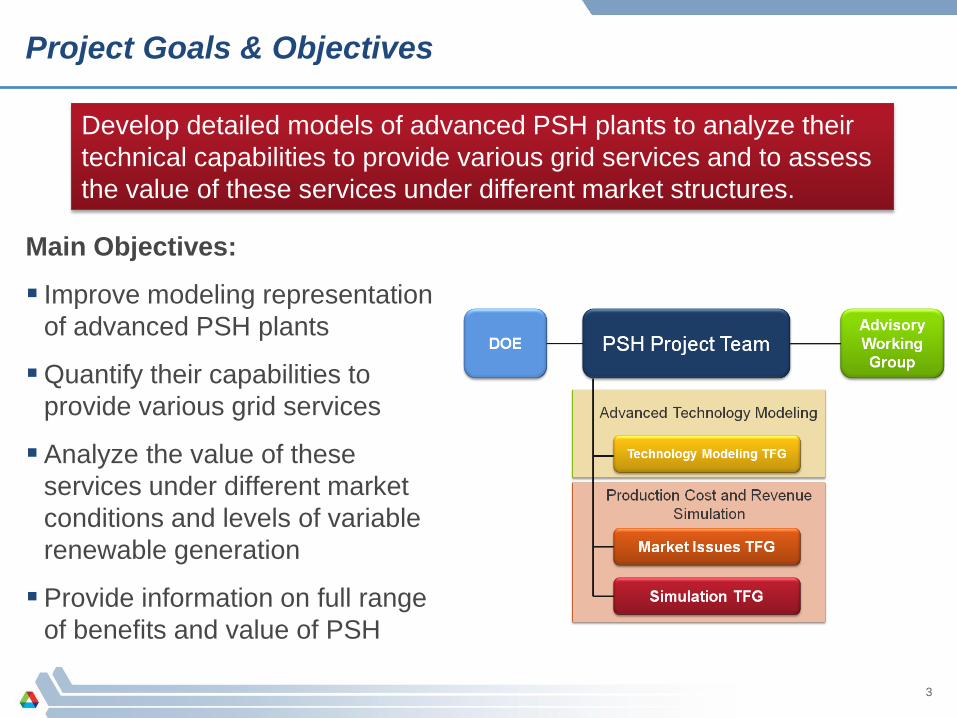
Project Goals & Objectives
Develop detailed models of advanced PSH plants to analyze their
technical capabilities to provide various grid services and to assess
the value of these services under different market structures.
Main Objectives:
Improve modeling representation
of advanced PSH plants
Quantify their capabilities to
provide various grid services
Analyze the value of these
services under different market
conditions and levels of variable
renewable generation
Provide information on full range
of benefits and value of PSH
3

Analysis Addressed Wide Range of Control Issues & Timeframes
Analysis aimed to capture PSH dynamic responses and operational characteristics
across different timescales, from a fraction of a second to days/weeks.
4
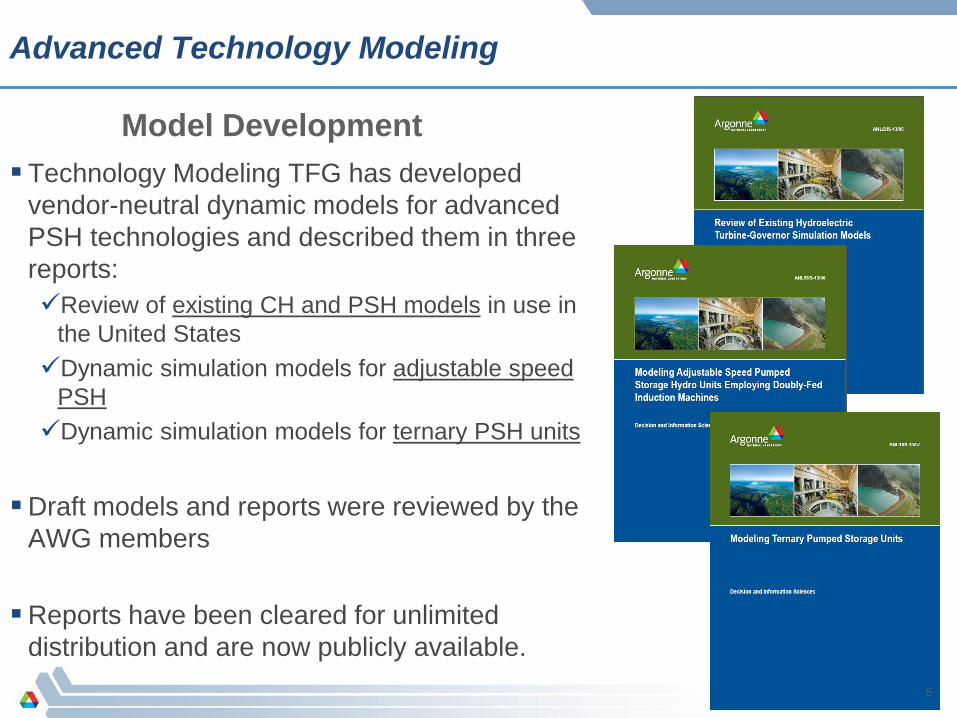
Advanced Technology Modeling
Technology Modeling TFG has developed
vendor-neutral dynamic models for advanced
PSH technologies and described them in three
reports:
Review of existing CH and PSH models in use in
the United States
Dynamic simulation models for adjustable speed
PSH
Dynamic simulation models for ternary PSH units
Draft models and reports were reviewed by the
AWG members
Reports have been cleared for unlimited
distribution and are now publicly available.
Model Development
5
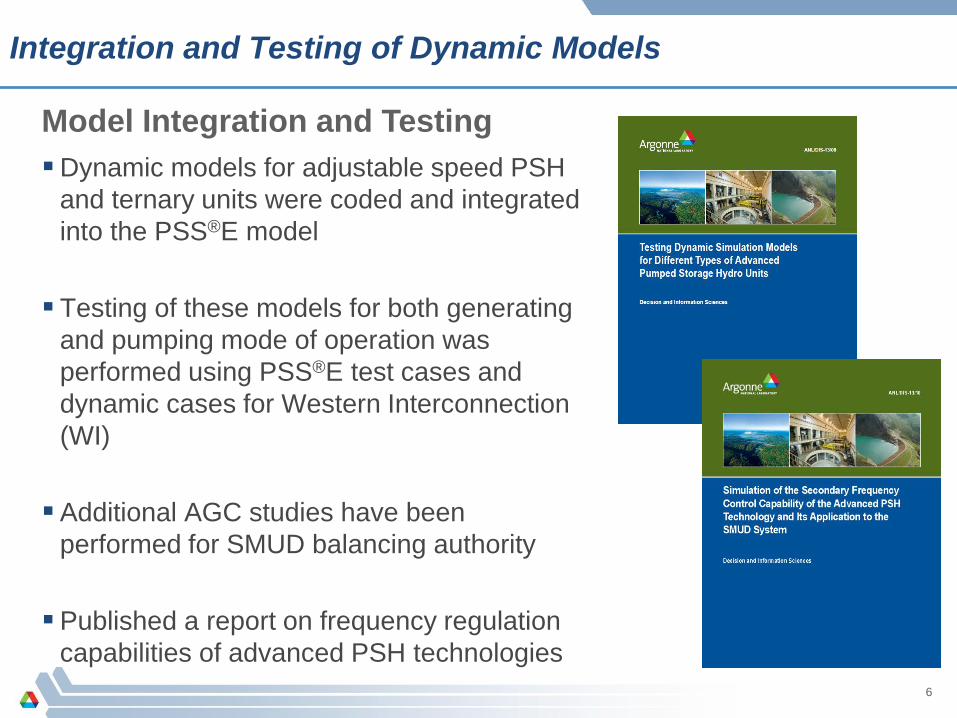
Integration and Testing of Dynamic Models
Dynamic models for adjustable speed PSH
and ternary units were coded and integrated
into the PSS®E model
Testing of these models for both generating
and pumping mode of operation was
performed using PSS®E test cases and
dynamic cases for Western Interconnection
(WI)
Additional AGC studies have been
performed for SMUD balancing authority
Published a report on frequency regulation
capabilities of advanced PSH technologies
Model Integration and Testing
6

PSH Provides Various Services and Contributions to the Power System
7
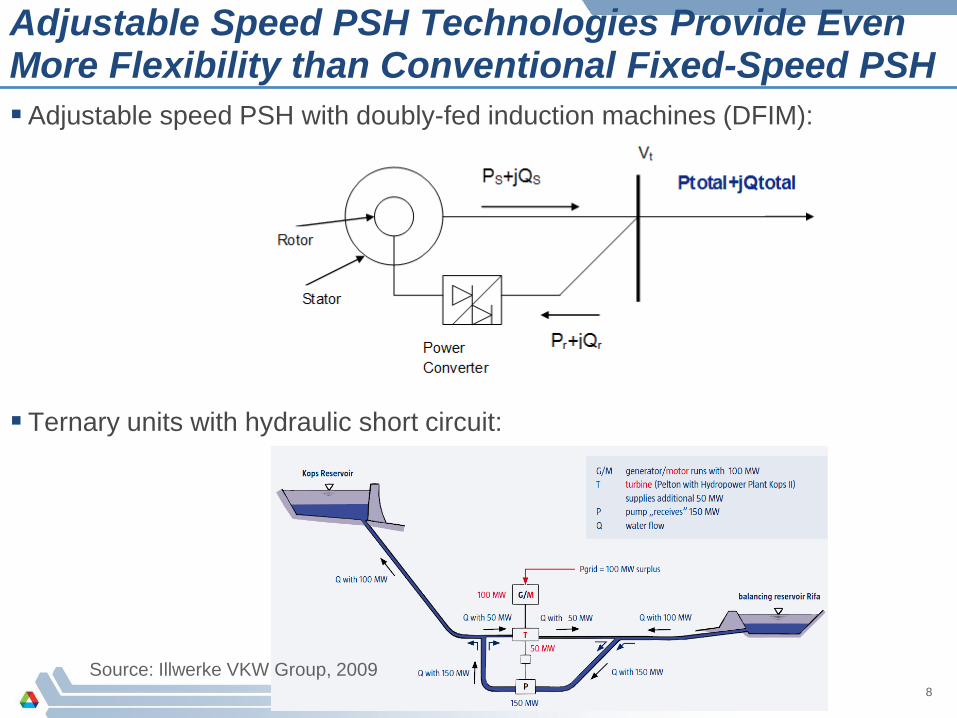
Adjustable Speed PSH Technologies Provide Even More Flexibility than Conventional Fixed-Speed PSH
Adjustable speed PSH with doubly-fed induction machines (DFIM):
Ternary units with hydraulic short circuit:
8
Source: Illwerke VKW Group, 2009
Additional Benefits of Adjustable Speed PSH
More flexible and efficient operation in generation mode
–Minimum unit power output as low as 20%-30%
– Increased efficiency and lifetime of the turbine at partial loads by operating at
optimal speed
Frequency regulation capabilities also available in the pumping mode
Electronically decoupled control of active and reactive power
–Provides more flexible voltage support
Improved dynamic behavior and stability of power system
–Improved transient stability in case of grid faults (e.g., short circuit faults in the
transmission system)
–Reduced frequency drops in case of generator outages
Better compensation of variability of renewable energy sources
–More flexible and quicker response in generating (turbine) mode
–Variable power in pumping mode to counterbalance variability of wind
–Excellent source of frequency regulation during the off-peak hours
9
PLEXOS Model was Used for Production Cost and Revenue Simulations
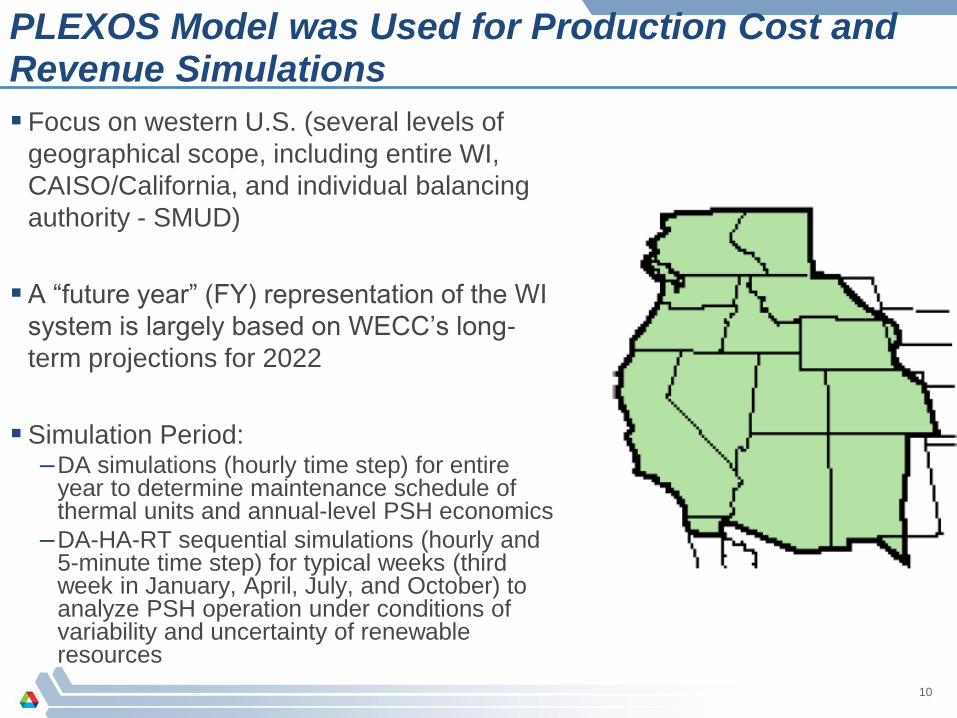
Focus on western U.S. (several levels of
geographical scope, including entire WI,
CAISO/California, and individual balancing
authority - SMUD)
A “future year” (FY) representation of the WI
system is largely based on WECC’s long-
term projections for 2022
Simulation Period: –DA simulations (hourly time step) for entire
year to determine maintenance schedule of thermal units and annual-level PSH economics
–DA-HA-RT sequential simulations (hourly and 5-minute time step) for typical weeks (third week in January, April, July, and October) to analyze PSH operation under conditions of variability and uncertainty of renewable resources
10
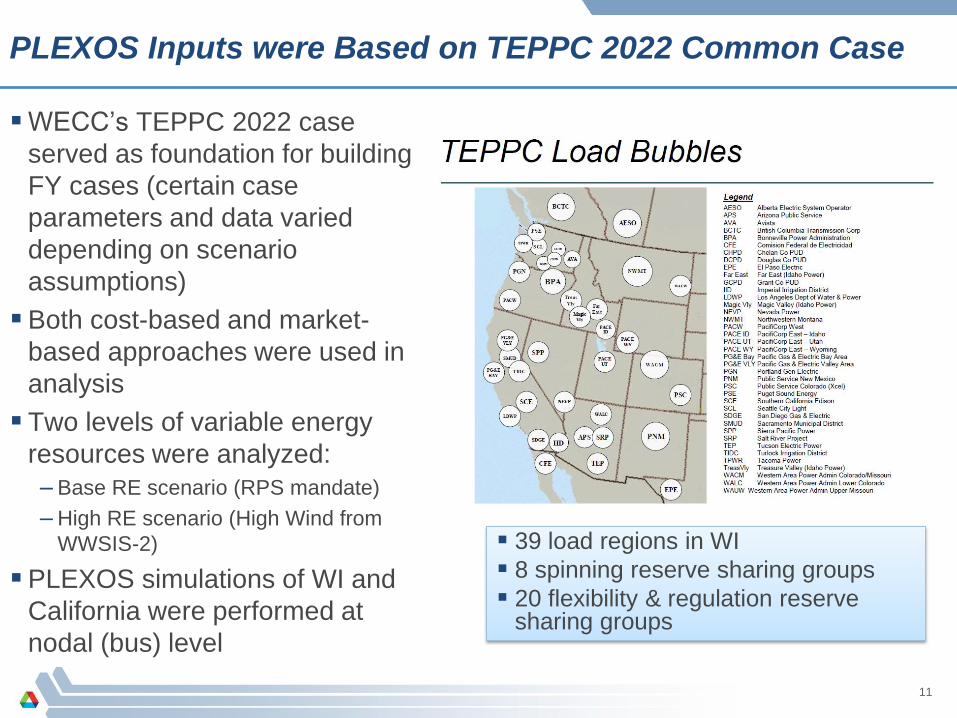
PLEXOS Inputs were Based on TEPPC 2022 Common Case
WECC’s TEPPC 2022 case
served as foundation for building
FY cases (certain case
parameters and data varied
depending on scenario
assumptions)
Both cost-based and market-
based approaches were used in
analysis
Two levels of variable energy
resources were analyzed:
– Base RE scenario (RPS mandate)
– High RE scenario (High Wind from
WWSIS-2)
PLEXOS simulations of WI and
California were performed at
nodal (bus) level
39 load regions in WI
8 spinning reserve sharing groups
20 flexibility & regulation reserve sharing groups
11
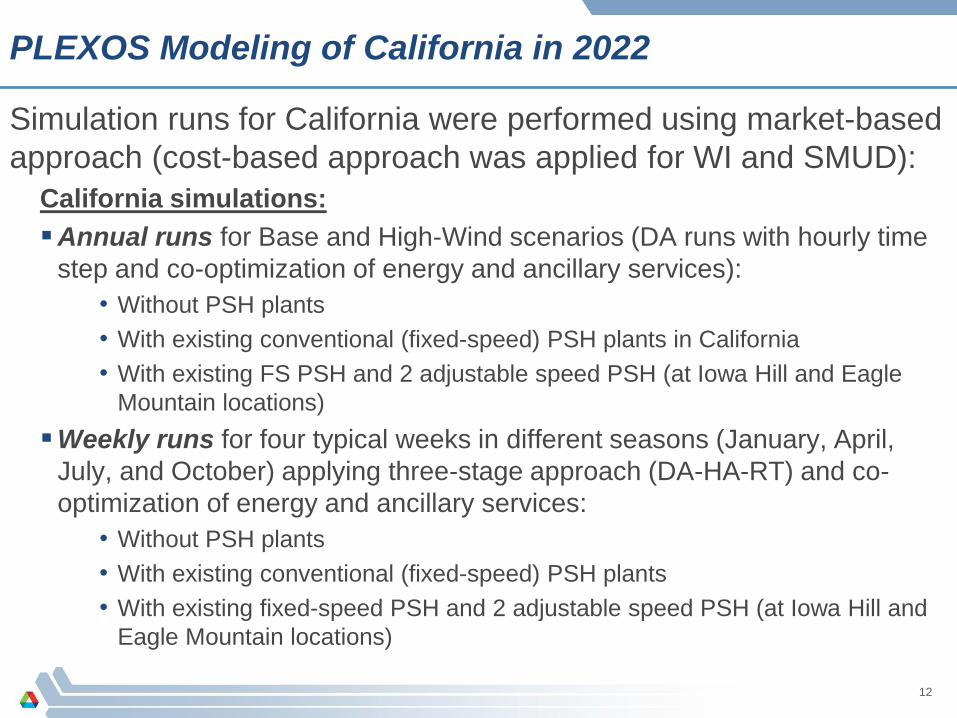
PLEXOS Modeling of California in 2022
Simulation runs for California were performed using market-based
approach (cost-based approach was applied for WI and SMUD):
California simulations:
Annual runs for Base and High-Wind scenarios (DA runs with hourly time
step and co-optimization of energy and ancillary services):
• Without PSH plants
• With existing conventional (fixed-speed) PSH plants in California
• With existing FS PSH and 2 adjustable speed PSH (at Iowa Hill and Eagle
Mountain locations)
Weekly runs for four typical weeks in different seasons (January, April,
July, and October) applying three-stage approach (DA-HA-RT) and co-
optimization of energy and ancillary services:
• Without PSH plants
• With existing conventional (fixed-speed) PSH plants
• With existing fixed-speed PSH and 2 adjustable speed PSH (at Iowa Hill and
Eagle Mountain locations)
12
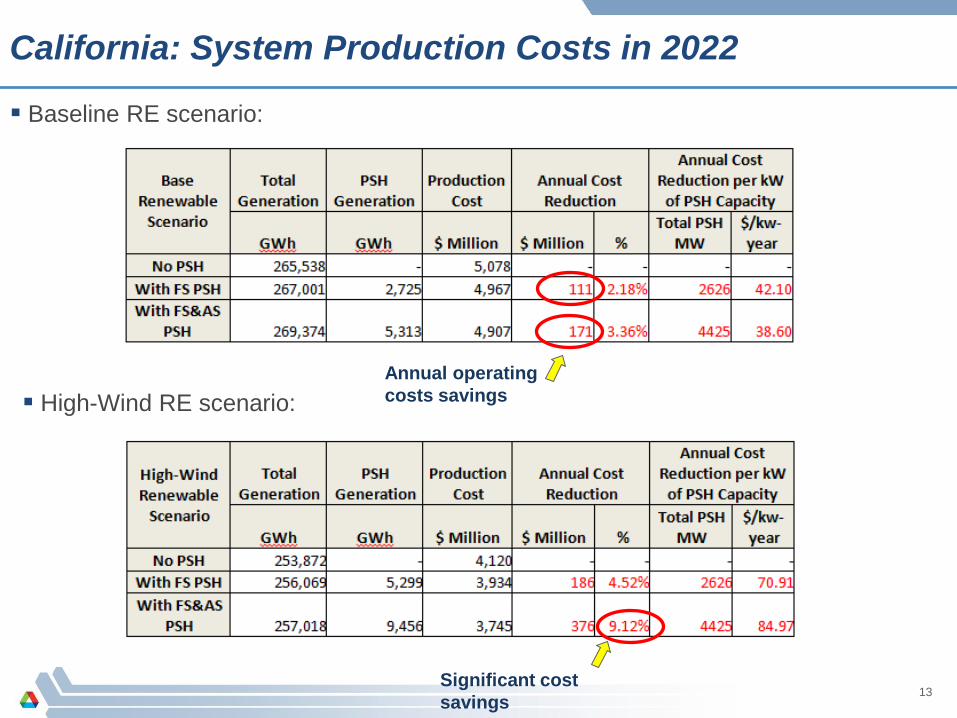
California: System Production Costs in 2022
Baseline RE scenario:
High-Wind RE scenario:
13 Significant cost
savings
Annual operating
costs savings
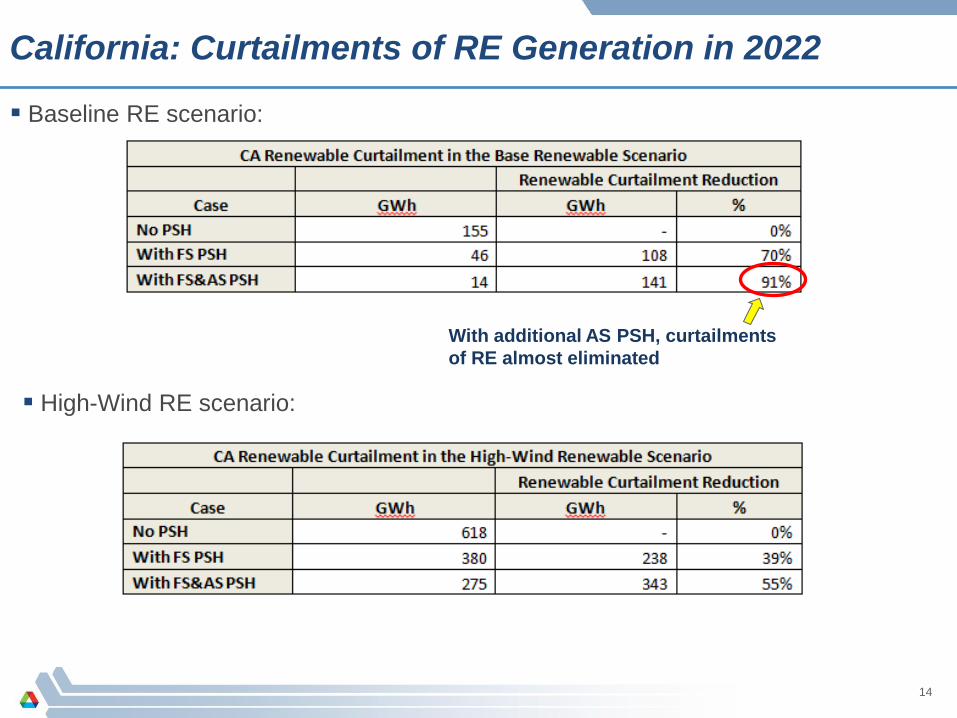
California: Curtailments of RE Generation in 2022
Baseline RE scenario:
High-Wind RE scenario:
14
With additional AS PSH, curtailments
of RE almost eliminated
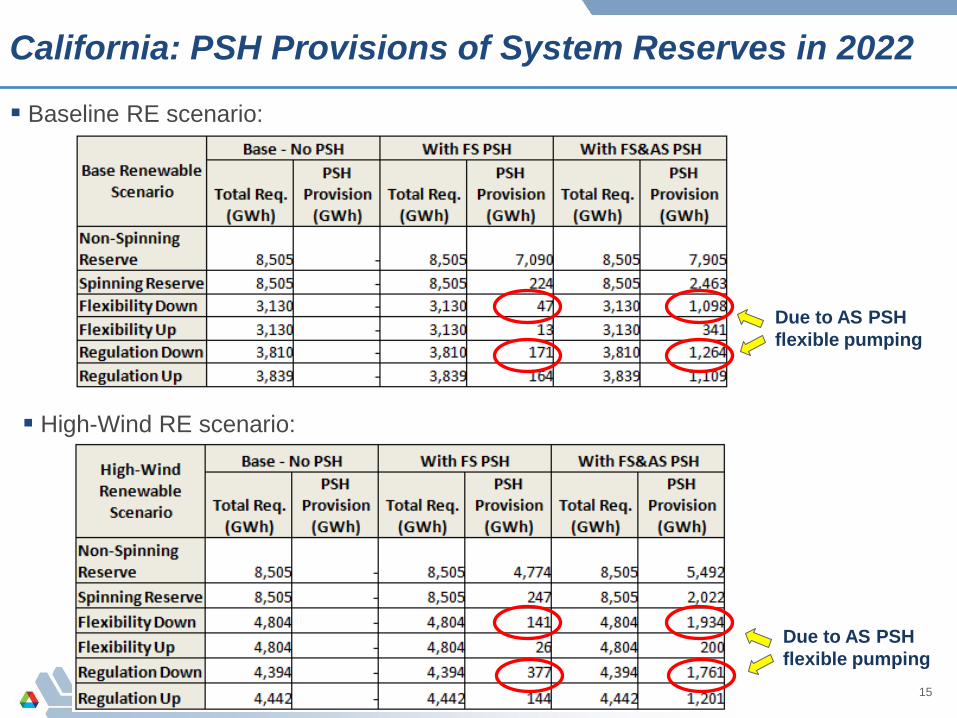
California: PSH Provisions of System Reserves in 2022
Baseline RE scenario:
High-Wind RE scenario:
15
Due to AS PSH
flexible pumping
Due to AS PSH
flexible pumping
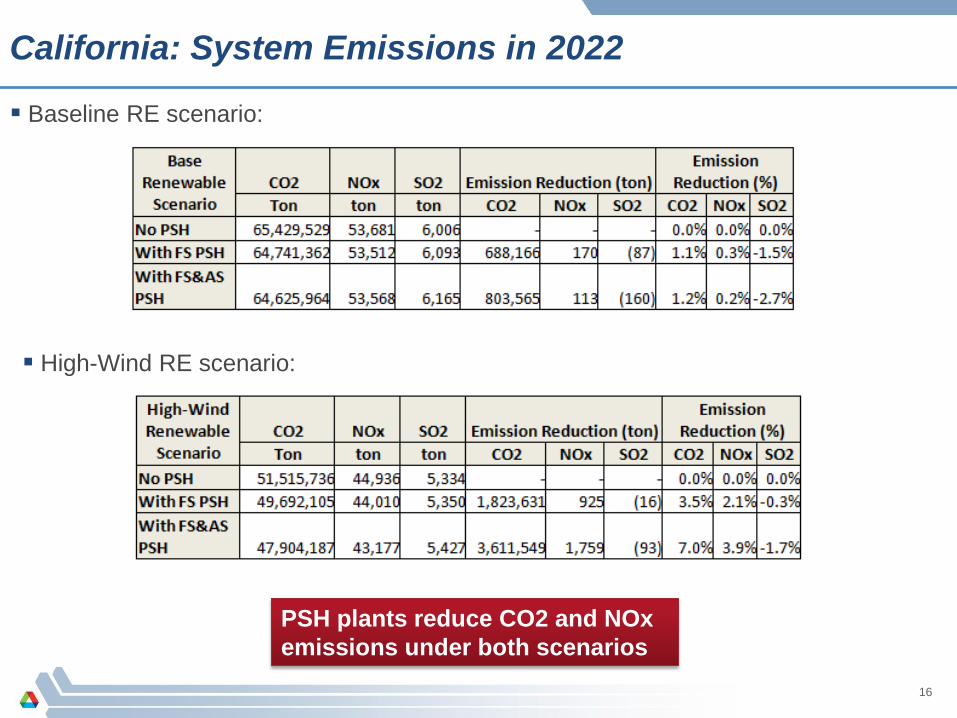
California: System Emissions in 2022
Baseline RE scenario:
High-Wind RE scenario:
16
PSH plants reduce CO2 and NOx
emissions under both scenarios
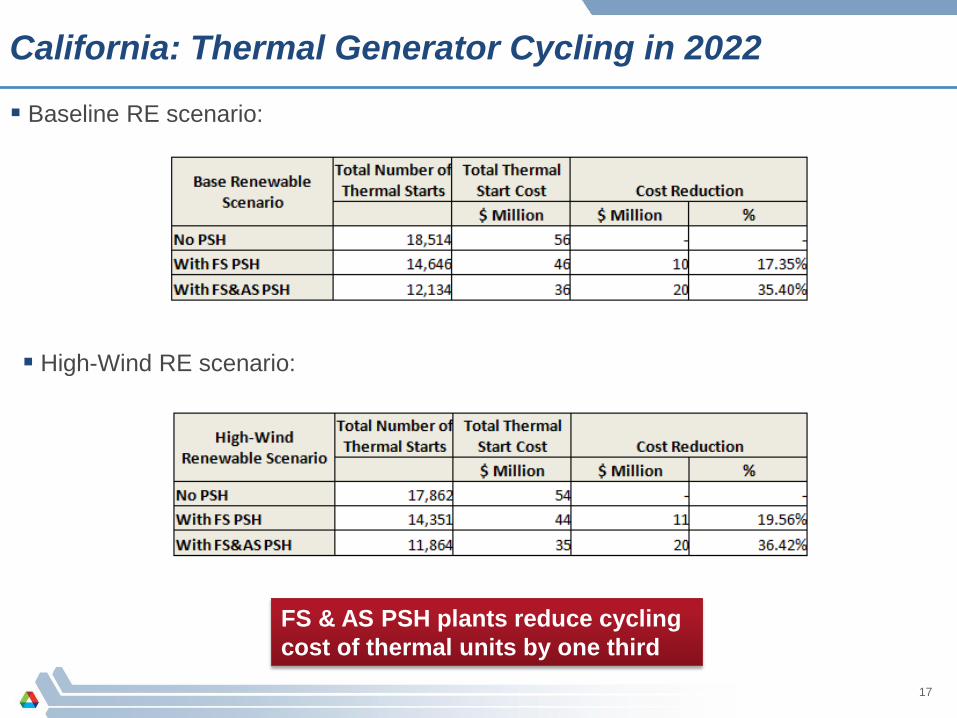
California: Thermal Generator Cycling in 2022
Baseline RE scenario:
High-Wind RE scenario:
17
FS & AS PSH plants reduce cycling
cost of thermal units by one third

California: Thermal Generator Ramping in 2022
Baseline RE scenario:
High-Wind RE scenario:
18
Ramping of thermal units
reduced by one third
Ramping of thermal units
reduced by one third
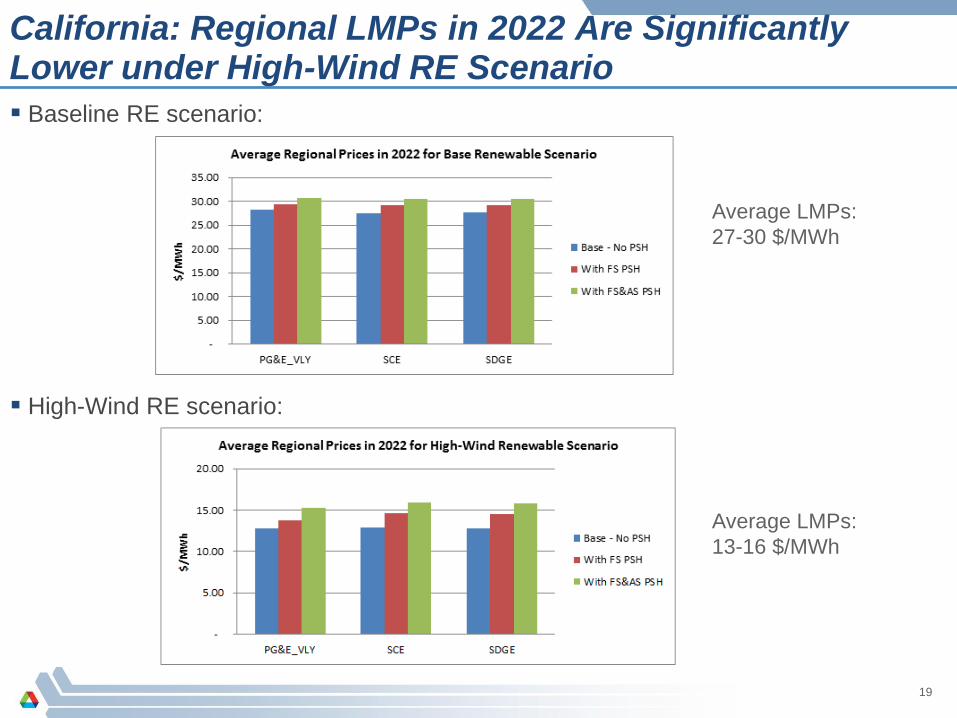
California: Regional LMPs in 2022 Are Significantly Lower under High-Wind RE Scenario
Baseline RE scenario:
High-Wind RE scenario:
19
Average LMPs:
27-30 $/MWh
Average LMPs:
13-16 $/MWh

PSH Provides Load for RE Generation during Off-Peak Hours (Reduces RE Curtailments and Negative LMPs)
20
Negative LMPs!
California: 3-Stage DA-HA-RT Modeling
Detailed simulation (5-minute time step in RT simulations) of four typical
weeks in different seasons of 2022 under High-Wind RE scenario
Simulated: 3rd weeks of January, April, July, and October
3rd week in July is the peak load week
3-Stage Sequential Simulation Results for Start and Shutdown Costs
under High-Wind Scenario
21
California: Summary of 3-Stage DA-HA-RT Modeling Results
22
Summary of 5-minute RT simulation results
for High-Wind renewable generation scenario

23
California Public Utilities Commission Technical Workshop
Michael L. Jones
Director, Power Generation
Pacific Gas and Electric Company
January 16, 2014
UNDERSTANDING CURRENT STATE OF PUMPED STORAGE BENEFITS AND BARRIERS
2 2
The only PROVEN large storage technology able to support Grid Operations 30 years of operation at Helms Pumped Storage facility – robust licensing and regulatory oversight of safety, environmental, and reliable operations 930 MW pumping to 1,212 MW generating Of SUSTAINED Energy/Capacity/Ancillary Services Spin/Load following (240 MW/Min) Non-Spin (0 to 1,212 MW in less than 10 min Regulation (AGC) Inertia: 3 million lbs of rotating equipment
Benefits: Proven
3 3
While pumped storage is tried and true technology, there are additional technology enhancements that make it even more valuable: Variable Speed Pumping Ternary Design (pump and turbine on the same shaft) Both can provide for demand side regulation and even “SMARTER GRID” benefits
Benefits: New Technology
4 4
Market Planning and evaluation process: • Recognition of Value Large-scale: • Economies of scale comes with a large
commitment
Development lead time: • Robust licensing and regulatory oversight • Appropriate approval path for either
Independent or Utility Owned resources
Barriers: Uncertainty