Embed Size (px)
Citation preview
Open Journal of Civil Engineering, 2018, 8, 64-81 http://www.scirp.org/journal/ojce
ISSN Online: 2164-3172 ISSN Print: 2164-3164
DOI: 10.4236/ojce.2018.81006 Mar. 20, 2018 64 Open Journal of Civil Engineering
Punching and Local Damages of Fiber and FRP Reinforced Concrete under Low-Velocity Impact Load
Kyung-Hwan Min
Rail Research Institute, Chungnam National University, Daejeon, South Korea
Abstract In recent years, the development and application of high performance fiber reinforced concrete or cementitious composites are increasing due to their high ductility and energy absorption characteristics. However, it is difficult to obtain the required properties of the FRCC by simply adding fiber to the con-crete matrix. Many researchers are paying attention to fiber reinforced poly-mers (FRP) for the reinforcement of construction structures because of their significant advantages over high strain rates. However, the actual FRP prod-ucts are skill-dependent, and the quality may not be uniform. Therefore, in this study, two-way punching tests were carried out to evaluate the perfor-mances of FRP strengthened and steel and polyvinyl alcohol (PVA) fiber reinforced concrete specimens for impact and static loads. The FRP reinforced normal concrete (NC), steel fiber reinforced concrete (SFRC), and PVA FRCC specimens showed twice the amount of enhanced dissipated energy (total energy) under impact loadings than the non-retrofitted specimens. In the low-velocity impact test of the two-way NC specimens strengthened by FRPs, the total dissipated energy increased by 4 to 5 times greater than the plain NC series. For the two-way specimens, the total energy increased by 217% be-tween the non-retrofitted SFRC and NC specimens. The total dissipated energy of the CFRP retrofitted SFRC was twice greater than that of the plain SFRC series. The PVA FRCC specimens showed 4 times greater dissipated energy than for the energy of the plain NC specimens. For the penetration of two-way specimens with fibers, the Hughes formula considering the tensile strength of concrete was a better predictor than other empirical formulae.
Keywords Fiber Reinforced Concrete, Steel Fiber, Polyvinyl Alcohol (PVA) Fiber, Fiber Reinforced Polymer (FRP), Low-Velocity Impact Load, Punching, Penetration
How to cite this paper: Min, K.-H. (2018) Punching and Local Damages of Fiber and FRP Reinforced Concrete under Low-Velo- city Impact Load. Open Journal of Civil Engineering, 8, 64-81. https://doi.org/10.4236/ojce.2018.81006 Received: February 1, 2018 Accepted: March 17, 2018 Published: March 20, 2018 Copyright © 2018 by author and Scientific Research Publishing Inc. This work is licensed under the Creative Commons Attribution International License (CC BY 4.0). http://creativecommons.org/licenses/by/4.0/
Open Access
K.-H. Min
DOI: 10.4236/ojce.2018.81006 65 Open Journal of Civil Engineering
Depth
1. Introduction
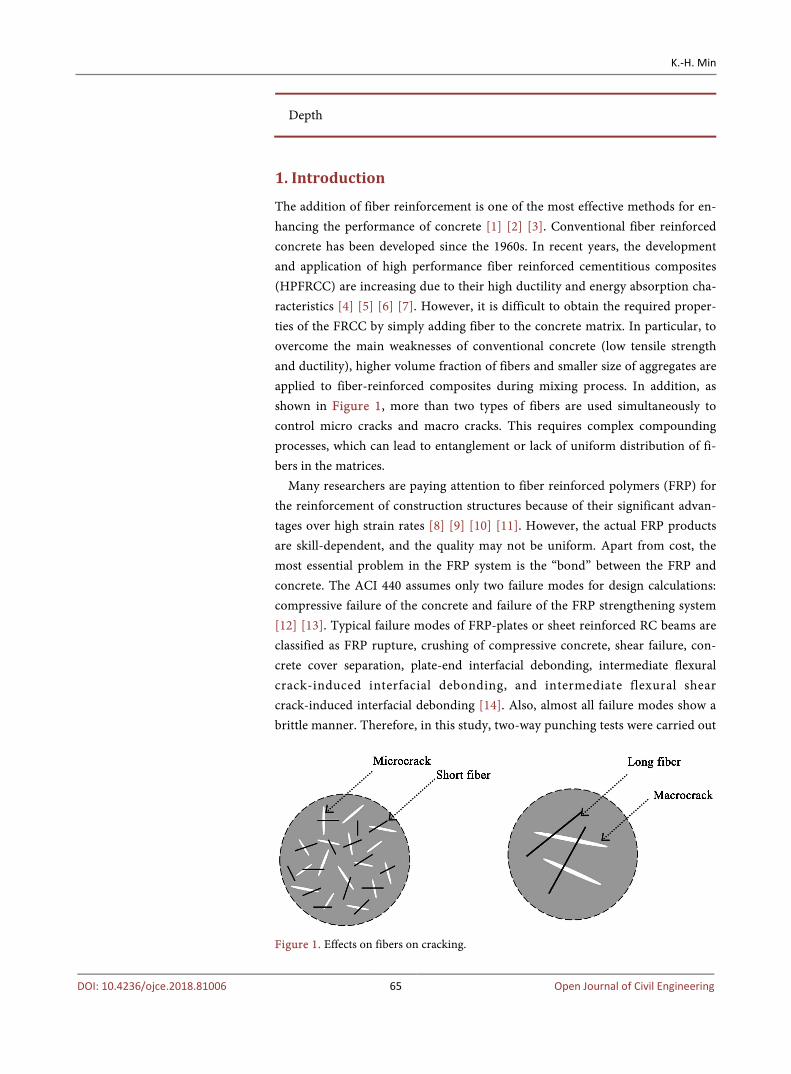
The addition of fiber reinforcement is one of the most effective methods for en-hancing the performance of concrete [1] [2] [3]. Conventional fiber reinforced concrete has been developed since the 1960s. In recent years, the development and application of high performance fiber reinforced cementitious composites (HPFRCC) are increasing due to their high ductility and energy absorption cha-racteristics [4] [5] [6] [7]. However, it is difficult to obtain the required proper-ties of the FRCC by simply adding fiber to the concrete matrix. In particular, to overcome the main weaknesses of conventional concrete (low tensile strength and ductility), higher volume fraction of fibers and smaller size of aggregates are applied to fiber-reinforced composites during mixing process. In addition, as shown in Figure 1, more than two types of fibers are used simultaneously to control micro cracks and macro cracks. This requires complex compounding processes, which can lead to entanglement or lack of uniform distribution of fi-bers in the matrices.
Many researchers are paying attention to fiber reinforced polymers (FRP) for the reinforcement of construction structures because of their significant advan-tages over high strain rates [8] [9] [10] [11]. However, the actual FRP products are skill-dependent, and the quality may not be uniform. Apart from cost, the most essential problem in the FRP system is the “bond” between the FRP and concrete. The ACI 440 assumes only two failure modes for design calculations: compressive failure of the concrete and failure of the FRP strengthening system [12] [13]. Typical failure modes of FRP-plates or sheet reinforced RC beams are classified as FRP rupture, crushing of compressive concrete, shear failure, con-crete cover separation, plate-end interfacial debonding, intermediate flexural crack-induced interfacial debonding, and intermediate flexural shear crack-induced interfacial debonding [14]. Also, almost all failure modes show a brittle manner. Therefore, in this study, two-way punching tests were carried out
Figure 1. Effects on fibers on cracking.
K.-H. Min
DOI: 10.4236/ojce.2018.81006 66 Open Journal of Civil Engineering
to evaluate the performances of FRP strengthened and steel and synthetic fiber reinforced concrete specimens for impact and static loads.
2. Experimental Programs 2.1. Test Variables
The test variables in this study are summarized in Table 1. Three concrete ma-trices (normal concrete (NC), steel fiber reinforced concrete (SFRC), and hybrid PVA fiber reinforced cementitious composite (FRCC), were used to fabricate the test specimens. Table 2 shows the mix proportions of the concrete matrix. Or-dinary Portland cement was used for a 40 MPa design strength NC. For the NC’s mixture, 50% water to cement ratio (W/C) was applied. Aggregates were crushed gravels with a maximum size of 20 mm, and sea sand. In order to achieve wor-kability, a liquid type polycarboxylate super-plasticizer was injected. A 0.75% volume fraction of long steel fiber (30 mm end hooked) was applied into the normal concrete mixture for the steel fiber reinforced concrete (SFRC).
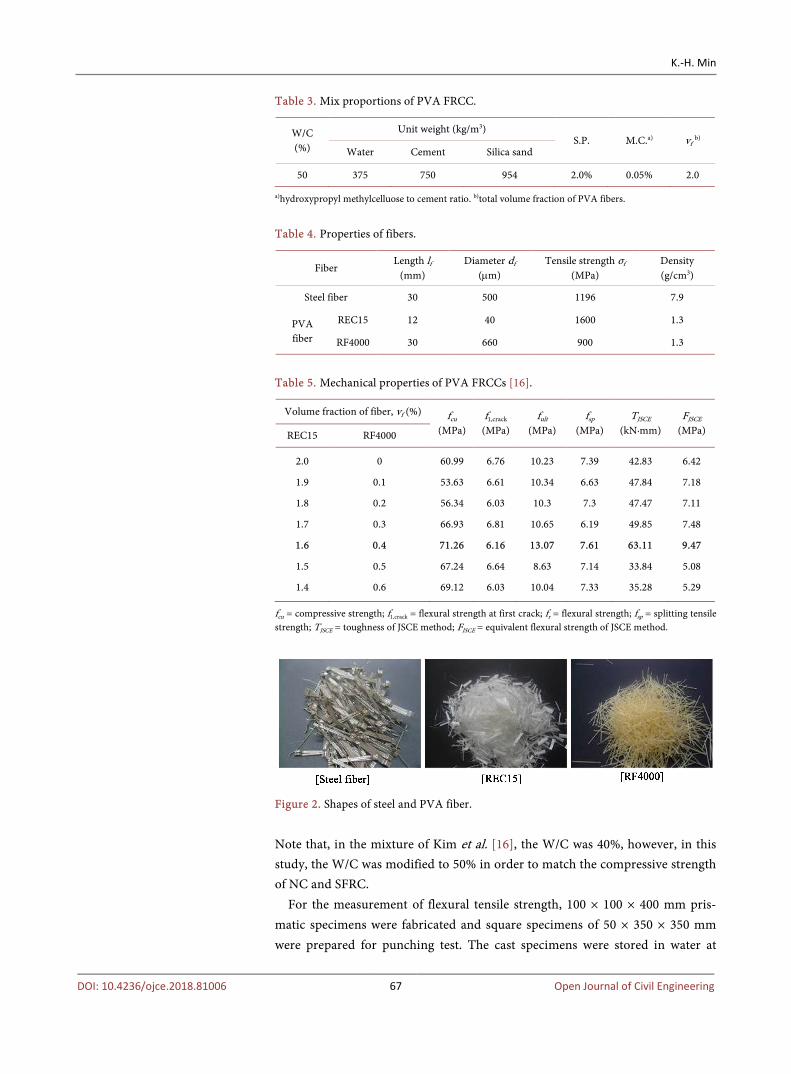
Table 3 presents the mix proportions of PVA FRCC [6] [7] [15] [16]. In the PVA FRCC mixture, there is no coarse aggregate, but 100 to 120 µm silica sand only used for an aggregate. Properties of steel and PVA fiber are summarized in Table 4 and shapes of fiber are shown in Figure 2. The total volume of fraction of the PVA fiber is 2%. In actual mixtures, two different PVA fibers were used, simultaneously, and a ratio of two fibers was selected from compressive and flex-ural strength tests [6] [7] [16]. From the mechanical tests, as summarized in Table 5, 1.6% and 0.4% for short (REC15) and long (RF4000) selected, respectively. Table 1. Variables of material test.
Variable Details Notation
Concrete
Normal concrete (NC) N
Steel fiber reinforced concrete (SFRC) S
Hybrid PVA fiber reinforced cementitious composite (FRCC) P
FRP strengthening
Not retrofitted
GFRP G
CFRP C
Angle of fabrics ±45° ±45
0/90° 0/90
Table 2. Mix proportions of NC and SFRC.
W/C (%)
S/a (%)
Unit weight (kg/m3) S.P.a) vf
b) Water Cement Fine aggregate Coarse aggregate
50 50.4 204 408 876 863 1.0% 0.75%
a)high range water reducing admixture to cement ratio. b)volume fraction of steel fiber on SFRC.
K.-H. Min
DOI: 10.4236/ojce.2018.81006 67 Open Journal of Civil Engineering
Table 3. Mix proportions of PVA FRCC.
W/C (%)
Unit weight (kg/m3) S.P. M.C.a) vf b)
Water Cement Silica sand
50 375 750 954 2.0% 0.05% 2.0
a)hydroxypropyl methylcelluose to cement ratio. b)total volume fraction of PVA fibers.
Table 4. Properties of fibers.
Fiber Length lf
(mm) Diameter df
(µm) Tensile strength σf
(MPa) Density (g/cm3)
Steel fiber 30 500 1196 7.9
PVA fiber
REC15 12 40 1600 1.3
RF4000 30 660 900 1.3
Table 5. Mechanical properties of PVA FRCCs [16].
Volume fraction of fiber, vf (%) fcu
(MPa) f1,crack
(MPa) fult
(MPa) fsp
(MPa) TJSCE
(kN·mm) FJSCE
(MPa) REC15 RF4000
2.0
1.9
1.8
1.7
1.6
1.5
1.4
0
0.1
0.2
0.3
0.4
0.5
0.6
60.99
53.63
56.34
66.93
71.26
67.24
69.12
6.76
6.61
6.03
6.81
6.16
6.64
6.03
10.23
10.34
10.3
10.65
13.07
8.63
10.04
7.39
6.63
7.3
6.19
7.61
7.14
7.33
42.83
47.84
47.47
49.85
63.11
33.84
35.28
6.42
7.18
7.11
7.48
9.47
5.08
5.29
fcu = compressive strength; f1,crack = flexural strength at first crack; fr = flexural strength; fsp = splitting tensile strength; TJSCE = toughness of JSCE method; FJSCE = equivalent flexural strength of JSCE method.
Figure 2. Shapes of steel and PVA fiber.
Note that, in the mixture of Kim et al. [16], the W/C was 40%, however, in this study, the W/C was modified to 50% in order to match the compressive strength of NC and SFRC.
For the measurement of flexural tensile strength, 100 × 100 × 400 mm pris-matic specimens were fabricated and square specimens of 50 × 350 × 350 mm were prepared for punching test. The cast specimens were stored in water at
K.-H. Min
DOI: 10.4236/ojce.2018.81006 68 Open Journal of Civil Engineering
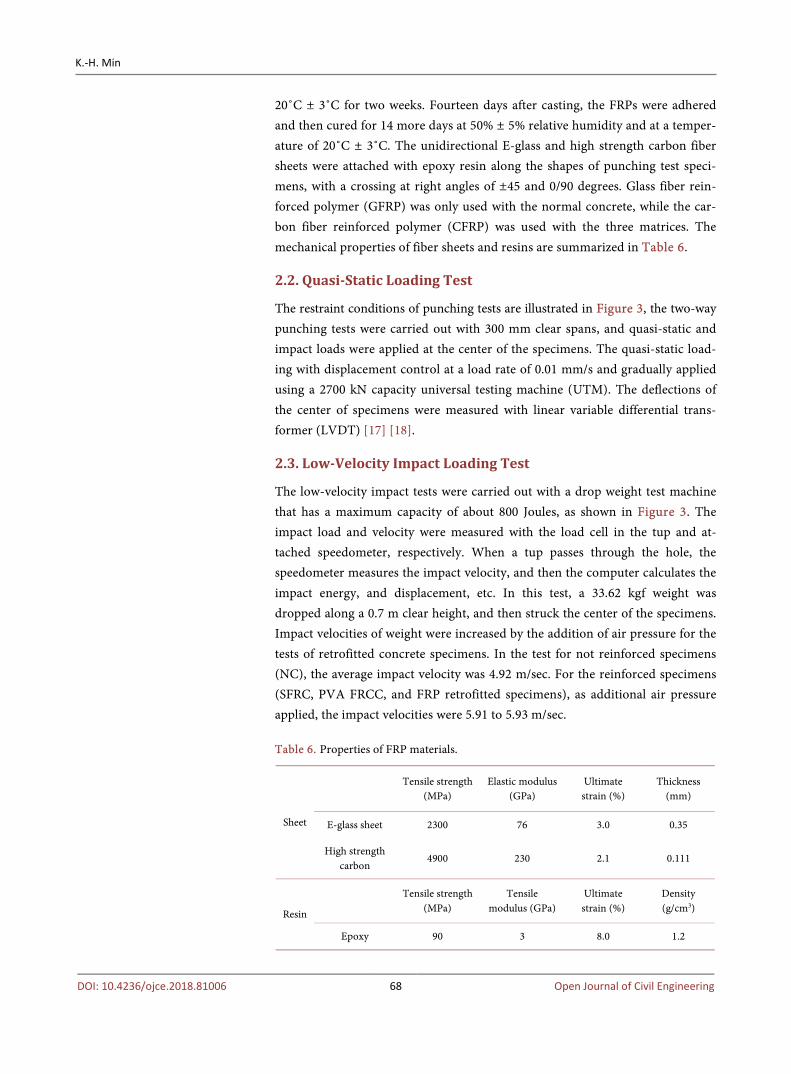
20˚C ± 3˚C for two weeks. Fourteen days after casting, the FRPs were adhered and then cured for 14 more days at 50% ± 5% relative humidity and at a temper-ature of 20˚C ± 3˚C. The unidirectional E-glass and high strength carbon fiber sheets were attached with epoxy resin along the shapes of punching test speci-mens, with a crossing at right angles of ±45 and 0/90 degrees. Glass fiber rein-forced polymer (GFRP) was only used with the normal concrete, while the car-bon fiber reinforced polymer (CFRP) was used with the three matrices. The mechanical properties of fiber sheets and resins are summarized in Table 6.
2.2. Quasi-Static Loading Test
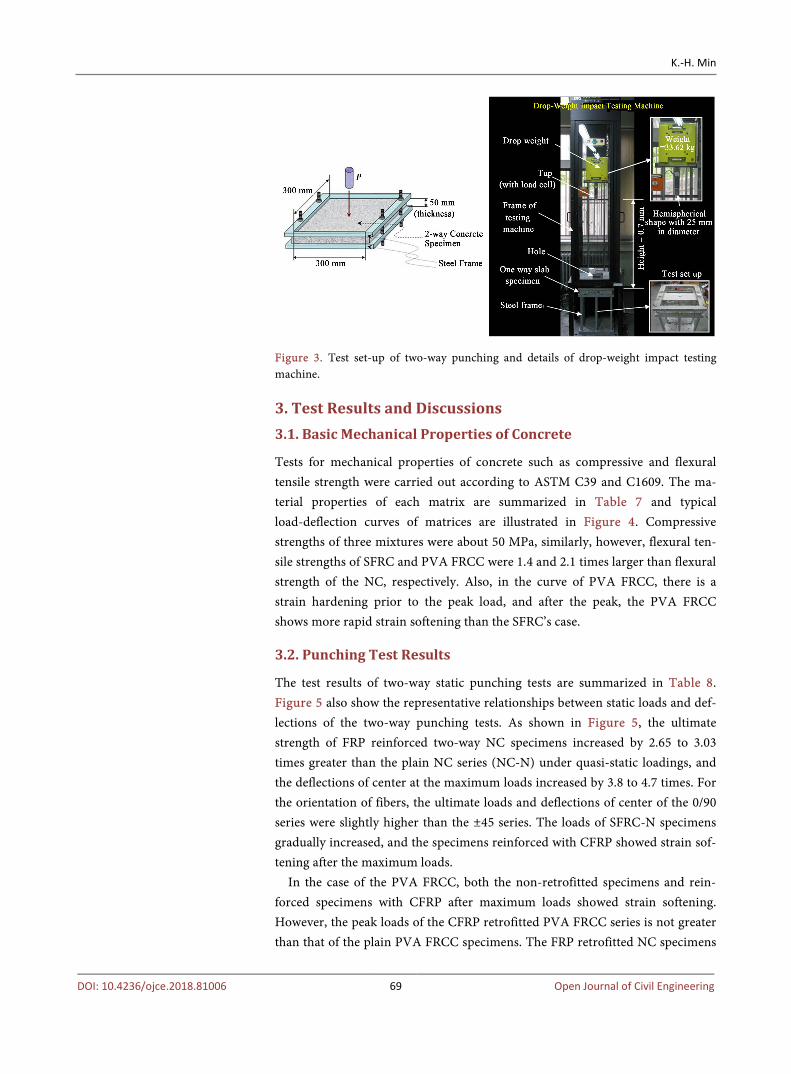
The restraint conditions of punching tests are illustrated in Figure 3, the two-way punching tests were carried out with 300 mm clear spans, and quasi-static and impact loads were applied at the center of the specimens. The quasi-static load-ing with displacement control at a load rate of 0.01 mm/s and gradually applied using a 2700 kN capacity universal testing machine (UTM). The deflections of the center of specimens were measured with linear variable differential trans-former (LVDT) [17] [18].
2.3. Low-Velocity Impact Loading Test
The low-velocity impact tests were carried out with a drop weight test machine that has a maximum capacity of about 800 Joules, as shown in Figure 3. The impact load and velocity were measured with the load cell in the tup and at-tached speedometer, respectively. When a tup passes through the hole, the speedometer measures the impact velocity, and then the computer calculates the impact energy, and displacement, etc. In this test, a 33.62 kgf weight was dropped along a 0.7 m clear height, and then struck the center of the specimens. Impact velocities of weight were increased by the addition of air pressure for the tests of retrofitted concrete specimens. In the test for not reinforced specimens (NC), the average impact velocity was 4.92 m/sec. For the reinforced specimens (SFRC, PVA FRCC, and FRP retrofitted specimens), as additional air pressure applied, the impact velocities were 5.91 to 5.93 m/sec. Table 6. Properties of FRP materials.
Sheet
Tensile strength
(MPa) Elastic modulus
(GPa) Ultimate strain (%)
Thickness (mm)
E-glass sheet 2300 76 3.0 0.35
High strength carbon
4900 230 2.1 0.111
Resin
Tensile strength (MPa)
Tensile modulus (GPa)
Ultimate strain (%)
Density (g/cm3)
Epoxy 90 3 8.0 1.2
K.-H. Min
DOI: 10.4236/ojce.2018.81006 69 Open Journal of Civil Engineering
Figure 3. Test set-up of two-way punching and details of drop-weight impact testing machine.
3. Test Results and Discussions 3.1. Basic Mechanical Properties of Concrete
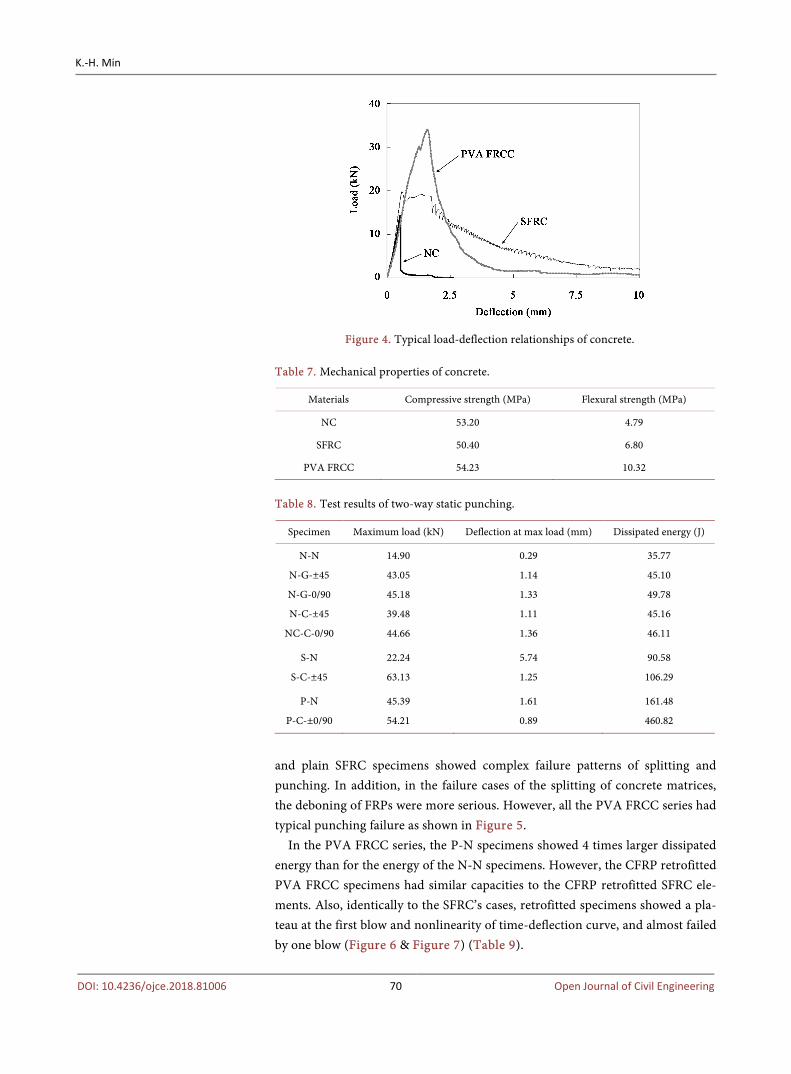
Tests for mechanical properties of concrete such as compressive and flexural tensile strength were carried out according to ASTM C39 and C1609. The ma-terial properties of each matrix are summarized in Table 7 and typical load-deflection curves of matrices are illustrated in Figure 4. Compressive strengths of three mixtures were about 50 MPa, similarly, however, flexural ten-sile strengths of SFRC and PVA FRCC were 1.4 and 2.1 times larger than flexural strength of the NC, respectively. Also, in the curve of PVA FRCC, there is a strain hardening prior to the peak load, and after the peak, the PVA FRCC shows more rapid strain softening than the SFRC’s case.
3.2. Punching Test Results
The test results of two-way static punching tests are summarized in Table 8. Figure 5 also show the representative relationships between static loads and def-lections of the two-way punching tests. As shown in Figure 5, the ultimate strength of FRP reinforced two-way NC specimens increased by 2.65 to 3.03 times greater than the plain NC series (NC-N) under quasi-static loadings, and the deflections of center at the maximum loads increased by 3.8 to 4.7 times. For the orientation of fibers, the ultimate loads and deflections of center of the 0/90 series were slightly higher than the ±45 series. The loads of SFRC-N specimens gradually increased, and the specimens reinforced with CFRP showed strain sof-tening after the maximum loads.
In the case of the PVA FRCC, both the non-retrofitted specimens and rein-forced specimens with CFRP after maximum loads showed strain softening. However, the peak loads of the CFRP retrofitted PVA FRCC series is not greater than that of the plain PVA FRCC specimens. The FRP retrofitted NC specimens
K.-H. Min
DOI: 10.4236/ojce.2018.81006 70 Open Journal of Civil Engineering
Figure 4. Typical load-deflection relationships of concrete.
Table 7. Mechanical properties of concrete.
Materials Compressive strength (MPa) Flexural strength (MPa)
NC 53.20 4.79
SFRC 50.40 6.80
PVA FRCC 54.23 10.32
Table 8. Test results of two-way static punching.
Specimen Maximum load (kN) Deflection at max load (mm) Dissipated energy (J)
N-N
N-G-±45
N-G-0/90
N-C-±45
NC-C-0/90
14.90
43.05
45.18
39.48
44.66
0.29
1.14
1.33
1.11
1.36
35.77
45.10
49.78
45.16
46.11
S-N
S-C-±45
22.24
63.13
5.74
1.25
90.58
106.29
P-N
P-C-±0/90
45.39
54.21
1.61
0.89
161.48
460.82
and plain SFRC specimens showed complex failure patterns of splitting and punching. In addition, in the failure cases of the splitting of concrete matrices, the deboning of FRPs were more serious. However, all the PVA FRCC series had typical punching failure as shown in Figure 5.
In the PVA FRCC series, the P-N specimens showed 4 times larger dissipated energy than for the energy of the N-N specimens. However, the CFRP retrofitted PVA FRCC specimens had similar capacities to the CFRP retrofitted SFRC ele-ments. Also, identically to the SFRC’s cases, retrofitted specimens showed a pla-teau at the first blow and nonlinearity of time-deflection curve, and almost failed by one blow (Figure 6 & Figure 7) (Table 9).
K.-H. Min
DOI: 10.4236/ojce.2018.81006 71 Open Journal of Civil Engineering
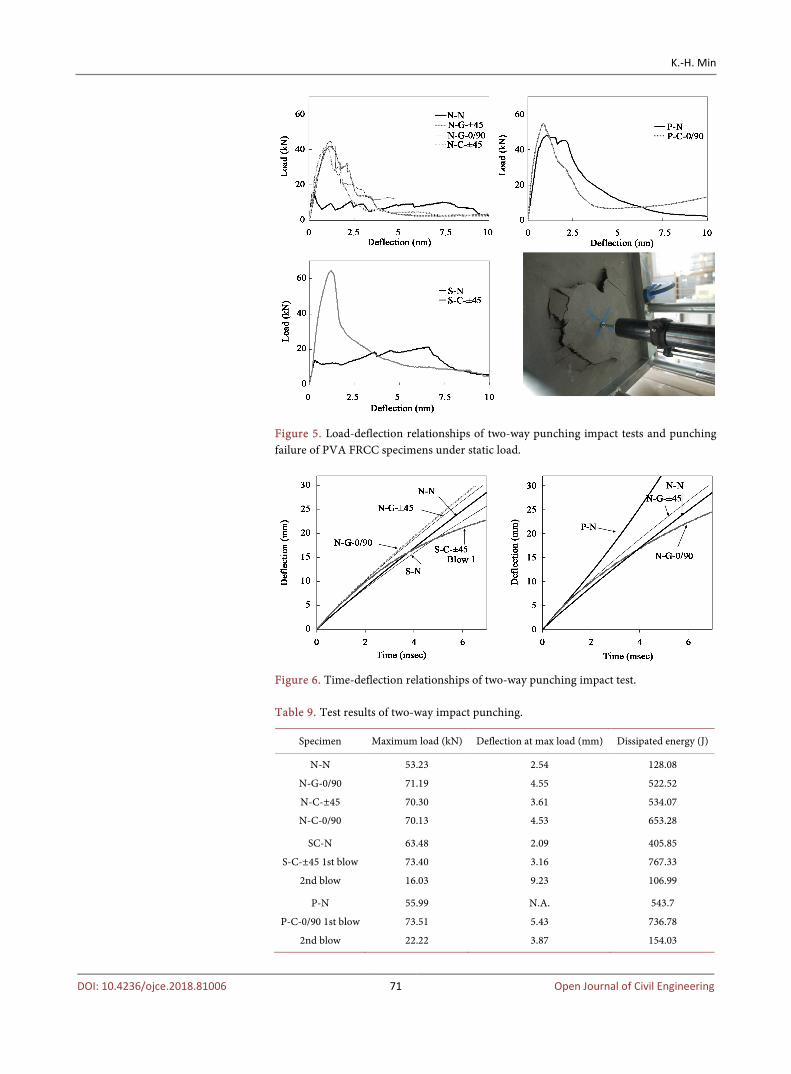
Figure 5. Load-deflection relationships of two-way punching impact tests and punching failure of PVA FRCC specimens under static load.
Figure 6. Time-deflection relationships of two-way punching impact test. Table 9. Test results of two-way impact punching.
Specimen Maximum load (kN) Deflection at max load (mm) Dissipated energy (J)
N-N
N-G-0/90
N-C-±45
N-C-0/90
53.23
71.19
70.30
70.13
2.54
4.55
3.61
4.53
128.08
522.52
534.07
653.28
SC-N
S-C-±45 1st blow
2nd blow
63.48
73.40
16.03
2.09
3.16
9.23
405.85
767.33
106.99
P-N
P-C-0/90 1st blow
2nd blow
55.99
73.51
22.22
N.A.
5.43
3.87
543.7
736.78
154.03
K.-H. Min
DOI: 10.4236/ojce.2018.81006 72 Open Journal of Civil Engineering
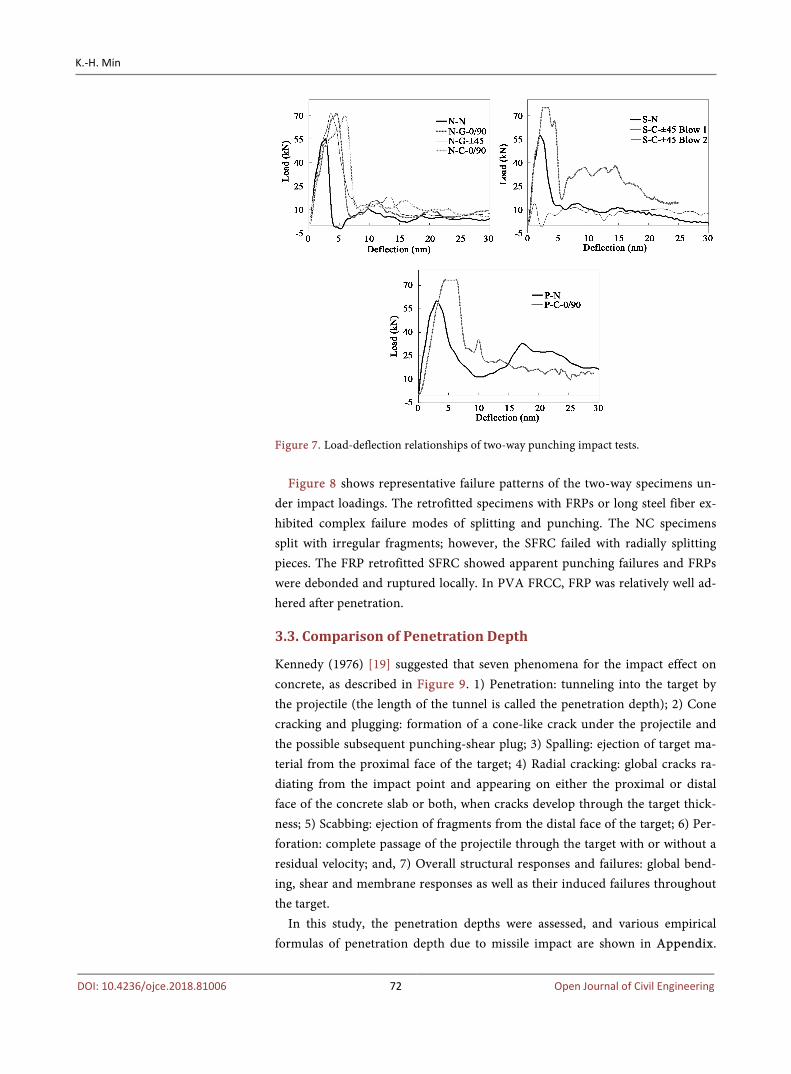
Figure 7. Load-deflection relationships of two-way punching impact tests.
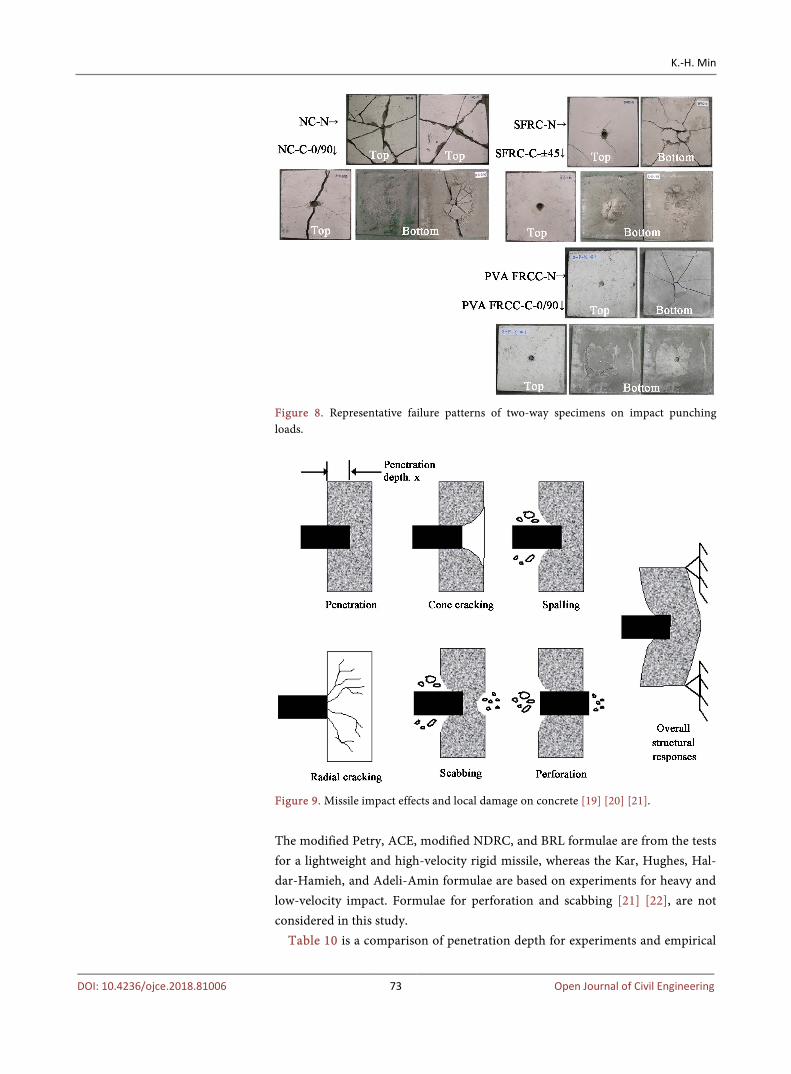
Figure 8 shows representative failure patterns of the two-way specimens un-der impact loadings. The retrofitted specimens with FRPs or long steel fiber ex-hibited complex failure modes of splitting and punching. The NC specimens split with irregular fragments; however, the SFRC failed with radially splitting pieces. The FRP retrofitted SFRC showed apparent punching failures and FRPs were debonded and ruptured locally. In PVA FRCC, FRP was relatively well ad-hered after penetration.
3.3. Comparison of Penetration Depth
Kennedy (1976) [19] suggested that seven phenomena for the impact effect on concrete, as described in Figure 9. 1) Penetration: tunneling into the target by the projectile (the length of the tunnel is called the penetration depth); 2) Cone cracking and plugging: formation of a cone-like crack under the projectile and the possible subsequent punching-shear plug; 3) Spalling: ejection of target ma-terial from the proximal face of the target; 4) Radial cracking: global cracks ra-diating from the impact point and appearing on either the proximal or distal face of the concrete slab or both, when cracks develop through the target thick-ness; 5) Scabbing: ejection of fragments from the distal face of the target; 6) Per-foration: complete passage of the projectile through the target with or without a residual velocity; and, 7) Overall structural responses and failures: global bend-ing, shear and membrane responses as well as their induced failures throughout the target.
In this study, the penetration depths were assessed, and various empirical formulas of penetration depth due to missile impact are shown in Appendix.
K.-H. Min
DOI: 10.4236/ojce.2018.81006 73 Open Journal of Civil Engineering
Figure 8. Representative failure patterns of two-way specimens on impact punching loads.
Figure 9. Missile impact effects and local damage on concrete [19] [20] [21].
The modified Petry, ACE, modified NDRC, and BRL formulae are from the tests for a lightweight and high-velocity rigid missile, whereas the Kar, Hughes, Hal-dar-Hamieh, and Adeli-Amin formulae are based on experiments for heavy and low-velocity impact. Formulae for perforation and scabbing [21] [22], are not considered in this study.
Table 10 is a comparison of penetration depth for experiments and empirical
K.-H. Min
DOI: 10.4236/ojce.2018.81006 74 Open Journal of Civil Engineering
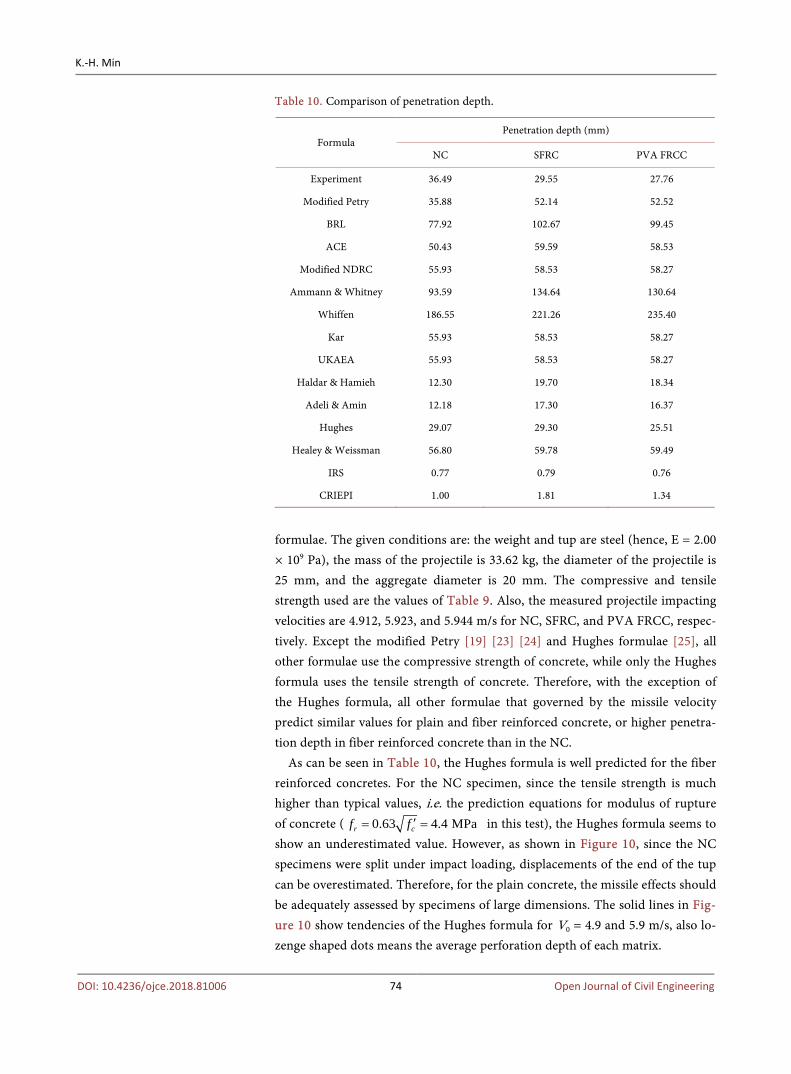
Table 10. Comparison of penetration depth.
Formula Penetration depth (mm)
NC SFRC PVA FRCC
Experiment 36.49 29.55 27.76
Modified Petry 35.88 52.14 52.52
BRL 77.92 102.67 99.45
ACE 50.43 59.59 58.53
Modified NDRC 55.93 58.53 58.27
Ammann & Whitney 93.59 134.64 130.64
Whiffen 186.55 221.26 235.40
Kar 55.93 58.53 58.27
UKAEA 55.93 58.53 58.27
Haldar & Hamieh 12.30 19.70 18.34
Adeli & Amin 12.18 17.30 16.37
Hughes 29.07 29.30 25.51
Healey & Weissman 56.80 59.78 59.49
IRS 0.77 0.79 0.76
CRIEPI 1.00 1.81 1.34
formulae. The given conditions are: the weight and tup are steel (hence, E = 2.00 × 10⁹ Pa), the mass of the projectile is 33.62 kg, the diameter of the projectile is 25 mm, and the aggregate diameter is 20 mm. The compressive and tensile strength used are the values of Table 9. Also, the measured projectile impacting velocities are 4.912, 5.923, and 5.944 m/s for NC, SFRC, and PVA FRCC, respec-tively. Except the modified Petry [19] [23] [24] and Hughes formulae [25], all other formulae use the compressive strength of concrete, while only the Hughes formula uses the tensile strength of concrete. Therefore, with the exception of the Hughes formula, all other formulae that governed by the missile velocity predict similar values for plain and fiber reinforced concrete, or higher penetra-tion depth in fiber reinforced concrete than in the NC.
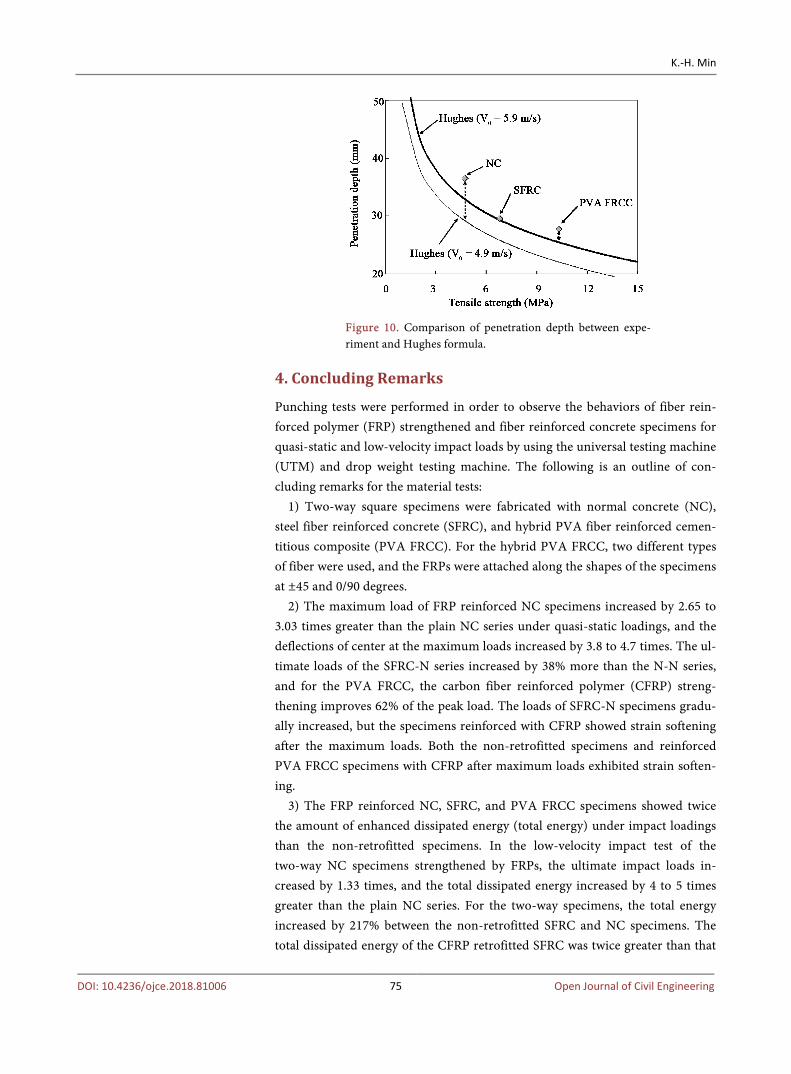
As can be seen in Table 10, the Hughes formula is well predicted for the fiber reinforced concretes. For the NC specimen, since the tensile strength is much higher than typical values, i.e. the prediction equations for modulus of rupture of concrete ( 0.63 4.4 MPar cf f ′= = in this test), the Hughes formula seems to show an underestimated value. However, as shown in Figure 10, since the NC specimens were split under impact loading, displacements of the end of the tup can be overestimated. Therefore, for the plain concrete, the missile effects should be adequately assessed by specimens of large dimensions. The solid lines in Fig-ure 10 show tendencies of the Hughes formula for V0 = 4.9 and 5.9 m/s, also lo-zenge shaped dots means the average perforation depth of each matrix.
K.-H. Min
DOI: 10.4236/ojce.2018.81006 75 Open Journal of Civil Engineering
Figure 10. Comparison of penetration depth between expe-riment and Hughes formula.
4. Concluding Remarks
Punching tests were performed in order to observe the behaviors of fiber rein-forced polymer (FRP) strengthened and fiber reinforced concrete specimens for quasi-static and low-velocity impact loads by using the universal testing machine (UTM) and drop weight testing machine. The following is an outline of con-cluding remarks for the material tests:
1) Two-way square specimens were fabricated with normal concrete (NC), steel fiber reinforced concrete (SFRC), and hybrid PVA fiber reinforced cemen-titious composite (PVA FRCC). For the hybrid PVA FRCC, two different types of fiber were used, and the FRPs were attached along the shapes of the specimens at ±45 and 0/90 degrees.
2) The maximum load of FRP reinforced NC specimens increased by 2.65 to 3.03 times greater than the plain NC series under quasi-static loadings, and the deflections of center at the maximum loads increased by 3.8 to 4.7 times. The ul-timate loads of the SFRC-N series increased by 38% more than the N-N series, and for the PVA FRCC, the carbon fiber reinforced polymer (CFRP) streng-thening improves 62% of the peak load. The loads of SFRC-N specimens gradu-ally increased, but the specimens reinforced with CFRP showed strain softening after the maximum loads. Both the non-retrofitted specimens and reinforced PVA FRCC specimens with CFRP after maximum loads exhibited strain soften-ing.
3) The FRP reinforced NC, SFRC, and PVA FRCC specimens showed twice the amount of enhanced dissipated energy (total energy) under impact loadings than the non-retrofitted specimens. In the low-velocity impact test of the two-way NC specimens strengthened by FRPs, the ultimate impact loads in-creased by 1.33 times, and the total dissipated energy increased by 4 to 5 times greater than the plain NC series. For the two-way specimens, the total energy increased by 217% between the non-retrofitted SFRC and NC specimens. The total dissipated energy of the CFRP retrofitted SFRC was twice greater than that
K.-H. Min
DOI: 10.4236/ojce.2018.81006 76 Open Journal of Civil Engineering
of the plain SFRC series. In the PVA FRCC series, the P-N specimens showed 4 times greater dissipated energy than for the energy of the N-N specimens. How-ever, the CFRP retrofitted PVA FRCC specimens had similar capacities to the CFRP retrofitted SFRC elements.
4) For the penetration of two-way specimens with steel fiber, the Hughes formula considering the tensile strength of concrete was a better predictor than other empirical formulae. However, for plain concrete, specimens need to be of larger size to avoid splitting failure. In addition, penetration depth due to missile impact may be much different due to the tensile strength of fiber reinforced concrete, so it should be improved through various experiments.
References [1] Bindiganavile, V., Banthia, N. and Aarup, B. (2002) Impact Response of Ul-
tra-High-Strength Fiber-Reinforced Cement Composite. ACI Material Journal, 99, 543-548.
[2] Rao, H.S., Ghorpade, V.G., Ramana, N.V. and Gnanwswar, K. (2010) Response of SIFCON Two-Way Slabs under Impact Loading. International Journal of Impact Engineering, 37, 452-458. https://doi.org/10.1016/j.ijimpeng.2009.06.003
[3] Sukontajukkul, P., Mindess, S., Banthia, N. and Mikami, T. (2001) Impact Resis-tance of Laterally Confined Fibre Reinforced Concrete Plates. Material and Struc-tures, 34, 612-618. https://doi.org/10.1007/BF02482128
[4] Habel, K. and Gauvreau, P. (2008) Response of Ultra-High Performance Fiber Reinforced Concrete (UHPFRC) to Impact and Static Loading. Cement and Con-crete Composite, 30, 938-946. https://doi.org/10.1016/j.cemconcomp.2008.09.001
[5] Li, V.C. (2005) Engineered Cementitious Composites. Proceedings of the 3rd Interna-tional Conference on Construction Materials, D-documents/1-05-SS-GF01_FP.pdf, 22-24August, 2005, Vancouver, Canada.
[6] Min, K.H., Cho, S.H., Kim, Y.W., Shin, H.O. and Yoon, Y.S. (2009) Assessment on Impact Resisting Performance of HPFRCCs Using Hybrid PVA Fibers. Proceedings of the 2nd International Workshop on Performance, Protection & Strengthening of Structures under Extreme Loading, 19-21 August 2009, Hayama, Japan.
[7] Min, K.H., Kim, Y.W., Yang, J.M., Lee, J.S. and Yoon, Y.S. (2009) Enhancing the Flexural Performance of Hybrid HPFRCC. Proceedings of the 4th International Conference on Construction Materials: Performance, Innovations and Structural Implications, August 24-26, 2009, Nagoya, Japan.
[8] Buchan, P.A. and Chen, J.F. (2007) Blast Resistance of FRP Composites and Poly-mer Strengthened Concrete and Masonry Structures—A State-of-The-Art Review. Composite Part B: Engineering, 38, 509-522. https://doi.org/10.1016/j.compositesb.2006.07.009
[9] Chen, C.C. and Li, C.Y. (2005) Punching Shear Strength of Reinforced Concrete Slabs Strengthened with Glass Fiber Reinforced Polymer Laminates. ACI Structural Journal, 102, 535-542.
[10] Malvar, L.J., Crawford, J.E. and Morrill, K.B. (2007) Use of Composites to Resist Blast. Journal of Composite for Construction, 11, 601-610. https://doi.org/10.1061/(ASCE)1090-0268(2007)11:6(601)
[11] Silva, P.F. and Lu, B. (2007) Improving the Blast Resistance Capacity of RC Slabs with Innovative Composite Materials. Composite Part B: Engineering, 38, 523-534.
K.-H. Min
DOI: 10.4236/ojce.2018.81006 77 Open Journal of Civil Engineering
https://doi.org/10.1016/j.compositesb.2006.06.015
[12] ACI Committee 440 (2002) Guide for the Design and Construction of Externally Bonded FRP Systems for Strengthening Concrete Structures, ACI 440.2R-02. American Concrete Institute, MI, USA.
[13] Bank, L.C. (2006) Composites for Construction: Structural Design with FRP Mate-rials. John Wiley & Sons, NJ, USA, 214-271. https://doi.org/10.1002/9780470121429
[14] Teng, J.G., Chen, J.F., Smith, S.T. and Lam, L. (2002) FRP-Strengthened RC Struc-tures. John Wiley & Sons, West Sussex, UK, 31-46.
[15] Kim, Y.W. (2008) Enhancing the Structural Behavior of High-Performance Fiber Reinforced Cementitious Composites Using Hybrid PVA Fibers. M.Sc. Thesis, Ko-rea University, South Korea.
[16] Kim, Y.W., Min, K.H., Yang, J.M. and Yoon, Y.S. (2008) Flexural and Impact Re-sisting Performance of HPFRCCs using Hybrid PVA Fibers. Journal of the Korea Concrete Institute, 21, 705-712. (In Korean) https://doi.org/10.4334/JKCI.2009.21.6.705
[17] Min, K.H., Yang, J.M., Yoo, D.Y. and Yoon, Y.S. (2010) Flexural and Punching Performances of FRP and Fiber Reinforced Concrete in Impact Loading. Proceed-ings of the 5th International Conference on FRP Composites in Civil Engineering, Beijing, 27-29 September 2010, 410-414.
[18] Min, K.H., Shin, H.O., Yoo, D.Y. and Yoon, Y.S. (2011) Flexural and Punching Beha-viors of Concrete Strengthening with FRP Sheets and Steel Fibers under Low-Velocity Impact Loading. Journal of the Korea Concrete Institute, 23, 31-38. (In Korean) https://doi.org/10.4334/JKCI.2011.23.1.031
[19] Kennedy, R.P. (1976) A Review of Procedures for the Analysis and Design of Con-crete Structures to Resist Missile Impact Effects. Nuclear Engineering and Design, 37, 183-203. https://doi.org/10.1016/0029-5493(76)90015-7
[20] Berriaud, C., Sokolovsky, A., Gueraud, R., Dulac, J. and Labrot, R. (1978) Local Be-haviour of Reinforced Concrete Walls under Missile Impact. Nuclear Engineering and Design, 45, 457-469. https://doi.org/10.1016/0029-5493(78)90235-2
[21] Li, Q.M., Reid, S.R., Wen, H.M. and Telford, A.R. (2005) Local Impact Effects of Hard Missiles on Concrete Targets. International Journal of Impact Engineering, 32, 224-284. https://doi.org/10.1016/j.ijimpeng.2005.04.005
[22] Chung, C.H., Choi, H., Lee, J.W. and Choi, K.R. (2010) Evaluation of Local Effect Prediction Formulas for RC Slabs Subjected to Impact Loading. Journal of Korean Civil Engineering Society, 30, 543-560. (In Korean)
[23] Samuely, F.J. and Hamann, C.W. (1939) Civil Protection. The Architectural Press, Princeton.
[24] Amirikian, A. (1950) Design of Protective Structures (A New Concept of Structural Behavior). Report NT-3726, Bureau of Yards and Docks, Department of the Navy.
[25] Hughes, G. (1984) Hard Missile Impact on Reinforced Concrete. Nuclear Engi-neering and Design, 77, 23-35. https://doi.org/10.1016/0029-5493(84)90058-X
[26] Gwaltney, R.C. (1968) Missile Generation and Protection in Light-Water-Cooled Power Reactor Plants. ORNL NSIC-22, Oak Ridge National Laboratory, Oak Ridge.
[27] Adeli, H. and Amin, A.M. (1985) Local Effects of Impactors on Concrete Structures. Nuclear Engineering and Design, 88, 301-317. https://doi.org/10.1016/0029-5493(85)90165-7
[28] Bangash, M.Y.H. (1989) Concrete and Concrete Structures: Numerical Modelling
K.-H. Min
DOI: 10.4236/ojce.2018.81006 78 Open Journal of Civil Engineering
and Application. Elsevier Applied Science, London.
[29] Chelapati, C.V., Kennedy, R.P. and Wall, I.B. (1972) Probabilistic Assessment of Air-craft Hazard for Nuclear Power Plants. Nuclear Engineering and Design, 19, 333-364. https://doi.org/10.1016/0029-5493(72)90136-7
[30] ACE (1946) Fundamentals of Protective Design. Report AT120 AT1207821, Army Corps of Engineers, Office of the Chief of Engineers.
[31] Kennedy, R.P. (1966) Effects of an Aircraft Crash into a Concrete Reactor Con-tainment Building. Holmes & Narver Inc., Anaheim.
[32] NDRC (1946) Effects of Impact and Explosion. Summary Technical Report of Divi-sion 2, Vol. 1, National Defense Research Committee, Washington DC.
[33] Whiffen, P. (1943) UK Road Research Laboratory. Note No. MOS/311.
[34] Kar, A.K. (1978) Local Effects of Tornado-Generated Missiles. Journal of the Struc-tural Division, 104, 809-816.
[35] Barr, P. (1990) Guidelines for the Design and Assessment of Concrete Structures Subjected to Impact. Report, UK Atomic Energy Authority, Safety and Reliability Directorate, HMSO, London.
[36] Haldar, A. and Hamieh, H. (1984) Local Effect of Solid Missiles on Concrete Struc-tures. Journal of Structural Engineering, 110, 948-960. https://doi.org/10.1061/(ASCE)0733-9445(1984)110:5(948)
[37] Haldar, A. (1985) Energy-Balanced Approach to Evaluation Local Effects of Impact of Nondeformable Missiles on Concrete Structures. Transactions of the Interna-tional Conference on Structural Mechanics in Reactor Technology, J, 203-214.
[38] Bangash, M.Y.H. (1993) Impact and Explosion: Structural Analysis and Design. CRC Press, Boca Raton.
[39] Kojima, I. (1991) An Experimental Study on Local Behaviour of Reinforced Con-crete Slabs to Missile Impact. Nuclear Engineering and Design, 130, 121-132. https://doi.org/10.1016/0029-5493(91)90121-W
K.-H. Min
DOI: 10.4236/ojce.2018.81006 79 Open Journal of Civil Engineering
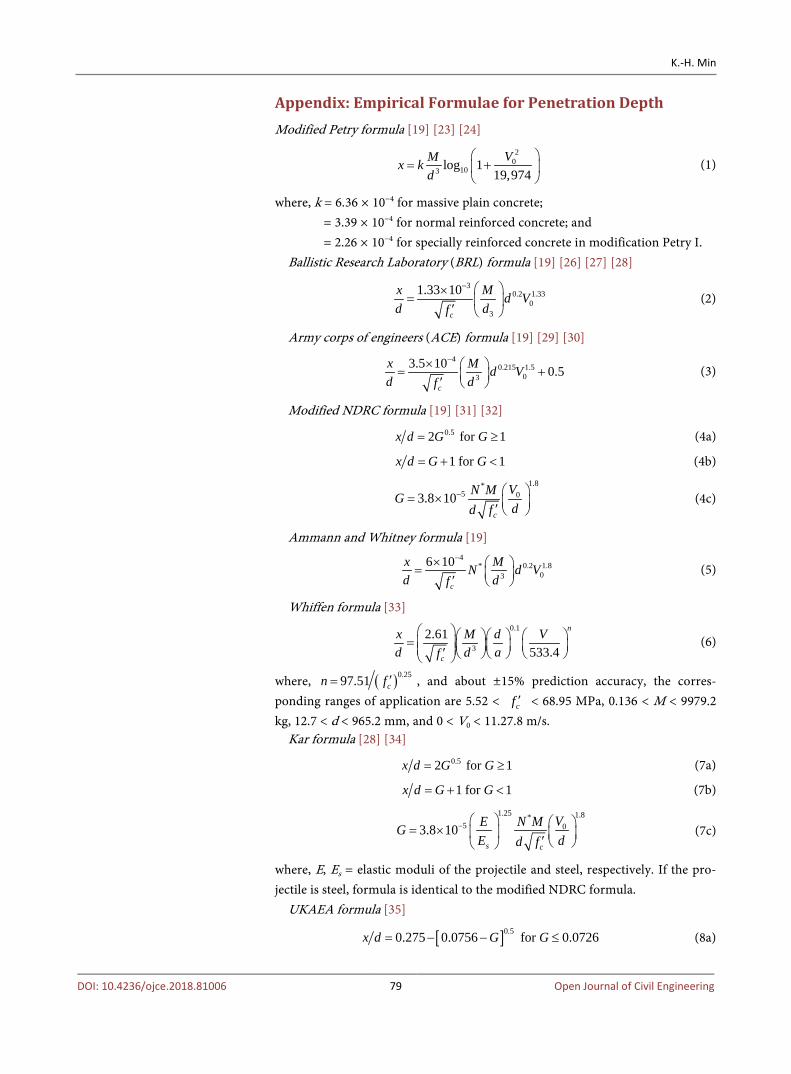
Appendix: Empirical Formulae for Penetration Depth
Modified Petry formula [19] [23] [24] 2
0103 log 1
19,974VMx k
d
= +
(1)
where, k = 6.36 × 10⁻⁴ for massive plain concrete; = 3.39 × 10⁻⁴ for normal reinforced concrete; and = 2.26 × 10⁻⁴ for specially reinforced concrete in modification Petry I. Ballistic Research Laboratory (BRL) formula [19] [26] [27] [28]
30.2 1.33
03
1.33 10
c
x M d Vd df
− ×= ′
(2)
Army corps of engineers (ACE) formula [19] [29] [30] 4
0.215 1.503
3.5 10 0.5c
x M d Vd df
−× = + ′ (3)
Modified NDRC formula [19] [31] [32] 0.52 for 1x d G G= ≥ (4a)
1 for 1x d G G= + < (4b) 1.8*
5 03.8 10c
VN MGdd f
− = × ′ (4c)
Ammann and Whitney formula [19] 4
* 0.2 1.803
6 10
c
x MN d Vd df
−× = ′ (5)
Whiffen formula [33] 0.1
32.61
533.4
n
c
x M d Vd adf
= ′ (6)
where, ( )0.2597.51 cn f ′= , and about ±15% prediction accuracy, the corres-ponding ranges of application are 5.52 < cf ′ < 68.95 MPa, 0.136 < M < 9979.2 kg, 12.7 < d < 965.2 mm, and 0 < V0 < 11.27.8 m/s.
Kar formula [28] [34] 0.52 for 1x d G G= ≥ (7a)
1 for 1x d G G= + < (7b)
1.25 1.8*5 03.8 10
s c
VE N MGE dd f
− = × ′ (7c)
where, E, Es = elastic moduli of the projectile and steel, respectively. If the pro-jectile is steel, formula is identical to the modified NDRC formula.
UKAEA formula [35]
[ ]0 50.275 0.0756 for 0.0726.x d G G= − − ≤ (8a)
K.-H. Min
DOI: 10.4236/ojce.2018.81006 80 Open Journal of Civil Engineering
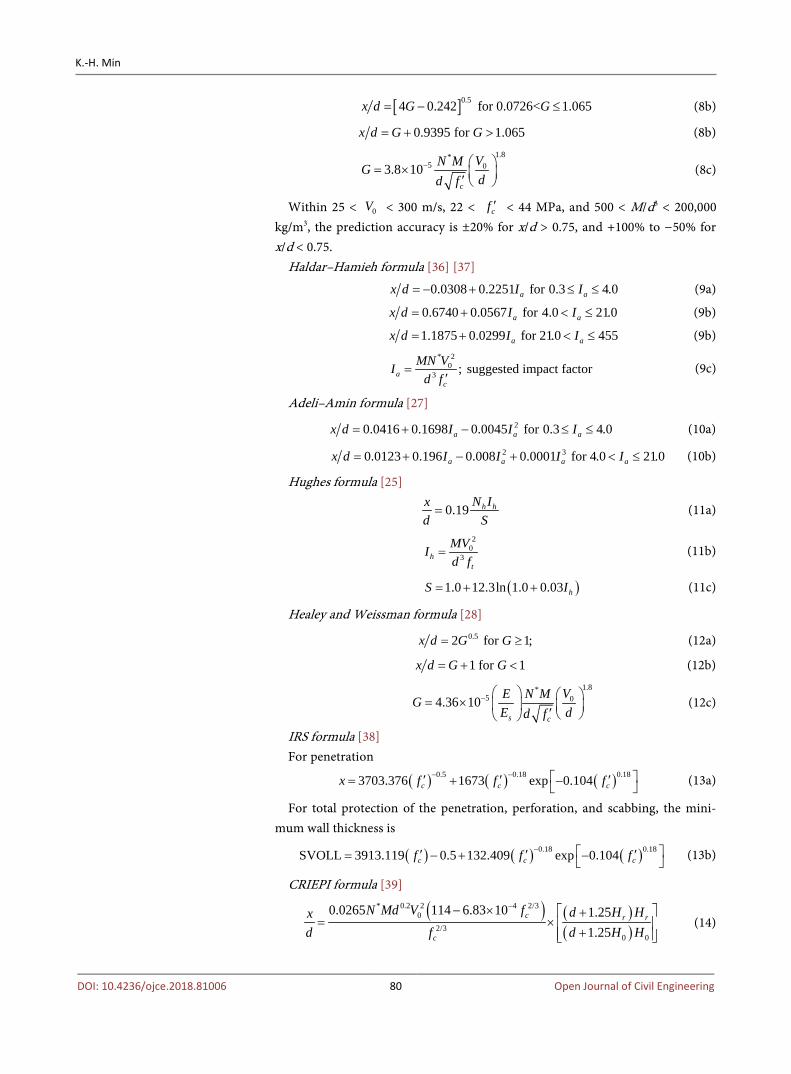
[ ]0 54 0.242 for 0.0726< 1.065.x d G G= − ≤ (8b)
0.9395 for 1.065x d G G= + > (8b) 1.8*
5 03.8 10c
VN MGdd f
− = × ′ (8c)
Within 25 < 0V < 300 m/s, 22 < cf ′ < 44 MPa, and 500 < M/d3 < 200,000 kg/m3, the prediction accuracy is ±20% for x/d > 0.75, and +100% to −50% for x/d < 0.75.
Haldar–Hamieh formula [36] [37]
0.0308 0.2251 for 0.3 4.0a ax d I I= − + ≤ ≤ (9a)
0.6740 0.0567 for 4.0 21.0a ax d I I= + < ≤ (9b)
1.1875 0.0299 for 21.0 455a ax d I I= + < ≤ (9b) * 2
03 ; suggested impact factora
c
MN VId f
=′
(9c)
Adeli–Amin formula [27] 20.0416 0.1698 0.0045 for 0.3 4.0a a ax d I I I= + − ≤ ≤ (10a)
2 30.0123 0.196 0.008 0.0001 for 4.0 21.0a a a ax d I I I I= + − + < ≤ (10b)
Hughes formula [25]
0.19 h hN Ixd S= (11a)
20
3ht
MVId f
= (11b)
( )1.0 12.3ln 1.0 0.03 hS I= + + (11c)
Healey and Weissman formula [28] 0.52 for 1;x d G G= ≥ (12a)
1 for 1x d G G= + < (12b) 1.8*
5 04.36 10s c
VE N MGE dd f
− = × ′ (12c)
IRS formula [38] For penetration
( ) ( ) ( )0.5 0.18 0.183703.376 1673 exp 0.104c c cx f f f− − ′ ′ ′= + − (13a)
For total protection of the penetration, perforation, and scabbing, the mini-mum wall thickness is
( ) ( ) ( )0.18 0.18SVOLL 3913.119 0.5 132.409 exp 0.104c c cf f f− ′ ′ ′= − + − (13b)
CRIEPI formula [39]
( ) ( )( )
* 0.2 2 4 2/30
2/30 0
0.0265 114 6.83 10 1.251.25
c r r
c
N Md V f d H Hxd d H Hf
−− × += × +
(14)
K.-H. Min
DOI: 10.4236/ojce.2018.81006 81 Open Journal of Civil Engineering
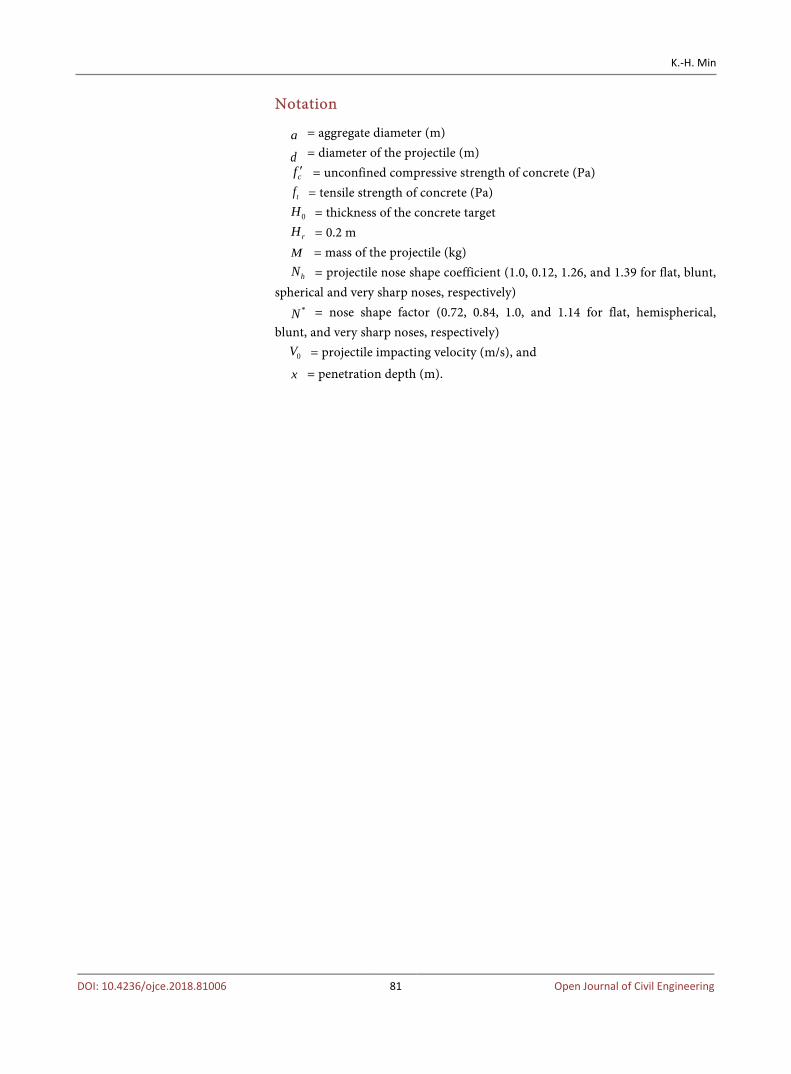
Notation
a = aggregate diameter (m)
d = diameter of the projectile (m)
cf ′ = unconfined compressive strength of concrete (Pa)
tf = tensile strength of concrete (Pa)
0H = thickness of the concrete target
rH = 0.2 m M = mass of the projectile (kg)
hN = projectile nose shape coefficient (1.0, 0.12, 1.26, and 1.39 for flat, blunt, spherical and very sharp noses, respectively)
*N = nose shape factor (0.72, 0.84, 1.0, and 1.14 for flat, hemispherical, blunt, and very sharp noses, respectively)
0V = projectile impacting velocity (m/s), and
x = penetration depth (m).