Embed Size (px)
Citation preview
101
Punishment and Status i
Emma von Essen, Eva Ranehillii
Abstract
Social hierarchy is part of human interaction in all societies, and hierarchical
systems are sustained by social norms and their enforcement. In this study,
we investigate how relative social status influences norm enforcement in a
dictator game with third party punishment. Status is conveyed by surname;
half of the third parties are matched with a dictator with a noble name and
half with a dictator with a common name. Receivers and third parties all
have common names. We find that third parties facing a low-status male
dictator punish to a greater extent than third parties facing a dictator from
any other social category. Interestingly, discriminatory behavior occurs only
in male-to-male interactions. For offers below 40 percent of the allocated
resource, male third parties punish a low-status male dictator almost twice as
much as his high-status counterpart. Thus, exposure to economic punishment
is significantly impacted by social status in our sample.
Keywords: status, punishment, discrimination, experiment
i EFI Working Paper Series in Economics and Finance 2012. No. 732.
ii E. Ranehill, Department of Economics, University of Zürich, Blümlisalpstrasse 10, 8006
Zürich, Switzerland. Email: [email protected]
102
Introduction
Social hierarchies are pervasive in human society, and a large body of re-
search underlines the fundamental importance of relative social status for
individual life outcomes such as well-being, health, morbidity, survival (e.g.
Boyce, 2004; Clark and Oswald, 1996; Sapolsky, 2005, 2004), cognition
(e.g. Lovaglia et al., 1998; Newman et al., 2005), and social behavior (e.g.
Hong and Bohnet, 2006; Kumru and Vesterlund, 2008; Piff et al. 2010).
Still, we know little about how relative social status influences economic
decision-making. Research in psychology and sociology indicates that rela-
tive social status has profound effects on behavior in human interactions. For
example, social status has been shown to form explicit and implicit percep-
tions of performance, deservingness, and action possibilities, which in turn
affect actual behavior. Relative social status consequently shapes what is
considered appropriate in social situations (e.g. Berger et al. 1985; Bourdieu,
1984; Cummins, 2000; Driskell and Mullen, 1990; Festinger 1954; Ridge-
way and Walker, 1995; Weber, 1924).1
In this study, we investigate how the relative social status of the dictator,
conveyed by noble and common names, influences the use of economic pun-
ishment in a dictator game with third party punishment. We also study the
impact of the dictator’s social status on generosity in a dictator game. Asso-
ciation with high-status individuals may convey advantages, and this factor
may influence who we treat well in pursuit of such an association, or who we
deal with carefully to avoid conflict.2 Social status may therefore have impli-
cations for many everyday economic decisions. From a larger perspective,
social status may have implications for core economic issues such as indi-
vidual economic outcomes, social mobility, or equity. As an illustration of
this, high social status as conveyed by a noble name has been shown to be an
asset in the marriage market, implying an economic premium (Almenberg
1 See for example the literature on status characteristics theory, originally developed by Ber-
ger et al. (1966). This theory suggests that in newly constituted task-oriented groups, power
and prestige rankings arise in parallel to initial individual characteristics (such as skin color,
gender, age, or height) even when individual status characteristics have no relation to task
performance. Although the theory has also been criticized (Simpson and Walker, 2002), a
large literature of theoretical and empirical studies confirms that status characteristics have
powerful and predictable effects on how we judge other individuals, and what we expect from
them. For an literature overview, see Berger et al. 1980 and Ridgeway and Walker 1995; for
examples of empirical work, see Kalkhoff and Barnum, 2000 and Ridgeway et al., 1998. For
similar thoughts in economics, see the work by Akerlof and Kranton (2000) discussing the
impact of identity and social category on economic behavior. 2 Another example demonstrating how much we value being associated with high-status
individuals is the phenomenon of celebrity auctions, where buyers pay enormous sums for
seemingly ordinary objects such as Britney Spears’ used chewing gum or a lock of Justin
Bieber’s hair (http://news.bbc.co.uk/2/hi/entertainment/3604616.stm, accessed at 13:30 on
2011-10-28, and http://www.bbc.co.uk/newsbeat/12645673, accessed at 13:30 on 2011-10-
28).
103
and Dreber, 2009). A recent study (Clark, 2012) used names from the noble
elite of the 1700s to show that Sweden’s social mobility rates are much low-
er than found in previous studies. Noble names have been, and are still to-
day, overrepresented in high-status professions and education, despite an
active Swedish policy aimed at increasing social mobility through institu-
tional arrangements such as free education and universal access to student
grants and loans.
There is an extensive body of research describing the importance of for-
mal and informal sanctions for norm compliance, both in the lab and in the
field (e.g. Carpenter and Matthews, 2005; Fehr and Gächter, 2000; Ostrom,
2000). In society, sanctions are often imposed by third parties in order to
assure impartiality. However, numerous studies of court proceedings find
that third parties judge in favor of higher status individuals (e.g. Abrams et
al., forthcoming; Phillips, 2009; Sarnecki et al., 2006).3 It is therefore im-
portant to investigate how relative social status influences economic interac-
tion. However, there is very little economics research on this topic.
Status is often defined as the honor or prestige attached to one's position
in society; in other words, it is a commonly recognized ranking of individu-
als. Many definitions of social status include the aspect that high status im-
plies favorable treatment and increased access to resources (e.g. Ball et al.,
2001; Fershtman and Gneezy, 2001; Weiss and Ferschtman, 1998).
A few previous laboratory studies also suggest that possessing relatively
high status implies an economic advantage. Ball et al. (2001) and Ball and
Eckel (1996, 1998) find that high-status participants receive better offers in
an ultimatum game and a double oral auction with experimentally-induced
status. This effect is persistent even in a treatment where allocation to the
high-status group is obviously random. However, the effect disappears when
low-status participants are unaware of the status allocated to high status par-
ticipants. This indicates that high social status induces favorable treatment at
least partly due to deference by lower-status individuals. Preferential treat-
ment of high-status participants is also found in studies by Glaeser et al.
(2000), and Harbaugh et al. (2001), using the trust game. In both studies,
participants of high status elicit more trustworthy behavior from the trus-
tees.4 These studies investigate the impact of social status in a non-
anonymous setting, and hence cannot measure the effect of social status ex-
3 In contrast to how status affects our judgments of others, there is a large literature focusing
on improving and signaling social status by consumption of goods and services for the prima-
ry purpose of displaying wealth and income; a phenomenon labeled “conspicuous consump-
tion” (e.g. Frank, 2000; Veblen, 1899). Related to this, a number of laboratory studies also
show that individuals are willing to increase their effort or sacrifice resources to improve their
relative ranking (e.g. Charness et al., 2010; Rustichini and Vostroknutov, 2008). 4 Glaeser et al. (2000) investigate behavior in a sample of Harvard undergraduates. The partic-
ipants meet their counterpart before they are separated again to play the trust game. Status
variables included hours worked for pay, hours spent volunteering, father’s education, number
of close friends, and proxies for popularity. Harbaugh et al. (2001) study the behavior of
children aged 8, 11, 14, and 17, with age used as a status marker.
104
cluding effects of reputational or strategic concerns. In addition, they inves-
tigate the effect of relative social status only in the reward domain.5 By defi-
nition, hierarchy establishes a vertical order of who gets to sanction whom.
Relative social status may have different implications in the reward and the
punishment domain, as hostile acts towards a superior may be a more deli-
cate matter than hostile acts towards subordinates. Altruistic acts may be less
dependent on their recipient.
A few previous studies in economics confirm that punishment by a third
party is likely to be shaped by the social context, such as parochialism, or the
relationship between the victim and the punisher (Bernhard et al., 2006;
Goette et al., 2006; Lieberman and Linke, 2007). Closest to our study is
probably the work of Hoff et al. (2011). In their experiment, low-caste indi-
viduals in India punish the violation of a cooperative norm less than high-
caste individuals. However, their results seem to be driven by group mem-
bership rather than by the ordinal social status of the castes.
This study is, to the best of our knowledge, the first to investigate the in-
fluence of social status on punishment in relation to the violation of an egali-
tarian norm. This makes it possible to compare how relative status affects
decisions of generosity as well as decisions to sanction non-generous behav-
ior. By using noble names as a status manipulation, we make use of an exist-
ing and commonly occurring status marker, rather than one induced in the
laboratory. We thereby avoid drawing any attention to the manipulation it-
self, thus preventing experimenter demand effects. As discussed below,
names have been used in a number of previous studies as an indicator of
social category. Our use of names also allows us to be the first to explore
whether the implications of social status are gendered.6
Nobility, as an indicator of ascribed status, is a good example to illustrate
the implications of social status. Nobility as a social rank has been prominent
in all European countries since the Middle Ages, and Asian nobility dates
back even further. However, today most countries forbid the attachment of
any privilege to nobility. The Swedish nobility lost its last privileges in the
19th century. Thus, in contrast to for example the caste system in India, Swe-
dish nobility is not formally politically relevant in society today.7 At present,
a noble name therefore has the advantage of being clearly separated from
merit. However, the surnames remain as explicit hereditary status markers.8
5 Ball and Eckel (1996) perform ultimatum games with status manipulations, but report no
results regarding the responders’ behavior. 6 Gender itself is highly connected to social status, and previous research indicates that men
are more sensitive to social hierarchies (Campbell, 2002). For example, male groups have
been shown to develop steeper hierarchies than female and mixed groups (Colarelli et al.,
2006). 7 Situations where caste is relevant in India include politically-enforced affirmative action in
education, and jobs that rely entirely on caste-based quotas (i.e. the caste-based reservations). 8 The last occasion on which a person was raised to the nobility in Sweden was in 1902, and
the Swedish monarch has since lost the right to ennoble. Surnames pertaining to a specific
family benefit from stronger protection in the Swedish name law than more frequently-
105
There is extensive evidence that names and titles convey social status. For
example, field experiments using different names for job applicants show
that employers discriminate against women and those with black or minority
names (e.g. Arai, Bursell, and Nekby, 2011; Bertrand and Mullainathan,
2004; Carlsson and Rooth, 2007).9 Previous literature also documents a ten-
dency for minority groups to adopt names common in the dominant culture
in order to gain acceptance. As an example, Watkins and London (1994) find
assimilation to common American names when studying name changing
behavior among immigrants in the USA. Pertaining to noble names, there is
anecdotal evidence of individuals spending considerable sums to acquire a
noble name and title, suggesting that noble names are coveted.10
In this study, we only vary the social status of the dictators. All participat-
ing third parties play against one of four individuals who participate as dicta-
tors in every session. The group of dictators consists of two men and two
women. One dictator of each gender has a noble name indicating high social
status; the other had a common name indicating low status. We find that
third parties matched with the low-status male dictator punished to a greater
extent than third parties matched with the low-status female dictator, the
high-status male dictator, or high-status female dictator. Interestingly, this
discrimination occurs only in male-to-male interactions. For dictator offers
below 40 percent, male third parties punish male dictators of low status al-
most twice as much as their high-status counterparts. The effect of social
status on the punishment of violations of an egalitarian norm, in male-to-
male interactions, thus appears to be sizable, and bears economic relevance.
We find no support for female discrimination.
Differential treatment in the third party punishment game can arise due to
at least three diverse reasons. First, if altruistic behavior evolved as norm-
enforcing mechanisms within relatively stable groups of individuals, altruis-
tic punishment should be more prevalent among in-group members. This can
lead to differential treatment if low-status males are considered in-group and
high-status males are considered out-group. We call this mechanism “the in-
group mechanism”. Second, the high-status group may be treated advanta-
geously simply because high status carries a positive connotation and high-
status individuals are more liked than low-status individuals. We label this
mechanism “high-status favoritism”. A third possibility is that the vertical
order that constitutes social status influences the use of punishment to a larg-
er degree than giving, such that high-status individuals are treated with leni-
ency when violating an egalitarian norm. This mechanism we label “lenien-
occurring names (for a discussion of the Swedish name law, see Arai and Skogman Thoursie,
2009). 9 However, non-experimental studies exploring the effect of minority names on life outcomes
reveal mixed results (Aura and Hess, 2010; Fryer and Levitt, 2004). 10 For example, a simple search on the internet indicates a long list of websites selling titles
for various prices. Two such examples are www.regaltitles.com (accessed at 13:20 on 2011-
10-28) and www.elitetitles.co.uk/ (accessed at 13:20 on 2011-10-28).
106
cy”.
In order to disentangle these effects, we also conducted a dictator game.
Given our previous results, this game was run using only male participants.
If high-status individuals are punished less in the third party punishment
game due to the in-group mechanism, we would expect to observe higher
transfers to low-status recipients in the dictator game (all third parties are of
low status). If discriminatory behavior primarily arises due to high group
favoritism, we should observe lower transfers to low-status recipients in the
dictator game. Finally, if high-status individuals are punished less due to
leniency, we would observe no or little difference in transfers between the
groups in the dictator game.
We find no difference in giving based on recipient status in the dictator
game. We thus conclude that status has a different implication in the giving
and punishment domain; higher-status individuals are simply treated with
leniency when violating social norms.
The rest of this article is organized as follows. Section two describes the
experiment design, and section three presents our results. We conclude with
section four, where we discuss the possible explanations for our findings as
well as future research.
Experimental design
The study consisted of two separate economic games: a third party punish-
ment game and a dictator game, each with the same status manipulation.
Social status was differentiated via the dictators’ surnames, as explained
below. All participants in the third party punishment game received a partic-
ipation fee of SEK 50.11
The third party punishment game was implemented using the methods of
Fehr and Fischbacher (2004), who were the first to use a dictator game with
third party punishment to investigate norm enforcement. The game has three
participants: a dictator, a recipient, and a third party. In our setting, the dicta-
tor is endowed with SEK 100 and the third party is endowed with SEK 50.
The recipient is given no money and makes no decisions. The dictator is
permitted to transfer money to the recipient in multiples of SEK 10, with a
maximum of SEK 50.12
The third party then decides whether or not to punish
the dictator, as well as the potential level of punishment. In our experiment,
punishment decisions were elicited according to the strategy method.13
For
11 At the time of the experiment, 1 USD corresponded to about SEK 7, so SEK 100 was about
USD 15. 12 We limited the maximum amount to SEK 50 in order to make our results comparable to
previous studies. 13 The strategy method utilizes the elicitation of contingent responses. The third party made a
sanctioning decision contingent on each possible transfer level before being informed of the
dictator’s decision. It is possible that this elicitation method induces different behaviors com-
107
each SEK that the third party pays to punish the dictator, the dictator’s pay-
off is reduced by SEK 3.
The payoffs (Wi) of the third party punishment game are thus:14
Dictator: Wd(x,p)=100-x-3*p
Third party: Wtp(p)=50-p
Recipient: Wr(x)=x
where x={10, 20, 30, 40, 50} is the sum the dictator transfers to the recipient
and p={0,1,2,...,50} is the punishment imposed by the third party.
Participants were randomly allocated to the roles of recipients and third par-
ties. We recruited four people for the position of dictator: a woman and a
man with the noble name von Essen, and a woman and a man with the com-
mon name Andersson.15
The participants were unaware that one of the au-
thors was also named von Essen.16
The group of four dictators made their
decisions once, and the other participants were then randomly matched with
one of the four dictators. Written instructions were distributed and read be-
fore making the decisions, and all third parties answered a set of control
questions to ensure that they understood the consequences of their decisions.
The recipients were asked to state their expectation concerning the punish-
ment, also using the strategy method.
The status manipulation was apparent only to the third party, who saw the
names of the two dictator game participants at the top of the decision sheet.
The instructions given to the dictator and the recipient contained no such
manipulation. The experiment was thus semi-anonymous in that the third
party knew the name of the dictator they were matched with. In other aspects
pared to a situation where the third party knows the dictator’s transfer decision (called the
“specific response method”). Evidence from Brandts and Charness (2000) and Cason and Mui
(1998) does not indicate that this is the case. 14 Note that dictators could have negative payoffs. 15 These names were used as they are very strong indicators of nobility and non-nobility,
respectively. The prefix “von” is a well-known indicator of Swedish nobility. Swedish law
awards intellectual property rights to surnames depending on how distinct they are, and names
with the prefix “von” and other noble surnames are protected such that a common person
cannot add “von” to their surname (Statistics Sweden
http://www.scb.se/Grupp/allmant/BE0801_2005K04_TI_10_A05ST0504.pdf, accessed on
2009-01-22). Names ending with –sson are the most common names in Sweden. Andersson is
the second most frequent surname, and was chosen as we had easy access to people with that
name who could participate in the study. The noble name of one of the authors was never
revealed to the participants. Due to Swedish tax regulations, we had to collect the name and
address of all participants after the experiment, and so were therefore able to control for
whether the third parties were noble or not. Our sample of third parties did not include any
individuals with a noble name. 16 This experiment was conducted when E. von Essen was in her second year of graduate
studies. At this time, Stockholm University had more than 3300 employees, 1500 PhD stu-
dents, and 60 000 students. It is therefore unlikely that any of the participants, including those
recruited from Stockholm University, associated the name “von Essen” with a PhD student at
the university.
108
the game was anonymous, and the third parties and recipients were aware of
this. Apart from the names on the decision sheet, no reference was made to
status or gender, and during the experiment, no participant indicated any
interest in the names, nor in any aspect of status or gender. After the experi-
ment, all third parties also answered a number of survey questions about age,
gender, income, motives, and beliefs about the dictator’s income and wealth.
This allowed us to control for potential mechanisms driving discriminatory
behavior. For example, beliefs about relative income or wealth could have
influenced decisions in the game. During the experiment, participants in
each role were placed at separate locations and each session took approxi-
mately 20 minutes.
Results
We start by presenting the general results of how the third parties punish the
dictators, and then address the effect of the dictator’s social status and gen-
der on third parties’ decisions. Throughout the analysis we explore the pro-
portion of punishment (i.e. the percentage of those who punished) as well as
the level of punishment. To calculate the proportion of punishment, we cre-
ate a binary variable defined as positive punishment by the third party at any
transfer level. The level of punishment is simply the average punishment
across the third party sample at a specific transfer level. Finally, we discuss
the underlying mechanisms behind the results, by studying behavior in a
dictator game as well as the effect of third party beliefs about dictator wealth
and income.17
General results: third party punishment
Our sample consists of 132 observations of third party behavior, 63 male and
69 female.18
Fourteen of these observations are dropped from the sample, in
most cases because the participants indicated that they knew another partici-
pant, or displayed an inability to understand the experimental setup.19
17 None of our variables were normally distributed according to a skewness and kurtosis test.
For all relevant tests in the analysis, we therefore performed a Mann-Whitney test as well as a
two-sided t-test. Throughout the analysis we refer only to the p-value for the Mann-Whitney
test unless there are differences in significance between the measures (at the 5% level). When
testing the equality between proportions we perform a chi square test and a parametric test of
proportions; the chi square test is presented unless otherwise stated. 18 The participants came from three different universities in Stockholm (Stockholm Universi-
ty, Stockholm School of Economics, and Stockholm Royal School of Technology). We found
no difference in punishment between the three schools. 19 When running the experiment, we considered it important that participants understood the
consequences of their actions. We also wanted to avoid participants with an existing personal
relationship that could influence their behavior. A total of 14 third-party observations are
excluded from the analysis, 8 from males and 6 from females. Ten of these are removed due
109
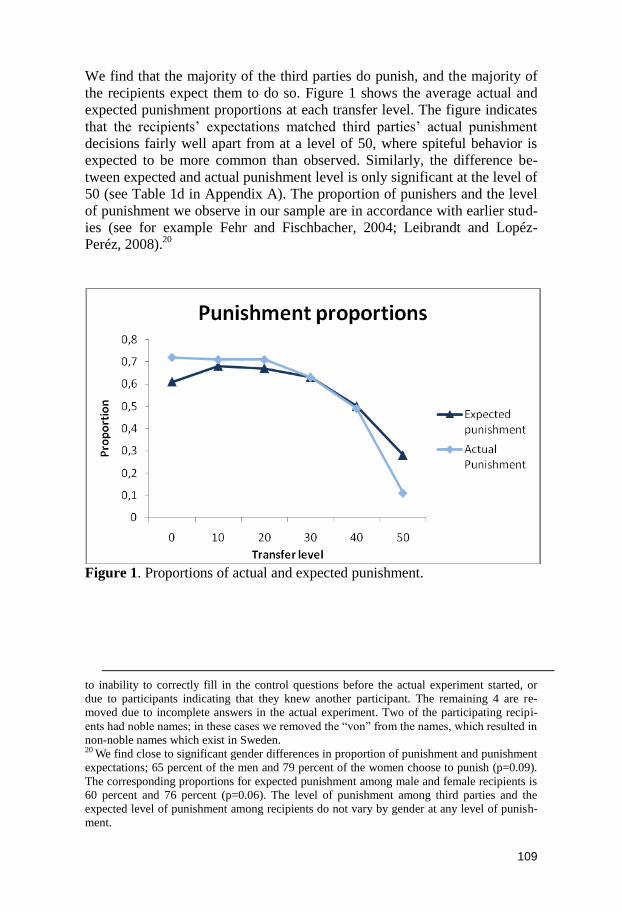
We find that the majority of the third parties do punish, and the majority of
the recipients expect them to do so. Figure 1 shows the average actual and
expected punishment proportions at each transfer level. The figure indicates
that the recipients’ expectations matched third parties’ actual punishment
decisions fairly well apart from at a level of 50, where spiteful behavior is
expected to be more common than observed. Similarly, the difference be-
tween expected and actual punishment level is only significant at the level of
50 (see Table 1d in Appendix A). The proportion of punishers and the level
of punishment we observe in our sample are in accordance with earlier stud-
ies (see for example Fehr and Fischbacher, 2004; Leibrandt and Lopéz-
Peréz, 2008).20
Figure 1. Proportions of actual and expected punishment.
to inability to correctly fill in the control questions before the actual experiment started, or
due to participants indicating that they knew another participant. The remaining 4 are re-
moved due to incomplete answers in the actual experiment. Two of the participating recipi-
ents had noble names; in these cases we removed the “von” from the names, which resulted in
non-noble names which exist in Sweden. 20 We find close to significant gender differences in proportion of punishment and punishment
expectations; 65 percent of the men and 79 percent of the women choose to punish (p=0.09).
The corresponding proportions for expected punishment among male and female recipients is
60 percent and 76 percent (p=0.06). The level of punishment among third parties and the
expected level of punishment among recipients do not vary by gender at any level of punish-
ment.
110
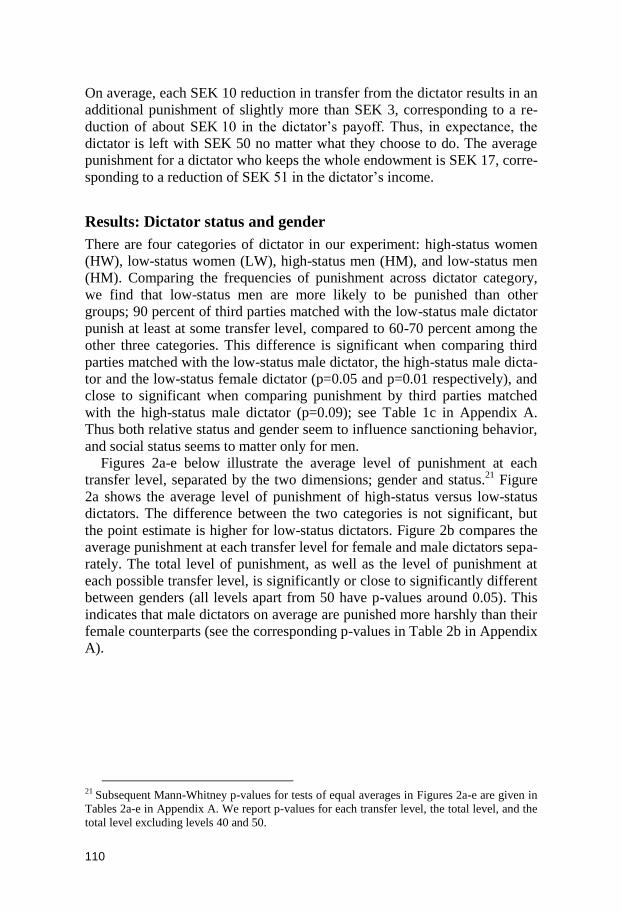
On average, each SEK 10 reduction in transfer from the dictator results in an
additional punishment of slightly more than SEK 3, corresponding to a re-
duction of about SEK 10 in the dictator’s payoff. Thus, in expectance, the
dictator is left with SEK 50 no matter what they choose to do. The average
punishment for a dictator who keeps the whole endowment is SEK 17, corre-
sponding to a reduction of SEK 51 in the dictator’s income.
Results: Dictator status and gender
There are four categories of dictator in our experiment: high-status women
(HW), low-status women (LW), high-status men (HM), and low-status men
(HM). Comparing the frequencies of punishment across dictator category,
we find that low-status men are more likely to be punished than other
groups; 90 percent of third parties matched with the low-status male dictator
punish at least at some transfer level, compared to 60-70 percent among the
other three categories. This difference is significant when comparing third
parties matched with the low-status male dictator, the high-status male dicta-
tor and the low-status female dictator (p=0.05 and p=0.01 respectively), and
close to significant when comparing punishment by third parties matched
with the high-status male dictator (p=0.09); see Table 1c in Appendix A.
Thus both relative status and gender seem to influence sanctioning behavior,
and social status seems to matter only for men.
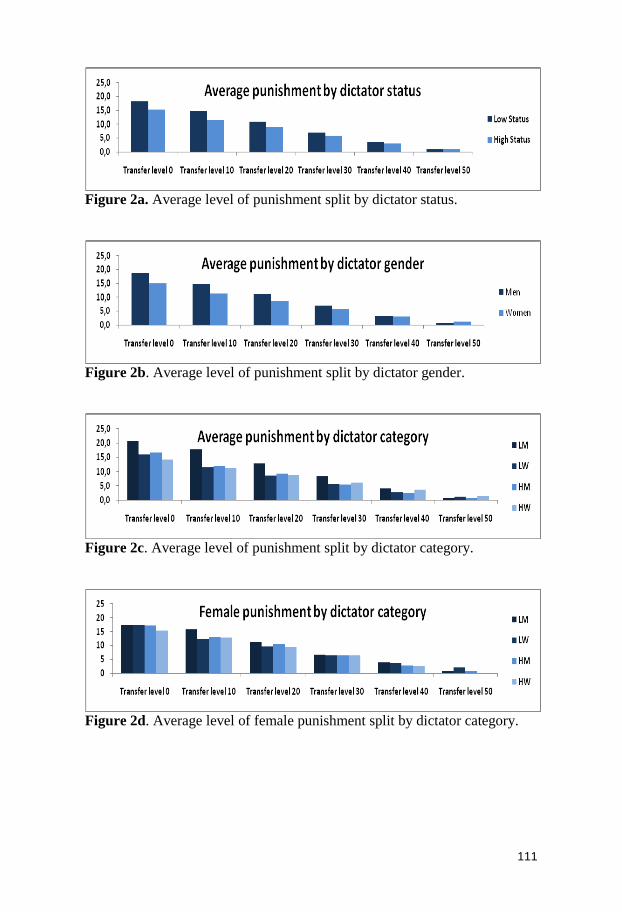
Figures 2a-e below illustrate the average level of punishment at each
transfer level, separated by the two dimensions; gender and status.21
Figure
2a shows the average level of punishment of high-status versus low-status
dictators. The difference between the two categories is not significant, but
the point estimate is higher for low-status dictators. Figure 2b compares the
average punishment at each transfer level for female and male dictators sepa-
rately. The total level of punishment, as well as the level of punishment at
each possible transfer level, is significantly or close to significantly different
between genders (all levels apart from 50 have p-values around 0.05). This
indicates that male dictators on average are punished more harshly than their
female counterparts (see the corresponding p-values in Table 2b in Appendix
A).
21 Subsequent Mann-Whitney p-values for tests of equal averages in Figures 2a-e are given in
Tables 2a-e in Appendix A. We report p-values for each transfer level, the total level, and the
total level excluding levels 40 and 50.
111
Figure 2a. Average level of punishment split by dictator status.
Figure 2b. Average level of punishment split by dictator gender.
Figure 2c. Average level of punishment split by dictator category.
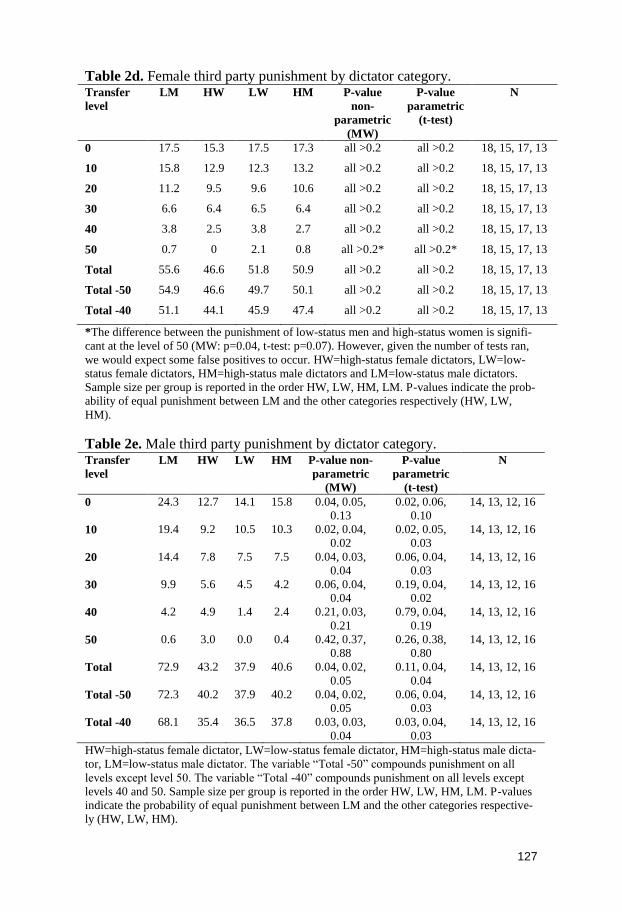
Figure 2d. Average level of female punishment split by dictator category.
112
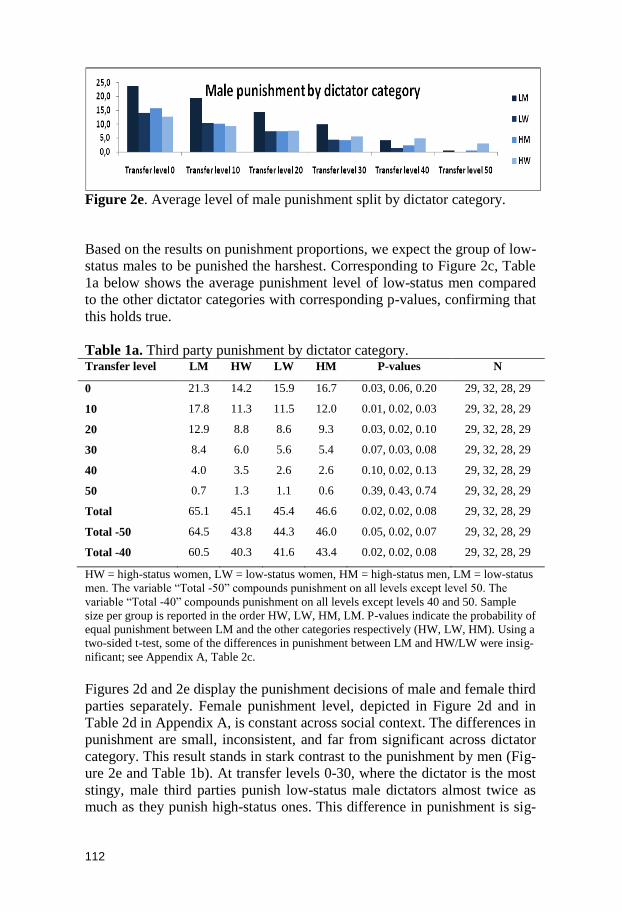
Figure 2e. Average level of male punishment split by dictator category.
Based on the results on punishment proportions, we expect the group of low-
status males to be punished the harshest. Corresponding to Figure 2c, Table
1a below shows the average punishment level of low-status men compared
to the other dictator categories with corresponding p-values, confirming that
this holds true.
Table 1a. Third party punishment by dictator category. Transfer level LM HW LW HM P-values N
0 21.3 14.2 15.9 16.7 0.03, 0.06, 0.20 29, 32, 28, 29
10 17.8 11.3 11.5 12.0 0.01, 0.02, 0.03 29, 32, 28, 29
20 12.9 8.8 8.6 9.3 0.03, 0.02, 0.10 29, 32, 28, 29
30 8.4 6.0 5.6 5.4 0.07, 0.03, 0.08 29, 32, 28, 29
40 4.0 3.5 2.6 2.6 0.10, 0.02, 0.13 29, 32, 28, 29
50 0.7 1.3 1.1 0.6 0.39, 0.43, 0.74 29, 32, 28, 29
Total 65.1 45.1 45.4 46.6 0.02, 0.02, 0.08 29, 32, 28, 29
Total -50 64.5 43.8 44.3 46.0 0.05, 0.02, 0.07 29, 32, 28, 29
Total -40 60.5 40.3 41.6 43.4 0.02, 0.02, 0.08 29, 32, 28, 29
HW = high-status women, LW = low-status women, HM = high-status men, LM = low-status
men. The variable “Total -50” compounds punishment on all levels except level 50. The
variable “Total -40” compounds punishment on all levels except levels 40 and 50. Sample
size per group is reported in the order HW, LW, HM, LM. P-values indicate the probability of
equal punishment between LM and the other categories respectively (HW, LW, HM). Using a
two-sided t-test, some of the differences in punishment between LM and HW/LW were insig-
nificant; see Appendix A, Table 2c.
Figures 2d and 2e display the punishment decisions of male and female third
parties separately. Female punishment level, depicted in Figure 2d and in
Table 2d in Appendix A, is constant across social context. The differences in
punishment are small, inconsistent, and far from significant across dictator
category. This result stands in stark contrast to the punishment by men (Fig-
ure 2e and Table 1b). At transfer levels 0-30, where the dictator is the most
stingy, male third parties punish low-status male dictators almost twice as
much as they punish high-status ones. This difference in punishment is sig-
113
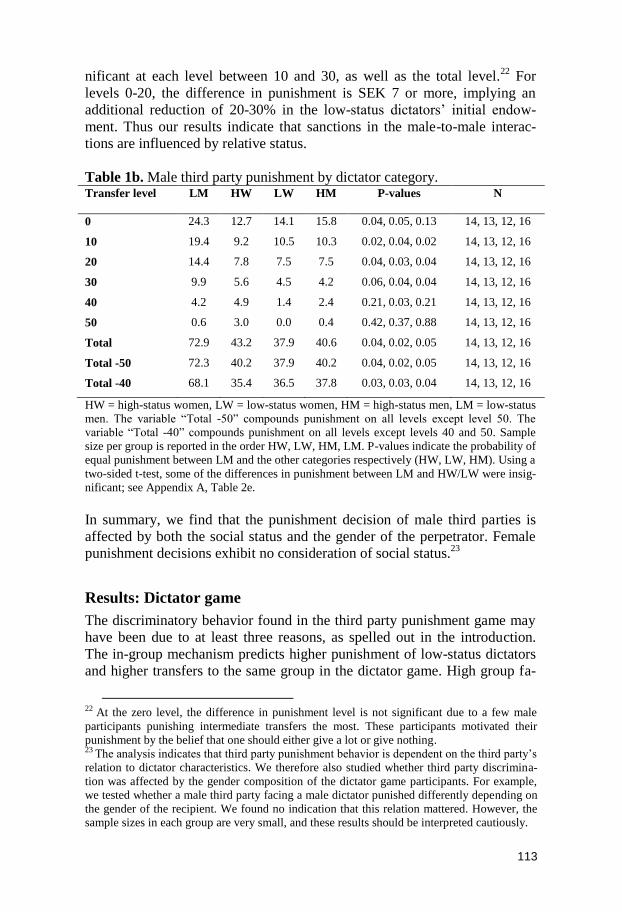
nificant at each level between 10 and 30, as well as the total level.22
For
levels 0-20, the difference in punishment is SEK 7 or more, implying an
additional reduction of 20-30% in the low-status dictators’ initial endow-
ment. Thus our results indicate that sanctions in the male-to-male interac-
tions are influenced by relative status.
Table 1b. Male third party punishment by dictator category. Transfer level LM HW LW HM P-values
N
0 24.3 12.7 14.1 15.8 0.04, 0.05, 0.13 14, 13, 12, 16
10 19.4 9.2 10.5 10.3 0.02, 0.04, 0.02 14, 13, 12, 16
20 14.4 7.8 7.5 7.5 0.04, 0.03, 0.04 14, 13, 12, 16
30 9.9 5.6 4.5 4.2 0.06, 0.04, 0.04 14, 13, 12, 16
40 4.2 4.9 1.4 2.4 0.21, 0.03, 0.21 14, 13, 12, 16
50 0.6 3.0 0.0 0.4 0.42, 0.37, 0.88 14, 13, 12, 16
Total 72.9 43.2 37.9 40.6 0.04, 0.02, 0.05 14, 13, 12, 16
Total -50 72.3 40.2 37.9 40.2 0.04, 0.02, 0.05 14, 13, 12, 16
Total -40 68.1 35.4 36.5 37.8 0.03, 0.03, 0.04 14, 13, 12, 16
HW = high-status women, LW = low-status women, HM = high-status men, LM = low-status
men. The variable “Total -50” compounds punishment on all levels except level 50. The
variable “Total -40” compounds punishment on all levels except levels 40 and 50. Sample
size per group is reported in the order HW, LW, HM, LM. P-values indicate the probability of
equal punishment between LM and the other categories respectively (HW, LW, HM). Using a
two-sided t-test, some of the differences in punishment between LM and HW/LW were insig-
nificant; see Appendix A, Table 2e.
In summary, we find that the punishment decision of male third parties is
affected by both the social status and the gender of the perpetrator. Female
punishment decisions exhibit no consideration of social status.23
Results: Dictator game
The discriminatory behavior found in the third party punishment game may
have been due to at least three reasons, as spelled out in the introduction.
The in-group mechanism predicts higher punishment of low-status dictators
and higher transfers to the same group in the dictator game. High group fa-
22 At the zero level, the difference in punishment level is not significant due to a few male
participants punishing intermediate transfers the most. These participants motivated their
punishment by the belief that one should either give a lot or give nothing. 23 The analysis indicates that third party punishment behavior is dependent on the third party’s
relation to dictator characteristics. We therefore also studied whether third party discrimina-
tion was affected by the gender composition of the dictator game participants. For example,
we tested whether a male third party facing a male dictator punished differently depending on
the gender of the recipient. We found no indication that this relation mattered. However, the
sample sizes in each group are very small, and these results should be interpreted cautiously.
114
voritism predicts higher punishment of low-status dictators and lower trans-
fers in the dictator game. Finally, leniency implies that differences are only
present in the punishment domain, where low-status males are punished
harsher. To disentangle these mechanisms, we ran a dictator game. Based on
the results from the third party punishment game, the dictator game was run
on a separate sample consisting only of men. The two men who previously
participated as dictators (high and low status) here took part as recipients. As
in the third party punishment game, the dictator was endowed with SEK 100
and the recipient was endowed with no money. Money could be transferred
from the dictator to the recipient in multiples of SEK 10, with a maximum of
SEK 50. The recipient had no decision to make.
The status manipulation was implemented in the same way as in the third
party punishment game. Each dictator saw the name of the recipient at the
top of his decision sheet, but aside from this, no reference was made to the
other player or to status.
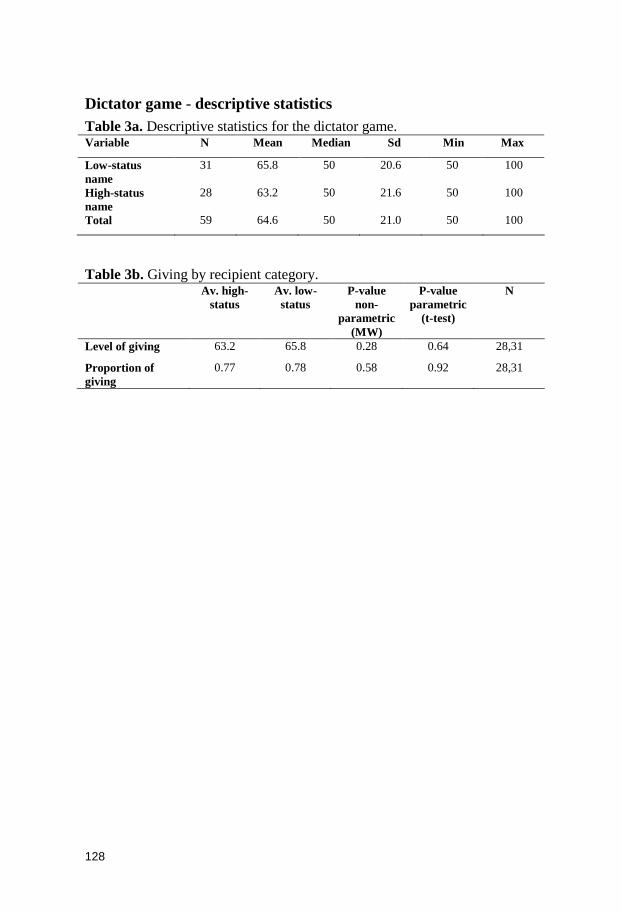
A total of 59 men participated in the dictator game. We assigned 31 par-
ticipants to face a recipient with a common name and the remaining 28 to
face a recipient with a noble name.24
The results indicate that giving in the
dictator game does not depend on the status of the recipient. On average,
low-status men receive SEK 34.2 and high-status men SEK 36.8, but this
difference is far from significant (p=0.28).25
This can be compared to the
results of Fershtman and Gneezy (2001), who find a difference in trust be-
havior depending on social category. However, in line with our results, they
also find no differentiation based on social category is found in a dictator
game. In sum, our results indicate that discrimination based on relative so-
cial status pertains only to the punishment domain, and not to giving. High-
status individuals thus seem to be treated with leniency by third parties when
violating an egalitarian norm.
Further analysis
The discrimination based on social category that we observe in this study
might be due not to social status per se, but to variables correlated (or per-
ceived to be correlated) with it. Social status may for example influence
beliefs about dictator wealth, income, or education. We can identify two
potential sources of bias. First, if variables believed to be correlated with
nobility have status implications in their own right, this would cause us to
overestimate the effect of nobility. Second, beliefs relating to high wealth or
income may also reinforce mechanisms not directly linked to status such as
inequality aversion (Bolton and Ockenfels, 2000; Fehr and Schmidt, 1999).
24 All participants were students at Stockholm University or Stockholm Royal School of
Technology. 25 A sample size analysis assuming an alpha of 0.05 and a power of 80% indicates that we
would need a sample size of 2096 participants in order to get significant results. See Table 3a
in Appendix A for descriptive statistics.
115
If nobility is thought to be positively correlated with wealth, inequality aver-
sion would cause us to underestimate the effect of social status. As shown
by Almenberg and Dreber (2009), the Swedish nobility has a higher wealth
than the common population. Women have been shown to be more averse to
inequality than men, and this could be a contributing factor to the gender
differences in discrimination in our study (Andreoni and Vesterlund 2001,
Dickinson and Tiefenthaler 2002, Selten and Ockenfels, 1998). The belief
that noble participants have a higher wealth, or that they value monetary
gains and losses differently, may also give rise to the perception that pun-
ishment applied to this group is less efficient, since the punishment associat-
ed with a particular amount represents a smaller share of the participant’s
total wealth.26
To assess this issue, in the survey after the experiment all third parties
were asked to state their beliefs regarding dictator wealth and income in
relation to the average student, and all dictators in the dictator game were
asked to do the same with respect to the recipient. The number of third par-
ties who indicated that they believed the dictator to have a higher wealth and
income than the average student are roughly equal irrespective of whether
they were matched with a high-status or a low-status dictator.27
The participants were also asked to state what distribution proposed by
the dictator they considered fair. This allowed us to exclude the possibility
that perceptions of fairness varied depending on the status of the dictator and
the recipient in any of the two games. In total, 82 percent of participants
consider an equal split as fair in both games, and this proportion does not
vary with social status category. It thus appears that it is the scale of pun-
ishment that differs across status categories, not the judgment of who should
abide by the norm. This corroborates the findings of Lieberman and Linke
(2004), who find that even though third party punishment varies with social
status, the norm expressed by third parties does not. Our results indicate that
social status has an impact on the use of economic punishment in male-to-
male interactions where egalitarian norms are violated, even after controlling
26 Similarly, non-pecuniary effects could be possible. The impact of a punishment issued by a
same-status peer may be perceived as more important than a punishment issued by a lower-
status individual. 27 Of those third parties facing a high-status dictator, 17 (12) participants thought their coun-
terpart had a higher wealth (income) than the average student. Among those facing a low-
status dictator, the corresponding number was 16 (14). These numbers are evenly distributed
among men and women. Third parties matched with the high-status male dictator that as-
sumed the matched dictator to have above-average wealth punish the least of all groups.
Third parties, matched with low-status dictators, assuming the matched dictator to have a high
wealth punish the harshest. In the male-to-male punishment of low-status dictators, the effect
of wealth beliefs goes in the opposite direction. However, the sample sizes are too small for a
statistical analysis. It is interesting that participants state similar beliefs about wealth and
income for high-status and low-status dictators, since the average wealth and income among
individuals with high-status names are indeed higher compared to the Swedish population on
average (Clark, 2012). However, all responders are university students stating their beliefs
about other university students, which may explain the stated beliefs.
116
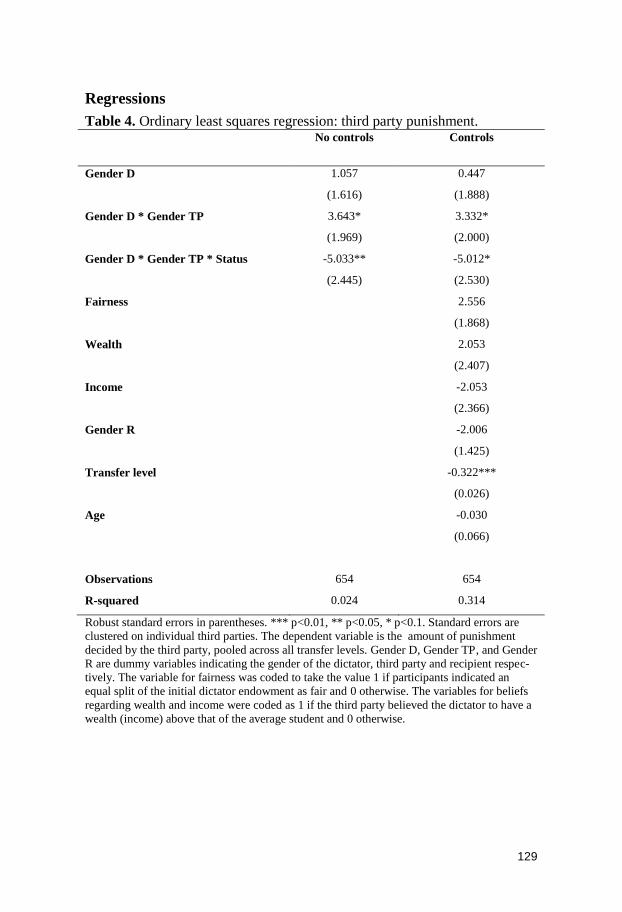
for beliefs about relative income and wealth. A regression analysis moreover
confirms our main results, indicating that third party beliefs concerning the
wealth and income of the dictator, as well as fairness, have no significant
effect on punishment.28
Discussion
Social status has been shown to have a profound impact on a wide spectrum
of individual life outcomes and behavior. Given this fact, it is important to
understand how social status influences individual economic decisions as
well as how relative social status shapes economic interactions. However,
there has been very little research into the effect of social status on economic
decision-making.
This article presents novel evidence that high-status individuals are pun-
ished less for a norm violation in a dictator game with third party punish-
ment, in comparison to low-status individuals. Interestingly, our results were
driven entirely by behavior in male-to-male interactions. The difference in
economic outcome by status category among males is economically rele-
vant, representing 20-30 percent of the dictators’ initial endowments. The
effect remains stable when controlling for beliefs about wealth and income,
and does not rely on fairness considerations being status-dependent. Male
third parties’ behavior thus varies with the social context. We find no effect
of social status on behavior among female third parties. We do also not find
a discriminatory effect of social status on altruistic behavior in a dictator
game. Thus, the results seem not to be driven by liking or whether the norm
violator belongs to the in-group or out-group. The effect of status seems to
pertain only to the punishment domain, and not to giving. In our study, high-
status individuals are treated with leniency when violating an egalitarian
norm.
The finding that social status provides a degree of protection from eco-
nomic punishment may have implications for the construction and rein-
forcement of male hierarchies in society. In a wider perspective, social status
and the induced behavioral change may have implications for social and
28 The ordinary least squares regression analysis is based on parametric assumptions that may
not be fulfilled. We pooled the data over all six decisions elicited by the strategy method for
each third party, clustering on individual third parties. We then conducted two regressions;
one with control variables and one without. The control variables included are: beliefs about
income, wealth, and fairness; gender of all players; and university and age of the third party.
The variables for beliefs regarding wealth and income were coded as 1 if the third party be-
lieved the dictator to have a wealth (income) above the average student and 0 otherwise. The
variable for fairness was coded to take the value 1 if the participant indicated an equal split of
the initial dictator endowment as fair and 0 otherwise. Male-to-male discrimination is signifi-
cant in both regressions (p=0.05 with controls, p=0.022 without controls), and beliefs regard-
ing wealth and income remained insignificant. See Table 4 in Appendix A.
117
economic mobility. This has been indicated by previous research, finding for
example that the outcomes of court proceedings often favor high status indi-
viduals (e.g. Abrams et al., forthcoming; Phillips, 2009; Sarnecki et al.,
2006), and that high relative status provides an economic premium both in
the lab and in the field (Almenberg and Dreber, 2009; Ball et al., 2001; Ball
and Eckel, 1998, 1996; Fershtman and Gneezy, 2001; Glaeser et al., 2000;
Weiss and Ferschtman, 1998). Recent research also indicates the importance
of using noble names when measuring social mobility. The noble elite in
Sweden seem to cling to status positions and education over time, meaning
that mobility increases more slowly than previously found, despite the im-
plementation of extensive policies aimed at ensuring equal opportunities
independent of social class (Clark 2012).
Our results further corroborate previous research implying that men are
more sensitive than women to social status in economic decision-making
tasks. For example, Huberman et al. (2004) find that male participants sacri-
fice more resources to obtain social status than female participants. Studying
discrimination among Jews of different ethnicity in the trust game, Fersht-
man and Gneezy (2001) also find discrimination to occur only between men.
Throughout history, many hierarchies in western societies has been either
male-dominated or exclusively for men. Nobility in Sweden, for example, is
only hereditary on the male side; thus it is historically associated with male-
ness. This may explain the higher level of investment in status observed
among men in comparison to among women (Campbell, 2002; Pawlowski et
al., 2000). Men are also often found to be more competitive compared to
women (see review by Croson and Gneezy, 2009). Since it is impossible for
third parties in our study to acquire noble names, competition for status in
the context of the present study may only be relevant between a low status
dictator and (low-status) third parties, causing higher punishment in interac-
tions among men without noble names.
An additional reason for the discrepancy in male and female behavior
could be gender differences in inequality aversion. Previous literature has
found women to be more inequality averse than men (Andreoni and Vester-
lund, 2001; Dickinson and Tiefenthaler, 2002; Selten and Ockenfels, 1998).
Although we find no indication that beliefs about income or wealth vary
with social category, if high social status is believed to be associated with
other benefits, this may counteract the effect of social status among female
third parties by inducing them to increase their punishment of high-status
individuals.
A few previous studies have explored in-group bias settings with third
party punishment (Bernhard et al. 2008 and Götte et al. 2006), typically
finding that the degree of punishment is lower among in-group members.
Our study differs from these previous studies in the sense that the status
groups in our study have a clear ordinal relationship. Further, all our third
parties and recipients are from the same status group; that is, individuals
with non-noble names. The group of low-status men in our study can also be
118
considered a large and heterogeneous social group. Our results also differ
from the results of Hoff et al. (2011), who use a trust game with third party
punishment in India to show that low-caste participants punish less than high
caste participants, but punishment in both groups is independent of the caste
of the norm violator. Several potential mechanisms might explain this varia-
tion in results. Norm enforcement could, for example, differ between coop-
erative and egalitarian norms. Culture may also create differences between
the studies; India’s caste system induces a more pronounced status hierarchy
with restricted interactions between the groups. This system is politically
relevant in today’s society, and group belonging may therefore repress the
decision to punish by low-status individuals more than the historical division
between nobility and commoners in Sweden. The fact that the low-status
group in our study is relatively large and not well defined may diminish the
tendency of lower intra-group punishment found in previous studies. How-
ever, even though the Swedish nobility lost its formal privileges more than a
century ago, the punishment-specific discrimination might still be due to
historic power inequalities. The decision to punish an individual of higher
status may be perceived to entail a larger risk of retaliation than the decision
not to give.
Our study shows a surprisingly large effect of social status on punishment
behavior, underlining the importance of social status as a modulator of be-
havior in male interactions. By guiding appropriate behavior, knowledge of
status relations is an important key to successfully navigation in human so-
cieties. Further research is needed concerning various types of social status
and the implications for economic decision-making in different situations.
Acknowledgements
We are grateful for comments from Konstanze Albrecht, Johan Almenberg,
Anne Boschini, Anna Dreber, Tore Ellingsen, Armin Falk, Hannah Schild-
berg-Hörisch, Magnus Johannesson, Astri Muren, Mats Persson, Frédéric
Schneider, Roberto Weber, and seminar participants at Zürich University
and CEE Copenhagen 2008. Financial support from the Jan Wallander and
Tom Hedelius Foundation, as well as the Carl Silfvén Foundation
(E. Ranehill) and the Swedish Council for Working Life and Social research
(FAS) is gratefully acknowledged (E. von Essen).
119
References
Abrams, D., Bertrand, M., Mullainathan, S., (2008). Do Judges Vary in their
Treatment of Race?. Forthcoming in the Journal of Legal Studies.
Akerlof, G. A., Kranton, R. E., (2000). Economics and Identity. The Quar-
terly Journal of Economics, MIT Press, vol. 115:3, 715-753.
Almenberg, J., Dreber, A., (2009). The Lady and the Trump: Status and
Wealth in the Marriage Market. Kyklos 62:2, 161-181.
Andreoni, J., Vesterlund, L., (2001). Which Is the Fair Sex? Gender Differ-
ences in Altruism. The Quarterly Journal of Economics. 116, 293-312.
Arai, M., and Skogman Thoursie, P., (2009). Renouncing personal names:
An empirical examination of surname change and earnings. Journal of
Labor Economics. 27:1, 127-147.
Arai, M., Bursell, M., Nekby, L., (2011). The reverse gender gap in discrim-
ination: Employer priors against men and women with Arabic names
Working paper CEB 11-027 ULB.
Aura, S., and Hess, G., (2010). What’s in a name?. Economic Inquiry. Vol
48:1. p 214-227.
Ball, S., Eckel, C., (1996). Buying Status: Experimental evidence on status
in negotiation. Psychology and Marketing. 13, 381-405.
Ball, S., Eckel, C., (1998). Stars Upon Thars. Working Paper. The Universi-
ty of Texas at Dallas.
Ball, S., Eckel, C., Grossman, P., Zame, W., (2001). Status In Markets. The
Quarterly Journal of Economics. 116:1, 161-188.
Berger, J., Cohen, B. P., Zelditch, M., (1966). Status Characteristics and
expectation states, in: Berger, J., Zelditch, M., Jr., & Anderson, B.
(Eds.), Sociological Theories in Progress. Vol. 1. Houghton Mifflin,
Boston, pp. 29–46.
Berger, J., Fisek, M. H., Norman, R. Z., and Wagner, D. G., (1985). The
Formation of Reward Expectations in Status Situations, in: Berger, J.,
Zelditch Jr., M. (Eds.), Status, Rewards, and Influence. Jossey-Bass, San
Francisco, pp. 215–261.
Bernhard, H., Fischbacher, U., Fehr, E., (2006). Parochial Altruism in Hu-
mans. Nature 442:7105, 912-915.
Bertrand, M., Mullainathan, S., (2004). Are Emily and Greg More Employa-
ble Than Lakisha and Jamal? A Field Experiment on Labor Market Dis-
crimination. American Economic Review. 94(4): 991–1013.
Bolton, G., Ockenfels, A., (2000). ERC: A Theory of Equity, Reciprocity
and Competition. American Economic Review. 90, 166-193.
Bourdieu, P., (1984). Distinction: A social critique of the judgment of taste
(R. Nice, Trans.). Cambridge, MA: Harvard University Press.
120
Boyce, W.T., (2004). Social stratification, health, and violence in the very
young. Annals of the New York Academy f Science. 1036, 47-68.
Brandts, J., Charness, G., (2000). Hot vs. Cold: Sequential Responses and
Preference Stability in Experimental Games. Experimental Economics,
2:3. 227-238.
Campbell, A., (2002). A Mind of Her Own. Oxford University Press, Oxford.
Carpenter, J., Matthews, P.H., (2005). Norm Enforcement: Anger, Indigna-
tion or Reciprocity?. Middlebury College Working Paper Series 0503,
Middlebury College, Department of Economics.
Carlsson, M., Rooth, D., (2007). Evidence of ethnic discrimination in the
Swedish labor market using experimental data. Labour Economics. 14.
716-729.
Cason, T., Mui, V.L., (1998). Social Influence in the Sequential Dictator
Game. Journal of Mathematical Psychology. 42, 248-265.
Charness, G., Masclet, D. Villeval, M.C., (2010). Competitive Preferences
and Status as an Incentive: Experimental Evidence. IZA Discussion Pa-
per 5034, Bonn.
Clark, A., Oswald, A., (1996). Satisfaction and Comparison Income. Journal
of Public Economics. 61, 359-81.
Clark, G., (2012). What is the true rate of social mobility in Sweden? A sur-
name analysis 1700-2012, University of California, Davis, August 16.
Colarelli, S. M., Spranger, J. L., Hechanova, M. R., (2006). Women, power,
and sex composition in small groups: An evolutionary perspective. Jour-
nal of Organizational Behavior. 27, 163–184.
Croson, R., Gneezy, U., (2009). Gender Differences in Preferences, Journal
of Economic Literature. 47:2, 448–74.
Cummins, D., (2005). Dominance, status, and social hierarchies. In D. M.
Buss (Ed.), The Handbook of evolutionary psychology. Hoboken, NJ:
John Wiley and Sons, pp. 676–697.
Dickinson, D., Tiefenthaler, J., (2002). What Is Fair? Experimental Evi-
dence. The Southern Economic Journal. 69, 414-428.
Driskell, J.E., Mullen, B., (1990). Status, expectations, and behavior: a meta-
analytic review and test of the theory. Personality and Social Psychology
Bulletin. 16:541–53.
Fehr, E., and Fischbacher, U., (2004). Third-party punishment and social
norms. Evolution and Human Behavior. 25, 63-87.
Fehr, E., Gächter, S., (2000). Cooperation and Punishment in Public Goods
Experiments. American Economic Review, 90:4, 980-994.
Fehr, E., and Schmidt, K., (1999). A Theory of Fairness, Competition, and
Cooperation. The Quarterly Journal of Economics. vol. 114, pp. 817-
868.
121
Fershtman, C., and Gneezy, U., (2001). Discrimination in a Segmented Soci-
ety: An Experimental Approach. The Quarterly Journal of Economics.
116:1, 3511-3377.
Festinger, L., (1954). A Theory of Social Comparison Processes. Human
Relations. 7, 117-140.
Frank, R., (2000). Luxury Fever: Money and Happiness in an Era of Excess.
Princeton: Princeton University Press.
Fryer, R., and Levitt, S., (2004). The Causes and Consequences of Distinc-
tively Black Names. The Quarterly Journal of Economics. Vol 119:3.
767-805.
Glaeser, E.L., Laibson, D.I., Scheinkman, J.A., Soutter, C. L., (2000). Meas-
uring Trust. The Quarterly Journal of Economics. 115, 811-846.
Goette, L., Huffman, D., Stephan, M., (2006). The impact of group member-
ship on cooperation and norm enforcement: Evidence using random as-
signment to real social groups. Institute for the Study of Labor, IZA Dis-
cussion paper, 2020.
Harbaugh, W.T., Krause, K., Liday, S., and Vesterlund, L., (2001). Trust in
Children. University of Oregon Economics Department Working Papers
2002-10, University of Oregon Economics Department, revised 25.
Hoff, K., Kshetramade, M. and Fehr, E., (2011). Caste and Punishment: The
Legacy of Caste Culture in Norm Enforcement. Economic Journal. Vol.
121, Iss. 556, 449-475.
Hong, K., Bohnet, I., (2006). Status and distrust: The relevance of inequality
and betrayal aversion. Journal of Economic Psychology. 28, 197-213.
Huberman, B., Loch, C., Öncüler, A., (2004). Status as a Valued Resource.
Social Psychology Quarterly. 67:1, 103-114.
Kalkhoff, W., Barnum, C., (2000). The Effects of Status-Organizing and
Social Identity Processes on Patterns of Social Influence. Social Psy-
chology Quarterly. 63, 95-115.
Kumru, C., Vesterlund, L., (2008). The Effects of Status on Voluntary Con-
tribution.Working Papers 266, University of Pittsburgh, Department of
Economics.
Leibrandt, A., Lopéz-Peréz, R., (2008). The Envious Punisher: Understand-
ing Third and Second Party Punishment with Simple Games. Institute for
Empirical Research in Economics, University of Zurich, Working Paper
Series, Working Paper No. 373.
Lieberman, D., Linke, L., (2007). The effect of social category on third party
punishment. Evolutionary Psychology. 5, 289-305.
Lovaglia, M.J., Lucas, J.W., Houser, J.A., Thye, S.R., & Markovsky, B.,
(1998). Status processes and mental ability test scores. American Journal
of Sociology. 1, 195–228.
122
Newman, M.L., Sellers, J.G., Josephs, R.A., (2005). Testosterone, cognition,
and social status. Hormone and Behavior 47, 205–211.
Ostrom, E., (2000). Collective Action and the Evolution of Social Norms.
Journal of Economic Perspective. 14(3), 137-58.
Pawlowski, B., Dunbar, R. I. M., and Lipowicz, A., (2000). Evolutionary
Fitness: Tall Men Have More Reproductive Success. Nature, 403:156.
Phillips, S., (2009). Status Disparities in the Capital of Capital Punishment.
Law and Society Review. 43:4.
Piff, P.K., Kraus, M.W., Cote, S., Cheng B.H., Keltner, D., (2010). Having
Less, Giving More: The Influence of Social Class on Prosocial Behavior.
Journal of Personality and Social Psychology. 99: 771–784.
Ridgeway, C., Boyle, E., Kuipers, K., Robinson, R., (1998). How Do Status
Beliefs Develop? The Role of Resources and Interaction. American So-
ciological Review. 63, 331-350.
Ridgeway, C., and Walker, H., (1995). Status Structures, in Cook, K., Fine,
G., and House, J., (Eds.) Sociological Perspectives on Social Psycholo-
gy, New York: Allyn and Bacon. p. 281-310.
Rustichini, A.,Vostroknutov, A. (2008). Competition with Skill and Luck.
Mimeo, University of Minnesota.
Sapolsky, R.M., (2005). The influence of social hierarchy on primate health,
Science 308, 648-652.
Sapolsky, R.M., (2004). Social status and health in humans and other ani-
mals. Annual Review of Anthropology. 33, 393-418.
Sarnecki, J., (2006). Är rättvisan rättvis? Tio perspektiv på diskriminering av
etniska och religiösa minoriteter inom rättssystemet. SOU 2006:30.
Selten, R., Ockenfels, A., (1998). An Experimental Solidarity Game. Journal
of Economic Behavior Organization. 34, 517-539.
Simpson, B., Walker, H.A., (2002). Status characteristics and performance
expectations: a reformulation. Sociological Theory. 20, 24-39.
Veblen, T., (1899). The Theory of the Leisure Class. MacMillan, New York.
Watkins, S.C., and London, A.S., (1994). Personal Names and Cultural
Change: A Study of the Naming Patterns of Italians and Jews in the
United States in 1910. Social Science History. 18, 169–209.
Weber, M., (1924). in From Max Weber: essays in sociology. (trans, eds)
Gerth H. H. Wright Mills C., London, Routledge and K. Paul, 1970.
Weiss, Y., Ferschtman, C., (1998). Social Status and Economic Perfor-
mance: a Survey. European Economic Review. 42, 801-820.

123
Appendix A
Descriptive statistics
Table 1a. Descriptive statistics. Variable N Mean p50 Sd Min Max
Female TP 118 0.53 1 0.50 0 1
Female R 118 0.56 1 0.50 0 1
Female D 118 0.51 1 0.50 0 1
HW 118 0.27 0 0.45 0 1
HM 118 0.25 0 0.43 0 1
LW 118 0.24 0 0.43 0 1
LM 118 0.25 0 0.43 0 1
Level 0 118 16.94 16.5 14.29 0 50
Level 10 118 13.11 13 11.55 0 40
Level 20 118 9.88 10 9.19 0 40
Level 30 118 6.38 5 7.38 0 40
Level 40 118 3.22 0 5.08 0 30
Level 50 118 0.93 0 4.06 0 30
Punishment 118 0.73 1 0.45 0 1
Fairness 109 0.82 1 0.39 0 1
Age 118 25.88 24 8.33 17 71
Descriptive statistics of all variables included in our analysis. Level 0-50 indicates the actual
level of punishment at each transfer level. Punishment and Fairness are dummy variables;
Punishment takes the value 1 when punishment was exerted at any level and 0 otherwise, and
Fairness takes the value 1 if a 50/50 split of the initial money was indicated as the fair divi-
sion and 0 otherwise. TP=third party, R=recipient, D=dictator, Third parties matched with:
HW=high-status female dictator, LW=low-status female dictator, HM=high-status male dicta-
tor, and LM=low-status male dictator.
124
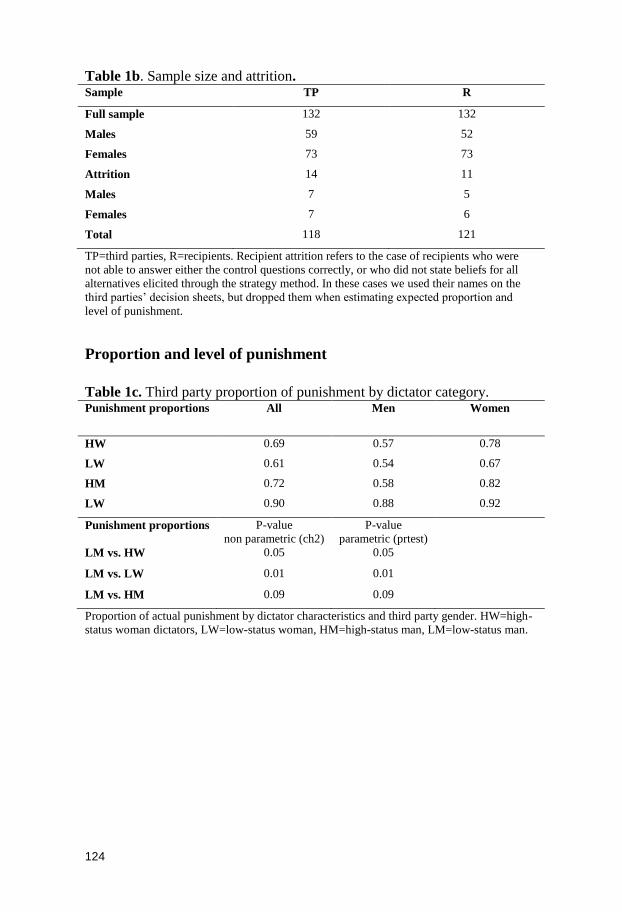
Table 1b. Sample size and attrition. Sample TP R
Full sample 132 132
Males 59 52
Females 73 73
Attrition 14 11
Males 7 5
Females 7 6
Total 118 121
TP=third parties, R=recipients. Recipient attrition refers to the case of recipients who were
not able to answer either the control questions correctly, or who did not state beliefs for all
alternatives elicited through the strategy method. In these cases we used their names on the
third parties’ decision sheets, but dropped them when estimating expected proportion and
level of punishment.
Proportion and level of punishment
Table 1c. Third party proportion of punishment by dictator category. Punishment proportions All Men Women
HW 0.69 0.57 0.78
LW 0.61 0.54 0.67
HM 0.72 0.58 0.82
LW 0.90 0.88 0.92
Punishment proportions P-value
non parametric (ch2)
P-value
parametric (prtest)
LM vs. HW 0.05 0.05
LM vs. LW 0.01 0.01
LM vs. HM 0.09 0.09
Proportion of actual punishment by dictator characteristics and third party gender. HW=high-
status woman dictators, LW=low-status woman, HM=high-status man, LM=low-status man.
125
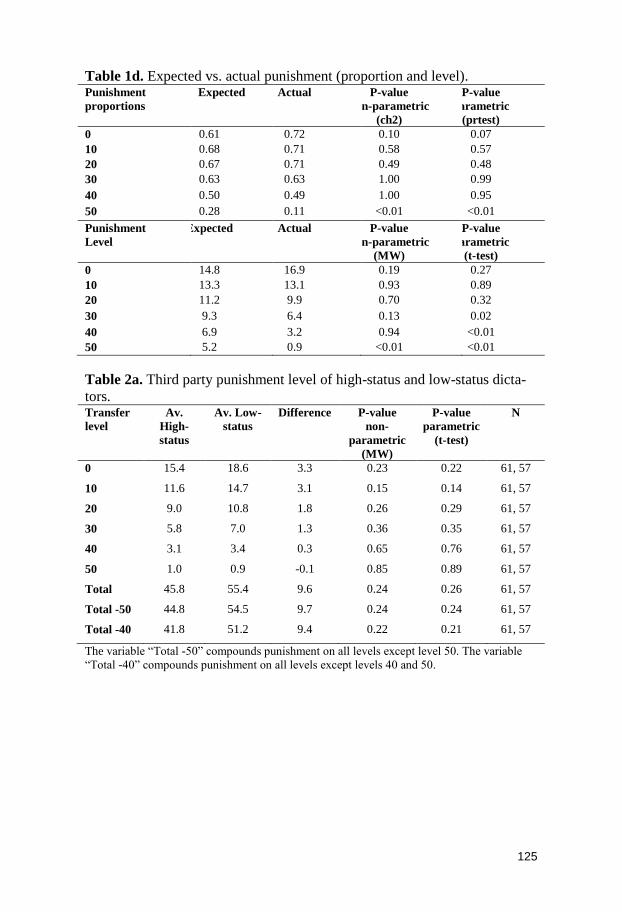
Table 1d. Expected vs. actual punishment (proportion and level). Punishment
proportions
Expected Actual P-value
non-parametric
(ch2)
P-value
parametric
(prtest)
0 0.61 0.72 0.10 0.07
10 0.68 0.71 0.58 0.57
20 0.67 0.71 0.49 0.48
30 0.63 0.63 1.00 0.99
40 0.50 0.49 1.00 0.95
50 0.28 0.11 <0.01 <0.01
Punishment
Level
Expected Actual P-value
non-parametric
(MW)
P-value
parametric
(t-test)
0 14.8 16.9 0.19 0.27
10 13.3 13.1 0.93 0.89
20 11.2 9.9 0.70 0.32
30 9.3 6.4 0.13 0.02
40 6.9 3.2 0.94 <0.01
50 5.2 0.9 <0.01 <0.01
Table 2a. Third party punishment level of high-status and low-status dicta-
tors. Transfer
level
Av.
High-
status
Av. Low-
status
Difference P-value
non-
parametric
(MW)
P-value
parametric
(t-test)
N
0 15.4 18.6 3.3 0.23 0.22 61, 57
10 11.6 14.7 3.1 0.15 0.14 61, 57
20 9.0 10.8 1.8 0.26 0.29 61, 57
30 5.8 7.0 1.3 0.36 0.35 61, 57
40 3.1 3.4 0.3 0.65 0.76 61, 57
50 1.0 0.9 -0.1 0.85 0.89 61, 57
Total 45.8 55.4 9.6 0.24 0.26 61, 57
Total -50 44.8 54.5 9.7 0.24 0.24 61, 57
Total -40 41.8 51.2 9.4 0.22 0.21 61, 57
The variable “Total -50” compounds punishment on all levels except level 50. The variable
“Total -40” compounds punishment on all levels except levels 40 and 50.
126
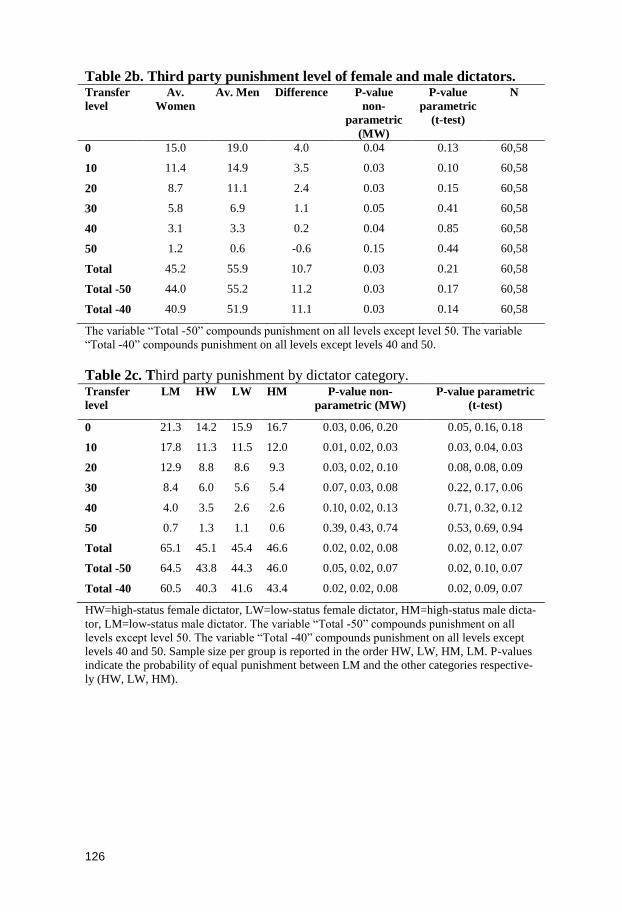
Table 2b. Third party punishment level of female and male dictators. Transfer
level
Av.
Women
Av. Men Difference P-value
non-
parametric
(MW)
P-value
parametric
(t-test)
N
0 15.0 19.0 4.0 0.04 0.13 60,58
10 11.4 14.9 3.5 0.03 0.10 60,58
20 8.7 11.1 2.4 0.03 0.15 60,58
30 5.8 6.9 1.1 0.05 0.41 60,58
40 3.1 3.3 0.2 0.04 0.85 60,58
50 1.2 0.6 -0.6 0.15 0.44 60,58
Total 45.2 55.9 10.7 0.03 0.21 60,58
Total -50 44.0 55.2 11.2 0.03 0.17 60,58
Total -40 40.9 51.9 11.1 0.03 0.14 60,58
The variable “Total -50” compounds punishment on all levels except level 50. The variable
“Total -40” compounds punishment on all levels except levels 40 and 50.
Table 2c. Third party punishment by dictator category. Transfer
level
LM HW LW HM P-value non-
parametric (MW)
P-value parametric
(t-test)
0 21.3 14.2 15.9 16.7 0.03, 0.06, 0.20 0.05, 0.16, 0.18
10 17.8 11.3 11.5 12.0 0.01, 0.02, 0.03 0.03, 0.04, 0.03
20 12.9 8.8 8.6 9.3 0.03, 0.02, 0.10 0.08, 0.08, 0.09
30 8.4 6.0 5.6 5.4 0.07, 0.03, 0.08 0.22, 0.17, 0.06
40 4.0 3.5 2.6 2.6 0.10, 0.02, 0.13 0.71, 0.32, 0.12
50 0.7 1.3 1.1 0.6 0.39, 0.43, 0.74 0.53, 0.69, 0.94
Total 65.1 45.1 45.4 46.6 0.02, 0.02, 0.08 0.02, 0.12, 0.07
Total -50 64.5 43.8 44.3 46.0 0.05, 0.02, 0.07 0.02, 0.10, 0.07
Total -40 60.5 40.3 41.6 43.4 0.02, 0.02, 0.08 0.02, 0.09, 0.07
HW=high-status female dictator, LW=low-status female dictator, HM=high-status male dicta-
tor, LM=low-status male dictator. The variable “Total -50” compounds punishment on all
levels except level 50. The variable “Total -40” compounds punishment on all levels except
levels 40 and 50. Sample size per group is reported in the order HW, LW, HM, LM. P-values
indicate the probability of equal punishment between LM and the other categories respective-
ly (HW, LW, HM).
127
Table 2d. Female third party punishment by dictator category. Transfer
level
LM HW LW HM P-value
non-
parametric
(MW)
P-value
parametric
(t-test)
N
0 17.5 15.3 17.5 17.3 all >0.2 all >0.2 18, 15, 17, 13
10 15.8 12.9 12.3 13.2 all >0.2 all >0.2 18, 15, 17, 13
20 11.2 9.5 9.6 10.6 all >0.2 all >0.2 18, 15, 17, 13
30 6.6 6.4 6.5 6.4 all >0.2 all >0.2 18, 15, 17, 13
40 3.8 2.5 3.8 2.7 all >0.2 all >0.2 18, 15, 17, 13
50 0.7 0 2.1 0.8 all >0.2* all >0.2* 18, 15, 17, 13
Total 55.6 46.6 51.8 50.9 all >0.2 all >0.2 18, 15, 17, 13
Total -50 54.9 46.6 49.7 50.1 all >0.2 all >0.2 18, 15, 17, 13
Total -40 51.1 44.1 45.9 47.4 all >0.2 all >0.2 18, 15, 17, 13
*The difference between the punishment of low-status men and high-status women is signifi-
cant at the level of 50 (MW: p=0.04, t-test: p=0.07). However, given the number of tests ran,
we would expect some false positives to occur. HW=high-status female dictators, LW=low-
status female dictators, HM=high-status male dictators and LM=low-status male dictators.
Sample size per group is reported in the order HW, LW, HM, LM. P-values indicate the prob-
ability of equal punishment between LM and the other categories respectively (HW, LW,
HM).
Table 2e. Male third party punishment by dictator category. Transfer
level
LM HW LW HM P-value non-
parametric
(MW)
P-value
parametric
(t-test)
N
0 24.3 12.7 14.1 15.8 0.04, 0.05,
0.13
0.02, 0.06,
0.10
14, 13, 12, 16
10 19.4 9.2 10.5 10.3 0.02, 0.04,
0.02
0.02, 0.05,
0.03
14, 13, 12, 16
20 14.4 7.8 7.5 7.5 0.04, 0.03,
0.04
0.06, 0.04,
0.03
14, 13, 12, 16
30 9.9 5.6 4.5 4.2 0.06, 0.04,
0.04
0.19, 0.04,
0.02
14, 13, 12, 16
40 4.2 4.9 1.4 2.4 0.21, 0.03,
0.21
0.79, 0.04,
0.19
14, 13, 12, 16
50 0.6 3.0 0.0 0.4 0.42, 0.37,
0.88
0.26, 0.38,
0.80
14, 13, 12, 16
Total 72.9 43.2 37.9 40.6 0.04, 0.02,
0.05
0.11, 0.04,
0.04
14, 13, 12, 16
Total -50 72.3 40.2 37.9 40.2 0.04, 0.02,
0.05
0.06, 0.04,
0.03
14, 13, 12, 16
Total -40 68.1 35.4 36.5 37.8 0.03, 0.03,
0.04
0.03, 0.04,
0.03
14, 13, 12, 16
HW=high-status female dictator, LW=low-status female dictator, HM=high-status male dicta-
tor, LM=low-status male dictator. The variable “Total -50” compounds punishment on all
levels except level 50. The variable “Total -40” compounds punishment on all levels except
levels 40 and 50. Sample size per group is reported in the order HW, LW, HM, LM. P-values
indicate the probability of equal punishment between LM and the other categories respective-
ly (HW, LW, HM).
128
Dictator game - descriptive statistics
Table 3a. Descriptive statistics for the dictator game. Variable N Mean Median Sd Min Max
Low-status
name
31 65.8 50 20.6 50 100
High-status
name
28 63.2 50 21.6 50 100
Total 59 64.6 50 21.0 50 100
Table 3b. Giving by recipient category. Av. high-
status
Av. low-
status
P-value
non-
parametric
(MW)
P-value
parametric
(t-test)
N
Level of giving 63.2 65.8 0.28 0.64 28,31
Proportion of
giving
0.77 0.78 0.58 0.92 28,31
129
Regressions
Table 4. Ordinary least squares regression: third party punishment. No controls Controls
Gender D 1.057 0.447
(1.616) (1.888)
Gender D * Gender TP 3.643* 3.332*
(1.969) (2.000)
Gender D * Gender TP * Status -5.033** -5.012*
(2.445) (2.530)
Fairness 2.556
(1.868)
Wealth 2.053
(2.407)
Income -2.053
(2.366)
Gender R -2.006
(1.425)
Transfer level -0.322***
(0.026)
Age -0.030
(0.066)
Observations 654 654
R-squared 0.024 0.314
Robust standard errors in parentheses. *** p<0.01, ** p<0.05, * p<0.1. Standard errors are
clustered on individual third parties. The dependent variable is the amount of punishment
decided by the third party, pooled across all transfer levels. Gender D, Gender TP, and Gender
R are dummy variables indicating the gender of the dictator, third party and recipient respec-
tively. The variable for fairness was coded to take the value 1 if participants indicated an
equal split of the initial dictator endowment as fair and 0 otherwise. The variables for beliefs
regarding wealth and income were coded as 1 if the third party believed the dictator to have a
wealth (income) above that of the average student and 0 otherwise.
130
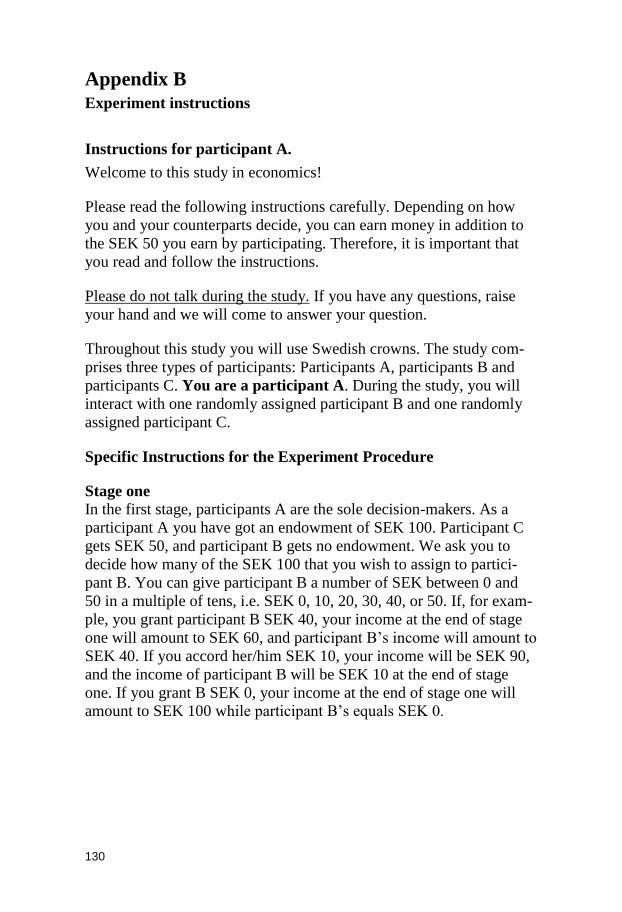
Appendix B
Experiment instructions
Instructions for participant A.
Welcome to this study in economics!
Please read the following instructions carefully. Depending on how
you and your counterparts decide, you can earn money in addition to
the SEK 50 you earn by participating. Therefore, it is important that
you read and follow the instructions.
Please do not talk during the study. If you have any questions, raise
your hand and we will come to answer your question.
Throughout this study you will use Swedish crowns. The study com-
prises three types of participants: Participants A, participants B and
participants C. You are a participant A. During the study, you will
interact with one randomly assigned participant B and one randomly
assigned participant C.
Specific Instructions for the Experiment Procedure
Stage one
In the first stage, participants A are the sole decision-makers. As a
participant A you have got an endowment of SEK 100. Participant C
gets SEK 50, and participant B gets no endowment. We ask you to
decide how many of the SEK 100 that you wish to assign to partici-
pant B. You can give participant B a number of SEK between 0 and
50 in a multiple of tens, i.e. SEK 0, 10, 20, 30, 40, or 50. If, for exam-
ple, you grant participant B SEK 40, your income at the end of stage
one will amount to SEK 60, and participant B’s income will amount to
SEK 40. If you accord her/him SEK 10, your income will be SEK 90,
and the income of participant B will be SEK 10 at the end of stage
one. If you grant B SEK 0, your income at the end of stage one will
amount to SEK 100 while participant B’s equals SEK 0.
131
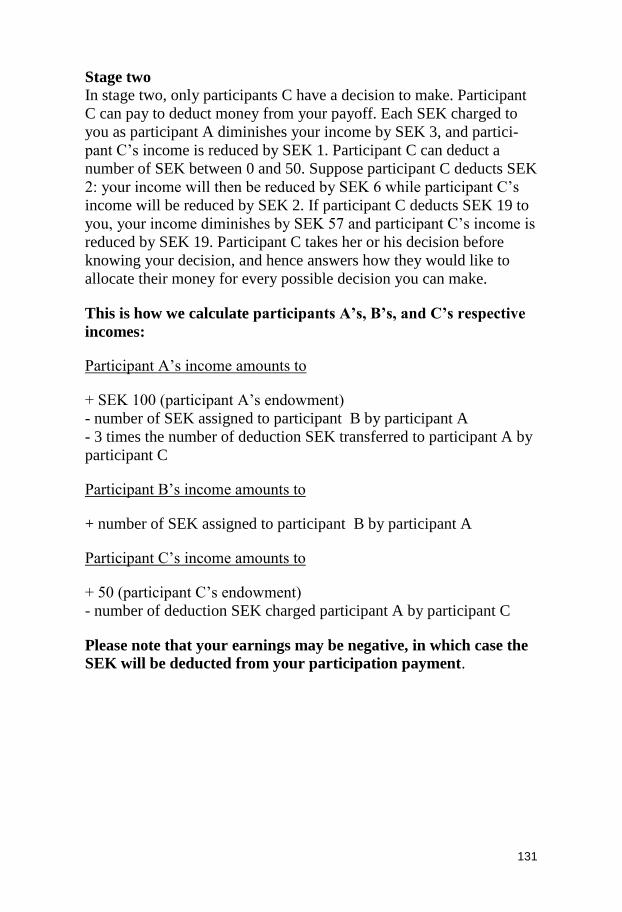
Stage two
In stage two, only participants C have a decision to make. Participant
C can pay to deduct money from your payoff. Each SEK charged to
you as participant A diminishes your income by SEK 3, and partici-
pant C’s income is reduced by SEK 1. Participant C can deduct a
number of SEK between 0 and 50. Suppose participant C deducts SEK
2: your income will then be reduced by SEK 6 while participant C’s
income will be reduced by SEK 2. If participant C deducts SEK 19 to
you, your income diminishes by SEK 57 and participant C’s income is
reduced by SEK 19. Participant C takes her or his decision before
knowing your decision, and hence answers how they would like to
allocate their money for every possible decision you can make.
This is how we calculate participants A’s, B’s, and C’s respective
incomes:
Participant A’s income amounts to
+ SEK 100 (participant A’s endowment)
- number of SEK assigned to participant B by participant A
- 3 times the number of deduction SEK transferred to participant A by
participant C
Participant B’s income amounts to
+ number of SEK assigned to participant B by participant A
Participant C’s income amounts to
+ 50 (participant C’s endowment)
- number of deduction SEK charged participant A by participant C
Please note that your earnings may be negative, in which case the
SEK will be deducted from your participation payment.

132
Control Questions
It is important that all participants have understood the rules of the
game. Therefore we ask you to answer the following control ques-
tions. When you have finished, signal to us by raising your hand.
A. Participant A assigns SEK 0 to participant B.
a) Participant C charges participant with SEK 0 deduction.
What is participant A’s income? ______________
What is participant B’s income? ______________
What is participant C’s income? ______________
b) Participant C charges participant A with SEK 30 deduction.
What is participant A’s income? ______________
What is participant B’s income? ______________
What is participant C’s income? ______________
2. Participant A assigns 40 SEK to participant B.
a) Participant C charges participant A with SEK 0 deduction.
What is participant A’s income? ______________
What is participant B’s income? ______________
What is participant C’s income? ______________
b) Participant C charges participant A with SEK 15 deduction.
What is participant A’s income? ______________
What is participant B’s income? ______________
What is participant C’s income? ______________
133
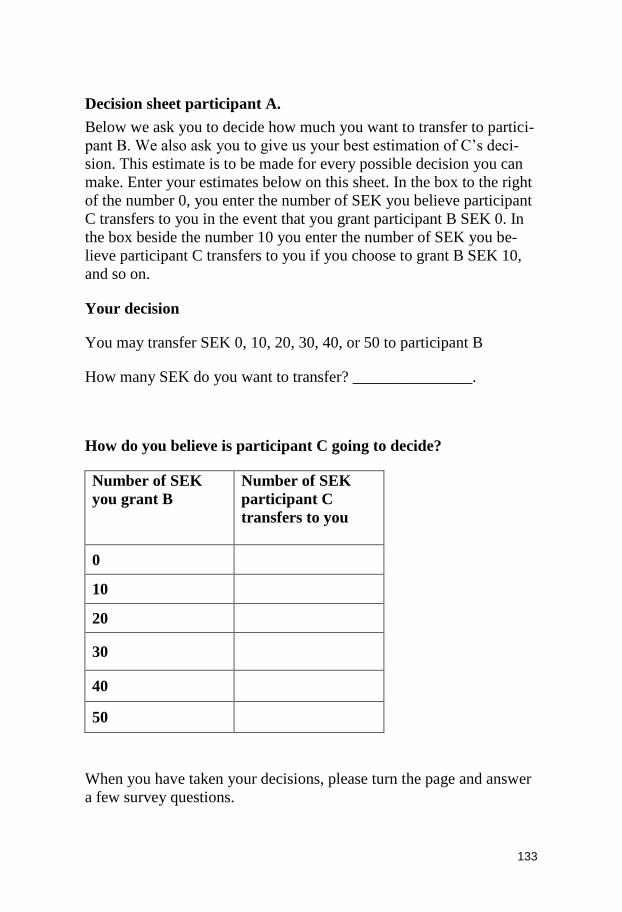
Decision sheet participant A.
Below we ask you to decide how much you want to transfer to partici-
pant B. We also ask you to give us your best estimation of C’s deci-
sion. This estimate is to be made for every possible decision you can
make. Enter your estimates below on this sheet. In the box to the right
of the number 0, you enter the number of SEK you believe participant
C transfers to you in the event that you grant participant B SEK 0. In
the box beside the number 10 you enter the number of SEK you be-
lieve participant C transfers to you if you choose to grant B SEK 10,
and so on.
Your decision
You may transfer SEK 0, 10, 20, 30, 40, or 50 to participant B
How many SEK do you want to transfer? _______________.
How do you believe is participant C going to decide?
Number of SEK
you grant B
Number of SEK
participant C
transfers to you
0
10
20
30
40
50
When you have taken your decisions, please turn the page and answer
a few survey questions.
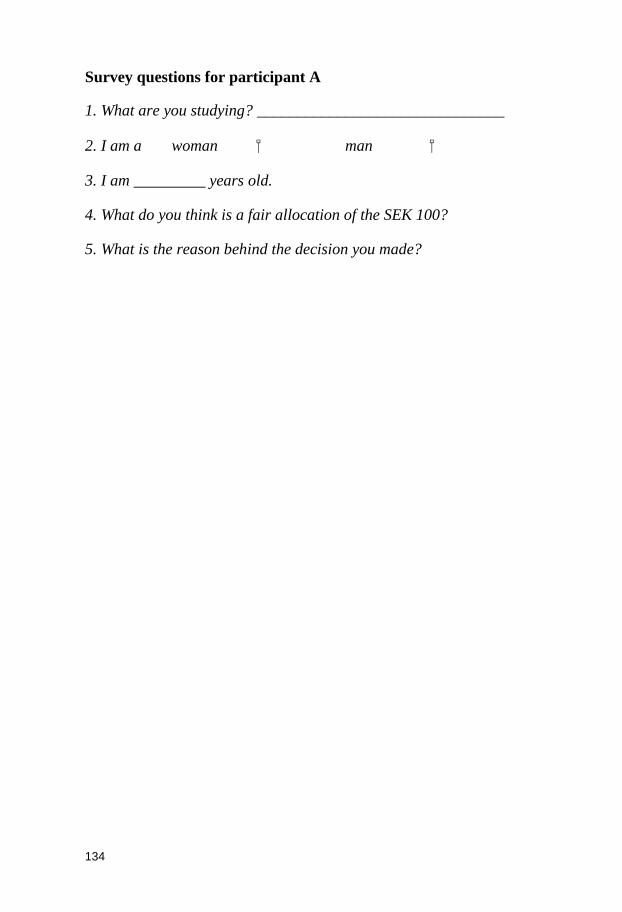
134
Survey questions for participant A
1. What are you studying? _______________________________
2. I am a woman man
3. I am _________ years old.
4. What do you think is a fair allocation of the SEK 100?
5. What is the reason behind the decision you made?
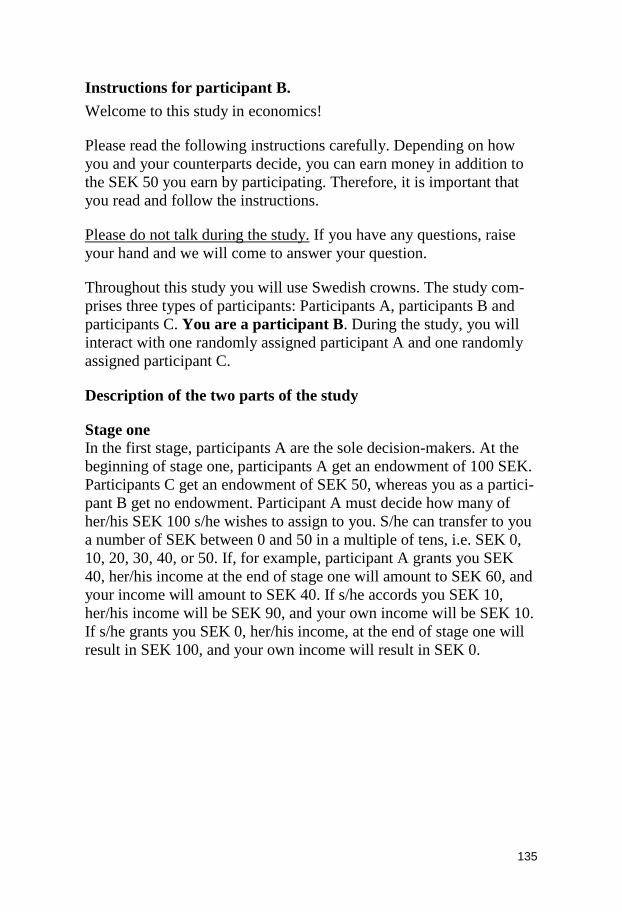
135
Instructions for participant B.
Welcome to this study in economics!
Please read the following instructions carefully. Depending on how
you and your counterparts decide, you can earn money in addition to
the SEK 50 you earn by participating. Therefore, it is important that
you read and follow the instructions.
Please do not talk during the study. If you have any questions, raise
your hand and we will come to answer your question.
Throughout this study you will use Swedish crowns. The study com-
prises three types of participants: Participants A, participants B and
participants C. You are a participant B. During the study, you will
interact with one randomly assigned participant A and one randomly
assigned participant C.
Description of the two parts of the study
Stage one
In the first stage, participants A are the sole decision-makers. At the
beginning of stage one, participants A get an endowment of 100 SEK.
Participants C get an endowment of SEK 50, whereas you as a partici-
pant B get no endowment. Participant A must decide how many of
her/his SEK 100 s/he wishes to assign to you. S/he can transfer to you
a number of SEK between 0 and 50 in a multiple of tens, i.e. SEK 0,
10, 20, 30, 40, or 50. If, for example, participant A grants you SEK
40, her/his income at the end of stage one will amount to SEK 60, and
your income will amount to SEK 40. If s/he accords you SEK 10,
her/his income will be SEK 90, and your own income will be SEK 10.
If s/he grants you SEK 0, her/his income, at the end of stage one will
result in SEK 100, and your own income will result in SEK 0.
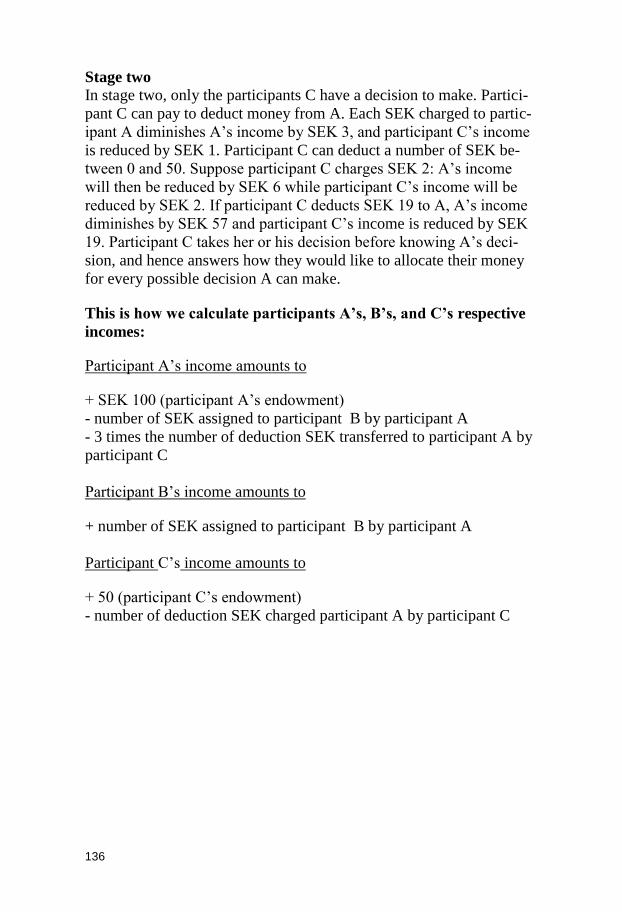
136
Stage two
In stage two, only the participants C have a decision to make. Partici-
pant C can pay to deduct money from A. Each SEK charged to partic-
ipant A diminishes A’s income by SEK 3, and participant C’s income
is reduced by SEK 1. Participant C can deduct a number of SEK be-
tween 0 and 50. Suppose participant C charges SEK 2: A’s income
will then be reduced by SEK 6 while participant C’s income will be
reduced by SEK 2. If participant C deducts SEK 19 to A, A’s income
diminishes by SEK 57 and participant C’s income is reduced by SEK
19. Participant C takes her or his decision before knowing A’s deci-
sion, and hence answers how they would like to allocate their money
for every possible decision A can make.
This is how we calculate participants A’s, B’s, and C’s respective
incomes:
Participant A’s income amounts to
+ SEK 100 (participant A’s endowment)
- number of SEK assigned to participant B by participant A
- 3 times the number of deduction SEK transferred to participant A by
participant C
Participant B’s income amounts to
+ number of SEK assigned to participant B by participant A
Participant C’s income amounts to
+ 50 (participant C’s endowment)
- number of deduction SEK charged participant A by participant C
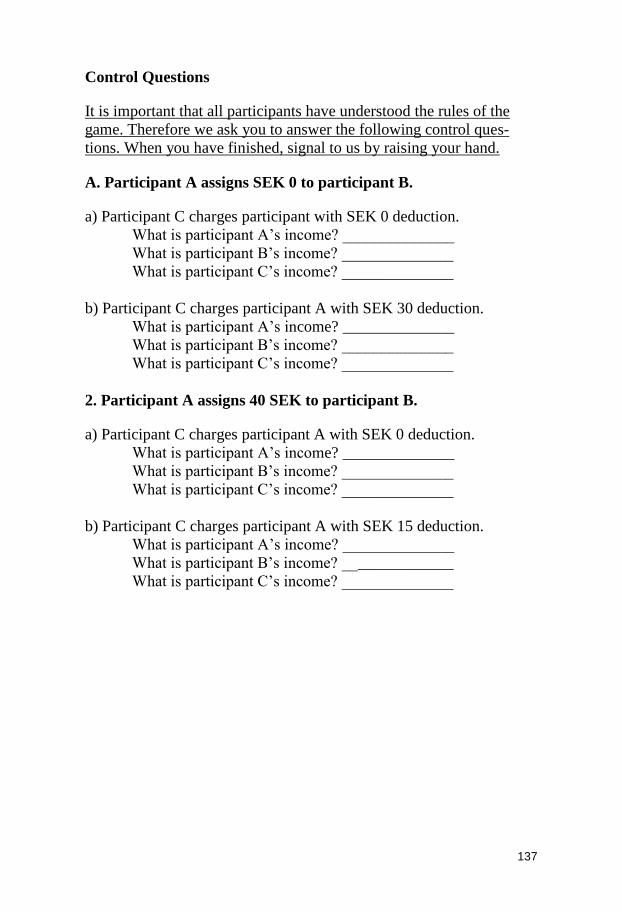
137
Control Questions
It is important that all participants have understood the rules of the
game. Therefore we ask you to answer the following control ques-
tions. When you have finished, signal to us by raising your hand.
A. Participant A assigns SEK 0 to participant B.
a) Participant C charges participant with SEK 0 deduction.
What is participant A’s income? ______________
What is participant B’s income? ______________
What is participant C’s income? ______________
b) Participant C charges participant A with SEK 30 deduction.
What is participant A’s income? ______________
What is participant B’s income? ______________
What is participant C’s income? ______________
2. Participant A assigns 40 SEK to participant B.
a) Participant C charges participant A with SEK 0 deduction.
What is participant A’s income? ______________
What is participant B’s income? ______________
What is participant C’s income? ______________
b) Participant C charges participant A with SEK 15 deduction.
What is participant A’s income? ______________
What is participant B’s income? ______________
What is participant C’s income? ______________
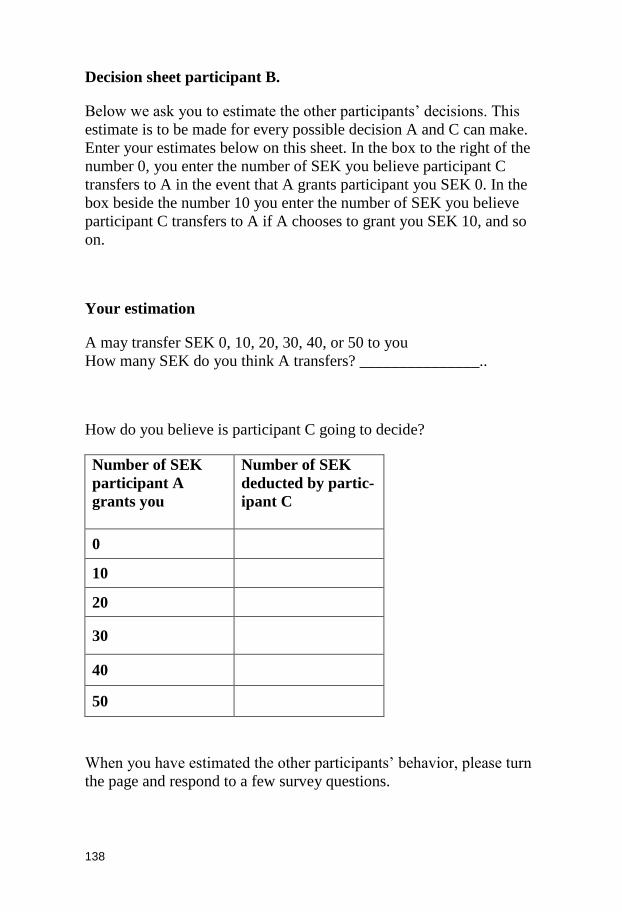
138
Decision sheet participant B.
Below we ask you to estimate the other participants’ decisions. This
estimate is to be made for every possible decision A and C can make.
Enter your estimates below on this sheet. In the box to the right of the
number 0, you enter the number of SEK you believe participant C
transfers to A in the event that A grants participant you SEK 0. In the
box beside the number 10 you enter the number of SEK you believe
participant C transfers to A if A chooses to grant you SEK 10, and so
on.
Your estimation
A may transfer SEK 0, 10, 20, 30, 40, or 50 to you
How many SEK do you think A transfers? _______________..
How do you believe is participant C going to decide?
Number of SEK
participant A
grants you
Number of SEK
deducted by partic-
ipant C
0
10
20
30
40
50
When you have estimated the other participants’ behavior, please turn
the page and respond to a few survey questions.
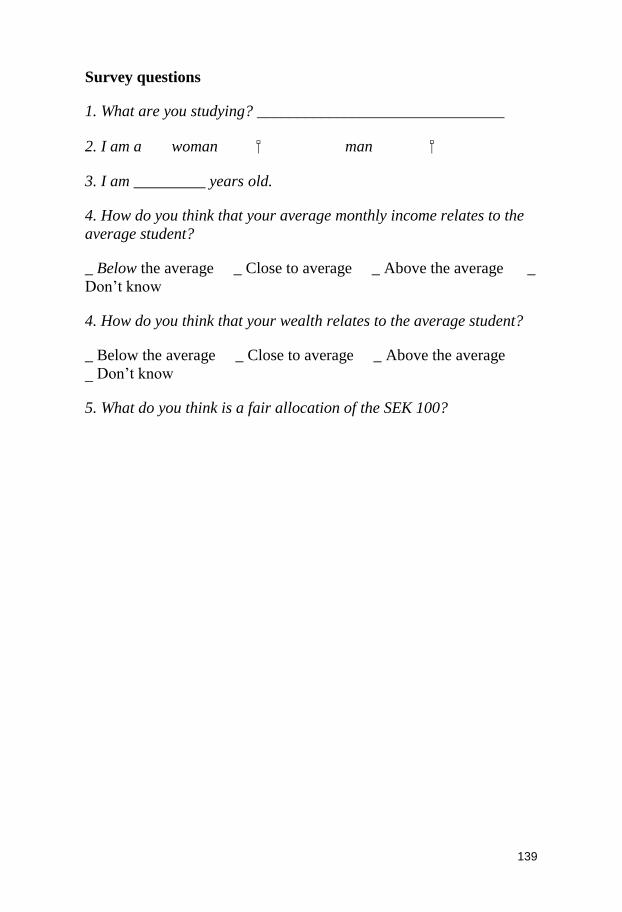
139
Survey questions
1. What are you studying? _______________________________
2. I am a woman man
3. I am _________ years old.
4. How do you think that your average monthly income relates to the
average student?
_ Below the average _ Close to average _ Above the average _
Don’t know
4. How do you think that your wealth relates to the average student?
_ Below the average _ Close to average _ Above the average
_ Don’t know
5. What do you think is a fair allocation of the SEK 100?
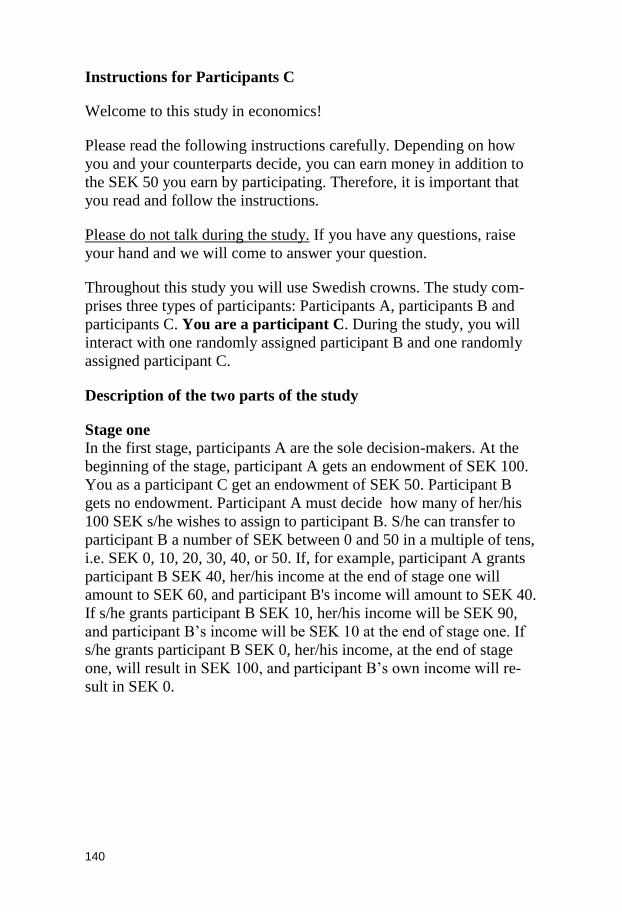
140
Instructions for Participants C
Welcome to this study in economics!
Please read the following instructions carefully. Depending on how
you and your counterparts decide, you can earn money in addition to
the SEK 50 you earn by participating. Therefore, it is important that
you read and follow the instructions.
Please do not talk during the study. If you have any questions, raise
your hand and we will come to answer your question.
Throughout this study you will use Swedish crowns. The study com-
prises three types of participants: Participants A, participants B and
participants C. You are a participant C. During the study, you will
interact with one randomly assigned participant B and one randomly
assigned participant C.
Description of the two parts of the study
Stage one
In the first stage, participants A are the sole decision-makers. At the
beginning of the stage, participant A gets an endowment of SEK 100.
You as a participant C get an endowment of SEK 50. Participant B
gets no endowment. Participant A must decide how many of her/his
100 SEK s/he wishes to assign to participant B. S/he can transfer to
participant B a number of SEK between 0 and 50 in a multiple of tens,
i.e. SEK 0, 10, 20, 30, 40, or 50. If, for example, participant A grants
participant B SEK 40, her/his income at the end of stage one will
amount to SEK 60, and participant B's income will amount to SEK 40.
If s/he grants participant B SEK 10, her/his income will be SEK 90,
and participant B’s income will be SEK 10 at the end of stage one. If
s/he grants participant B SEK 0, her/his income, at the end of stage
one, will result in SEK 100, and participant B’s own income will re-
sult in SEK 0.
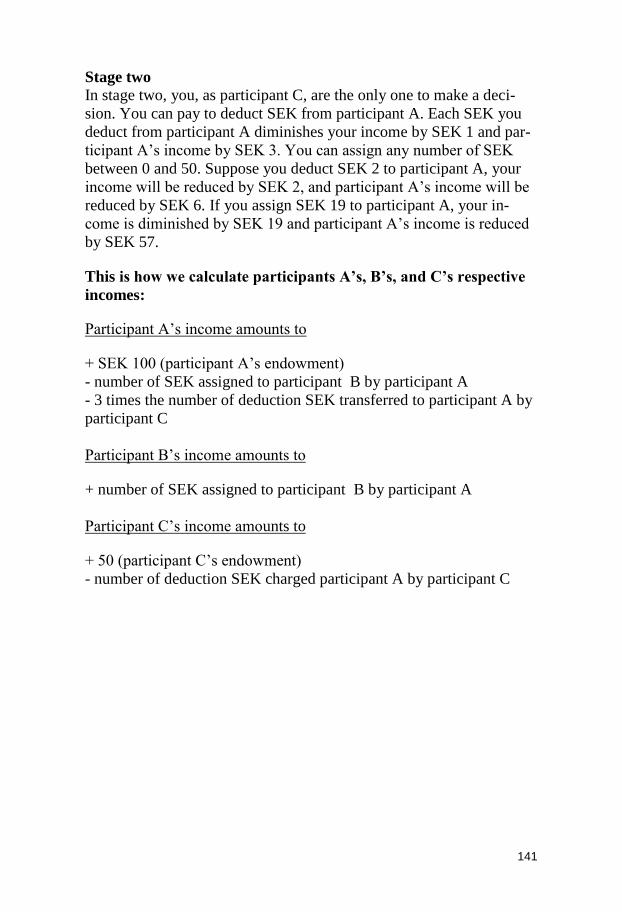
141
Stage two
In stage two, you, as participant C, are the only one to make a deci-
sion. You can pay to deduct SEK from participant A. Each SEK you
deduct from participant A diminishes your income by SEK 1 and par-
ticipant A’s income by SEK 3. You can assign any number of SEK
between 0 and 50. Suppose you deduct SEK 2 to participant A, your
income will be reduced by SEK 2, and participant A’s income will be
reduced by SEK 6. If you assign SEK 19 to participant A, your in-
come is diminished by SEK 19 and participant A’s income is reduced
by SEK 57.
This is how we calculate participants A’s, B’s, and C’s respective
incomes:
Participant A’s income amounts to
+ SEK 100 (participant A’s endowment)
- number of SEK assigned to participant B by participant A
- 3 times the number of deduction SEK transferred to participant A by
participant C
Participant B’s income amounts to
+ number of SEK assigned to participant B by participant A
Participant C’s income amounts to
+ 50 (participant C’s endowment)
- number of deduction SEK charged participant A by participant C
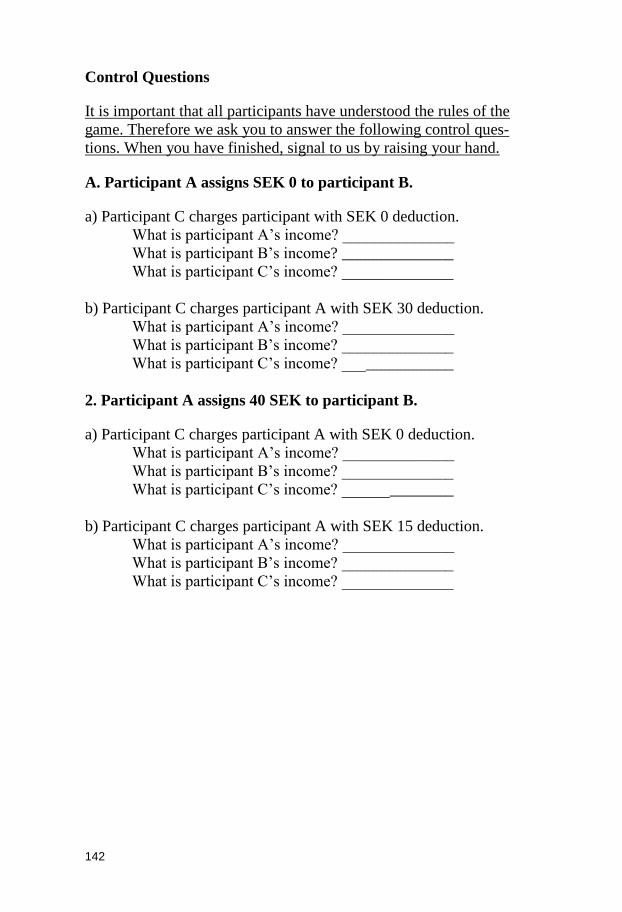
142
Control Questions
It is important that all participants have understood the rules of the
game. Therefore we ask you to answer the following control ques-
tions. When you have finished, signal to us by raising your hand.
A. Participant A assigns SEK 0 to participant B.
a) Participant C charges participant with SEK 0 deduction.
What is participant A’s income? ______________
What is participant B’s income? ______________
What is participant C’s income? ______________
b) Participant C charges participant A with SEK 30 deduction.
What is participant A’s income? ______________
What is participant B’s income? ______________
What is participant C’s income? ______________
2. Participant A assigns 40 SEK to participant B.
a) Participant C charges participant A with SEK 0 deduction.
What is participant A’s income? ______________
What is participant B’s income? ______________
What is participant C’s income? ______________
b) Participant C charges participant A with SEK 15 deduction.
What is participant A’s income? ______________
What is participant B’s income? ______________
What is participant C’s income? ______________
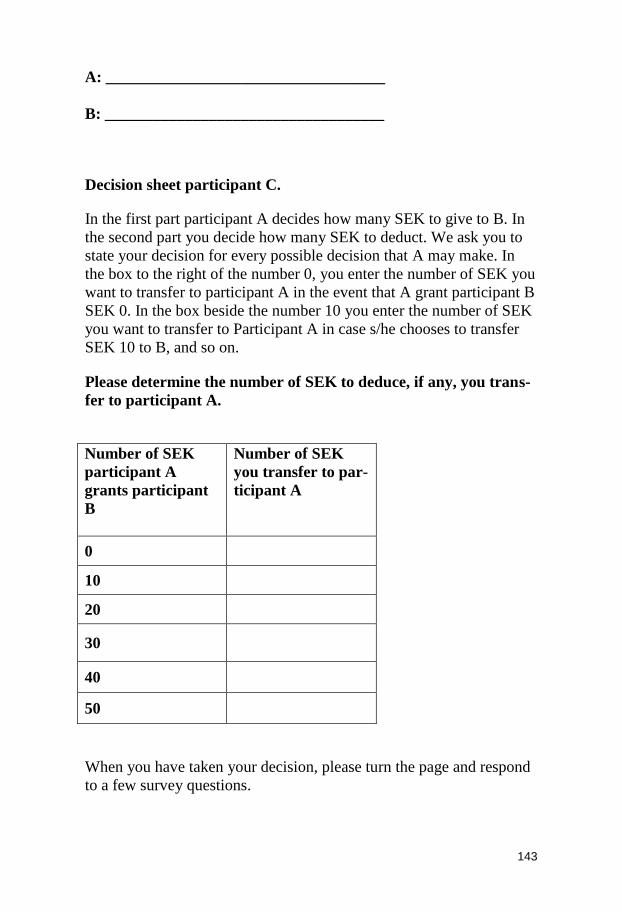
143
A: ___________________________________
B: ___________________________________
Decision sheet participant C.
In the first part participant A decides how many SEK to give to B. In
the second part you decide how many SEK to deduct. We ask you to
state your decision for every possible decision that A may make. In
the box to the right of the number 0, you enter the number of SEK you
want to transfer to participant A in the event that A grant participant B
SEK 0. In the box beside the number 10 you enter the number of SEK
you want to transfer to Participant A in case s/he chooses to transfer
SEK 10 to B, and so on.
Please determine the number of SEK to deduce, if any, you trans-
fer to participant A.
Number of SEK
participant A
grants participant
B
Number of SEK
you transfer to par-
ticipant A
0
10
20
30
40
50
When you have taken your decision, please turn the page and respond
to a few survey questions.
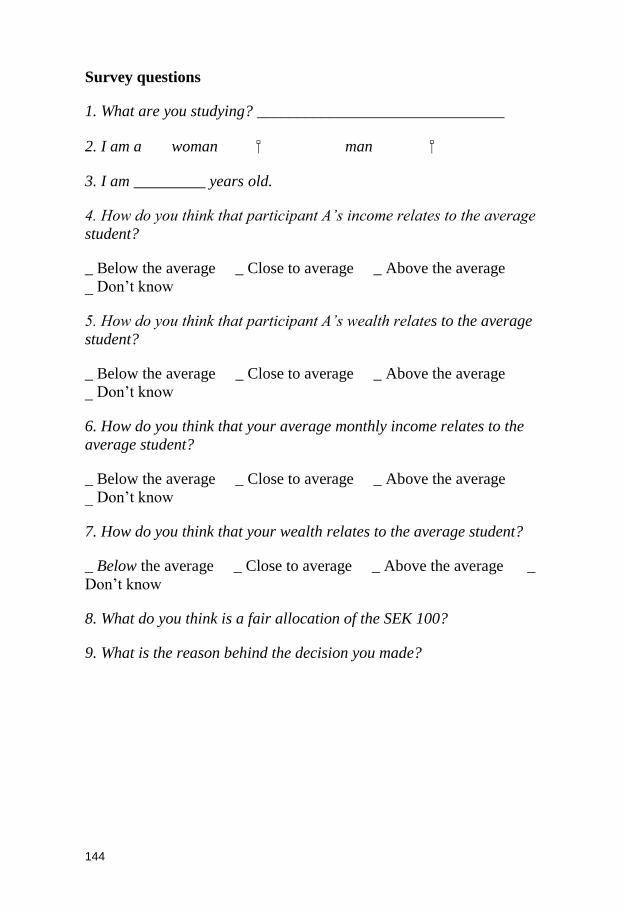
144
Survey questions
1. What are you studying? _______________________________
2. I am a woman man
3. I am _________ years old.
4. How do you think that participant A’s income relates to the average
student?
_ Below the average _ Close to average _ Above the average
_ Don’t know
5. How do you think that participant A’s wealth relates to the average
student?
_ Below the average _ Close to average _ Above the average
_ Don’t know
6. How do you think that your average monthly income relates to the
average student?
_ Below the average _ Close to average _ Above the average
_ Don’t know
7. How do you think that your wealth relates to the average student?
_ Below the average _ Close to average _ Above the average _
Don’t know
8. What do you think is a fair allocation of the SEK 100?
9. What is the reason behind the decision you made?