Embed Size (px)
Citation preview
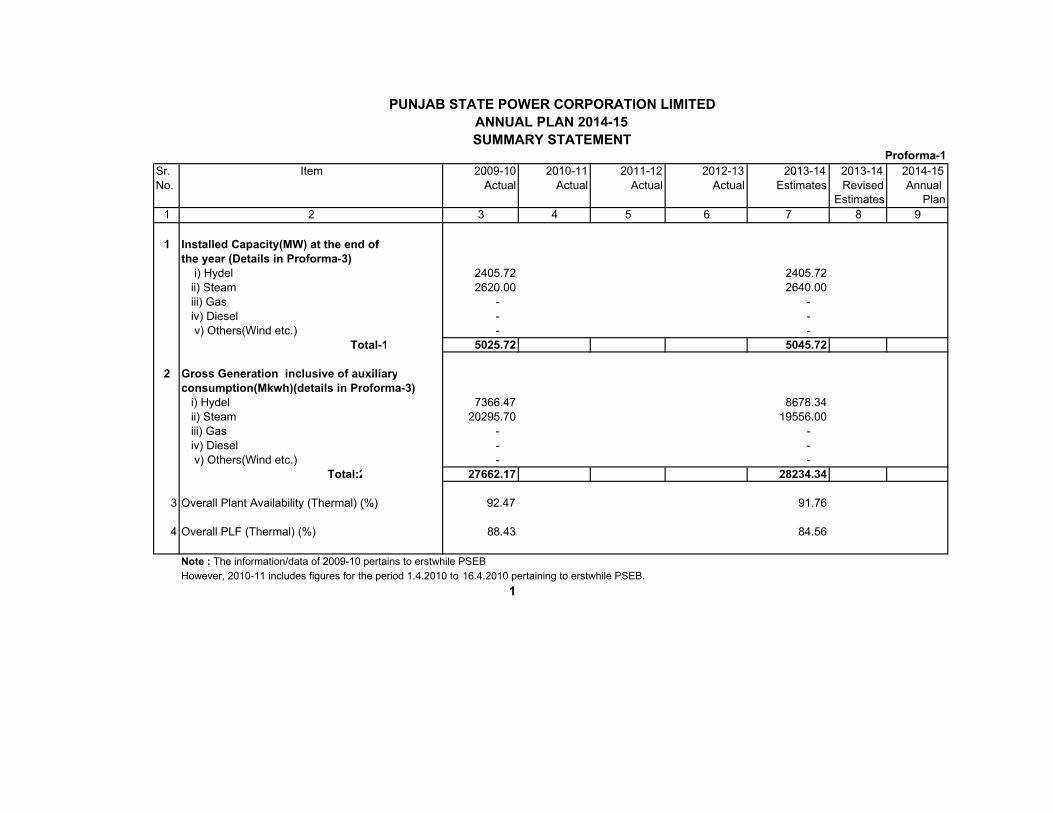
Sr. Item 2009-10 2010-11 2011-12 2012-13 2013-14 2013-14 2014-15
No. Actual Actual Actual Actual Estimates Revised Annual
Estimates Plan
1 2 3 4 5 6 7 8 9
1 Installed Capacity(MW) at the end of
the year (Details in Proforma-3)
i) Hydel 2405.72 2405.72
ii) Steam 2620.00 2640.00
iii) Gas - -
iv) Diesel - -
v) Others(Wind etc.) - -
Total-1 5025.72 5045.72
2 Gross Generation inclusive of auxiliary
consumption(Mkwh)(details in Proforma-3)
i) Hydel 7366.47 8678.34
ii) Steam 20295.70 19556.00
iii) Gas - -
iv) Diesel - -
v) Others(Wind etc.) - -
Total:2 27662.17 28234.34
3 Overall Plant Availability (Thermal) (%) 92.47 91.76
4 Overall PLF (Thermal) (%) 88.43 84.56
Note : The information/data of 2009-10 pertains to erstwhile PSEB
However, 2010-11 includes figures for the period 1.4.2010 to 16.4.2010 pertaining to erstwhile PSEB.
1
PUNJAB STATE POWER CORPORATION LIMITED
Proforma-1
ANNUAL PLAN 2014-15
SUMMARY STATEMENT
Sr. Item 2009-10 2010-11 2011-12 2012-13 2013-14 2013-14 2014-15
No. Actual Actual Actual Actual Estimates Revised Annual
Estimates Plan
1 2 3 4 5 6 7 8 9
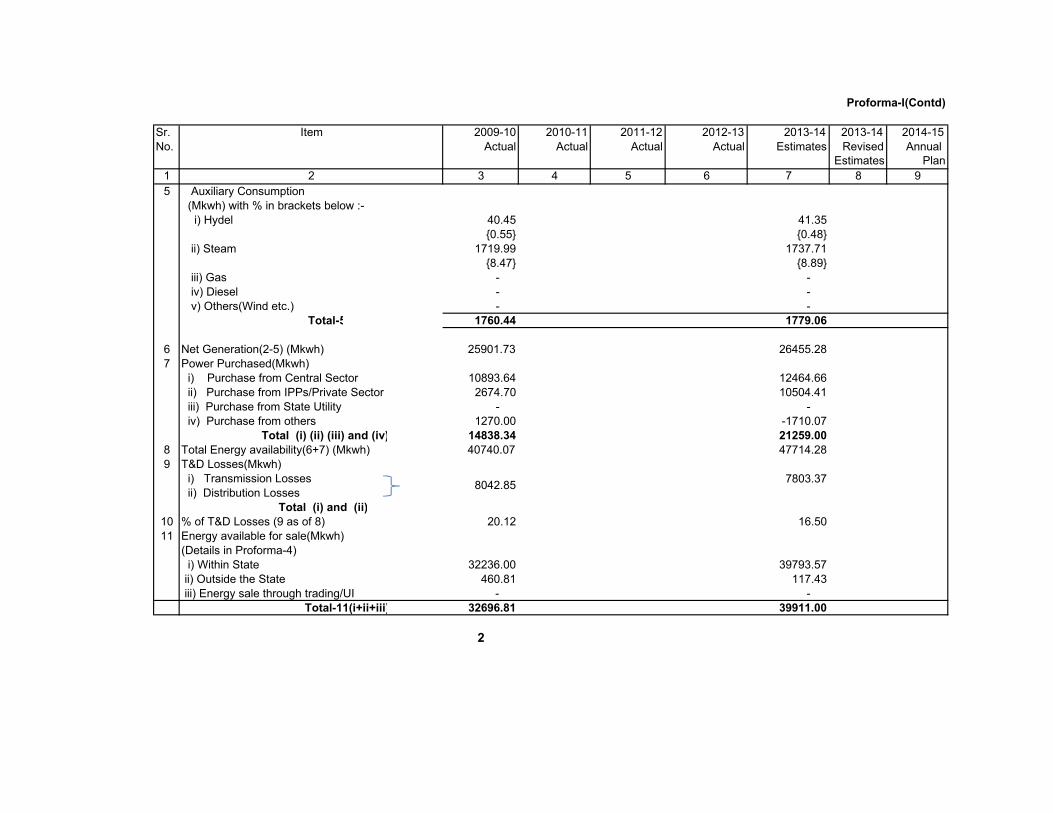
5 Auxiliary Consumption
(Mkwh) with % in brackets below :-
i) Hydel 40.45 41.35
{0.55} {0.48}
ii) Steam 1719.99 1737.71
{8.47} {8.89}
iii) Gas - -
iv) Diesel - -
v) Others(Wind etc.) - -
Total-5 1760.44 1779.06
6 Net Generation(2-5) (Mkwh) 25901.73 26455.28
7 Power Purchased(Mkwh)
i) Purchase from Central Sector 10893.64 12464.66
ii) Purchase from IPPs/Private Sector 2674.70 10504.41
iii) Purchase from State Utility - -
iv) Purchase from others 1270.00 -1710.07
Total (i) (ii) (iii) and (iv) 14838.34 21259.00
8 Total Energy availability(6+7) (Mkwh) 40740.07 47714.28
9 T&D Losses(Mkwh)
i) Transmission Losses 7803.37
ii) Distribution Losses
Total (i) and (ii)
10 % of T&D Losses (9 as of 8) 20.12 16.50
11 Energy available for sale(Mkwh)
(Details in Proforma-4)
i) Within State 32236.00 39793.57
ii) Outside the State 460.81 117.43
iii) Energy sale through trading/UI - -
Total-11(i+ii+iii) 32696.81 39911.00
2
Proforma-I(Contd)
8042.85
Proforma-I(Contd)
(Rs.Crore)
Sr. Item 2009-10 2010-11 2011-12 2012-13 2013-14 2013-14 2014-15
No. Actual Actual Actual Actual Estimates Revised Annual
Estimates Plan
1 2 3 4 5 6 7 8 9
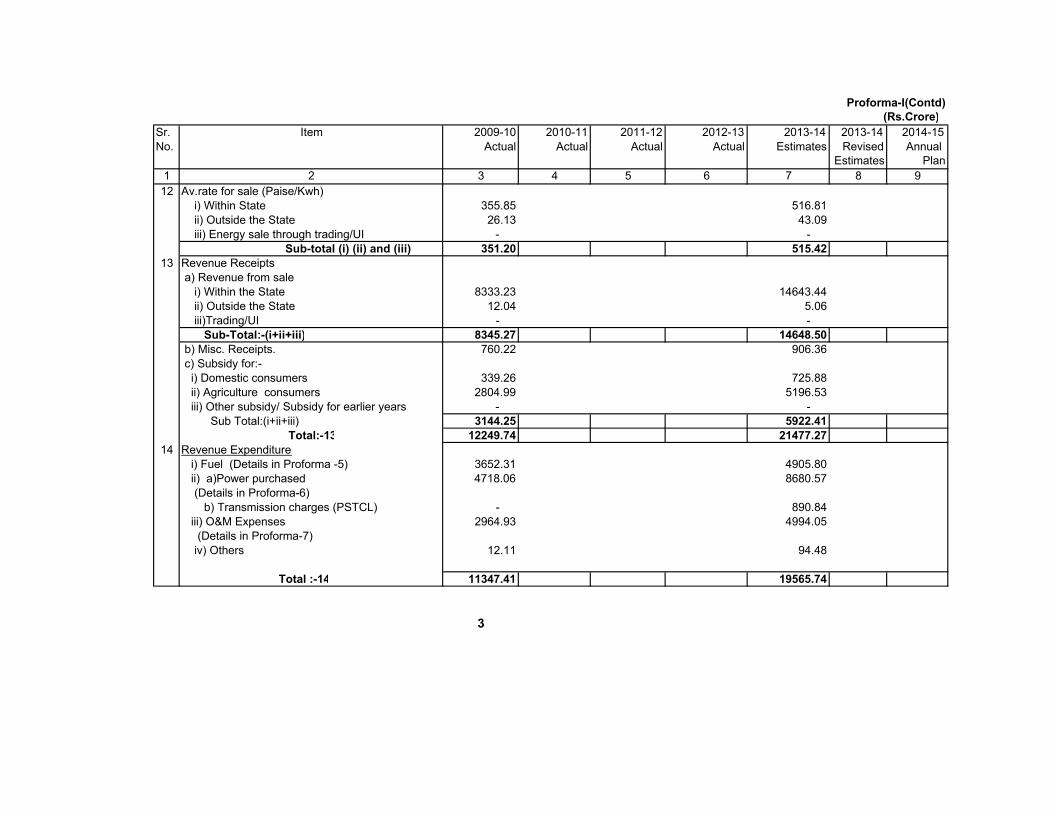
12 Av.rate for sale (Paise/Kwh)
i) Within State 355.85 516.81
ii) Outside the State 26.13 43.09
iii) Energy sale through trading/UI - -
Sub-total (i) (ii) and (iii) 351.20 515.42
13 Revenue Receipts
a) Revenue from sale
i) Within the State 8333.23 14643.44
ii) Outside the State 12.04 5.06
iii)Trading/UI - -
Sub-Total:-(i+ii+iii) 8345.27 14648.50
b) Misc. Receipts. 760.22 906.36
c) Subsidy for:-
i) Domestic consumers 339.26 725.88
ii) Agriculture consumers 2804.99 5196.53
iii) Other subsidy/ Subsidy for earlier years - -
Sub Total:(i+ii+iii) 3144.25 5922.41
Total:-13 12249.74 21477.27
14 Revenue Expenditure
i) Fuel (Details in Proforma -5) 3652.31 4905.80
ii) a)Power purchased 4718.06 8680.57
(Details in Proforma-6)
b) Transmission charges (PSTCL) - 890.84
iii) O&M Expenses 2964.93 4994.05
(Details in Proforma-7)
iv) Others 12.11 94.48
Total :-14 11347.41 19565.74
3
(Rs.Crore)
Sr. Item 2009-10 2010-11 2011-12 2012-13 2013-14 2013-14 2014-15
No. Actual Actual Actual Actual Estimates Revised Annual
Estimates Plan
1 2 3 4 5 6 7 8 9
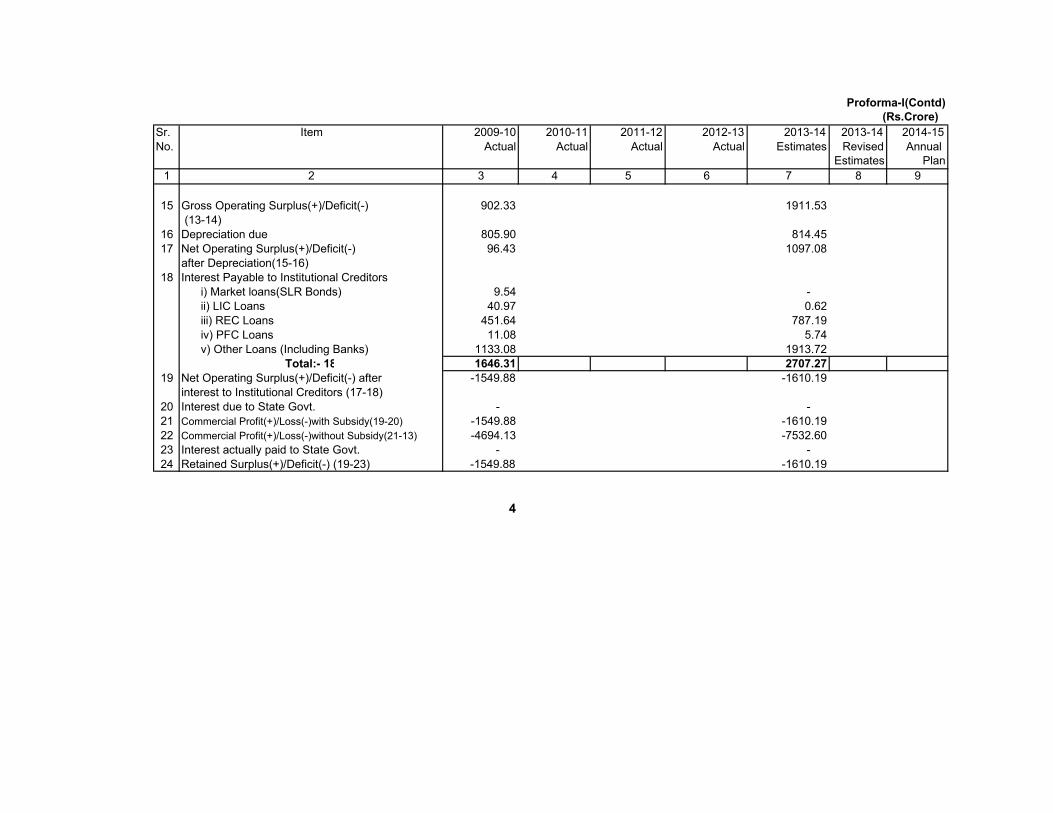
15 Gross Operating Surplus(+)/Deficit(-) 902.33 1911.53
(13-14)
16 Depreciation due 805.90 814.45
17 Net Operating Surplus(+)/Deficit(-) 96.43 1097.08
after Depreciation(15-16)
18 Interest Payable to Institutional Creditors
i) Market loans(SLR Bonds) 9.54 -
ii) LIC Loans 40.97 0.62
iii) REC Loans 451.64 787.19
iv) PFC Loans 11.08 5.74
v) Other Loans (Including Banks) 1133.08 1913.72
Total:- 18 1646.31 2707.27
19 Net Operating Surplus(+)/Deficit(-) after -1549.88 -1610.19
interest to Institutional Creditors (17-18)
20 Interest due to State Govt. - -
21 Commercial Profit(+)/Loss(-)with Subsidy(19-20) -1549.88 -1610.19
22 Commercial Profit(+)/Loss(-)without Subsidy(21-13) -4694.13 -7532.60
23 Interest actually paid to State Govt. - -
24 Retained Surplus(+)/Deficit(-) (19-23) -1549.88 -1610.19
4
Proforma-I(Contd)
Proforma-I(Contd)
(Rs.Crore)
Sr. Item 2009-10 2010-11 2011-12 2012-13 2013-14 2013-14 2014-15
No. Actual Actual Actual Actual Estimates Revised Annual
Estimates Plan
1 2 3 4 5 6 7 8 9
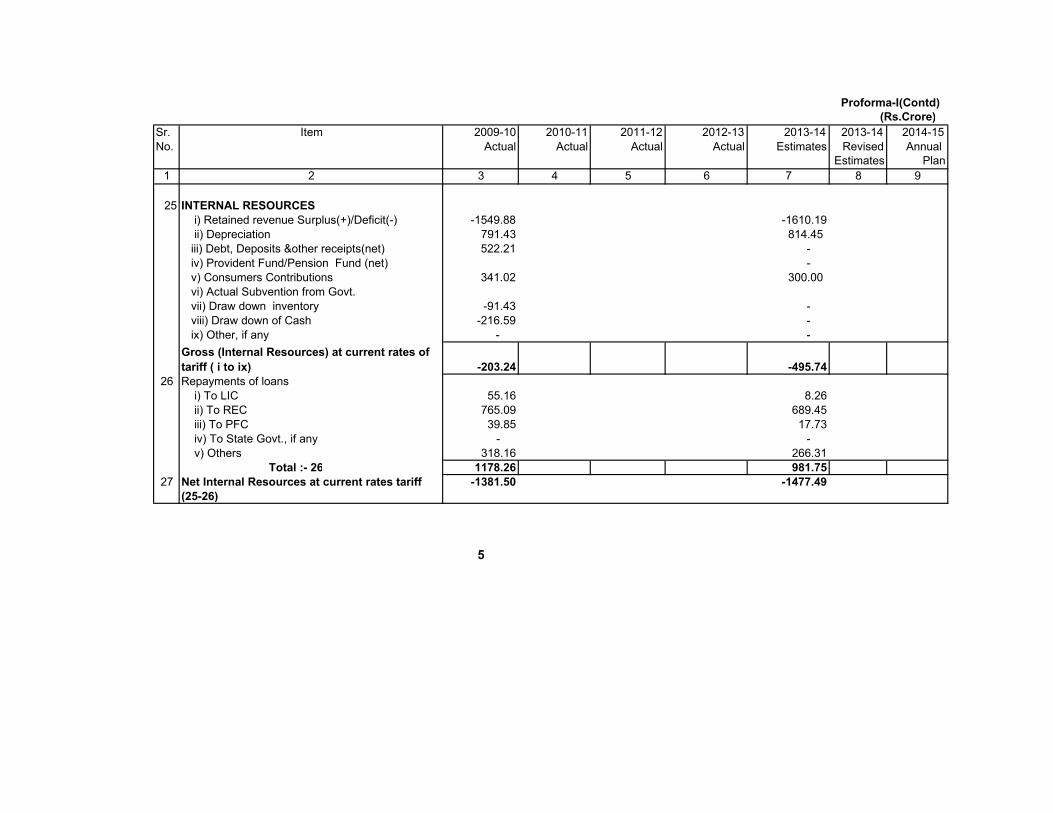
25 INTERNAL RESOURCES
i) Retained revenue Surplus(+)/Deficit(-) -1549.88 -1610.19
ii) Depreciation 791.43 814.45
iii) Debt, Deposits &other receipts(net) 522.21 -
iv) Provident Fund/Pension Fund (net) -
v) Consumers Contributions 341.02 300.00
vi) Actual Subvention from Govt.
vii) Draw down inventory -91.43 -
viii) Draw down of Cash -216.59 -
ix) Other, if any - -
Gross (Internal Resources) at current rates of
tariff ( i to ix) -203.24 -495.74
26 Repayments of loans
i) To LIC 55.16 8.26
ii) To REC 765.09 689.45
iii) To PFC 39.85 17.73
iv) To State Govt., if any - -
v) Others 318.16 266.31
Total :- 26 1178.26 981.75
27 Net Internal Resources at current rates tariff -1381.50 -1477.49
(25-26)
5
Proforma-I(Contd) (Rs.Crore)
Sr. Item 2009-10 2010-11 2011-12 2012-13 2013-14 2013-14 2014-15
No. Actual Actual Actual Actual Estimates Revised Annual
Estimates Plan
1 2 3 4 5 6 7 8 9
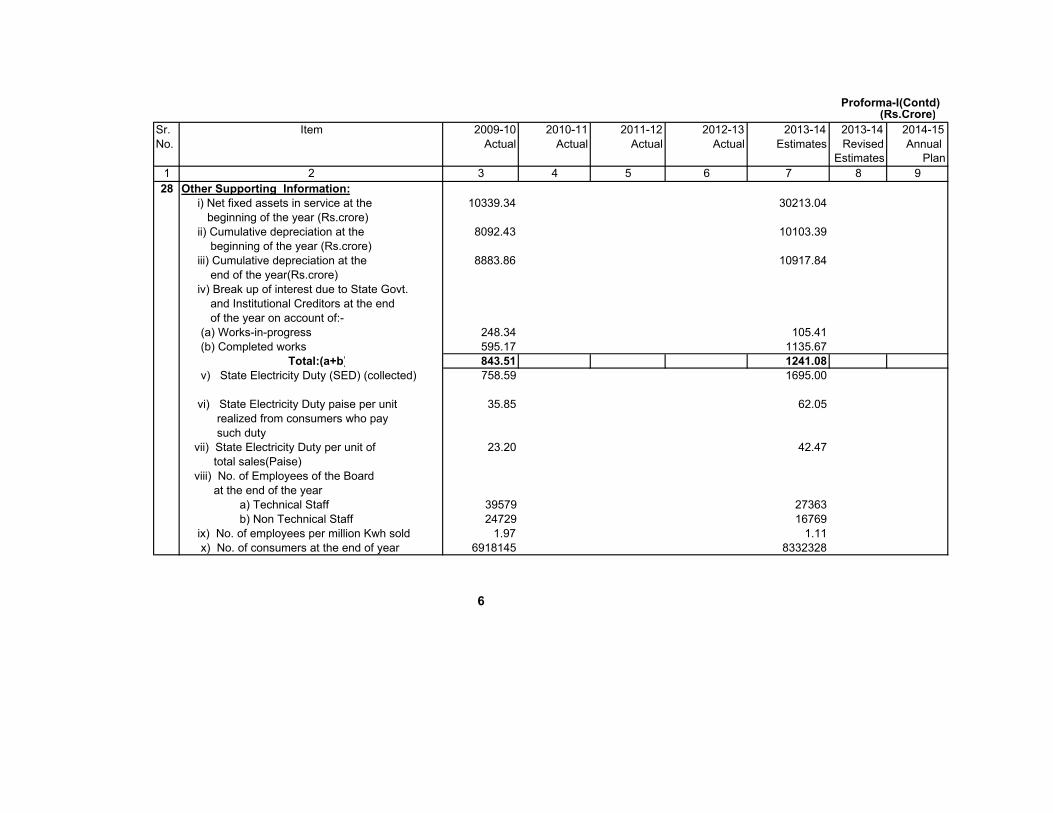
28 Other Supporting Information:
i) Net fixed assets in service at the 10339.34 30213.04
beginning of the year (Rs.crore)
ii) Cumulative depreciation at the 8092.43 10103.39
beginning of the year (Rs.crore)
iii) Cumulative depreciation at the 8883.86 10917.84
end of the year(Rs.crore)
iv) Break up of interest due to State Govt.
and Institutional Creditors at the end
of the year on account of:-
(a) Works-in-progress 248.34 105.41
(b) Completed works 595.17 1135.67
Total:(a+b) 843.51 1241.08
v) State Electricity Duty (SED) (collected) 758.59 1695.00
vi) State Electricity Duty paise per unit 35.85 62.05
realized from consumers who pay
such duty
vii) State Electricity Duty per unit of 23.20 42.47
total sales(Paise)
viii) No. of Employees of the Board
at the end of the year
a) Technical Staff 39579 27363
b) Non Technical Staff 24729 16769
ix) No. of employees per million Kwh sold 1.97 1.11
x) No. of consumers at the end of year 6918145 8332328
6
Proforma-I(Contd)
(Rs.Crore)
Sr. Item 2009-10 2010-11 2011-12 2012-13 2013-14 2013-14 2014-15
No. Actual Actual Actual Actual Estimates Revised Annual
Estimates Plan
1 2 3 4 5 6 7 8 9
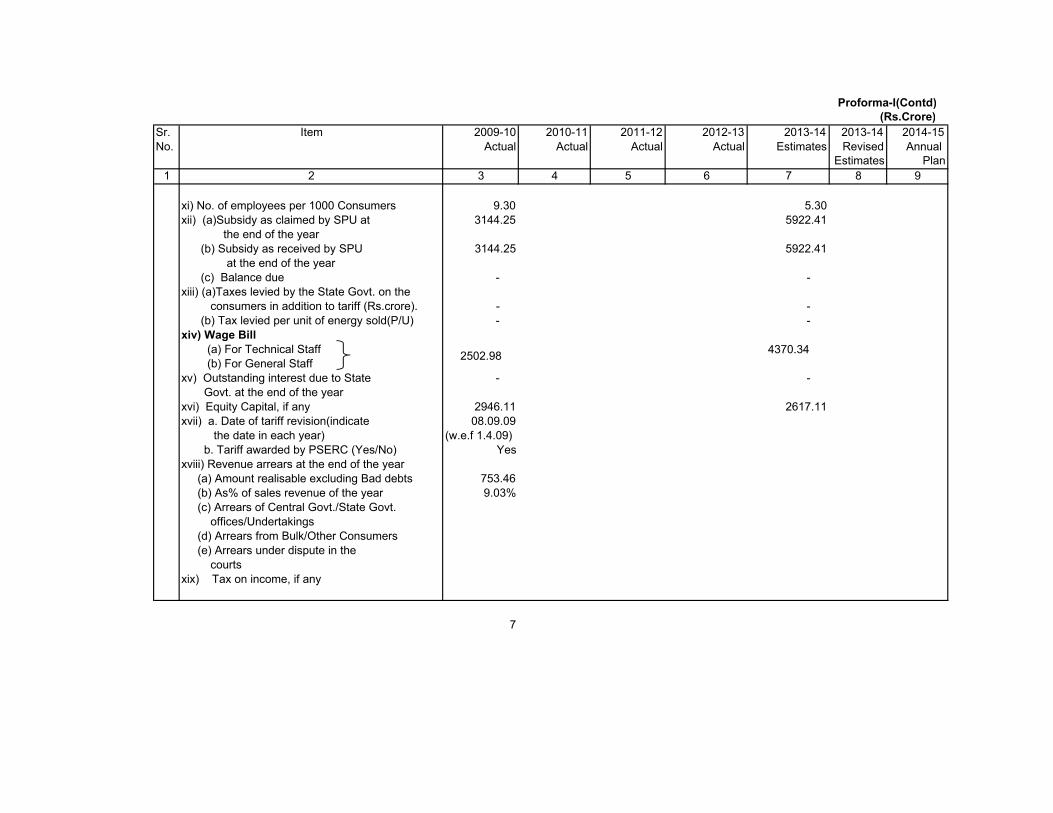
xi) No. of employees per 1000 Consumers 9.30 5.30
xii) (a)Subsidy as claimed by SPU at 3144.25 5922.41
the end of the year
(b) Subsidy as received by SPU 3144.25 5922.41
at the end of the year
(c) Balance due - -
xiii) (a)Taxes levied by the State Govt. on the
consumers in addition to tariff (Rs.crore). - -
(b) Tax levied per unit of energy sold(P/U) - -
xiv) Wage Bill
(a) For Technical Staff 4370.34
(b) For General Staff
xv) Outstanding interest due to State - -
Govt. at the end of the year
xvi) Equity Capital, if any 2946.11 2617.11
xvii) a. Date of tariff revision(indicate 08.09.09
the date in each year) (w.e.f 1.4.09)
b. Tariff awarded by PSERC (Yes/No) Yes
xviii) Revenue arrears at the end of the year
(a) Amount realisable excluding Bad debts 753.46
(b) As% of sales revenue of the year 9.03%
(c) Arrears of Central Govt./State Govt.
offices/Undertakings
(d) Arrears from Bulk/Other Consumers
(e) Arrears under dispute in the
courts
xix) Tax on income, if any
7
2502.98
Proforma-I(Contd)
(Rs.Crore)
Sr. Item 2009-10 2010-11 2011-12 2012-13 2013-14 2013-14 2014-15
No. Actual Actual Actual Actual Estimates Revised Annual
Estimates Plan
1 2 3 4 5 6 7 8 9
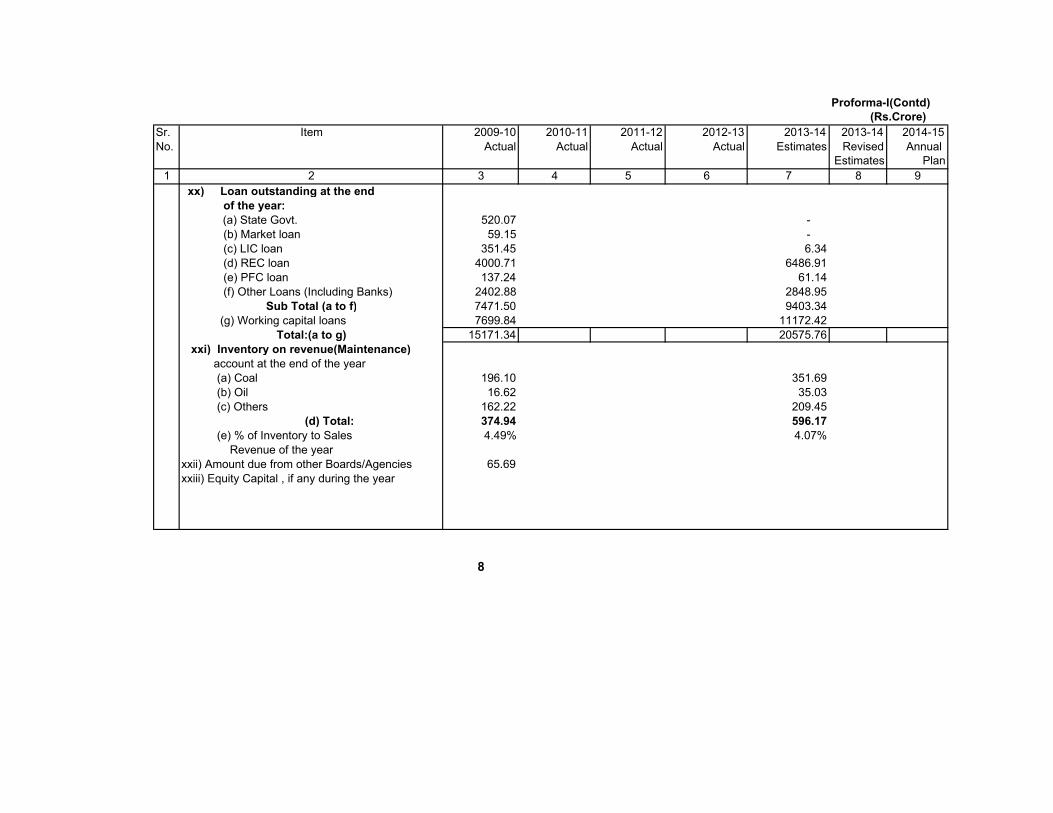
xx) Loan outstanding at the end
of the year:
(a) State Govt. 520.07 -
(b) Market loan 59.15 -
(c) LIC loan 351.45 6.34
(d) REC loan 4000.71 6486.91
(e) PFC loan 137.24 61.14
(f) Other Loans (Including Banks) 2402.88 2848.95
Sub Total (a to f) 7471.50 9403.34
(g) Working capital loans 7699.84 11172.42
Total:(a to g) 15171.34 20575.76
xxi) Inventory on revenue(Maintenance)
account at the end of the year
(a) Coal 196.10 351.69
(b) Oil 16.62 35.03
(c) Others 162.22 209.45
(d) Total: 374.94 596.17
(e) % of Inventory to Sales 4.49% 4.07%
Revenue of the year
xxii) Amount due from other Boards/Agencies 65.69
xxiii) Equity Capital , if any during the year
8
Proforma-I(Contd)
(Rs.Crore)
Sr. Item 2009-10 2010-11 2011-12 2012-13 2013-14 2013-14 2014-15
No. Actual Actual Actual Actual Estimates Revised Annual
Estimates Plan
1 2 3 4 5 6 7 8 9
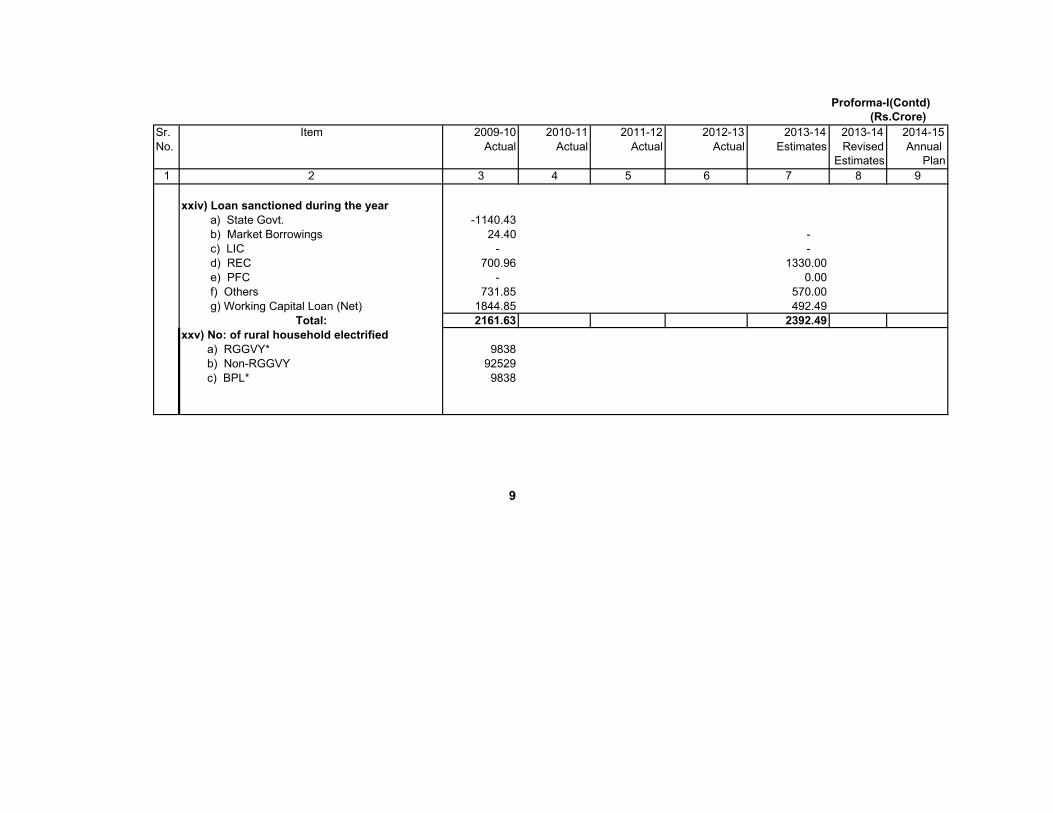
xxiv) Loan sanctioned during the year
a) State Govt. -1140.43
b) Market Borrowings 24.40 -
c) LIC - -
d) REC 700.96 1330.00
e) PFC - 0.00
f) Others 731.85 570.00
g) Working Capital Loan (Net) 1844.85 492.49
Total: 2161.63 2392.49
xxv) No: of rural household electrified
a) RGGVY* 9838
b) Non-RGGVY 92529
c) BPL* 9838
9
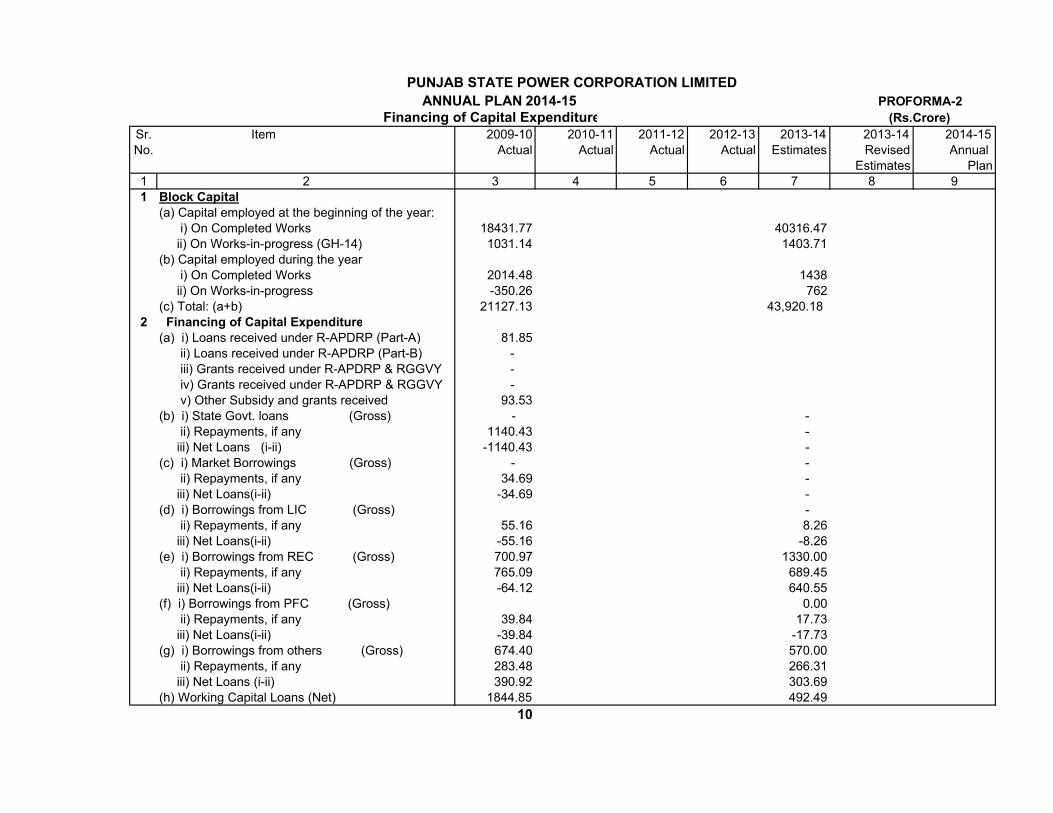
ANNUAL PLAN 2014-15 PROFORMA-2
Financing of Capital Expenditure (Rs.Crore)
Sr. Item 2009-10 2010-11 2011-12 2012-13 2013-14 2013-14 2014-15
No. Actual Actual Actual Actual Estimates Revised Annual
Estimates Plan
1 2 3 4 5 6 7 8 9
1 Block Capital
(a) Capital employed at the beginning of the year:
i) On Completed Works 18431.77 40316.47
ii) On Works-in-progress (GH-14) 1031.14 1403.71
(b) Capital employed during the year
i) On Completed Works 2014.48 1438
ii) On Works-in-progress -350.26 762
(c) Total: (a+b) 21127.13 43,920.18
2 Financing of Capital Expenditure
(a) i) Loans received under R-APDRP (Part-A) 81.85
ii) Loans received under R-APDRP (Part-B) -
iii) Grants received under R-APDRP & RGGVY -
iv) Grants received under R-APDRP & RGGVY -
v) Other Subsidy and grants received 93.53
(b) i) State Govt. loans (Gross) - -
ii) Repayments, if any 1140.43 -
iii) Net Loans (i-ii) -1140.43 -
(c) i) Market Borrowings (Gross) - -
ii) Repayments, if any 34.69 -
iii) Net Loans(i-ii) -34.69 -
(d) i) Borrowings from LIC (Gross) -
ii) Repayments, if any 55.16 8.26
iii) Net Loans(i-ii) -55.16 -8.26
(e) i) Borrowings from REC (Gross) 700.97 1330.00
ii) Repayments, if any 765.09 689.45
iii) Net Loans(i-ii) -64.12 640.55
(f) i) Borrowings from PFC (Gross) 0.00
ii) Repayments, if any 39.84 17.73
iii) Net Loans(i-ii) -39.84 -17.73
(g) i) Borrowings from others (Gross) 674.40 570.00
ii) Repayments, if any 283.48 266.31
iii) Net Loans (i-ii) 390.92 303.69
(h) Working Capital Loans (Net) 1844.85 492.49
10
PUNJAB STATE POWER CORPORATION LIMITED
Sr. Item 2009-10 2010-11 2011-12 2012-13 2013-14 2013-14 2014-15
No. Actual Actual Actual Actual Estimates Revised Annual
Estimates Plan
1 2 3 4 5 6 7 8 9
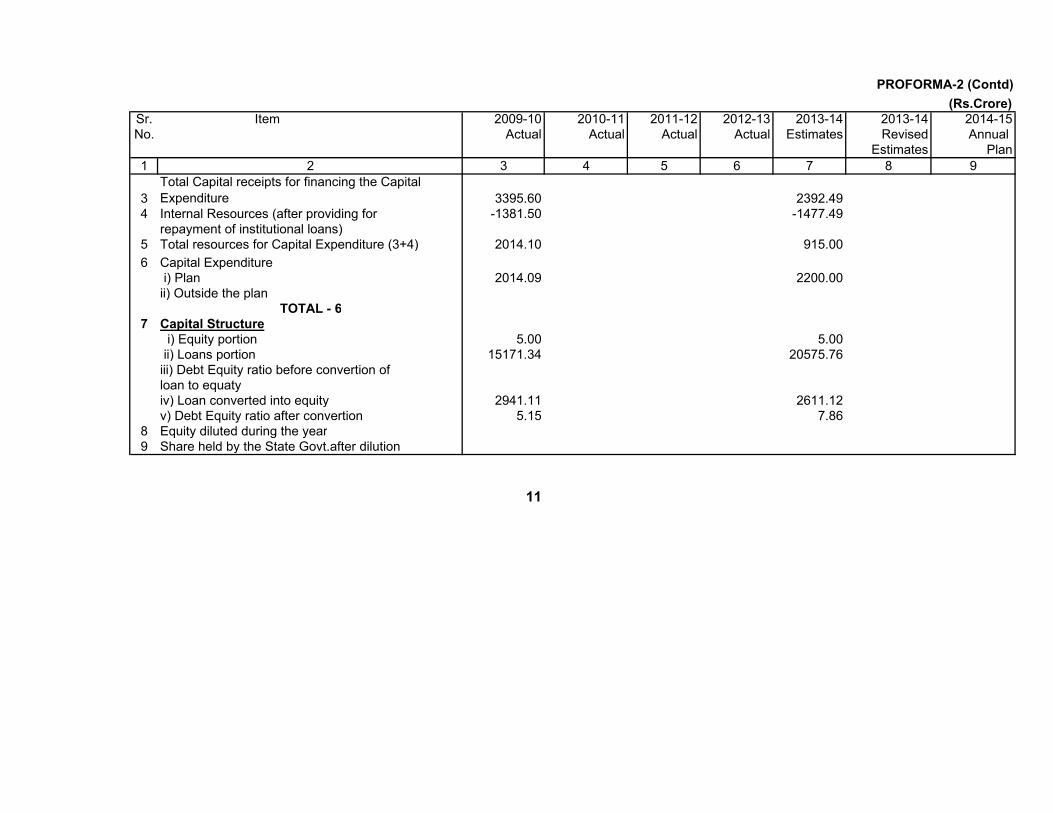
3
Total Capital receipts for financing the Capital
Expenditure 3395.60 2392.49
4 Internal Resources (after providing for -1381.50 -1477.49
repayment of institutional loans)
5 Total resources for Capital Expenditure (3+4) 2014.10 915.00
6 Capital Expenditure
i) Plan 2014.09 2200.00
ii) Outside the plan
TOTAL - 6
7 Capital Structure
i) Equity portion 5.00 5.00
ii) Loans portion 15171.34 20575.76
iii) Debt Equity ratio before convertion of
loan to equaty
iv) Loan converted into equity 2941.11 2611.12
v) Debt Equity ratio after convertion 5.15 7.86
8 Equity diluted during the year
9 Share held by the State Govt.after dilution
11
PROFORMA-2 (Contd)
(Rs.Crore)
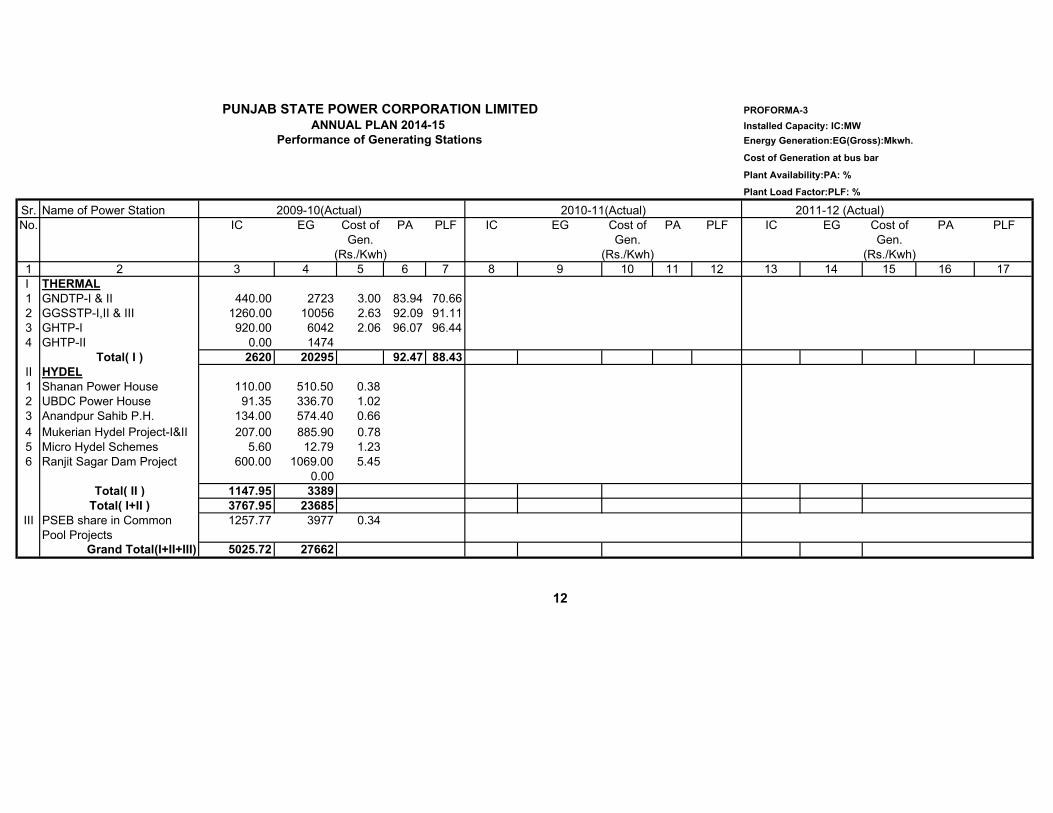
PROFORMA-3
Installed Capacity: IC:MW
Energy Generation:EG(Gross):Mkwh.
Cost of Generation at bus bar
Plant Availability:PA: %
Plant Load Factor:PLF: %
Sr. Name of Power Station 2009-10(Actual) 2011-12 (Actual)
No. IC EG Cost of PA PLF IC EG Cost of PA PLF IC EG Cost of PA PLF
Gen. Gen. Gen.
(Rs./Kwh) (Rs./Kwh) (Rs./Kwh)
1 2 3 4 5 6 7 8 9 10 11 12 13 14 15 16 17
I THERMAL
1 GNDTP-I & II 440.00 2723 3.00 83.94 70.66
2 GGSSTP-I,II & III 1260.00 10056 2.63 92.09 91.11
3 GHTP-I 920.00 6042 2.06 96.07 96.44
4 GHTP-II 0.00 1474
Total( I ) 2620 20295 92.47 88.43
II HYDEL
1 Shanan Power House 110.00 510.50 0.38
2 UBDC Power House 91.35 336.70 1.02
3 Anandpur Sahib P.H. 134.00 574.40 0.66
4 Mukerian Hydel Project-I&II 207.00 885.90 0.78
5 Micro Hydel Schemes 5.60 12.79 1.23
6 Ranjit Sagar Dam Project 600.00 1069.00 5.45
0.00
Total( II ) 1147.95 3389
Total( I+II ) 3767.95 23685
III PSEB share in Common 1257.77 3977 0.34
Pool Projects
Grand Total(I+II+III) 5025.72 27662
12
PUNJAB STATE POWER CORPORATION LIMITEDANNUAL PLAN 2014-15
Performance of Generating Stations
2010-11(Actual)
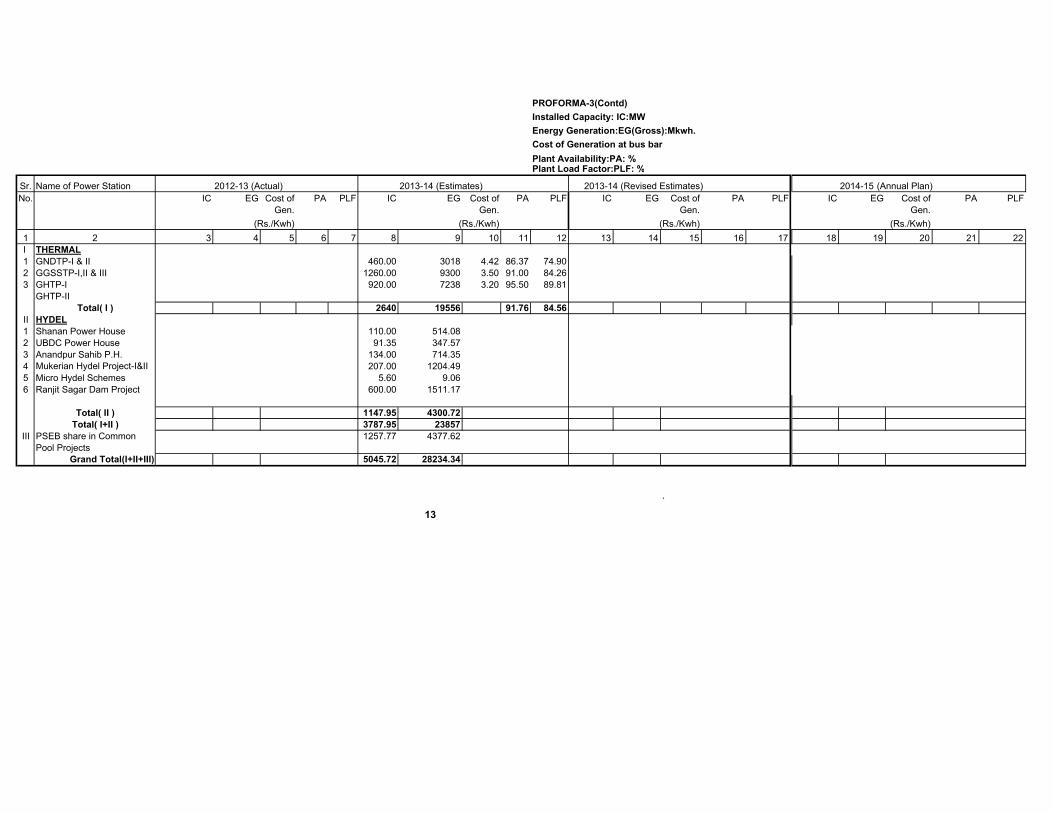
PROFORMA-3(Contd)
Installed Capacity: IC:MW
Energy Generation:EG(Gross):Mkwh.
Cost of Generation at bus bar
Plant Availability:PA: %Plant Load Factor:PLF: %
Sr. Name of Power Station 2012-13 (Actual) 2013-14 (Estimates) 2013-14 (Revised Estimates) 2014-15 (Annual Plan)
No. IC EG Cost of PA PLF IC EG Cost of PA PLF IC EG Cost of PA PLF IC EG Cost of PA PLF
Gen. Gen. Gen. Gen.
(Rs./Kwh) (Rs./Kwh) (Rs./Kwh) (Rs./Kwh)
1 2 3 4 5 6 7 8 9 10 11 12 13 14 15 16 17 18 19 20 21 22
I THERMAL
1 GNDTP-I & II 460.00 3018 4.42 86.37 74.90
2 GGSSTP-I,II & III 1260.00 9300 3.50 91.00 84.26
3 GHTP-I 920.00 7238 3.20 95.50 89.81
GHTP-II
Total( I ) 2640 19556 91.76 84.56
II HYDEL
1 Shanan Power House 110.00 514.08
2 UBDC Power House 91.35 347.57
3 Anandpur Sahib P.H. 134.00 714.35
4 Mukerian Hydel Project-I&II 207.00 1204.49
5 Micro Hydel Schemes 5.60 9.06
6 Ranjit Sagar Dam Project 600.00 1511.17
Total( II ) 1147.95 4300.72
Total( I+II ) 3787.95 23857
III PSEB share in Common 1257.77 4377.62
Pool Projects
Grand Total(I+II+III) 5045.72 28234.34
`
13
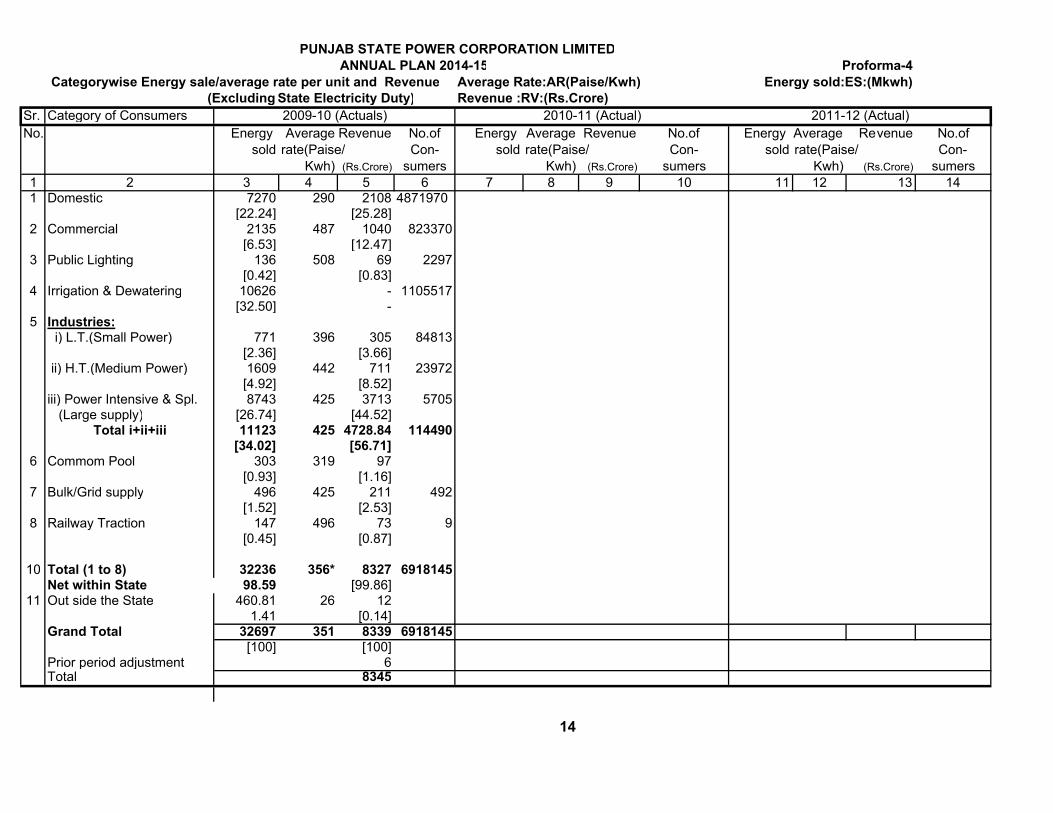
PUNJAB STATE POWER CORPORATION LIMITED
ANNUAL PLAN 2014-15 Proforma-4
Categorywise Energy sale/average rate per unit and Revenue Average Rate:AR(Paise/Kwh) Energy sold:ES:(Mkwh)
(Excluding State Electricity Duty) Revenue :RV:(Rs.Crore)
Sr. Category of Consumers
No. Energy Average Revenue No.of Energy Average Revenue No.of Energy Average Revenue No.of
sold rate(Paise/ Con- sold rate(Paise/ Con- sold rate(Paise/ Con-
Kwh) (Rs.Crore) sumers Kwh) (Rs.Crore) sumers Kwh) (Rs.Crore) sumers
1 2 3 4 5 6 7 8 9 10 11 12 13 141 Domestic 7270 290 2108 4871970
[22.24] [25.28]2 Commercial 2135 487 1040 823370
[6.53] [12.47]3 Public Lighting 136 508 69 2297
[0.42] [0.83]4 Irrigation & Dewatering 10626 - 1105517
[32.50] -5 Industries:
i) L.T.(Small Power) 771 396 305 84813[2.36] [3.66]
ii) H.T.(Medium Power) 1609 442 711 23972[4.92] [8.52]
iii) Power Intensive & Spl. 8743 425 3713 5705 (Large supply) [26.74] [44.52]
Total i+ii+iii 11123 425 4728.84 114490[34.02] [56.71]
6 Commom Pool 303 319 97[0.93] [1.16]
7 Bulk/Grid supply 496 425 211 492[1.52] [2.53]
8 Railway Traction 147 496 73 9[0.45] [0.87]
10 Total (1 to 8) 32236 356* 8327 6918145Net within State 98.59 [99.86]
11 Out side the State 460.81 26 121.41 [0.14]
Grand Total 32697 351 8339 6918145[100] [100]
Prior period adjustment 6Total 8345
14
2010-11 (Actual)2009-10 (Actuals) 2011-12 (Actual)
#DIV/0! Proforma-4(Contd)
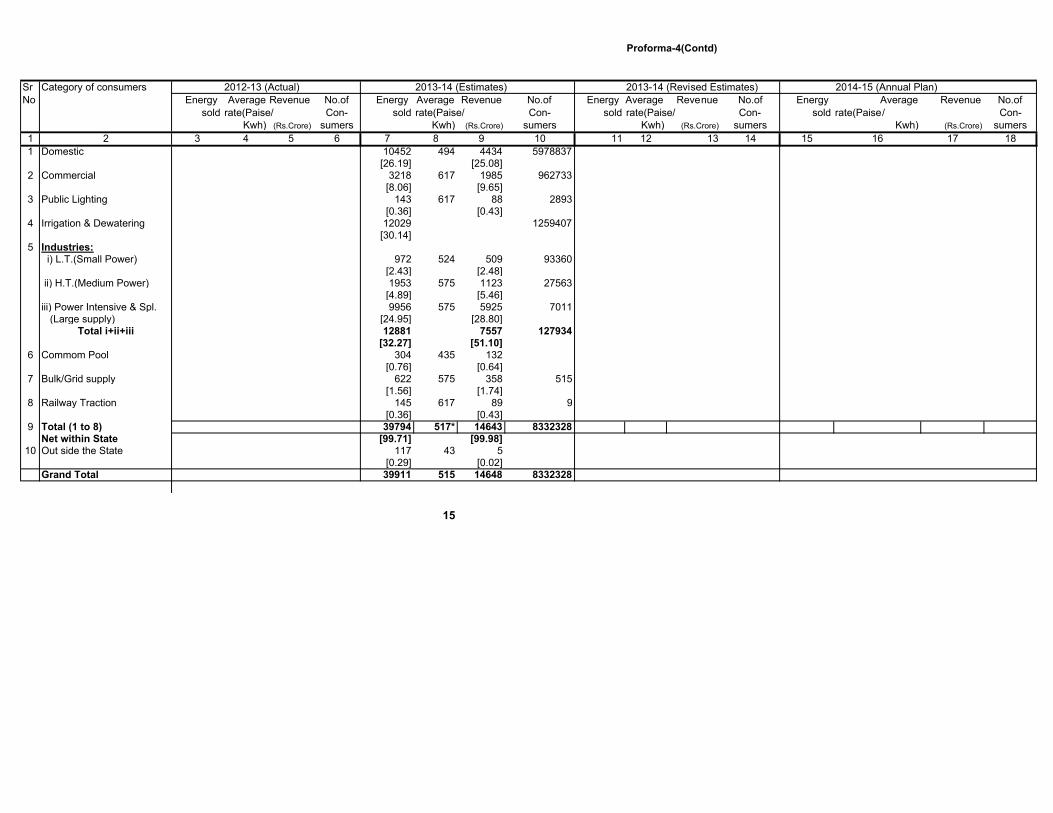
Sr Category of consumers 2012-13 (Actual) 2013-14 (Estimates) 2013-14 (Revised Estimates) 2014-15 (Annual Plan)
No Energy Average Revenue No.of Energy Average Revenue No.of Energy Average Revenue No.of Energy Average Revenue No.of
sold rate(Paise/ Con- sold rate(Paise/ Con- sold rate(Paise/ Con- sold rate(Paise/ Con-
Kwh) (Rs.Crore) sumers Kwh) (Rs.Crore) sumers Kwh) (Rs.Crore) sumers Kwh) (Rs.Crore) sumers
1 2 3 4 5 6 7 8 9 10 11 12 13 14 15 16 17 18
1 Domestic 10452 494 4434 5978837[26.19] [25.08]
2 Commercial 3218 617 1985 962733[8.06] [9.65]
3 Public Lighting 143 617 88 2893[0.36] [0.43]
4 Irrigation & Dewatering 12029 1259407[30.14]
5 Industries: i) L.T.(Small Power) 972 524 509 93360
[2.43] [2.48] ii) H.T.(Medium Power) 1953 575 1123 27563
[4.89] [5.46]iii) Power Intensive & Spl. 9956 575 5925 7011 (Large supply) [24.95] [28.80]
Total i+ii+iii 12881 7557 127934[32.27] [51.10]
6 Commom Pool 304 435 132[0.76] [0.64]
7 Bulk/Grid supply 622 575 358 515[1.56] [1.74]
8 Railway Traction 145 617 89 9[0.36] [0.43]
9 Total (1 to 8) 39794 517* 14643 8332328Net within State [99.71] [99.98]
10 Out side the State 117 43 5[0.29] [0.02]
Grand Total 39911 515 14648 8332328
15
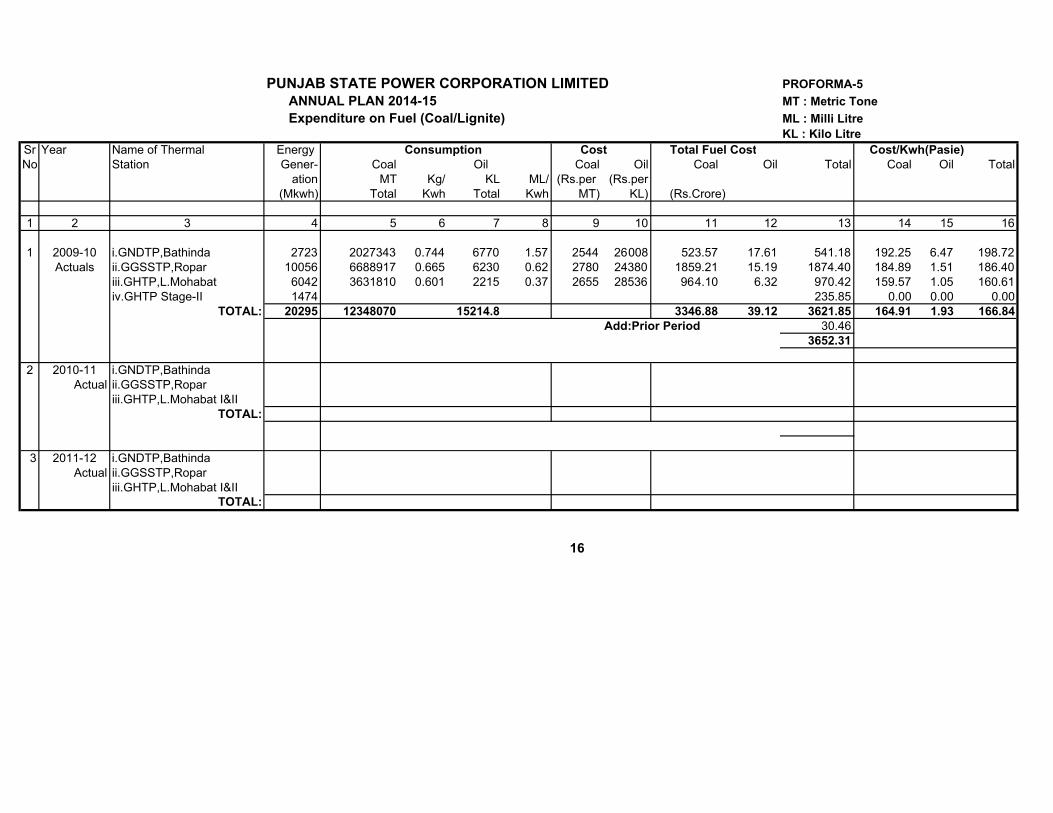
PUNJAB STATE POWER CORPORATION LIMITED PROFORMA-5
ANNUAL PLAN 2014-15 MT : Metric Tone
Expenditure on Fuel (Coal/Lignite) ML : Milli Litre
KL : Kilo Litre
Sr Year Name of Thermal Energy Consumption Cost Total Fuel Cost Cost/Kwh(Pasie)
No Station Gener- Coal Oil Coal Oil Coal Oil Total Coal Oil Total
ation MT Kg/ KL ML/ (Rs.per (Rs.per
(Mkwh) Total Kwh Total Kwh MT) KL) (Rs.Crore)
1 2 3 4 5 6 7 8 9 10 11 12 13 14 15 16
1 2009-10 i.GNDTP,Bathinda 2723 2027343 0.744 6770 1.57 2544 26008 523.57 17.61 541.18 192.25 6.47 198.72
Actuals ii.GGSSTP,Ropar 10056 6688917 0.665 6230 0.62 2780 24380 1859.21 15.19 1874.40 184.89 1.51 186.40
iii.GHTP,L.Mohabat 6042 3631810 0.601 2215 0.37 2655 28536 964.10 6.32 970.42 159.57 1.05 160.61
iv.GHTP Stage-II 1474 235.85 0.00 0.00 0.00
TOTAL: 20295 12348070 15214.8 3346.88 39.12 3621.85 164.91 1.93 166.84
Add:Prior Period 30.46
3652.31
2 2010-11 i.GNDTP,Bathinda
Actual ii.GGSSTP,Ropar
iii.GHTP,L.Mohabat I&II
TOTAL:
3 2011-12 i.GNDTP,Bathinda
Actual ii.GGSSTP,Ropar
iii.GHTP,L.Mohabat I&II
TOTAL:
16
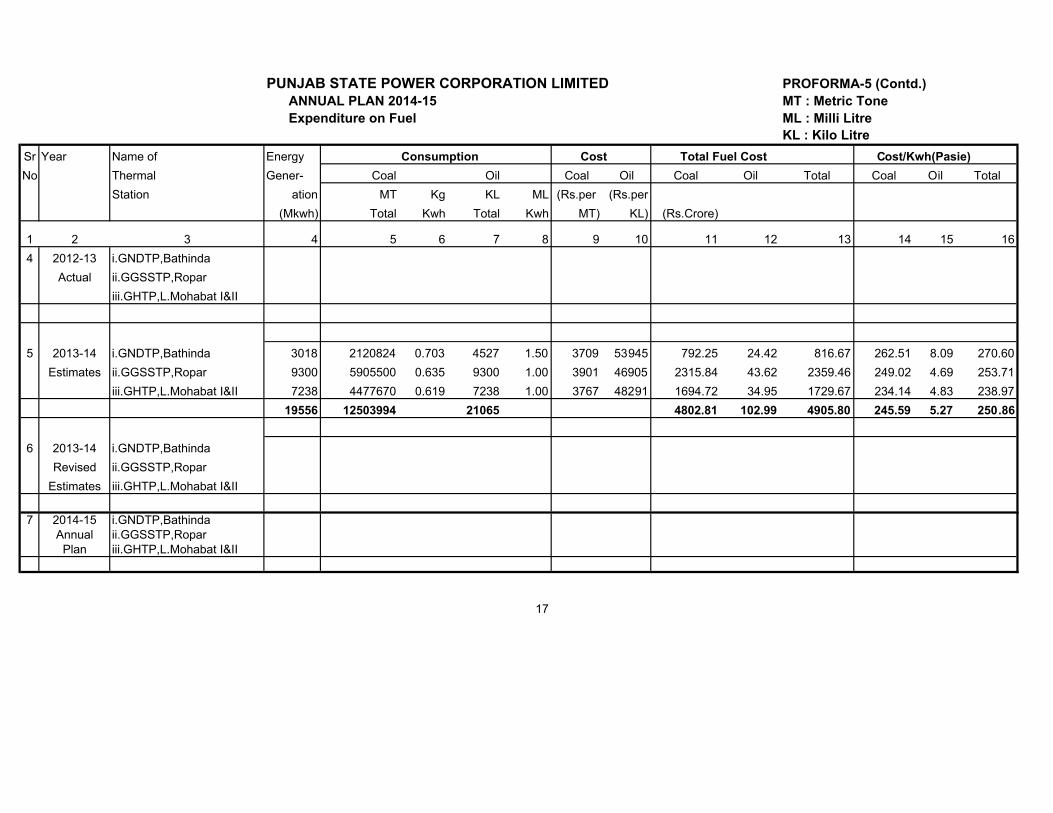
PUNJAB STATE POWER CORPORATION LIMITED PROFORMA-5 (Contd.)
ANNUAL PLAN 2014-15 MT : Metric Tone
Expenditure on Fuel ML : Milli Litre
KL : Kilo Litre
Sr Year Name of Energy Consumption Cost Total Fuel Cost Cost/Kwh(Pasie)
No Thermal Gener- Coal Oil Coal Oil Coal Oil Total Coal Oil Total
Station ation MT Kg KL ML (Rs.per (Rs.per
(Mkwh) Total Kwh Total Kwh MT) KL) (Rs.Crore)
1 2 3 4 5 6 7 8 9 10 11 12 13 14 15 16
4 2012-13 i.GNDTP,Bathinda
Actual ii.GGSSTP,Ropar
iii.GHTP,L.Mohabat I&II
5 2013-14 i.GNDTP,Bathinda 3018 2120824 0.703 4527 1.50 3709 53945 792.25 24.42 816.67 262.51 8.09 270.60
Estimates ii.GGSSTP,Ropar 9300 5905500 0.635 9300 1.00 3901 46905 2315.84 43.62 2359.46 249.02 4.69 253.71
iii.GHTP,L.Mohabat I&II 7238 4477670 0.619 7238 1.00 3767 48291 1694.72 34.95 1729.67 234.14 4.83 238.97
19556 12503994 21065 4802.81 102.99 4905.80 245.59 5.27 250.86
6 2013-14 i.GNDTP,Bathinda
Revised ii.GGSSTP,Ropar
Estimates iii.GHTP,L.Mohabat I&II
7 2014-15 i.GNDTP,Bathinda
Annual ii.GGSSTP,Ropar
Plan iii.GHTP,L.Mohabat I&II
17
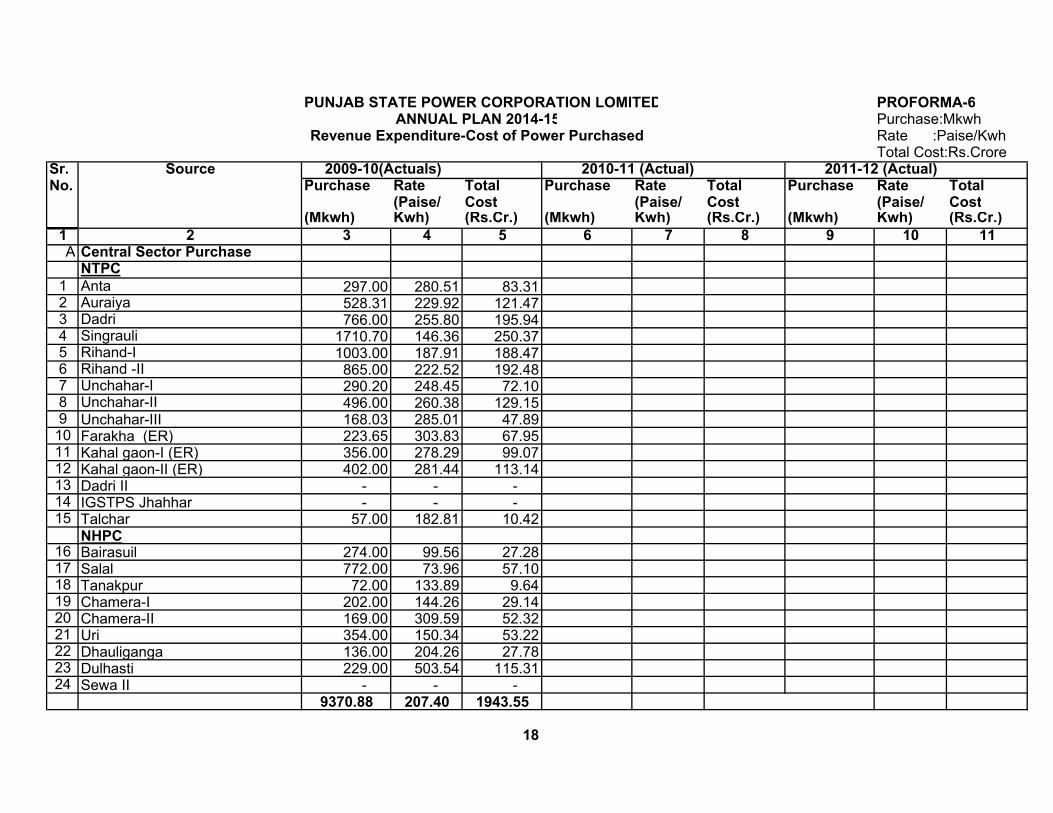
PUNJAB STATE POWER CORPORATION LOMITED PROFORMA-6Purchase:MkwhRate :Paise/KwhTotal Cost:Rs.Crore
Sr. Source 2009-10(Actuals) 2010-11 (Actual) 2011-12 (Actual)No. Purchase Rate Total Purchase Rate Total Purchase Rate Total
(Paise/ Cost (Paise/ Cost (Paise/ Cost(Mkwh) Kwh) (Rs.Cr.) (Mkwh) Kwh) (Rs.Cr.) (Mkwh) Kwh) (Rs.Cr.)
1 2 3 4 5 6 7 8 9 10 11A Central Sector Purchase
NTPC
1 Anta 297.00 280.51 83.312 Auraiya 528.31 229.92 121.473 Dadri 766.00 255.80 195.944 Singrauli 1710.70 146.36 250.375 Rihand-I 1003.00 187.91 188.476 Rihand -II 865.00 222.52 192.487 Unchahar-I 290.20 248.45 72.108 Unchahar-II 496.00 260.38 129.159 Unchahar-III 168.03 285.01 47.8910 Farakha (ER) 223.65 303.83 67.9511 Kahal gaon-I (ER) 356.00 278.29 99.0712 Kahal gaon-II (ER) 402.00 281.44 113.1413 Dadri II - - - 14 IGSTPS Jhahhar - - - 15 Talchar 57.00 182.81 10.42
NHPC16 Bairasuil 274.00 99.56 27.2817 Salal 772.00 73.96 57.1018 Tanakpur 72.00 133.89 9.6419 Chamera-I 202.00 144.26 29.1420 Chamera-II 169.00 309.59 52.3221 Uri 354.00 150.34 53.2222 Dhauliganga 136.00 204.26 27.7823 Dulhasti 229.00 503.54 115.3124 Sewa II - - -
9370.88 207.40 1943.55
18
ANNUAL PLAN 2014-15Revenue Expenditure-Cost of Power Purchased

PROFORMA-6 (Contd..)Sr. Source 2009-10(Actuals) 2010-11 (Actual) 2011-12 (Actual)No. Purchase Rate Total Purchase Rate Total Purchase Rate Total
(Paise/ Cost (Paise/ Cost (Paise/ Cost(Mkwh) Kwh) (Rs.Cr.) (Mkwh) Kwh) (Rs.Cr.) (Mkwh) Kwh) (Rs.Cr.)
1 2 3 4 5 6 7 8 9 10 11NPCIL
25 NAPP 84.76 210.60 17.8526 RAPP-3 & 4 446.00 300.99 134.2427 RAPP-5 & 6 29.00 302.07 8.76
Other Sources
28 NJPC 788.00 275.93 217.4329 Tehri 175.00 619.66 108.4430 Koteshwer HEP (THDC) - - -
Central Sector 10893.64 223.09 2430.27
31 PGCIL transmission charges - - 262.82Total Central Sector 10893.64 223.09 2693.09
B Long Term Traders1 Long term Co-gen plants 250.00 383.24 95.812 Long term thro. Traders 644.00 367.13 236.433 Tala - - - 4 Baglihar-I HEP - - - 5 Pragati-III Gas Plant Bawana - - - 6 Mundra UMPP - - - 7 NVVNL Bundled Power - - -
Total long term traders 894.00 371.63 332.24C Short Term Traders1 Traders/UI 1695.00 676.54 1146.742 Short term Co-gen plants within 86.00 394.07 33.89
Total Short term traders 1781.00 662.90 1180.63E Banking -257.00 -150.70 38.73F UI 1025.00 398.54 408.50G UI(open access) - - - H Open Access 502.00
Total 14838.63 313.59 4653.18Add prior period - - 64.87Total Purchase 14838.63 313.59 4718.05
19

PROFORMA-6
Sr. SourceNo. Purchase Rate Total Purchase Rate Total Purchase Rate Total Purchase Rate Total
(Paise/ Cost (Paise/ Cost (Paise/ Cost (Paise/ Cost(Mkwh) Kwh) (Rs.Cr.) (Mkwh) Kwh) (Rs.Cr.) (Mkwh) Kwh) (Rs.Cr.) (Mkwh) Kwh) (Rs.Cr.)
1 2 3 4 5 6 7 8 9 10 11 12 13 14A Central Sector Purchase
NTPC
1 Anta 148.84 589.36 87.722 Auraiya 225.99 573.92 129.703 Dadri 330.35 601.54 198.724 Singrauli 1637.75 181.57 297.375 Rihand-I 876.71 223.62 196.056 Rihand -II 802.95 236.75 190.107 Unchahar-I 146.01 449.19 65.588 Unchahar-II 251.70 456.90 115.009 Unchahar-III 84.70 522.61 44.2710 Farakha (ER) 78.68 471.60 37.1111 Kahal gaon-I (ER) 172.88 401.46 69.4012 Kahal gaon-II (ER) 294.44 522.16 153.7413 Dadri II 40.58 718.64 29.1614 IGSTPS Jhahhar 6.60 1736.80 11.4615 Rihand-III 294.35 405.19 119.2716 Barh-II 204.54 405.19 82.88
NHPC17 Bairasuil 303.37 185.92 56.4018 Salal 807.73 108.98 88.0319 Tanakpur 67.04 265.36 17.7920 Chamera-I 231.75 188.82 43.7621 Chamera-II 175.05 325.35 56.9522 Uri 381.64 186.57 71.2023 Dhauliganga 135.36 320.01 43.3224 Dulhasti 221.47 630.28 139.5925 Sewa II 29.92 678.88 20.31
TOTAL: 7950.38 297.45 2364.88
20
2014-15 (Annual Plan)2013-14 ( Revised Estimate)2013-14 (Estimate)2012-13 (Actual)
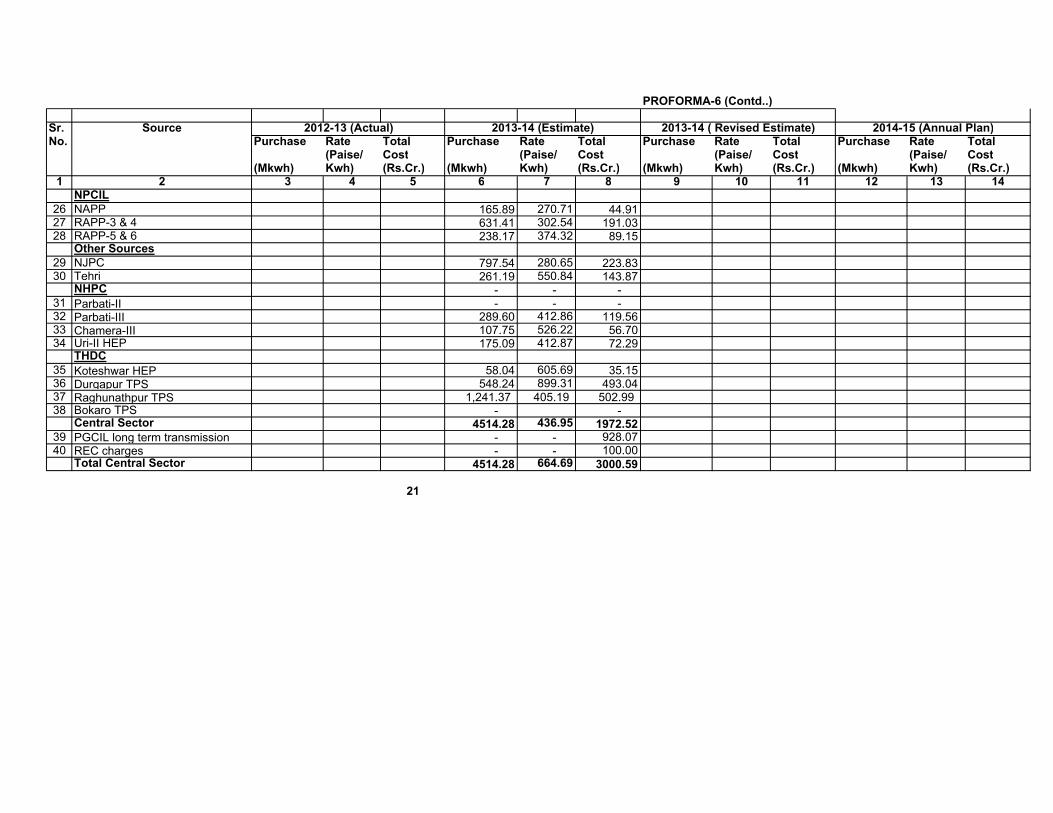
PROFORMA-6 (Contd..)
Sr. SourceNo. Purchase Rate Total Purchase Rate Total Purchase Rate Total Purchase Rate Total
(Paise/ Cost (Paise/ Cost (Paise/ Cost (Paise/ Cost(Mkwh) Kwh) (Rs.Cr.) (Mkwh) Kwh) (Rs.Cr.) (Mkwh) Kwh) (Rs.Cr.) (Mkwh) Kwh) (Rs.Cr.)
1 2 3 4 5 6 7 8 9 10 11 12 13 14NPCIL
26 NAPP 165.89 270.71 44.9127 RAPP-3 & 4 631.41 302.54 191.0328 RAPP-5 & 6 238.17 374.32 89.15
Other Sources
29 NJPC 797.54 280.65 223.8330 Tehri 261.19 550.84 143.87
NHPC - - - 31 Parbati-II - - - 32 Parbati-III 289.60 412.86 119.5633 Chamera-III 107.75 526.22 56.7034 Uri-II HEP 175.09 412.87 72.29
THDC
35 Koteshwar HEP 58.04 605.69 35.1536 Durgapur TPS 548.24 899.31 493.0437 Raghunathpur TPS 1,241.37 405.19 502.99 38 Bokaro TPS - -
Central Sector 4514.28 436.95 1972.5239 PGCIL long term transmission - - 928.0740 REC charges - - 100.00
Total Central Sector 4514.28 664.69 3000.59
21
2014-15 (Annual Plan)2013-14 ( Revised Estimate)2013-14 (Estimate)2012-13 (Actual)
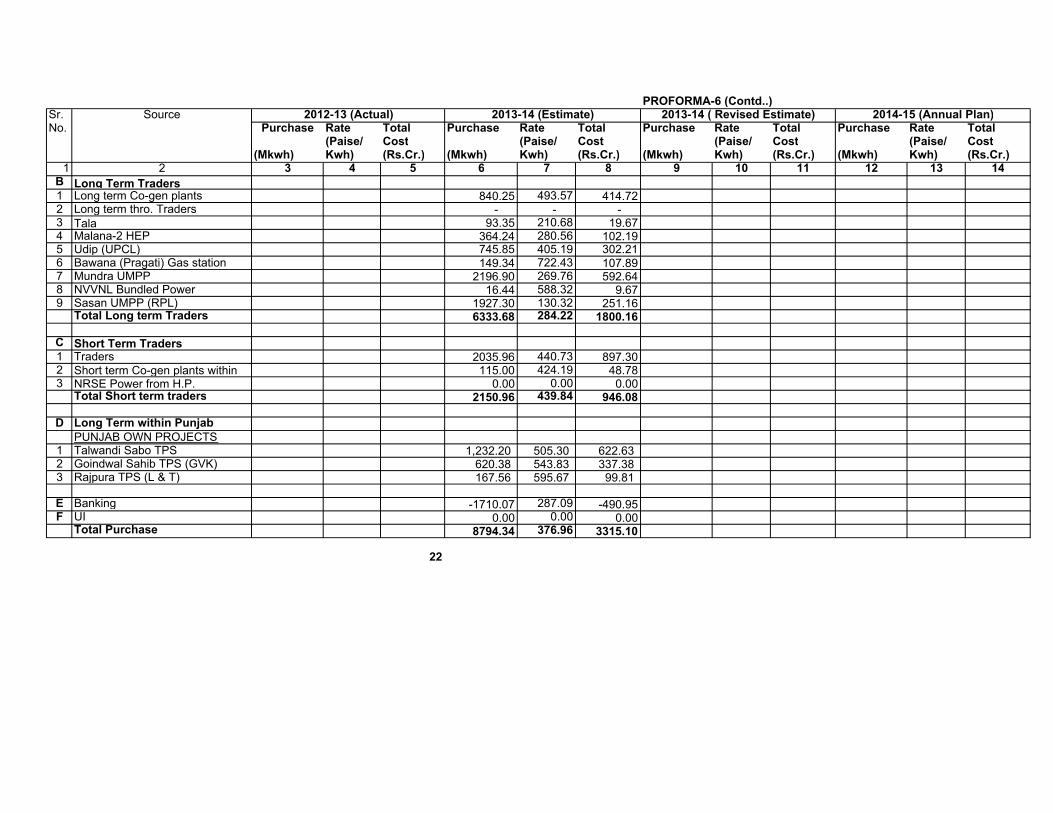
PROFORMA-6 (Contd..)Sr. SourceNo. Purchase Rate Total Purchase Rate Total Purchase Rate Total Purchase Rate Total
(Paise/ Cost (Paise/ Cost (Paise/ Cost (Paise/ Cost(Mkwh) Kwh) (Rs.Cr.) (Mkwh) Kwh) (Rs.Cr.) (Mkwh) Kwh) (Rs.Cr.) (Mkwh) Kwh) (Rs.Cr.)
1 2 3 4 5 6 7 8 9 10 11 12 13 14B Long Term Traders1 Long term Co-gen plants 840.25 493.57 414.722 Long term thro. Traders - - - 3 Tala 93.35 210.68 19.674 Malana-2 HEP 364.24 280.56 102.195 Udip (UPCL) 745.85 405.19 302.216 Bawana (Pragati) Gas station 149.34 722.43 107.897 Mundra UMPP 2196.90 269.76 592.648 NVVNL Bundled Power 16.44 588.32 9.679 Sasan UMPP (RPL) 1927.30 130.32 251.16
Total Long term Traders 6333.68 284.22 1800.16
C Short Term Traders1 Traders 2035.96 440.73 897.302 Short term Co-gen plants within 115.00 424.19 48.783 NRSE Power from H.P. 0.00 0.00 0.00
Total Short term traders 2150.96 439.84 946.08
D Long Term within Punjab
PUNJAB OWN PROJECTS1 Talwandi Sabo TPS 1,232.20 505.30 622.63 2 Goindwal Sahib TPS (GVK) 620.38 543.83 337.38 3 Rajpura TPS (L & T) 167.56 595.67 99.81
E Banking -1710.07 287.09 -490.95F UI 0.00 0.00 0.00
Total Purchase 8794.34 376.96 3315.10
22
2014-15 (Annual Plan)2013-14 ( Revised Estimate)2013-14 (Estimate)2012-13 (Actual)
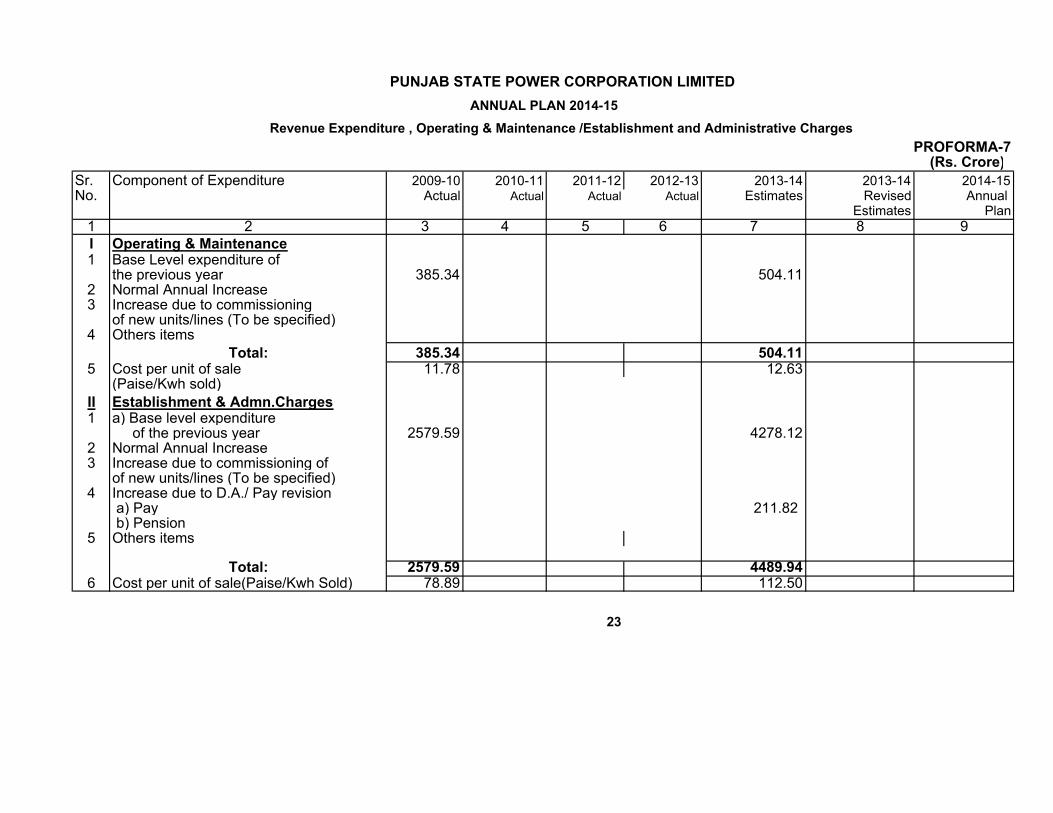
PROFORMA-7 (Rs. Crore)
Sr. Component of Expenditure 2009-10 2010-11 2011-12 2012-13 2013-14 2013-14 2014-15No. Actual Actual Actual Actual Estimates Revised Annual
Estimates Plan
1 2 3 4 5 6 7 8 9
I Operating & Maintenance1 Base Level expenditure of
the previous year 385.34 504.112 Normal Annual Increase3 Increase due to commissioning
of new units/lines (To be specified)4 Others items
Total: 385.34 504.115 Cost per unit of sale 11.78 12.63
(Paise/Kwh sold)
II Establishment & Admn.Charges1 a) Base level expenditure
of the previous year 2579.59 4278.122 Normal Annual Increase3 Increase due to commissioning of
of new units/lines (To be specified)4 Increase due to D.A./ Pay revision
a) Pay 211.82 b) Pension
5 Others items
Total: 2579.59 4489.946 Cost per unit of sale(Paise/Kwh Sold) 78.89 112.50
23
ANNUAL PLAN 2014-15
Revenue Expenditure , Operating & Maintenance /Establishment and Administrative Charges
PUNJAB STATE POWER CORPORATION LIMITED
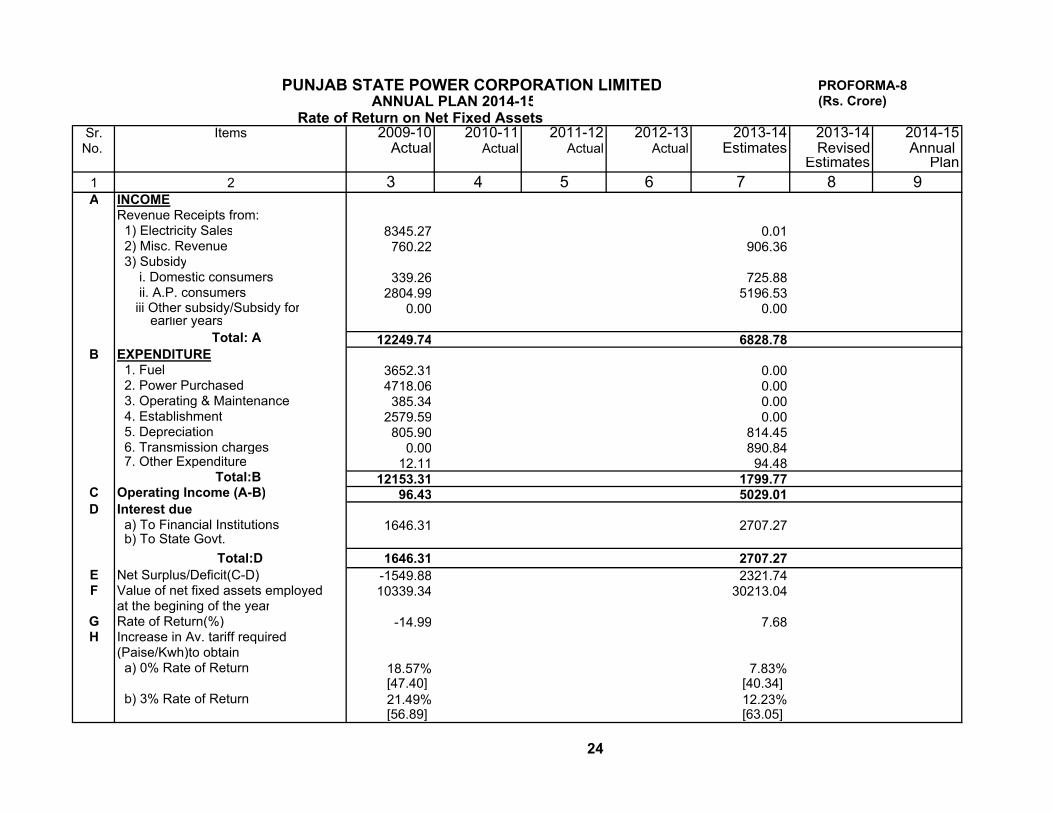
PUNJAB STATE POWER CORPORATION LIMITED PROFORMA-8 (Rs. Crore)
Rate of Return on Net Fixed AssetsSr. Items 2009-10 2010-11 2011-12 2012-13 2013-14 2013-14 2014-15No. Actual Actual Actual Actual Estimates Revised Annual
Estimates Plan
1 2 3 4 5 6 7 8 9A INCOME
Revenue Receipts from: 1) Electricity Sales 8345.27 0.01 2) Misc. Revenue 760.22 906.36 3) Subsidy i. Domestic consumers 339.26 725.88 ii. A.P. consumers 2804.99 5196.53 iii Other subsidy/Subsidy for 0.00 0.00 earlier years
Total: A 12249.74 6828.78B EXPENDITURE
1. Fuel 3652.31 0.00 2. Power Purchased 4718.06 0.00 3. Operating & Maintenance 385.34 0.00 4. Establishment 2579.59 0.00 5. Depreciation 805.90 814.45 6. Transmission charges 0.00 890.84 7. Other Expenditure 12.11 94.48
Total:B 12153.31 1799.77C Operating Income (A-B) 96.43 5029.01D Interest due
a) To Financial Institutions 1646.31 2707.27 b) To State Govt.
Total:D 1646.31 2707.27
E Net Surplus/Deficit(C-D) -1549.88 2321.74F Value of net fixed assets employed 10339.34 30213.04
at the begining of the yearG Rate of Return(%) -14.99 7.68H Increase in Av. tariff required
(Paise/Kwh)to obtain a) 0% Rate of Return 18.57% 7.83%
[47.40] [40.34] b) 3% Rate of Return 21.49% 12.23%
[56.89] [63.05]
24
ANNUAL PLAN 2014-15

PROFORMA -9
(Rs. Crore)
Sr. Name of the Undertakings Dues Upto Dues from
No. 31.3.2013 1.4.2013
to 30.11.2013
1 2 3 4
1 Central Undertakings
2 Banks
3 PFC
4 Others
Total
25
PUNJAB STATE POWER CORPORATION LIMITED
ANNUAL PLAN 2014-15
Outstanding dues to the Central Undertakings & others (Including Banks)
Outstanding dues as on 30.11.2013
5
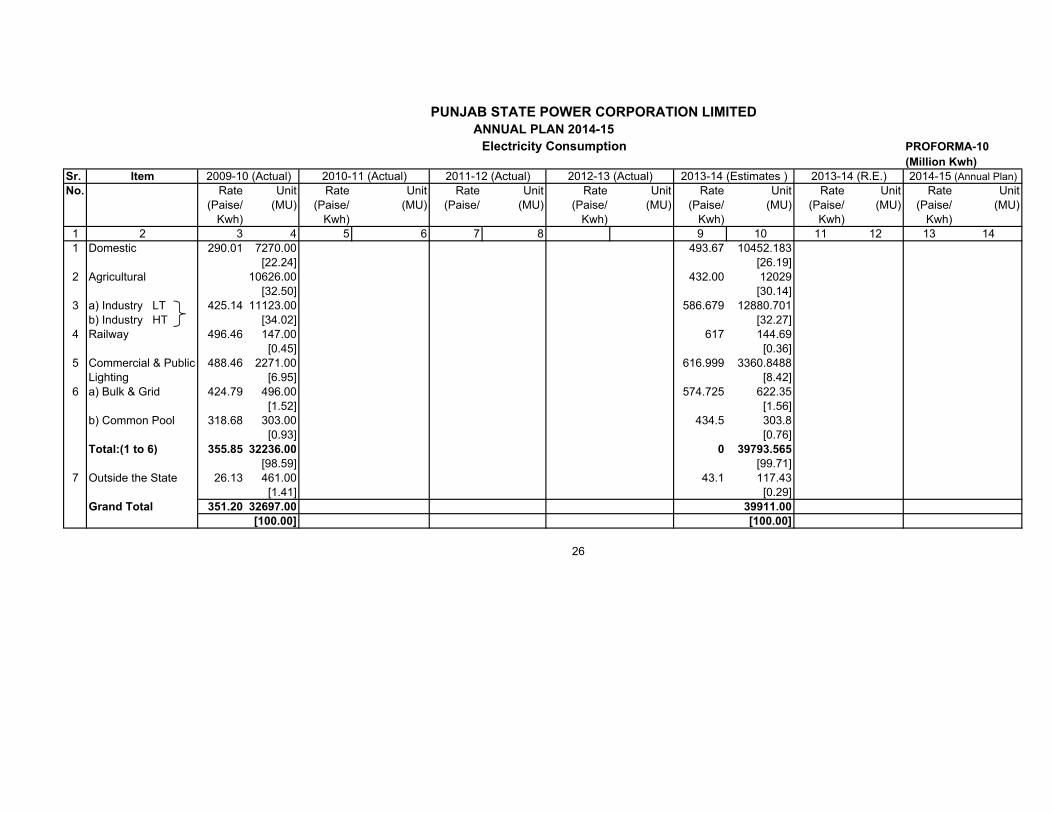
PROFORMA-10
(Million Kwh)
Sr. Item
No. Rate Unit Rate Unit Rate Unit Rate Unit Rate Unit Rate Unit Rate Unit
(Paise/ (MU) (Paise/ (MU) (Paise/ (MU) (Paise/ (MU) (Paise/ (MU) (Paise/ (MU) (Paise/ (MU)
Kwh) Kwh) Kwh) Kwh) Kwh) Kwh)
1 2 3 4 5 6 7 8 9 10 11 12 13 14
1 Domestic 290.01 7270.00 493.67 10452.183
[22.24] [26.19]
2 Agricultural 10626.00 432.00 12029
[32.50] [30.14]
3 a) Industry LT 425.14 11123.00 586.679 12880.701
b) Industry HT [34.02] [32.27]
4 Railway 496.46 147.00 617 144.69
[0.45] [0.36]
5 Commercial & Public 488.46 2271.00 616.999 3360.8488
Lighting [6.95] [8.42]
6 a) Bulk & Grid 424.79 496.00 574.725 622.35
[1.52] [1.56]
b) Common Pool 318.68 303.00 434.5 303.8
[0.93] [0.76]
Total:(1 to 6) 355.85 32236.00 0 39793.565
[98.59] [99.71]
7 Outside the State 26.13 461.00 43.1 117.43
[1.41] [0.29]
Grand Total 351.20 32697.00 39911.00
[100.00] [100.00]
26
PUNJAB STATE POWER CORPORATION LIMITED
ANNUAL PLAN 2014-15
Electricity Consumption
2009-10 (Actual) 2010-11 (Actual) 2011-12 (Actual) 2013-14 (Estimates ) 2013-14 (R.E.) 2014-15 (Annual Plan)2012-13 (Actual)
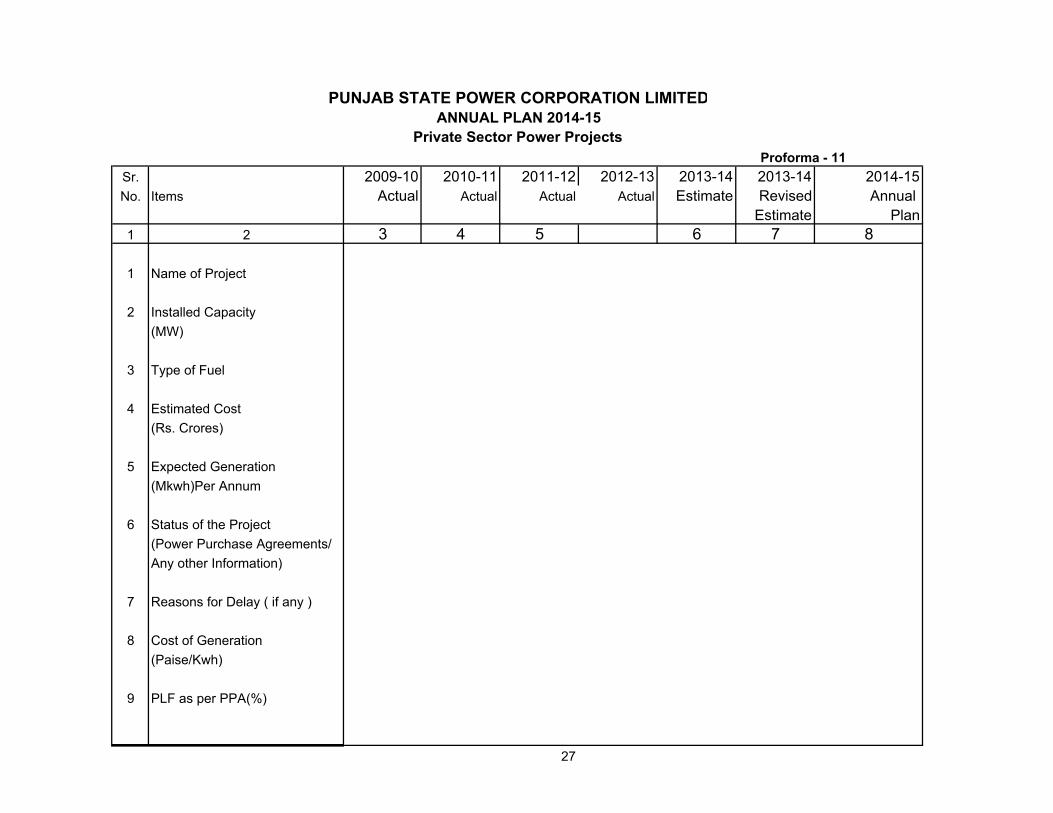
Proforma - 11
Sr. 2009-10 2010-11 2011-12 2012-13 2013-14 2013-14 2014-15
No. Items Actual Actual Actual Actual Estimate Revised Annual
Estimate Plan
1 2 3 4 5 6 7 8
1 Name of Project
2 Installed Capacity
(MW)
3 Type of Fuel
4 Estimated Cost
(Rs. Crores)
5 Expected Generation
(Mkwh)Per Annum
6 Status of the Project
(Power Purchase Agreements/
Any other Information)
7 Reasons for Delay ( if any )
8 Cost of Generation
(Paise/Kwh)
9 PLF as per PPA(%)
27
PUNJAB STATE POWER CORPORATION LIMITED
ANNUAL PLAN 2014-15
Private Sector Power Projects
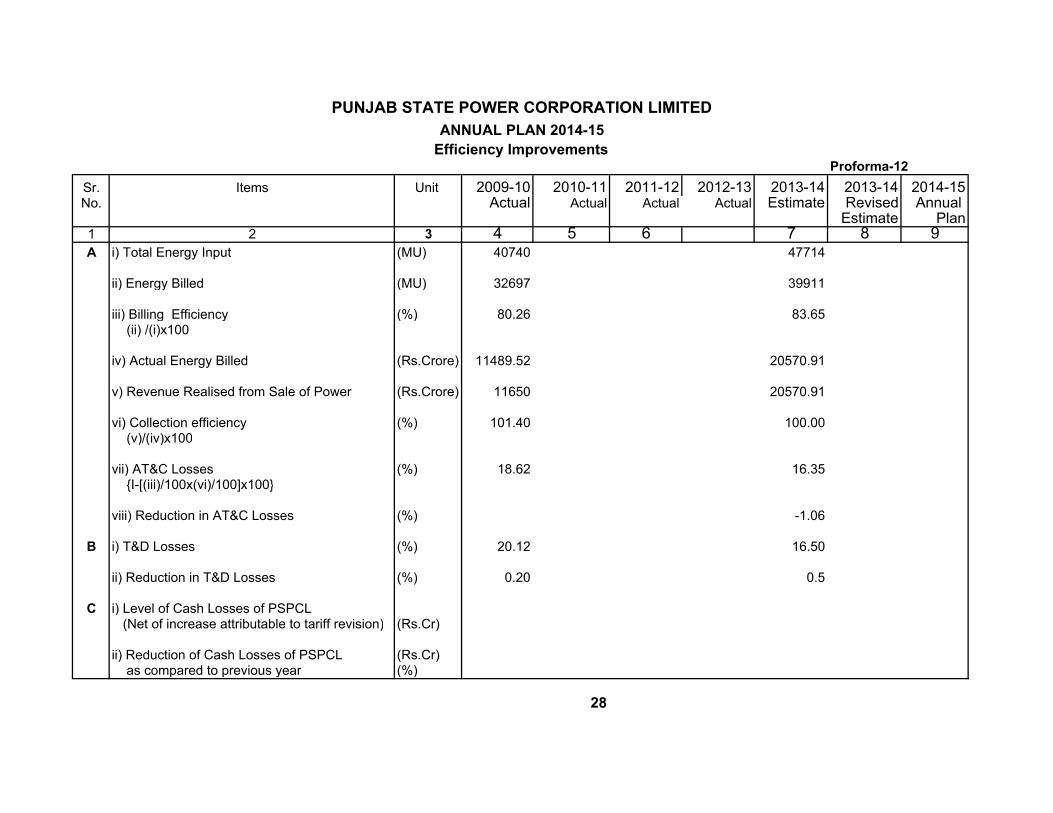
Proforma-12
Sr. Items Unit 2009-10 2010-11 2011-12 2012-13 2013-14 2013-14 2014-15No. Actual Actual Actual Actual Estimate Revised Annual
Estimate Plan1 2 3 4 5 6 7 8 9A i) Total Energy Input (MU) 40740 47714
ii) Energy Billed (MU) 32697 39911
iii) Billing Efficiency (%) 80.26 83.65 (ii) /(i)x100
iv) Actual Energy Billed (Rs.Crore) 11489.52 20570.91
v) Revenue Realised from Sale of Power (Rs.Crore) 11650 20570.91
vi) Collection efficiency (%) 101.40 100.00 (v)/(iv)x100
vii) AT&C Losses (%) 18.62 16.35 {I-[(iii)/100x(vi)/100]x100}
viii) Reduction in AT&C Losses (%) -1.06
B i) T&D Losses (%) 20.12 16.50
ii) Reduction in T&D Losses (%) 0.20 0.5
C i) Level of Cash Losses of PSPCL (Net of increase attributable to tariff revision) (Rs.Cr)
ii) Reduction of Cash Losses of PSPCL (Rs.Cr) as compared to previous year (%)
28
Efficiency Improvements
ANNUAL PLAN 2014-15
PUNJAB STATE POWER CORPORATION LIMITED
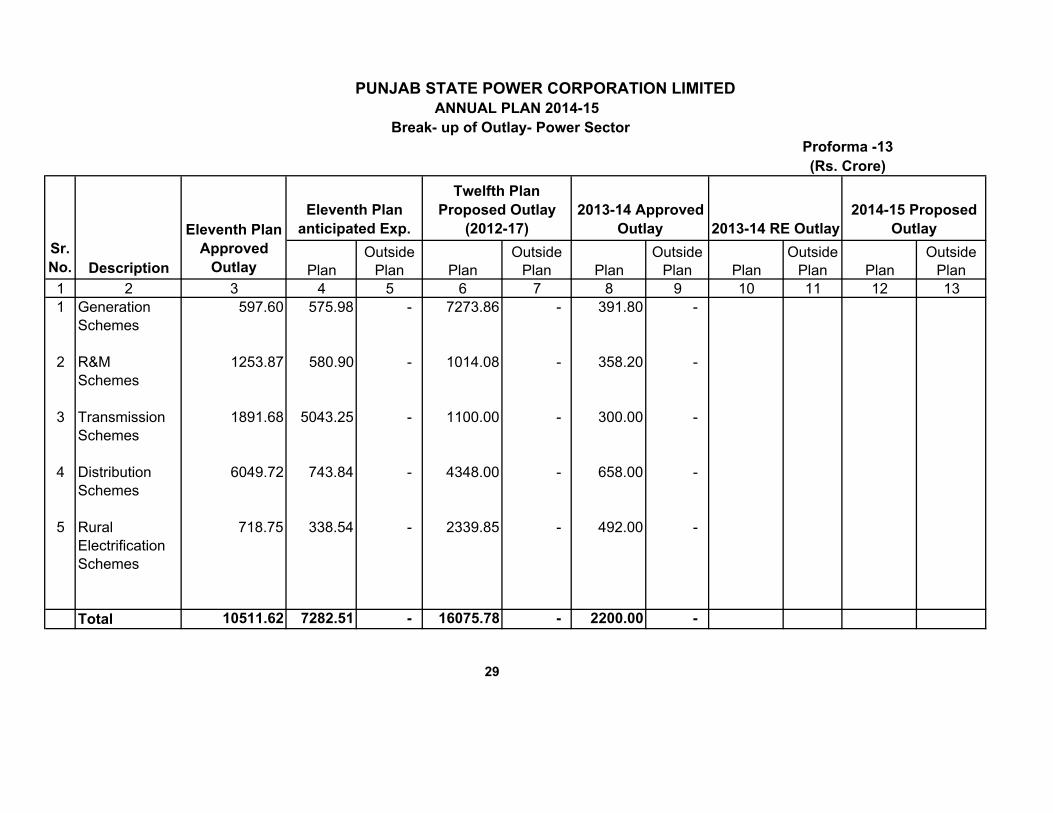
1 2 3 4 5 6 7 8 9 10 11 12 13
1 Generation 597.60 575.98 - 7273.86 - 391.80 -
Schemes
2 R&M 1253.87 580.90 - 1014.08 - 358.20 -
Schemes
3 Transmission 1891.68 5043.25 - 1100.00 - 300.00 -
Schemes
4 Distribution 6049.72 743.84 - 4348.00 - 658.00 -
Schemes
5 Rural 718.75 338.54 - 2339.85 - 492.00 -
Electrification
Schemes
Total 10511.62 7282.51 - 16075.78 - 2200.00 -
29
ANNUAL PLAN 2014-15
Break- up of Outlay- Power Sector
Eleventh Plan
Approved
Outlay
Eleventh Plan
anticipated Exp.
Plan
Outside
Plan
Twelfth Plan
Proposed Outlay
(2012-17)
Plan
Outside
Plan
2013-14 Approved
Outlay
Plan
Outside
PlanDescription
PUNJAB STATE POWER CORPORATION LIMITED
2013-14 RE Outlay
Plan
Outside
Plan
2014-15 Proposed
Outlay
Plan
Outside
Plan
Proforma -13
(Rs. Crore)
Sr.
No.