Embed Size (px)
Citation preview

ANALYSIS OF THE HEALTH SYSTEM IN SLOVENIA
Purchasing andPayment ReviewFinal Report
Purchasing and payment review
Final report29 October 2015
The European Observatory on Health Systems and Policies supports and promotes evidence-based health policy-making through comprehensive and rigorous analysis of health systems in Europe. It brings together a wide range of policy-makers, academics and practitioners to analyse trends in health reform, drawing on experience from across Europe to illuminate policy issues.
The Observatory is a partnership hosted by the WHO Regional Office for Europe, which includes the governments of Austria, Belgium, Finland, Ireland, Norway, Slovenia, Sweden, Switzerland, the United Kingdom and the Veneto Region of Italy; the European Commission; the World Bank; UNCAM (French National Union of Health Insurance Funds); the London School of Economics and Political Science; and the London School of Hygiene & Tropical Medicine. The Observatory has a secretariat in Brussels and it has hubs in London (at LSE and LSHTM) and at the Technical University of Berlin.

Purchasing and payment review
Written by:Wilm Quentin, European Observatory on Health Systems and Policies
Dimitra Panteli, European Observatory on Health Systems and Policies
Anna Maresso, European Observatory on Health Systems and Policies
Ewout van Ginneken, European Observatory on Health Systems and Policies
With the assistance of:
Andrej Robida, Mircha Poldrugovac, Suzana Jarc, Boris Kramberger, Jakob Ceglar, Bojan Popovič, Tatja Kostnapfel, Tanja Mate, Danica Rotar Pavlič, and Andreja Čufar
© World Health Organization 2016 (acting as the host organization for, and secretariat of, the European Observatory on Health Systems and Policies)
All rights reserved. The European Observatory on Health Systems and Policies welcomes requests for permission to reproduce or translate its publications, in part or in full.
The designations employed and the presentation of the material in this publication do not imply the expression of any opinion whatsoever on the part of the European Observatory on Health Systems and Policies concerning the legal status of any country, territory, city or area or of its authorities, or concerning the delimitation of its frontiers or boundaries.
The mention of specific companies or of certain manufacturers’ products does not imply that they are endorsed or recommended by the European Observatory on Health Systems and Policies in preference to others of a similar nature that are not mentioned. Errors and omissions excepted, the names of proprietary products are distinguished by initial capital letters.
All reasonable precautions have been taken by the European Observatory on Health Systems and Policies to verify the information contained in this publication. However, the published material is being distributed without warranty of any kind, either express or implied. The responsibility for the interpretation and use of the material lies with the reader. In no event shall the European Observatory on Health Systems and Policies be liable for damages arising from its use. The views expressed by authors, editors, or expert groups do not necessarily represent the decisions or the stated policy of the European Observatory on Health Systems and Policies or any of its partners
Please address requests about the publication to:
Publications, WHO Regional Office for Europe, UN City, Marmorvej 51, DK-2100 Copenhagen Ø,Denmark.
Alternatively, complete an online request form for documentation, health information, or for permission to quote or translate, on the Regional Office web site (http://www.euro.who.int/en/what-we-publish/publication-request-forms).

Slovenia Purchasing and payment review iii
ContentsList of tables, figures, boxes and annexes . . . . iv
List of abbreviations. . . . . . . . . . . . . . . . . v
1 Introduction: strategic purchasing of health services in Slovenia . . . . . . . . . . . . . . . . . 1
2 Coverage: benefit basket and HTA . . . . . . . 1Introduction . . . . . . . . . . . . . . . . . . . . . . . 1The situation in Slovenia . . . . . . . . . . . . . . . . 2International experience. . . . . . . . . . . . . . . . . 4Conclusions . . . . . . . . . . . . . . . . . . . . . . . . 7References . . . . . . . . . . . . . . . . . . . . . . . . . 8Annex . . . . . . . . . . . . . . . . . . . . . . . . . . . 9
3 The purchasing process. . . . . . . . . . . . . . 19Introduction . . . . . . . . . . . . . . . . . . . . . . .19The situation in Slovenia . . . . . . . . . . . . . . . .19Main problems and challenges . . . . . . . . . . . . .21International experience. . . . . . . . . . . . . . . . 22Conclusion . . . . . . . . . . . . . . . . . . . . . . . 28References . . . . . . . . . . . . . . . . . . . . . . . . 29
4 Payment for health care services and physicians . . . . . . . . . . . . . . . . . . . . . . .30Introduction . . . . . . . . . . . . . . . . . . . . . . 30Payment for acute inpatient care . . . . . . . . . . . 30 Current payment system . . . . . . . . . . . . . . . 30 Main problems . . . . . . . . . . . . . . . . . . . . .31 International experiences . . . . . . . . . . . . . . .31Payment for outpatient (specialized ambulatory) services . . . . . . . . . . . . . . . . . . . . . . . . . .33 Current payment system . . . . . . . . . . . . . . . .33 Main problems . . . . . . . . . . . . . . . . . . . . 35 International experiences . . . . . . . . . . . . . . 35Payment for primary care . . . . . . . . . . . . . . . 36 Current payment system . . . . . . . . . . . . . . . 36 Main problems . . . . . . . . . . . . . . . . . . . . 38 International experiences . . . . . . . . . . . . . . 38Payment of physicians . . . . . . . . . . . . . . . . . 39 Current payment system . . . . . . . . . . . . . . . 40 Main problems . . . . . . . . . . . . . . . . . . . . 41 International experiences . . . . . . . . . . . . . . 42Conclusions . . . . . . . . . . . . . . . . . . . . . . . 46References . . . . . . . . . . . . . . . . . . . . . . . . 47Annex . . . . . . . . . . . . . . . . . . . . . . . . . . 48
5 The potential for introducing pay-for-performance schemes . . . . . . . . . . . . . . . .49Introduction . . . . . . . . . . . . . . . . . . . . . . 49Quality management framework in Slovenia . . . . 49Data availability and performance indicators . . . 50
International examples of P4P schemes . . . . . . . .53Checklist for P4P design. . . . . . . . . . . . . . . . 57Conclusions . . . . . . . . . . . . . . . . . . . . . . . 59References . . . . . . . . . . . . . . . . . . . . . . . . .61Annex . . . . . . . . . . . . . . . . . . . . . . . . . . 62
Slovenia Purchasing and payment review iv
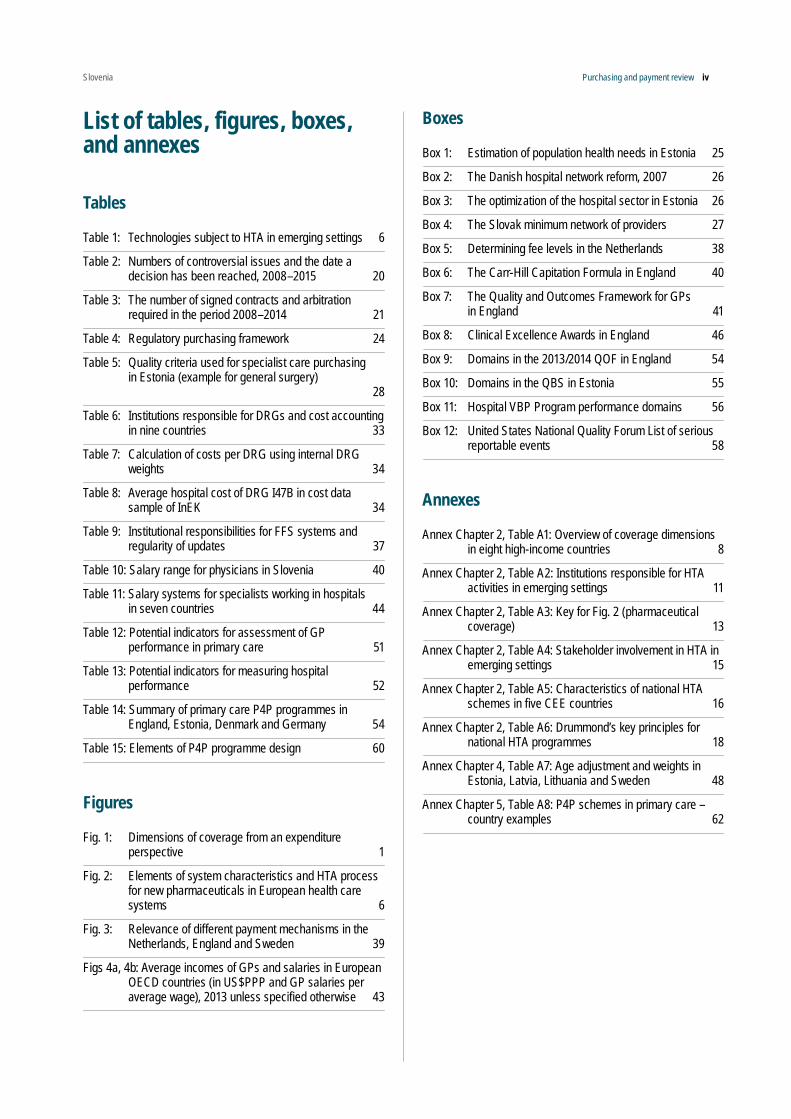
List of tables, figures, boxes, and annexes
Tables
Table 1: Technologies subject to HTA in emerging settings 6
Table 2: Numbers of controversial issues and the date a decision has been reached, 2008–2015 20
Table 3: The number of signed contracts and arbitration required in the period 2008–2014 21
Table 4: Regulatory purchasing framework 24
Table 5: Quality criteria used for specialist care purchasing in Estonia (example for general surgery) 28
Table 6: Institutions responsible for DRGs and cost accounting in nine countries 33
Table 7: Calculation of costs per DRG using internal DRG weights 34
Table 8: Average hospital cost of DRG I47B in cost data sample of InEK 34
Table 9: Institutional responsibilities for FFS systems and regularity of updates 37
Table 10: Salary range for physicians in Slovenia 40
Table 11: Salary systems for specialists working in hospitals in seven countries 44
Table 12: Potential indicators for assessment of GP performance in primary care 51
Table 13: Potential indicators for measuring hospital performance 52
Table 14: Summary of primary care P4P programmes in England, Estonia, Denmark and Germany 54
Table 15: Elements of P4P programme design 60
Figures
Fig. 1: Dimensions of coverage from an expenditure perspective 1
Fig. 2: Elements of system characteristics and HTA process for new pharmaceuticals in European health care systems 6
Fig. 3: Relevance of different payment mechanisms in the Netherlands, England and Sweden 39
Figs 4a, 4b: Average incomes of GPs and salaries in European OECD countries (in US$PPP and GP salaries per average wage), 2013 unless specified otherwise 43
Boxes
Box 1: Estimation of population health needs in Estonia 25
Box 2: The Danish hospital network reform, 2007 26
Box 3: The optimization of the hospital sector in Estonia 26
Box 4: The Slovak minimum network of providers 27
Box 5: Determining fee levels in the Netherlands 38
Box 6: The Carr-Hill Capitation Formula in England 40
Box 7: The Quality and Outcomes Framework for GPs in England 41
Box 8: Clinical Excellence Awards in England 46
Box 9: Domains in the 2013/2014 QOF in England 54
Box 10: Domains in the QBS in Estonia 55
Box 11: Hospital VBP Program performance domains 56
Box 12: United States National Quality Forum List of serious reportable events 58
Annexes
Annex Chapter 2, Table A1: Overview of coverage dimensions in eight high-income countries 8
Annex Chapter 2, Table A2: Institutions responsible for HTA activities in emerging settings 11
Annex Chapter 2, Table A3: Key for Fig. 2 (pharmaceutical coverage) 13
Annex Chapter 2, Table A4: Stakeholder involvement in HTA in emerging settings 15
Annex Chapter 2, Table A5: Characteristics of national HTA schemes in five CEE countries 16
Annex Chapter 2, Table A6: Drummond’s key principles for national HTA programmes 18
Annex Chapter 4, Table A7: Age adjustment and weights in Estonia, Latvia, Lithuania and Sweden 48
Annex Chapter 5, Table A8: P4P schemes in primary care – country examples 62

Slovenia Purchasing and payment review v
List of abbreviationsALOS Average length of stay
CEE Central and Eastern Europe
CMS Centers for Medicare & Medicaid Services
COPD Chronic obstructive pulmonary disease
DDRB Review Body on Doctors’ and Dentists’ Remuneration
DRG Diagnosis-related group
EHIF Estonian Health Insurance Fund
EU European Union
FFS Fee-for-service
FTE Full-time equivalent
GA General Agreement
GP General practitioner
HAC Hospital-acquired condition
HIIS Health Insurance Institute of Slovenia
HNDP Hospital Network Development Plan
HRRP Hospital Readmissions Reduction Program
HTA Health technology assessment
InEK Institute for the Hospital Reimbursement System
IPPS Inpatient Prospective Payment System
MBS Medicare Benefit Schedule
NHIS National Health Insurance Fund
NHS National Health Service
NICE National Institute for Health and Care Excellence
NIPH National Institute of Public Health
OECD Organisation for Economic Co-operation and Development
QALY Quality-adjusted life-year
QBS Quality Bonus System
QMAS Quality Management Analysis System
QOF Quality and Outcomes Framework
P4P Pay-for-performance
VBP Value-based purchasing

Slovenia Purchasing and payment review 1
1 Introduction: strategic purchasing of health services in SloveniaAll health systems exercise some form of purchasing of health services. In its most basic form it is the allocation of funds from payers to providers but if aligned to societal health care needs and wishes, it has the potential to play a key role in determining a health system’s overall performance in terms of quality and cost.
Purchasing is more than contracting of providers. Indeed, if policy-makers are to achieve their desired results, they need to take a broad systems approach to purchasing and act upon all the various components of the purchasing function. If purchasing only focuses on individual elements such as contracts, payment systems or provider competition, it will not reach its full potential (Busse et al., 2007). For example, the introduction of a new diagnosis-related group (DRG) system to improve efficiency will succeed only if the government has the governance capacity to develop and maintain such a system; if providers have the managerial ability to respond to the new financial incentives; and if the health interventions financed through the new system are informed by cost-effectiveness evidence and respond to the health needs of the population.
A purchasing strategy should therefore ref lect a comprehensive and strategic approach. Strategic purchasing aims to increase health system performance through the effective allocation of financial resources to providers. This involves several elements that will be discussed in this review of the Slovenian health care purchasing system:
• Which interventions should be purchased taking into account evidence on cost–effectiveness, for example through the use of health technology assessment (HTA)?
• How should these be purchased using which contractual mechanisms and from which providers so that they respond to population needs and national health priorities?
• What payment systems should be used to optimize the performance of the current system?
The following chapters address each element by: (i) describing the current situation in Slovenia; (ii) identifying problems or issues that impact negatively on optimal functioning; (iii) presenting international evidence on how other countries address these functions; and (iv) offering options for solutions. A final section looks at the preconditions necessary for introducing pay-for-performance (P4P) schemes to reward providers for their quality and/or extra efforts.
2 Coverage: benefit basket and HTA
Introduction
Coverage in a statutory system encompasses three distinct dimensions: (a) breadth, depicting the extent to which the population is covered; (b) depth, describing the type and number of services covered; and (c) height, accounting for the extent to which included services are covered and not subject to cost-sharing.1 As is evident in Fig. 1, coverage may take different shapes. For example, universal systems in terms of population coverage can include a limited amount of services that are fully covered or have a comprehensive services package but with more cost-sharing per service.
Fig. 1Dimensions of coverage from an expenditure perspective
Public expenditure
on health
Cost sharing
Breadth: who is insured?
Depth:Which benefitsare covered?
Uninsured
Other services
Total health expenditureHeight: whatproportionof thecosts iscovered?
Source: adapted from Rechel, Thomson and Van Ginneken (2010)
The totality of health services and goods (explicit or implicit catalogues/ lists/ service groups) covered under public schemes constitute the benefit basket or package. While similarities exist in the way statutory benefit packages are determined in different countries, each system has a unique combination of substantive principles, according to which services are considered for the statutory benefit package, and relevant decision-making processes. As a general rule, a broad definition of the statutory benefit package can be found at a higher legislative level, mostly delineating the areas of care to be covered. Packages are then determined more concretely by a variety of actors at the regulatory level, centrally or regionally, and usually within each area of care. This
1. A slightly different terminology has also been used for the same model, still using breadth to denote how much of the population is covered, but describing which services are covered as the “scope” of coverage and the proportion of the benefit cost covered as the “depth”. Essentially, the three-dimensional model is applied identically.

Slovenia Purchasing and payment review 2
results in more or less explicit benefit catalogues, which can consist of recommendations and/or the inclusion or exclusion of specific services. How these catalogues are set up is often related to how countries pay for services in different areas of care (Schreyögg et al., 2005).
The situation in Slovenia
Breadth of coverage – who is covered?The Health Care and Health Insurance Act of 1992 set up the compulsory public insurance scheme in place in Slovenia today. While permanent residence in Slovenia is one of the main factors determining entitlement to health services, Articles 15 to 18 of the Act also delineate other conditions (apart from residence), under which a person is compulsorily insured. The scheme is administered by the Health Insurance Institute of Slovenia (HIIS) for all 25 categories of insured persons delineated in Article 15 of the Act.2 Their entitlement is defined in a manner that ensures that coverage is virtually universal, with the exception of those individuals whose insurance status is unclear (<1% of the insured population), mostly due to an unclear residence situation (e.g. for commuters, people who have moved abroad, etc.).
There are different contribution rates for different categories of insured groups, while the National Institute for Employment covers contributions for the unemployed and the state and/or municipalities for individuals without income, prisoners and war veterans. Pensioners do not pay contributions: they are covered by the Pension and Disability Insurance Institute of Slovenia. Proactive steps have been taken by the HIIS in recent years both to monitor the number of these people and to ensure payment of employer contributions into the system. Measures aiming to ensure that small entrepreneurs and self-employed individuals pay their contributions regularly were introduced in 2001 (Article 78a of the Health Care and Health Insurance Act) and included provisions on withholding non-emergency services for non-paying individuals and their co-insured dependents.3
Voluntary health insurance is mostly complementary in nature and covered approximately 71% of the total population or approximately 95% of the population who are subject to co-payments under the complementary health insurance scheme as of December 2014 (Albreht et al., 2016). It is offered by one non-profit and two for-profit insurers. Supplementary health insurance policies are only taken out by a small proportion of the population.
2 The specifics on insurance for work-related injury and occupational disease are set out in Articles 16 to 18.3 An exception to this rule for children, stepchildren, grandchildren, brothers and sisters was instituted in 2011.
Depth of coverage – what is covered?Compulsory health insurance covers all basic risks: (1) illness and injury not connected to work and (2) injury at work or professional illness (Article 13 of the Act). There are almost no differences in benefits between the categories of insured persons; however, some of the benefits foreseen in Article 13 (health services, wage compensation and reimbursement of travel expenses) do not apply to all categories of insured persons. For example, retired people are not entitled to sick-leave benefits, certain self-employed people and farmers are not entitled to reimbursement for travel expenses and so on. Services to be covered by compulsory health insurance are broadly defined by the Health Care and Health Insurance Act (Article 23). The Act further stipulates which population groups (children and students up to 26 years of age) and service categories are to be covered in their entirety by insurance (e.g. emergency services; family planning, reproductive and pregnancy-related services; prevention and diagnosis of infectious diseases; mandatory immunization and chemoprophylactic services; and services for a number of pre-specified conditions, nursing care in institutions and at home). By extension, all other services require co-payments, which can be paid out of pocket or covered by complementary health insurance policies.
For the majority of areas of care, the Act does not provide a detailed list of services4 but mandates that co-payment levels for services are determined by the HIIS in agreement with the government. Thus, the HIIS issues the Regulation of Compulsory Health Insurance, which needs to be accepted by the HIIS Assembly and approved by the Minister of Health (for more on co-payment levels see the next section, “Height of coverage”). In practice, this means that there are no services which are excluded from public coverage by law; however, certain services, such as cosmetic surgery, can be eliminated in the “Regulation of Compulsory Health Insurance”. A positive list (full coverage), a positive list with up to 30% co-payment and an intermediate list (higher co-payments required) are in place for pharmaceuticals. The field of medical devices has its own rules (mostly in regulative acts of the HIIS), but there is no national register of medical devices and no national defined way of testing new technology and its quality and effectiveness. This produces many difficulties in defining a basket of medical devices that are directly prescribed to patients and others that are provided by suppliers of health services.
Height of coverage – how much of the costs are covered?As mentioned above, a broad range of services in the Slovenian compulsory insurance system require co-payments, which are defined by the HIIS in agreement
4 Exceptions are pharmaceuticals and a part of dental care; similar considerations apply to medical devices, for which a full positive list will be set up by July 2017.
Slovenia Purchasing and payment review 3
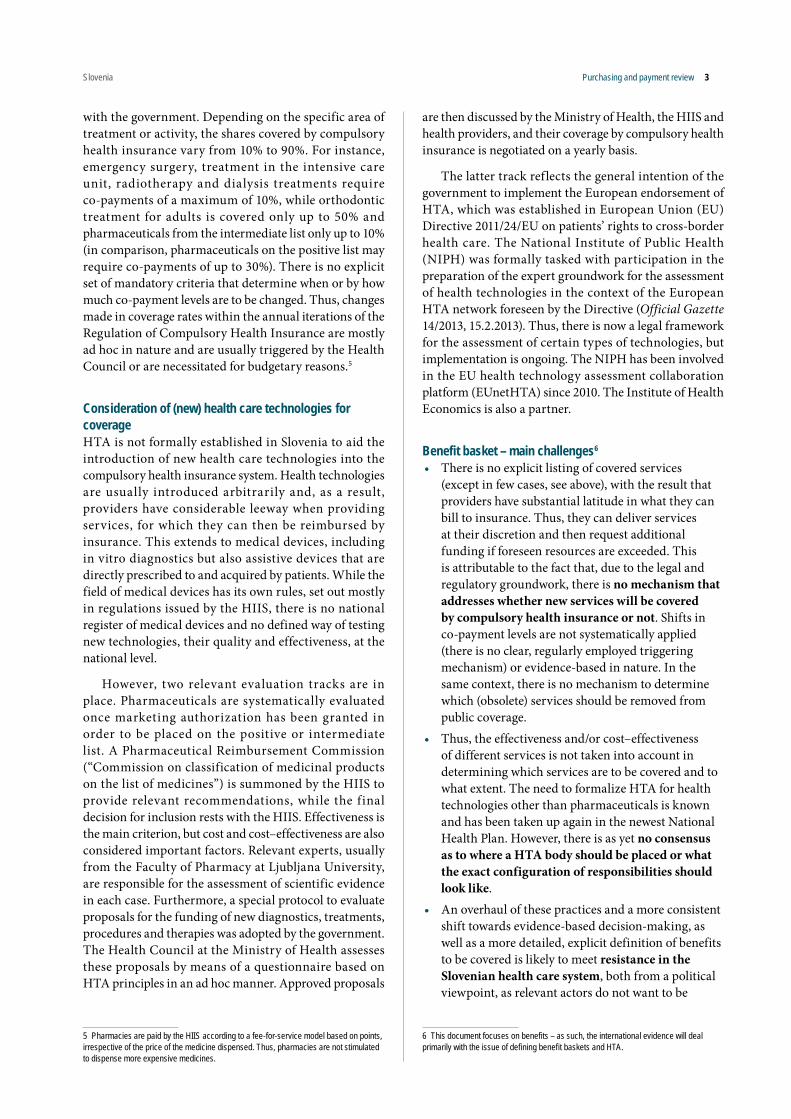
with the government. Depending on the specific area of treatment or activity, the shares covered by compulsory health insurance vary from 10% to 90%. For instance, emergency surgery, treatment in the intensive care unit, radiotherapy and dialysis treatments require co-payments of a maximum of 10%, while orthodontic treatment for adults is covered only up to 50% and pharmaceuticals from the intermediate list only up to 10% (in comparison, pharmaceuticals on the positive list may require co-payments of up to 30%). There is no explicit set of mandatory criteria that determine when or by how much co-payment levels are to be changed. Thus, changes made in coverage rates within the annual iterations of the Regulation of Compulsory Health Insurance are mostly ad hoc in nature and are usually triggered by the Health Council or are necessitated for budgetary reasons.5
Consideration of (new) health care technologies for coverageHTA is not formally established in Slovenia to aid the introduction of new health care technologies into the compulsory health insurance system. Health technologies are usually introduced arbitrarily and, as a result, providers have considerable leeway when providing services, for which they can then be reimbursed by insurance. This extends to medical devices, including in vitro diagnostics but also assistive devices that are directly prescribed to and acquired by patients. While the field of medical devices has its own rules, set out mostly in regulations issued by the HIIS, there is no national register of medical devices and no defined way of testing new technologies, their quality and effectiveness, at the national level.
However, two relevant evaluation tracks are in place. Pharmaceuticals are systematically evaluated once marketing authorization has been granted in order to be placed on the positive or intermediate list. A Pharmaceutical Reimbursement Commission (“Commission on classification of medicinal products on the list of medicines”) is summoned by the HIIS to provide relevant recommendations, while the final decision for inclusion rests with the HIIS. Effectiveness is the main criterion, but cost and cost–effectiveness are also considered important factors. Relevant experts, usually from the Faculty of Pharmacy at Ljubljana University, are responsible for the assessment of scientific evidence in each case. Furthermore, a special protocol to evaluate proposals for the funding of new diagnostics, treatments, procedures and therapies was adopted by the government. The Health Council at the Ministry of Health assesses these proposals by means of a questionnaire based on HTA principles in an ad hoc manner. Approved proposals
5 Pharmacies are paid by the HIIS according to a fee-for-service model based on points, irrespective of the price of the medicine dispensed. Thus, pharmacies are not stimulated to dispense more expensive medicines.
are then discussed by the Ministry of Health, the HIIS and health providers, and their coverage by compulsory health insurance is negotiated on a yearly basis.
The latter track reflects the general intention of the government to implement the European endorsement of HTA, which was established in European Union (EU) Directive 2011/24/EU on patients’ rights to cross-border health care. The National Institute of Public Health (NIPH) was formally tasked with participation in the preparation of the expert groundwork for the assessment of health technologies in the context of the European HTA network foreseen by the Directive (Official Gazette 14/2013, 15.2.2013). Thus, there is now a legal framework for the assessment of certain types of technologies, but implementation is ongoing. The NIPH has been involved in the EU health technology assessment collaboration platform (EUnetHTA) since 2010. The Institute of Health Economics is also a partner.
Benefit basket – main challenges6
• There is no explicit listing of covered services (except in few cases, see above), with the result that providers have substantial latitude in what they can bill to insurance. Thus, they can deliver services at their discretion and then request additional funding if foreseen resources are exceeded. This is attributable to the fact that, due to the legal and regulatory groundwork, there is no mechanism that addresses whether new services will be covered by compulsory health insurance or not. Shifts in co-payment levels are not systematically applied (there is no clear, regularly employed triggering mechanism) or evidence-based in nature. In the same context, there is no mechanism to determine which (obsolete) services should be removed from public coverage.
• Thus, the effectiveness and/or cost–effectiveness of different services is not taken into account in determining which services are to be covered and to what extent. The need to formalize HTA for health technologies other than pharmaceuticals is known and has been taken up again in the newest National Health Plan. However, there is as yet no consensus as to where a HTA body should be placed or what the exact configuration of responsibilities should look like.
• An overhaul of these practices and a more consistent shift towards evidence-based decision-making, as well as a more detailed, explicit definition of benefits to be covered is likely to meet resistance in the Slovenian health care system, both from a political viewpoint, as relevant actors do not want to be
6 This document focuses on benefits – as such, the international evidence will deal primarily with the issue of defining benefit baskets and HTA.

Slovenia Purchasing and payment review 4
responsible for rationing health care by deciding that certain benefits will not be included, and from the provider side, where a certain degree of reluctance to upset a system that has been in place for years can be expected.
International experience
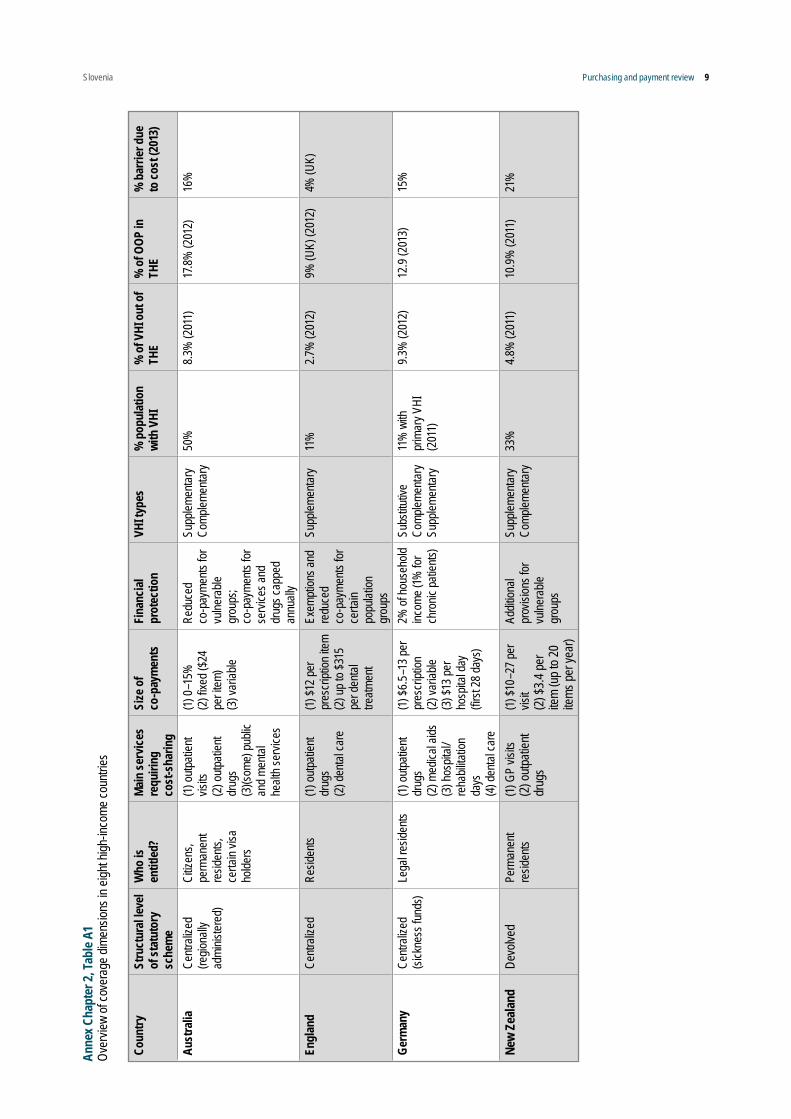
Determining which services to prioritize for public coverageAs previously mentioned, what is to be covered is usually decided at two levels. Areas of care are determined at a higher (legislative) level, as is the case in Slovenia. Similarities across countries can be seen at this level. For example, some areas of care are almost always included, such as primary care and acute inpatient care. Others, such as dental care and cosmetic surgery, are among the most likely to be excluded. However, the exact range of services contained in the benefit package is variable and subject to decision-making at regulatory level. The following paragraphs further illustrate the process of defining benefit baskets in a range of health care systems, including tax-funded, insurance-based and mixed systems (see Panteli & van Ginneken, 2016). An overview of system characteristics can be found in the Annex Chapter 2, Table A1.
Decision-making processes leading to more explicitly defined packages and the criteria that underpin them are system-specific, but a commonality is that they are increasingly adopting evidence-based approaches. To name a few examples, the Medicare Benefit Schedule (MBS) in Australia is a concrete listing of services subsidized by the government under the national Medicare Benefit Scheme. The Health Insurance Act 1973 stipulates that, to be covered, services need to be clinically relevant (“generally accepted in the medical profession as necessary for the appropriate treatment of the patient”) and listed on the MBS. The government is advised about which services to cover by the Medical Services Advisory Committee, which provides independent expert advice on all new and amended MBS services regarding their comparative safety, effectiveness, cost–effectiveness and total cost. In New Zealand, the National Health Committee (NHC) assesses new interventions submitted by the Ministry of Health and national or regional health authorities for public funding. It uses 11 criteria for evaluation, which fall under the domains of clinical safety and effectiveness, cost–effectiveness, societal and ethical issues, and feasibility of adoption. In the same system, the Pharmaceutical Management Agency (PHARMAC) is responsible for the assessment and prioritization of pharmaceuticals to be included in the national formulary, medical devices and vaccines under the New Zealand Medicines System, which is a subset of
the health system. PHARMAC uses nine criteria to assess technologies, which include, inter alia, availability, clinical benefit and risk, cost–effectiveness, budgetary impact and direct costs, as well as their position within government health priorities.
In the Netherlands, the government defines a list of “essential” benefits, which health insurers are legally required to provide, based on recommendations from the National Health Care Institute (Zorginstituut Nederland). As a general rule, services that have been found to be effective after evidence-based evaluations are recommended for inclusion. Whereas all pharmaceuticals and medical aids are evaluated, evaluation of other categories (such as health services, technologies, products) must be requested by a letter from a stakeholder. The Zorginstituut considers the following four criteria when evaluating a given intervention: necessity (severity of condition and ability of patients to pay for treatment themselves), efficacy, cost–effectiveness and feasibility (including sustainability considerations). Insurers have important leeway in contracting care and, as a result, differences occur between insurers in the content of contracted care benefits.
I n G er ma ny, t he Federa l Joi nt C om m it tee (Gemeinsamer Bundesausschuss, G-BA) issues directives determining or modifying the explicit benefit catalogue of the statutory health insurance funds, thus specifying which services are to be reimbursed. The general approach towards coverage is different based on the level of care: in inpatient care, services can be offered (and reimbursed) unless explicitly excluded by the G-BA (Verbotsvorbehalt); in ambulatory care they need to be explicitly included in the benefit package to be reimbursed (Erlaubnisvorbehalt). Decisions in both cases are based on the principles of diagnostic or therapeutic benefit, medical necessity and cost–effectiveness. The G-BA is supported in the scientific assessment of the evidence on medical benefit by the Institute for Quality and Efficiency in Health Care (IQWiG), an independent institute founded in 2004. While all three criteria are considered in each case, it is mainly (added) benefit that determines inclusion or exclusion from the lists.
In systems with less explicit benefit packages, different approaches to priority-setting for health care are in place. With the goal of promoting “appropriate, necessary and efficient” care, the National Institute for Health and Care Excellence (NICE) in England issues guidance on clinically effective treatments to be provided by the National Health Service (NHS) and appraises health technologies with regard to their efficacy and cost–effectiveness. Technologies that are positively evaluated are made available by the NHS; final decision-making power rests with NHS Trusts in England and NHS Boards in Scotland. Explicit rationing or prioritization has been largely rejected in the NHS context; however,

Slovenia Purchasing and payment review 5
NICE does employ a concrete threshold when deciding on a technology’s cost–effectiveness, ranging between £20 000 and £30 000 per quality-adjusted life-year (QALY) gained. Nevertheless, final NICE decisions are not only based on comparative cost–effectiveness but also include other considerations, such as fair distribution of resources. Finally, NICE can recommend that use of an intervention is restricted to a particular group of people within the population only if there is clear evidence about increased effectiveness in this subgroup, or if there are other reasons relating to fairness in society or relevant legal requirements.
Norway does not have an explicit list of approved benefits for statutory coverage. Parliament decides about the areas of care to be covered under the publicly funded system along with criteria for cost-sharing and its caps. The necessity of certain treatments, for example elective surgery, is to be determined by the treating physician before they qualify for public reimbursement. While the range (and budget) of services is set at municipal level, some prioritized services, such as paediatric care, are mandatory for all municipalities. Priority-setting criteria (severity of condition, effectiveness, cost–effectiveness) are used differently for different types of service categories. There is neither an official QALY valuation nor a set threshold value for cost-effectiveness decisions; however, certain set amounts are sometimes used for comparisons or estimations (e.g. NOK 500 000 – or US$ 60 355 – per QALY gained). The Norwegian Knowledge Centre for the Health Services (NOKC) carries out economic evaluations of interventions on behalf of the Ministry of Health and Care Services, the health trusts, the Norwegian Directorate of Health, the Norwegian Medicines Agency and the National Council for Priority Setting in Health Care.
Similarly, covered services in the Swedish system vary across the country, due to the decentralized nature of financing and provision. Decisions on what care to prioritize given a finite health care budget rest on guidelines adopted by the Swedish Parliament (Riksdag) in 1997 (in the bill Priority Setting in Health Care 1996/97:60). The bill introduced the so-called “ethics platform” upon the recommendation of the Parliamentary Priorities Commission. The platform is based on the principles of human dignity, need and solidarity, and cost–effectiveness in descending order of significance. The National Model for Transparent Prioritization in Swedish Health Care (last revised in 2011) is based on those principles and is meant for prioritization decisions by all types of publicly funded health care providers, within county councils, municipalities and privately managed health care.
In the United States, benefit packages in private insurance vary by insurer and insurance type, but typically include at least inpatient and outpatient hospital
care and physician services. Coverage and service reimbursement largely depends on what providers deem “medically necessary”. The statutory schemes, Medicare and Medicaid, both insure different groups of individuals and benefit packages vary within the programmes for each group. Medicare, a federal programme, covers hospital and outpatient care as well as outpatient prescription medications, but largely excludes dental and long-term care services. Its coverage requires relatively high cost-sharing; as a result, many citizens covered under the programme take out complementary health insurance policies and incur high direct expenses. While Medicaid has a centrally determined list of mandatory services to be covered, lower cost-sharing ratios as well as a more f lexible exemption scheme, states (which co-fund the scheme) are allowed to apply restrictions to the volume of services covered (for example, number of visits per year). Coverage is therefore variable across its three dimensions both between and within groups of insured persons.
As perhaps might be expected, the definition of depth of coverage is complex and variable across countries. Interestingly, a group of core criteria seems to be similar across countries – namely, that services need to be necessary and effective with a certain consideration of costs. This ref lects the recognition that, when the full range cannot be covered, there is merit to first eliminating those services that do not bring (added) value.
Set up of formal HTA tracksHTA is “a multidisciplinary process that summarises information about the medical, social, economic and ethical issues related to the use of a health technology in a systematic, transparent, unbiased and robust manner. Its aim is to inform the formulation of safe, effective, health policies that are patient focused and seek to achieve best value” (EUnetHTA). HTA is used as a policy-informing tool, most frequently in connection with coverage decisions involving the pricing and reimbursement of health technologies, such as pharmaceuticals and medical devices.
The seed for today’s HTAs was planted in the 1970s in the United States, as a result of discussions around the diffuse and inefficient use of new medical technologies. Since then, HTA has become a well-rooted approach in many European countries, albeit for a varying range of health technologies (Table 1). Thus, while pharmaceutical reimbursement decisions incorporate some version of evidence assessment in almost all health systems, many countries have expanded the scope of HTA for coverage decision-making to include medical devices and procedures but also public health interventions and rehabilitation services. The extent to which evidence-based recommendations based on HTA inf luence the inclusion of these technologies into the benefit basket varies: while in some cases they are directly linked to

Slovenia Purchasing and payment review 6
coverage decision-making (e.g. Germany or the United Kingdom) in others they can be intended as a foundation for different levels of decision-making (e.g. Austria).
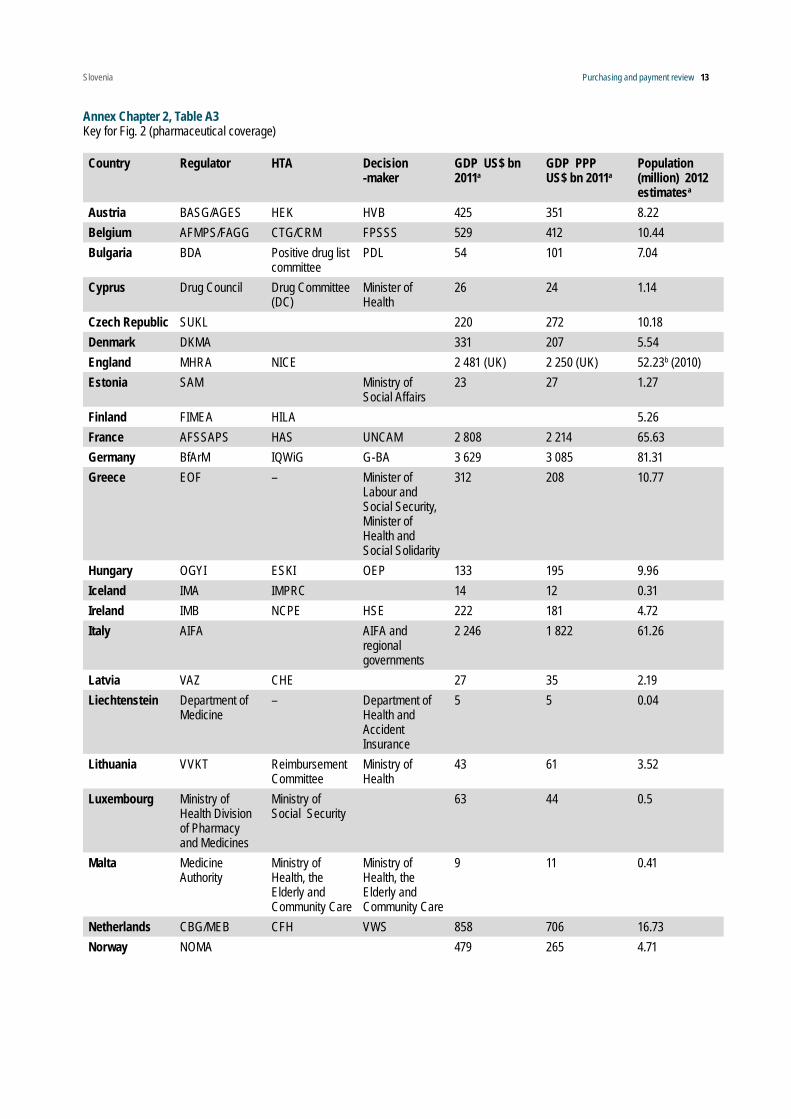
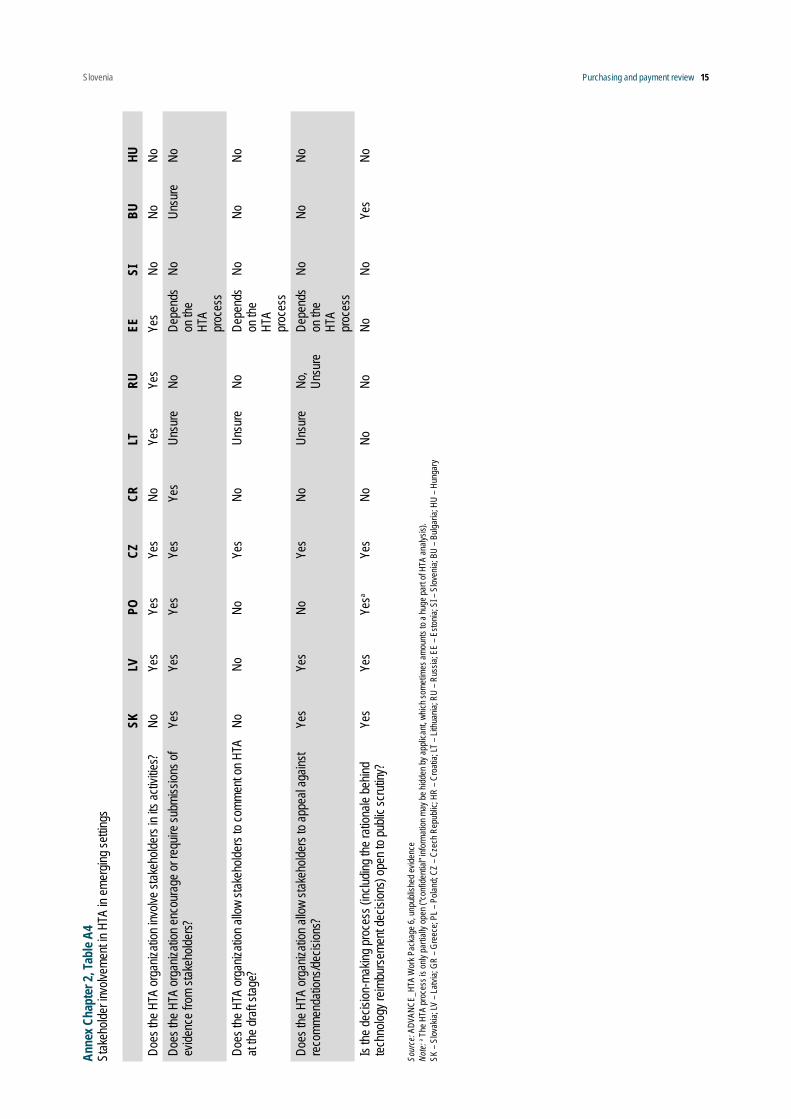
There are different types of institutions conducting HTA (see Annex Chapter 2, Table A2; this is also evident in the composition of the EUnetHTA partner pool), spanning health authorities, national institutes, social insurance institutions, academic research centres or foundations and regional governments. The main distinction is to be made between those bodies producing reports to advise the decision-making process and those directly responsible for regulation of health technologies. In other words, some agencies only collect and synthesize available evidence on technologies, while the evidence appraisal and final decision is left to other bodies; in other cases these steps are taken by different units within the same institution (Fig. 2). A range of stakeholders can be involved at different points during the evidence-based decision-making process based on HTA (see Annex Chapter 2, Tables A3, A4). Stakeholder participation is crucial both for legitimacy and transparency of decisions made.
Fig. 2Elements of system characteristics and HTA process for new pharmaceuticals in European health care systems
Source: Allen et al., 2013.Note: Institutions per country are explained in Annex Chapter 2, Table A3. Capital letters in the first column and in the first row are used for classification purposes in the source material and are irrelevant here.Abbreviations: AP = appraisal; CB = coverage body; EV = economic value; REG = regulator (for market access); TV = therapeutic value.
In Central and Eastern European (CEE) countries examined in recent research (Gulácsi et al., 2014), important steps towards institutionalization of evidence-based coverage decisions have taken place in recent years (see also Annex Chapter 2, Table A5). The use of HTA has been embedded in the law in several countries (e.g. Bulgaria, Hungary, Poland, Romania), but the importance of HTA bodies and for HTA results in decision-making varies. All medical services claiming statutory reimbursement are subject to HTA in several CEE countries. As is the case in many contexts where HTA is newly institutionalized, assessments and economic evaluations from countries where the concept is well established are often considered for evaluation. De novo analyses are rarer (Hungarian and Polish HTAs have included some in recent years). All five CEE countries had limited professional capacities for HTA work, despite
SK LV GR PL CZ HR LT RU EE SI BU HUPharmaceuticals (include vaccines and other biological products)
X X X X X X X X X X X
Medical devices (include diagnostic products) X X X X X X XMedical procedures X X X X XE-health technologies XPublic health interventions X X X XOther Xa
Source: ADVANCE_HTA Work Package 6, unpublished evidence.Note: a National and local government health care programmes. SK – Slovakia; LV – Latvia; GR – Greece; PL – Poland; CZ – Czech Republic; HR – Croatia; LT – Lithuania; RU – Russia; EE – Estonia; SI – Slovenia; BU – Bulgaria; HU – Hungary
Table 1Technologies subject to HTA in emerging settings

Slovenia Purchasing and payment review 7
knowledgeable researchers and civil servants being available, while commissioning professionals from other countries to help with evaluations is not unheard of. It is therefore suggested that HTA professionals in CEE countries form their own community – in addition to those at the European and international level – to enable both a more targeted support network and more localized collaboration, as well as the more in-depth establishment of HTA overall.
Ultimately, it is the will on the part of decision-makers, be it payers or politicians, to really take HTA results into account that is the deciding factor regarding the extent to which institutionalization of HTA is effective and worthwhile. Legal and/or regulatory embeddedness are crucial steps but the implementation of relevant provisions additionally requires a change of culture among decision-makers at all levels in the health care system. Recent anecdotal evidence from Austria suggests that HTA results, regardless of their robustness and relevance, are wasted as long as the political will for implementation and for shouldering difficult decisions when health technologies have no (added) value is lacking.
Conclusions
In view of the main challenges facing the Slovenian health system regarding its benefit basket illustrated above, international evidence, as well as best-practice recommendations, (see Annex Chapter 2, Table A6) encourage the following considerations:
➢ A clear mechanism to determine which (new) benefits are to be covered by compulsory health insurance needs to be established in a manner that includes all types of services and health technologies, such as medical devices. HTA has already been recognized as a tool well-suited for this purpose. Its implementation would not only reduce inefficiencies and waste but also support best care for patients. Slovenia already has some experience with evidence-based approaches, which should be expanded and built upon. The legal mandate to consider resulting recommendations should be expanded.
➢ While there is no international “must” about the type of body to be entrusted with HTA work, it is clear that it should be independent of financial interests and therefore exclusively in the non-profit-making domain. Selecting the topics for assessment, evaluation of the evidence and final decision-making for the benefit basket will in all likelihood involve different actors, therefore a clear, explicit and regulated delineation of responsibilities is required. In this context, the distinction between marketing authorization of health technologies or registration of procedures, for which evidence on safety and quality is usually sufficient, and the evaluation of benefit and value, which is important for coverage decision-making, should also be considered.
➢ Clear criteria need to be established, be it in regulation or at the institutional level, which will guide evaluations. Traditionally, effectiveness, safety and costs (or cost–effectiveness) are the ones most frequently employed. From a methodological perspective, experience can be drawn through collaborating with more experienced countries, for example in the context of EUnetHTA.
➢ Political will is paramount if evidence-based approaches are to be implemented to boost quality and efficiency, as they may lead to the conclusion that services should not be covered by the social security system. The effects of this may be somewhat mitigated if coverage decisions are taken transparently and the reasoning behind them is made clear and readily accessible. Stakeholder involvement is vital in this respect.

Slovenia Purchasing and payment review 8
References
ADVANCE_HTA Work Package 6. Strengthening and implementing HTA in emerging settings: Central and Eastern Europe and Latin America and the Caribbean: a mapping exercise based on literature review and surveys. Unpublished evidence (corresponding author: Jaime Espin, Andalusian School of Public Health, [email protected]).
Albreht T et al. (2016). Slovenia: health system review. Health Systems in Transition, 18(3):1–207.
Allen N et al. (2013). Development of archetypes for non-ranking classification and comparison of European national health technology assessment systems. Health Policy, 113:305–312.
Busse R et al. (2007). Strategic purchasing to improve health system performance: key issues and international trends. Healthcare Papers, 8(Spec. no.):62–76.
Commonwealth Fund (2014). Commonwealth Fund International Health Policy Survey 2014. New York, The Commonwealth Fund.
Drummond MF et al. (2008). Key principles for the improved conduct of health technology assessments for resource allocation decisions. International Journal of Technology Assessment Health Care, 24(3):244–258.
Gulácsi L et al. (2014). Health technology assessment in Poland, the Czech Republic, Hungary, Romania and Bulgaria. European Journal of Health Economics 15(Suppl. 1):S13–25.
Mossialos E et al., eds. (2014). International profiles of health care systems 2014. New York, The Commonwealth Fund.
ONS (2010). Population estimates for UK, England and Wales, Scotland and Northern Ireland [web site]. Newport, Office for National Statistics (https://www.ons.gov.uk/peoplepopulationandcommunity/populationandmigration/populationestimates/datasets/populationestimatesforukenglandandwalesscotlandandnorthernireland).
Panteli D, van Ginneken E (forthcoming). Defining health care benefit packages: how sufficientarian is current practice? In: Fourie C, Rid A, eds. How much is enough? Sufficiency and thresholds in health care. Oxford, Oxford University Press.
Rechel B, Thomson S, Van Ginneken E (2010). Health systems in transition template for authors. WHO, on behalf of the European Observatory on Health Systems and Policies. Copenhagen, World Health Organization Regional Office for Europe.
Schreyögg J et al. (2005). Defining the health benefit basket in nine European countries: evidence from the European Union Health BASKET Project. European Journal of Health Economics, 6(Suppl. 1):2–10.
Stephens JM, Handke B, Doshi JA (2012). International survey of methods used in health technology assessment (HTA): Does practice meet the principles proposed for good research? Comparative Effectiveness Research, 2:29–44.
Slovenia Purchasing and payment review 9An
nex C
hapt
er 2,
Tabl
e A1
Over
view
of co
vera
ge di
mens
ions i
n eigh
t high
-inco
me co
untri
es
Coun
trySt
ruct
ural
level
of st
atut
ory
sche
me
Who
is
entit
led?
Main
serv
ices
re
quiri
ng
cost
-sha
ring
Size
of
co-p
aym
ents
Fina
ncial
pr
otec
tion
VHI t
ypes
% p
opul
atio
n wi
th V
HI
% o
f VHI
out
of
THE
% o
f OOP
in
THE
% b
arrie
r due
to
cost
(201
3)
Aust
ralia
Centr
alize
d (re
giona
lly
admi
nister
ed)
Citiz
ens,
perm
anen
t re
siden
ts,
certa
in vis
a ho
lders
(1) ou
tpati
ent
visits
(2)
outp
atien
t dr
ugs
(3)(s
ome)
publi
c an
d men
tal
healt
h ser
vices
(1) 0
–15%
(2)
fixed
($24
pe
r item
) (3
) var
iable
Redu
ced
co-p
ayme
nts fo
r vu
lnera
ble
grou
ps;
co-p
ayme
nts fo
r se
rvice
s and
dr
ugs c
appe
d an
nuall
y
Supp
lemen
tary
Co
mplem
enta
ry50
%8.
3% (2
011)
17.8%
(201
2)16
%
Engl
and
Centr
alize
dRe
siden
ts(1)
outp
atien
t dr
ugs
(2) de
ntal c
are
(1) $1
2 per
pr
escr
iption
item
(2)
up to
$31
5 pe
r den
tal
treatm
ent
Exem
ption
s and
re
duce
d co
-pay
ments
for
certa
in po
pulat
ion
grou
ps
Supp
lemen
tary
11%
2.7%
(201
2)9%
(UK)
(201
2)4%
(UK)
Germ
any
Centr
alize
d (si
ckne
ss fu
nds)
Lega
l resid
ents
(1) ou
tpati
ent
drug
s (2)
med
ical a
ids
(3) h
ospit
al/
reha
bilita
tion
days
(4)
denta
l car
e
(1) $
6.5–
13 pe
r pr
escr
iption
(2)
varia
ble
(3) $
13 pe
r ho
spita
l day
(fi
rst 2
8 day
s)
2% of
hous
ehold
inc
ome (
1% fo
r ch
ronic
patie
nts)
Subs
titutiv
e Co
mplem
enta
ry
Supp
lemen
tary
11%
with
pr
imar
y VHI
(2
011)
9.3%
(201
2)12
.9 (2
013)
15%
New
Zeala
ndDe
volve
dPe
rman
ent
resid
ents
(1) G
P vis
its
(2) ou
tpatie
nt dr
ugs
(1) $1
0–27
per
visit
(2) $3
.4 pe
r ite
m (u
p to 2
0 ite
ms pe
r yea
r)
Addit
ional
prov
ision
s for
vu
lnera
ble
grou
ps
Supp
lemen
tary
Co
mplem
enta
ry33
%4.8
% (2
011)
10.9
% (2
011)
21%

Slovenia Purchasing and payment review 10Co
untry
Stru
ctur
al lev
el of
stat
utor
y sc
hem
e
Who
is
entit
led?
Main
serv
ices
re
quiri
ng
cost
-sha
ring
Size
of
co-p
aym
ents
Fina
ncial
pr
otec
tion
VHI t
ypes
% p
opul
atio
n wi
th V
HI
% o
f VHI
out
of
THE
% o
f OOP
in
THE
% b
arrie
r due
to
cost
(201
3)
Norw
ayDe
centr
alize
dPe
rman
ent
resid
ents
(1) G
P vis
its
(2) S
pecia
list
visits
(3)
outpa
tient
drug
s (4)
diag
nosti
c tes
ts
(5) p
hysio
(6
) den
tal c
are
(1) $1
6 (2)
$35
(3) up
to $5
7 pe
r pre
scrip
tion
(4) $2
5 and
$6
resp
. (5
+6) v
ariab
le
Annu
al ca
ps
(e.g.
$234
for
phys
ician
se
rvice
s in
2014
) Ex
empti
ons
(vulne
rable
gr
oups
) Tax
de
ducti
ons
(chro
nic
patie
nts)
Supp
lemen
tary
7% (2
013)
0.7%
(201
1)15
% (2
012)
10%
Swed
enDe
centr
alize
dLe
gal re
siden
ts(1)
GP
visits
(2)
spec
ialist
vis
its
(3) h
ospit
al da
ys
(4) pr
escr
iption
dr
ugs
(5) d
enta
l car
e
(1) $1
4–34
(2)
$23–
40
(3) $1
0–11
(4
& 5)
Varie
s de
pend
ing on
ac
crue
d co
-pay
ment
Annu
al ca
ps
(e.g.
$126
for
visits
and $
252
for d
rugs
)
Supp
lemen
tary
5% (2
014)
0.3%
(201
2)16
.5% (2
012)
6%
The N
ethe
r-lan
dsCe
ntrali
zed
(hea
lth
insur
ers)
Resid
ents,
ta
x-pay
ers
living
abro
ad
(1) ph
ysio
(2) de
ntal c
are
(3) so
me dr
ugs
and m
edica
l aid
s
Man
dator
y de
ducti
ble of
$4
36 pe
r yea
r
Exem
ption
s and
all
owan
ces f
or
certa
in gr
oups
Comp
lemen
tary
Su
pplem
enta
ry85
% co
mple-
menta
ry (2
013)
7.8%
(201
0)11
.9%
(201
1)22
%
Unite
d St
ates
(2
013)
Centr
alize
d (M
edica
re an
d Me
dicaid
)
Resid
ents
(34%
co
vere
d by
publi
c pr
ogra
mmes
in
2013
)
Varia
bleVa
riable
Varia
blePr
imar
y (e
mploy
-er
-bas
ed,
indivi
dual)
Su
pplem
enta
ry
for ad
ults o
ver
65 ye
ars
64%
(prim
ary i
n 20
13)
33.4%
(201
2)12
% (2
013)
37%
Sour
ces:
Mos
sialos
et a
l., 20
14; C
omm
onwe
alth F
und,
2014
. Not
es: $
in th
e tab
le ar
e US$
; VHI
– vo
lunta
ry h
ealth
insu
ranc
e; TH
E – t
otal
healt
h exp
endit
ure;
OOP
– out
-of-p
ocke
t pay
men
ts.

Slovenia Purchasing and payment review 11
Albania Medical Devices Management Sector, National Centre of Quality, Safety and Accreditation of Health Institutions (NCQSA)
Reimbursement Department (Departamenti i Rimbursimit/DR/RD) at Health Insurance Institute in collaboration with Pharmaceutical Directorate in Ministry of Health (Drejtoria Farmaceutike/DF) are responsible for pharmaceuticals reimbursement
[no formal process of HTA]Belarus Republican Scientific and Practical Centre for Medical Technologies, Informatization, Administration
and Management of Health
[no formal process of HTA]Bosnia-Herzegovina Evidence on the therapeutic benefits and the economic impacts of medicines are assessed by the
Medicines Committee
Criteria for reimbursement are defined by the Health Insurance Fund
[no formal process of HTA]Bulgaria National Council on Prices and Reimbursement of Medicinal Products (NCPR) is responsible for
assessment, appraisal and reimbursementCroatia Agency for Quality and Accreditation in Health Care and Social Welfare is responsible for assess-
ment
Croatian Institute for Health Insurance (CIHI) (Drug Committee and Medical Devices Committee) is responsible for appraisal
Cyprus Drug Committee is responsible for assessment, appraisal and decisions regarding reimbursement of medical products
Czech Republic Marketing authorization holder (MAH) is responsible for assessment
State Institute of Drug Control (SÙKL) is responsible for appraisalEstonia Estonian Heath Insurance Fund is responsible for appraisal; the assessment is based on information
submitted by applicant
[no formal process of HTA]Greece National Drug Organization (EOF) in collaboration with the National Organization for the Provision of
Health Care Services of Greece (EOPYY) are responsible for the assessment and appraisal process
[no formal process of HTA]Hungary Technology Appraisal Head Department (TAHD) in the National Institute for Quality and Organiza-
tional Development in Health Care and Medicines (THAD–GYEMSZI TEI) is responsible for assessment and appraisal
Kosovo [no formal process of HTA]Latvia Centre of Health Economics (CHE) within the NHS is responsible for assessment and appraisalLithuania State Health Care Accreditation Agency (VASPVT) performs assessment of medical devices
Diseases, Pharmaceuticals and Medical Aids Reimbursement Commission and the National Health Insurance Fund are responsible for appraisal of pharmaceutical products. Most information is provided by the applicant company, and usually no additional analysis is carried out
Macedonia Ministry of Health, Bureau for MedicinesMoldova Medicines AgencyMontenegro Ministry of Health
Annex Chapter 2, Table A2Institutions responsible for HTA activities in emerging settings

Slovenia Purchasing and payment review 12
Poland Agency for Polish Health Technology Assessment (AHTAPol–AOTM) is responsible for assessment
Transparency council is responsible for appraisalRomania [no formal process of HTA]Russia Department of the Establishment for Higher and Continuous Education for Civil Servants founded by
the Presidential Administration (RANE)Serbia National Health Insurance Fund (RZZO)
[no formal process of HTA]Slovakia Working Group for Pharmacoeconomics, Clinical Outcomes and HTA of the Ministry of HealthSlovenia Slovenia Health Insurance Institute (ZZZS)
[no formal process of HTA]Turkey General Directorate of Health Research (Sağlık Araştırmaları Genel Müdürlüğü or SAGEM), the
Drugs and Medical Devices Agency (Türkiye İlaç ve Tıbbi Cihaz Kurumu or TİTCK) and the Social Security Institution (Sosyal Güvenlik Kurumu or SGK).
Medical and Economic Evaluation Committee (MEEC) is responsible for assessment Reimbursement Commission (RC) is responsible for appraisal and final decision (Social Security Institution – SGK)
Ukraine Ukraine Agency of Health Technology assessment (UAOTZ)
Source: ADVANCE_HTA Work Package 6, unpublished evidence.
Slovenia Purchasing and payment review 13
Country Regulator HTA Decision -maker
GDP US$ bn 2011a
GDP PPP US$ bn 2011a
Population (million) 2012 estimatesa
Austria BASG/AGES HEK HVB 425 351 8.22Belgium AFMPS/FAGG CTG/CRM FPSSS 529 412 10.44Bulgaria BDA Positive drug list
committeePDL 54 101 7.04
Cyprus Drug Council Drug Committee (DC)
Minister of Health
26 24 1.14
Czech Republic SUKL 220 272 10.18Denmark DKMA 331 207 5.54England MHRA NICE 2 481 (UK) 2 250 (UK) 52.23b (2010)Estonia SAM Ministry of
Social Affairs23 27 1.27
Finland FIMEA HILA 5.26France AFSSAPS HAS UNCAM 2 808 2 214 65.63Germany BfArM IQWiG G-BA 3 629 3 085 81.31Greece EOF – Minister of
Labour and Social Security, Minister of Health and Social Solidarity
312 208 10.77
Hungary OGYI ESKI OEP 133 195 9.96Iceland IMA IMPRC 14 12 0.31Ireland IMB NCPE HSE 222 181 4.72Italy AIFA AIFA and
regional governments
2 246 1 822 61.26
Latvia VAZ CHE 27 35 2.19Liechtenstein Department of
Medicine– Department of
Health and Accident Insurance
5 5 0.04
Lithuania VVKT Reimbursement Committee
Ministry of Health
43 61 3.52
Luxembourg Ministry of Health Division of Pharmacy and Medicines
Ministry of Social Security
63 44 0.5
Malta Medicine Authority
Ministry of Health, the Elderly and Community Care
Ministry of Health, the Elderly and Community Care
9 11 0.41
Netherlands CBG/MEB CFH VWS 858 706 16.73Norway NOMA 479 265 4.71
Annex Chapter 2, Table A3Key for Fig. 2 (pharmaceutical coverage)

Slovenia Purchasing and payment review 14
Country Regulator HTA Decision -maker
GDP US$ bn 2011a
GDP PPP US$ bn 2011a
Population (million) 2012 estimatesa
Poland URPL AHTAPol MZ 532 766 38.42Portugal INFARMED Minister of
Health 242 247 10.78
Romania ANMDM Ministry of Health
185 264 21.85
Scotland MHRA SMC SMC and area drugs and therapeutics committee (RHB)
2 481 (UK) 2 250 (UK) 5.22 (2010)
Slovakia SUKL Categorization Committee (CC)
Minister of Health
97 127 5.48
Slovenia JAZMP ZZZS 52 59 2Spain AEMPS DGFPS DGFPS and
autonomous health authori-ties
1 537 1 411 47.04
Sweden MPA/NAM TLV/LFN 572 380 9.1Switzerland Swissmedic FDC BAG/OFSP 666 341 7.66Wales MHRA AWMG Minister of
Health 2 781 (UK) 2 250 (UK) 3.01b (2010)
Source: Allen et al., 2013.Notes: a https://www.cia.gov/library/publications/the-world-factbook/geos/xx.html (accessed 2013).b http://www.ons.gov.uk/ons/rel/pop-estimate/population-estimates-for-uk–england-and-wales–scotland-and-northern-ireland/population-estimates-timeseries-1971-to-current-year/index.html (accessed 2013; link no longer operational, for new link see ONS, n.d.).
Slovenia Purchasing and payment review 15An
nex C
hapt
er 2,
Tabl
e A4
Stak
ehold
er in
volve
ment
in HT
A in
emer
ging s
ettin
gs
SKLV
POCZ
CRLT
RUEE
SIBU
HUDo
es th
e HTA
orga
nizati
on in
volve
stak
ehold
ers i
n its
activ
ities?
NoYe
sYe
sYe
sNo
Yes
Yes
Yes
NoNo
NoDo
es th
e HTA
orga
nizati
on en
cour
age o
r req
uire s
ubmi
ssion
s of
evide
nce f
rom
stake
holde
rs?Ye
sYe
sYe
sYe
sYe
sUn
sure
NoDe
pend
s on
the
HTA
proc
ess
NoUn
sure
No
Does
the H
TA or
ganiz
ation
allow
stak
ehold
ers t
o com
ment
on H
TA
at the
draf
t sta
ge?
NoNo
NoYe
sNo
Unsu
reNo
Depe
nds
on th
e HT
A pr
oces
s
NoNo
No
Does
the H
TA or
ganiz
ation
allow
stak
ehold
ers t
o app
eal a
gains
t re
comm
enda
tions
/decis
ions?
Yes
Yes
NoYe
sNo
Unsu
reNo
, Un
sure
Depe
nds
on th
e HT
A pr
oces
s
NoNo
No
Is the
decis
ion-m
aking
proc
ess (
includ
ing th
e rati
onale
behin
d tec
hnolo
gy re
imbu
rsem
ent d
ecisi
ons)
open
to pu
blic s
cruti
ny?
Yes
Yes
Yesa
Yes
NoNo
NoNo
NoYe
sNo
Sour
ce: A
DVAN
CE_H
TA W
ork P
acka
ge 6
, unp
ublis
hed e
viden
ceNo
te: a T
he H
TA p
roce
ss is
only
par
tially
ope
n (“c
onfid
entia
l” inf
orm
ation
may
be h
idden
by a
pplic
ant,
which
som
etim
es a
mou
nts t
o a h
uge p
art o
f HTA
ana
lysis)
.SK
– Sl
ovak
ia; LV
– La
tvia;
GR –
Gree
ce; P
L – P
oland
; CZ
– Cze
ch R
epub
lic; H
R – C
roat
ia; LT
– Lit
huan
ia; R
U – R
ussia
; EE
– Esto
nia; S
I – S
loven
ia; B
U – B
ulgar
ia; H
U – H
unga
ry

Slovenia Purchasing and payment review 16An
nex C
hapt
er 2,
Tabl
e A5
Char
acter
istics
of na
tiona
l HTA
sche
mes i
n five
CEE
coun
tries
Polan
dCz
ech
Repu
blic
Hung
ary
Rom
ania
Bulg
aria
1. Fo
rmali
zatio
n an
d in
stitu
tiona
lizat
ion
Lega
l enfo
rcem
ent o
f HTA
2004
No20
0420
1320
13Or
ganiz
ation
embe
dding
AHTA
PoL
No H
TA bo
dy; S
ÚKL
MoH
, TAH
DM
oHNP
RCHu
man r
esou
rce c
apac
ity
(HTA
)a60
peop
leNo
HTA
spec
ialist
s12
–14 p
eople
2 peo
ple1–
2 peo
ple
Tech
nolog
ies as
sess
ed
Phar
mace
utica
ls, m
edica
l de
vices
and a
ll othe
r med
ical
serv
ices c
laimi
ng pu
blic f
unds
Phar
mace
utica
ls Ph
arma
ceuti
cals,
med
ical
devic
es, h
ospit
al me
dical
techn
ologie
s
Phar
mace
utica
ls, m
edica
l de
vices
, med
ical im
aging
tec
hnolo
gies,
and a
ll othe
r me
dical
serv
ices c
laimi
ng
publi
c fun
ds
Phar
mace
utica
ls, m
edica
l de
vices
2. St
anda
rdiza
tion
Offic
ial H
TA gu
idelin
e de
velop
ment
AHTA
PoL
SÚKL
TAHD
(MoH
)HT
A un
it (M
oH)
NPRC
Econ
omic
evalu
ation
s CE
A/CU
A/BI
ACE
A/CU
ACE
A/CU
A/BI
ACE
A/CU
A/BI
ACE
A/CU
A/BI
ALo
cal d
ata re
quire
ments
Yes
Yes
Yes
Yes
Yes
Crite
ria fo
r pos
itive
reco
mmen
datio
nsEf
ficac
y, sa
fety,
ICER
less
tha
n 3 x
GDP/
capit
a, BI
A an
d ris
k of o
ff-lab
el us
e
ICER
≈ 3
x GDP
/capit
aEf
ficac
y, sa
fety,
ICER
less
tha
n 2–3
x GD
P/ca
pita,
BIA
HAS,
NIC
E/SM
C/AW
MSG
reco
mmen
datio
n,Ex
pert
opini
on
reim
burs
emen
t stat
us in
EU,
re
lative
effic
acy a
nd sa
fety,
PRO
Publi
c hea
lth pr
ioritie
s Ye
sYe
sYe
sYe
sYe
sPu
blic h
ealth
prior
ities l
inked
to
decis
ion-m
aking
NoNo
Yes f
or ho
spita
l med
ical
techn
ology
NoNo

Slovenia Purchasing and payment review 17Po
land
Czec
h Re
publ
icHu
ngar
yRo
man
iaBu
lgar
ia3.
Exec
utio
nAp
plica
tion f
ee
Yes
Yes
Yes
NoNo
Natio
nal/re
giona
l HTA
proc
ess
Natio
nal
Natio
nal
Natio
nal
Natio
nal
Natio
nal
Numb
er of
decis
ions
870
NAb
997 (
2004
–201
0) an
d 250
167
271
betw
een 2
010 a
nd 20
13Nu
mber
of de
cision
s on d
rugs
742
NAb
NA16
727
1Nu
mber
of po
sitive
decis
ions
on dr
ugs
547
NAb
NA13
0NA
Publi
shed
appr
aisals
87
0NA
No16
7No
4. Fu
rther
pro
fess
iona
lizat
ion
Shor
tage
in tr
ained
pr
ofess
ionals
Yes
Yes
Yes
Yes
Yes
Acad
emic
educ
ation
al tra
ining
Yes
Yes
Yes
NoNo
Sour
ce: G
ulacs
i et a
l. 201
4.No
tes:
a Pro
fess
ionals
resp
onsib
le fo
r HTA
; b SÚK
L’s d
ecisi
ons a
re m
anda
tory
for a
ny ch
ange
of p
ricing
and
reim
burs
emen
t for
all p
harm
aceu
ticals
.CE
A – c
ost-e
ffecti
vene
ss a
nalys
is; C
UA –
cost-
utilit
y ana
lysis;
BIA
– bu
dget
impa
ct an
alysis
; ICE
R – i
ncre
men
tal c
ost-e
ffecti
vene
ss ra
tio; G
DP –
gros
s dom
estic
pro
duct
NA –
not a
vaila
ble
Slovenia Purchasing and payment review 18
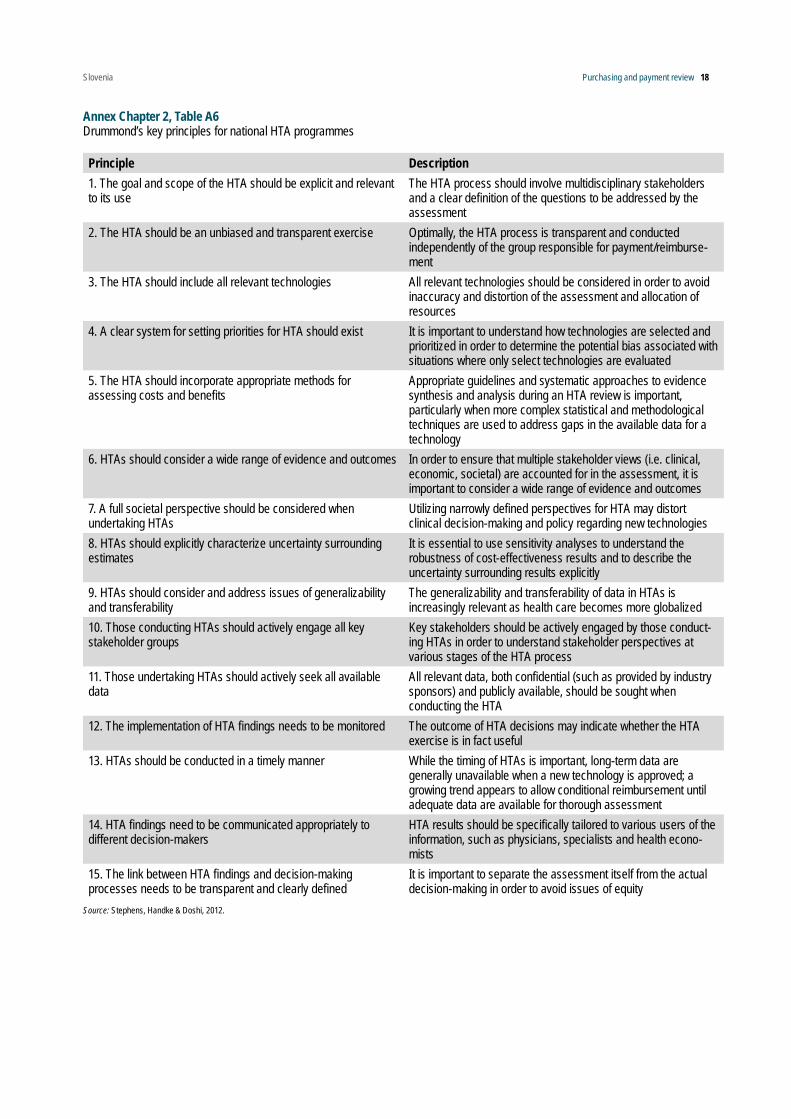
Principle Description1. The goal and scope of the HTA should be explicit and relevant to its use
The HTA process should involve multidisciplinary stakeholders and a clear definition of the questions to be addressed by the assessment
2. The HTA should be an unbiased and transparent exercise Optimally, the HTA process is transparent and conducted independently of the group responsible for payment/reimburse-ment
3. The HTA should include all relevant technologies All relevant technologies should be considered in order to avoid inaccuracy and distortion of the assessment and allocation of resources
4. A clear system for setting priorities for HTA should exist It is important to understand how technologies are selected and prioritized in order to determine the potential bias associated with situations where only select technologies are evaluated
5. The HTA should incorporate appropriate methods for assessing costs and benefits
Appropriate guidelines and systematic approaches to evidence synthesis and analysis during an HTA review is important, particularly when more complex statistical and methodological techniques are used to address gaps in the available data for a technology
6. HTAs should consider a wide range of evidence and outcomes In order to ensure that multiple stakeholder views (i.e. clinical, economic, societal) are accounted for in the assessment, it is important to consider a wide range of evidence and outcomes
7. A full societal perspective should be considered when undertaking HTAs
Utilizing narrowly defined perspectives for HTA may distort clinical decision-making and policy regarding new technologies
8. HTAs should explicitly characterize uncertainty surrounding estimates
It is essential to use sensitivity analyses to understand the robustness of cost-effectiveness results and to describe the uncertainty surrounding results explicitly
9. HTAs should consider and address issues of generalizability and transferability
The generalizability and transferability of data in HTAs is increasingly relevant as health care becomes more globalized
10. Those conducting HTAs should actively engage all key stakeholder groups
Key stakeholders should be actively engaged by those conduct-ing HTAs in order to understand stakeholder perspectives at various stages of the HTA process
11. Those undertaking HTAs should actively seek all available data
All relevant data, both confidential (such as provided by industry sponsors) and publicly available, should be sought when conducting the HTA
12. The implementation of HTA findings needs to be monitored The outcome of HTA decisions may indicate whether the HTA exercise is in fact useful
13. HTAs should be conducted in a timely manner While the timing of HTAs is important, long-term data are generally unavailable when a new technology is approved; a growing trend appears to allow conditional reimbursement until adequate data are available for thorough assessment
14. HTA findings need to be communicated appropriately to different decision-makers
HTA results should be specifically tailored to various users of the information, such as physicians, specialists and health econo-mists
15. The link between HTA findings and decision-making processes needs to be transparent and clearly defined
It is important to separate the assessment itself from the actual decision-making in order to avoid issues of equity
Annex Chapter 2, Table A6Drummond’s key principles for national HTA programmes
Source: Stephens, Handke & Doshi, 2012.

Slovenia Purchasing and payment review 19
3 The purchasing process
Introduction
Strategic purchasing, or active purchasing, in contrast to passive purchasing (e.g. use of historical budgets), is often seen as the main instrument for promoting efficiency in the use of health funds. It should promote quality and efficiency by, among others, examining actual health needs and their regional variations, the interventions and services that best meet these needs, and how these interventions and services should be purchased or provided while taking into account the availability of providers and their quality (Preker et al. 2007)
This chapter focuses on how the purchasing process is regulated and planned in Slovenia. Although payment methods and benefit setting can be seen as an integral part of purchasing, they will be discussed in more detail in different sections. In the next sections the purchasing process will be analysed and main problems identified. Moreover, international best practice and experience will be examined that may provide solutions or possible reform trajectories to overcome the problems encountered in Slovenia.
The situation in Slovenia
The purchasing process in Slovenia is regulated by the 1992 Health Care and Health Insurance Act and further outlined in three key hierarchical documents. From top to bottom, these include (1) the National Health Plan, which constitutes the overall planning document of the Slovenian health system, (2) the General Agreement (GA), which is a framework contract between partners and (3) the individual provider contracts. The latter two documents jointly lay down the most important allocation mechanism for compulsory health insurance funds collected by the HIIS.
The National Health PlanAccording to the Health Care and Health Insurance Act, a National Health Plan should be accepted by Ministry of Health (and approved by the Parliament). It does not specify a particular duration for the Plan. Relating to the purchasing of health services, this Plan should define a basic public provider network that meets the health needs of the population, the roles and responsibilities as well as the aims and targets of the health system. However, such a Plan was only approved twice in the period 1992–2014. Even when it was accepted it did not provide concrete and feasible definitions for a public network of providers, classification of hospitals, the health care measures to be implemented, priorities, projections or overall health
gain targets. Instead, Slovenia has a public network that is largely based on historically developed supply factors, which have led to large disparities in the distribution of providers and health professionals. The last resolution on a National Health Plan was approved for the period 2008–2013 but, because its content is not adequately defined, the Plan cannot be used as a planning document for the involved stakeholders and their activities. As such, the current Plan has no concrete meaning. A new draft plan is currently under discussion, but has not yet been approved.
The National Health Plan does not clearly define roles and responsibilities for all stakeholders in terms of (1) who should be involved, (2) what their responsibility is in terms of planning/purchasing and for which area of the health system, and (3) how the planning and purchasing process should take place in terms of methodology and approach. According to their respective missions, the NIPH and the Ministry of Health should prepare materials for drafting and discussing the Plan while other public institutions should collaborate on matters pertaining to their field of expertise. For example, the content in the National Health Plan that relates to purchasing and financing of health services should be prepared in cooperation with the HIIS. However, in absence of a clearly defined process for drafting a health plan, the contributions of the stakeholders are not as clear and comprehensive as they need to be and the eventual health plan cannot be used as a solid basis on which to build the negotiating and purchasing process.
The General Agreement Apart from requiring a National Health Plan, the Health Care and Health Insurance Act also outlines the negotiating and purchasing process through yearly general agreements. Interestingly, no changes or amendments have occurred in this part of the law since 1992. The GA seeks to reconcile the different proposals and interests between partners in relation to the available funds and stipulates what services, are to be provided, their scope and the prices the HIIS must pay.
The following partners are involved to represent the interests of individual stakeholders:
• the Ministry of Health (it is not clearly defined whose interests it represents: e.g. the Government of the Republic of Slovenia, the ruling coalition, the funder and owner of hospitals, or the electorate);
• the HIIS (represents the payers of contributions and health service users);
• the Association of Health Institutions of Slovenia (represents public health institutions: hospitals and health care centres);
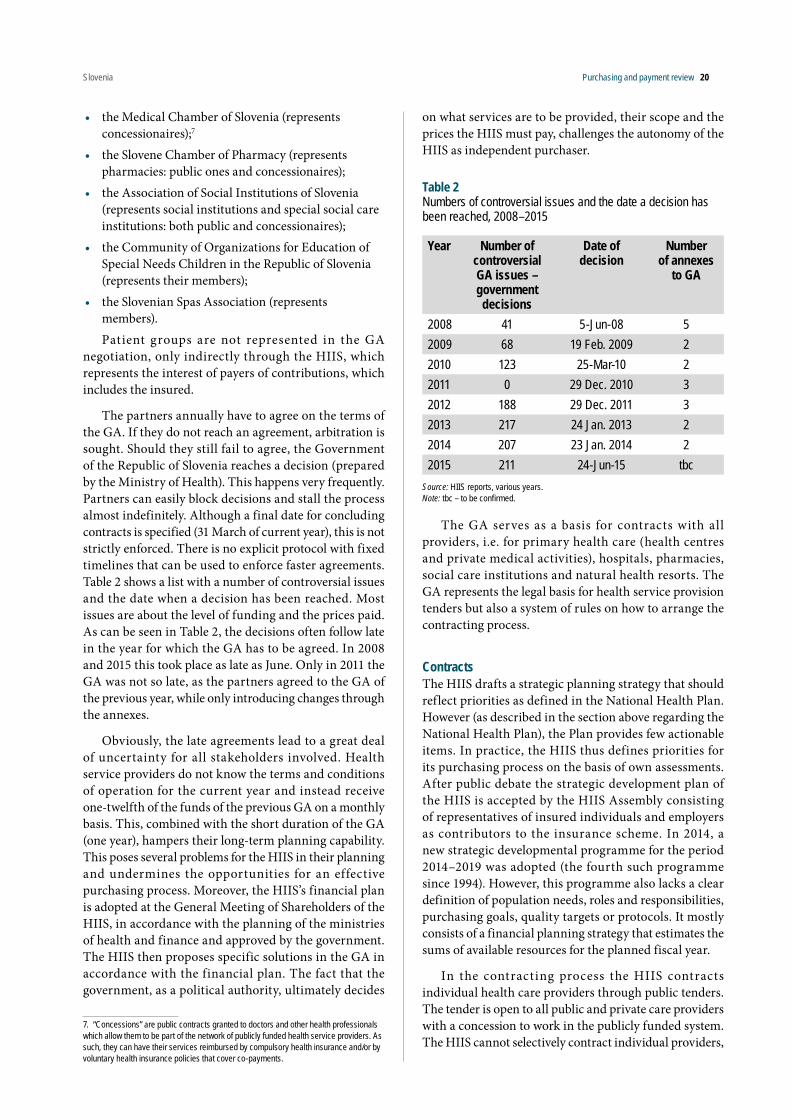
Slovenia Purchasing and payment review 20
• the Medical Chamber of Slovenia (represents concessionaires);7
• the Slovene Chamber of Pharmacy (represents pharmacies: public ones and concessionaires);
• the Association of Social Institutions of Slovenia (represents social institutions and special social care institutions: both public and concessionaires);
• the Community of Organizations for Education of Special Needs Children in the Republic of Slovenia (represents their members);
• the Slovenian Spas Association (represents members). Patient groups are not represented in the GA
negotiation, only indirectly through the HIIS, which represents the interest of payers of contributions, which includes the insured.
The partners annually have to agree on the terms of the GA. If they do not reach an agreement, arbitration is sought. Should they still fail to agree, the Government of the Republic of Slovenia reaches a decision (prepared by the Ministry of Health). This happens very frequently. Partners can easily block decisions and stall the process almost indefinitely. Although a final date for concluding contracts is specified (31 March of current year), this is not strictly enforced. There is no explicit protocol with fixed timelines that can be used to enforce faster agreements. Table 2 shows a list with a number of controversial issues and the date when a decision has been reached. Most issues are about the level of funding and the prices paid. As can be seen in Table 2, the decisions often follow late in the year for which the GA has to be agreed. In 2008 and 2015 this took place as late as June. Only in 2011 the GA was not so late, as the partners agreed to the GA of the previous year, while only introducing changes through the annexes.
Obviously, the late agreements lead to a great deal of uncertainty for all stakeholders involved. Health service providers do not know the terms and conditions of operation for the current year and instead receive one-twelfth of the funds of the previous GA on a monthly basis. This, combined with the short duration of the GA (one year), hampers their long-term planning capability. This poses several problems for the HIIS in their planning and undermines the opportunities for an effective purchasing process. Moreover, the HIIS’s financial plan is adopted at the General Meeting of Shareholders of the HIIS, in accordance with the planning of the ministries of health and finance and approved by the government. The HIIS then proposes specific solutions in the GA in accordance with the financial plan. The fact that the government, as a political authority, ultimately decides
7. “Concessions” are public contracts granted to doctors and other health professionals which allow them to be part of the network of publicly funded health service providers. As such, they can have their services reimbursed by compulsory health insurance and/or by voluntary health insurance policies that cover co-payments.
on what services are to be provided, their scope and the prices the HIIS must pay, challenges the autonomy of the HIIS as independent purchaser.
Table 2Numbers of controversial issues and the date a decision has been reached, 2008–2015
Year Number of controversial GA issues – government decisions
Date of decision
Number of annexes
to GA
2008 41 5-Jun-08 52009 68 19 Feb. 2009 22010 123 25-Mar-10 22011 0 29 Dec. 2010 32012 188 29 Dec. 2011 32013 217 24 Jan. 2013 22014 207 23 Jan. 2014 22015 211 24-Jun-15 tbc
Source: HIIS reports, various years.Note: tbc – to be confirmed.
The GA serves as a basis for contracts with all providers, i.e. for primary health care (health centres and private medical activities), hospitals, pharmacies, social care institutions and natural health resorts. The GA represents the legal basis for health service provision tenders but also a system of rules on how to arrange the contracting process.
ContractsThe HIIS drafts a strategic planning strategy that should reflect priorities as defined in the National Health Plan. However (as described in the section above regarding the National Health Plan), the Plan provides few actionable items. In practice, the HIIS thus defines priorities for its purchasing process on the basis of own assessments. After public debate the strategic development plan of the HIIS is accepted by the HIIS Assembly consisting of representatives of insured individuals and employers as contributors to the insurance scheme. In 2014, a new strategic developmental programme for the period 2014–2019 was adopted (the fourth such programme since 1994). However, this programme also lacks a clear definition of population needs, roles and responsibilities, purchasing goals, quality targets or protocols. It mostly consists of a financial planning strategy that estimates the sums of available resources for the planned fiscal year.
In the contracting process the HIIS contracts individual health care providers through public tenders. The tender is open to all public and private care providers with a concession to work in the publicly funded system. The HIIS cannot selectively contract individual providers,
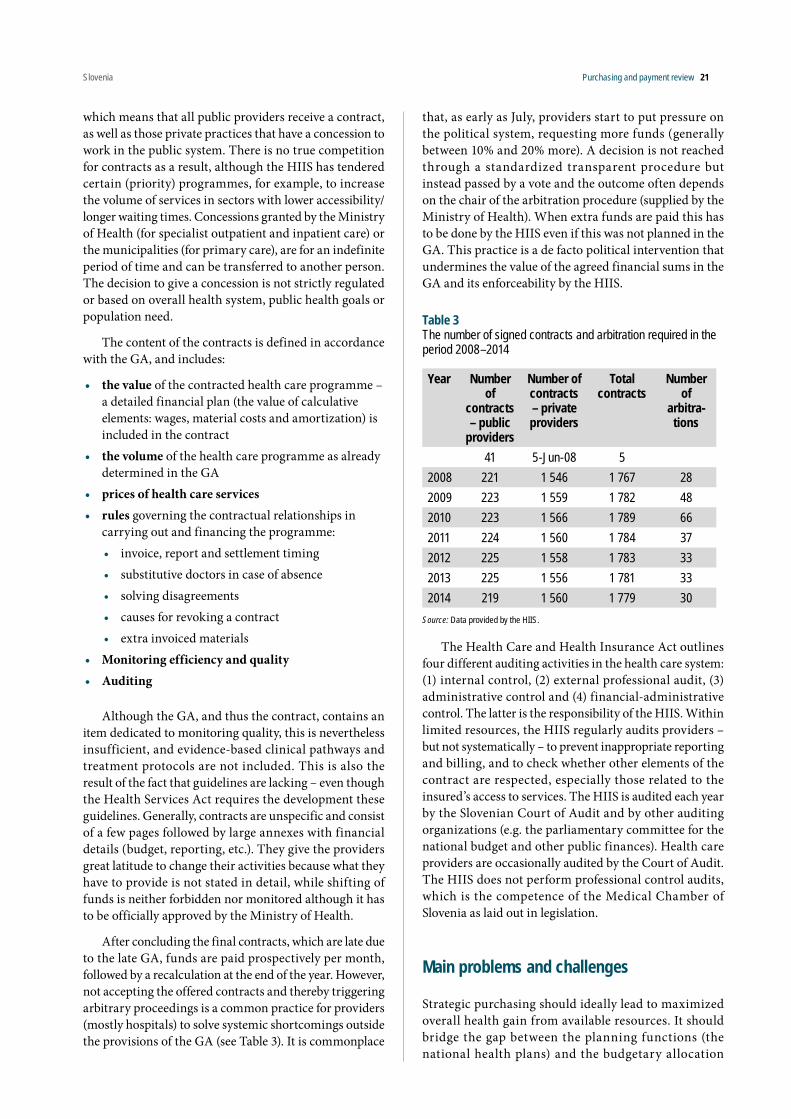
Slovenia Purchasing and payment review 21
which means that all public providers receive a contract, as well as those private practices that have a concession to work in the public system. There is no true competition for contracts as a result, although the HIIS has tendered certain (priority) programmes, for example, to increase the volume of services in sectors with lower accessibility/longer waiting times. Concessions granted by the Ministry of Health (for specialist outpatient and inpatient care) or the municipalities (for primary care), are for an indefinite period of time and can be transferred to another person. The decision to give a concession is not strictly regulated or based on overall health system, public health goals or population need.
The content of the contracts is defined in accordance with the GA, and includes:
• the value of the contracted health care programme – a detailed financial plan (the value of calculative elements: wages, material costs and amortization) is included in the contract
• the volume of the health care programme as already determined in the GA
• prices of health care services• rules governing the contractual relationships in
carrying out and financing the programme:• invoice, report and settlement timing• substitutive doctors in case of absence• solving disagreements• causes for revoking a contract • extra invoiced materials
• Monitoring efficiency and quality • Auditing
Although the GA, and thus the contract, contains an item dedicated to monitoring quality, this is nevertheless insufficient, and evidence-based clinical pathways and treatment protocols are not included. This is also the result of the fact that guidelines are lacking – even though the Health Services Act requires the development these guidelines. Generally, contracts are unspecific and consist of a few pages followed by large annexes with financial details (budget, reporting, etc.). They give the providers great latitude to change their activities because what they have to provide is not stated in detail, while shifting of funds is neither forbidden nor monitored although it has to be officially approved by the Ministry of Health.
After concluding the final contracts, which are late due to the late GA, funds are paid prospectively per month, followed by a recalculation at the end of the year. However, not accepting the offered contracts and thereby triggering arbitrary proceedings is a common practice for providers (mostly hospitals) to solve systemic shortcomings outside the provisions of the GA (see Table 3). It is commonplace
that, as early as July, providers start to put pressure on the political system, requesting more funds (generally between 10% and 20% more). A decision is not reached through a standardized transparent procedure but instead passed by a vote and the outcome often depends on the chair of the arbitration procedure (supplied by the Ministry of Health). When extra funds are paid this has to be done by the HIIS even if this was not planned in the GA. This practice is a de facto political intervention that undermines the value of the agreed financial sums in the GA and its enforceability by the HIIS.
Table 3The number of signed contracts and arbitration required in the period 2008–2014
Year Number of
contracts – public
providers
Number of contracts – private providers
Total contracts
Number of
arbitra-tions
41 5-Jun-08 52008 221 1 546 1 767 282009 223 1 559 1 782 482010 223 1 566 1 789 662011 224 1 560 1 784 372012 225 1 558 1 783 332013 225 1 556 1 781 332014 219 1 560 1 779 30
Source: Data provided by the HIIS.
The Health Care and Health Insurance Act outlines four different auditing activities in the health care system: (1) internal control, (2) external professional audit, (3) administrative control and (4) financial-administrative control. The latter is the responsibility of the HIIS. Within limited resources, the HIIS regularly audits providers – but not systematically – to prevent inappropriate reporting and billing, and to check whether other elements of the contract are respected, especially those related to the insured’s access to services. The HIIS is audited each year by the Slovenian Court of Audit and by other auditing organizations (e.g. the parliamentary committee for the national budget and other public finances). Health care providers are occasionally audited by the Court of Audit. The HIIS does not perform professional control audits, which is the competence of the Medical Chamber of Slovenia as laid out in legislation.
Main problems and challenges
Strategic purchasing should ideally lead to maximized overall health gain from available resources. It should bridge the gap between the planning functions (the national health plans) and the budgetary allocation

Slovenia Purchasing and payment review 22
of resources through an effective purchasing strategy. Currently in Slovenia, many important elements are missing:
1. The National Health Plan lacks key essentials that could be used as a basis for the purchasing process. These include: governance arrangements, concrete and feasible definitions for a public network of providers, an assessment of population needs, clear description of roles and responsibilities herein, and concrete priorities and targets.
2. The process leading to the GA (and as a result individual contracts) is slow due to strong disagreement regarding the level of funding, scope and the prices paid. This leads to a great deal of uncertainty. Health service providers do not know the terms and conditions for the current year while the effectiveness of the HIIS as purchaser is severely hampered.
3. The short duration of the GAs hinders the development and monitoring of long-term goals both for the HIIS and the providers. Moreover, they are thus not aligned with the National Health Plan targets.
4. If a GA cannot be achieved, the government decides (on the basis of advice from the Ministry of Health). This means that the government de facto decides on the services and scope, and the prices have to be paid by the HIIS. This affects effectiveness of the HIIS as an independent body purchasing on behalf of the people of Slovenia. Furthermore, the government may have a conflict of interest as it owns all the hospitals.
5. Perhaps because guidance from the National Health Plan is lacking, the HIIS defines priorities for its purchasing process on the basis of own assessments. However, this strategic programme mostly entails a financial planning strategy and lacks a clear definition of population needs, roles and responsibilities, purchasing goals, quality targets or protocols.
6. The HIIS is required to contract with all public and private providers who hold a concession to operate in Slovenia. Selective contracting is not allowed. However, concessions are granted by mayors of municipalities and not based on overall health system or public health goals. This undermines the purchasing function of the HIIS.
7. Generally, contracts, in line with the GA, are unspecific and consist of a few pages followed by large annexes with financial details. They do not stipulate in great detail what has to be provided and how, and which evidence-based clinical pathways and protocols have to be followed (mainly because
such guidelines have not yet been produced). This leaves room for providers to perform activities that may not be in line with population needs.
8. Providers frequently refuse offered contracts and seek arbitration, hoping to compensate shortfalls. A decision is passed by a vote and the outcome often depends on the chair of the arbitration procedure (from the Ministry of Health). When extra funds have to be paid, this is done from the budget of the HIIS. This practice undermines the value of the GA and planning for all health care providers.
9. Patient groups are not represented in the GA negotiation, only indirectly through the HIIS.
10. Control and monitoring systems are lacking. As required by law, the HIIS regularly audits providers, but not systematically. More investment, perhaps new bodies, may be needed to check inappropriate reporting and billing as well as contractual obligations, etc.
International experience
The international body of literature and descriptions of national experiences with purchasing processes are relatively limited, especially when compared to individual elements of the purchasing process, such as payment mechanisms or benefit setting. This is quite surprising given that strategic purchasing is a main instrument for promoting efficiency in the use of health funds. Today, many countries are seeking to develop the expertise and systems to implement an effective strategic purchasing policy. Countries that have consistently implemented all the elements of an effective purchasing strategy, however, are scarce.
Below, several preconditions for effective purchasing will be discussed that are based on the international literature and experience.
Effective stewardshipA broad consensus among analysts and policy-makers exists about the key role of stewardship in ensuring health system effectiveness. Stewardship’s main functions include formulating strategic policy directions, generating intelligence, exerting influence through regulation and ensuring accountability (Saltman & Ferroussier-Davis 2000; Travis et al. 2003, Busse et al., 2007).
Formulating health policy is a key function of government stewardship although it has tended to have minimal influence over purchasing decisions (Busse et al., 2007). The following five policy lessons can be drawn from the analysis of the failures, as well as successes,

Slovenia Purchasing and payment review 23
in implementing health targets in several countries (Figueras, Jakubowski & Robinson, 2005), which directly apply to Slovenia as well:
• Targets should be realistic but challenging (not the mere projection of trends), transparent, technically and politically plausible, evidence-based, selective and reflective both of health needs and priorities.
• Key stakeholders, particularly the professionals involved in implementation, should be included in setting targets.
• Targets should be supported with evidence for effective implementation policies.
• Subnational development of targets in combination with national formulation increases the likelihood of their implementation.
• Building targets into performance-management systems, including financial incentives and performance reviews, also facilitates their implementation.
As already noted, the current Slovenian National Health Plan in many instances does not meet these goals. This renders the document ineffective as a guiding document for the health system. Combined with the absence of clearly defined roles and responsibilities for the health system, it leads to stakeholders easily dismissing the document.
Clearly, governments encounter technical, economic, political and cultural barriers that affect their ability and credibility in carrying out effective purchasing stewardship (Hunter, Shishkin & Taroni, 2005). In many countries that went through economic transition, the technical and administrative capacity required is lacking. Departments and government bodies with regulatory functions are frequently understaffed and suffer from poor information on the behaviour of purchasers and providers. Moreover, formulating health policies and setting a regulatory framework, collecting information and monitoring purchasers requires substantia l investment, which can pose an economic obstacle.
Lastly, the existence of closed social networks between government officials, purchasers and providers, as well as officials accustomed to command-and-control functions, hinder the adoption of effective stewardship (Busse at al., 2007).
Therefore, the National Health Plan drafting process should be carefully revised to ensure a document is produced that can actually steer the health system and hold stakeholders accountable. This would also require an assessment as to whether expertise and staffing levels are adequate to meet the demands to design, regulate, run and monitor an effective purchasing process. This may
require substantial (initial) investment, which could lead to painful discussions on financial priorities in Slovenian health care.
Establishing an integrated regulatory frameworkUntil now, efforts in Slovenia to improve purchasing have too often focused on individual elements of a purchasing strategy, particularly on payment methods, as perhaps illustrated by a current push to promote P4P. In order for purchasing to become effective, however, a broad framework of regulations should be installed that integrates and coordinates the various aspects of cost-effective purchasing and deals with multiple objectives. This includes four main regulatory mechanisms (see Table 4).
Perhaps a framework as above could be used to assess the purchasing process on more levels than discussed within the scope of this part of the report. In the next sections, however, focus will be on some of the areas that have been identified as particularly problematic in Slovenia and which mostly relate to regulation of contractual relationships and providers.
Ensuring cost-effective contractingContracts are the main vehicle by which purchasers translate their populations’ health needs and desires into the provision of health services. In Slovenia this is mainly facilitated through the GA and the individual contracts with providers. Population health needs or a public network of providers have never been estimated and established, but such surveys could be carried out under the National Health Plan.
Establishing population health needHealth needs assessment is not routinely carried out in many health systems. Even when it exists, it is not always used for purchasing or used in a systematic fashion. This originates from the lack of a public health function in many countries, missing policy capacity, the non-geographically delimited coverage of many purchasers (e.g. social insurance countries with multiple insurers) and an absence of public health skills in purchasing organizations. This function seems to work better in national health service systems in which coordination or integration between public health and purchasing is more straightforward. At the very least, information should be obtained, where possible, from the growing number of national and local health reports, describing patterns of mortality, morbidity and other health-related measures (Busse et al., 2007).
The set-up in Slovenia, with the HIIS as single payer, lends itself quite well to estimating population health needs and using them to good effect. This is in contrast to systems where multiple payers compete and purchase

Slovenia Purchasing and payment review 24
on the same territory. Often these health assessments are done for a particular subcomponent of the health system, such as primary care or emergency services. There are not many countries in Europe with similar systems to the Slovenian one that have carried out a system-wide health needs assessment. Perhaps Estonia, where a revised purchasing strategy is gradually being implemented, could provide a possible trajectory for Slovenia. The Estonian Health Insurance Fund (EHIF), a single purchaser on behalf of 1.4 million people, estimates population need for health services based on historical patient-level service utilization (see Box 1). The HIIS has individual patient-level data available that should make such estimations possible. In Estonia, several challenges remain, however. The process of establishing actual population need may still be biased towards historical supply factors and future refinements in methodology will be necessary in order to make better estimates.
Planning a provider networkTo rationalize the provider network, many countries have sought to define a network of (public) providers allowed to operate on their territory with the ultimate aim of restructuring and optimizing the delivery system. Especially countries with a Soviet legacy in their health system inherited bloated hospital sectors and large regional disparities between the numbers of provider and specialties available per population. These are mostly the result of historical supply-side and political factors rather than differences in medical need and changing demographics.
Several countries have implemented strategies, to rationalize the provider network. Internationally, the 2007 Danish hospital reform is often used as an example (see Box 2). The Danish policy aims to attain the highest quality of care by centralizing specialized interventions into fewer locations. It is based on the assumption that
Regulation targeted at
Examples
Citizens’ participation and purchasers’ accountability
• availability of information from purchasers about access to health services
• formal participation of citizen representatives on purchasing boards
• patients’ rights legislation stipulating what citizens can expect from purchasers
• complaint mechanismsMonitoring purchas-ers’ performance
Insurance role
• guaranteeing equitable and efficient behaviour
• mandatory insurance
• income-related contributions or community-rated premiums
Purchasing role
• ensuring operation within a fixed budget
• a standardized package of benefits
• government participation on purchasing boards.Contractual relationships between providers and purchasers
• framework and rules for collective contracting
• specifying the roles of the various partners, including purchasers, associations of providers, professional organizations and the government
• establishing the details of the contracting process, including negotiation and litigation rules
• specific rules and procedures for contracting include requirements for access to information for purchasers and providers as well as the right of purchasers to evaluate the implementation of contractual provisions
• quality standards
• payment-system requirements
• price regulation via national tariffs by unit of outputProviders • measures affecting strategic planning
• technology and licensing
• certification and accreditation
Table 4Regulatory purchasing framework
Source: Adapted from Figueras, Jakubowski & Robinson, 2005; Busse et al., 2007.

Slovenia Purchasing and payment review 25
there is a positive correlation between high frequency of a given intervention and the quality of its delivery. This rationale is also ref lected in the recent strategic purchasing reform in Estonia (see Box 3). It should be noted, however, that a recent systematic review showed that this relationship is so far inconclusive (Mesman et al., 2015). Obviously, concentrating care in fewer locations has other advantages relating to synergy effects and cost. In Slovakia, comprehensive reform in the early 2000s introduced a minimum network requirement which sought to find a middle way between market forces and government control (see Box 4).
All cases have in common that they do not rely on a single strategy, but are built around two main instruments to rationalize the network: (1) a strict concession and network planning system based on health needs, and (2) (selective) contracting. Currently, the HIIS cannot contract selectively. This ref lects the situation in most other countries (exceptions include Estonia, the Netherlands, the United Kingdom), which use their licensing or concession system to control the network. However, in Slovenia the concession system is not strictly controlled or based on health needs. What is more, there seems to be some scope to rationalize the hospital network in Slovenia, mainly evidenced by a very low acute bed occupancy rate (68.9%) compared to the EU15 (75.9%) and EU13 (73.0%) (in 2011) (WHO 2015) and inequities in access. Perhaps the fact that in Slovenia the state is the owner of hospitals could be an advantage, although local communities effectively blocked earlier reform plans. In many other countries, plans to restructure hospitals (e.g. mergers, closures, changes in capacity and specialties)
often succumb to local resistance as local governments own hospitals and resist reform (e.g. Lithuania, Slovakia, Switzerland).
Linking contracting with planningEstablishing a purchasing strategy based on meaningful information on health needs is the starting point of the contracting process (Duran et al., 2005). More emphasis should be placed on requiring the HIIS to develop strategic (long-term, e.g. 3–5 year) and operational (annual) purchasing plans. This will signal the intentions of the HIIS by setting out service requirements, (hard) budget constraints and performance targets. They will also enable providers to produce their own business plans and long-term goals. The contracting cycle continues with purchasers identifying providers, followed by negotiating contracts, reaching agreement through a standardized procedure (within a previously defined timeline), and then managing and monitoring those contracts.
Many countries, among them several of the new EU Member States have problems finding the appropriate balance between government stewardship and the roles of purchasers and providers in negotiating contracts’ main parameters, such as activities (e.g. number of patients treated, surgeries performed), payment methods and selection of providers. In some countries, the government determines these parameters (Busse et al., 2007). Slovenia is among them, especially in cases when the Ministry of Health has to step in to arbitrate and decides over such issues as service provision, scope, prices and extra funding. This affects the authority, the autonomy and effectiveness of the HIIS as purchaser. In the United Kingdom, legally binding contracts have replaced service-level agreements, which means that disputes are no
Box 1Estimation of population health needs in Estonia
The EHIF estimates population need for health services based on historical patient-level service utilization by specialties and by counties, but limiting this to –/+10% of the Estonian average. Additionally, some regional characteristics, such as population density (regions with higher population density have higher outpatient care shares compared to inpatient care), are included. In practice, high-density regions may be 6% above the Estonian average while low-density regions may be 11% below the Estonian average. Thus if average population need is 100, the variation may range between 90 and 110 in a county with average population density. If the county is high-density, population need may be as high as (100 + 10 + 6 = 116), while in a low-density county this number could be as low as (100 – 10 –11 = 79). With this information, the needed levels of service provision are calculated, taking into account patient mobility between counties and evaluated against geographical accessibility criteria. These criteria define which services should be available in which location (see Box 3). This results in an estimation of service volumes needed per specialty and county. The EHIF then uses this as a basis for negotiations with hospitals (Habicht, Habicht & van Ginneken, 2015).
Example: Estimating the need for outpatient gastroenterology care in Tartu County Using historical patient-level utilization patterns in Estonia adjusted to the Estonian average and adjusted for regional characteristics, the estimated need for outpatient gastroenterology care (a third level specialty thus only available in four counties including Tartu) of the population living in Tartu County was 3473 treatment cases in 2014. Of this need, 3376 treatment cases are provided in Tartu County while the rest go to another county. In addition, 2197 treatment cases were provided to patients living in a county that does not have to provide these services and thus have to travel to Tartu County. In total, the need for gastroenterology in Tartu County is 5573 (3376 + 2197) treatment cases. The Hospital Network Development Plan (HNDP) hospital in Tartu is able to cover 4096 treatment cases (based on historical data and hospital’s own assessment), which leaves a remaining need of 1477 treatment cases. An average patient has 1.6 visits, lasting 20 mins (⅓ hr). This means 1477 × 1.6 visits × ⅓ hr = 788 hr. The optimal workload per one full-time equivalent (FTE) is 225 days × 7 hr = 1575 hr per year. This implies that the remaining workload is 788/1575 = 0.5 FTE, i.e. the minimum amount for the EHIF to start a public tender (Habicht, Habicht & van Ginneken, 2015).

Slovenia Purchasing and payment review 26
Box 2The Danish hospital network reform, 2007
The main aims for the Danish reform were cost control (although €3 billion in implementation costs has been invested) and the perception that larger catchment areas were needed to support future specialization and to secure structural adjustments. The National Board of Health, a body under the Ministry of Health, envisaged reducing the number of acute care hospitals from around 40 in 2006 to between 20 and 25 in 2015. This was based on the assumption that a catchment area of between 200 000 and 400 000 persons was needed to secure quality and rationalize staffing.
The National Board of Health issued a report in 2007 aimed at guiding the regional planning process of acute care, including pre-hospital treatment. The report, for example, suggested the establishment “joint acute wards” at acute care hospitals and the placement of four trauma centres across the country. In these joint acute wards, emergency and acute patient admissions are organized in one ward (Olejaz et al., 2012).
The process was managed by the National Board of Health. It may issue binding guidelines on specialty planning. The 2007 Health Act gave the Board the authority to approve or reject applications from health care providers, public or private, to perform specialized treatments or diagnostic procedures. In practice, each region and each private provider submits a specialty plan detailing the placement of different specialized functions (treatment or diagnostic procedures). A total of 1100 different specialized functions have been identified.
The specialty planning guidelines are based on reports to an advisory committee from groups of representatives from the relevant medical societies and the regions. The committee then advises the National Board of Health on the distribution of specialized functions. The National Board of Health monitors the functions and has the possibility to revoke approvals (Olejaz et al., 2012).
For each clinical medical specialty in the hospital sector and hospital dentistry (family medicine, public health and forensic medicine are not included in the specialty plan), a division is made to group interventions/treatments in basic, regional and highly specialized interventions. Basic interventions take up, on average, 90% of the functions, but this number varies greatly. Thoracic surgery, for example, has only highly specialized interventions while geriatrics has none. A guiding principle has been to have regional functions performed at one to three hospitals in each region and highly specialized functions at one to three hospitals in the country. Some diseases are so rare that they cannot be treated or even diagnosed with adequate experience in a small country like Denmark. For these patients there is the possibility of receiving treatment outside the country (Olejaz et al., 2012).
One consequence of the process of specialty planning has been a further centralization of specialized functions; this has resulted in the closure of smaller facilities and longer distances for citizens to travel to providers. Despite these issues and popular dissatisfaction, there has been broad political and professional support for the process of speciality planning and the guiding principle of the need for centralization for quality reasons (Olejaz et al., 2012).
Box 3The optimization of the hospital sector in Estonia
In Estonia the optimization of the provider network is mostly the result of the interaction between the HNDP, commissioned and adopted by the Ministry of Social Affairs in 2003) and the (selective) purchasing process carried out by the EHIF. The 2003 HNDP was defined with financial support from the World Bank and drafted by Swedish consultants, and aimed to plan an efficient future hospital network. Among others, it categorized hospitals into regional, central, general and local according to the range of services provided, and required that a hospital should be within 60 mins travel time by car (70 km). The EHIF is required to contract all HNDP hospitals (19 state- or municipality-owned acute care hospitals working under private law). The negotiation process determines the volume of care these hospitals are allowed to provide in a certain location. HNDP hospitals provide outpatient and inpatient specialist care but also nursing care and some dental care. The rationale behind this is that these hospitals need to be contracted to guarantee geographical access to a minimum level of specialist care and 24/7 emergency care (Lai et al., 2013). The remainder of care is purchased selectively.
The plan, however, did not succeed in overcoming regional disparities and therefore the EHIF has recently started to develop its own geographical access criteria, used in its purchasing process. For example, in specialist care, four levels of access were defined for outpatient specialist care, which closely relate to the complexity of the care and disease prevalence (see
fig. below). The first level includes rare and very complex care that is made accessible in one location in Estonia – Tallinn or Tartu (e.g. organ transplantations). Services at the second level have to be accessible in two locations – Tallinn and Tartu (e.g. oncology, cardiac surgery, neurosurgery, vascular surgery). At the third level there are services that have to be available in the four biggest counties – Tallinn, Pärnu, Tartu and Ida-Viru (e.g. urology, endocrinology, gastroenterology, cardiology, rheumatology, neurology, orthopaedics, pulmonology). The fourth level includes the most common care types and includes specialties that have to be accessible at county level (e.g. general surgery, otorhinolaryngology, ophthalmology, gynaecology, dermatovenerology, psychiatry) (Habicht, Habicht & van Ginneken, 2015).
Level 1transplantation
Tallin OR Tartu
Level 4general surgery;internal diseases;otorhinolaryngology;ophtalmology;gynaecology;dermatovenerology;psychiatry;rehabilitation
All counties
Level 3urology;endocrinology;gastroenterology;cardiology;rheumatology;neurology;orthopaedics;pulmonology;paediatrics;infectious diseases
Tallinn, Pärnu,Tartu and Ida-Viru
Level 2cardiac surgery;paediatric surgery;neurosurgery;maxillofacial surgery;thoracic surgery;vascular surgery;haematology;other nephrology;oncology
Tallin AND Tartu
Inreasing complexity of care
Declining disease prevalence
low
high
Acce
ssib
ility
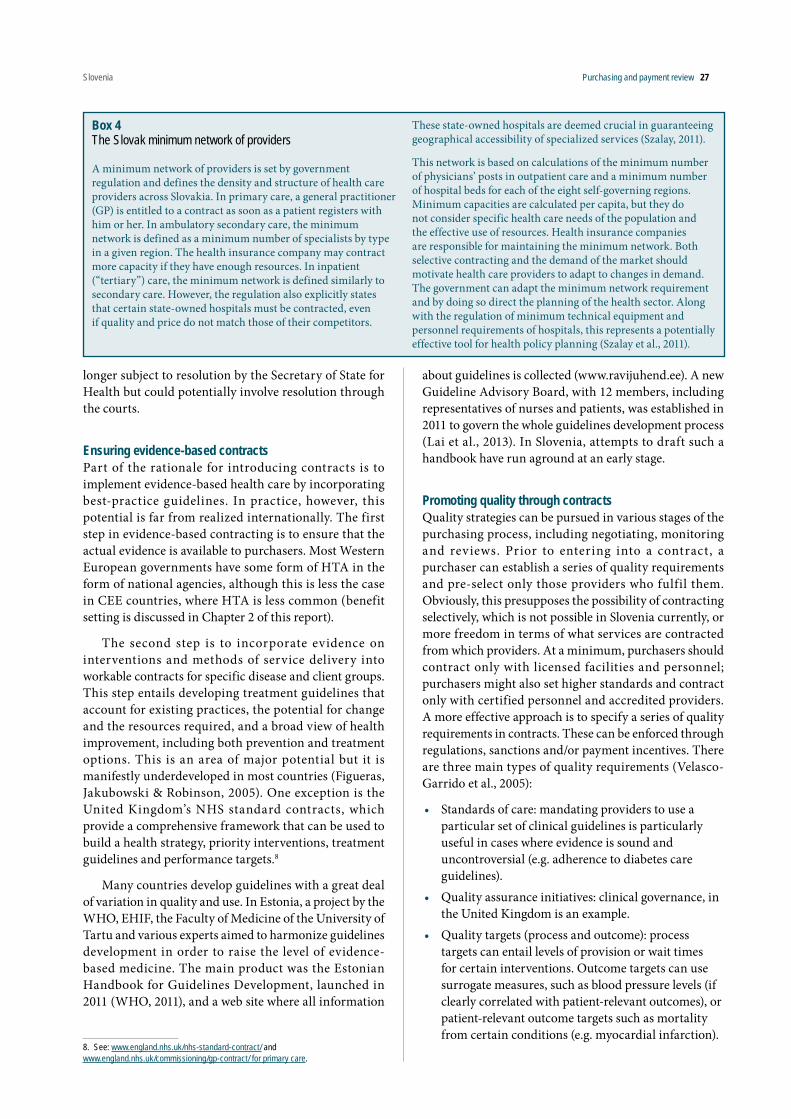
Slovenia Purchasing and payment review 27
longer subject to resolution by the Secretary of State for Health but could potentially involve resolution through the courts.
Ensuring evidence-based contractsPart of the rationale for introducing contracts is to implement evidence-based health care by incorporating best-practice guidelines. In practice, however, this potential is far from realized internationally. The first step in evidence-based contracting is to ensure that the actual evidence is available to purchasers. Most Western European governments have some form of HTA in the form of national agencies, although this is less the case in CEE countries, where HTA is less common (benefit setting is discussed in Chapter 2 of this report).
The second step is to incorporate evidence on interventions and methods of service delivery into workable contracts for specific disease and client groups. This step entails developing treatment guidelines that account for existing practices, the potential for change and the resources required, and a broad view of health improvement, including both prevention and treatment options. This is an area of major potential but it is manifestly underdeveloped in most countries (Figueras, Jakubowski & Robinson, 2005). One exception is the United Kingdom’s NHS standard contracts, which provide a comprehensive framework that can be used to build a health strategy, priority interventions, treatment guidelines and performance targets.8
Many countries develop guidelines with a great deal of variation in quality and use. In Estonia, a project by the WHO, EHIF, the Faculty of Medicine of the University of Tartu and various experts aimed to harmonize guidelines development in order to raise the level of evidence-based medicine. The main product was the Estonian Handbook for Guidelines Development, launched in 2011 (WHO, 2011), and a web site where all information
8. See: www.england.nhs.uk/nhs-standard-contract/ and www.england.nhs.uk/commissioning/gp-contract/ for primary care.
about guidelines is collected (www.ravijuhend.ee). A new Guideline Advisory Board, with 12 members, including representatives of nurses and patients, was established in 2011 to govern the whole guidelines development process (Lai et al., 2013). In Slovenia, attempts to draft such a handbook have run aground at an early stage.
Promoting quality through contracts Quality strategies can be pursued in various stages of the purchasing process, including negotiating, monitoring and reviews. Prior to entering into a contract, a purchaser can establish a series of quality requirements and pre-select only those providers who fulfil them. Obviously, this presupposes the possibility of contracting selectively, which is not possible in Slovenia currently, or more freedom in terms of what services are contracted from which providers. At a minimum, purchasers should contract only with licensed facilities and personnel; purchasers might also set higher standards and contract only with certified personnel and accredited providers. A more effective approach is to specify a series of quality requirements in contracts. These can be enforced through regulations, sanctions and/or payment incentives. There are three main types of quality requirements (Velasco-Garrido et al., 2005):
• Standards of care: mandating providers to use a particular set of clinical guidelines is particularly useful in cases where evidence is sound and uncontroversial (e.g. adherence to diabetes care guidelines).
• Quality assurance initiatives: clinical governance, in the United Kingdom is an example.
• Quality targets (process and outcome): process targets can entail levels of provision or wait times for certain interventions. Outcome targets can use surrogate measures, such as blood pressure levels (if clearly correlated with patient-relevant outcomes), or patient-relevant outcome targets such as mortality from certain conditions (e.g. myocardial infarction).
Box 4The Slovak minimum network of providers
A minimum network of providers is set by government regulation and defines the density and structure of health care providers across Slovakia. In primary care, a general practitioner (GP) is entitled to a contract as soon as a patient registers with him or her. In ambulatory secondary care, the minimum network is defined as a minimum number of specialists by type in a given region. The health insurance company may contract more capacity if they have enough resources. In inpatient (“tertiary”) care, the minimum network is defined similarly to secondary care. However, the regulation also explicitly states that certain state-owned hospitals must be contracted, even if quality and price do not match those of their competitors.
These state-owned hospitals are deemed crucial in guaranteeing geographical accessibility of specialized services (Szalay, 2011).
This network is based on calculations of the minimum number of physicians’ posts in outpatient care and a minimum number of hospital beds for each of the eight self-governing regions. Minimum capacities are calculated per capita, but they do not consider specific health care needs of the population and the effective use of resources. Health insurance companies are responsible for maintaining the minimum network. Both selective contracting and the demand of the market should motivate health care providers to adapt to changes in demand. The government can adapt the minimum network requirement and by doing so direct the planning of the health sector. Along with the regulation of minimum technical equipment and personnel requirements of hospitals, this represents a potentially effective tool for health policy planning (Szalay et al., 2011).
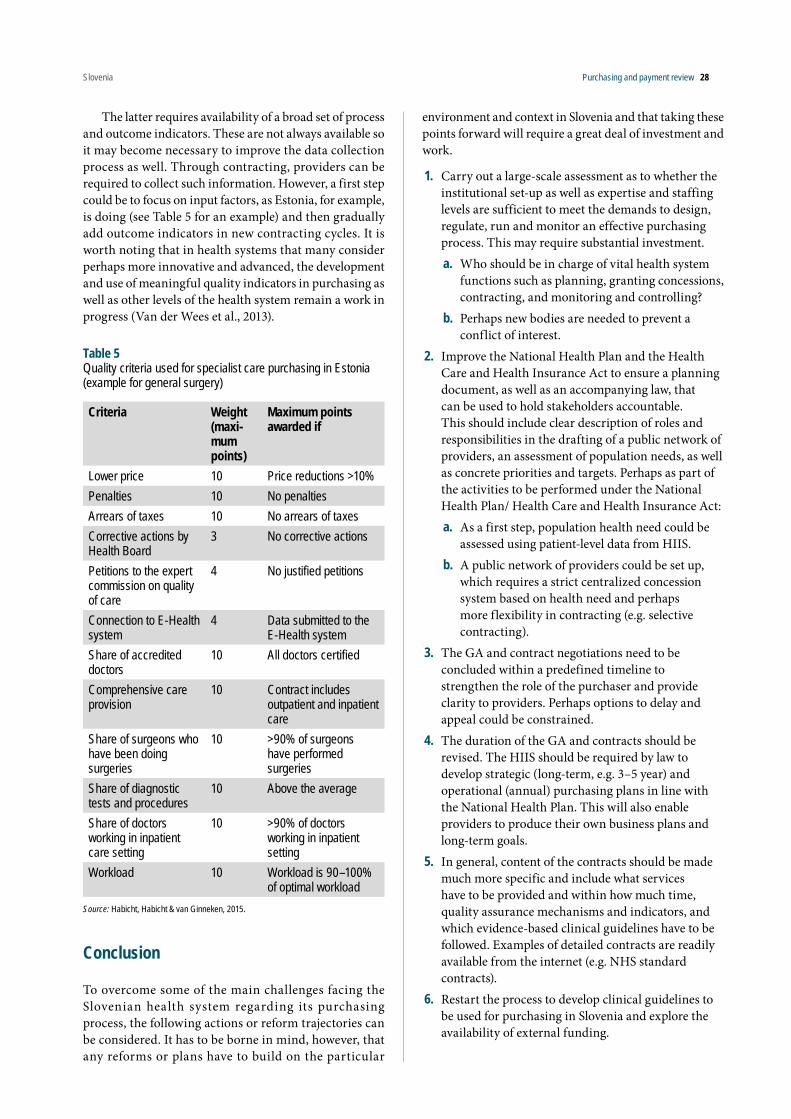
Slovenia Purchasing and payment review 28
The latter requires availability of a broad set of process and outcome indicators. These are not always available so it may become necessary to improve the data collection process as well. Through contracting, providers can be required to collect such information. However, a first step could be to focus on input factors, as Estonia, for example, is doing (see Table 5 for an example) and then gradually add outcome indicators in new contracting cycles. It is worth noting that in health systems that many consider perhaps more innovative and advanced, the development and use of meaningful quality indicators in purchasing as well as other levels of the health system remain a work in progress (Van der Wees et al., 2013).
Table 5Quality criteria used for specialist care purchasing in Estonia (example for general surgery)
Criteria Weight (maxi-mum points)
Maximum points awarded if
Lower price 10 Price reductions >10%Penalties 10 No penaltiesArrears of taxes 10 No arrears of taxesCorrective actions by Health Board
3 No corrective actions
Petitions to the expert commission on quality of care
4 No justified petitions
Connection to E-Health system
4 Data submitted to the E-Health system
Share of accredited doctors
10 All doctors certified
Comprehensive care provision
10 Contract includes outpatient and inpatient care
Share of surgeons who have been doing surgeries
10 >90% of surgeons have performed surgeries
Share of diagnostic tests and procedures
10 Above the average
Share of doctors working in inpatient care setting
10 >90% of doctors working in inpatient setting
Workload 10 Workload is 90–100% of optimal workload
Source: Habicht, Habicht & van Ginneken, 2015.
Conclusion
To overcome some of the main challenges facing the Slovenian health system regarding its purchasing process, the following actions or reform trajectories can be considered. It has to be borne in mind, however, that any reforms or plans have to build on the particular
environment and context in Slovenia and that taking these points forward will require a great deal of investment and work.
1. Carry out a large-scale assessment as to whether the institutional set-up as well as expertise and staffing levels are sufficient to meet the demands to design, regulate, run and monitor an effective purchasing process. This may require substantial investment. a. Who should be in charge of vital health system
functions such as planning, granting concessions, contracting, and monitoring and controlling?
b. Perhaps new bodies are needed to prevent a conflict of interest.
2. Improve the National Health Plan and the Health Care and Health Insurance Act to ensure a planning document, as well as an accompanying law, that can be used to hold stakeholders accountable. This should include clear description of roles and responsibilities in the drafting of a public network of providers, an assessment of population needs, as well as concrete priorities and targets. Perhaps as part of the activities to be performed under the National Health Plan/ Health Care and Health Insurance Act:a. As a first step, population health need could be
assessed using patient-level data from HIIS.b. A public network of providers could be set up,
which requires a strict centralized concession system based on health need and perhaps more flexibility in contracting (e.g. selective contracting).
3. The GA and contract negotiations need to be concluded within a predefined timeline to strengthen the role of the purchaser and provide clarity to providers. Perhaps options to delay and appeal could be constrained.
4. The duration of the GA and contracts should be revised. The HIIS should be required by law to develop strategic (long-term, e.g. 3–5 year) and operational (annual) purchasing plans in line with the National Health Plan. This will also enable providers to produce their own business plans and long-term goals.
5. In general, content of the contracts should be made much more specific and include what services have to be provided and within how much time, quality assurance mechanisms and indicators, and which evidence-based clinical guidelines have to be followed. Examples of detailed contracts are readily available from the internet (e.g. NHS standard contracts).
6. Restart the process to develop clinical guidelines to be used for purchasing in Slovenia and explore the availability of external funding.

Slovenia Purchasing and payment review 29
7. Strengthen the purchasing role of the HIIS as independent body purchasing on behalf of the people of Slovenia:a. define competences vis-à-vis the Ministry of
Health and the governmentb. reassess the government’s role in arbitration with
regard to the GA and contractsc. explore putting in place an arbitration system
through the judicial system or another independent body (e.g. ombudsman)
d. consider the introduction of selective contractinge. introduce hard budget constraints enforced by
the HIIS.
8. Consider including patient groups in the GA negotiation, to help focus discussions on quality of care instead of financing and shortfalls.
9. Improve information systems so that they mandate, collect and make available meaningful information for use by all stakeholders to enable effective purchasing.
References
Busse R et al. (2007). Strategic purchasing to improve health system performance: key issues and international trends. Healthcare Papers, 8 (Spec. no.): 62–76.
Duran A et al. (2005). Purchasers, providers and contracts. In: Figueras J, Jakubowski E, Robinson R, eds. Purchasing to improve health systems performance. Maidenhead, Open University Press.
Figueras J, Jakubowski E, Robinson R, eds. (2005). Purchasing to improve health systems performance. Maidenhead, Open University Press.
Habicht T, Habicht J, van Ginneken E (2015). Strategic purchasing reform in Estonia: reducing inequalities in access while improving care concentration and quality. Health Policy, 119(8):1011–1016.
Hunter DJ, Shishkin S, Taroni F (2005). Steering the purchaser: stewardship and government. In Figueras J, Jakubowski E, Robinson R, eds. Purchasing to improve health systems performance. Maidenhead, Open University Press.
Lai T et al. (2013). Estonia: health system review. Health Systems in Transition, 15(6):1–196. Review.
Mesman R et al. (2015). Why do high-volume hospitals achieve better outcomes? A systematic review about intermediate factors in volume–outcome relationships. Health Policy, 119(8):1055–1067.
Olejaz M et al. (2012). Denmark: health system review. Health Systems in Transition, 14(2):i–xxii, 1–192.
Preker AS et al. (2007). Public ends, private means: strategic purchasing of health services. Washington, DC, World Bank.
Saltman RB, Ferroussier-Davis O (2000). The concept of stewardship. Bulletin of the World Health Organization, 78(6): 733–739.
Szalay T et al. (2011). Slovakia: health system review. Health Systems in Transition, 13(2):v–xxiii, 1–174.
Velasco-Garrido M et al. (2005). Purchasing for quality of care. In: Figueras J, Jakubowski E, Robinson R, eds. Purchasing to improve health systems performance. Maidenhead, Open University Press.
WHO (2011). Estonian handbook for guidelines development. Geneva, World Health Organization.
WHO Regional Office for Europe (2015). WHO European Health for All database (HF-DB) [offline database]. Copenhagen, WHO Regional Office for Europe (http://www.euro.who.int/hfadb).

Slovenia Purchasing and payment review 30
4 Payment for health care services and physicians
Introduction
This chapter looks at the payment systems for health care services (inpatient services, secondary ambulatory services and primary care services) and for physicians in Slovenia and highlights the main problems that have been identified with the current payment systems. We provide information on experiences from other countries, which may help to overcome the identified problems concerning the payment systems in Slovenia.
Payment for acute inpatient care
There are 26 public hospitals in Slovenia, including two major tertiary institutions (University medical centres Ljubljana and University medical centres Maribor), 10 general hospitals, 4 specialized tertiary institutions (the Oncological Institute, the Rehabilitation Institute, the University Clinic Golnik, the University Psychiatric Clinic Ljubljana) and 10 other specialized hospitals. In addition, there are three small private facilities with a concession to provide public inpatient services. In 2011, there were 369 acute care hospital beds per 100 000 population in Slovenia, which was slightly below the EU28 average (385 per 100 000) but slightly above the average in countries that were EU Member States before 2004 (345 per 100 000) (WHO Regional Office for Europe, 2015). The number of discharges per 100 population and average length of stay (ALOS) was slightly above the EU average (16.1 discharges in Slovenia compared to 15.9 in the EU28 and an ALOS of 6.7 days in Slovenia compared to 6.4 in the EU28), while the occupancy rate was relatively low (69% in Slovenia compared to 76% in EU28).9
Current payment systemHospital payment is based on provider-level budgets, which are negotiated between the HIIS and each provider. If HIIS and the provider do not reach an agreement, a process of arbitration is started and the final contract specifying the budget is adopted by HIIS, the provider and the Ministry of Health. Usually contract negotiations do not take place until well into the year for which the budget is negotiated because negotiations can start only after the GA (which determines, among others, the national-level budget and the volume of services) has been concluded. In fact, the GA predetermines the individual provider contract to a large extent. Negotiations for the GA are
9. There is an inconsistency in the data because the calculated occupancy rate based on the reported number of discharges, ALOS and number of beds would be 79%.
always extremely difficult – and the ultimate decision is usually taken by the government of Slovenia (see Chapter 3 The purchasing process).
Hospital budgets are defined on the basis of the budget for the previous year (plus potential change determined in negotiation process), and they take into consideration the different departments and types of services provided. Budgets are defined in terms of the total number of DRG weights and the total number of cases for which the hospital will receive reimbursement from HIIS. In theory, hospitals receive DRG-based case payments per treated patient and they are very rarely paid for DRGs provided in excess of the agreed DRG-based budget. However, in practice, hospitals receive every month one-twelfth the annual budget and they usually treat patients also after having reached the DRG-based budget cap. Many hospitals reach the agreed budget for DRG weights well before the end of the year (e.g. early/mid-November), although some hospitals may have difficulties using up their budget.
Hospital budgets are quite soft: First, complementary insurance always pays its share (14%) of DRG-based case payments, as well as for DRGs provided in excess of the agreed budget. Second, in times of favourable economic conditions, if the HIIS has more resources than estimated at the beginning of the year, hospitals may negotiate additional funds to cover (part of the) expenditures for those DRGs provided in excess of the budget. Third, the government, as the owner of most hospitals, has ultimate responsibility for deficits and outstanding bills of hospital suppliers; and hospital debts of about €150 million have currently accumulated. In the past, the government has sometimes covered accumulated hospital debts but this is not done automatically or on a systematic basis. Finally, dialyses, transplantations, cancer surgery and some other services are exempted from the DRG-based budget cap.
DRGs were introduced in 2004 based on an imported version of Australian Refined (AR-) DRGs in order to better measure hospital activity, to enable DRG-based case payment and to improve hospital management. In 2013, a new version (AR-DRG 6.0) was imported from Australia, which is currently only used for the classification of patients, while payments continue to be made on the basis of the previous version (AR-DRG 4.2) because a transfer to the new system would lead to large (unexplained) discrepancies in the allocated budgets. At the end of the year, when the balance is drawn up of the monthly budget instalments against hypothetical DRG-based case payments, these payments are valued on the basis of imported Australian cost weights. There is no adjustment of DRG-based payments for day cases, or short- and long-stay outliers. Also, there is no adjustment for readmissions or (re-)transfers – each case is counted separately. Finally, control of reported case (DRG billing) data by HIIS is impaired because there are only very
Slovenia Purchasing and payment review 31
few medical reviewers (monitoring coded data) and no controls of medical documentation in hospitals – although there are some controls by complementary health insurance.
Institutional responsibilities for adjusting/updating DRGs and adjusting/updating cost weights are not sufficiently clear. National cost weights cannot be calculated (except for a small number of DRGs, where normative cost estimates were made) because there are no standardized rules for cost accounting. This is an important problem because imported (and potentially inadequate) cost weights will lead to overpayment for some DRGs and underpayment for others. Also, the financial statements of hospitals are not sufficiently detailed to be used for the adjustment of cost weights. Up to 2009, the base rate, which converts DRG weights into monetary values, was determined on the basis of the available budget and the estimated national inpatient activity (in terms of DRG weights) for the coming year. Since 2009, the base rate in the current year is determined by taking the base rate in the previous year with some minor adjustments, such as for inflation. University hospitals have a higher base rate in order to compensate for the higher costs of teaching. Payments are the same for public and private providers, although public hospitals may benefit from additional funds for investments in infrastructure.
Main problems
• Insufficient institutional support for keeping the DRG system up to date: Responsibilities for adjusting and updating both the definitions of DRGs and DRG cost weights are not sufficiently clear. There is no national DRG institution and the Ministry of Health does not have sufficient capacity to keep the system up to date.
• Imported (and potentially inadequate) cost weights: National cost data for adjusting or updating DRG weights is not available because cost accounting and data collection in hospitals is not standardized. Even the financial statements of hospitals are not sufficiently standardized and detailed to allow an adjustment of cost weights to the national context.
• Weak incentives for increased efficiency: Hospital management has only weak incentives to increase the number of cases by making more efficient use of available infrastructure (e.g. by increasing the number of day cases or reducing length of stay) because budgets are capped. At the same time, hospital management may accept higher costs of care (e.g. for expensive technologies) because ultimate financial responsibility for deficits is borne by the government.
International experiences
Institutions responsible for keeping DRG systems up to dateCountries rely on very different institutional arrangements for adjusting and updating DRG systems. Table 6 provides an overview of the institutions that are responsible for the development of DRGs and for national cost accounting standards in nine countries. In most countries, different institutions are responsible for the development of the DRG system and for cost accounting standards. However, in Germany, responsibilities for both have always been under the roof of the Institute for the Hospital Reimbursement System (InEK). In the Netherlands and Ireland, responsibilities were recently merged within one institution as countries are increasingly realizing the need for standardized high-quality cost data as an important input for maintaining and updating their DRG systems.
Particularly interesting is that Estonia and Sweden, as well as some other Nordic countries (e.g. Finland, Latvia, Norway – not shown in Table 6) collaborate in the development of DRGs through their Nordic Casemix Centre based in Helsinki (Linna & Virtanen, 2011). This collaboration started during the mid-1990s, when several countries were struggling with the problem of converting their national or imported DRG systems to ICD-10 codes. Countries then joined their efforts to develop a common DRG system that would replace existing national systems and imported DRG systems from abroad. However, the approach is very f lexible as countries have often produced national versions of the common system, and DRG weights are always calculated separately for each country. Slovenia could potentially join efforts with other countries that use AR-DRGs in Europe, such as Bosnia and Herzegovina, Bulgaria, Croatia, Ireland, Macedonia, Romania and Serbia.
Cost accounting for adjusting and updating cost weightsThe availability of high-quality hospital cost information is essential for developing and updating DRG systems and for ensuring fair DRG-based hospital payment systems. If hospital cost information does not allow differences to be identified between costs of individual patients, it is impossible to use a data-driven approach to develop economically homogeneous DRGs. In addition, if hospital cost information is imprecise, calculated weights for certain DRGs could be falsely estimated to be higher or lower than they really are and, consequently, hospitals will be over- or underpaid for specific DRGs. Therefore, the fairness of DRG-based hospital payment systems and the ability of these systems to encourage efficiency are to a large extent determined by the quality of the hospital cost information used to develop these systems and to calculate DRG weights.

Slovenia Purchasing and payment review 32
Countries that have imported DRG systems from abroad often start by adjusting imported DRG weights to the local cost context, using highly aggregated cost accounting data and a set of internal DRG cost weights. For example, in Spain (Cots et al., 2011b), imported All-Patient (AP)-DRG weights are adjusted using cost data from a relatively simple top-down allocation of hospital costs to 11 “partial cost centres” (operating room; radiology; laboratory; pharmacy; medical services; intensive care; other hospitalization costs; other intermediate hospitalization costs; medical staff; functional costs; overheads). Costs per DRG can then be calculated using data on the number of cases (Nj) in each DRG (DRGj) and a set of internal DRG cost weights (Wi-j) (see Table 7). A similar approach is also used for adjusting imported AR-DRG weights to national cost data in Ireland (O’Reilly, McCarthy & Wiley, 2011). For this purpose, Irish cost data is allocated to 13 cost centres (allied health; critical care; coronary care unit; emergency; imaging; pathology; medical pay; prosthesis; nursing; pharmacy; theatre operating procedures; theatre non-operating procedures; and blood) and DRG weights are adjusted using internal service weights for cost centres based on Australian cost data.
Adjusting imported DRG weights to national cost data is a first step to improve the adequacy of DRG weights. However, in the long run, most countries attempt to improve hospital cost accounting systems in order to obtain patient-level cost information, which is not only better for the calculation of accurate and reliable DRG weights but also for improved hospital management. For example, in Germany, patient-level cost data are collected from a sample of about 10% of German hospitals that follow cost accounting guidelines developed by InEK. This approach allows making adjustments to the DRG system on the basis of information about the distribution of costs for individual patients and it allows hospital managers to benchmark hospital costs (for a detailed set of cost modules) against the sample average (see Table 8).
An interesting approach for the collection of cost data is used in the Netherlands, where resource-use data (number of bed days, number and type of lab tests, types of surgical procedures) are collected from all hospitals (assuring representativeness of the data), while unit costs using bottom-up micro-costing come only from a small sample of hospitals (thus reducing the costs of data collection) (Tan et al., 2011).
Strengthening incentives for efficiencyThere are many options for making use of DRGs with the aim of increasing efficiency. One option is to use DRGs for the allocation of a national or regional budget. For example, in Ireland (O’Reilly et al., 2011), the national hospital budget is allocated to hospitals on the basis of their previous activity as measured by AR-DRGs (e.g. in
2012 it was allocated based on the AR-DRGs provided in 2010 and the first half of 2011). Consequently, hospitals have an incentive to provide more DRGs as this will give them a larger share of the national hospital budget. This has the advantage of increasing incentives for productivity (incentivizing hospitals to deliver more services), while keeping the size of the national budget under control of the payer.
Another option is to increase the importance of DRG-based case payments and to reduce the importance of hospital budgets. Currently, DRG-based case payments do not play an important role in determining the overall budget size in Slovenia as most hospitals reach their DRG-based budget cap well before the end of the year. If the budget cap was changed into a target budget and hospitals were allowed to provide services beyond the budget, hospitals would have a stronger incentive to increase the number of treated patients (although the strength of the incentive could be reduced by applying a lower base rate for DRGs provided in excess of the budget, e.g. 35% of the normal base rate, as in Germany). While DRG-based case payments potentially create stronger incentives for productivity, a disadvantage is that it reduces macro-level budgetary control.
It is important to carefully manage a transition to stronger financial incentives for hospitals on the basis of DRGs as increasing the strength of incentives for efficiency can also have unintended consequences (Cots et al., 2011a). Therefore, most countries gradually increase the strength of DRG-based incentives during a transition period and the effects are carefully monitored. In addition, DRG-based payments in Slovenia are currently operated without a number of (relatively simple) refinements that have been introduced in other countries:
• First, there is no mechanism for outlier adjustments. In almost all other European countries with DRG-based payments, these payments are usually adjusted for both long-stay outliers (daily surcharges) and short stay outliers (daily deductions) as well as for day cases (Cots et al., 2011a).
• Second, there is no system for annually recalibrating the average DRG cost weight to 1 in order to ensure that upcoding does not lead to continuously increasing cost weights.
• Third, there are only weak controls in Slovenia over hospital activity and hospital coding, but these controls become increasingly important if the strength of DRG-based incentives is increased.
• Fourth, there is no system for monitoring and managing readmissions in Slovenia, while other countries, such as Germany, England or the United States have introduced policies to counter incentives for higher readmissions (Kristensen, Bech & Quentin, 2015).

Slovenia Purchasing and payment review 33
Payment for outpatient (specialized ambulatory) services
Specialist ambulatory services in Slovenia are mostly provided by hospital outpatient departments and health centres. In addition, some specialists in private offices have a concession to provide public services. For each specialty, norms define technical (e.g. equipment) and staffing requirements for a specialist team, usually consisting of one specialist, one nurse and an administrative support worker.
Current payment systemBudgets for specialist teams are negotiated between providers and the HIIS after the GA has been negotiated and on the basis of the annexes of the agreement. It is possible that a provider negotiates a budget for a specialist team, which is not (or nor longer) present. For example, a hospital might negotiate a full budget for a cardiology team, even if it does not have (or no longer has) a full-time employment contract with a cardiologist. Alternatively, a provider may only secure, for example, one-third of the budget for a cardiology team if patient needs in the catchment area do not require a full team to be present. The size of the budget for each specialist team differs depending on the specialty (e.g. cardiology, neurology or orthopaedics) because of differences in labour, material and infrastructure costs, and is mostly based on historic cost data. However, the budget is the same for all teams within a given specialty in the country.
Each provider has to bill services on the basis of a fee-for-service (FFS) catalogue (colloquially known as the “Green Book” – although officially termed “list of services”) but total annual reimbursement is limited by the negotiated budget. In fact, just as for hospital care, providers receive each month one-twelfth of their annual budget. If the HIIS has more funds at the end of the year than originally estimated, providers might be able to negotiate additional resources for services provided in excess of the agreed budget. In addition, just as for hospital care, complementary voluntary health insurance always pays its share of costs, including for services provided in excess of the agreed budget. Furthermore, larger providers (hospital outpatient departments and health centres) might be able to bill the services of one specialist team to the budget of another specialist team (within the same specialty), in order to use up the available budgets.
The Green Book was originally developed during socialist times with the aim of measuring physician activity. It was not developed with the aim of defining an FFS provider payment system. Nevertheless, there have been only rather minor updates of the Green Book because stakeholders are jointly responsible for updating payment systems in Slovenia and they generally fail to reach an agreement on proposed changes (see Chapter 3, The purchasing process). In general, fees are defined in terms of a certain number of points, which are based on very rarely updated historic estimates of costs and time. The actual fee level is determined during the process of annual negotiations, which defines a point value in euros.
Jurisdictions Institution responsible for DRGs Institution responsible for cost accounting standards
Canada (Quebec)
Ministry of Health Ministry of Health
Denmark DRG office at the National Board of Health The Danish Ministry of Health (Ministeriet for Sundhed of Forebyggelse)
England National Health Service Information Authority Healthcare Financial Management Association (HFMA)Estonia Nordic Casemix Centre Estonian Health Insurance Fund (EHIF)France ATIH (Agence technique sur l’information hospitalière) Direction générale de l’offre des soinsGermany Institute for the Hospital Reimbursement System
(InEK)Ireland Health Pricing OfficeItaly Central office in the Ministry of Health and regional
officesMinistry of Health
Netherlands Dutch Health Care Authority – Nederlandse Zorgautoriteit
Sweden Nordic Casemix Centre in cooperation with the Swedish National Board of Health and Welfare
National Board of Health and Welfare in cooperation with the Swedish Association of Local Auhorities and Regions
Table 6Institutions responsible for DRGs and cost accounting in nine countries

Slovenia Purchasing and payment review 34
CC1 . . . CCi . . . CC11
DRG1 . . . DRGj . . . DRG886
N1 * W1-1
Nj * W1-j N886 * W1-886
N1 * Wi-1
Nj * Wi-j N886 * Wi-886
N1 * W11-1
Nj * W11-j N886 * W11-886
Total weighted activity Unit cost 1 to 11 Cost per DRGj
TW1 = Σ(Nj * Wi=j) UC1 = TCOST1 / TW1 CDRGj = Σ(UCi* Wi-j)
TWi = Σ(Nj * W1-j) UCi = TCOSTi / TWi
TW11 = Σ(Nj * W11-j ) UC11 = TCOST11/ TW11
Table 7Calculation of costs per DRG using internal DRG weights
CCi is a partial cost centre
Wi-j is the internal (partial) DRG weight for DRGj and the partial cost centre CCi
Nj is the total number of patients classified into DRGj
TCOSTi is the total cost for the partial cost centre CCi
UCi is the unit cost for the internal (partial) cost weight Wi
CDRGj is the cost in Euros for DRGjSource: Cots et al., 2011b.
Source: Authors’ own compilation based on InEK, 2010.Note: InEk – Institut für das Entgeltsystem im Krankenhaus (Institute for the Hospital Reimbursement System).
Table 8Average hospital cost of DRG I47B in cost data sample of InEK

Slovenia Purchasing and payment review 35
There are several problems with the billing of services on the basis of the Green Book. First, definitions of the (about 2000) billable FFS items and the billing rules are not sufficiently clear, leaving ample room for creative billing practices and complicating controls by HIIS. Second, the structure of the fee catalogue defines for each specialty a basic fee, which can be billed only once per visit and covers all services that are part of a normal visit, and a number of additional billable services, which differ across specialties. This leads to excessive referrals if a certain service is included in the basic fee for one specialist but can be billed separately by another specialist. Third, fee levels for similar services provided by different specialists differ enormously (e.g. the fee for the excision of a skin lesion is ten times higher for surgeons than for dermatologists), and this – again – leads to excessive referrals. Fourth, fee levels do not adequately reflect the costs of service provision and some fees are overvalued while others are undervalued.
Main problems
• Malfunctioning institutional arrangements for revising and updating the FFS catalogue: There is no institution that has primary responsibility for managing the FFS catalogue and joint responsibility of stakeholders leads to deadlock blocking updates and revisions of the FFS system.
• Weak incentives for efficiency: Provider-level budget caps that are easily reached with the help of creative billing practices do not incentivize providers to deliver services and to attract patients.
International experiences
Updating FFS systemsInstitutional arrangements for updating FFS systems vary greatly across countries. Table 9 provides an overview of the distribution of responsibilities for developing fee schedules and updating relativities and base values across countries. Despite considerable variation, one common feature across countries is that responsibility for developing and updating the FFS systems is split between, on the one hand, responsibility for determining the catalogue and defining and updating relativities (points or weights) for individual services and, on the other hand, determining the base value, which converts relativities into monetary values. Usually associations of specialists play an important role for the definition of the FFS catalogue and for relativities relevant to services provided
by their specialty. For the definition of the base value, the payers play a more important role, often negotiating the base value with providers.
In Germany and Switzerland, a joint institution of payers and providers is responsible for developing and updating the FFS catalogue. However, in both countries, the federal government has the right to intervene if the institution is in deadlock and does not reach a decision. In addition, in Germany, institutional deadlock is prevented by regulations that allow either payers or providers to demand the inclusion of three neutral voting members on the relevant committee, who have to be nominated jointly by payers and providers.
In France, the Netherlands and the United States (Medicare system), a national authority exists, which is chief ly responsible for the development of the fee catalogue. However, the bulk of the work of defining fees and relativities relies on input from specialist medical associations, with each specialist organization responsible for fees applicable to its specialty field. National authorities usually follow the advice of the specialist organizations as the definition of fees and relativities affects only the distribution of funds across specialists (and sometimes only within a particular specialty) but not the overall level of funds. The system for defining relativities of the FFS catalogue in the Netherlands is described in Box 5.
Developing and maintaining an FFS system is highly complex as FFS catalogues often consist of several thousand individual billing codes. More advanced FFS systems (e.g. in Germany or Switzerland) specify for each code a set of billing rules, which define: (1) the types of services that are covered by the code, (2) the types of providers that are eligible for billing (possibly including specific technical qualifications), (3) the allowed frequency of billing the code for the same patient (e.g. during the same session or over a defined period of time), (4) the types of other services that can be billed together with the code during the same session, (5) if services can be provided only under particular conditions, for example during certain times of the day, after referral by a particular specialist, and so on.
An alternative approach to an FFS system for billing of specialist outpatient services is the extension of DRG systems to outpatient care. In countries, such as England, Finland and Sweden, specific DRGs exist for outpatient care and each patient treated by an outpatient department is grouped on the basis of the diagnosis and/or procedure and certain other types of information into the applicable DRG. Usually, the number of DRGs is much smaller than in traditional FFS systems. For example, in Sweden, there are 335 outpatient DRGs in addition to 157 day surgery DRGs, 29 day medicine DRGs and 18 DRGs for endoscopies. Extending the DRG system to outpatient care has two important advantages: First, it bundles together different services provided during an outpatient visit

Slovenia Purchasing and payment review 36
into one “product” that is defined on the basis of patient and treatment characteristics. Second, it harmonizes the payment system across sectors, which may contribute to better aligned incentives. Third, it facilitates updates of the system, as these can be carried out by the same institution and following the same approach as for updates of the inpatient DRG system.
Incentives for efficiency or productivity Eff iciency and productiv ity incentives could be strengthened by various approaches, which have been applied in different countries. One option, which used to be the approach for payment of ambulatory physicians in Germany, is to remove the provider-level budget cap and to replace it by a macro-level (national or regional) budget for ambulatory specialist services. Each individual provider would be allowed to provide an unlimited amount of services. Each service would be billed on the basis of the points system of the FFS catalogue. However, the monetary value for a point would be determined only retrospectively (at the end of the quarter or year), when the total available budget could be divided by the total amount of service points provided by all providers. Consequently, providers who deliver more services would obtain a larger share of the total budget. A disadvantage of the system from the perspective of the providers is that they do not know their budget until the end of the billing period, and that their reimbursement depends on total activity of all ambulatory providers in the country or region.
A modified version of this approach, similar to the one described for the Netherland in Box 5 and currently in use in Germany, would be to define the budget at the level of each specialty. This has the advantage that major discrepancies in payment of providers across specialties can be avoided. In many countries, fees are often considerably more profitable in some specialties (usually in more procedure-oriented specialties) than in others because fees are not adjusted fast enough when technological advances lead to lower costs for certain services – and this leads to large differences in revenues across specialties. Another advantage of this approach is that payment of an individual provider does not depend on total activity of all providers but only on activity of providers practising within the same specialty. If one provider engages in excessive provision of services or inappropriate billing, this will influence only specialists within the same specialty. Ideally, such a payment system would be combined with mechanisms that allow specialists to monitor the behaviour of their peers and to discipline inappropriate behaviour.
Yet another option would be to use a system of differentiated budgets, which would be similar to the system used currently in the Czech Republic and in Germany. For example, a provider-level budget could be
defined for a standard amount of services, for example the average amount of services provided by specialists of that specialty. Providers would then be allowed to bill FFS at a standard rate until they had used up their budget. In addition, they would be allowed to bill additional services, which would be reimbursed at a progressively lower rate, e.g. 70% for exceeding the budget by up to 5%, 50% for exceeding the budget by up to 10% and so on. Furthermore, certain specialized services could be exempted from the provider-level budget but could be limited by an overall specialty-level budget, which would again ensure that specialists have a collective interest in reducing excessive increases of these services. Finally, certain high-priority services could be exempted from both budgets to further incentivize provision of these services.
Payment for primary care
Primary care services in Slovenia are mostly provided by health centres, known as local public health centres, where about 60% of all primary care physicians (mostly GPs but also paediatricians and gynaecologists) work as employees. There are 57 public health centres and 978 private providers that work through concessions (HIIS data for 2014). About 40% of primary care physicians are self-employed and about half of these rent premises in health centres, while the other half work in their own private offices. As for secondary care services, norms define staffing requirements for primary care teams concerning staff (e.g. one physician, one nurse and one administrative assistant) but there are no controls to verify if these requirements are (still) met.
Current payment systemJust as for secondary care, budgets for primary care teams are negotiated between providers and the HIIS on the basis of the GA (with minimal room for real negotiations because the contract is more or less predetermined by the GA). In a first step, the HIIS determines the number of programmes (one programme = one primary care team) to provide services for the population in the catchment area of the health care unit. For example, if the population of the area is 20 000 people, then the number of the programmes assigned to the unit is 11.1 programmes.
In a second step, the budget for one programme is calculated in such a way that it covers the costs of salaries for a primary care team as specified by the staffing norms as well as average costs of buildings, equipment, lab tests, insurance, cleaning and so on. Budgets are somewhat different for GPs, paediatricians and gynaecologists, because staffing norms differ. However, individual primary care teams may or may not comply with the norms and there are no controls to verify if, for example, a

Slovenia Purchasing and payment review 37
Responsible institutions Regularity of updatesFrance FFS catalogue French National Health Insurance Fund
(NHIF) in collaboration with specialist societies – each responsible for fees applicable to its specialty
Irregular, 10 amendments between 2011 and the beginning of 2014
Base value Negotiated between NHIF and physi-cians
Last update in 2005
Germany FFS catalogue Valuation Committee of the Federal Joint Committee, consisting of representatives of SHI funds and SHI physicians – if these cannot reach an agreement, the Committee can be extended to include three neutral voting members. Ultimately the federal government has the right to intervene
Irregular, last major revision of FFS catalogue in 2009, multiple minor adjustments since then
Base value Negotiated between regional Associa-tions of SHI Funds and regional Associations of SHI Physicians
Annually
Switzerland FFS catalogue A joint company representing payers and providers (TARMED Suisse) develops the FFS catalogue, if payers and providers cannot reach an agreement, the Federal government has the right to intervene
Irregular; 18 revisions since the introduc-tion of the FFS system in 2003 until the beginning of 2014
Base value Negotiated between Mandatory Health Insurance Companies and providers (cantonal associations of physicians and hospitals)
Annually
The Netherlands
FFS/DRG catalogue DRG catalogue determined by the Netherlands Healthcare Authority (NZA). Until 2015, the relativities for the fee part of each DRG were determined by committees of medical specialists
Irregular
Base value Calculated on the basis of the national budget
Annually
USA (Medicare)
FFS catalogue The American Medical Association maintains the billing codes and incorpo-rates recommendations by specialty soci-eties; pricing decisions are made by the Centers for Medicare & Medicaid Services (CMS) on the basis of advice from the specialty societies
Prices of the FFS catalogue are updated annually
Base value Parliament Annually
Table 9Institutional responsibilities for FFS systems and regularity of update
Source: Authors’ own compilation based on Quentin et al., 2014.Notes: SHI – social health insurance.

Slovenia Purchasing and payment review 38
GP practising in his private office with a concession from HIIS actually employs a nurse and an administrator as assumed by the staffing norms.
Actual payment of primary care providers (within the budget) then consists of a mix of capitation and FFS. Primary care providers receive a certain number of capitation points, which depends on the number of registered patients and their age (3 capitation points [CP] for <1 year of age; 1.9CP for 1–6.99 years; 0.88CP for 7–18.99 years; 0.84CP for 19–49.99 years; 1.4CP for 50–64.99 years; 2.2CP for 65–74.99 years; and 3CP for >75 years). The euro value per capitation point is determined by dividing the national primary care budget by the total number of capitation points (for the total number of insured).
The budget for GPs is calculated for a total of 2400 capitation points (representing on average 1800 patients), and amounts to €116 670. Budgets for paediatricians and gynaecologists are calculated slightly differently. Primary care providers receive capitation points for every registered patient. The sum total of all capitation points for registered patients determines the total budget volume both for capitation payments and for FFS payments.
Providers may refuse to accept patients after having reached 110% of the average number of capitation points but some providers accept considerably more patients (up to 3000, which allows them to achieve higher incomes). If a provider does not reach 2400 capitation points, payment is below the budget as defined by the norm. In theory, however, a physician can compensate for a lower number of patients by providing more (billable) services in order to obtain the full budget (although this does not happen often). In addition, since 2005, when a preventive programme was introduced, providers may obtain the full budget if they perform the required preventive work, regardless of the number of curative services provided.
Primary care providers bill FFS on the basis of the GA standards for the family medicine office, including, for example, the short visit fee (1.50 quotients), the first curative visit fee (3.60 quotients), the follow-up visit fee (2.30 quotients), and the comprehensive assessment fee (2.80 quotients). One quotient is worth between €2.50 and €3.00, depending on the value of the total annual budget for family doctors. FFS income represents on average less than 50% of total income of primary care providers. In addition, as most primary care providers reach their budget cap very easily through the provision of billable services, there are only limited incentives for the provision of services.
Main problems
• Inadequate age weighting of capitation payments: As age weighting is not based on current utilization or cost data, the age weighting is thought to be inadequate. In particular, the number of capitation points for old age (3CP for >75) is perceived to be too low, when compared with capitation points for children (3CP for <1).
• Limited incentives for service provision and quality of care: As the budget cap for FFS income is easily reached by primary care providers, there are only limited incentives to provide services and payments do not depend on quality of care.
International experiences
Weighting of capitation payments Almost all countries that use capitation payments for primary care physicians apply some kind of age adjustment although they differ concerning the exact definition of age
Box 5Determining fee levels in the Netherlands
In the Netherlands, the DRG system is used for the payment of all services provided by specialists and resembled until recently – at least to a certain extent – FFS systems used in other countries. It is developed by the Netherlands Health Authority on the basis of cost data from hospitals, taking into account suggestions of specialists and hospitals. A reform in 2012 introduced a new system for determining fee levels of specialists – or, more precisely, the honorarium component of each DRG. The reform introduced a national specialist budget and delegated responsibility for determining relativities for the honorarium component of each DRG to the Association of Medical Specialists. The approach consists of several steps:
1. The national budget for services provided by self-employed specialists is divided between the 26 specialties based on
the number of FTE of specialists per discipline with some minor corrections.
2. Specialists’ committees can suggest altering the relativities of the fee schedule and may suggest introducing new DRGs. Their suggestions can be based on their own time studies or, usually, on expert opinion, or a consensus that some DRGs are relatively over- or underrated compared to others.
3. The budget for each specialty is then divided by the total service points provided by all specialists belonging to that specialty in the previous year, with the total points calculated on the basis of the adjusted fee levels.
This calculation leads to a base value, which is used over the course of the year for the payment of specialists. However, a new reform is scheduled to abolish the definition of fee levels for specialists altogether. Instead, specialists will have to negotiate their payment with hospitals.
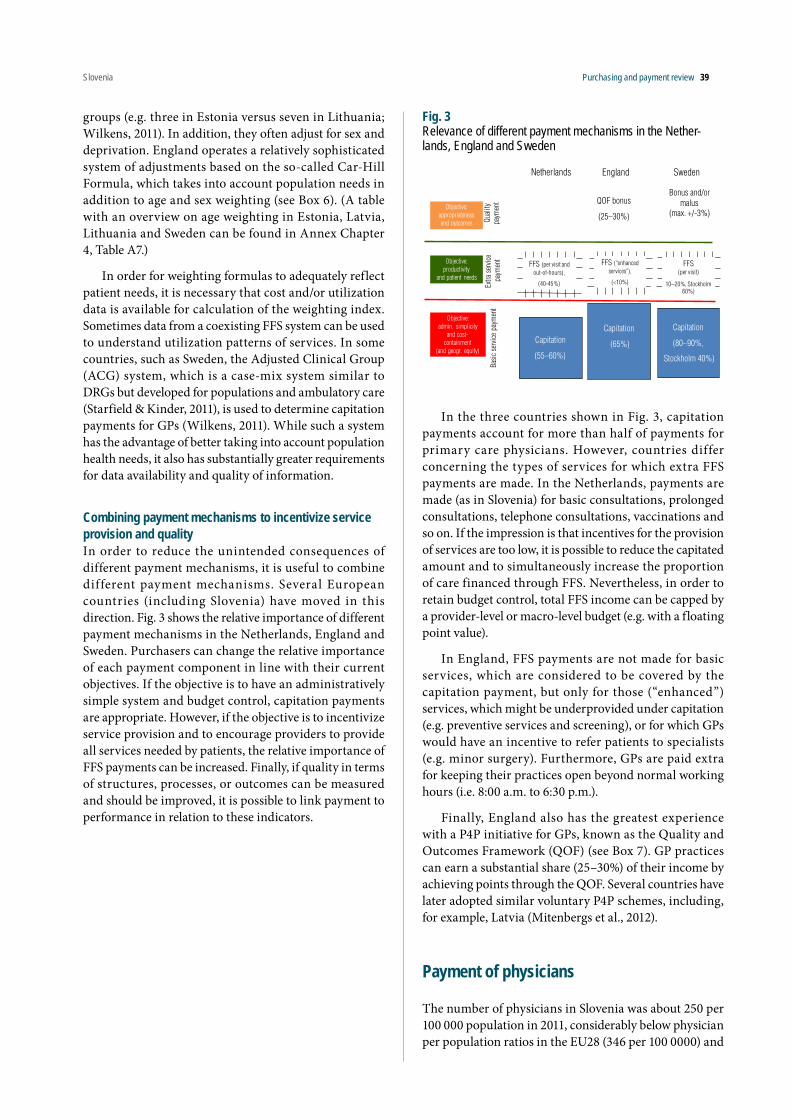
Slovenia Purchasing and payment review 39
groups (e.g. three in Estonia versus seven in Lithuania; Wilkens, 2011). In addition, they often adjust for sex and deprivation. England operates a relatively sophisticated system of adjustments based on the so-called Car-Hill Formula, which takes into account population needs in addition to age and sex weighting (see Box 6). (A table with an overview on age weighting in Estonia, Latvia, Lithuania and Sweden can be found in Annex Chapter 4, Table A7.)
In order for weighting formulas to adequately reflect patient needs, it is necessary that cost and/or utilization data is available for calculation of the weighting index. Sometimes data from a coexisting FFS system can be used to understand utilization patterns of services. In some countries, such as Sweden, the Adjusted Clinical Group (ACG) system, which is a case-mix system similar to DRGs but developed for populations and ambulatory care (Starfield & Kinder, 2011), is used to determine capitation payments for GPs (Wilkens, 2011). While such a system has the advantage of better taking into account population health needs, it also has substantially greater requirements for data availability and quality of information.
Combining payment mechanisms to incentivize service provision and qualityIn order to reduce the unintended consequences of different payment mechanisms, it is useful to combine different payment mechanisms. Several European countries (including Slovenia) have moved in this direction. Fig. 3 shows the relative importance of different payment mechanisms in the Netherlands, England and Sweden. Purchasers can change the relative importance of each payment component in line with their current objectives. If the objective is to have an administratively simple system and budget control, capitation payments are appropriate. However, if the objective is to incentivize service provision and to encourage providers to provide all services needed by patients, the relative importance of FFS payments can be increased. Finally, if quality in terms of structures, processes, or outcomes can be measured and should be improved, it is possible to link payment to performance in relation to these indicators.
Fig. 3Relevance of different payment mechanisms in the Nether-lands, England and Sweden
Capitation
(55–60%)
Objective: appropriatenessand outcomes
Objective: productivity
and patient needs
Objective: admin. simplicity
and cost-containment
(and geogr. equity)
Basi
c se
rvic
e pa
ymen
tEx
tra s
ervi
cepa
ymen
tQu
ality
pa
ymen
t
EnglandNetherlands Sweden
FFS (per visit and out-of-hours),
(40-45%)
Capitation
(65%)
Capitation
(80–90%,
Stockholm 40%)
Bonus and/ormalus
(max. +/-3%)QOF bonus
(25–30%)
FFS (per visit)
10–20%, Stockholm 60%)
FFS (“enhanced services”),
(<10%)
In the three countries shown in Fig. 3, capitation payments account for more than half of payments for primary care physicians. However, countries differ concerning the types of services for which extra FFS payments are made. In the Netherlands, payments are made (as in Slovenia) for basic consultations, prolonged consultations, telephone consultations, vaccinations and so on. If the impression is that incentives for the provision of services are too low, it is possible to reduce the capitated amount and to simultaneously increase the proportion of care financed through FFS. Nevertheless, in order to retain budget control, total FFS income can be capped by a provider-level or macro-level budget (e.g. with a floating point value).
In England, FFS payments are not made for basic services, which are considered to be covered by the capitation payment, but only for those (“enhanced”) services, which might be underprovided under capitation (e.g. preventive services and screening), or for which GPs would have an incentive to refer patients to specialists (e.g. minor surgery). Furthermore, GPs are paid extra for keeping their practices open beyond normal working hours (i.e. 8:00 a.m. to 6:30 p.m.).
Finally, England also has the greatest experience with a P4P initiative for GPs, known as the Quality and Outcomes Framework (QOF) (see Box 7). GP practices can earn a substantial share (25–30%) of their income by achieving points through the QOF. Several countries have later adopted similar voluntary P4P schemes, including, for example, Latvia (Mitenbergs et al., 2012).
Payment of physicians
The number of physicians in Slovenia was about 250 per 100 000 population in 2011, considerably below physician per population ratios in the EU28 (346 per 100 0000) and

Slovenia Purchasing and payment review 40
slightly below the average in EU Member States that joined the EU after 2004 (275 per 100 000). The ratio of GPs per population was also considerably below the EU average (45 versus 79 per 100 000) but similar to the average of EU Member States that joined the EU after 2004 (46 GPs per 100 000). The proportion of GPs out of all physicians was above the average proportion in countries that joined the EU in 2004 (about 18% versus 17%), although below the average proportion in the EU28 (almost 23%).
Current payment systemMost physicians in Slovenia (GPs and specialists) are public employees, paid according to the civil servants’ pay scale. Only about 10% of specialists in ambulatory care and 40% of GPs are self-employed. In addition, about 10% of specialists have a second contract with another (public or private) institution besides their full-time employment contract. Furthermore, salaried GPs and specialists may engage in private practice if approved by hospital management or the Ministry of Health – but this does not constitute a major source of income for physicians.
Physician salaries depend mostly on qualifications and seniority. The lowest salary is paid for physicians during specialization training (minimum salary grade 36: €1715 per month), while the maximum salary is paid for specialists with several years of experience (maximum salary grade 57: €3814) (see Table 10). Employees can be promoted in the same workplace for 10 grades. The salary is up to 12% higher for some specialties (depending on the minimum duration of specialization training). The salary
grade depends on so-called special working conditions, for example, working in an department, the operating room or intensive care units and so on.
Table 10Salary range for physicians in Slovenia
Qualification status
Salary bracket
Salary grade at the
beginning
Salary grade with seniority
promotionDuring specialist training
VII/2 36–43 (€1 715–2 244)
46–53 (€2 516–3 280)
Without specialization
VII/2 40–45 (€2 001–
2 422)
50–55 (€2 929–
3 537)Specialists VIII 41–53
(€2 079–3 280)
51–57 (€3 042–
3 814)
In addition to the base salaries, physicians can receive a certain amount of performance-related pay. This may include:
• payment for extra hours (often contributing a substantial share to total income)
• a supplement for more intensive work in the public sector (up to 20%), for example, if a physician has to stand in for an absent colleague or if three specialists
Box 6The Carr-Hill Capitation Formula in England
The Carr-Hill Formula has been used in England since 2003 but has undergone some adjustments over time. The formula is intended to allocate resources fairly to primary care practices by adjusting allocations for factors that influence relative needs and costs, including:
• age and sex structure of the patient population (see details below),
• the proportion of the population that live in nursing and residential homes (those patients tend to cause a higher workload because consultations always involve travel time,
• additional care needs of the population, relating to morbidity and mortality (as measured by survey data on standardized limited long-standing illnesses and standardized mortality ratio for those aged <65),
• additional work effort related to changes in the practice population (new patients tend to require a higher workload) and
• factors outside the control of providers that lead to higher costs, for example higher wage costs and rurality (population density).
In order to account for the age and sex structure of the population, the formula includes a system of 14 age-sex bands with cost weights attached to each band. Cost weights of age-sex bands were calculated on the basis of data from a sample of GP practices. However, the data only provided information on the duration of consultations within the practice and had to be adjusted for the average duration of home visits and the number of home visits (based on survey data).
Age–sex workload index (males aged 5–14 = 1) for United Kingdom except Scotland
0–4 5–14 15–44 45–64 65–74 75–84 85+
Male 3.97 1 1.02 2.15 4.19 5.18 6.27
Female 3.64 1.04 2.19 3.36 4.9 6.56 6.72
Source: BMA/NHS Employers, 2007.

Slovenia Purchasing and payment review 41
supply four programmes or if a primary care facility provides a non-integer number of programmes (e.g. 11.1 programmes)
• a seniority supplement (in addition to the seniority based grade in the salary system)
• payment for on-call or stand-by hours• an outdoor work supplement• a mentor’s allowance• * a supplement for scientific qualifications
(“specialist”, Masters, PhD)• an allowance for bilingualism• an allowance for specific risks (e.g. X-ray exposure)• an allowance for working less favourable hours
(shift work).
The most important supplementary income for specialists consists of payment for extra hours worked, which are, however, often only “equivalent hours”. The concept of “equivalent hours” means that specialists who work “very quickly” might receive, for example, payment for 40 hours of work even if they have worked only 30 hours. Obviously, this system leaves substantial f lexibility for local agreements as it always depends on individual negotiations whether local managers agree to pay 40 equivalent hours for 30 hours of work. In addition, equivalent hours are the currency for second job contracts, where specialists are usually paid a fixed amount of equivalent hours for doing a certain amount of work, for example, a certain number of endoscopies.
The problem with the current payment system is that the civil service pay scale is considered to be inadequate for physicians. Payment is thought to be too low and to provide insufficient incentives for productivity and
quality. The system of equivalent work hours is a work-around to enable individual negotiations, which are officially prohibited. However, the system is highly non-transparent and often leads to the absence of physicians from their workplace, once they feel that they have fulfilled their obligation of 40 equivalent hours of work. In addition, payment for GPs is perceived to be too low and to provide insufficient incentives for physicians to specialize in family medicine. Furthermore, GPs cannot participate in the system of equivalent hours.
Main problems
• Rigidity of the civil servant pay scale: Physician payment has to follow the civil service pay scale but this prohibits finding satisfactory arrangements for rewarding performance of physicians. The common practice of paying for “equivalent hours” substitutes for adequate payment, but is highly non-transparent and often leads to absence from the workplace.
• Insufficient incentives for productivity and quality: The pay scale for physicians does not sufficiently incentivize productivity and quality, and local arrangements for managing physicians are based on non-transparent agreements.
• Insufficient remuneration of primary care physicians: Primary care is considered to be unattractive because of perceived relatively low pay.
Box 7The QOF for GPs in England
The QOF was introduced in 2004 and provides substantial financial incentives to GPs for reaching predefined quality targets (Gillam & Steel, 2013). Participation in the QOF is not obligatory for GP practices, but most do. In 2013/2014, GP performance was measured against a total of 121 indicators and practices could achieve a maximum of 900 points. The indicators included structural, process and outcome indicators, and were grouped into five domains (HSCIC, 2015):
1. 93 clinical indicators, mostly covering chronic conditions (e.g. chronic kidney disease, heart failure, hypertension) worth up to a maximum of 610 points.
2. Nine public health indicators across four clinical areas – blood pressure, cardiovascular disease, primary prevention, obesity and smoking (e.g. the percentage of smokers with an offer of support and treatment to quit smoking).
3. Nine public health–additional services indicators across four service areas, including cervical screening (e.g. the
percentage of eligible women with a cervical screening test in the previous five years), child health surveillance, contraception and maternity services.
4. Nine indicators for quality and productivity (e.g. concerning implementation of care pathways, participation in external peer review).
5. One indicator for patient experience, which relates to length of consultations (i.e. routine booked consultations should not be less than 10 min).
GP practices can earn QOF points by reaching a predefined quality threshold on each indicator, and each QOF point translates into a monetary value. In the first years after implementation (2004), the income of GPs increased significantly as practices reached on average 83% of the points and increased their income up to 25%. In subsequent years, the government set up higher performance criteria to make it more difficult for GPs to achieve the targets and to earn the bonus. There has been substantial debate about whether payments really reflect better quality or if they are just the result of better recording of information, and there have been concerns about practices gaming the system (Gillam & Steel, 2013).

Slovenia Purchasing and payment review 42
International experiences
Negotiation of physician salariesSalaries of physicians in most countries are negotiated between associations of physicians and associations of providers. It is unusual that they are part of the normal public sector pay scale. Table 11 provides an overview of salary systems for specialists working in hospitals in Canada, England, Germany, the Netherlands, Sweden, Switzerland and the United States.
In Canada, France, Germany, the Netherlands and Switzerland collective negotiations between associations of physicians and associations of hospitals determine salary levels. In England, the salary level is fixed by the Department of Health based on recommendations by an independent review body (the Review Body on Doctors’ and Dentists’ Remuneration, DDRB). In Sweden and the United States, salary levels depend on individual negotiations. Individual negotiations (for salaries above the collective contract) are also permitted also in Germany, the Netherlands and Switzerland.
Just as in Slovenia, the most important factor inf luencing salary levels in most countries is the experience of physicians, which is usually defined in terms of years worked. In countries with a strong hierarchical organization of specialists in hospitals, such as France, Germany, and Switzerland, a physician’s position in the hierarchy is another important factor determining salary levels. In the Netherlands, taking on certain management functions is associated with a higher income but this does not imply a hierarchical relationship.
Managing physicians and providing incentives for productivity and qualityIn Sweden and the United States, where salaries are based on individual negotiations, the ability to negotiate higher salaries contributes to f lexibility in the management of physicians, as physicians working in particular specialties or in rural areas can be paid a higher salary. Furthermore, specific qualifications of physicians or their popularity may also play a role during negotiations. In the United States, where services of specialists are paid for on the basis of FFS, employed specialists usually receive a substantial part of their salary in the form of bonuses related to their individual productivity (as measured by earned FFS income for the provider). This effectively counters the problem of inadequate activity but can be problematic because the incentives of such a system mimic those of FFS systems (possibly leading to overprovision of services).
In countries with hierarchical relationships, the recognition of efforts by more senior colleagues can be an important mechanism to motivate more junior colleagues. In addition, because specialists belonging to higher levels
in the hierarchy receive higher salaries, there is a strong incentive for specialists to move up the hierarchy. Because promotion to a higher level is dependent on a multitude of factors and will take several years, the incentive to move up the hierarchy can provide long-term motivation for greater effort.
In England, where there is no hierarchical relationship among specialists in hospitals, all specialists are required to have an agreed job plan, which is specified in terms of four-hour sessions. Each session is specified in terms of the activity (inpatient care, outpatient care, administrative tasks, research, etc.), the time when that activity is performed and where it takes place. Having such a plan helps managers and physicians to work together and it strengthens accountability. In order to motivate physicians, an important part of salaries in England consists of clinical excellence awards. They constitute the most systematic attempt at financially rewarding physician achievements in relation to prevention, care, research and/or teaching (see Box 8).
GP and specialist incomeThe income of GPs and specialists in Slovenia is in the middle range of incomes in European countries. Figs 4a and 4b show, based on Organisation for Economic Co-operation and Development (OECD) data, that average incomes for physicians in Slovenia are at about US$ PPP 80 400 for GPs and US$ PPP 80 600 for specialists. They are considerably higher than incomes of physicians in all Eastern European countries for which data are available, and also above some Western European countries, such as Finland. Furthermore, GPs earn 2.26 times more than the average wage in Slovenia, which is among the highest ratios of countries for which data are available.
There is some concern among Slovenian experts that these data are incorrect. This is because the average salary shown in the OECD database is equivalent to the maximum salary obtainable for GPs according to the salary scale. Slovenian experts say that GPs are generally grouped into the salary scale at a level that is below that of other specialists who have completed their training. Furthermore, as the lower salary is combined with a lower potential for earnings through equivalent hours, lower reimbursement is said to be an important reason why family medicine is unattractive.
Nevertheless, focusing on payment of GPs alone is unlikely to solve the problem of insufficient numbers of GPs. In other countries, training of GPs has been scaled up and improved with the aim of obtaining more and better qualified GPs. Better training, including through structured training programmes, also leads to greater prestige of GPs who will be recognized as physicians with broad and substantial knowledge. Furthermore, comparable training requirements for GPs and specialists

Slovenia Purchasing and payment review 43
would be an important argument to support the demand of GPs to be grouped at the same level of the salary scale as other specialists.
Furthermore, working conditions of GPs could be improved through a reorganization of out-of-hours emergency care services and by sharing the workload among a higher number of trained GPs. The number of active GPs has already increased by 34% between 2005 and 2013, which should ultimately translate into a lower workload for GPs (WHO Regional Office for Europe, 2015). In addition, the proportion of GPs out of all physicians has increased in Slovenia from 16% in 2005 to 19% in 2013. Both of these figures seem to suggest that working as a GP is, in fact, not totally unattractive.
Figs 4a and 4bAverage incomes of GPs and salaries in European OECD countries (in US$ PPP and GP salaries per average wage), 2013 unless specified otherwise
0 50 000 100 000 150 000 200 000 250 000 300 000
Hungary (2013)
Estonia (2014)
Poland (2012)
Slovak Republic (2012)
Sweden (2002)
Finland (2013)
Slovenia (2013)
United Kingdom (2012)
Spain (2014)
Netherlands (2013)
Luxembourg (2013) 253 444.04278 427.94
143 156.1686 428.48
95 983.0882 974.69
112 871.4481 139.1080 625.1980 417.96
112 550.1778 161.72
71 110.2962 555.67
48 865.54
36 214.7147 767.71
49 803.2536 909.53
46 015.2534 712.70
Specialistsalaries
GP salaries
0 1 2 3 4 5
Hungary
Estonia
Netherlands (2012)
United Kingdom (2012)
Finland
Spain
Poland (2012)
Slovak Republic
Sweden (2002)
Slovenia
Luxembourg
Source: OECD, 2015.
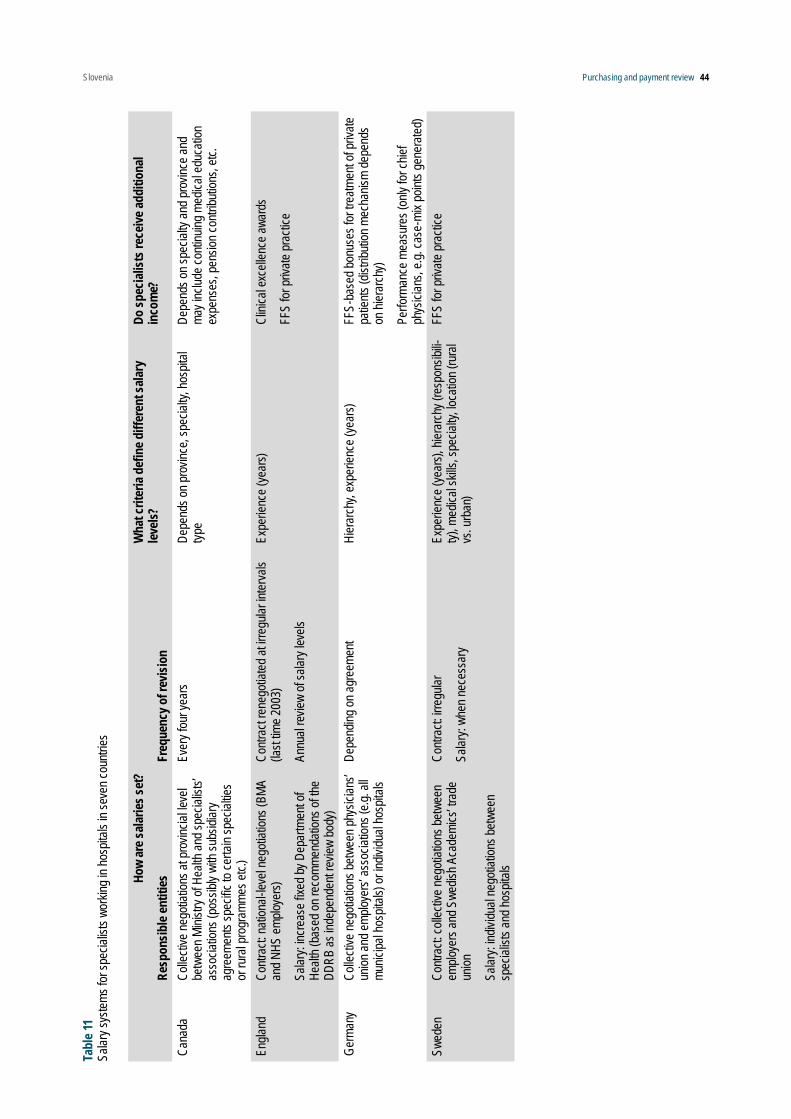
Slovenia Purchasing and payment review 44
How
are s
alarie
s set
?
Resp
onsib
le en
tities
Freq
uenc
y of r
evisi
on
Wha
t crit
eria
defin
e diff
eren
t sala
ry
levels
?Do
spec
ialist
s rec
eive a
dditi
onal
inco
me?
Cana
daCo
llecti
ve ne
gotia
tions
at pr
ovinc
ial le
vel
betw
een M
inistr
y of H
ealth
and s
pecia
lists’
as
socia
tions
(pos
sibly
with
subs
idiar
y ag
reem
ents
spec
ific to
certa
in sp
ecial
ties
or ru
ral p
rogr
amme
s etc.
)
Ever
y fou
r yea
rsDe
pend
s on p
rovin
ce, s
pecia
lty, h
ospit
al typ
eDe
pend
s on s
pecia
lty an
d pro
vince
and
may i
nclud
e con
tinuin
g med
ical e
duca
tion
expe
nses
, pen
sion c
ontri
butio
ns, e
tc.
Engla
ndCo
ntrac
t: nati
onal-
level
nego
tiatio
ns (B
MA
and N
HS em
ploye
rs)
Salar
y: inc
reas
e fixe
d by D
epar
tmen
t of
Healt
h (ba
sed o
n rec
omme
ndati
ons o
f the
DDRB
as in
depe
nden
t rev
iew bo
dy)
Contr
act r
eneg
otiate
d at ir
regu
lar in
terva
ls (la
st tim
e 200
3)
Annu
al re
view
of sa
lary l
evels
Expe
rienc
e (ye
ars)
Clini
cal e
xcell
ence
awar
ds
FFS
for pr
ivate
prac
tice
Germ
any
Colle
ctive
nego
tiatio
ns be
twee
n phy
sician
s’ un
ion an
d emp
loyer
s’ as
socia
tions
(e.g.
all
munic
ipal h
ospit
als) o
r indiv
idual
hosp
itals
Depe
nding
on ag
reem
ent
Hier
arch
y, ex
perie
nce (
year
s)FF
S-ba
sed b
onus
es fo
r tre
atmen
t of p
rivate
pa
tients
(dist
ributi
on m
echa
nism
depe
nds
on hi
erar
chy)
Perfo
rman
ce m
easu
res (
only
for ch
ief
phys
ician
s, e.g
. cas
e-mi
x poin
ts ge
nera
ted)
Swed
enCo
ntrac
t: coll
ectiv
e neg
otiati
ons b
etwe
en
emplo
yers
and S
wedis
h Aca
demi
cs’ tr
ade
union
Salar
y: ind
ividu
al ne
gotia
tions
betw
een
spec
ialist
s and
hosp
itals
Contr
act: i
rregu
lar
Salar
y: wh
en ne
cess
ary
Expe
rienc
e (ye
ars),
hier
arch
y (re
spon
sibili-
ty), m
edica
l skil
ls, sp
ecial
ty, lo
catio
n (ru
ral
vs. u
rban
)
FFS
for pr
ivate
prac
tice
Tabl
e 11
Salar
y sys
tems f
or sp
ecial
ists w
orkin
g in h
ospit
als in
seve
n cou
ntries

Slovenia Purchasing and payment review 45Ho
w ar
e sala
ries s
et?
Resp
onsib
le en
tities
Freq
uenc
y of r
evisi
on
Wha
t crit
eria
defin
e diff
eren
t sala
ry
levels
?Do
spec
ialist
s rec
eive a
dditi
onal
inco
me?
Switz
erlan
dCo
llecti
ve ne
gotia
tions
betw
een t
he
hosp
ital m
edica
l com
miss
ion an
d ind
ividu
al ho
spita
ls or
betw
een t
he as
socia
tion o
f ho
spita
l phy
sician
s and
grou
ps of
hosp
itals
(e.g.
munic
ipal o
r can
tonal
hosp
itals)
Indivi
dual
nego
tiatio
ns ab
out p
lace i
n sala
ry
scale
, sha
re of
FFS
inco
me fr
om pr
ivate
and a
mbula
tory p
atien
ts as
well
as fo
r bo
nuse
s
Depe
nding
on ag
reem
ent
Hier
arch
y (re
spon
sibilit
y), ex
perie
nce
(year
s)Bo
nuse
s for
trea
tmen
t of p
rivate
and
ambu
lator
y pati
ents
(dist
ributi
on m
echa
-nis
m de
pend
s on h
ierar
chy)
Bonu
ses b
ased
on di
ffere
nt cr
iteria
(e.g.
TA
RMED
point
s, pa
tients
trea
ted, c
ase-
mix
point
s gen
erate
d)
The
Nethe
rland
sCo
llecti
ve ne
gotia
tions
betw
een t
he
Asso
ciatio
n of S
pecia
lists
and e
ither
the
Hosp
ital F
eder
ation
(NVZ
) or t
he F
eder
a-tio
n of U
niver
sity M
edica
l Cen
tres (
NFU)
Ever
y two
year
sEx
perie
nce (
year
s), re
spon
sibilit
y (de
part-
ment
or di
vision
man
ager
), tea
ching
Hosp
ital s
pecif
ic bo
nuse
s (inf
orma
tion
unav
ailab
le)
Unite
d Stat
esInd
ividu
al ne
gotia
tions
n/aPr
oduc
tivity
(mea
sure
d in R
VU po
ints),
sp
ecial
ty, po
pular
ity, lo
catio
n (ru
ral–
urba
n)n/a
Sour
ce: Q
uent
in et
al., 2
014.

Slovenia Purchasing and payment review 46
Conclusions
International experiences provide examples of different approaches that can contribute to improving the functioning of payment systems in Slovenia.
The problems and possible solutions are very similar across payment systems for inpatient care, specialist ambulatory care and primary care – and they resemble those concerning the payment of physicians. Most importantly, it is necessary to (1) clearly assign institutional responsibilities for developing payment systems and for keeping them up to date; (2) improve payment adequacy by increasing the availability of cost data for the calculation of DRG weights, by improving mechanisms for updating FFS weights, by recalibrating capitation payments and by redefining the salary scale; and (3) provide stronger incentives for efficiency and quality by changing the relative importance of different payment systems.
However, payment reforms ultimately need to be viewed in a broader organizational context as their effects strongly depend on governance structures (Duràn, Saltman & Dubois, 2011; Busse, van der Grinten & Svensson, 2002). Financial incentives will have relatively little effect in motivating change if provider (hospital/local public health care institution) management has
only limited autonomy to make decisions on staff and equipment, and if ultimately the financial risk of providers is borne by the Treasury.
Box 8Clinical excellence awards in England
As part of the 2003 consultant payment reform, the English NHS introduced the so-called clinical excellence awards (CEAs). These awards are specifically aimed at rewarding performance “over and above” the standard expected of consultants, that is, they do not necessarily reward reaching predefined targets but they are intended to stimulate outstanding personal accomplishments of NHS consultants who do not engage in private practice. There are 12 award levels ranging from under £3000 per year to over £75 000 per year. Awards up to level 8 are allocated by a local committee (so-called employer-based awards), whereas levels 10–12 are awarded by a national committee; level 9 is either awarded locally or nationally. The committees’ assessments and decisions are based on standardized applications by individual consultants. Consultants who want to apply for the awards have to provide evidence of many (but not all) of the following (ACCEA, 2013):
• sustained commitment to patient care and well-being, or to improving public health
• high standards of both technical and clinical aspects in patient care
• an outstanding contribution to professional leadership
• a sustained commitment to the values and goals of the NHS
• a contribution to continuous improvement in service organization and delivery
• embracing the principles of evidence-based practice
• a contribution to the knowledge base through research
• recognition as excellent teachers and/or trainers and/or managers
• a contribution to policy-making and planning in health and health care
Eligibility criteria exist for all levels of the awards. Assessment criteria are outlined by the relevant appraisal committees. Yet due to the nature of the awards these are soft criteria. The average value of national awards (including also Distinction Awards) was £43 194 in 2010, the average value of local awards (including Discretionary Points and Commitment Awards) was £12 485. Almost 50% of all consultants in England held an award in 2010. More than £500 million was spent on awards to consultants and clinical academics in the fiscal year 2011/2012, accounting for about 9% of total NHS spending on consultants.
The DDRB formulated a range of recommendations after a review of the scheme in 2012 (DDRB, 2012). For example, it recommended introducing ceilings of £40 000 nationally and of £35 000 locally. Furthermore, clinical excellence awards should be connected to current performance, including patient feedback, while continuing to reward academic and teaching achievements. The recommendations (which also included recommendations on other aspects of consultant remuneration) are currently the subject of negotiation between the government, the NHS employers and the British Medical Association.
Source: Quentin et al., 2014.

Slovenia Purchasing and payment review 47
References
ACCEA (2013). NHS consultants’ clinical excellence awards scheme – guide for national awards applicants. London, Advisory Committee on Clinical Excellence Awards/NHS.
BMA/NHS Employers (2007). Review of the general medical services global sum formula. London, NHS Employers (http://www.nhsemployers.org/~/media/Employers/Documents/Primary%20care%20contracts/GMS/GMS%20Finance/Global%20Sum/frg_report_final_cd_090207.pdf, accessed 31 July 2015).
Busse R, van der Grinten T & Svensson P-G (2002). Regulating entrepreneurial behaviour in hospitals: theory and practice. In: Saltman RB, Busse R & Mossialos E, eds. Regulating entrepreneurial behaviour in European health care systems. Buckingham, Open University Press.
Cots F et al. (2011a). DRG-based hospital payment: intended and unintended consequences. In: Busse R et al., eds. Diagnosis related groups in Europe: moving towards transparency, efficiency and quality in hospitals? Buckingham, Open University Press.
Cots F et al. (2011b). Spain: a case study on diversity of DRG use – the Catalan experience. In: Busse R et al., eds. Diagnosis related groups in Europe: moving towards transparency, efficiency and quality in hospitals? Buckingham, Open University Press.
DDRB (2012). Review of compensation levels, incentives and the Clinical Excellence and Distinction Award schemes for NHS consultants. London: Review Body on Doctors’ and Dentists’ Remuneration.
Duràn A, Saltman RB & Dubois HFW (2011). A framework for assessing hospital governance. In: Saltman RB, Duràn A & Dubois HFW, eds. Governing public hospitals: reform strategies and the move towards institutional autonomy. Copenhagen, World Health Organization.
Gillam S, Steel N (2013). The Quality and Outcomes Framework – where next? British Medical Journal, 346:f659.
HSCIC (2015). QOF 2013/14 results. Leeds: Health and Social Care Information Centre (http://qof.hscic.gov.uk/, accessed 3 August 2015).
InEK (2010). Report browser 2010/2008. Siegburg: Institut für das Entgeltsystem im Krankenhaus (InEK) (http://www.g-drg.de/cms/content/view/full/2553, accessed 13 May 2015).
Kristensen SR, Bech M, Quentin W (2015). A roadmap for comparing readmission policies with application to Denmark, England, Germany and the United States. Health Policy, 119:264–273.
Linna M, Virtanen M (2011). NordDRG: The benefits of coordination. In: Busse R et al., eds. Diagnosis related groups in Europe: moving towards transparency, efficiency and quality in hospitals? Buckingham, Open University Press.
Mitenbergs U et al. (2012). Latvia: health system review. Health Systems in Transition, 14:xv–xxii, 1–191.
O’Reilly J, McCarthy B & Wiley MM (2011). Ireland: a review of casemix applications within the acute public hospital system. In: Busse R et al., eds. Diagnosis related groups in Europe: moving towards transparency, efficiency and quality in hospitals? Buckingham, Open University Press.
OECD (2015). OECD health statistics. Paris: OECD.
Quentin W et al. (2014). Remuneration of medical specialists in selected countries. In: Van de Voorde C et al., eds. Conceptual framework for the reform of the Belgian hospital payment system. Brussels, Belgian Health Care Knowledge Centre (KCE).
Starfield B, Kinder K (2011). Multimorbidity and its measurement. Health Policy, 103:3–8.
Tan SS et al. (2011). The Netherlands: The Diagnose Behandeling Combinaties. In: Busse R et al., eds. Diagnosis related groups in Europe: moving towards transparency, efficiency and quality in hospitals? Buckingham, Open University Press.
WHO Regional Office for Europe (2015). European Health for All database (HFA-DB) [offline database]. Copenhagen, WHO Regional Office for Europe. (http://www.euro.who.int/hfadb).

Slovenia Purchasing and payment review 48
Wilkens J (2011). Funding primary health care in the Baltic Sea area: differences, similarities, and challenges in funding primary health care to achieve the objectives of ImPrim. Blekinge, Sweden, Blekinge Centre of Competence (http://ltblekinge.se/Documents/Forskning%20och%20utveckling/Blekinge%20kompetenscentrum/Projekt/ImPrim/Publications/Synthesis%20report%20paying%20for%20PHC%20WP3%20110815.pdf, accessed 3 August 2015).
Annex Chapter 4, Table A7Age adjustment and weights in Estonia, Latvia, Lithuania and Sweden
Country Age groups and weightEstonia 0–2 yrs 2–69 yrs 70+ yearsPoints/weights n/a n/a n/aLatvia 0–1 yrs 1–7 yrs 7–18 yrs 18–44 yrs 45–65 yrs > 65 yrsPoints/weights 5.24 2.46 1.17 0.53 0.92 1.4Lithuania 0–1 yrs 1–4 yrs 5–6 yrs 7–17 yrs 18–49 yrs 50–65 yrs 65+ yrsPoints/weights 348 199 152 101 69 110 129Sweden (Blekinge)
0–6 yrs 7–39 yrs 40–64 yrs 65–74 yrs 75+ yrs
Points/weights 1.00/261 0.40/104 1.00/261 2.00/523 2.50/654Source: Wilkens, 2011.Note: n/a – not available.

Slovenia Purchasing and payment review 49
5 The potential for introducing pay-for-performance schemes
Introduction
P4P may be defined as “the adaptation of provider payment methods to include specific incentives and metrics explicitly to promote the pursuit of quality and other health system performance objectives” (Cashin et al., 2014). Currently, there are no such P4P schemes operating in Slovenia. It is essential to note that P4P schemes are never stand-alone payment mechanisms and instead form integral parts of existing provider payment systems. Chapter 4 of this report outlines the main payment methods in place in Slovenia to pay providers (e.g. physicians and hospitals) for their services but none of these payment models are explicitly geared towards incentivizing the improvement of quality. Thus, consistent with commitments made in Slovenia’s draft National Health Plan (Republic of Slovenia Ministry of Health, 2015), the deficiencies identified in the current payment methods for remunerating primary care providers and for paying hospitals should first be tackled in order to establish properly functioning and transparent payment methodologies (see Chapter 4). It should be stressed that introducing P4P schemes prematurely, without the means to monitor activity and quality reliably, not only risks rewarding the providers that are best at gaming the system but also undermines the primary policy objectives of financial incentive schemes – to reward legitimate extra effort (performance) and to improve quality of care.
With these caveats in mind, this chapter explores some of the preconditions (e.g. legal/policy frameworks, responsible bodies, indicators) that impact on the potential to introduce P4P mechanisms into health services payment systems in Slovenia to incentivize better quality of care and patient safety. We briefly look at the current legislative and/or policy frameworks for quality management and improvement in Slovenia, and the data that is currently available that could possibly be developed for the purpose of measuring aspects of performance in general practitioner (GP) care and in hospital settings. In addition, we present some examples from other countries of P4P schemes designed to enhance quality in primary care – for example, to reward GPs for undertaking disease prevention activities or participating in disease management programmes – and P4P schemes designed to enhance clinical outcomes and value-based purchasing (VBP) in hospitals. We also provide a schematic shortlist of the key elements that would need to be considered in designing a P4P scheme.
Quality management framework in Slovenia
In all health care systems, ensuring high quality of services for patients is a constant challenge both in terms of establishing effective organizational and governance structures to monitor quality and health system performance and in terms of having the necessary financial resources and data to implement quality improvement strategies. In Slovenia, assessments by national experts (Poldrugovac et al., 2014; Robida, 2009) highlight that quality gaps between best practices and actual results in health care delivery, particularly in implementing evidence-based clinical practice, not only adversely impact on clinical quality but also on patient outcomes and health system efficiency. Other shortcomings include poor coordination of services, inadequate communication among health care providers, poor patient-centred care and sub-optimal preventive services (Robida, 2009; see also Nolte et al. 2015b).
Slovenia has made attempts to establish legal frameworks and policies for quality management and safety in health care but so far, despite ambitious objectives, these efforts have not been coordinated adequately and implementation has been patchy (Republic of Slovenia Ministry of Health, 2015).
First, major health legislation in Slovenia does not specifically address quality monitoring and improvement in a systematic way. For example, a keyword search of the Health Services Act, the Health Care and Health Insurance Act, the Medical Services Act, the Patient Rights Act and The General Agreement Act (using keywords such as “patient safety” and “quality”) highlights that these concepts are mentioned only sporadically. A National Strategy for Health Quality and Safety (2010–2015) was published in 2010, whose stated aim is to “develop systematic and professional activities for the continuous improvement of health care and patient safety” (Republic of Slovenia National Contact Point for Cross-border health care, 2015). The strategy includes four strategic goals: the development of systematic quality and safety management; the development of a culture of safety and quality within the health care sector; the establishment of an education and training system in the field of quality and safety; and the development of systems for improving successful and efficient health care. However, practical implementation of concrete measures in line with the National Strategy has been rather sluggish.
Second, at the level of individual providers, internal supervision of quality and patient safety is formally required by the Health Services Act. Providers are required to ensure safe and high-quality medical treatment, including the introduction of clinical pathways, quality indicators and other methods and quality tools. At the same time, they should ensure regular internal monitoring of patient safety and the quality of medical

Slovenia Purchasing and payment review 50
treatment as well as broader internal and external quality auditing (accreditation) at all levels of care. However, the obligation for each provider to monitor its own quality is not implemented in a uniform or structured manner. In 2003, a Ministry of Health-sponsored project on the development of clinical guidelines published a manual on how to prepare guidelines and two national guidelines were produced. The project was not converted into a sustainable programme. A further manual on the development of clinical pathways was issued by the Ministry of Health in 2006 and revised in 2009, but currently there is no national programme for developing and adopting uniform clinical pathways that apply to all facilities in terms of evidence-based content that is then adapted to the organizational aspects of service delivery to fit local circumstances. Thus, the task of producing clinical pathways is left to individual providers. Hospitals are required to publish at least two clinical pathways each year but there is no penalty for those that do not do so. Moreover, there is no supervision of such published clinical pathways, resulting in variability across facilities, and no monitoring of their appropriateness. In addition, external inspection of health care activities is fragmented and sub-optimal. The regulations consist of peer reviews between individual physicians, coordinated by the Medical Chamber of Slovenia, a review of facility finances (audits) limited to contractual obligations with the HIIS which are undertaken by the latter, and compliance with legal requirements, undertaken by the Ministry of Health. Related to this, existing human resources and administrative capacities are not adequately developed, either at the national level or at the level of individual providers to undertake quality management practices.
Third, international accreditation of health care organizations on a voluntary basis is a recent development that can also play a role in improving quality. This international accreditation procedure is separate from, and in addition to, the formal licensing procedure (called “verification”) of health service providers, overseen by the Ministry of Health. Under the voluntary accreditation procedure, providers are accredited by internationally recognized organizations, independent of the Ministry of Health or the HIIS (such as Det Norske Veritas International Accreditation Standards, Accreditation Canada Internat iona l and A ACI Internat iona l Accreditation Standards for Healthcare Organizations). Between 2011 and July 2015, 23 out of 30 hospitals in Slovenia were accredited by one of these organizations.
Accreditation is also becoming more common among providers of outpatients specialized services and health care centres. The data on accreditation is published on the Ministry of Health website (Albreht et al., 2016). For Slovenia’s public hospitals, this voluntary accreditation has essentially become mandatory in that there is a financial
penalty of withholding 0.3% of a hospital’s annual budget if it does not take part in the accreditation process. There are no positive incentives for taking part in the process.
Fourth, currently there is no institutional framework that delineates the respective powers and responsibilities of various stakeholders in overseeing quality management and improvement policies (Republic of Slovenia Ministry of Health, 2015), leading to piecemeal implementation and monitoring of quality management strategies. The absence of a health care quality coordination unit also impacts on the capacity to develop, collect and evaluate appropriate performance indicators that could potentially be used for the purposes of rewarding of quality (see the next section).
Data availability and performance indicators
Slovenia has begun the process of collecting quality-related data and developing indicators in both the primary care and hospital sectors. However, the system of developing and collecting indicators can only be considered to be at the initial phase of development, particularly in the hospital sector, and current data are not yet suitable to be used as metrics for a rigorous system for measuring or rewarding quality.
Primary careA few indicators are currently available as part of the regular administrative collection of data as required by the annual general agreements between providers and the HIIS. The list of indicators was introduced in 2010 and results are available for 2011. Other data are also regularly collected by the NIPH. Such data are collected either quarterly or annually and are available in printed form; however, there is a considerable time lag between the time they are collected and the time they are published. Other drawbacks impeding the use of such data as quality metrics include the lack of quality control over the data collected and incompleteness due to non-compliance by some providers, despite the legal obligation to submit the data under the annual GA contract (see Chapter 3 of this report for more information on the GA).
Table 12 lists some current indicators that have been identified by Slovene experts as potential candidates for inclusion in a pilot programme of performance measurement in primary care, if data quality can be improved adequately and evaluated for their robustness.

Slovenia Purchasing and payment review 51
Table 12Potential indicators for assessment of GP performance in primary care
Indicator Sub-indicatorsRate of influenza vaccination for each provider in people older than 65 years
–
Primary prevention of cardiovascular disease (i) Proportion of people with normal blood cholesterol (5.0 mmol / L) after treatment in the observation period
(ii) Proportion of subjects with moderately elevated body mass index (25 to 29.99 kg / m2) after treatment in the observation period
(iii) Proportion of subjects with normal body mass index (20–25 kg / m2) after treatment in the observation
Rate of measles vaccination for each provider –Rate of admission for chronic diseasea (i) Rate of admission due to bronchial asthma in adults
(ii) Rate of admission due to chronic obstructive pulmonary disease
(iii) Rate of admission due to chronic heart failure
(iv) Rate of admission due to coronary heart disease (angina pectoris) without invasive intervention
(v) Rate of admission due to arterial hypertension
(vi) Rate of admission due to acute complications of diabetes
(vii) Rate of admission due to chronic complications of diabetes (viii) Rate of lower limb amputation due to diabetes
(ix) Rate (in the last year) of examined patients for risk factors for the projected population aged 30–64
(x) Ratio of patients with hypertension who had measured, in the current year, an average blood pressure of <140/90 (measurements in the clinic or verified at home), depending on the number of registered patients with hypertension
(xi) Measured value of glycolysated haemoglobin of 7% or less in patients with diabetes
(xii) Ratio of patients with COPD who are vaccinated against flu during the current year in relation to the total number of registered patients with COPD
(xiii) Ratio of patients with benign prostatic hyperplasia with a measured PSA in relation to the total number of registered patients with benign prostatic hyperplasia
(xiv) Ratio of patients diagnosed with depression after filling out the questionnaire for depression, compared to the number of all registered patients with depression
Source: Questionnaire sent to Working Group 4, Slovene Health System Review Project, 2015.Note: a Indicators ix–xiv are indicators for outpatient ambulatory services for chronic patients managed by registered nurses and supervised by GPs.

Slovenia Purchasing and payment review 52
HospitalsIn terms of inpatient settings, the main objective in terms of quality assurance is to improve quality and patient safety in specific facilities where such problems exist and to reduce variability in patient outcomes among providers.
Slovenia has established a system of compulsory recording and gathering of quality indicators in the hospital sector. The first six obligatory quality indicators were introduced in 2006. In 2011, the Ministry of Health broadened the set of compulsory quality indicators that hospitals are obliged to monitor10 and there are now 73. Data for the majority of the indicators can be extracted from national databases while the data for others have to be gathered by the hospitals and sent to the Ministry of Health or other collecting organizations. As required by the GA, most indicators are published on each hospital’s website and periodically also in a national report published by the Ministry of Health, in association with the Medical Chamber, HIIS and NIPH. Failure to make the results available to the public via its website results in a financial penalty being imposed on the hospital.
Table 13 identifies a preliminary subset of the 73 indicators that are currently being collected as indicators that could be further developed and evaluated as metrics
10. In addition to the original six, the indicators were based on OECD indicators, PATH *sp out?* indicators, indicators from the Medical Chamber of Slovenia and indicators from the European Union’s *EU* Simpatie – Safety improvement for patients in Europe – project.
of hospital performance. Such data are either collected on a yearly basis (administrative data) or quarterly (non-administrative data).
Since 2011, efforts have focused on producing comparable data across providers but since the quality reporting indicator programme is still in its early years of operation, a number of data limitations have been identified (Poldrugovac et al., 2014; Poldrugovac & Simčič, 2012) that currently impede their reliability as measures of quality, including:
• a lack of external verification of data produced by hospitals;
• a lack of statistical process controls, except for some indicators introduced by the Medical Chamber of Slovenia;
• non-reporting by some providers; • short time series;• lack of information technology support.
In addition, the Ministry of Health has established an adverse event reporting system which requires reporting to the Ministry of Health of very serious adverse events (known as sentinel events) within 48 hours of their occurrence (Albreht et al., 2016). However, currently, these data are not fully available publicly – only the total number of sentinel events per category is available. Information is publicly available for quality indicators related to safety,
Table 13Potential indicators for measuring hospital performance
Indicator Sub-indicatorsInjuries of delivery pathway at vaginal delivery -Rate of Caesarean sections -
30-day mortality due to acute myocardial infarction -30-day mortality due to ischaemic cerebral stroke -Chronic heart failurea (i) left ventricular ejection fraction assessment
(ii) beta-blocker therapy for left ventricular systolic dysfunction
(iii) Angiotensin-converting enzyme inhibitor or Angiotensin receptor blocker for left ventricular systolic dysfunction
(iv) counselling for implantable cardioverter – defibrillator for patients with left ventricular systolic dysfunction on combination medical therapy
(v) patient self-care education
(vi) post-discharge appointment30-days readmission to the same or to another hospital for the same diagnosis
-
Source: Questionnaire sent to Working Group 4, Slovene Health System Review Project, 2015.Note: a These are newly introduced process indicators and require collection from 2015 onwards.

Slovenia Purchasing and payment review 53
such as patients’ falls and MRSA, but these data are unreliable. Therefore, these shortcomings will need to be addressed systematically before any subset of indicators from the current obligatory set can be utilized as hospital performance metrics.
International examples of P4P schemes
It should also be noted that within the international literature on P4P, there is no conclusive evidence that such financial incentive schemes have been effective in improving the quality of patient care, increasing patient satisfaction or in addressing imbalances in quality of care at the primary care level (Wright, 2012; Partel, 2014; Eijkenaar et al, 2013). This may be partly due to a lack of appropriate study design in evaluating the performance of such schemes. Thus, this section presents some international examples of P4P schemes operating in primary care and hospitals for illustrative purposes only. The aim is to highlight the different policy objectives targeted by various financial incentives/reward schemes and to briefly describe their major features.
Primary careTable 14 provides a summary of the main features of different primary care P4P programmes in England, Estonia, Denmark and Germany while Annex Chapter 5, Table A8 provides more detail on each scheme.
By far the most ambitious and costly P4P scheme in the world is the United Kingdom’s Quality and Outcomes Framework (QOF),11 which accounts for significant proportion (approximately 25%) of general practices’ annual income and costs the NHS approximately £1 billion per year to operate. Introduced in 2004, the main objective of the programme was to improve the overall quality of primary care throughout the country (including improvements in chronic diseases management and mortality rates, as well as reductions in avoidable hospital admissions and population health status inequalities), to raise the status of the GP profession and link rewards to workload. With 121 indicators, across four domains (and one sub-domain), financial rewards are directly linked to the achievement of each target. GP practices are awarded points according to the proportion of eligible patients for whom each indicator target is met, with a maximum of 900 points (HSCIC, 2015).
Although participation in the QOF is voluntary, participation rates are very high, with approximately 8123 GP practices and nearly 100% of registered patients being included in the programme in 2011/12 (Cashin, 2014). Achievement scores also have been consistently
11. From April 2013, for the first time since its introduction in 2004, the QOF was different between England and the devolved administrations in Scotland, Wales and Northern Ireland.*reph*
high, with an average of 831.4 points out of 900 (92.4%) in 2013–2014, prompting criticism that the indicators are too “easy” to achieve. Two features of the QOF that stand out are the scale of the programme, with a very large number of indicators and domains covered (see Box 9) and the sophisticated data collection and evaluation infrastructure used to operate the scheme. Data to calculate achievement scores under the QOF are extracted automatically from electronic medical records into a specially developed national database, the Quality Management Analysis System (QMAS). Reports are generated by the QMAS to calculate individual practices’ QOF achievement scores and reward payments.
Estonia’s Primary Health Care Quality Bonus System (QBS) was designed to motivate family physicians to widen the scope of their services and to provide incentives for a greater focus on disease prevention and chronic disease management within primary care. The scope of the programme is focused on process indicators (45) across 3 domains (Box 10), with different points allocated for each indicator, up to a maximum of 600 points. In 2011 the maximum QBS bonus payment across all three domains was a much more modest €3835 (compared to the United Kingdom’s QOF) or 4.5% of the total annual income for a family physician (€80 800). The total cost for the EHIF was €800 000, about 1% of its total primary health care budget. Despite the fact that a significant proportion of physicians each year (54% in 2010) fail to achieve high enough scores to earn a bonus payment, take-up rates of the voluntary scheme are high, at 90% of all family physicians. One major limitation of the QBS is that because it operates from the EHIF’s electronic billing system, the programme uses only process-based information/indicators and does not include any outcome measures. To date, although no formal evaluation has been undertaken some studies on the QBS suggest that the programme is linked to improved chronic disease management and reduced hospitalization for chronic conditions (Cashin et al., 2014).

Slovenia Purchasing and payment review 54
Table 14Summary of primary care P4P programmes in England, Estonia, Denmark and Germany
Country Programme Performance domains
Number of indicators
Basis for reward Nature of reward
England Quality and Outcomes Framework (QOF)
Clinical care
Public health (sub-domain, additional public health)
Quality and productivity
Patient experience
121 Percent of target met after minimum threshold is reached
Approximately 20–25% of GP practice income paid as a bonus
Estonia Primary Health Care Quality Bonus System (QBS)
Disease prevention
Chronic disease management
Additional activities
45 Minimum target thresholds
Up to 4.5% of family doctor income paid as a bonus
Denmark Diabetes case management payments
Documentation
Follow-up of patients
N/A Up-front annual fee per diabetic patient listed with the practice for covering the various elements of disease management
Information not available
Germany Gesundes Kinzigtal Integrated Care initiative
Individual treatment plans and goal-setting agreements
Patient self-management and shared decision-making
Follow-up of patients and case management
Additional services and tailor-made arrangements for patients with urgent needs
Currently around 30 Share of Gesundes Kinzigtal GmbH’s profit on the basis of individual provider performance plus extra payments for additional services provided to enrolled patients
Approximately 10–15% of provider’s income paid as a bonus
Source: Cashin et al., 2014; Nolte et al., 2015a; Rudkjøbing et al., 2015.
Box 9Domains in the 2013/2014 QOF in England
The 2013/2014 QOF for England comprised a clinical domain, a public health domain, a quality and productivity domain, and a patient experience domain.
The clinical domain included over 90 indicators across 20 clinical areas: atrial fibrillation, secondary prevention of coronary heart disease, heart failure, hypertension, peripheral arterial disease, stroke and transient ischaemic attacks, diabetes mellitus, hypothyroidism, asthma, COPD, dementia, depression, mental health, cancer, chronic kidney disease, epilepsy, learning disabilities, osteoporosis, rheumatoid arthritis and palliative care. Each area is typically covered by two to three indicators,
with a larger number for diabetes (16) and mental health (10).
The public health domain comprised 18 indicators across 8 areas, including primary prevention of coronary heart disease, blood pressure, obesity, smoking, cervical screening, child health surveillance, maternity services and contraception.
The newly introduced quality and productivity domain included nine indicators, such as review of specialist referrals, the number of emergency admissions, the implementation of care pathways, among others.
The fourth patient experience domain included one indicator, which seeks to ensure a minimum patient consultation time with the doctor.
Source: Nolte et al., 2015a.

Slovenia Purchasing and payment review 55
Box 10Domains in the QBS in Estonia
Domain I: Disease prevention – includes the three indicator groups of child vaccination, children’s preventive check-ups and cardiovascular disease prevention.
Domain II: Chronic disease management – includes indicators for four conditions: hypertension, type II diabetes, myocardial infarction and hypothyreosis.
Domain III: Additional activities – includes indicators for four areas: family physician and nurse recertification, maternity care, gynaecological activities and surgical activities.
Source: Habicht, 2014.
In contrast to the QOF and QBS, which have a broad focus on GP activities and associated performance indicators, Denmark is piloting a single-focus P4P programme that pays a financial incentive to GPs to be case managers for diabetes patients. For GPs who voluntarily sign up to the programme a relatively high up-front annual fee of €156 per diabetic patient listed with the practice is paid for covering the various elements of disease management, such as documenting consultations and following clinical guidelines, providing agreed follow-up visits and acting on non-attendance (Rudkjøbing et al., 2015). GPs who do not join the scheme continue to receive the normal €17 fee per patient consultation. The scheme has been operating since 2007 and results (to 2012) have been somewhat disappointing in that the take-up rate among GPs has been rather low (30%) and patient enrolment reaching only about 10% of all diabetes patients. Initial assessments speculate that the low take-up rates may be due to the financial incentive being set too low and that, in terms of patient participation, the programme has not succeeded in avoiding cream-skimming (Rudkjøbing et al., 2015)
A final example is the Gesundes Kinzigtal Integrated Care initiative in the Kinzig valley in south-western Germany. This reward programme has an innovative business/financial model in which a local physicians’ network and a health care management company (OptiMedis) form a regional integrated care management company called Gesundes Kinzigtal GmbH. The company has a contract with two German sickness funds (AOK and LKK) to manage the health care budget for all of their members in the Kinzigtal region and to provide integrated care services and additional benefits to registered members of the initiative (membership is voluntary and free of charge). The main objective of the Gesundes Kinzigtal Integrated Care model is to encourage greater integration of care and reduce health care costs whereby health care providers are incentivized to emphasize prevention and health promotion as well as improve coordination of care. Key provider financial incentives are linked to performance indicators, with providers receiving
a share of the company’s profit on the basis of individual performance. Profit is derived solely from realized savings relative to the average costs of care. Like the QOF, this reward scheme relies on a highly developed data capture and evaluation infrastructure, such as system-wide electronic patient records, a data warehouse and online performance measurement software, for feedback reports to physicians and for calculation of performance results and rewards. One interesting feature of the initiative is that it actively implemented precautionary measures to avoid potential risk selection (cream-skimming) and under-provision of care (given that rewards are reliant on realized savings). In fact, Gesundes Kinzigtal has primarily enrolled members with above-average morbidity and costs. Despite this, savings levels and financial results since the inception of the programme in 2007 have exceeded expectations, suggesting that the use of goal-setting techniques, individualized treatment plans and additional health check-ups may have contributed to these results.
HospitalsIn this section we describe three separate P4P hospital programmes operating in the United States that link payments from Medicare (the country’s national social insurance programme mainly for those over 65 years of age) for inpatient services to the performance of approximately 3400 hospitals. These payments are currently based on hospital performance in the areas of clinical quality, outcomes, patient experience and eff iciency. A growing share of Medicare hospital payments (a total of 6% by 2017) are dependent upon how hospitals perform under the VBP Program, the Hospital Readmissions Reduction Program and the Hospital-Acquired Condition Reduction Program, all three of which are applied to hospitals that contract with Medicare (Kahn et al., 2015)
Hospital VBP ProgramIn 2014 the Hospital VBP Program assessed hospital performance according to three domains of quality measures: (i) clinical process of care; (ii) patient experience of care; (iii) outcomes (Box 11). In 2015 an additional “efficiency” domain was included, defined as Medicare Spending per Beneficiary (MSPB).
Under the Hospital VBP Program, Medicare makes incentive payments to hospitals based on either: (a) how well they perform on each measure, or (b) how much they improve their performance on each measure compared to their performance during a baseline period. CMS assesses each hospital’s total performance by comparing its achievement and improvement scores for each applicable Hospital VBP measure. CMS uses a threshold (50th percentile) and benchmark (mean of the top decile) to determine how many points are awarded for

Slovenia Purchasing and payment review 56
the achievement and improvement scores. CMS compares the achievement and improvement scores and only uses whichever is greater. Measure scores are calculated into a domain score, and the domain scores are then weighted to produce a total score. CMS uses a linear exchange function to translate total performance scores into value-based incentive payments (Department of Health and Human Services CMS, 2015).
Funding for the incentive payments comes from Medicare’s established budget for hospital payments under its DRG system, called the IPPS (Inpatient Prospective Payment System). Hospitals participating in Hospital VBP have their base operating DRG payments for each patient discharge across all hospitals reduced by a small percentage each year (1.5% in 2015) and these funds are pooled to fund the incentive payments. Thus, the Hospital VBP is “budget neutral” for the IPPS.
According to Kahn et al. (2015) the Hospital VBP Program redistributed about US$ 126 mil lion in hospital payments for the 2015 fiscal year. Out of 3089
hospitals receiving a payment adjustment under the programme, 44.5% (1375 hospitals) were penalized, that is, their payment adjustment was less than the 1.5% of base operating payments, the amount that each hospital contributed to the Hospital VBP Program payment pool. Conversely, approximately 55.5% of hospitals received a bonus under the programme, averaging a modest 0.4% (US$ 73 000) and for 60% of these, the bonus amounted to less than US$ 50 000. The current limited bonuses are due to most hospitals’ meeting performance targets; however, since CMS has stated that, in the coming years, the outcome and efficiency domains’ weighting will be increased in relation to the process-of-care indicators, the magnitude of total scores and bonus payments may change (Kahn et al., 2015).
Hospital Readmissions Reduction Program In October 2012, CMS began reducing Medicare payments (up to 3% of base operating payments in 2014) for hospitals paid under the IPPS which recorded excess rates of preventable readmissions, measured by dividing
Box 11Hospital VBP Program performance domains
Domain I – Clinical Processes of Care (13)
AMI-7a Fibrinolytic Therapy Received Within 30 Minutes of Hospital Arrival
AMI-8a Primary PCI Received Within 90 Minutes of Hospital Arrival
HF-1 Discharge Instructions
PN-3b Blood Cultures Performed in the Emergency Department (ED) Prior to Initial Antibiotic Received in Hospital
PN-6 Initial Antibiotic Selection for Community-Acquired Pneumonia (CAP) in Immunocompetent Patients
SCIP-Inf-1 Prophylactic Antibiotic Received Within One Hour Prior to Surgical Incision
SCIP-Inf-2 Prophylactic Antibiotic Selection for Surgical Patients Hospital Value-Based Purchasing Program
SCIP-Inf-3 Prophylactic Antibiotics Discontinued Within 24 Hours After Surgery End Time
SCIP-Inf-4 Cardiac Surgery Patients with Controlled 6:00 a.m. Postoperative Serum Glucose
SCIP-Inf-9 (for FY 2014–2015 only) Urinary Catheter Removal on Postoperative Day 1 or Postoperative Day 2
SCIP-Card-2 Surgery Patients on a Beta-Blocker Prior to Arrival Who Received a Beta-Blocker During the Perioperative Period
SCIP-VTE-1 (for FY 2013–2014 only) Surgery Patients with Recommended Venous Thromboembolism Prophylaxis Ordered
SCIP-VTE-2 Surgery Patients Who Received Appropriate Venous Thromboembolism Prophylaxis Within 24 Hours Prior to Surgery to 24 Hours After Surgery
Domain II – Patient Experience (8)
Results are extracted from surveys of patients who left the hospital are based on the percent of patients who said they “always” had a favourable experience in these areas:
• How well nurses communicated with patients.
• How well doctors communicated with patients.
• How responsive hospital staff were to patients’ needs.
• How well caregivers managed patients’ pain.
• How well caregivers explained medication to patients before giving it to them.
• How clean and quiet the hospital room and hall were.
• How often caregivers explained to patients how to take care of themselves after discharge.
• How the hospital stay rated overall.
Domain III – Mortality
The third area that was evaluated was mortality rates among Medicare patients admitted for heart attack, heart failure or pneumonia. For each, Medicare determined a hospital’s death rate for patients who died while in the hospital or within 30 days after leaving. Medicare adjusted these rates to take into account how sick the patients were.
Source: Rau, 2013; Department of Health and Human Services CMS, 2015.

Slovenia Purchasing and payment review 57
a hospital’s number of “predicted” 30-day readmissions for heart attack, heart failure, pneumonia, hip/knee replacement and chronic obstructive pulmonary disease (COPD) by the number that would be “expected” based on an average hospital with similar patients. A ratio greater than 1 indicates excess readmissions.12 The purpose of the programme is to improve quality and lower costs for Medicare patients by helping to ensure that hospitals discharge patients when they are fully prepared and safe for continued care at home or in a lower care setting. However, the validity of the programme has been questioned, as readmission rates for the first three reported conditions were already declining in 2013, the year that the first penalties under the Hospital Readmissions Reduction Program (HRRP) were imposed, possibly due to existing public reporting requirements on the United States Hospital Compare website (Kahn et al., 2015).
The HRRP has a greater effect on hospital payments than the Hospital VBP Program – in 2015 approximately 75% of the 3478 hospitals subject to the scheme received a payment penalty. The average HRRP penalty for this group was 0.5% of total operating payments, or US$ 161 000. Approximately, 10% of hospitals accounted for nearly half of the total penalties.
Hospital-Acquired Condition Reduction ProgramFrom October 2014 Medicare payments to hospitals may also be reduced in order to encourage hospitals to reduce their rates of hospital-acquired conditions (HACs), defined as a group of reasonably preventable conditions that patients did not have upon admission to a hospital, but which developed during their hospital stay. Hospitals’ performance is measured against three quality measures (patient safety indicator 90 composite, central-line associated bloodstream infection and catheter associated urinary tract infection) which are used to derive a total HAC score between 1 and 10; the higher the total score, the worse the hospital has performed. In the 2015 fiscal year, 3300 hospitals were included in the HAC Reduction Program and those ranked in the top quartile (25%, with a score of 7 or higher) received a penalty of a 1% reduction in their total IPPS payments. Major teaching hospitals represented the largest category of all hospitals in the penalty-receiving group (19%) and contributed 48% of the approximately US$ 357 million in penalties that were imposed under the programme (Kahn et al., 2015). In terms of performance scores, many hospital scores were concentrated near the seventy-fifth percentile cut-off point that determines the penalty.
It should be noted that a l l three performance measures of the HAC Reduction Program are included as outcome measures under the Hospital VBP Program
12. Readmission rates for coronary artery bypass graft will be added to the programme in 2017.
in 2015. Kahn et al. (2015) point out that this overlap is due to the statutory requirements to measure infection rates in both programmes, as well as other factors, such as the limited availability of appropriate performance measures, and efforts to align measures on similar patient outcomes across programmes. In 2017, the overlap will be expanded to three other measures (surgical site infection, Clostridium difficile infection and MRSA infection).
Adverse events indicatorsOne route towards developing an initial, delimited pilot project on rewarding hospitals for their performance or imposing penalties for non-performance is to focus only on the reporting of hospital adverse events/HACs and attaching a penalty for those hospitals which perform badly on this metric. The United States’ National Quality Forum has identified a list of serious reportable events (SREs; see Box 12) that provides some indicators that could be used for this purpose. The introduction of such indicators would require, in the first instance, an evaluation of the specific Slovenian context to assess the validity and reliability of the chosen indicators.
Checklist for P4P design
Table 15 presents a general checklist of key elements to consider when designing a P4P scheme. By their nature, P4P schemes differ according to the health setting and policy objectives. Often the aims of reward schemes in primary care settings are quite broad; they are designed to cover larger proportions of the population in their scope for improving quality and tend to focus on encouraging service delivery according to clinical guidelines. For hospital settings P4P programmes tend to be narrower in focus and designed to address particular problems, such as reducing avoidable complications due to hospitalization or to encourage adherence to clinical guidelines in specific areas (Cashin, 2014). The examples from the United States illustrate a strengthened focus on VBP which aims to link the delivery of higher quality services to cost–effectiveness. Regardless of the context, all P4P schemes share common elements which need to be addressed systematically in order for a successful reward programme to be developed.

Slovenia Purchasing and payment review 58
Box 12United States’ National Quality Forum list of serious reportable events
1. SURGICAL OR INVASIVE PROCEDURE EVENTS
1A. Surgery or other invasive procedure performed on the wrong site (updated) Applicable in: hospitals, outpatient/office-based surgery centres, ambulatory practice settings/office-based practices, long-term care/skilled nursing facilities
1B. Surgery or other invasive procedure performed on the wrong patient (updated) Applicable in: hospitals, outpatient/office-based surgery centres, ambulatory practice settings/office-based practices, long-term care/skilled nursing facilities
1C. Wrong surgical or other invasive procedure performed on a patient (updated) Applicable in: hospitals, outpatient/office-based surgery centres, ambulatory practice settings/office-based practices, long-term care/skilled nursing facilities
1D. Unintended retention of a foreign object in a patient after surgery or other invasive procedure (updated) Applicable in: hospitals, outpatient/office-based surgery centres, ambulatory practice settings/office-based practices, long-term care/skilled nursing facilities
2. PRODUCT OR DEVICE EVENTS
2A. Patient death or serious injury associated with the use of contaminated drugs, devices, or biologics provided by the health care setting (updated) Applicable in: hospitals, outpatient/office-based surgery centres, ambulatory practice settings/office-based practices, long-term care/skilled nursing facilities
2B. Patient death or serious injury associated with the use or function of a device in patient care, in which the device is used or functions other than as intended (updated) Applicable in: hospitals, outpatient/office-based surgery centres, ambulatory practice settings/office-based practices, long-term care/skilled nursing facilities
2C. Patient death or serious injury associated with intravascular air embolism that occurs while being cared for in a health care setting (updated) Applicable in: hospitals, outpatient/office-based surgery centres, long-term care/skilled nursing facilities
3. PATIENT PROTECTION EVENTS
3A. Patient death or serious injury associated with patient elopement (disappearance) (updated) Applicable in: hospitals, outpatient/office-based surgery centres, ambulatory practice settings/office-based practices, long-term care/skilled nursing facilities
3B. Patient suicide, attempted suicide, or self-harm that results in serious injury, while being cared for in a health care setting (updated) Applicable in: hospitals, outpatient/office-based surgery centres, ambulatory practice settings/office-based practices, long-term care/skilled nursing facilities
4. CARE MANAGEMENT EVENTS
4A. Patient death or serious injury associated with a medication error (e.g. errors involving the wrong drug, wrong dose, wrong patient, wrong time, wrong rate, wrong preparation, or wrong route of administration) (updated) Applicable in: hospitals, outpatient/office-based surgery centres, ambulatory practice settings/office-based practices, long-term care/skilled nursing facilities
4B. Patient death or serious injury associated with unsafe administration of blood products (updated) Applicable in: hospitals, outpatient/office-based surgery centres, ambulatory practice settings/office-based practices, long-term care/skilled nursing facilities
4C. Maternal death or serious injury associated with labour or delivery in a low-risk pregnancy while being cared for in a health care setting (updated) Applicable in: hospitals, outpatient/office-based surgery centres
4D. Death or serious injury of a neonate associated with labour or delivery in a low-risk pregnancy (new) Applicable in: hospitals, outpatient/office-based surgery centres
4E. Patient death or serious injury associated with a fall while being cared for in a health care setting (updated) Applicable in: hospitals, outpatient/office-based surgery centres, ambulatory practice settings/office-based practices, long-term care/skilled nursing facilities
4F. Any Stage 3, Stage 4, and unstageable pressure ulcers acquired after admission/presentation to a health care setting (updated) Applicable in: hospitals, outpatient/office-based surgery centres, long-term care/skilled nursing facilities
4G. Artificial insemination with the wrong donor sperm or wrong egg (updated) Applicable in: hospitals, outpatient/office-based surgery centres, ambulatory practice settings/office-based practices
4H. Patient death or serious injury resulting from the irretrievable loss of an irreplaceable biological specimen (new) Applicable in: hospitals, outpatient/office-based surgery centres, ambulatory practice settings/office-based practices, long-term care/skilled nursing facilities
4I. Patient death or serious injury resulting from failure to follow up or communicate laboratory, pathology, or radiology test results (new) Applicable in: hospitals, outpatient/office-based surgery centres, ambulatory practice settings/office-based practices, long-term care/skilled nursing facilities

Slovenia Purchasing and payment review 59
Conclusions
Slovenia’s draft National Health Plan (2015) contains a commitment to recognize greater efficiency and quality on the part health care providers through rewarding performance. At the same time, it acknowledges the need to take a step-by-step approach and to first develop appropriate models, including the adoption of suitable performance criteria, and to test any resulting P4P models prior to implementation (Republic of Slovenia Ministry of Health, 2015). Looking at the current situation in Slovenia and some international examples of P4P schemes in primary and hospital care, the following preconditions have been identified for meeting these aims:
• The development and enforcement of the quality management framework currently in place should be strengthened, including the development of a national programme for developing and adopting uniform clinical guidelines for various conditions, and enforcing the regulation of quality monitoring responsibilities within individual health care facilities/institutions.
• An institutional framework should be identified and established that is responsible for overseeing quality management and improvement policies (possibly a coordinating unit within the HIIS that can synchronize the inputs of relevant organizational stakeholders); the necessary financial resources will need to be provided for this purpose.
• A concerted effort is required to develop appropriate indicators/performance metrics in both the primary care and hospital sectors, and to coordinate their collection and robust evaluation. The existence of reliable and measurable indicators of quality, in terms of structures, processes and outcomes, is
indispensable for linking payment to performance. This task could be carried out most efficiently by a coordinating unit dedicated to quality management.
• In tandem, a robust system of quality reporting and public dissemination of results (to providers themselves through feedback reports, to patients and to health services funders – HIIS and voluntary health insurers) could be operationalized. Such a system would form the basis of more robust quality monitoring activities.
• The current payment systems for primary care providers, GPs/family physicians and hospitals need to be amended to establish properly functioning and transparent payment methodologies (see Chapter 4 of this report) before any P4P pilot scheme is implemented.
• Any initial P4P scheme that is developed should start off at a modest scale (featuring a small number of targeted indicators) and be implemented as a pilot programme in a defined geographical area (region) or provider group. Robust evaluation of the pilot programme’s impact against specific quality improvement and outcomes criteria should take place before roll-out on a national basis.
• Initial small-scale pilot programmes could be considered in primary care, in the hospital sector via a hospital reward/penalty scheme focusing on a minimum set of indicators on adverse events or more generally on a “pay for reporting” scheme where payment could be reduced if providers fail to provide information (of sufficient quality) on a set of quality indicators.
5. ENVIRONMENTAL EVENTS
5A. Patient or staff death or serious injury associated with an electric shock in the course of a patient care process in a health care setting (updated) Applicable in: hospitals, outpatient/office-based surgery centres, ambulatory practice settings/office-based practices, long-term care/skilled nursing facilities
5B. Any incident in which systems designated for oxygen or other gas to be delivered to a patient contains no gas, the wrong gas, or are contaminated by toxic substances (updated) Applicable in: hospitals, outpatient/office-based surgery centres, ambulatory practice settings/office-based practices, long-term care/skilled nursing facilities
5C. Patient or staff death or serious injury associated with a burn incurred from any source in the course of a patient
care process in a health care setting (updated) Applicable in: hospitals, outpatient/office-based surgery centres, ambulatory practice settings/office-based practices, long-term care/skilled nursing facilities
5D. Patient death or serious injury associated with the use of physical restraints or bedrails while being cared for in a health care setting (updated) Applicable in: hospitals, outpatient/office-based surgery centres, ambulatory practice settings/office-based practices, long-term care/skilled nursing facilities
6. RADIOLOGIC EVENTS
6A. Death or serious injury of a patient or staff associated with the introduction of a metallic object into the MRI area (new) Applicable in: hospitals, outpatient/office-based surgery centres, ambulatory practice settings/office-based
Source: National Quality Forum, 2015.

Slovenia Purchasing and payment review 60
Table 15Elements of P4P programme design
Element Factors to considerPerformance domains and measures
(1) Defining domains for measurement:
• clinical quality (structure, process and outcome measures)
• priority services (e.g. immunization or cancer screening)
• efficiency (e.g. achieving shared savings and lower cost growth)
• patient experience and satisfaction - equity/reduction of health status disparities
(2) Choosing the right number of indicators to capture the important aspects of performance and take account of available data while at the same time avoiding making the system overly complex
(3) Weighting of performance domains (typically the weighting signals priorities)
(4) Involving stakeholders in developing performance measures to increase acceptanceBasis for reward or penalty (1) Options for reward/penalty basis include:
• an absolute level of the measure (whether a specific target is achieved above a threshold)
• a change in the level achieved over time (improvement)
• how providers perform relative to other providers (relative ranking)
(2) Calculation of achievement rates (single or composite measures; transparency and complexity of methodology)
(3) Risk adjustment (adjustments to compensate providers serving a disproportionately sicker or costlier to care for population to reduce the incentive for them to avoid such patients)
Nature of the reward or penalty
(1) Size of reward or penalty
(2) Who is the recipient (individuals or institutions)?
(3) Is participation voluntary or compulsory?
(4) Whether financial reward is accompanied by non-financial awards
(5) Frequency of penalty/rewardData reporting and verification (1) Data availability and quality (clinical data, insurance/reimbursement claims data)
(2) IT infrastructure for data capture, processing and calculation
(3) Frequency of reporting
(4) How are rewarded/penalized results measured and validated in order to discharge the contractual relationship between the payer and provider?
Source: Adapted from Cashin, 2014.

Slovenia Purchasing and payment review 61
References
Albreht T et al. (2016). Slovenia: health system review. Health Systems in Transition, 18(3):1–207.
Cashin C (2014). P4P program design. In: Cashin C et al., eds. Paying for performance in health care. Berkshire, Open University Press.
Cashin C et al., eds. (2014). Paying for performance in health care. Berkshire, Open University Press.
Department of Health and Human Services CMS (2015). Hospital Value-Based Purchasing Program. Washington, DC, Centers for Medicare and Medicaid Services.
Eijkenaar F et al. (2013). Effects of pay for performance in health care: a systematic review of systematic reviews. Health Policy, 110:115–130.
Habicht T (2014). Estonia: primary health care quality bonus system. In: Cashin C et al., eds. Paying for performance in health care. Buckingham, Open University Press.
HSCIC (2015). QOF 2013/14 results. Leeds: Health and Social Care Information Centre (http://qof.hscic.gov.uk/, accessed 3 August 2015).
Kahn CN et al. (2015). Assessing Medicare’s hospital pay-for-performance programs and whether they are achieving their goals. Health Affairs, 34(8):1281–1288.
National Quality Forum (2015). List of SREs. Washington, DC, National Quality Forum (http://www.qualityforum.org/Topics/SREs/List_of_SREs.aspx, accessed 10 August 2015).
Nolte E et al. (2015a). England. In: Nolte E, Knai C, eds. Assessing chronic disease management in European health systems. Country reports. Copenhagen: World Health Organization (acting as the host organization for, and secretariat of, the European Observatory on Health Systems and Policies):27–36.
Nolte E et al. (2015b) Optimizing service delivery. Report commissioned by the Government of Slovenia, Ministry of Health. Ljubljana: Ministry of Health.
Partel K (2014). Can we improve the health system with pay-for-performance? Deeble Institute for Health Policy Research. Australian Healthcare and Hospital Association, 5:1–13.
Poldrugovac M, Simčič B (2012) Primerljivost kazalnikov kakovosti, ki se spremljajo na nacionalni ravni med izvajalci zdravstvenih storitev [Comparability of quality indicators to be monitored at the national level between health care providers]. In: Skela Savič B et al., eds. Kakovostna zdravstvena obravnava skozi izobraževanje, raziskovanje in multiprofesionalno povezovanje-prispevek k zdrvju posameznika in družbe. [Quality health care treatment in the framework of education, research and multi professional collaboration – towards the health of individuals and society]. Proceedings of the International Scientific Conference, 7–8 June 2012, University College of Health Jesenice, Ljubljana:264–275.
Poldrugovac M et al., eds. (2014). Kazalniki kakovosti v zdravstvu – letno poročilo 2011 [Health quality indicators – annual report 2011]. Ljubljana, Ministry of Health.
Rau J (2013). Methodology: how value based purchasing payments are calculated. Kaiser Health News, 14 November (http://khn.org/news/value-based-purchasing-medicare-methodology/, accessed 19 May 2016).
Republic of Slovenia Ministry of Health (2015). Resolution on the National Health Care Plan 2015–2025 – Together for a society of health. Ljubljana, Ministry of Health.
Republic of Slovenia National Contact Point on Cross-border Health Care (2015). National Strategy for Health Quality and Safety. Available at: http://www.nkt-z.si/wps/portal/nktz/home/healthcare/quality%26safety/other/!ut/p/b0/04_Sj9CPykssy0x PLMnMz0vMAfGjzOJNDF093Y39DTwN_IIMDBzdvQ3CfFxND PwNTfQLsh0VAX0IH0M!/
Robida A (2009). Pot do odlične zdravstvene prakse [The road to the excellent medical practices] Ljubljana, GV Planet.
Rudkjøbing A et al. (2015). Evaluation of a policy to strengthen case management and quality of diabetes care in general practice in Denmark. Health Policy, 119(8):1023–1030.
Wright M (2012). Pay-for-performance programs – do they improve the quality of primary care? Australian Family Physician, 41(12):989–991.

Slovenia Purchasing and payment review 62
Annex Chapter 5: P4P schemes in primary care – country examples
Source material mainly based on: C Hernández-Quevedo, R Llano, E Mossialos (2012). Paying for integrated care: an assessment. Rapid Response Report for the European Commission. European Observatory on Health Systems and Policies.
ENGLAND: QUALITY AND OUTCOMES FRAMEWORK (QOF)
Programme aimsThe QOF was introduced in 2004 as part of a new contract with GPs, with the aim of improving the overall quality of primary care throughout the country, to make the GP profession more attractive, to reduce the wide variation in payments to practices and to fairly link reward to workload. In turn, quality improvement is seen to contribute to the achievement of a number of other interrelated goals (Martin et al., 2010; Gillam & Siriwardena, 2010):
• to stimulate an improvement in chronic disease management;
• to reduce avoidable hospital admission rates through better chronic disease management at the primary care level;
• to contribute to improvements in national mortality rates; and
• to contribute to bridging the gap in population health status inequalities.
Performance domains and indicatorsThe QOF rewards GP practices with financial incentives for meeting quality targets measured initially against 146 indicators. Periodic reviews have revised and reduced the number of indicators to 121. Financial rewards are directly linked to the level of achievement of each target.
In 2013/2014, GP performance was measured against a total of 121 indicators. Practices could achieve a maximum of 900 points. A selection of structural, process and outcome indicators were grouped into four domains and one sub-domain (HSCIC, 2015):
1. 93 clinical indicators, mostly covering chronic conditions (e.g. chronic kidney disease, heart failure, hypertension) worth up to a maximum of 610 points;
2. nine public health indicators across four clinical areas – blood pressure, cardiovascular disease, primary prevention, obesity and smoking (e.g. the percentage of smokers with an offer of support and treatment to quit smoking);
2a. nine public health additional services indicators across four service areas, including cervical screening (e.g. the percentage of eligible women with a cervical screening test in the previous five years), child health surveillance, contraception and maternity services;
3. nine indicators for quality and productivity (e.g. concerning implementation of care pathways, participation in external peer review).
4. one indicator for patient experience, which relates to length of consultations (i.e. routine booked consultations should not be less than 10 minutes).
Incentive paymentsUnder the QOF, GP practices are awarded points according to the proportion of eligible patients for whom each indicator target is met.
For 2014/2015 GP practices in England were paid a f lat rate of £156.92 for each point they achieve, up to a maximum of 900 points. Payments are adjusted for practice size and disease prevalence relative to the national average. The programme allows GPs to report “exceptions”; that is, “exception reporting” allows certain patients, who are deemed to be unsuitable (according to set criteria) to be excluded from the overall target for patients registered at a practice.
Martin et al. (2010) and Cashin (2014) estimate that about 20–25% of GP practice income is tied to QOF financial incentives. In 2005/2006 the additional income from the QOF per GP practice was around £126 000, which is an extremely high level of reward by international standards. Currently, expenditures for the QOF are around £1 billion per year (Cashin, 2014).
Data sources and flowsData to calculate achievement scores under the QOF are extracted automatically from electronic medical records into a specially developed national database, the QMAS. Reports are generated by the QMAS to calculate individual practices’ QOF achievement scores and reward payments. Data relating to organizational indicators are entered manually by practices on the QMAS website.
Potential success and evaluation In terms of its implementation, the QOF has been deemed a success (Gillam & Siriwardena, 2010). Although participation by practices in the QOF is voluntary, participation rates are very high (The Information Centre, 2012). In 2011/2012 the programme covered 8123 GP practices and almost 100% of registered patients (Cashin, 2014). Since its inception, GP practices have achieved high scores. In 2013/2014 the average achievement score for practices was 831.4 points out of 900, that is, 92.4% of the total available; 162 practices achieved the maximum
Slovenia Purchasing and payment review 63
of 900 points. There has been criticism in the United Kingdom that the indicators were set at too “easy” a level, while at the same time the scheme has also had an effect in reducing inequalities in the delivery of primary care (Doran et al., 2008).
It is important to note that the QOF only measures a small proportion of primary care or GP activity and thus does not capture all the domains of quality, such as continuity of care, patient-centred consultation skills, diagnostic skills or care of diseases not included in the QOF (Ashworth & Kordowicz, 2010). Moreover, it is unclear whether high achievement scores translate into improved patient care and health outcomes, as no systematic, large-scale studies have yet been undertaken. In their review of the literature Steel and Willems (2010) conclude that the evidence base for the impact of the QOF remains patchy and inconclusive. Their analysis of 35 studies highlights that the achievement of standards has risen each year approximately in line with pre-existing trends and, while findings vary between studies and indicators, there is no consensus on whether the QOF has changed the underlying overall rate of quality improvement. However, there have been some significant, albeit small improvements for some conditions such as diabetes and asthma. Another recent systematic review of existing research on the QOF noted that while there was evidence of modest improvements in the quality of care for chronic diseases covered by the framework, its impacts on costs, professional behaviour and patient experience had remained uncertain (Gillam, Siriwardena & Steel, 2012). A further review also noted that the QOF has had limited impact on improving health outcomes, which the authors attributed to the framework’s focus on process-based indicators and the indicators’ ceiling thresholds (Langdown & Peckham, 2014).
Most studies concur that the QOF led to rapid and universal adoption of electronic records by GPs, since payments were dependent on data extracted from electronic records. Practices employed more staff, especially nurses and administrative staff, and proactive care for major chronic diseases such as diabetes and asthma was increasingly provided by nurses working in disease-focused clinics within their GP practices (Nolte et al., 2015).
ReferencesAshworth M, Kordowicz M (2010). Quality and Outcomes Framework: smoke and mirrors? Quality in Primary Care, 18(2):127–131.
Cashin C (2014) United Kingdom: Quality and Outcomes Framework. In: Cashin C et al., eds. Paying for performance in health care. Buckingham, Open University Press.
Doran T et al. (2008). The effect of financial incentives on inequalities in the delivery of primary care in England. Lancet, 372:728–736.
Gillam S, Siriwardena AN (2010). The Quality and Outcomes Framework: triumph of technical rationality, challenge for individual care? Quality in Primary Care, 18(2):81–83.
Gillam S, Siriwardena AN, Steel N (2012). Pay-for-performance in the United Kingdom: impact of the Quality and Outcomes Framework—a systematic review. Annals of Family Medicine, 10:461–468.
HSCIC (2015). QOF 2013/14 results. Leeds: Health and Social Care Information Centre (http://qof.hscic.gov.uk/, accessed 3 August 2015).
Langdown C, Peckham S (2014). The use of financial incentives to help improve health outcomes: is the Quality and Outcomes Framework fit for purpose? A systematic review. Journal of Public Health, 36:251–258.
Martin S et al. (2010). Do quality improvements in primary care reduce secondary care costs? Primary research into the impact of the Quality and Outcomes Framework on hospital costs and mortality. London, The Health Foundation (http://www.health.org.uk/publications/QOF-report/, accessed 5 August 2015).
Nolte E et al. (2015) Optimizing service delivery. Report commissioned by the Government of Slovenia, Ministry of Health. Ljubljana: Ministry of Health.
Steel N, Willems S (2010). Research learning from the UK Quality and Outcomes Framework: a review of existing research. Quality in Primary Care, 18(2):117–125.
The Information Centre (2012). The Quality and Outcomes Framework (http://www.qof.ic.nhs.uk/faqs/#qof03, accessed 5 August 2015).

Slovenia Purchasing and payment review 64
ESTONIA: PRIMARY CARE QBS
Programme aimsThe QBS was introduced in 2006 to:
• provide incentives for family physicians (GPs) to focus on disease prevention;
• reduce morbidity from vaccine-preventable diseases and reduce hospitalization from chronic diseases;
• improve the management of chronic diseases within primary health care;
• motivate family physicians to widen the scope of their services.
Performance domains and indicatorsThe QBS has three domains, with several indicator groups:
Domain I – disease prevention – includes the three indicator groups of child vaccination, children’s preventive check-ups and cardiovascular disease prevention.
Domain II – chronic disease management – includes indicators for four conditions: hypertension, type II diabetes, myocardial infarction and hypothyreosis.
Domain III – additional activities – includes indicators for four areas: family physician and nurse recertification, maternity care, gynaecological activities and surgical activities. There is a total of 45 indicators, with a possible
maximum score of 600 points. Different total points are available for each domain and indicator (i.e. indicators are weighted) and physicians earn points for reaching the performance target for each indicator.
Incentive paymentsDomains I and II constitute the “basic payment”, which was a maximum of €3068 per year in 2011. Family physicians are eligible for bonus payments if they achieve at least 80% of possible points. The bonus payment is paid to the family physician at 100% (€3068) if at least 560 points is achieved and at 80% (€2454) if at least 480 points is achieved. Scores below 80% do not receive any payment.
An additional payment from Domain III is payable only if family physicians have already qualified for a bonus payment in Domains I and II at at least the 80% level. The maximum payment under Domain III was €767 in 2011.
Bonus payments are paid to the family physician who then decides whether and how to distribute the payment among other staff, such as nurses.
In 2011 the maximum QBS bonus payment across all three domains was €3835 or 4.5% of the total annual income for a family physician (€80 800). The total cost of the QBS in that year was €800 000, about 1% of the EHIF’s total primary health care budget.
Data sources and flowsData required for the QBS is derived from the EHIF’s routine claims data through its electronic billing system. Patient-level information is available electronically for all activities, including lists of patients with chronic diseases. Only information on the recertification of physicians and nurses must be provided manually by medical associations overseeing continuous medical information.
Potential success and evaluation In 2010 the share of physicians participating in the programme on a voluntary basis was 90% (up from 50% when the QBS started in 2006) and covered approximately 90% of insured people in Estonia. These strong take-up rates have been achieved despite the fact that a significant proportion of physicians each year fail to achieve high enough scores to earn a bonus payment. For example, in 2010, approximately 24% of family physicians received bonus payments at the maximum level for Domains I and II, a further 12% earned a bonus payment at the 80% level while just over half (54%) did not qualify for any payment at all (10% of all family physicians did not participate in the programme). There is also wide variation in take-up rates and achievement of bonus payments across the country’s counties.
No formal evaluation has yet been undertaken of the QBS; however, some studies assessing its impact suggest that the programme is linked to improved chronic disease management and reduced hospitalization for chronic conditions (Habicht, 2014). Moreover, the implementation of QBS and monitoring of performance results has highlighted the importance of clinical guidelines in performance monitoring at the primary care level.
One limitation of the QBS is that, because it is based on the EHIF’s electronic billing system, it limits the programme to process-based information/indicators and does not include any outcome measures.
ReferencesHabicht T (2014). Estonia: primary health care quality bonus system. In: Cashin C et al., eds. Paying for performance in health care. Buckingham, Open University Press.

Slovenia Purchasing and payment review 65
DENMARK: PAYMENTS TO GPs FOR BEING CASE MANAGERS FOR DIABETES PATIENTS
Programme aimsThe financial incentive for coordinating care to diabetic patients is a pilot project started in 2007, constituting part of a general policy to improve care by strengthening GPs’ role. The purpose of the policy, as stated in the agreement between the Danish regions and GPs, is to develop and ensure quality in the treatment of chronic diseases in general practice and to give GPs a tool to systematize care and quality assurance of the treatment and monitoring of patients with chronic diseases.
Performance domains and indicatorsGPs have to regularly assess the appropriateness of each patient’s management and document consultations. The care must follow the guidelines provided by the Danish College of General Practitioners (the scientific college of general practice). Follow-up visits must be agreed between the GP and the patient, and the GP must follow up on non-attendance. A key element of the policy is that following the annual consultation and corresponding fee, the next three consultations are provided without further reimbursement for the GP.
Incentive paymentsA financial incentive is paid to GPs for delivery of care to type II diabetes patients. Once a GP joins the scheme the GP is paid a relatively high up-front annual fee of €156 per diabetic patient listed with the practice for covering the various elements of disease management (Rudkjøbing et al., 2012).
Data sources and flowsA requirement to receive the annual fee for diabetic care is the installation of a sentinel data capture system. The system collects key data from the electronic health record system, generates reports for each practice and benchmarks the GP’s performance against that of other GPs.
Potential success and evaluation Entering into this new form of reimbursement is voluntary and the GPs are free to stay with the traditional FFS reimbursement scheme with a reimbursement fee of €17 per consultation. Between 2007 and 2012, approximately 30% of GP practices had adopted the use of the incentive and services had been extended to 33 000 patients, about half the number that had been expected when the programme began, and representing only about 10% of diabetes patients.
Although the implementation of the scheme was not yet complete in 2012 (as more GPs were signing up), it is generally accepted that the programme was not functioning as envisioned, with take-up rates being far too low, suggesting that the level of the financial incentive may be too low. More importantly, the low rate of diabetes patients being signed up by their GP may suggest that the programme has not succeeded in avoiding cream-skimming. In addition, given the lack of evaluation, it is unclear whether this incentive mechanism has led to higher quality care at a lower cost while maintaining or improving the recipients’ health and satisfaction (Rudkjøbing et al., 2015).
ReferencesRudkjøbing A et al. (2012). Integrated care: a Danish perspective. British Medical Journal, 345:e4451.
Rudkjøbing A et al. (2015). Evaluation of a policy to strengthen case management and quality of diabetes care in general practice in Denmark. Health Policy, 119(8):1023–1030.

Slovenia Purchasing and payment review 66
GERMANY: GESUNDES KINZIGTAL INTEGRATED CARE PROGRAMME
Background informationThe German health care system has historically been characterized by significant financial and organizational fragmentation across health care sectors and providers, resulting in substantial inefficiencies. In an effort to encourage greater integration of care and lower health care costs, the 2004 Statutory Health Insurance Modernization Act allowed German sickness funds to spend 1% of their overall expenditure on integrated care programmes. Contrary to the expectations of health policy-makers, however, most of the integrated care programmes that were established focused on specific indications (e.g. knee surgery) and usually integrated only two sectors (e.g. rehabilitation and integrated care). The Gesundes Kinzigtal Integrated Care initiative is one of the few population-based integrated care systems that covers all sectors and indications of care for a specified population.
Based in the Kinzig valley in south-western Germany, Gesundes Kinzigtal Integrated Care is managed by a regional integrated care management company called Gesundes Kinzigtal GmbH, which was founded by a local physicians’ network and a health care management company in 2005. As part of its contract agreement with two German sickness funds (AOK and LKK), Gesundes Kinzigtal GmbH is tasked with managing the health care budget for all of their members in the Kinzigtal region (31 000 patients). Importantly, however, most of the integrated care services and additional benefits are offered only to members who voluntarily decide to actively enrol in the programme free of charge. As of May 2010, 6870 insured members have become active enrolled members.
As part of its prevention and health promotion strategy, Gesundes Kinzigtal offers programmes targeting common high-burden chronic diseases to patients who have been identified to be at-risk or who have already developed certain chronic illnesses. Some initiatives include active health promotion for the elderly, intervention programmes for patients with chronic heart failure, and a physician-led smoking cessation programme, as well as “Healthy Kinzigtal moving”, which offers vouchers and discounts to members for sports and gym clubs.
Programme aimsThe main objective of the Gesundes Kinzigtal Integrated Care model is to encourage greater integration of care and lower health care costs through an innovative financial model whereby health care providers are incentivized to emphasize prevention and health promotion as well as improve coordination of care.
Performance domains and indicatorsStriving to achieve population health gains and lower costs, the Gesundes Kinzigtal Integrated Care model is characterized by four key components: (1) individual treatment plans and goal-setting agreements between physician and patient, (2) patient self-management and shared decision-making between doctor and patient (doctors receive training in shared decision-making), (3) follow-up care and case management (with clearly defined care coordinators), (4) “Right care at the right time” (whereby tailored arrangements are made for patients who need to be seen urgently despite long waiting times for certain services).
Incentive paymentsKey provider f inancia l incent ives are l inked to performance indicators, with providers receiving a share of the company’s prof it on the basis of individualperformance.
One of the more important innovations of the Gesundes Kinzigtal Integrated Care initiative is its financial model. Profit is derived solely from realized savings relative to the average costs of care, which is then shared between the management company and the sickness funds on the basis of a negotiated shared savings contract. Importantly, health care providers continue to be reimbursed in the same way by statutory health insurers, with additional pay-for-performance reimbursement provided by Gesundes Kinzigtal GmbH for services not normally covered but considered important to achieve better quality of care. In addition, all providers are given a share of the company’s profit on the basis of individual provider performance – an innovative alignment of the interests of heath care providers and health insurers to achieve efficiencies. Collectively, these additional payments comprise 10–15% of providers’ other income.
With regard to patient incentives, there are no direct financial incentives offered for active enrolment. Recruitment of patients relies instead on explanation of the additional benefits that actively enrolled patients receive, such as (1) improved care coordination across all sectors, (2) a “doctor of trust” who provides additional case management services, (3) care providers who have been trained in shared decision-making, (4) a closer patient–physician relationship through individualized treatment plans, (5) additional health check-ups relative to normal care, (6) access to physicians outside normal hours and (7) discounts for gym memberships among other benefits. Notably, patients are free to seek services from any non-contracted health care providers, thus preserving patients’ freedom of choice.

Slovenia Purchasing and payment review 67
Data sources and flowsA system-wide electronic patient record is used to regularly analyse patient data and identify high-risk costs. In addition, a comprehensive business intelligence infrastructure (with, for example, data warehouse and online performance measurement feedback reports for physicians) has been implemented which allows the integration and transformation of various data sources like claims data, health records from physicians, survey data and so on for performance-management purposes. A set of indicators (currently around 30), which is constantly evolving and provides relevant information, is used.
Potential success and evaluation A key concern of the Gesundes Kinzigtal Integrated Care model is the potential for risk selection and under-provision of care. Accordingly, various precautions have been put in place, which have been shown to be successful not only in preventing traditional risk selection, but in achieving an “inverted” risk selection, such that Gesundes Kinzigtal has primarily enrolled members with above-average morbidity and costs. To assess the possible under-provision of services, Gesundes Kinzigtal has voluntarily allocated a sizeable budget for independent evaluation of the system by a newly established agency, EKIV. The evaluation consists of a quasi-experimental, population-based controlled cohort trial, which seeks to compare service utilization and health outcomes between the Gesundes Kinzigtal Integrated Care model and usual care.
One potential challenge relates to whether the financial incentives given to providers are strong enough to result in greater efficiency given the fact that they are still largely reimbursed on an FFS system with capped budgets; as mentioned above, the additional payments given by Gesundes Kinzigtal GmbH account for only 10–15% of providers’ other income. Nevertheless, the first financial results of the system counter the suggestion that the new incentives are too weak. In 2007, Gesundes Kinzigtal GmbH realized an increase of 3.38% in the region’s overall contribution margin, exceeding expectations. While the realized savings cannot be attributed directly to any one component of the system, it is likely that the use of goal-setting techniques, individualized treatment plans, and additional health check-ups may have “contributed to an enhanced ‘health mindfulness’ on the part of both physicians and patients which then again might have led to lower costs” (Hildebrandt et al. 2010).
ReferencesHildebrandt H et al. (2010). Gesundes Kinzigtal Integrated Care: improving population health by a shared health gain approach and a shared savings contract. International Journal of Integrated Care, 10:1–14.