Embed Size (px)
Citation preview

BscB(IM) 6. Semester
Author: Ida Fosso Jacobsen Supervisor: Sudarshan Kumar Pillalamarri
A Financial and Strategic Analysis of
Norwegian Air Shuttle ASA
Department of Business Studies
Aarhus School of Business
03.05.2010
Abstract
The purpose of this thesis is to analyse Norwegian Air Shuttle ASA, and their economic
performance with help from both a financial and a strategic analysis. Norwegian will be
benchmarked against their largest competitors in the Norwegian and European market, being
SAS Scandinavian Airlines and Cimber Sterling, in order to conclude on how Norwegian
really is performing. The thesis will be based on public available information such as annual
reports in period 2005-2009, and newspaper articles.
Norwegian is the largest low cost airline company in Scandinavia, and the fourth largest in
Europe. They are operating to 85 destinations and 27 countries within Europe, Dubai and
Marrakech. From 2008 to 2009, Norwegian had a growth of 18% in passenger number which
caused an increase of 17.4% in their revenues. This is investigated further in the financial
analysis where Norwegian`s income statement, balance sheet, cash flow statement and key
ratio calculations are being analysed with the purpose of examining their economic
performance and to see if Norwegian has any liquidity problems. The fact that Norwegian in
November 2009 issued shares giving them about 250 million in new capital, and the major
investor HBK Holding (the owner is Norwegian`s CEO) sold some of their shares in the same
period, caused concerns around their financial situation. Especially, since Norwegian is
scheduled to receive 70 newly purchased and leased airplanes during 2008-2014. This is a
step towards them meeting their goal to further decrease their unit costs that will enable them
to continue to offer low prices, and still generate a profit. Both ROIC and Asset Turnover
show that Norwegian could be more effective in utilizing its assets, and the liquidity analysis
shows that Norwegian have problems paying both their current and non-current obligations,
taxes and interest rates.
The strategic analysis focuses on external factors that influence the airline industry such as oil
price and exchange rate. Both of these factors have fluctuated significantly over the last years,
not in a beneficial way. A higher oil price increases unit costs, as fuel is one of the major costs
in the budget, whereas a stronger dollar would not benefit as most of the suppliers trade in this
currency. It is also focused on the fierce competition within the airline industry, which is why
having as low unit costs as possible is important in order to be able to generate a profit.
Based on the financial and strategic analysis it can be concluded that Norwegian is a better
investment possibility than their major competitors SAS and Cimber Sterling.
Table of contents
1

1: Introduction.............................................................................................................................5
1.1: Problem statement................................................................................................................5
1.2: Limitations...........................................................................................................................6
1.3: Structure...............................................................................................................................6
1.4 About Norwegian Air Shuttle ASA......................................................................................7
2: Financial Statement Analysis..................................................................................................8
2.1: The European Airline Market..............................................................................................9
2.2: Income statement...............................................................................................................12
2.2.1: Operating Profit (EBIT)..........................................................................................13
2.2.2: Profitability.............................................................................................................15
2.2.3: Conclusion on the income statement......................................................................17
2.3: Balance sheet.....................................................................................................................18
2.3.1: General overview of the balance sheet...................................................................18
2.3.2: Net working capital.................................................................................................20
2.3.3: Liquidity analysis....................................................................................................21
2.3.4: The Share................................................................................................................23
2.3.4: Conclusion on the balance sheet.............................................................................24
2.4: Cash Flow Statement ........................................................................................................25
2.4.1: Cash Flow from operating activities.......................................................................25
2.4.2: Cash Flow from investing activities.......................................................................26
2.4.3: Cash Flow from financial activities........................................................................27
2.4.4: Change in cash........................................................................................................27
2.4.5: Cash flow ratios......................................................................................................28
2.4.6: Conclusion on the cash flow statement..................................................................30
2.5: Conclusion on the Financial Statement Analysis..............................................................31
3: Strategic Analysis.................................................................................................................32
3.1: PESTEL analysis...............................................................................................................32
3.1.1: Political Aspects.....................................................................................................33
3.1.2: Economical Aspects................................................................................................33
3.1.3: Socio-cultural Factors.............................................................................................34
3.1.4: Technological Factors.............................................................................................34
3.1.5: Environmental Aspects...........................................................................................34
3.1.6: Legal Aspects..........................................................................................................35
2

3.1.7: Summary of the PESTEL analysis..........................................................................36
3.2 Porters 5 forces...........................................................................................................36
3.2.1: The threat of potential new entrants......................................................................37
3.2.2: The bargaining power of suppliers........................................................................37
3.2.3: The bargaining power of buyers.............................................................................38
3.2.4: The threat of substitutes..................................................................................38
3.2.5: The extent of competitive rivalry...........................................................................39
3.2.6: Summary of Porters 5 forces analysis...................................................................39
3.3: Conclusion on the strategic analysis – SWOT analysis.....................................................40
3.3.1: Strengths.................................................................................................................40
3.3.2: Weaknesses.............................................................................................................41
3.3.3: Opportunities..........................................................................................................41
3.3.4: Threats....................................................................................................................42
4: Conclusion on the Strategic and Financial Analysis of Norwegian.....................................43
5: Bibliography....................................................................................................................45
6: Appendix7
Appendix 1: Norwegian`s route network
Appendix 2: Norwegian`s revenue: domestic and international
Appendix 3: Norwegians fleet 2009-2014
Appendix 4: Overview oil price in period 2005-2009
Appendix 5: Overview exchange rate USD/NOK in period 2005-2009
Appendix 6: Overview of the share development for Norwegian in period 2005-2009
Appendix 7: Norwegian Air Shuttle ASA corporate structure
Appendix 8: Cimber Sterling corporate structure
Appendix 9: Scandinavian Airline Group corporate structure 2009
Appendix 10: Norwegian: Income Statement 2005-2009
Appendix 11: Norwegian: Balance Sheet
Appendix 12: Norwegian: Cash Flow Statement
Appendix 13: Norwegian: Traffic Figures
Appendix 14: Norwegian: Calculations
Appendix 15: Norwegian: Share
Appendix 16: Norwegian: Key ratios
Appendix 17: SAS: Income statement 2005-200957
3

Appendix 18: SAS: Balance Sheet
Appendix 19: SAS: Cash Flow Statement
Appendix 20: SAS: Traffic numbers
Appendix 21: SAS: Calculations
Appendix 22: SAS: Cash Flow ratios
Appendix 23: SAS: Share
Appendix 24: Cimber Sterling: Income Statement 2004/2005-2008/2009
Appendix 25: Cimber Sterling: Balance Sheet
Appendix 26: Cimber Sterling: Cash Flow Statement
Appendix 27: Cimber Sterling: Calculations
Appendix 28: Cimber Sterling: Key ratios
1: Introduction
4

The financial crisis has hit the air traffic industry hard. The International Air Traffic
Association write in their report that 2009 has been the worst year for the industry since the
second world war, with a decline in overall passenger demand of 3.5%. This will lead to a
total loss of 11 billion US Dollars for the industry (IATA, 2010).
However, the market can see a clear change in buying behaviour where people tend to be
more cost oriented. Low cost companies such as Norwegian Air Shuttle ASA, from now
referred to as Norwegian, are experiencing growth and an increase in market share compared
to companies such as SAS, known for having higher prices, which are having huge economic
problems. This can clearly be seen in Norway where SAS has lost a substantial part of their
domestic market share to Norwegian over the last years.
In November 2009, Norwegian`s board decided to issue up to 1 620 000 new shares, which
will give them around NOK 250 million kroner in new capital. At the same time, HBK
Holding AS, the major investor in Norwegian, announced that they are selling 970 000 shares
in the company. Norwegian`s CEO, Bjørn Kjos which also is the main owner of HBK
Holding AS, says that this is done because the company wants to strengthen their equity and
be prepared for new growth possibilities in the future1.
1.1: Problem statement
The purpose of this thesis is to look at the economic performance of Norwegian Air Shuttle
ASA and external factors that might influence the air shuttle industry. Norwegian and the
board’s decision on issuing new shares will be the focus of this report, to see if the company
have liquidity problems. When a company is issuing new shares and insiders within
Norwegian are selling shares at the same time, it can make potential investors nervous and be
a sign that something significant is about to happen.
This will be investigated with help from these questions:
- Analyse the financial situation for Norwegian Air Shuttle ASA by looking at the
income statement, balance sheet and the cash flow statement in years 2005-2009.
- Calculate and analyse key ratios to look at the economic performance of Norwegian.
- Which external factors are affecting Norwegian?
1.2: Limitations
1 Andersen, Tor Øyvind; Brander, Anna Sandvig: http://e24.no/boers-og-finans/article3359145.ece
5

The thesis will only focus on the European air shuttle market, which is the market where
Norwegian mainly is operating. The thesis will compare Norwegian against their two largest
competitors in the Scandinavian and European market, Cimber Sterling ASA and
Scandinavian Airlines AS (SAS). It is important to be aware of that SAS is not a low cost
airline company, but are included as this is Norwegian`s biggest competitor in the
Scandinavian market.
All the information about Norwegian, SAS and Cimber Sterling has been collected from their
annual reports in years 2005-2009, and for Norwegian interim report 2009 as their annual
report for 2009 not yet has been published. Information is also collected from Norwegian
newspaper articles, since there has been no contact with the companies. No information has
been collected after April 5, 2010. In the financial analysis SAS`s numbers are in billions,
while Norwegian and Cimber Sterling`s numbers are in million.
1.3: Structure
Section 2: Financial Statement Analysis
In the economic part of the thesis, numbers from the annual report over the five past years
(2005–2009) and interim reports (2008-2009) will be used. First the income statement,
balance sheet and the cash flow will be analysed to see if there are any large changes that we
should be concerned about. Further on the most relevant key ratios for the paper will be
calculated and used when analysing Norwegian`s performance and liquid situation. Even
though the accounts look good, they may in some cases show a misleading picture of the
actual situation, and therefore analysing key ratios are important as it gives a more accurate
analysis and gives a clearer picture of the actual situation. Therefore measuring the
profitability and liquid situation of Norwegian and its competitors will be the focus in this
paper. In the profitability analysis, the DuPont method will be used to measure ratios as ROIC
and ROE. Liquidity analysis is in focus in this thesis, as it looks at if a company is able to pay
its short term debt.
A comparison between Norwegian and Cimber Sterling and SAS will be created by using key
ratios, because then we can see how Norwegian is performing compared to their competitors.
Section 3: Strategic Analysis
6

The thesis will continue with a strategic analysis of the external factors influencing
Norwegian. Methods as the PESTEL analysis and Porter`s 5 Forces will be used to look at the
environment surrounding the organisation. The PESTEL analysis will be created as a list of
the political, economical, socio-cultural, technological, environmental and legal aspects of the
environment the companies are in. Porter`s 5 forces will be used to look at the competitive
environment surrounding Norwegian. The internal part of the strategic analysis is excluded as
there has been no personal contact with Norwegian, but instead strengths and weaknesses are
being included in the SWOT analysis.
1.4: About Norwegian Air Shuttle ASA
Norwegian Air Shuttle ASA was established January 22, 1993 as a company supposed to
continue “Busy Bee of Norway AS” air traffic on the west coast of Norway in cooperation
with Braathens S.A.F.E. In 2002, Norwegian decided to expand and to establish themselves as
a strong player in the domestic air travel industry within Norway, dominated at that time by
Scandinavian Airlines (SAS). Norway is an attractive market due to the large geographical
distances, and the routes between Oslo-Trondheim and Oslo-Bergen is on the list of busiest
routes within Europe. Norwegian decided to establish themselves as a low cost carrier and
started operating on the four busiest routes from Oslo to Trondheim, Bergen, Stavanger and
Tromsø with leased Boeing 737 300 airplanes. The beginning of 2000 was affected by a
recession and travellers were therefore interested in the increased competition and the lower
prices offered by Norwegian2.
Norwegian are following a low cost strategy, where they seek to offer their broad target group
of customers the lowest possible price. This is said to be their competitive advantage. Their
business idea turned out to be successful and had the perfect timing during the financial hard
times, and only after a few months their market share was between 10%-15%. In 2003 they
were listed on the Oslo Stock Exchange, and have since then expanded with both new
domestic and international routes, operating out of new places such as Warsaw in Poland,
Stockholm in Sweden and Copenhagen in Denmark. The company has also used their brand
name to start up other companies as can be seen from their corporate structure (appendix 7).
Bank Norwegian is an internet bank they own 20% of, and Call Norwegian AS that offers
cheap phone and broadband subscriptions, is 100% owned.
2 http://www.norwegian.com/about-norwegian/facts/history/
7

In 2007 they entered into an agreement with Boeing to purchase and lease total of 70 (48
owned, 22 leased) new aircrafts of type 737 800 aircraft in the period 2008 to 2014 (Appendix
3). The new planes will fit into their new strategy of a lower cost base since the new airplanes
have lower maintenance costs and fuel consumption. The plan is to deliver back the leased
airplanes when the rest of the new fleet are delivered by 2014.
Today (April 2010) Norwegian is the biggest low cost airline company in Scandinavia and the
fourth largest in Europe. Their business idea is to give everyone the possibility to travel by air
which is why they follow the low ticket prices strategy. Their goal is to establish themselves
as the preferred supplier of air travelling in selected markets (Annual report 2008; p8).
Norwegian is constantly opening new routes and by end 2009 they has 238 routes to 93
destinations across Europe, North Africa (Marrakech) and Middle East (Dubai) (Appendix 1)
with total of 10.8 million passengers in 2009, a growth of 18% from previous year.
2: Financial Statements Analysis
When analysing financial statements, historical data from the last five years are included to
get an overview of a company’s economical performance. The purpose of this is to discover
the financial value drivers that give the company economic value, and calculating key ratios
will help us find these factors. It is important to get an overview of the statements and to
calculate key ratios, because in some situations a company can make financial statements look
better than the actual situation is (Sørensen; 2009).
Financial statements are divided into income statement, balance sheet and cash flow statement
and they all give us economic information from different aspects. Calculating financial ratios
is important in order to measure the performance of a company, either how productive or how
profitable it is and their liquidity situation. Key ratios are however useless, if not
benchmarked to either a company’s performance over several years, the overall industry, or
another company within the same industry. Such data can create a useful insight of the
company’s performance and find strengths, opportunities, threats and weaknesses. Norwegian
will be compared against two of their biggest competitors, SAS and Cimber Sterling, where
numbers from past five years are used. There are many ratios that can be used to analyse a
company’s performance, and I have chosen to calculate ratios important to this company that
will explain the economic situation and answer the problem statement (Møller 1991).
8

In this thesis years 2005 to 2009 will be analysed and then key ratios will be calculated.
However, in the key ratio analysis only years between 2007 and 2009 will be analysed as this
is concluded to give sufficiently accurate result. Norwegians Annual report 2009 has not yet
been published, therefore analyses of the balance sheet and cash flow statement is not done
for this year, which also affects some of the key ratios. The financial reports for Norwegian
and SAS are following IRFS, but only accounting years from 2006/2007 are IFRS for Cimber
Sterling and therefore previous years will not be analysed.
Consolidated financial statements are a common statement for the parent company and all its
subsidiaries, and are being used in this analysis because it can be seen that all the subsidiaries
within the group are more or less related to the same activities (Appendix 7, 8, 9). However
we have to be aware of that the consolidated statement often gives higher productivity for
each company and that its performance might look better than the actual situation (Schack
2002: p 245).
2.1: The European Airline Market
As stated earlier; the thesis will focus on the European airline market. This broad market
includes both business and pleasure travellers in order to identify as many strategic options as
possible (Lynch 2006: p 81).
Norwegian has had a huge increase in both passengers and revenue over the last years,
carrying close to 11 million passengers in 2009. This increase of 18% from 2008 is related to
the increase in market share in both the Norwegian domestic market and the low cost routes to
the most popular destinations in Europe. The Norwegian market is duopoly, with Norwegian
and SAS as the only operators and their market share development over the last years can be
seen in figure 1. Norwegian has increased their market share in all years, while SAS has
experienced a decrease in market share through the same period. Cimber Sterling`s traffic
numbers is not analysed.
9

Figure 1: Market share development for SAS and Norwegian from 1. tertial innland og utland:
http://www.avinor.no/avinor/trafikk/20_Reisevaner
Figure 2 shows the market share development for airline travel from Norway to destinations
abroad in year 2005 and 2009. The same development as in figure 1 can be seen here. In 2005
SAS was clearly the largest operator followed by Norwegian and KLM. A change can be seen
in 2009 as Norwegian has increased their market share whereas both SAS and KLM
decreased theirs. This indicates that in the recession, low cost airline companies were choosed
over the more traditional airline companies.
2005
NorwegianSASKLMRyanairLufthansaOther
2009
NorwegianSASKLMRyanairLufthansaOther
Figure 2: Market share from airline travel between Norway and destinations abroad. Numbers are from:
http://www.avinor.no/avinor/trafikk/20_Reisevaner
In order to understand Norwegian and how they are operating compared to their competitors,
their cost base it is important to look at (Appendix 13, 20). Norwegian`s numbers of airplanes
and routes have increased over the years, as have capacity/production (Available Seat
Kilometre (ASK)). An overview of Norwegian`s and SAS` unit costs and yield can be seen in
10

figure 3. Norwegian`s yield (income per passenger kilometre) for 2009 has been decreasing
compared to 2008 to 0.60, even though there has been a growth in passengers. This is caused
by the increase in fuel cost, increasing distances and massive cuts in ticket prices. SAS on the
other hand has had a stable yield at 1.22 in period 2007-2008.
Remaining successful in the highly competitive industry is all about having as low unit costs
per seat per kilometre as possible3. Unit costs are affected by external events as fuel price,
distribution costs, airport charges and internal costs as staff costs, type of airlines used and
destinations (Doganis; 2002 p 103). Norwegian`s unit costs have decreased 13% from its peak
in 2008 at 0.56 to 0.49 in 2009. The decrease in units cost has been due to the decrease in fuel
price and exchange rate in dollars and euro since 2008. Ryanair, a company Norwegian does
not see as a major competitor as they have flights to remote airports, has unit costs at 0.29.
Norwegian is expecting their unit costs to continue to decrease to a level below 0.40, when
they are replacing their fleet with all new and more environmentally friendly aircraft that will
yield higher capacity and lower pollution.
2007 2008 20090
0.2
0.4
0.6
0.8
1
1.2
1.4
Norwegian unit costsNorwegian yieldSAS unit costsSAS yield
Figure3: Overview of unit costs and yield for Norwegian and SAS from Annual Report 2007-2009
Figure 3 shows that Norwegian is a low cost based airline company compared to their
competitor SAS, which has both higher unit costs and yield. SAS has historically been one of
the companies with the highest unit costs, but has been forced to decrease its unit costs when
the low cost airlines were established to keep up with the competition and generate a profit.
SAS has tried to compete by offering lower prices, however, this strategy failed as SAS has a
higher cost base, and Norwegian replied by decreasing their prices even more. Therefore SAS
3 Kaspersen, Line: http://www.dn.no/forsiden/naringsliv/article1836896.ece
11

is focusing on a different strategy offering faster check in, free coffee/tea, newspapers, bonus
card and advantages from their membership in Star Alliance for their customers (SAS Annual
Report).
2005 2006 2007 2008 2009 -
10,000,000
20,000,000
30,000,000
40,000,000
50,000,000
60,000,000
70,000,000
NorwegianSASCimber Sterling
Figure 4: Own creation from Annual Reports for Norwegian, SAS and Cimber Sterling in period 2005-2009.
The overview of the three companies’ revenues in period 2005-2009 (Figure 4) shows that
SAS clearly has the highest revenues of Norwegian and Cimber Sterling. However, their
revenues have been decreasing in the period compared to both Cimber Sterling`s and
Norwegian`s which has had large growth in last five years. This again indicates that low cost
companies such as Norwegian and Cimber Sterling have increased their revenues in the
recession, while the traditional airline companies with higher cost bases such as SAS have had
problems. The explanations behind this development will be analysed further in the income
statement.
2.2: Income statement
The income statement reports how shareholders` equity has increased or decreased as a result
of operating and financial activities for a specific accounting period. Operating activities are a
company’s primary activities that create value to a company, while financial activities are
activities not directly related to the area of business (Pennan: 2001, p 32). Norwegian`s
operating revenues are all included in the income statement being ticket sales, other passenger
related revenues, and other revenues (table 1).
12

2.2.1: Operating Profit (EBIT)
The equation operating profit, also called earnings before interest and tax (EBIT), is a result
of revenues minus expenses:
Operating profit=Revenues−expences
Operating profit is analysed more closely in order to get a more accurate overview of where
Norwegian`s revenues and expenses come from.
2009 2008 2007 2006 2005Ticket revenue 6 389 406 5 641 533 3 956 000 2 879 400 1 931 663 Other passenger related revenue 788 655 463 609 212 000 62 000 40 583 Other revenue 131 129 121 271 58 202 Total operating revenues 7 309 189 6 226 413 4 226 202 2 941 400 1 972 246 Operational expences 4 318 731 4 892 727 3 171 818 2 368 636 1 504 338 Payroll 1 303 299 1 076 068 622 189 412 940 298 223 Depreciation, amortization and impairment 148 882 129 611 74 044 51 070 29 316 Other operating expences + leasing 966 411 318 094 224 200 139 264 111 091 Other losses/gains 147 767 Total operating expences 6 737 323 6 564 267 4 092 251 2 971 910 1 942 968 Operating profit (EBIT) 571 866 (337 854) 133 951 (30 510) 29 278 Profit (loss) after tax 446 251 3 944 84 580 -21 997 27 980
Table 1: Summary of income statement Norwegian; Annual reports 2005 – 2008, Interim report 2009 Q4.
Norwegian`s revenues have had a steady increase over the years mostly connected to the
growth in passengers. In appendix 2, an overview of how their revenues are divided between
domestic and international travels can be seen. In 2009 revenues coming from domestic
travels increased 26% since 2008, compared to 12% within the same period on international
travels. The income statement to Norwegian are dividing their total operating revenues into
ticket revenues, other passenger related revenues and other revenues as it is related to fees and
third party products. Total operating expenses has also had an increase over the years. Other
operating expenses + leasing costs and depreciation are both increasing due to prepayments
and purchase of new airplanes and also the increased oil price. The growth in production
(ASK) and the acquisition of Norwegian Air Shuttle Sweden AS in 2007 are said to be the
main reasons for the increase in both expenses and revenues.
Norwegian has had a varied operating profit (EBIT) over the years, leading to negative results
in both 2006 and 2008 where expenses are exceeding revenues. These years are also giving
loss (2006) and extremely low profit (2008), which can be explained by the sudden increase
in production (ASK) and passenger traffic and therefore the need to utilize 19 airplanes the
13

last quarter compared to 14 normally. Profit after tax has never been better for Norwegian
than in 2009. The huge increase from 2008 is mainly due to the increase in production and
market share in the Norwegian and the European market.
SAS 2009 2008 2007 2006 2005Total operating revenues 44 992 53 052 50 671 60 924 62 688 Total operating expences 48 074 53 817 49 378 59 651 61 315 Operating profit SEK -3 082 -765 1 293 1 273 1 373 Profit (loss) after tax -2 947 -6 321 636 4 740 255 Cimber Sterling 2008/2009 2007/2008 2006/2007Total operating revenues 1 297 757 1 193 046 970 791 Total operating expences 1 299 476 1 119 503 917 197 Operating profit DKK -1 719 73 543 53 594 Profit (loss) after tax -58 925 56 007 25 845
Table 2: Summary of income statement: SAS Annual report 2005-2009; Cimber Sterling Annual report 2008/2009
SAS as a traditional airline company has had a decreasing development in both revenues and
expenses which lead to a negative operating profit and loss after tax in years 2008 and 2009.
Reasons behind this negative development are the decreasing ASK (production), as a result of
the increased competition and loss of market share. Because of the negative results, SAS is
dependent on new capital to survive. Therefore they managed to convince their owners in
2009 (government in Norway, Sweden, Denmark) to give new capital of 6 billion SEK, but
this didn’t help the company that again are in financial trouble. The group has again asked
their owners for SEK 5 billion in new capital. The owners will oblige, but in return are
expecting a stronger financial position next year with SAS cutting their costs drastically4.
Cimber Sterling as a low cost company has had an increase in both their revenues and
expenses over the years. In 2008/2009 expenses are exceeding revenues which cause a
negative operating profit of DKK -1 719 million and a loss after tax. This is explained by
Cimber Sterling Group AS taking over the bankrupted airline company Sterling Airlines AS
in this accounting period. In this connection the group expanded as a step towards them being
a bigger and more dominating actor in the European airline market. Investments in new
planes, new staff and marketing of the company are expenses that dominated this year. Loss
after tax this year is also explained from an increase in financial expenses, caused by the
increased exchange rate USD/DKK on their loans.
4 Sparre, Martin Riber; Kaspersen, Line: http://www.dn.no/forsiden/borsMarked/article1834613.ece
14

2.2.2: Profitability
When measuring profitability ratios we will look at if the company are earning enough in
order to generate a satisfying profit (Penman: 2001, p 366). When analysing Norwegian, the
profitability key ratios will be based on Return on Equity (ROE). This is done because it can
be further decompounded into financial leverage and Return on Invested Capital (ROIC) in
the DuPont analysis.
Assets
Turnover
ROIC Profit
MarginROE Financial
Leverage
Figure 5: Three step DuPont decomposition from Sørensen: 2009: p.255, adjusted by me
The DuPont model (figure 5) is used in this thesis because it is a good approach to use when
determining factors influencing Norwegians profitability. It decomposes Return on Equity
(ROE) in two components being ROIC and financial leverage, where ROIC are further being
decomposed into assets turnover and profit margin. The ratios except profit margin will need
numbers from the balance sheet (assets and equity), but are included in the DuPont analysis as
it is explaining how effective and profitable a company is. Financial leverage is a ratio that
analyses to which degree net operating assets are financed by net financial obligations or
equity, and therefore this ratio will be calculated and analysed in the liquidity analysis
(Pennan 2001: p 354) (Sørensen 2009: p 255).
Key ratio 2009 2008 2007 2006 2005ROE (%) 35,7 % 0,6 % 22,0 % -10,9 % 19,8 %Return on Invested Capital (ROIC) 12,3 % 0,2 % 4,6 % -2,6 % 0,07Profit Margin (%) 6,1 % 0,1 % 2,0 % -0,7 % 1,4 %EBIT Margin (%) 7,8 % -5,4 % 3,2 % -1,0 % 1,5 %Asset Turnover 1,46 1,96 1,81 2,77 2,92
Table 3: Key financial ratios Norwegian: calculations with guidelines from “Den Danske Finansanalytikerforening” (The Danish Society of Investment Professionals)
15

Return on Equity (ROE) is the first ratio to investigate in the profitability analysis. It is used
to see what profit shareholders can expect compared to other investments possibilities e.g. the
interest rate you get in the bank (around 3% - 4%). Norwegian`s ROE have been changing
over the last years, with a close to zero result in 2008 which reflects the same development as
profit/loss for the specific year. However, in the other years ROE has been high, including
2009 where it is 35.7%, giving a good payoff compared to other investments possibilities.
Even though Norwegian`s expected return in most of the accounted years is good,
shareholders need to consider the risk of losses as the airline industry are highly competitive
and therefore also risky. Normally, industries that are risky give a higher ROE, and it is
therefore important to take risk in consideration, as the money could be placed in a bank at a
interest rate that is more or less stable.
Return on Invested Capital (ROIC) measures how operational efficient a company is using its
available assets, excluding how the company is financed. This is why ROIC is such a good
ratio for comparing companies that might have different structures. ROIC are in 2008 0.2%,
and in 2009 12.3% which is a good development for the company. ROE are automatically
affected by ROIC, and therefore the bad ROIC in 2008 can explain the bad ROE the same
year. We should therefore take a deeper look at ROIC to see what could be the reason for
these negative ratios, which is why ROIC are further decomposed into profit margin and
assets turnover.
Profit margin explains how much of the revenue that creates profit and how much that are left
to cover tax, interest e.g. The table shows that Norwegian`s profit margin are at a level of
0.1% in 2008 and 6.1% in 2009. In 2008, Norwegian has had a low profit after tax that can
explain the low profit margin. Assets turnover is an activity ratio that explains how efficient
the company utilizes its assets to produce revenue; how operationally efficient the company
is. If this ratio is high, it could mean that the company is managing to use its assets efficiently
to generate sales and profits. Norwegian does not have the highest ratios and the fact that they
are decreasing over the years indicates that Norwegian is not that operationally efficient.
Since operating profit were analysed in the first part of the income statement, EBIT margin is
included in the ratio analysis. It is a good ratio to use when comparing companies within the
same industry to see how effective they are and how much they have grown over the years.
As EBIT margin is comparing revenues and expenses, this ratio is negative in 2008 as
16

expenses exceeded revenues this year. In the other years it looks good and the ratio is
increasing, which shows that they have grown over the years.
SAS 2009 2008 2007 2006 2005ROE -29,4 % -48,9 % 3,8 % 33,3 % 2,1 %ROIC -7,0 % -15,2 % 1,3 % 9,6 % 0,5 %Profit Margin -6,6 % -11,9 % 1,3 % 7,8 % 0,4 %EBIT Margin -6,9 % -1,4 % 2,6 % 2,1 % 2,2 %Asset Turnover 1,06 1,22 1,04 1,19 1,08Cimber Sterling 2008/2009 2007/2008 2006/2007ROE -32,5 % 27,7 % 12,7 %ROIC -0,05 % 0,05 % 0,03 %Profit Margin -4,5 % 4,7 % 2,7 %EBIT Margin -0,1 % 6,2 % 5,5 %Asset Turnover 1,19 1,14 1,11
Table 4: Key ratios SAS and Cimber Sterling
Norwegian`s profitability key ratios are compared against SAS` and Cimber Sterling` to see
how well they are performing and how efficient they are. Both SAS and Cimber Sterling has
the same development as their ROE, ROIC, profit margin and EBIT margin are all negative
over the last year. This is not a positive development and it can be concluded that they are not
profitable or using its available assets as efficient, because they have not created any profit
over the last years. A potential investor will need to consider the risk as an investment has not
lead to any payoff in 2009.
2.2.3: Conclusion on the income statement
Despite the competitive market and the economic recession, Norwegian experienced 2009 as
one of their best years with a continued growth in revenues (17.4%), EBIT and profit after
tax. The growth is related to the increased in ticket sales, which was expected as the company
has continued to increase their market share both domestically within Norway and in the rest
of Europe. Due to investments in a new fleet, their expenses also increased over the last years.
The profitability analysis was made on the background of the DuPont analysis where ROE
where decomposed into ROIC as was further decomposed into profit margin and assets
turnover. Many of the key ratios for Norwegian are in 2008 low due to the decrease in profit
after tax this year. However, the ratios in 2009 are good. Return on Equity (ROE) is at a high
level in 2009, meaning that shareholders can expect higher return than from other investments
possibilities. Because of the fluctuating numbers through the years, this has to be seen in
connection with the high level of risk there is to invest in a competitive market like the airline
industry. ROIC and asset turnover analyses show how efficient Norwegian is using its assets
17

to create revenue. ROIC are at a low level but show an increasing tendency compared to
previous years, whereas asset turnover is at a decreasingly low level, indicating that there are
room for improvement. Profit margin is increasing and at a high level in 2009, meaning that a
large amount of the revenue creates profit, and that there are some left to cover tax and
interest rates.
SAS and Cimber Sterling have negative ratios in ROE, ROIC, profit margin and EBIT margin
in 2009. This indicates that Norwegian has better efficiency and profitability ratios than their
competitors, being better at utilize its assets and create profit. However, further analysis with
liquidity ratios is necessary in order to come up with a final conclusion.
2.3: Balance Sheet
The balance sheet is listing a company`s assets, equity and liabilities in a given period of time,
and are used when investigating a company’s liquidity and financial leverage. Assets are
investments expected to generate future profit, equity are the claims by the owners and
liabilities are claims to the payoff from the assets by claimants other than owners. Both the
assets and liabilities are divided into current and non-current, where current are
generating/pay cash within a year and non-current are long term obligations (Pennan 2001: p
28). To sum up, the balance sheet is an overview of the company’s investments and claims on
return of these investments, and as the equation states: shareholders equity equals the
difference between assets and liabilities:
Equity=Assets−Liabilities
The focus of this report will be on the balance sheet and the cash flow statements financial
ratios as it is measuring liquidity, as the purpose of this thesis is to analyse Norwegian and
their financial situation.
2.3.1: General overview of the balance sheet
2009 2008 2007 2006 2005Assets 5 021 964 3 178 884 2 331 097 1 061 944 675 822 Liabilities 3 420 254 2 281 515 1 822 824 801 217 534 236 Equity 1 601 710 897 368 508 273 260 727 141 586
Table 5: Balance sheet for Norwegian; Source: Annual Report 2005-2008, Interim report Q4 2009.
Norwegian`s assets, liabilities and equity have increased rapidly over the years (appendix 11).
In 2009 non-current assets accounted for 52% of total assets and were characterized with the
arrival and prepayments of the new airplanes that will arrive within 2014, increased book
18

value of airplanes and new de-icing equipment. Cash and cash equivalent is the value of
assets that are cash or that can be converted into cash immediately, and is seen as the main
current asset. It has increased with more than MNOK 800 to NOK 1 408 475 000 in 2009.
Having this much cash available makes you wonder what Norwegian will spend it on and why
it is so large. Some theories can be that the company wants to pay out dividends, down
payment of debt or payment of tangible goods (Sørensen 2009: p 196). For Norwegian, the
third theory is most likely as they are investing in new airplanes and easy accessible cash can
be a good thing to have in case of unexpected costs (changes in currency e.g.). Trade and
other receivables have also increased over the years with a peak in 2008 when new procedures
with credit card settlements were developed. All together these are the main events that have
caused the assets to increase in 2009. Liabilities also increased in the account period and
looking at both current and non-current liabilities, the net bearing interest liabilities including
purchase and prepayment of new airplanes are the main event that has caused liabilities to
increase. Borrowing has increased over the years and it contains an unsecured bond issue with
floating interest rates.
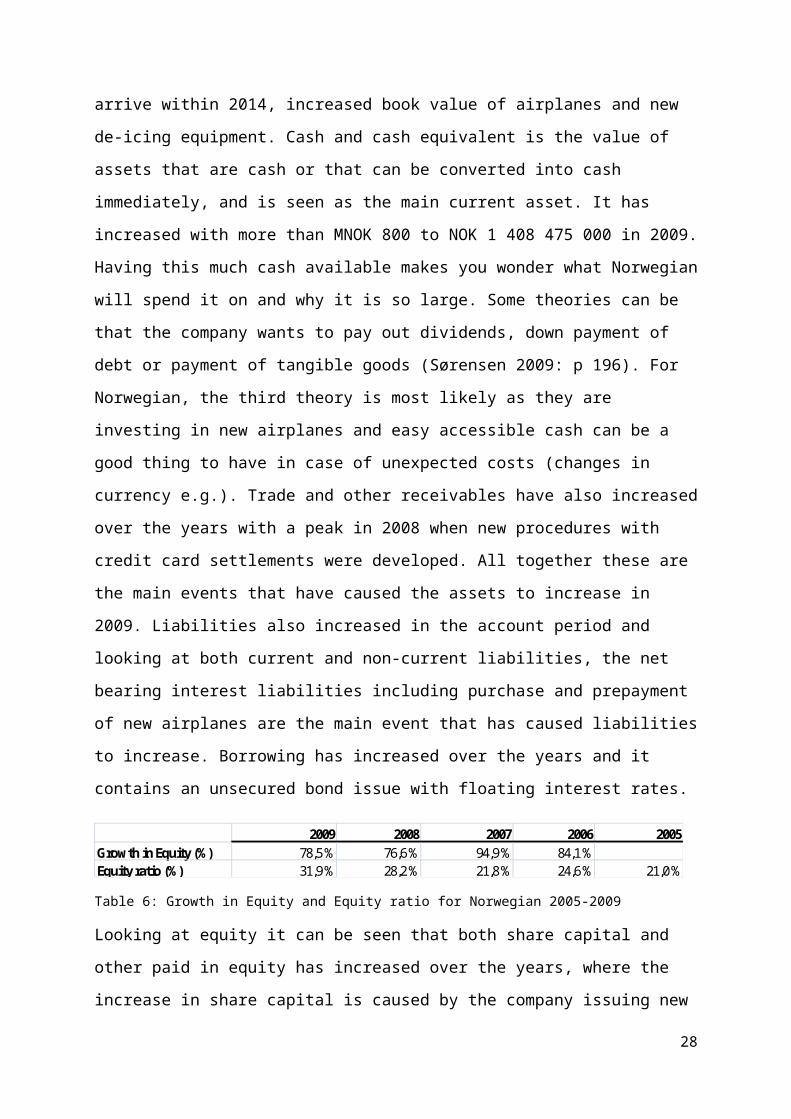
2009 2008 2007 2006 2005Growth in Equity (%) 78,5 % 76,6 % 94,9 % 84,1 %Equity ratio (%) 31,9 % 28,2 % 21,8 % 24,6 % 21,0 %
Table 6: Growth in Equity and Equity ratio for Norwegian 2005-2009
Looking at equity it can be seen that both share capital and other paid in equity has increased
over the years, where the increase in share capital is caused by the company issuing new
shares. The growth in equity of 78.5% between 2008 and 2009 and the increasing equity ratio
are seen as a positive thing for a company, but when the cash is coming from issuing new
shares it could indicate that the company is experiencing liquidity problems. To reject this
theory Norwegian stated in a press release that the reason behind the issuing of new shares is
to strengthen their equity, secure their strong market position and to prepare the company for
continued growth possibilities. The CEO Bjørn Kjos says that now that they are becoming
more international due to the expansion over the last years, they want to attract new investors
to invest in the company5.
It is also important to say that Norwegian has not yet paid dividends. They have a rule that
this will not be done before the financial situation is more stable and they have an equity ratio
above an appropriate level (Annual report 2008: p 19). SAS have not paid out dividends in
5 Andersen, Tor Øyvind; Brander, Anna Sandvig: http://e24.no/boers-og-finans/article3359145.ece
19

period 2005-2009, and state that this will not be done before their financial situation is at a
more stable level. Cimber Sterling did pay out dividends in year 2007/2008.
SAS 2009 2008 2007 2006 2005Assets 42 495 43 364 48 770 51 164 58 016 Liabilities 31 106 34 682 31 621 34 776 45 935 Equity 11 389 8 682 17 149 16 388 12 081 Cimber Sterling 2008/2009 2007/2008 2006/2007Assets 1 090 212 1 045 645 874 780 Liabilities 927 834 845 212 671 810 Equity 162 378 200 433 202 970
Table 7: Balance sheet overview: SAS and Cimber Sterling
SAS has had a decrease in assets over the last years and decrease in liabilities except from an
increase in 2008. Equity has varied over the years but is increasing again after a decrease in
2008. The decrease in assets is mainly due to a decrease in intangible assets (goodwill)
because of the sale of Air Baltic 4th quarter of 2008. The decrease in liabilities is caused by
purchase of new airplanes and income received from the sale of Air Baltic. The increase in
equity is caused by issuing new shares and it is important to mention that the company
received SEK 6 billion to cover their massive loss in 2008 (page 14). SAS`s cash and cash
equivalent is also looked at to see if they have had the same development as Norwegian. Cash
available is also large in SAS, but has a decreasing tendency compared to previous years.
As for Cimber Sterling, it can be seen that they have had the same progress as Norwegian
with an increase in both assets and liabilities. However, their equity has decreased over the
last three years. The increase in assets and liabilities is caused by them purchasing Sterling
Airlines in 2008/2009. Cimber Sterling`s cash and cash equivalent has been decreasing from
its peak in 2006/2007 to a more stable level in 2008/2009. Therefore it can be concluded that
looking at SAS and Cimber Sterling, there is nothing in the overall industry that can explain
the reason behind Norwegian having as much cash available.
2.3.2: Net working capital
Net working capital is calculated as current assets – current liabilities and tells us if the
company is able to pay its current liabilities with current assets. It is therefore important not to
include financial items that are not involved in generating sales (Pennan 2001: p 359). Cash
and cash equivalents are included in the calculation as the majority are cash in bank and short
term deposits with maturity of three months or less being easy accessible (Annual report
2008: note 24, p. 61).
20

A positive net work capital indicates that the company are not having any current liquidity
problems. Norwegian net work capital has been positive in all years except from 2008 and
2009 (appendix 14). This indicates that Norwegian has not had any problems paying their
short term debt in earlier years, except over the last two years. However, it is important to
notice that if it wasn’t for the large and increasing cash and cash equivalent the net working
capital would have been negative in the other years as well. Looking at 2008 and 2009, net
working capital is negative and it seems that Norwegian in this year had problems paying
their short term liabilities with their short term assets. It could also just be an indicator
towards that Norwegian this year invested heavily and had a huge growth. Therefore further
investigation with liquidity analysis will be necessary in order to see how serious their
problems are.
2.3.3 Liquidity analysis
Norwegian`s liquid situation will be investigated with background from the balance sheet. It
is important to measure liquidity ratios to see a Norwegian’s ability to meet current
obligations with assets that can be quickly converted into cash. This because liquidity tells us
about a company’s ability to repay non-current debt, and financial leverage tells us the
relative size of financial assets.
Financial leverage (Debt to equity) 2,14 2,54 3,59 3,07 3,77 Current ratio 0,92 0,95 1,04 1,01 1,07Quick ratio 0,90 0,93 1,01 0,98 0,99Solvency 46,8 % 39,3 % 27,9 % 32,5 % 26,5 %
Table 8: Norwegian: Liquidity ratios
Quick ratio looks at the company’s ability to repay current liabilities with current assets in the
short term perspective, and therefore inventory is excluded in the calculation because it will
take a longer period of time to convert this into cash. The quick ratio is only in year 2007
above its optimal level at 1, but it is close to the optimal level in the other years. The concern
is that the ratio has had a decreasing tendency since 2007. Current ratio measure Norwegian’s
ability to cover current liabilities with current assets, looking at it from a longer perspective
that the quick ratio, and therefore inventory are included. The current ratios optimal level is
around 2, and it can be seen that the ratio has not been at a satisfactory level in any of the
years and there is a decreasing tendency. Because of the decreasing tendency in both quick
and current ratio it can be said that Norwegian is experiencing payment problems in the short
and longer run. They should focus on the decreasing tendency that can indicate them having
21

problems creating liquidity. The solvency ratio measures a company`s ability to meet its long
term commitments. Norwegian has had a high and increasing solvency ratio above 20%, over
the last three years indicating that they are a financially healthy company, and that there are
no sign of them failing its obligations. Because of the high degree of debt and the fact that
solvency it is calculated with equity, it does take the cash from the current share issue in
consideration. Therefore it is important to notice that this liquidity ratios might not give the
right picture of the actual situation, and it is therefore important to look at it in relation to the
cash flow ratios in the next chapter (Schack 2002: p 72).
Financial leverage ratios measures to which extent net operating assets are financed by net
financial obligations or by equity (Pennan 2001: p 339). For Norwegian, debt to equity ratio is
analysed because it measures how much of the company is leveraged in debt. If this number is
high, it could mean that the company rely on debt as a source of financing, which is the case
for Norwegian. Debt to equity ratio has been at a level above 2 in the last years, however,
there is a decreasing tendency which is good as Norwegian then rely on debt as a source of
financing in a decreasing way.
SAS 2009 2008 2007 2006 2005Quick ratio 0,67 0,93 1,04 1,12 0,92 Current ratio 0,71 0,89 1,09 1,18 0,97 Financial leverage (Debt to Equity) 2,73 3,99 1,84 2,12 3,80 Cimber Sterling 2008/2009 2007/2008 2006/2007Quick ratio 0,42 0,47 0,73 Current ratio 0,60 0,63 0,88 Financial leverage (Debt to Equity) 5,71 4,22 3,31
Table 9: Liquidity ratios for SAS and Cimber Sterling
SAS has had a decrease in their current and quick ratio from 2006. The current ratio is below
the optimal level in all years, and it could be concluded that in the longer run it will be hard
for the company to repay their debt. The quick ratio, on the other hand, has been above and
close to the optimal level except from 2009. Because of the decline in both quick and current
ratio over the years it can be concluded that SAS would have problems repaying their short
term debt. The financial leverage is varying for the years in question, and had its peak in
2008, which could be due to the purchase of new airplanes that were financed by loans that
caused an increase in debt.
Cimber Sterling is in all the three years below its optimal levels in both current and quick
ratio and it is a decreasing tendency. This is not a good development for Cimber Sterling as it
22

indicates that they will have problems repaying their short term debt. The financial leverage
for the period is high and constantly increasing, which can indicate that the company is using
debt to finance new assets. However, as stated earlier, this will be further investigated in the
cash flow analysis.
2.3.4: The Share
Norwegian Air Shuttle ASA became listed on Oslo Stock Exchange in 2003. Looking at
Norwegian`s share development (Appendix 6), we can see how the share price has behaved
over the last five years.
2009 2008 2007 2006 2005Share price close 140 36,9 169 93 79Number of outstanding shares year end 34 209 858 32 359 778 20 865 526 19 669 196 18 085 696
Market cap (NOKm) 4 789 1 194 3 526 1 829 1 429 EPS 13,04 0,12 4,05 -1,12 1,55 P/E 10,73 302,76 41,69 -83,16 51,06Book equity per share 46,82 27,73 24,36 13,26 7,83 Share price/Book equity per share 2,99 1,33 6,94 7,02 10,09
Table 10: Norwegian`s share
The share price has increased over the years except from 2008 where it was historically low,
however, it ended 2009 at 140 kroner. The number of outstanding shares has also increased
over the accounting years caused by issuing of new shares in order to strengthen their strong
position in the market and letting new investors be a part of their expansion process6. Market
cap measures the market value for the company’s outstanding shares; the value of the
company. It shows that Norwegian`s market cap has been increasing except from a decrease
in 2008 expected after the historically low share price.
In 2009 earnings per share (ESP) generates profit after tax at 13.04 kroner per share, which is
good compared to previous years. This ratio is useful when comparing companies as you
should always invest in a company that gives as high EPS as possible. Looking at earnings per
share for SAS (appendix 23) shows that Norwegian will be the preferred investment as SAS
generates loss after tax at -1.19 kroner per share.
Price-Earnings (P/E) indicates a firm’s possibility to grow earnings. If this ratio is high it
means that the future earnings are expected to be higher than current earnings, but it is
important to be aware that P/E can be high because current year’s earnings have been low, as
in the case of Norwegian which has experienced lower earnings in previous years. When
6 Andersen, Tor Øyvind; Brander, Anna Sandvig: http://e24.no/boers-og-finans/article3359145.ece
23

analysing P/E we also needs to consider risk, as a high risk on future earnings will give lower
P/E (Pennan 2001: p 527). Book equity per share assesses the minimum value of a company`s
equity in a current situation as it does not look into the future. The ratio is good and it has
been increasing over the five years, and it can be seen that the book value is not above the
market value in any of the years. Share price divided by book equity per share is calculated to
see what the market is expecting. For Norwegian, all the ratios are above 1 and it can be
concluded that the market expects ROE to exceed the owners` expected return on investment
and give value to the owners.
2.3.5: Conclusion on the balance sheet
The balance sheet tells us about a company’s assets, liabilities and equity, and is used to
analyse the liquidity situation within a company with help of key ratio analysis. Norwegian`s
balance sheet, assets and equity have all been increasing over the years. The main events
causing this increase are purchase and prepayments of new airplanes, an increase in cash and
cash equivalents, and issuing of new shares. Cash and cash equivalents that is easy accessible
cash has had a huge growth over the last years. This must be them preparing for their new
investments as such a tendency cannot be seen from either SAS`s or Cimber Sterling`s
balance sheet. Norwegian`s net working capital is positive in all years except 2008 and 2009,
indicates that they have not had problems paying their current debt, except from the last two
years.
The financial ratio analysis from the balance sheet concludes that there are signs of liquidity
problems both current and non-current. This because the quick ratio is close to, but below its
optimal level, and the current ratio is far below its optimal level. However, they should be
concerned as the decreasing ratios could indicate that Norwegian has problems creating
liquidity. The financial leverage is high but showing a decreasing tendency, which indicates
that the company is at a decreasing level relying on debt as a source of financing. Their
solvency ratio, that includes equity, is at a good level indicating that they are a financial
healthy company. However, this needs to be investigated closer in the cash flow analysis.
Norwegian are performing better compared to SAS`s and Cimber Sterling`s by looking at the
key ratios. The quick and current ratio analysis concluded that SAS would have problems
repaying their debt in the short and longer run. As their debt to equity ratio is higher than
Norwegian`s, meaning that they are depending on debt as a source of financing at a higher
degree than Norwegian. Cimber Sterling has current and quick ratios far from to its optimal
24

level, and the debt to equity ratio is high and increasing, indicating that they are relying on
debt as a source of financing at an increasing level.
2.4: Cash Flow statement
The cash flow statement connects the income statement with the balance sheet and explains
how the company has used and received cash over the account period. It is important to pay
increased attention towards the cash flow statements, as it focuses on cash available for
operations and investments and will help to understand how well companies can handle new
investments or potential losses. Analysing key ratios from the cash flow statement will
continue the liquidity analysis from the balance sheet, and we will get a more accurate
overview of the situation in Norwegian (appendix 12).
The Cash flow statement is divided into three groups being cash flow from operating
activities, cash flow from investing activities and cash flow from financial activities. By
adding these activities together we will see if there has been a decrease or increase in the
company’s cash flow in the accounting period (Pennan 2001: p 35):
Cash ¿operations+cash¿ investment+cash¿ financing=change∈cash
Norwegian 2009 2008 2007 2006 2005Net cash flow from operating activities 884 404 -385 551 457 932 75 562 95 356 Net cash flow from investing activities -1 269 894 -253 475 -532 619 -245 257 -38 368 Net cash flow from financial activities 1 188 162 686 644 306 425 139 864 -14 601 Change in cash 800 938 52 466 229 713 -29 839 42 387 SAS Net cash flow from operating activities -3 414 -2 651 2 866 2 102 1 507 Net cash flow from investing activities -2 611 -2 913 -213 7 485 1 001 Net cash flow from financial activities 4 284 2 480 -4 492 -7 438 -2 457 Change in cash -1 741 -3 084 -1 839 2 149 51 Cimber Sterling 2008/2009 2007/2008 2006/2007Net cash flow from operating activities 154 329 115 539 64 529 Net cash flow from investing activities -94 666 -250 139 -23 142 Net cash flow from financial activities -57 195 110 850 -41 627 Change in cash 2 468 -23 750 -240
Table 10: Norwegian, SAS and Cimber Sterling cash flow statement 2005-2009
2.4.1: Cash flow from operating activities
Net cash flow from operating activities is cash generated from selling products and net cash
used, useful to study as it gives a better overview than earnings from the income statement. A
company that have positive earnings and positive cash flow from operating activities indicates
that they will be able to pay its debt. Looking at Norwegian`s cash flow from operating
activities it can be seen that they had positive values in all years except 2008, which means
25

that they were generating less cash than they used this year. In 2009 they generated MNOK
884 404, mostly due to an increase in operating revenues and a reduction in accounts
receivable. This was a huge increase after the decrease in 2008 due to the huge loss in net
profit after tax and the changes in net working capital.
Changes in working capital needs to be looked at closer, and will be analysed with use of
2008 numbers. Working capital was also investigated in the balance sheet (p.20) as current
assets minus current liabilities. It is also included in the cash flow statement because
companies normally increase or decrease their current assets or current liabilities in the
accounting period. It can be seen that there has been an increase in inventory, accounts
receivable and payable, meaning that the company has spent more money on purchasing
assets this year. Therefore the amounts need to be subtracted from the operating profit. The
same happens with the change in assets, liabilities and air traffic settlements, but since there
has been a decrease since last year, this number is added to operating profit.
Looking at SAS cash flow statement, it can be seen that cash flow from operating activities
has been decreasing since 2007. A major part of this is due to negative net income before tax
of -2 947 billions and large restructuring costs. Net cash flow from operating activities has
also increased for Cimber Sterling, meaning that they are generating more cash than they are
using, even though they delivered a loss after tax of DKK -58 925 million.
2.4.2: Cash flow from investing activities
Net cash flow from investing activities is cash spent on purchasing new assets less cash
received from selling assets. Norwegian`s investment activities have been negative over the
past five years, but in 2008 their investment activities decreased. The reason behind this
decrease was due to a gain from a sale of a USD currency hedge contract, and not because
they were spending less on new investments. As shown in the cash flow statement both
payments of inventory and tangible goods increased this period, as the investments of the first
10 Boeing airplanes have partially been financed by Pre-Delivery-Payment7 (purchase of new
airplanes). Between 2008 - 2009 we can see a huge increase in cash flow from investing
activities that again can be explained by payment of two new airplanes from Boeing and
prepayments of the rest of the airplanes. The purchase of the new airplanes is an investment
Norwegian regards as urgent to keep up with the strong competition within the industry as the
new airplanes will help the company to decrease their cost base.
7 Aircraft manufactures often require customers to make down payments before aircrafts are delivered.
26

Looking at SAS and Cimber Sterling, their cash flow from investing activities has also been
negative through the last three years. The decrease in investing activities from 2008 to 2009
for SAS are explained by prepayments and purchase of new airplanes and that the company at
the same time received payment for the sale of Air Baltic and sold and leased backs some of
their airplanes. Cimber Sterling has had a decrease in investing activities from last year
despite their purchase of Sterling AS.
2.4.3: Cash flow from financial activities
Net cash flow from financial activities is cash transactions that are claimants from equity and
debt. For Norwegian it can be seen that financing activities in all years are positive and that
there has been an increase over the five years. Their debt has also been increasing over the
years and since there has been almost no repayment of debt the financial activities consists of
issuing new shares and proceeds from long term debt. Especially the increase between 2009
and 2008 can be explained by issuing of new shares which caused their equity ratio to
increase. It also shows that in 2009 they issued MNOK 400 unsecured bonds with a maturity
date in 2012. In this connection they bought back MNOK 137 in bond issue with maturity
date 2010.
Compared to their competitors, SAS`s cash flow from financial activities has increased in
2009. This is explained by a decline in net borrowings which was financed by issuing new
shares. Cimber Sterling has negative values in financial activities in 2008/2009 due to
repayment of debt. In 2007/2008 they took a loan and at the same time paid MDKK 45 080 in
dividends which therefore explains the positive financial activities for this year.
2.4.4: Change in cash
The change in cash and cash equivalents are the operating, investing and financing activities
added together, but we also need to take the foreign exchange effect on cash in consideration.
The change in foreign exchange rate needs to be considered as Norwegian is an international
company where most of their cash comes from American dollars (USD) and Euro (EUR).
Change in cash will indicate the health for a company and the more cash available, the better.
For Norwegian the net change in cash and cash equivalents is positive and has been increasing
over the last three years, indicating that the company is doing well and is generating enough
cash for future investments and growth.
27
The large increase in operating and financial activities in 2009 is the main reason why
Norwegian is having this much cash available that can be used in e.g. new investments. This
can be a sign of Norwegian being a stable and solvent company, but further investigations are
needed with help from the cash flow ratios, because if it wasn’t for the share issue, the change
in cash might not have given us this situation.
2.4.5: Cash flow ratios
Cash flow ratios measure a company’s ability to meet financial and operational commitments
and also consider the risk involved. The financial analysis of key ratios from the cash flow
statement will be used to continue the liquidity analysis from the balance sheet as it gives a
more accurate picture of Norwegian`s liquidity situation than the current and quick ratios. The
cash flow can also help managers to better understand problem areas within the company and
plan to be more efficient (The power of Cash Flow ratios: 1998).
Operating cash flow 0,4 -0,2 0,4 0,1 0,2Cash current debt coverage 0,4 -0,2 0,4 0,1 0,2Cash interest coverage 40,1 -5,5 -5,7 -146,2Total debt 0,26 -0,17 0,25 0,09 0,18
Table 11: Cash Flow ratios for Norwegian
Operating cash flow measures a company’s ability to generate cash to pay short term debt
(within a year). A company should have a ratio above 1, because then a company is
generating enough cash to pay its current commitments, and at the same time they have
margin in case of further growth in operating cash flow etc. If the ratio is below its optimal
level, a company most likely needs external help to pay its current liabilities, and the threat of
bankruptcy increases. This is the case of Norwegian which in all years has had ratios close to
zero, and in 2008 negative. This indicates that Norwegian has had problems financing their
short term debt during this period, and that the company therefore has been and still are
depending on external help in order to pay their short term debt. Cash current debt coverage
measures the same as operating cash flow but takes dividend into consideration. Since
Norwegian will not pay out dividends unless their equity ratio is more stable, cash current
debt coverage equals operating cash flow.
Funds flow coverage measures if a company can pay “unavoidable” costs as interest rates and
taxes. The purpose of this analysis is see how pressured the company is and if they can bear
new investments and further growth. Funds flow coverage is not calculated for Norwegian as
28

they repayment of debt is not to be seen in the overview of financial activities since 2004.
However, it will be calculated for both SAS and Cimber Sterling.
Cash interest coverage measures if a company is able to pay interests on its debt. This ratio is
very actual, especially in these days as some companies are borrowing more than they can
afford. As it can be seen Norwegian has had negative ratios in previous years except 2008
where the ratio are positive and above an optimal level of 1, and that year the company would
not have had problems paying interests on their debt this year.
Total debt measures the company’s ability to cover future debt obligations, and it indicates
how long it will take to repay debt, assuming that all cash flow from operating activities goes
to repay debt. A low ratio indicates that a company may have problems to repay debt in the
future, which can be seen as Norwegian`s ratios are zero in most of the year, and negative in
2008. This confirms findings from the balance sheet indicating that the company will have
problems repaying debt in the future.
2009 2008 2007 2006 2005Operating cash flow (OCF) -0,19 -0,16 0,14 0,12 0,07Cash current debt coverage (CDC) -0,19 -0,16 0,14 0,12 0,07Funds flow coverage (FFC) -0,34 0,17 0,50 0,32 -5,35Cash interest coverage(CIC) 5,05 3,81 -1,49 -0,39 0,13Total debt -0,11 -0,08 0,09 0,06 0,03
Table 12: Cash Flow ratios for SAS
Financial key ratios from the cash flow statement are also calculated for SAS and Cimber
Sterling to see how Norwegian is performing compared to their competitors. SAS`s operating
cash flow and the cash current debt coverage are the same as SAS do not pay out dividends.
The ratios are negative and close to zero in all five years meaning that SAS have problems
generating cash to pay the short term debt themselves. Funds flow coverage is positive during
the period except for 2009, meaning that this year SAS was not able to pay their unavoidable
costs as taxes. Cash interest coverage is constantly growing and is at a level of 5.05 in 2009,
indicating that SAS is able to pay interest on their debt. Their ability to pay tax and dividends
is not favourable, however, they are able to pay interest on their debt.
Operating cash flow (OCF) 0,33 0,30 0,22Cash current debt coverage (CDC) 0,33 0,19 0,22Funds flow coverage (FFC) 1,84 -0,64 2,56Cash interest coverage(CIC) -4,26 -2,88 -2,40Total debt 0,17 0,14 0,10
Table 13: Cash Flow ratios for Cimber Sterling
29

The overview of Cimber Sterling shows that their operating cash flow and cash current debt
coverage are both below the optimal level of 1. In 2007/2008 the company decided to pay out
DKK 45 080 million in dividends, which is why cash current debt coverage is decreasing this
year. This ratio indicates that the company itself will have problems generating cash to pay
their short term debt. The funds flow coverage is good in 2006/2007 and 2008/2009,
indicating that the company can pay costs as taxes and dividends. They are not able to pay
interest on their debt seen from cash interest coverage that is negative in all years.
2.4.6: Conclusion on the Cash Flow statement
The cash flow statement is an overview of what the company has used and received in cash
during the years. From Norwegian`s cash flow statement, it can be seen that the company has
had positive values in investing activities in all years except 2008, when they spent more cash
than they generated. This can also be seen from investing activities that have negative values
in each year, meaning that Norwegian spent more cash on purchase of assets than they
received from assets sold. The cash flow statement is therefore strongly affected by
prepayments and purchase of new airplanes which were in Norwegians focus especially in
2008 and 2009. In the problem statement it is stated that the company’s liquid situation in
relation to their issuing of shares need to be investigated. The financial activities show that
issuing new shares is the main activity which causes the company to end up with positive
values in financial activities over the last four years. A positive increase in change in cash
indicates that they are generating enough cash for future investments and growth.
The analysis of liquidity ratios from the balance sheet has been continued to measure
Norwegians ability to generate cash to pay back short term debt and to pay interest. Based on
the balance sheet, we concluded that Norwegian have liquidity problems paying their short
term and future debt. In the cash flow analysis, operating cash flow concluded that Norwegian
has had and will continue on have problems generating enough cash to pay their short term
debt, which is not good as the company then rely on external help and the risk of bankruptcy
increases. However, it needs to be remembered that this ratio does not take the issuing of
share in account. Total debt ratio indicates that they will have problems in the future repaying
their debt, but the cash interest coverage concludes that Norwegian has been able to pay
interest on its debt over the last two years with good margin.
However, looking at Norwegian`s performance compared to SAS and Cimber Sterling, it does
not look bad as their ratios are better than the competitors. Their competitors have liquidity
30

problems evidenced by the same ratio calculations. Both companies’ ratios are fluctuating a
lot. Overall, SAS will have problems generating cash to pay both current and non-current debt
and to pay unavoidable costs, but they should be able to pay interest on their debt. Cimber
Sterling on the other hand, is able to generate cash to repay short term debt and pay
unavoidable costs, but not able to pay interest rates on their debt.
2.5: Conclusion on the financial statement analysis
Despite the economic recession and the fact that 2009 has been the hardest year for the airline
industry since the Second World War, Norwegian delivered their best result historically. Their
revenues had a growth of 17.4% between 2008 to 2009 (appendix 16), which is good
compared to the overall market which saw a passenger decrease of 3%, and their biggest
competitors SAS and Cimber Sterling ended 2009 with a loss after tax. The growth in profit
after tax for Norwegian over the years is due to larger market shares both domestically, in
Europe, and with the decrease of unit costs. It is important for a low cost airline company like
Norwegian to have as low unit costs as possible, which enables them to offer low ticket prices
and still generate a profit. Therefore they are constantly finding new ways to decrease their
unit costs even more, and over the last years they have purchased new airplanes that will
increase their capacity and decrease fuel consumption and again decrease unit costs further.
The research question has been to look at Norwegian`s liquidity situation in connection to the
issuing of shares. This will be investigated in the key ratio analysis.
The prepayments and purchase of new airplanes has affected all the financial statements over
the last two years. From the balance sheet it can be seen that both assets and liabilities have
increased after prepayments, purchase and arrival of new airplanes, and equity increasing
after issuing shares. The cash flow statement reflects the same development as operating
activities are positive, meaning that Norwegian generated more cash than expenses mostly
due to an increased profit in 2009. Invested activities had a huge increase from 2008 to 2009,
which means they purchased more assets than they sold, also relating to the new airplanes.
However, financing activities has had increasing and positive values over the last years,
affected by the issuing of new shares.
Analysing key financial ratios are important to get a more reliable look at Norwegian`s actual
situation. The DuPont method is used to measure profitability ratios to see how efficient they
are. Both ROIC and asset turnover shows that the company is not that efficient when it comes
to using its assets to generate revenue, but ROIC is increasing which is a good development
31

and therefore needs to be taken into consideration. ROE shows that the shareholder can expect
a high return in 2009. However, this number is fluctuating a lot from negative to higher
values, so the risk involved needs to be consider as Norwegian are in a strongly competitive
environment. Profit margin is increasing and at a high level meaning that a high degree of the
revenue creates profit and that there still are some cash is left to cover tax and interest rates.
The liquidity analysis was the focus of this report as we wanted to investigate if the reason to
why Norwegian is issuing shares is because of bad economic performance. It measures
Norwegian`s ability to generate cash to pay back short term debt, pay interest, tax and
dividends. Both the balance sheet and the cash flow statement indicate that Norwegian will
have problems financing their current and non-current debt, but it will be harder in the long
run as shown by total debt ratio. Their solvency ratio is good, indicating that Norwegian is
financially healthy, but we need to be aware of that in this calculation money received from
share issue are included. Their ability to pay unavoidable costs like taxes and interest rates is
good in 2008 after years with negative ratios, and the financial leverage shows that
Norwegian is at a decreasing level relying on debt as a source of financing.
3: Strategic Analysis
A strategic analysis looks at what is happening both externally and internally within an
organization today and in the future. When evaluating a company it is not only important to
look at the economic performance, but also the strategy they are following in order to see if it
has been successful (Schack 2002: p 203). The methods used in this thesis will only analyse
the external part as there has been no personal contact with Norwegian. However, in the
conclusion (SWOT analysis) some internal strengths and weaknesses found in annual reports
will be reviewed to get a better overview of Norwegian`s situation. The purpose of this
analysis is to cover the external non-financial value drivers that will have importance for the
future value creation of Norwegian (Sørensen 2009: p 18).
3.1: PESTEL analysis
When evaluating the environment, it is always useful to start with a PESTEL analysis, that
can be seen as a checklist of the political, economical, socio-cultural, technological,
environmental and legal aspects of past events. The method is used to measure the external
environment in the air travel industry, where the main propose is to identify external factors
that influence the industry. Because by understanding the environment, you can take
advantage of the opportunities and minimize the threats (Lynch 2006: p. 84). All six aspects
32

are included in the thesis because they all reflect important and relevant information, but the
main focus will be on the economic and legal aspects.
3.1.1: Political aspects
As many airline companies are state owned, they are able to be financially protected by their
local government. The Norwegian, Swedish and Danish government has protected SAS over
the last years as they are their major investors. SAS have had economic problems, and in 2009
they were given 6 billion SEK in new capital by their investors. However, this did not help as
SAS again has asked for 5 billion SEK new capital in order to survive. This will be given in
return of a promise of a stronger financial position by next year, and a cost savings program
(page 14).
3.1.2: Economic aspects
Economic aspects also play an important role, as the ongoing recession has affected the airline
industry hard causing 2009 to be the worst year since the Second World War, since there is a
correlation between demand for air travel and economic growth. As mentioned earlier, it is all
about having as low unit costs as possible to be able to be a part of this highly competitive
industry. Therefore external factors as such as oil price and the exchange rate in both dollars
and Euros will be of importance for the companies and will be further investigated.
The oil price is an important external factor that affects an airline company’s unit costs, as
fuel normally is one of the largest costs. In the overview of the oil price (Appendix 4) it can
be seen that from 2005 it was more or less stable until the beginning of 2007, when increasing
prices reached their peak in mid 2008. The huge increase in oil prices can be caused by many
factors, some of them being change in demand for oil, decrease in production and geopolitical
reasons such as the Iraq war. This price increase was not good for the airline companies that
had chosen not hedge, and explains why many airline companies reported a loss after tax this
year.
The exchange rates of the national currency, dollar (USD) and Euro (EUR) are also important
factors to consider, as main costs to e.g. suppliers are being traded in American dollars or in
Euro. Norwegian is dependent on the exchange rate USD/NOK (Appendix 5) because of the
payments on the new Boeing airplanes. It can be seen that it has fluctuated over the last years
reaching its peak in end 2008 where 1 dollar = 7.2 NOK. Since the beginning of 2009 it has
33
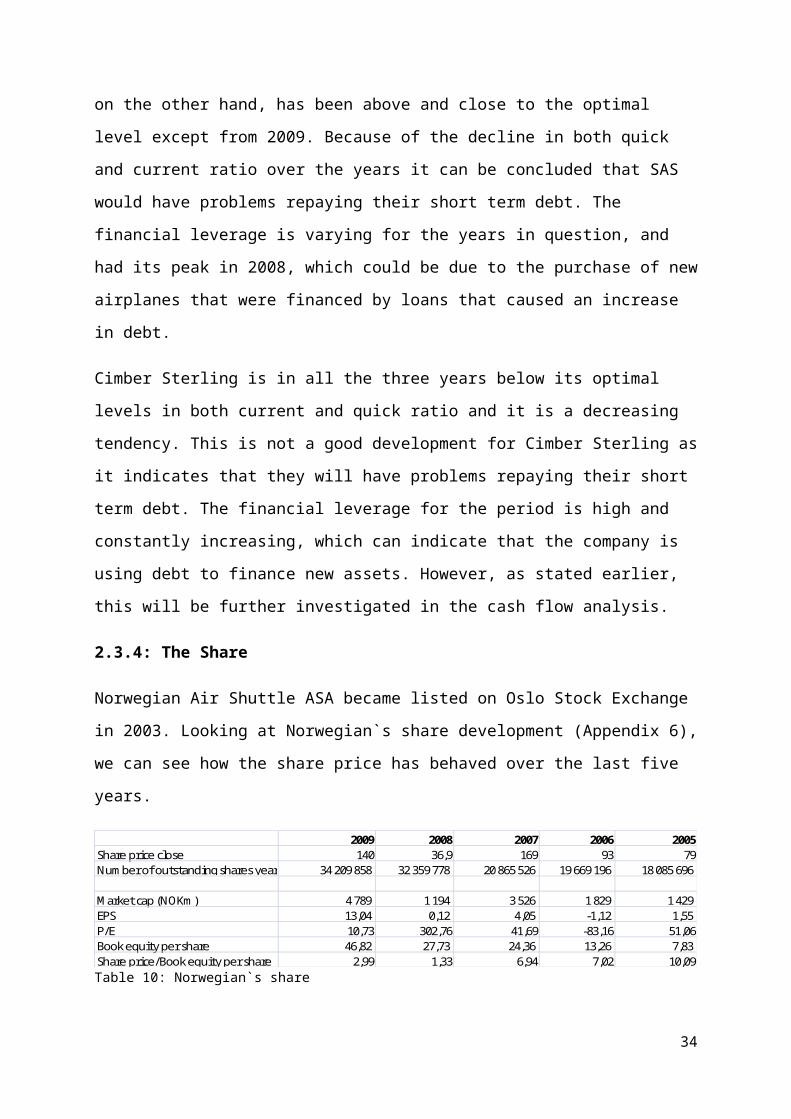
decreased, ending in 2009 at 1 dollar = 5.8 NOK. A more stable and weaker exchange rate
will benefit Norwegian as they still have to pay for their airplanes in dollars until 2014.
Norwegian does hedge both fuel and currency in order to increase predictability in their
budgets. Norwegian sais that the gains from hedging are small in periods where there are
increasing prices, but the losses of hedging is smaller in periods where prices decreases.
3.1.3: Socio-cultural factors
Consumer behaviour has changed over the last years towards people flying more and
demanding more services. The business idea for many of the traditional airline companies is
to increase people’s mobility by making it easier for their customers to travel by offering
faster check-in, ticketless travels and bonus cards. Low cost airline companies, on the other
hand, want to increase people’s mobility by offering low ticket prices, which is a major reason
why there has been an increase in passengers since the beginning of the decade.
3.1.4: Technological factors
Technological factors affect the airline industry in several ways. Due to new laws and
regulations made by EU and national governments it is important that the technology can
adapt to these situations. Boeing and Airbus as the main suppliers of airplanes have to makes
sure to be up to date, and as Boeing states on their web page; “Technology is advancing faster
than expected”8. Boeing which is a major supplier to the airline industry has developed more
environmentally friendly airplanes (Boeing 737-800). This aircraft has lower noise and
pollution level, that will help Norwegian, that are changing its fleet to only containing these
planes to lower unit costs.
3.1.5: Environmental aspects
The increasing attention towards climate has a direct affect towards the airline industry. There
are several regulations that have been created to protect the environment, and people are
encouraged to buy climate quotes when travelling. As mentioned above several airports in
Europe have different landing fees depending on the noise and emission level of each
airplane. As the industry is all about having as low unit costs as possible it is important to pay
attention the environment.
8 http://www.boeing.com/commercial/environment/index.html
34

3.1.6: Legal aspects
Legal aspects are especially important as new laws and regulations made by national
governments and the EU will automatically affect the industry. An EU regulation that has had
a huge negative influence on the traditional airline companies is the airline liberalisation
process that was finalised in April 1997. Until this point traditional airline companies that
often are state owned (e.g. SAS owned by the Norwegian, Swedish and Danish states) were
protected by their national governments. After the deregulation, member states were no longer
allowed to protect its national airline, meaning that an airline company from one member state
was now allowed to operate in another member state. This lead to increased competition and
opened up the market giving each airline company the possibility to negotiate their own route
network and set fares. This was the beginning of the low cost airlines existence, which can be
seen from an overview of the market share (Figure 1, 2).where low costs airlines are giving
hard competition to the traditional companies such as SAS.9
Different laws such as the competition law and the employment and safety law are all
important for the airline companies within this industry, because of the high degree of
competition. Especially after the terrorist attacks of September 11, 2001 there has been
increased attention on security leading to higher costs for the airline companies, but this is not
necessarily considered as a bad thing as safety often is an important factor that customers’
value highly.
There have been situations where companies have broken some regulations in order to get a
competitive advantage. At the end of March 2010 SAS was sentenced to pay MNOK 160 to
Norwegian in compensation after they misused information SAS received in 2008 through a
common booking system (Amadeus), and for using secret information about Norwegian
received in an e-mail. The accusations against SAS were that they stole customers that were
supposed to fly with Norwegian using Norwegian`s ticket price information, by lowering their
prices on these routes Norwegian planned to have campaign on10.
Another recent event is the conflict between Norwegian and Cimber Sterling, which occurred
after Norwegian established their new base in Copenhagen and started to compete
domestically within Denmark. Tickets for DKK 1 were sold at the opening of the new route
between Copenhagen and Karup, but the fully booked airplane, departed almost empty. 9http://europa.eu/rapid/pressReleasesAction.do?reference=IP/96/950&format=HTML&aged=0&language=EN&guiLanguage=en10 Becker, Cecilie Langum: http://www.dn.no/forsiden/borsMarked/article1860776.ece
35

Subsequently Norwegian discovered that employees at Cimber Sterling had bought tickets
using fake names such as Donald Duck and Queen of Denmark. The employees` name
became public in Danish newspapers, and they filed a complaint about Norwegian to the Data
Inspectorate where they claimed that Norwegian had used their names illegal referring to
Norwegian`s use of personal data. The complaint was rejected at the end of March and this
case is therefore considered settled11.
3.1.7: Summary of the PESTEL analysis
In the PEST analysis several external factors influencing Norwegian are identified
representing opportunities and threats. The increased competition in the airline industry is a
consequence of a liberalisation process in the EU. Member states are no longer allowed to
protect their own airline companies, and it is now up to each company to decide route
networks and prices. This increased the competition and gave low cost companies an
opportunity to compete with the traditional airline companies with lower ticket prices and unit
costs.
To compete in the airline industry it is important to have low unit costs. Oil prices are one of
an airline company’s largest costs affects unit costs, and the peak in oil price in 2008 hurt the
airline companies that hadn’t hedged the price. Exchange rates in dollars and Euros are also
seen as a threat to airline companies as suppliers often trade in dollars or Euro. Norwegian
which is investing in new airplanes to be paid in dollars would benefit by a more stable
exchange rate.
There has been an increased focus on environmental issues in recent years which has forced
the implementation of new airplane technology for noise reduction and lower fuel emission.
Companies investing in these new airplanes will benefit as they gives lower unit costs (lower
fuel emission and landing fees) and they can win new customers that are concerned about the
environment.
3.2 Porters 5 forces
Porters 5 forces is a framework that helps organisations investigate its strategy in order to
develop opportunities and protect themselves from competition and other threats in the
environment. It is included in this thesis to investigate the attractiveness of the airline industry
(Lynch 2006: p 94). According to the founder Michael Porter, managers are defining their
11 Kaspersen, Line: http://www.dn.no/forsiden/naringsliv/article1861369.ece
36

competitors as the already established industry rivals, but it will also be important to include
four other factors such as suppliers, customers, potential entrants and potential substitutes as
a manager will be better prepared when the interaction within an industry are known (Porter
2008: p 2).
3.2.1: The threat of potential new entrants
A market is attractive for new entrants if the profit margins are high and the barriers to enter
are low. The airline industry is an unattractive market to enter for new companies as it will
include a huge risk. The entry barriers are high due the large capital requirements need to
invest in either leased or purchased airplanes, and the companies within the industry are
already well established, which makes it unattractive. Profit margins are not the highest due to
large competition forcing prices down. Norwegian is ending with a profit after taxes, but their
competitors SAS and Cimber Sterling are both ending with a loss after taxes. By looking at
rate of return (ROE) analysed in the financial statement analysis, it can be concluded that
even though the value is fluctuating a lot, an investment in Norwegian would in many of the
years have given a high return. But it is also important to consider the huge risk involved
compared to other investment possibilities.
It can therefore be concluded that the airline industry is not an attractive market to enter for a
new airline company. However, existing airline companies can expand to offer more
segments, to increase market share as Norwegian is considering. They want to go from a
company offering low price tickets for short destinations to also offering their products in
America and Asia12.
3.2.2: The bargaining power of suppliers
The main suppliers of airplanes, personnel, repairs and equipment to the airline industry are
Boeing and Airbus and the competition between them is fierce. Boeing and Airbus are not
strong suppliers, meaning that they have low bargaining power because their performance is
depending on the overall industry performance. This is because they have the airline industry
as their main focus.
Because of the fierce competition between the suppliers they are pressured to invent new
technology that will fit into the future. In recent years there has been an increased focus on the
12 Dagens Næringsliv: http://www.dn.no/forsiden/naringsliv/article1756103.ece
37

environment, and Boeing invented new technology helping to decrease noise and emission
levels.
The employees working for the different airline companies can be said to have a high degree
of bargaining power. During the recession, many airline companies have needed to fire
employees or give a decrease in wages which has not been popular with the different interest
organisations and strikes has been the solution. SAS is a company that has had many
problems with strikes due to unpleased cabin crew.13
3.2.3: The bargaining power of buyers
The bargaining power of buyers is concluded to be at a medium level as the airline companies
are offering more or less the same product on air travel to European destinations, just with
different benefits. Factors that determine what airline company the customers choose is price,
brand reputation and extra services such as newspaper, coffee/tea, bonus cards, ticketless
travel and fast check-in. Frequent flying and flexibility is also important factors for especially
business travellers.
Prices can be considered to be the most important factor, and describes why Norwegian as a
low cost airline company has increased their market share as much as they have over the last
years. If a customer instead chooses to fly with a traditional airline company such as SAS they
will get fast check-in, ticketless travel, more frequent flying, newspapers, coffee/tea and
bonus points on the travel. This separates them from Norwegian where the only bonus you get
is a ticketless travel and low ticket price. Brand reputation is also an important factor to be
consider as customers values numbers of cancelations and delays.
3.2.4: The threat of substitutes
A substitute performs the same or similar function as the airline industry, and normally does
not replace existing products, but it can limit the potential profit in the industry. The airline
industry has several substitutes, especially people that are concerned about environment and
pollution and will choose more environmentally friendly transportation methods such as
trains. However, this will depend on the travel distance.
On short distances there is a high threat of substitutes due to car, bus, train and sailing. The
potential profit for the airline industry will suffer on short distances, and it will be important
13 Kaspersen, Line: http://www.dn.no/forsiden/naringsliv/article1100206.ece
38

to distance itself from the substitute product. This can be done by focusing on the benefits of
flying short distances as time, money and personal preferences that will be a clear advantage
for business travellers. On longer distances the threat will be at a lower level as the price on
long distances normally are lower compared to its substitutes and travellers will save time.
There are also several distances to e.g. America and Asia that will be hard to travel if it wasn’t
for the airplanes.
3.2.5: The extent of competitive rivalry
There is a high level of rivalry within the airline industry as the existing companies are
constantly trying to gain market share with different strategies, and there is high exit barriers.
A reason why the European market has as a high level of competition is because the
companies are more or less offering routes to the same geographical area.
There are different strategies the airline companies use to increase their market share.
Norwegian is following the cost leadership strategy and has a competitive advantage if we
look at the market share development. They have increased their market share in both the
domestic and the European markets. The low cost strategy they are following has been
successful for Norwegian because their low unit costs help the company generate profit even
though their ticket prices are low. If we compare their development to the more traditional
airline companies such as SAS, we see they have had the opposite development with a
decreasing market share in Norway and Europe. If they were to try to compete on the price
they would not generate the same profit as a low cost company, due to the different unit costs.
This is why budget airlines are a major competitive threat for the traditional airline
companies.
Ryanair, SAS and Cimber Sterling are all companies that can be seen as potential threats to
Norwegian. Ryanair and Cimber Sterling are both offering low tickets prices to destinations
all over Europe, but Norwegian see Cimber Sterling as a bigger threat than Ryanair, because
Ryanair often flies to remote airports which explains why their unit costs and ticket prices are
lower than Norwegian`s. SAS is seen as the major competitor within the Scandinavian
market.
3.2.6: Summary of Porters 5 forces analysis
Understanding the competition within the airline industry will help companies discover
opportunities and to decide if the industry is attractive to enter. It is clear that the airline
39

industry is a though market to enter with high entry barriers due to strong competition and the
large investment needed. Even though there are high returns (ROE) in some years, there is
also high risk involved. Therefore the threat of new airline companies entering this market is
not considerable, especially not now in a difficult economical climate where most of the
airline companies are experiencing economical problems.
The bargaining power of suppliers is not high as Boeing and Airbus are the main suppliers of
airplanes in the market and there is fierce competition between them. The threat of buyers is
also considered to be at a medium level as most of the companies are offering the same
service by transporting you to final destinations. Which company the customer chooses
depend what the customer values as price, brand reputation and on extra benefits such as fast
check-in etc. Threat of substitutes is considered to be at a low level for long destinations, but
higher for short distance destinations where substitutes are bus, train, car and sailing.
Substitutes are not seen as a major threat because alternative transportation methods are
usually more time consuming and expensive.
3.3: Conclusion on the strategic analysis – SWOT analysis
The SWOT analysis will be used to sum up information from the strategic analysis,
summarizing the strengths and weaknesses internally within the organisation, and
opportunities and threats externally (Lynch 2006: p 446).
3.3.1: Strengths
Norwegian`s major strength is their successful low cost strategy, being a major reason to the
increased market share over the years. Passenger numbers will continue to grow as people
per-sue air travelling as a safe and fast way to travel. Norwegian`s traffic figures for January
2010 reports about a 28% increase in passengers compared to same period last year.
Norwegian`s brand name can also be seen as a strength, as the company has a good regularity
record for its scheduled flights at 98.93% in 2008 despite strikes. They were also recognized
as the market leader in 2009 for being able to stay in business through challenging times and
for adapting the low cost strategy to the Scandinavian market.
Norwegian`s low unit costs enables them to follow the low cost strategy, unlike more
traditional airline companies such as SAS, and they will therefore have a clear competitive
advantage. As unit costs are depending on the fuel price, landing fees and staff costs, the new
40

and more environmentally friendly airplanes Boeing 737-800 will help Norwegian decrease
their unit costs further, as the new planes increase capacity and decrease emission levels.
Norwegian has also invented a low price calendar on their webpage, registered as protected
design. They do not have a patent on the technical aspects, only the graphic symbols and the
web interface, but this will give the company a competitive edge as it makes it easier for
customer to search for low price tickets.
3.3.2: Weaknesses
A huge weakness for Norwegian is that they are not a market leader on punctuality. Even
though they have a high regularity rate, it has been decreasing over the years. SAS surveyed
their Eurobonus members via a research questionnaire, about the most annoying thing that
could happened when travelling by air. The outcome was clearly showed that delays were
most annoying for travellers. SAS was the most punctual airline company in 2009, and
Norwegian might lose potential customers that values punctuality high to SAS14. However,
this could be biased as it was investigated by SAS and shows that their customers were clearly
pleased with the service they get with SAS as they don’t have to pay for luggage and getting
bonus points and free seat selection was something they were pleased with15. Another
weakness is that Norwegian is not part of an alliance, as Star Alliance and they can therefore
loose potential customers.
3.3.3: Opportunities
We are looking at the airline companies’ opportunities from an external point of view. Even
though the airline industry has been hit by the recession and a decrease in passengers
travelling in 2009, the industry is again optimistic.
Companies that invest in new and more environmentally friendly airplanes (e.g. Boeing 737-
800) will benefit from this upswing as it will create lower unit costs due to lower fuel
emissions and landing fees. New planes will increase capacity, and it will be possible to
attract new customers who care for the environment. Reputation is a very important factor in
this industry, and there is a good possibility to improve reputation by improving punctuality
seen as an important factor when people choose an airline company.
14 SAS: http://www.sasgroup.net/SASGroup_General/popupContainer.asp?File=Most%20punctual%20airline%202009.htm15 Dagens Næringsliv: http://www.dn.no/borspause/article1716252.ece
41

3.3.4: Threats
There are several challenges for the airline companies, and during the last years of economic
recession, higher oil prices and fluctuating exchange rates have been a problem. The oil price
increase are important as fuel is a major expense for the airline companies, and the same for
unstable dollar and Euro exchange rates, as suppliers often trade in these currencies. As stated
in the financial analysis it is all about having the lowest unit costs possible in order to offer
customers lower tickets price and still generate a profit. New regulations are also seen as a
threat, especially for the traditional airlines, just like in 1997 when the liberalisation process
started and the result was an increase in competition. The environmental issues are also
important for the airline industry and different actions are being established such as purchase
of climate quotes and landing fees depending on noise and emission levels. As a result the
main suppliers of airplanes Boeing and Airbus are constantly competing to offer the newest
technology.
Other threats are the fierce competition in the industry, because the many companies offering
travels to the same destinations. The only different is the level of service. Therefore not being
a member of an alliance can be detrimental. An alliance is working together to create different
route networks to make it possible to collect bonus points on travels, which is a benefit for
customers and simplifies travel. There is also the risk of terror attacks and accidents involving
airplanes, particularly after the terror attacks September 11, 2001 when numbers of
passengers decreased dramatically.
The threat of new entrants and more competition than already existing is considered low
because of the high barriers to enter the market considering the capital required and the high
risk involved. After the deregulation in 1997, the European airline market could see a switch
where the numbers of airline companies started to increase and the competition intensified.
Today the market is filled with companies offering all segments from low ticket price to the
more exclusive. The same is the threat of substitutes as customers on long distances will save
time and money travelling by air than car, train and sailing.
42

4: Conclusion on the Strategic and Financial Analysis of Norwegian
The purpose of this thesis is to study the economic performance of Norwegian. A financial
analysis was first created where the income statement, balance sheet and the cash flow
statement were looked at, thereafter key ratios were calculated to get a more precise overview
of Norwegian`s financial position. In the second part, a strategic analysis was conducted to
see which external factors that are affecting Norwegian.
Norwegian decided in November 2009 to issue 1 620 000 new shares, which gave
approximately NOK 250 million kroner in new capital. At the same time their biggest
investor, HBK Holding that has Norwegian`s CEO as the majority holder, decided to sell
some of their shares. This raised questions about Norwegian having financial problems.
However, Norwegian stated that this was done to strengthen their equity and to prepare the
company for further growth, and as Norwegian now was an international company they
wanted to attract new and international investors.
The overall airline industry has had challenging years because of the recession, but
Norwegian regard 2009 as the best year in their history with increase in revenues, growth in
passenger number and increased profit after taxes. Their low cost strategy turned out to be
successful, as their market share has continued its growth stealing market share from other
traditional companies as SAS. Their assets and liabilities have also increased as they are
investing and making prepayment for their new fleet. This is also reflected in their cash flow
statement that shows an increase in both operational and investing activities, which is caused
by an increased operating profit and purchase and prepayment of the aircrafts. Both
Norwegians equity and financial activities have increased over the last year mostly due to the
share issue.
The profitability analysis is measuring if Norwegian is earning enough cash to generate a
profit, and the liquidity analysis measures the ability to generate cash to pay back short term
debt, pay interest, tax and dividends. Profit margin shows that a small part of Norwegian`s
revenue creates profit and that there still are some left to cover tax and interest rates. ROE
shows the shareholders expected profit. In 2009 it is 25.7%, which is high compared to
previous years and alternative investments e.g. the bank. As the numbers are fluctuating a lot,
there is important to consider the huge risk that follows this industry. ROIC and assets
turnover measure how efficient Norwegian are utilizing its assets. Due to fluctuating numbers
it can be concluded that Norwegian could be more operational efficient.
43

From the liquidity ratios it can be concluded that Norwegian will have problems paying their
current and non current debt. This is on the background of the quick and current ratio analysis
and the operating cash flow and total debt ratio and the decreasing tendency which can
indicate that they have problems creating liquidity. They are therefore dependent on external
help to pay their debt as can be a reason to why Norwegian has had current issue of shares. If
this share issue are included, as to be seen from solvency ratio, it concludes that Norwegian is
a financial healthy company that will have no problems financing their non-current
obligations. This, because of the increase in equity. Their financial leverage ratio says that
Norwegian is at a decreasing level depending on debt as a source of financing. It is seen that
in 2008 had no problems paying interest rates on their debt. On the basis on the ratios it can
be said that that if it wasn’t for the issue of shares and the new capital gain as a result of this,
Norwegian would have been in bigger liquidity problems.
The liberalisation process which is said to be the start of the low cost companies` existence
increased the competition between the European airline companies, as company were allowed
to choose route network and prices themselves. Because of the fierce competition it is hard to
survive. Therefore maintaining as low unit cost as possible is important for Norwegian as they
then can lower ticket prices and still generate profit. Costs that affect unit costs are hard to
control as they depend on external factors such as oil price and landing fees, and internal
factors such as service fees and flight distance. Especially increase in oil prices is not
favourable, as fuel is one of the main costs. The same with fluctuations in exchange rates in
both dollars and Euros as many suppliers are trading in these currencies. The investment in
the new and more environmentally friendly airplanes is seen as an opportunity for Norwegian
as capacity increases and both noise and pollution levels decreases.
Norwegian was benchmarked against two of their largest competitor being SAS and Cimber
Sterling. This was done to analyse where Norwegian stands compared to the overall market.
Even though many of Norwegian`s financial ratios is not that good, they are good compared
to SAS and Cimber Sterling, as they are better in utilizing its assets and give a higher
expected profit for its shareholders. Therefore it can be concluded that Norwegian is a better
investment option compared to SAS and Cimber Sterling. But it is important to mention that
an investment is always dependent on each investor and their risk tolerance.
44

5: Bibliography
Books:
Den Danske Finansanalytikerforening. (1997). Anbefalinger & Nøgletal . København .
Lynch, R. (2006). Corporate Strategy. England: Prentice Hall.
Pennman, S. (2001). Financial Statement Analysis and Security Valuation. Singapore: McGraw-Hill .
Schack, B. (2002). Regnskabsanalyse og virksomhedsbedømmelse. Jurist og økonomiforbundets forlag.
Sørensen, O. (2009). Regnskabsanalyse og værdiansættelse - en praktisk tilgang. Gjellerup.
Internet:
Picture
Airplane: Retrieved from http://www.mansd.org/mcdonough/images/airplane.jpg
Andersen, T. Ø., & Brander, A. S. (2009, November 5). Kjos selger i Norwegian. Retrieved from E24: http://e24.no/boers-og-finans/article3359145.ece
Becker, C. L. (2010, March 16). Giganterstatning til Kjos. Retrieved from Dagens Næringsliv: http://www.dn.no/forsiden/borsMarked/article1860776.ece
Boeing: Retrieved from http://www.boeing.com/commercial/environment/index.html
Dagens Næringsliv. (2009, August 4). Dette hater vi mest på flyreise. Retrieved from http://www.dn.no/borspause/article1716252.ece
Dagens Næringsliv. (2009, October 7). Norwegian vil også fly langt og billig. Retrieved from http://www.dn.no/forsiden/naringsliv/article1756103.ece
Dagens Næringsliv: Market data United States Dollar (b) vs Norwegian Krone Spot (USD/NOK). Retrieved from http://www.dn.no/finans/portal/graph?newt__source=feed.currencies.dn_rt_currencies&newt__item=X%3ASEURUSD
Dagens Næringsliv: Markets data Norwegian Air Shuttle. Retrieved from http://www.dn.no/finans/portal/graph?newt__source=feed.ose.ALL_SHARES&newt__item=NAS
Denstadli, J. M. (2009). Norwegian Air Travel Survey 2009. Retrieved from http://www.avinor.no/avinor/trafikk/20_Reisevaner
Donagis, R. (2002). Flying off course: the economics of international airlines. Retrieved from http://books.google.com/books?id=eR5unZWjOEUC&pg=PA102&lpg=PA102&dq=affects+unit+costs+airline&source=bl&ots=tDcuw8KtBG&sig=w7lgIJny1Sia8gSniS6bmpDSHRQ&hl=no&ei=leG5S6WTCNagONHB1aEL&sa=X&oi=book_result&ct=result&resnum=9&ved=0CDMQ6AEwCA#v=onepage&q=affect
45

EU. (2006). Europe`s free market in air travel. Retrieved from http://europa.eu/rapid/pressReleasesAction.do?reference=IP/96/950&format=HTML&aged=0&language=EN&guiLanguage=en
Financial Times: Market data ICE BRENT CRUDE Future Front Month C. Retrieved from http://markets.ft.com/tearsheets/performance.asp?s=1054972&ss=WSODIssue
International Air Transport Association. (2010, January 27). 2009: Worst Demand Decline in History - Encouraging Year-end Improvements. Retrieved from http://iata.org/pressroom/pr/2010-01-27-01.htm
Kaspersen, L. (2010, February 11). Derfor lykkes Norwegian - mens SAS sliter. Retrieved from Dagens Næringsliv: http://www.dn.no/forsiden/naringsliv/article1836896.ece
Kaspersen, L. (2010, March 17). Renvasker Norwegian. Retrieved from http://www.dn.no/forsiden/naringsliv/article1861369.ece
Kaspersen, L. (2007, May 24). SAS-streik i morgen. Retrieved from http://www.dn.no/forsiden/naringsliv/article1100206.ece
Mills, J., & Yamamura, J. (1998, October). The Power of Cash Flow Ratios. Retrieved from http://www.journalofaccountancy.com/Issues/1998/Oct/mills.htm
Møller, C. (1991). Finans/Invest. Retrieved from Nøgletal for finansielt beredskab: http://www.finansinvest.dk.www.baser.dk/Uploads/91_nr_6_Nøgletal_for_finansiel%20-%20PpjFUHaBJk.pdf
Norwegian Air Shuttle ASA History. Retrieved from http://www.norwegian.com/about-norwegian/facts/history/
Porter, M. (2008). Harvard Business Review. Retrieved from The five competitive forces that shape strategy: http://web.ebscohost.com.www.baser.dk/ehost/pdf?vid=1&hid=11&sid=e42a47eb-6754-455e-acb4-0fe2c56f0ebf%40sessionmgr13&bdata=JnNpdGU9ZWhvc3QtbGl2ZQ%3d%3d
SAS Scandinavian Airlines: SAS was Europe`s most punctual airline in 2009. Retrieved from http://www.sasgroup.net/SASGroup_General/popupContainer.asp?File=Most%20punctual%20airline%202009.htm
Sparre, M. R., & Kaspersen, L. (2010, February 9). SAS henter 5 mrd. Retrieved from Dagens Næringsliv: http://www.dn.no/forsiden/borsMarked/article1834613.ece
Annual Reports:
Cimber Sterling Group AS: Annual Reports, Interim reports. Retrieved from http://investor.cimber.com/annuals.cfm
Norwegian Air Shuttle ASA: Annual Reports, Traffic Figures, Interim Reports. Retrieved from http://www.norwegian.com/about-norwegian/investor-relations/reports--presentations/
SAS Scandinavian Airlines AS: Annual Reports, Interim reports. Retrieved from http://www.sasgroup.net/SASGroup/default.asp
46

6: Appendix
Appendix 1: Norwegian`s route network end 2009; interim report Q4 2009: http://www.norwegian.no/om-norwegian/investor-relations/reports--presentations/interim-reports-and-presentations/
47

Appendix 2: Norwegian`s revenue: domestic and international from presentation of results 2009 Q4
Appendix 3: Norwegian`s fleet in the next six years. From: presentation of results 2009 Q4.
48

Appendix 4: Overview oil price in period 2005-2009: http://markets.ft.com/tearsheets/performance.asp?s=1054972&ss=WSODIssue
Appendix 5: Overview exchange rate USD/NOK in period 2005-2009:
http://www.dn.no/finans/portal/graph?newt__source=feed.currencies.dn_rt_currencies&newt__item=X%3ASEURUSD
49

Appendix 6: Overview of the share development for Norwegian in period 2005-2009:
http://www.dn.no/finans/portal/graph?newt__source=feed.ose.ALL_SHARES&newt__item=NAS
Appendix 7: Norwegian Air Shuttle ASA corporate structure 2008:
http://www.norwegian.com/Global/english/aboutnorwegian/IR/doc/annualreports/Norwegian_Annual_Report_2008.pdf
50

Appendix 8: Cimber Sterling corporate structure April 30, 2009:
http://www.cimber.dk/public/dokumenter/Diverse/Cimber%20Sterilng%20Group%20AS%20-%20%C5rsrapport%202008_09.pdf
Appendix 9: Scandinavian Airline Group corporate structure 2009: http://www.sasgroup.net/SASGroup/default.asp
51

IFRSIn NOK 1000
2009 2008 2007 2006 2005INCOME STATEMENTTicket revenue 6 389 406 5 641 533 3 956 000 2 879 400 1 931 663 Other passenger related revenue 788 655 463 609 212 000 62 000 40 583 Other revenue 131 129 121 271 58 202 Total operating revenues 7 309 189 6 226 413 4 226 202 2 941 400 1 972 246 Operational expences 4 318 731 4 892 727 3 171 818 2 368 636 1 504 338 Payroll 1 303 299 1 076 068 622 189 412 940 298 223 Depreciation, amortization and impairment 148 882 129 611 74 044 51 070 29 316 Other operating expences + leasing 966 411 318 094 224 200 139 264 111 091 Other losses/gains 147 767 Total operating expences 6 737 323 6 564 267 4 092 251 2 971 910 1 942 968 Operating profit 571 866 (337 854) 133 951 (30 510) 29 278
Net financial items 47 974 351 966 (29 949) (1 196) 9 657 Share of profit (loss) from associated company 3 200 (8 773) (1 821) Gain on share issuance of associate - 10 801 Profit (loss) before tax 623 040 5 339 112 982 (31 706) 38 935 Income tax expence 176 789 1 395 28 402 (9 709) 10 955 Profit (loss) for the year 446 251 3 944 84 580 (21 997) 27 980
Appendix 10: Norwegian: Income Statement 2005-2009
52

AssetsNon current assetIntangible assets 198 074 232 407 33 243 31 955 Deffered tax asset 59 759 61 317 96 597 86 694 Total intangible assets 190 700 257 833 293 724 129 840 118 649 Aircraft, parts and installations on leased aircrafts 523 676 209 820 214 419 23 223 Equipment and fixtures 31 014 24 313 14 025 13 597 Buildings 3 933 3 933 Other tangible assets 2 446 814 Financial assets available for sale 5 628 10 004 Investment in associate 81 604 44 743 53 516 Hedged item - firm commitment - 128 031 Prepayment Boeing contract 705 165 316 546 Other receivables 32 403 28 506 8 819 19 388 Total non-current assets 2 719 118 1 604 395 1 068 393 367 103 174 857
Current assetsInventory 40 825 34 214 28 000 19 341 36 764 Trade and other receivables 829 858 914 379 491 543 443 492 200 174 Financial assets available for sale - 215 758 Derivative financial instrument 23 688 18 360 7 771 298 2 563 Hedged item - firm commitment - 18 222 Cash and cash equivalents 1 408 475 607 536 501 410 231 710 261 464 Total current assets 2 302 846 1 574 489 1 262 704 694 841 500 965
Total assets 5 021 964 3 178 884 2 331 097 1 061 944 675 822
Equity and LiabilitiesEquityShare capital 1 093 155 3 236 2 087 1 967 1 837 Share premium 789 130 408 277 Other paid-in equity 508 555 38 984 32 753 273 643 157 523 Other reserves (7 633) (4 550) Retained earnings 73 650 69 706 (14 883) (17 746) Owned Shares - (28) Total equity 1 601 710 897 368 508 273 260 727 141 586
Non-current liabilitiesPension obligation 61 815 33 310 30 794 30 487 Provision for periodic maintenance 114 090 101 042 81 734 34 779 Deferred tax 9 695 19 470 Derivative financial intrument - 154 333 Borrowings 440 873 297 697 Other long term liabilities 918 638 Total non-current liabilities 918 638 626 474 605 852 112 528 65 266
Current liabilitiesShort term part of borrowings 257 456 - Trade and other payables 694 832 644 837 395 850 250 277 Air traffic settlement liabilities 598 162 536 548 291 795 218 693 Derivative financial instrument 104 325 34 375 1 014 - Tax payable 267 1 212 30 - Total current liabilities 2 501 616 1 655 042 1 216 972 688 689 468 970 Total liabilities 3 420 254 2 281 516 1 822 824 801 217 534 236 Total equity and liabilities 5 021 964 3 178 884 2 331 097 1 061 944 675 822
Appendix 11: Norwegian: Balance Sheet 2005-2009
53

From operating activitiesOperating profit (337 854) 133 951 (30 510) 29 278 Taxes paid (787) (738) (163) - Depreciation, amortization and write down 129 611 74 044 51 070 29 316 Pension expence without cash effect 28 505 2 516 307 (8 480) Other non cash items 6 196 1 963 Interest income 39 427 40 901 10 047 10 305 Interest expense (9 880) (70 849) (11 243) (648) Change in inventories, accounts receivable and payable (324 649) 32 153 (1 887) (121 790) Change in air traffic settlement liabilities 61 614 156 343 73 102 109 660 Change in other current assets and current liabilities 22 266 87 648 (15 161) 47 715 Net cash flow from operating activities 884 404 (385 551) 457 932 75 562 95 356 From investing activitiesPayments aircraft purchase (349 436) (316 546) Purchase of tangible assets (393 433) (56 785) (229 930) (21 244) Purchase of intangible assets (33 414) (14 030) (15 029) (17 209) Net cash from aquisitions (20 604) 126 246 Proceeds from sales of financial assets 324 347 - Proceeds from sales of investment bonds 219 065 - Investments in shares and bond - (271 504) Returns on investment in financial fixed asset (298) 85 Net cash flow from investing activities (1 269 894) (253 475) (532 619) (245 257) (38 368) From financial activitiesProceeds from long term debt 339 864 297 000 Proceeds from issuing new shares 376 000 9 425 114 993 1 057 Interest on borrowings (29 220) - Aquisition of own shares - (15 658) Proceeds from sale of own shares 24 871 - Net cash flow from financial activities 1 188 162 686 644 306 425 139 864 (14 601)
Foreign exchange effect on cash (1 734) 4 848 (2 025) (8) Net change in cash and cash equivalents 800 938 52 466 229 713 (29 839) 42 387 Cash and cash equivalents at 1 January 607 536 403 959 174 248 204 086 161 699 Cash and cash equivalents at 31 December 1 408 474 456 425 403 961 174 247 204 086
Cash and cash equivalents in balance sheet 1 408 475 607 536 501 410 231 710 261 464 Restricted funds (151 113) 97 451 57 462 57 378 Cash in cash flow statement 1 408 474 456 425 403 961 174 247 204 086
Appendix 12: Norwegian: Cash Flow Statement 2005-2009
Traffic figures 2009 2008 2007 2006 2005Passengers 10 754 104 9 136 553 6 362 725 5 104 814 3 289 769 Yield 0,60 0,62 0,67 0,68 0,71ASK mill 13 555 11 530 7 561 5 371 3 464 Load factor 78 % 79 % 80 % 79 % 78 %Unit cost (NOK) 0,49 0,56 0,53Unit Revenue (NOK) 0,47 0,49 0,52Number of routes operated during year 200 170 114 86 50Number of aircrafts 46 40 33 19 14
Appendix 13: Norwegian: Traffic Figures 2005-2009
54

2009 2008 2007 2006 2005Inventory 40 825 34 214 28 000 19 341 36 764 Trade and other receivables 829 858 914 379 491 543 443 492 200 174 Financial assets available for sale - - 215 758 - - Derivative financial instrument 23 688 18 360 7 771 298 2 563 Hedged item - firm commitment - - 18 222 - - Cash and cash equivalents 1 408 475 607 536 501 410 231 710 261 464 Current assets 2 302 846 1 574 489 1 262 704 694 841 500 965
Short term part of borrowings 257 456 - - - Derivative financial intrument 104 325 34 375 1 014 - Trade and other payables 694 832 644 837 395 850 250 277 Air traffic settlement liabilities 598 162 536 548 291 795 218 693 Tax payable 267 1 212 30 - Current liabilities 2 501 616 1 655 042 1 216 972 688 659 468 970 Net working capital -198 770 -80 553 45 732 6 182 31 995
Current debt 2 501 616 1 655 042 1 216 972 688 689 468 970
EBIT 571 866 -337 854 133 951 -30 510 29 278 Depreciation, amortization and impairment 148 882 129 611 74 044 51 070 29 316 EBITDA 720 748 -208 243 207 995 20 560 58 594
EBITA 571 866 (337 854) 133 951 (30 510) 29 278 EBITA margin 7,82 -5,43 3,17 -1,04 1,48
Interest expences - -9 880 -70 849 -11 243 -648 Taxes paid - -787 -738 -163 -
Appendix 14: Norwegian: Calculations
2009 2008 2007 2006 2005Share price close From annual report 2005-2009 140 36,9 169 93 79Number of outstanding shares year endFrom annual report 2005-2009 34 209 858 32 359 778 20 865 526 19 669 196 18 085 696
Market cap (NOKm) Numbers of outstanding shares year end*share price close (34209858*140)/1000000 4 789 1 194 3 526 1 829 1 429
EPS Profit (loss) for the year/number of outstanding shares year end(446251*1000)/34209858 13,04 0,12 4,05 -1,12 1,55 P/E Share price close / EPS 140/13,04 10,73 302,76 41,69 -83,16 51,06Book equity per share Equity/ Number of outstanding shares year end (1601710*1000)/34209858 46,82 27,73 24,36 13,26 7,83 Share price/Book equity per share 140/46,82 2,99 1,33 6,94 7,02 10,09
Appendix 15: Norwegian: Share 2005-2009
55

Appendix 16: Norwegian: Key ratios 2005-2009
56
Key rati
oDe
finitio
n/Calc
ulatio
nExa
mple (
2009)
2009
2008
2007
2006
2005
ROE (%
)Pro
fit (Lo
ss) for
the y
ear/Av
erage
equity
44625
1/((16
01710
+89736
8)/2)
35,7 %
0,6 %
22,0 %
-10,9 %
19,8 %
Return
on Inv
ested
Capital
(ROIC)
Profit
(Loss)
for th
e year
/(total
asset
s-cash
)446
251/(
502196
4-140
8475)
12,3 %
0,2 %
4,6 %
-2,6 %
0,07
Profit
Margin
(%)
Profit
(Loss)
for th
e year
after t
ax / O
perati
ng rev
enues
44625
1/730
9189
6,1 %
0,1 %
2,0 %
-0,7 %
1,4 %
EBIT M
argin (
%)EBI
T/ ope
rating
revenu
es571
866/7
3091
897,8
%-5,4
%3,2
%-1,0
%1,5
%
Asset T
urnove
rRev
enue/t
otal as
sets
73091
89/50
21964
1,46
1,96
1,81
2,77
2,92
Growth
in rev
enue (%
)(To
tal re
venue
year1-
total
revenu
e year
0)/tot
al rev
enue y
ear0
(7309
189-6
2664
13)/62
66413
17,4 %
47,3 %
43,7 %
49,1 %
Financ
ial lev
erage
(Debt t
o equi
ty)Tot
al lia
bilitie
s / To
tal eq
uity
34202
54/16
01719
2,14
2,54
3,5
9
3,0
7
3,7
7
Curren
t ratio
curren
t asset
s/curr
ent lia
bilitie
s230
2846/
2501
6160,9
20,9
51,0
41,0
11,0
7Qu
ick rati
o(cu
rrent
assets
- inven
tory)/
curren
t liab
ilities
(2302
846-4
0825
)/2501
6160,9
00,9
31,0
10,9
80,9
9Sol
vency
Equity/
Total l
iabiliti
es160
1719/
3402
5446,
8 %39,
3 %27,
9 %32,
5 %26,
5 %
Growth
in Equ
ity (%)
(Equit
y year
1-equi
ty year
0)/equ
ity ye
ar 0
(1601
719-8
9736
8)/160
1719
78,5 %
76,6 %
94,9 %
84,1 %
Equity
ratio (%
)Equ
ity / to
tal as
sets
16017
19/50
21964
31,9 %
28,2 %
21,8 %
24,6 %
21,0 %
Opera
ting ca
sh flo
w Cas
h Flow
from o
perati
ng acti
vities
(CFFO
)/Curr
ent lia
bilitie
s884
404/2
5016
160,4
-0,20,4
0,10,2
Cash c
urrent
debt c
overag
e (CF
FO - p
aid div
idend
) / cur
rent d
ebt(88
4404
-0)/25
0161
60,4
-0,20,4
0,10,2
Cash in
terest
cover
age(CF
FO + i
nteres
t paid +
taxes
paid)
/ Inte
rest p
aid(88
4404
+-988
0+-78
7)/-98
8040,
1-5,5
-5,7-14
6,2Tot
al debt
CFFO/
Total
debt
88440
4/342
0254
0,26
-0,17
0,25
0,09
0,18

In billion (000 000)IFRSINCOME STATEMENT 2009 2008 2007 2006 2005Revenue 44 918 53 195 50 598 60 777 61887Income from sale of aircraft, buildings, shares 332 4 41 88 667 Share of income in affilated companies -258 -147 32 59 134 Total operating revenues 44 992 53 052 50 671 60 924 62 688 Other operational expences 25 912 31 791 28 682 36 069 35 303 Payroll 17 998 18 153 16 897 18 092 20 467 Depreciation, amortization and impairment 1 845 1 591 1 457 1 964 2 412 Leasing costs for aircrafts 2 319 2 282 2 342 3 526 3 133 Total operating expences 48 074 53 817 49 378 59 651 61 315 Operating profit -3 082 -765 1 293 1 273 1 373
Income from other holding of securities - 5 -47 50 Financial income 304 654 787 488 534 Financial expences -645 -933 -1 041 -1 422 -1 539 Profit (loss) before tax -3 423 -1 044 1 044 292 418 Income tax expence 803 28 -273 -128 -163 Profit (loss) for the year from continuing operations -2 620 -1 016 771 164 255
Income from discounted operations -327 -5 305 -135 4 576 Profit (loss) for the year -2 947 -6 321 636 4 740 255
Appendix 17: SAS: Income statement 2005-2009
AssetsNon current assetIntangible assets 1 296 1 092 1 226 2 932 3 862 Aircraft, parts and installations on leased aircrafts 13 087 11 037 10 766 11 330 14 681 Spare engines and aircraft servicing equipment 1 299 1 185 1 211 1 383 1 526 Workshop and aircraft servicing equipment 161 220 226 215 210 Other equipment and vehicles 192 318 308 634 1 213 Buildings and Land 439 513 568 684 1 257 Construction in progress 158 232 172 378 148 Prepayments relating to tangible fixed assets 238 627 185 317 422 Equity in affiliated companies 358 622 1 063 1 012 1 214 Long term receivables from affiliated companies - 170 189 228 Other holdings of securities 234 5 5 601 214 Pension funds, net 10 286 9 658 9 496 8 805 8 363 Deferred tax assets 1 159 921 690 1 378 1 524 Other long term receivables 729 410 577 1 331 1 577 Total non-current assets 29 636 26 840 26 663 31 189 36 439 Current assetsInventory and Expendable spare parts 758 819 849 993 1 038 Payment to suppliers - 1 1 3 27 Accounts receivable 1 581 1 851 1 951 3 918 1 620 Receivables from affilated companies 92 479 510 357 4 568 Other receivables 4 780 2 661 2 637 2 767 3 892 Prepaid expences and accured income 1 058 1 009 1 070 1 134 1 748 Short term investments 3 691 3 872 7 308 9 117 7 265 Assets held for sale 401 3 921 6 198 - Cash and bank balances 498 1 911 1 583 1 686 1 419 Total current assets 12 859 16 524 22 107 19 975 21 577 Total assets 42 495 43 364 48 770 51 164 58 016
57

Equity and LiabilitiesEquityShare capital 6 168 1 645 1 645 1 645 1 645 Share premiumOther contributed capital 170 170 170 170 658 Other reserves 279 -718 1 466 1 312 918 Retained earnings 4 772 7 585 13 849 13 239 8 283 Minority interests 19 22 577 Total equity 11 389 8 682 17 149 16 388 12 081
Non-current liabilitiesSubordinated loans 919 953 693 716 771 Bond issues - 2 212 2 079 7 135 7 355 Other loans 6 809 10 535 3 936 5 685 11 039 Deferred tax liabilities 2 832 2 988 3 755 3 473 3 617 Other provisions 2 131 768 691 603 697 Other liabilities 378 334 120 235 129 Total non-current liabilities 13 069 17 790 11 274 17 847 23 608
Current liabilitiesCurrent portion of long-term loans 5 742 872 1 615 841 3 183 Short term loans 907 1 189 421 2 043 3 828 Prepayments from customers 13 7 20 181 123 Accounts payables 1 738 2 068 2 108 3 350 4 358 Liabilities to affiliated companies - - 94 169 183 Unearned transportation revenue 3 227 3 299 3 842 3 395 3 038 Current portion of other provisions 852 148 190 318 273 Other liabilities 2 110 2 460 1 580 1 845 1 916 Accured expenses and prepaid income 3 264 4 274 5 149 4 744 5 326 Liabilities attributable to assets held for sale 157 2 465 5 323 - Tax payable 27 110 5 43 99 Total current liabilities 18 037 16 892 20 347 16 929 22 327 Total liabilities 31 106 34 682 31 621 34 776 45 935 Total equity and liabilities 42 495 43 364 48 770 51 164 58 016
Appendix 18: SAS: Balance Sheet 2005-2009
58

From operating activitiesIncome before tax -3 423 -1 044 1 044 292 418 Taxes paid -3 -19 -38 -65 16 Depreciation, amortization and write down 1 845 1 591 1 457 1 964 2 412 Income from sale of aircraft, buildings, shares -332 -4 -46 -91 -717 Income bef. tax in discountinued operations excl. Capital gain -520 -4 113 -710 411 Depreciation and impairments in discounted operations 47 1 804 485 182 Adjustments for items not included in the cash flow 44 -64 -15 -149 -355 Change in inventories, expendable spare parts 69 42 11 -51 -166 Change in operating receivables 8 177 -397 -439 33 Change in liabilities -1 149 -1 021 1 075 48 -134 Net cash flow from operating activities -3 414 -2 651 2 866 2 102 1 507 From investing activitiesAircraft -3 700 -2 995 -1 310 -846 -410 Spare parts -266 -127 -127 -71 -435 Buildings, equipment and other facilitaties -384 -599 -782 -1 139 -791 Shares and participations, intangible assets -230 -69 -171 -118 -173 Prepayments for flight equipment -81 -665 -293 -125 -18 Aquisitions of subsidiary - 7 -225 - Disposal of subsidiaries 605 103 549 5 725 622 Sale of aircraft, buildings and shares + other fixed assets 174 655 652 4 059 2 046 Income from sale and leaseback of aircraft 872 1 166 1 387 160 Sale of non-current assets etc. 399 -389 107 Net cash flow from investing activities -2 611 -2 913 -213 7 485 1 001 From financial activitiesProceeds issurance of borrowings 2 080 6 500 - Repayment of borrowing -3 060 -4 260 -4 700 Change in interest-bearing receivables and liabilities -544 240 208 888 -1 827 Change in minority interest -31 Change in long term loans -7 268 -482 Change in short term loans -1 058 -117 Right issue including issue costs 5 808 Net cash flow from financial activities 4 284 2 480 -4 492 -7 438 -2 457
Cash flow from year -1 741 -3 084 -1 839 2 149 51 Translation difference in liquid assets 49 -18 29 -30 38 Cash&cash equivalents reclassified from/to assets held sale 98 -6 -102 - - Cash and cash equivalents at 1 January 5 783 8 891 10 803 8 684 8 595 Cash and cash equivalents at 31 December 4 189 5 783 8 891 10 803 8 684
Appendix 19: SAS: Cash Flow Statement 2005-2009
2009 2008 2007 2006 2005Passengers 24 898 000 25 355 000 25 403 000 38 609 000 36 312 000 Yield (SEK) 1,22 1,22 1,15 1,10ASK (mill.) 35 571 38 776 36 852 53 771 52 754 Load factor 70,9 % 71,9 % 74,1 % 71,5 % 69,1 %
Appendix 20: SAS: Traffic numbers 2005-2009
59

2009 2008 2007 2006 2005Current assets 12 859 16 524 22 107 19 975 21 577 Current liabilities 18 037 16 892 20 347 16 929 22 327 Net working capital -5 178 -368 1 760 3 046 -750
Intangible assets 1 296 1 092 1 226 2 932 3 862Tangible assets 15 017 13 053 12 853 14 031 18 677 Invested capital 16 313 14 145 14 079 16 963 22 539
Operating profit (2 947) (6 321) 636 4 740 255 EBITA -2 947 -6 321 636 4 740 255EBITA margin -6,55 -11,91 1,26 7,78 0,41
Current debt 18 037 16 892 20 347 16 929 22 327
EBIT -3 082 -765 1 293 1 273 1 373 Depreciation, amortization and impairment 1 845 1 591 1 457 1 964 2 412 EBITDA -1 237 826 2 750 3 237 3 785
Financial income 304 654 787 488 534 Income tax expense 803 28 -273 -128 -163
Repayment of borrowing 3060 4260 4700 8 326 599 Tax adjusted debt repayment 4 250 5 917 6 528 11 564 832
Appendix 21: SAS: Calculations
Key ratio Definition/Calculation Example (2009) 2009 2008 2007 2006 2005ROE Profit (Loss) for the year/Average equity*100 2947/((11389+8682)/2) -29,4 % -48,9 % 3,8 % 33,3 % 2,1 %Return on Invested Capital (ROIC) Profit (Loss) for the year/(total assets-cash) 2947/(42495-498) -0,07 -0,15 0,01 0,10 0,00
Profit Margin Profit (Loss) for the year after tax / Operating revenues 2947/44992 -6,6 % -11,9 % 1,3 % 7,8 % 0,4 %EBIT Margin EBIT/ operating revenues (-3082)/44992 -6,9 % -1,4 % 2,6 % 2,1 % 2,2 %Asset Turnover Revenue/total assets 44992/42495 1,06 1,22 1,04 1,19 1,08Growth in revenue (Total revenue year1-total revenue year0)/total revenue year0 (44992-53052)/53052 -15,2 % 4,7 % -16,8 % -2,8 %
Financial leverage (Debt to Equity) Total liabil ities / Total equity 31106/11389 2,73 3,99 1,84 2,12 3,80Current ratio current assets/current liabil ities 12859/18037 0,71 0,98 1,09 1,18 0,97Quick ratio current assets less inventory/current l iabi lities (12859-758)/18037 0,67 0,93 1,04 1,12 0,92Solvency (%) Equity/Total l iabi lities 11389/31106 36,6 % 25,0 % 54,2 % 47,1 % 26,3 %
Growth in Equity (%) (Equity year1-equity year0)/equity year 0 (11389-8682)/8682 31,2 % -49,4 % 4,6 % 35,7 %Equity ratio (%) Equity / total assets 11389/42495 26,8 % 20,0 % 35,2 % 32,0 % 20,8 %
Operating cash flow (OCF) CFFO / Current debt (-3414)/18037 -0,19 -0,16 0,14 0,12 0,07Cash current debt coverage (CDC) (CFFO - paid dividend) / current debt (-3414-0)/18037 -0,19 -0,16 0,14 0,12 0,07Funds flow coverage (FFC) EBITDA / (intrests + skattekorrigeret afdrag på gæld) (-1237)/(-645+4250) -0,34 0,17 0,50 0,32 -5,35Cash interest coverage(CIC) (CFFO + paid interests + paid tax) / paid interests (-3414-645+803)/-645 5,05 3,81 -1,49 -0,39 0,13Total debt CFFO/Total debt (-3414)/31106 -0,11 -0,08 0,09 0,06 0,03
Appendix 22: SAS: Cash flow ratios 2005-2009
60

2009 2008 2007 2006 2005Share Price at year end From annual report 2005-2009 4,03 6,19 13,55 19,03 17,07Outstanding shares year end From annual report 2005-2009 2 467 500 000 1 645 000 000 164 500 000 164 500 000 164 500 000
Market capitalization (SEKmill) Outstanding shares year end* average share price 4,03*2467500000*1000000 9 944 10 183 2 229 3 130 2 808
EPS Profit (loss) for the year / average number of stocks 2947*1000000/2467500000 -1,19 -3,84 3,87 28,81 1,55 P/E share price at year end / EPS 4,03/-1,19 -3,37 -1,61 3,50 0,66 11,01 Book equity per share Equity/number of outstanding shares year end 11389*1000000/2467500000 4,62 5,28 104,25 99,62 73,44
Share price year end/Book equity per share 4,03/4,62 0,87 1,17 0,13 0,19 0,23
Appendix 23: SAS: Share
2008/2009 2007/2008 2006/2007 2005/2006 2004/2005INCOME STATEMENTTicket revenue 1 297 757 1 148 192 970 791 830 000 692 000 Other passenger related revenueOther revenue - 44 854 - Total operating revenues 1 297 757 1 193 046 970 791 830 000 692 000 Operational expences 673 504 549 151 471 021 Payroll 401 771 356 472 288 790 Other operating expences 72 103 59 781 47 865 Operating expences 1 147 378 965 404 807 676 Operating profit before leasing and depreciation 150 379 227 642 163 115 Leasing costs 58 257 69 908 63 930 64 000 51 000 Depreciation 93 841 84 191 45 591 51 000 58 000 Total operating expences 1 299 476 1 119 503 917 197 115 000 109 000 Operating profit -1 719 73 543 53 594 715 000 583 000
Financial income 1 472 32 585 6 231 Financial expences 78 888 36 840 24 042 Net financial items -77 416 -4 255 -17 811 -12 000 -12 000 Profit (loss) before tax -79 135 69 288 35 783 703 000 571 000 Income tax expence 20 210 -13 281 -9 938 4 000 30 000 Profit (loss) for the year -58 925 56 007 25 845 4 000 -73 000
Appendix 24: Cimber Sterling: Income Statement 2004/2005-2008/2009
61

Assets 2008/2009 2007/2008 2006/2007Non current assetIntangible assets (patents) 11 159 1 793 1 729 Aircraft, parts and installations on leased aircrafts 731 969 759 470 569 567 Equipment and fixtures 19 091 16 468 8 494 Buildings 15 609 16 871 16 707 Materielle aktiver under udførelse 9 080 2 476 1 435 Other receivables 20 462 8 615 16 956 Total non-current assets 807 370 805 693 614 888 Current assetsInventory 82 145 60 834 45 652 Receivables from sale of inventory 123 184 137 956 138 845 Derivative financial instrument - - 1 052 Income tax receivable 5 93 183 Other receivables 50 113 33 437 16 103 Prepaid expences 22 985 4 752 6 264 Securities 128 1 066 26 228 Cash and cash equivalents 4 282 1 814 25 565 Total current assets 282 842 239 952 259 892 Total assets 1 090 212 1 045 645 874 780 EquityShare capital 600 600 600 Share premium 30 652 30 652 30 652 Value adjustments hedging 8 458 -12 412 1 052 Retained earnings 122 668 181 593 170 666 Total equity 162 378 200 433 202 970 Non-current liabilitiesProvision 750 - 51 947 Deferred tax 51 762 65 012 55 897 Creditinstitutions 350 837 354 762 217 681 Leasingobligations 31 462 38 762 45 520 Borrowings 20 210 7 378 6 914 Total non-current liabilities 455 021 465 914 377 959 Short term liabilitiesShort term part of borrowings 1 596 1 012 1 253 Short term part of creditinstitution debt 59 523 55 857 28 966 Driftskredit 12 964 33 434 22 968 Short term part of leasing obligations 7 300 6 758 6 256 Derivative financial instrument - 16 546 - Received prepayments 177 527 90 221 34 736 Air traffic liabilities 102 117 83 673 78 496 Other borrowings 106 914 91 797 121 176 Provisions 4 872 - - Total short term liabilities 472 813 379 298 293 851 Total liabilities 927 834 845 212 671 810 Total equity and liabilities 1 090 212 1 045 645 874 780
Appendix 25: Cimber Sterling: Balance Sheet 2006/2007-2008/2009
62

From operating activitiesOperating profit before tax -79 135 69 288 35 783 Depreciation, amortization and write down 93 841 84 191 45 591 Other non cash items 5 301 10 270 136 Provisions 5 622 -51 947 - Financial income -1 472 -32 585 -6 231 Financial expense 78 888 36 840 24 042 Change in inventory -21 311 -15 182 -3 460 Change in account receivables -20 137 -14 935 -30 029 Change in prepayments, suppliers, other debt 120 867 31 283 16 418 Intrest income 1 111 28 048 1 061 Intrest expences -29 338 -29 793 -19 038 Taxes paid 92 61 256 Net cash flow from operating activities 154 329 115 539 64 529 From investing activitiesPurchase of intangible assets -10 427 -908 -550 Purchase of tangible assets -79 083 -308 385 -35 501 Sale of tangible assets 3 390 25 956 11 062 Net cash from aquisitions 2 450 - - Change in longterm receivables -11 847 8 341 -2 608 Sale of securities 851 24 857 4 455 Net cash flow from investing activities -94 666 -250 139 -23 142 From financial activitiesChange in debt to credit institutions -57 195 155 930 -41 627 Paid dividends to investors - -45 080 - Net cash flow from financial activities -57 195 110 850 -41 627
Net change in cash and cash equivalents 2 468 -23 750 -240 Cash and cash equivalents at 1 January 1 814 25 565 25 805 Cash and cash equivalents at 31 December 4 282 1 815 25 565
Appendix 26: Cimber Sterling: Cash Flow Statement 2006/2007-2008/2009
2008/2009 2007/2008 2006/2007 2005/2006 2004/2005Current assets 282 842 239 952 259 892 Current liabilities 472 813 379 298 293 851 Net working capital -189 971 -139 346 -33 959
EBIT -1 719 73 543 53 594 715 000 583 000 Depreciation, amortization and impairment 93 841 84 191 45 591 51 000 58 000 EBITDA 92 122 157 734 99 185 766 000 641 000
Tax adjusted debt repaymentChange in debt to credit institutions 57 195 -155 930 41 627 Tax adjusted (Change in debt/tax rate (1-0,28) 79 438 -216 569 57 815
Appendix 27: Cimber Sterling: Calculations
63

Key ratio Definition/Calculation Example (2008/2009) 2008/2009 2007/2008 2006/2007ROE Profit (Loss) for the year/Average equity (-58925)/((162378+200433)/2) -32,48 % 27,77 % 12,73 %Return on invested capital (ROIC) Profit (Loss) for the year/(total assets-cash) (-58925)/(1090212-4282) -0,05 0,05 0,03
Profit Margin (%) Profit (Loss) for the year after tax / Operating revenues (-58925)/1297757 -4,5 % 4,7 % 2,7 %EBIT Margin (%) EBIT/ operating revenues (-1719)/1297757 -0,1 % 6,2 % 5,5 %Asset Turnover Revenue/operating assets 1297757/1090212 1,19 1,14 1,11ROA EBIT/ operating assets (-1719)/1090212 -0,002 0,07 0,06
Growth in revenue (%) (Total revenue year1-total revenue year0)/total revenue year0 (1297757-1193046)/1193046 8,8 % 22,9 % 17,0 %
Financial leverage (Debt to equity) Total l iabil ities / Total equity 927834/162378 5,71 4,22 3,31Current ratio current assets/current liabilities 282842/472813 0,60 0,63 0,88Quick ratio (current assets - inventory)/current liabilities (282842-82145)/472813 0,42 0,47 0,73Solvency Equity/Total l iabil ities 162378/927834 17,5 % 23,7 % 30,2 %
Growth in Equity (Equity year1-equity year0)/equity year 0 (162378-200433)/200433 -19,0 % -1,2 %Equity ratio Equity / total assets 162378/1090212 14,9 % 19,2 % 23,2 %
Operating cash flow (OCF) CFFO / Current debt 154329/472813 0,33 0,30 0,22Cash current debt coverage (CDC) (CFFO - paid dividend) / current debt (154329-0)/472813 0,33 0,19 0,22Funds flow coverage (FFC) EBITDA / (intrests + tax adjustments on debt) 92122/(29338+79438) 1,84 -0,64 2,56Cash interest coverage(CIC) (CFFO + paid intrests + paid tax) / paid intrests (154329+29338+92)/29338 -4,26 -2,88 -2,40Total debt CFFO/Total debt 154329/927834 0,17 0,14 0,10
Appendix 28: Cimber Sterling: Key ratios
64