Embed Size (px)
Citation preview

© 2019 Purigen Biosystems, Inc. All rights reserved.
Ionic™ Purification SystemSimplified Nucleic Acid Purification
BROCHUREVERSION 1.1 | OCTOBER 2019
Purigen Biosystems, Inc.5700 Stoneridge Drive, Suite 100
Pleasanton, CA 94588
TEL: +1 925 264-1364 EMAIL: [email protected]
PURIGEN BIOSYSTEMS

2
BROCHURE | IONIC™ PURIFICATION SYSTEM
The commonly used bead- and column-based extraction technologies have followed the same fundamental workflow for over 20 years. This workflow uses ethanol, chaotropic salts, and other solutions to bind nucleic acid to a silica membrane or surface-labeled bead, which is then washed prior to the nucleic acid being stripped off the solid support into an elution buffer. During this typically laborious process, the nucleic acid is denatured, dehydrated, and fragmented. The eluate is also susceptible to contamination from wash buffers or beads.
Why We Developed a New Approach to Nucleic Acid Purification
Disadvantages Consequences
Incomplete binding to or removal from the solid support • Nucleic acid loss compromises data quality when sample input quantity is limited
• Recovery can be biased by fragment length or GC content
• For researchers, reduced biological insight
• For clinicians, less actionable information and false negatives
Contamination from wash buffers and bead coatings • Low purity leading to false negatives and compromised data
Workflow with multiple hands-on steps • Throughput bottleneck and potential errors; excessive use of disposable tips and labware
Process and Characteristics
• Surface-based = loss and damage
• Wash solution contamination
• Limited integration potential
Traditional Purification Separation Principle
Column-based Silica
Bead-based Carboxyl
Solubility

3
Impurity
Trailing Ions (slow) Leading Ions (fast)
Nucleic Acid
1 Sample loaded
CathodicBuffer
SeparationBuffer
ElutionBuffer
AnodicBuffer
Nucleic Acid
2 Current applied; nucleic acid moves and concentrates
CathodicBuffer
SeparationBuffer
ElutionBuffer
AnodicBuffer
Nucleic Acid
3 Purified sample collectedNucleic Acid
Impurities Nucleic Acid
Purigen Biosystems
Isotachophoresis (ITP) separates and concentrates charged molecules in solution solely based on their electrophoretic mobility. Biological samples are gently lysed and added to the Purigen Ionic™ Fluidics Chip. An electric field is then applied to the chip and the nucleic acid is isolated in its natural, native form. The nucleic acid is not denatured or dehydrated, and there’s no binding to, or stripping from, fixed surfaces. The result is a higher yield of pure nucleic acid that is less fragmented and free from bead or wash buffer contamination.
Isotachophoresis – a Superior Approach to Nucleic Acid Separation
Process and Characteristics
• Solution-based = higher yield and integrity
• Higher purity
• Fewer processing steps and less hands-on time
Purigen ITP Separation Principle
ITP Charge
Simple Charge-based Sample Prep in Solution

4
BROCHURE | IONIC™ PURIFICATION SYSTEM
Ionic™ Purification System
The revolutionary Ionic™ Purification System from Purigen Biosystems utilizes isotachophoresis (ITP) to extract, purify, and concentrate nucleic acid from biological samples. Nucleic acids extracted by the system are pure, abundant, and ready to use in just 60 minutes.
➊ Touchscreen console; Software-driven workflow
2 Thermally controlled chip holder
3 Compact benchtop footprint
➊
3
2
Simplified Nucleic Acid Preparation
The Ionic system is so different, its advantages are most readily understood in contrast with conventional nucleic acid extraction and purification methods:
No organic solvents
No harsh, high-salt buffers
No system programming
No beads or repetitive washing
No hands-on mixing, separation, sample transfers, or buffer exchanges
No pumps, valves, or other moving parts
5
Purigen Biosystems
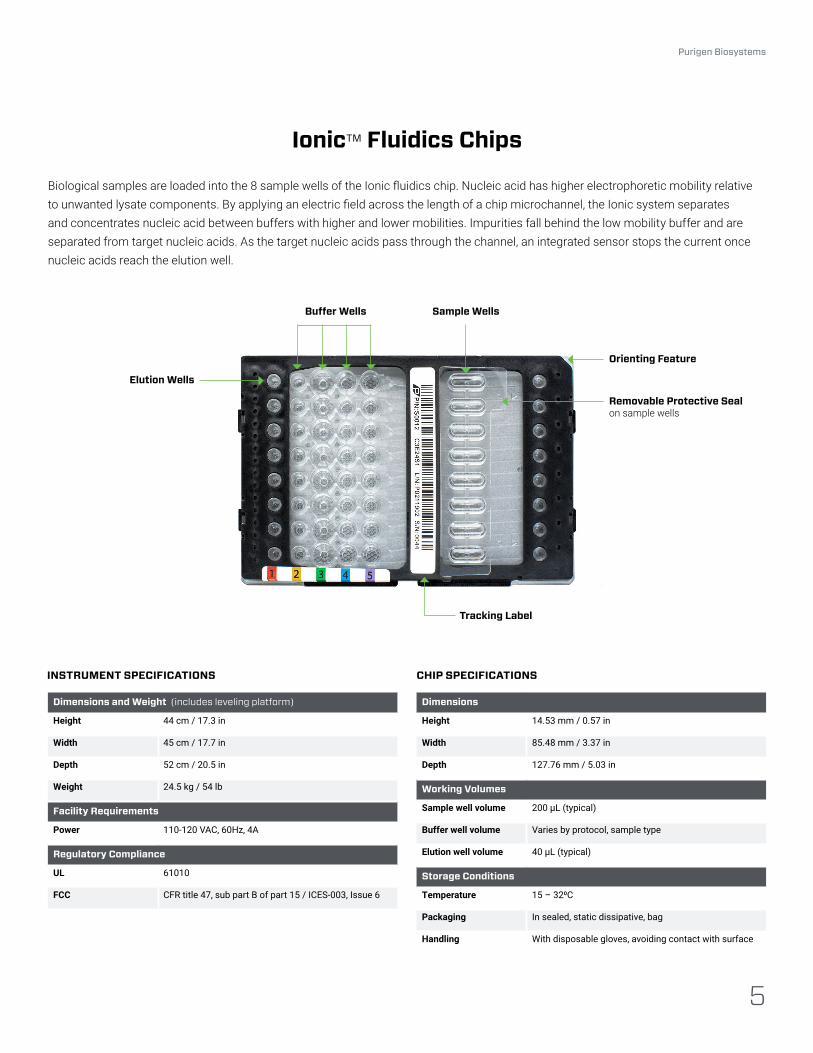
Ionic™ Fluidics Chips
Biological samples are loaded into the 8 sample wells of the Ionic fluidics chip. Nucleic acid has higher electrophoretic mobility relative to unwanted lysate components. By applying an electric field across the length of a chip microchannel, the Ionic system separates and concentrates nucleic acid between buffers with higher and lower mobilities. Impurities fall behind the low mobility buffer and are separated from target nucleic acids. As the target nucleic acids pass through the channel, an integrated sensor stops the current once nucleic acids reach the elution well.
INSTRUMENT SPECIFICATIONS
Dimensions and Weight (includes leveling platform)
Height 44 cm / 17.3 in
Width 45 cm / 17.7 in
Depth 52 cm / 20.5 in
Weight 24.5 kg / 54 lb
Facility Requirements
Power 110-120 VAC, 60Hz, 4A
Regulatory Compliance
UL 61010
FCC CFR title 47, sub part B of part 15 / ICES-003, Issue 6
CHIP SPECIFICATIONS
Dimensions
Height 14.53 mm / 0.57 in
Width 85.48 mm / 3.37 in
Depth 127.76 mm / 5.03 in
Working Volumes
Sample well volume 200 µL (typical)
Buffer well volume Varies by protocol, sample type
Elution well volume 40 µL (typical)
Storage Conditions
Temperature 15 – 32⁰C
Packaging In sealed, static dissipative, bag
Handling With disposable gloves, avoiding contact with surface
Orienting Feature
Removable Protective Sealon sample wells
Tracking Label
Elution Wells
Sample WellsBuffer Wells

6
BROCHURE | IONIC™ PURIFICATION SYSTEM
Rapid Purification of Precious Samples in Just ONE Hour
Ionic System Workflow
60 minTotal Run-time
< 3 minutes total hands-on time per sample
2Load SamplesLoad 8 samples – use touchscreen to start the run
50 mins
Load Run BuffersAdd buffers from reagent kit – use touchscreen to start priming
8 mins1
Get Purified Nucleic AcidCollect samples when touchscreen displays “Run Complete”
2 mins3
7
Purigen Biosystems
Higher Quality Nucleic Acid for Higher Quality Data
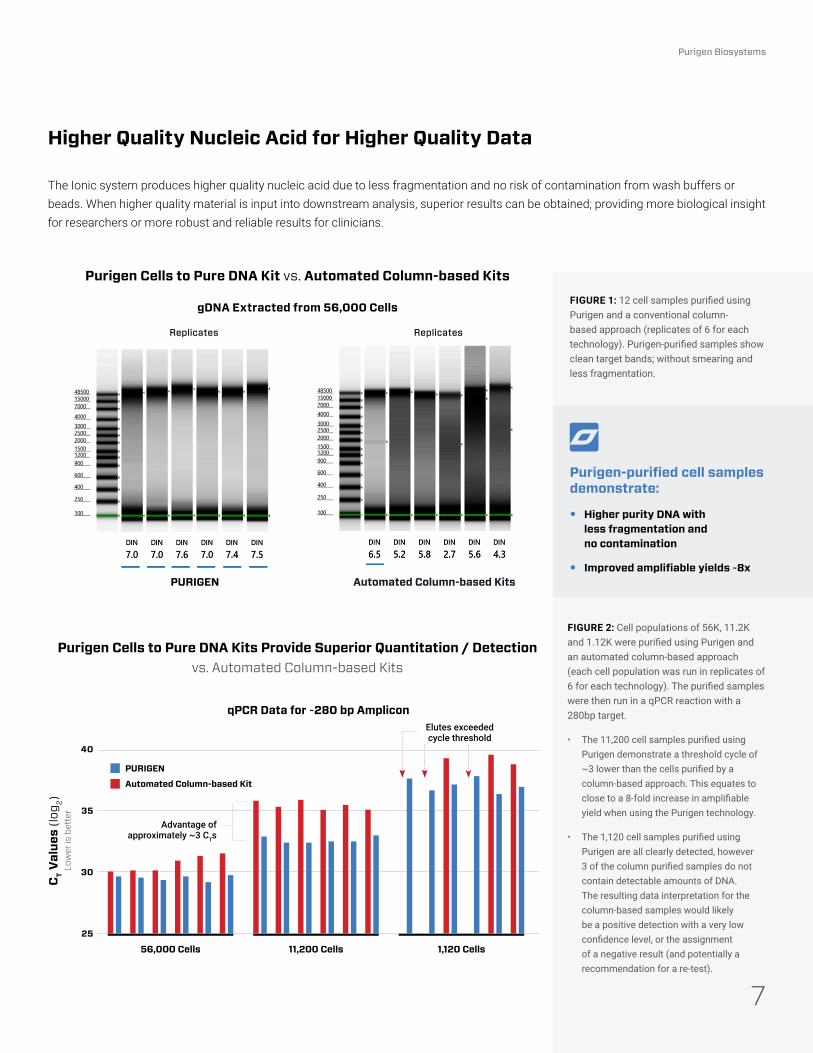
The Ionic system produces higher quality nucleic acid due to less fragmentation and no risk of contamination from wash buffers or beads. When higher quality material is input into downstream analysis, superior results can be obtained; providing more biological insight for researchers or more robust and reliable results for clinicians.
FIGURE 2: Cell populations of 56K, 11.2K and 1.12K were purified using Purigen and an automated column-based approach (each cell population was run in replicates of 6 for each technology). The purified samples were then run in a qPCR reaction with a 280bp target.
• The 11,200 cell samples purified using Purigen demonstrate a threshold cycle of ~3 lower than the cells purified by a column-based approach. This equates to close to a 8-fold increase in amplifiable yield when using the Purigen technology.
• The 1,120 cell samples purified using Purigen are all clearly detected, however 3 of the column purified samples do not contain detectable amounts of DNA. The resulting data interpretation for the column-based samples would likely be a positive detection with a very low confidence level, or the assignment of a negative result (and potentially a recommendation for a re-test).
Purigen Cells to Pure DNA Kits Provide Superior Quantitation / Detectionvs. Automated Column-based Kits
Purigen-purified cell samples demonstrate:
Higher purity DNA with less fragmentation and no contamination
Improved amplifiable yields ~8x
FIGURE 1: 12 cell samples purified using Purigen and a conventional column-based approach (replicates of 6 for each technology). Purigen-purified samples show clean target bands; without smearing and less fragmentation.
7
Purigen Cells to Pure DNA Kit vs. Automated Column-based Kits
gDNA Extracted from 56,000 Cells
15
Purigen Cells-to-DNA Provides Higher Quality DNAvs. Automated Column-based System
Purigen Automated Column-based System
(gDNA extracted from 56,000 cells)
15
Purigen Cells-to-DNA Provides Higher Quality DNAvs. Automated Column-based System
Purigen Automated Column-based System
(gDNA extracted from 56,000 cells)
PURIGEN Automated Column-based Kits
15
Purigen Cells-to-DNA Provides Higher Quality DNAvs. Automated Column-based System
Purigen Automated Column-based System
(gDNA extracted from 56,000 cells)
15
Purigen Cells-to-DNA Provides Higher Quality DNAvs. Automated Column-based System
Purigen Automated Column-based System
(gDNA extracted from 56,000 cells)
Replicates Replicates
40
35
30
25
CT V
alue
s (lo
g 2)Lo
wer
is b
ette
r
PURIGEN
Automated Column-based Kit
Advantage of approximately ~3 CTs
qPCR Data for ~280 bp AmpliconElutes exceeded cycle threshold
11,200 Cells56,000 Cells 1,120 Cells
Load 8 samples – use touchscreen to start the run
Add buffers from reagent kit – use touchscreen to start priming
Collect samples when touchscreen displays “Run Complete”
8
BROCHURE | IONIC™ PURIFICATION SYSTEM
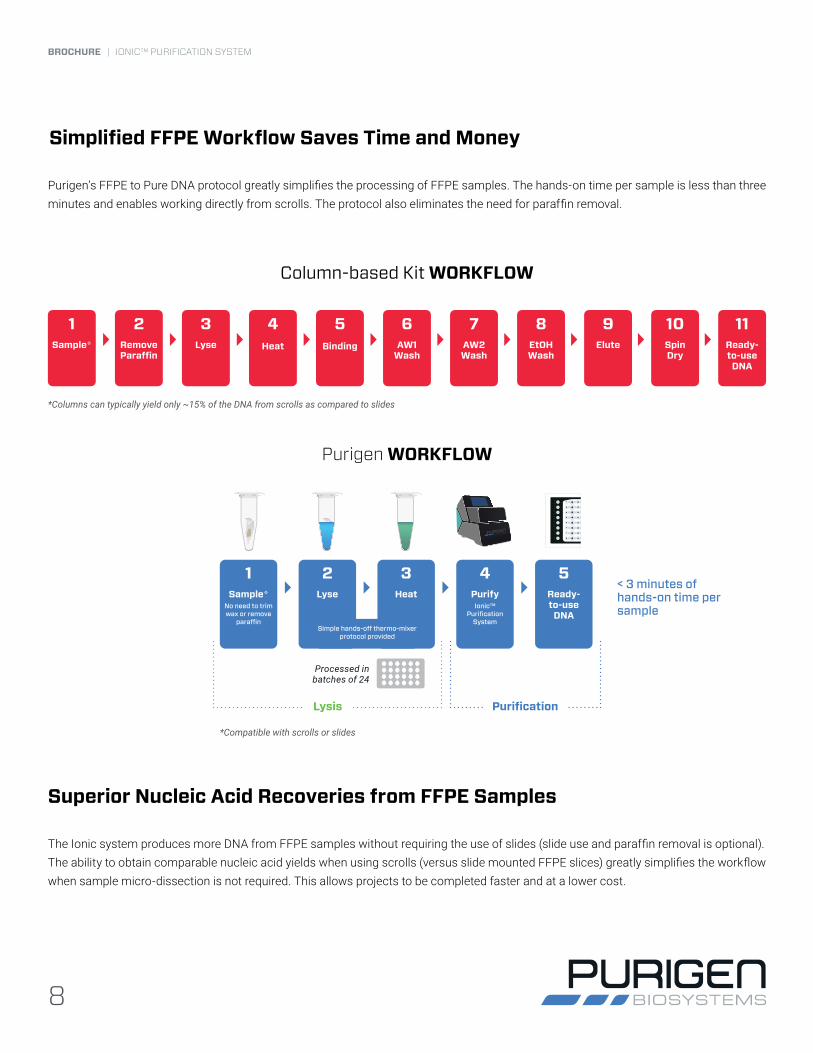
Superior Nucleic Acid Recoveries from FFPE Samples
The Ionic system produces more DNA from FFPE samples without requiring the use of slides (slide use and paraffin removal is optional). The ability to obtain comparable nucleic acid yields when using scrolls (versus slide mounted FFPE slices) greatly simplifies the workflow when sample micro-dissection is not required. This allows projects to be completed faster and at a lower cost.
Purigen’s FFPE to Pure DNA protocol greatly simplifies the processing of FFPE samples. The hands-on time per sample is less than three minutes and enables working directly from scrolls. The protocol also eliminates the need for paraffin removal.
Simplified FFPE Workflow Saves Time and Money
Column-based Kit WORKFLOW
1Sample*
5Binding
2Remove Paraffin
6AW1
Wash
3Lyse
7AW2 Wash
4Heat
8EtOH Wash
9Elute
10Spin Dry
11Ready- to-use
DNA
*Columns can typically yield only ~15% of the DNA from scrolls as compared to slides
Purigen WORKFLOW
*Compatible with scrolls or slides
Processed in batches of 24
2Lyse
1Sample*
No need to trim wax or remove
paraffin
5Ready- to-use
DNA
3Heat
4Purify
Ionic™ Purification
SystemSimple hands-off thermo-mixer
protocol provided
Lysis Purification
< 3 minutes of hands-on time per sample
9
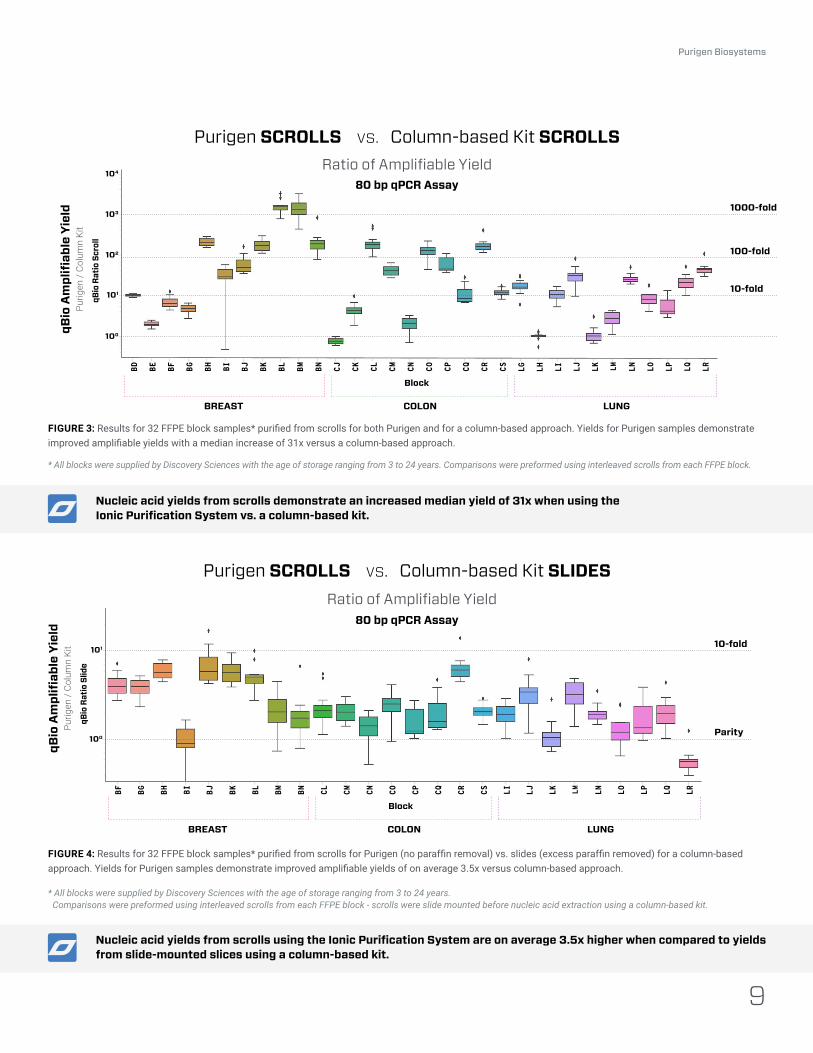
Nucleic acid yields from scrolls demonstrate an increased median yield of 31x when using the Ionic Purification System vs. a column-based kit.
Purigen Biosystems
FIGURE 4: Results for 32 FFPE block samples* purified from scrolls for Purigen (no paraffin removal) vs. slides (excess paraffin removed) for a column-based approach. Yields for Purigen samples demonstrate improved amplifiable yields of on average 3.5x versus column-based approach.
qBio
Am
plifi
able
Yie
ldPu
rigen
/ Co
lum
n Ki
t 101
100
qBio
Rat
io S
lide
BF BG BH BI BJ BK BL BM BN CL CM CN CO CQ CR CS LI LJ LK LM LN LO LP LQ LRCP
10-fold
Parity
Block
BREAST COLON LUNG
Selected for Sequencing
* All blocks were supplied by Discovery Sciences with the age of storage ranging from 3 to 24 years. Comparisons were preformed using interleaved scrolls from each FFPE block - scrolls were slide mounted before nucleic acid extraction using a column-based kit.
80 bp qPCR Assay
Purigen SCROLLS vs. Column-based Kit SLIDES
Nucleic acid yields from scrolls using the Ionic Purification System are on average 3.5x higher when compared to yields from slide-mounted slices using a column-based kit.
FIGURE 3: Results for 32 FFPE block samples* purified from scrolls for both Purigen and for a column-based approach. Yields for Purigen samples demonstrate improved amplifiable yields with a median increase of 31x versus a column-based approach.
qBio
Am
plifi
able
Yie
ldPu
rigen
/ Co
lum
n Ki
t
100
qBio
Rat
io S
crol
l
BD BE BH BI BJ BK BL BM BN CL CM CN CO CP CQ CR CS LI LJ LK LM LN LO LP LQ LR
Block
BREAST COLON LUNG
10-fold101
102
103
104BF BG CJ CK LG LH
100-fold
1000-fold
* All blocks were supplied by Discovery Sciences with the age of storage ranging from 3 to 24 years. Comparisons were preformed using interleaved scrolls from each FFPE block.
80 bp qPCR AssayRatio of Amplifiable Yield
Ratio of Amplifiable Yield
Purigen SCROLLS vs. Column-based Kit SCROLLS
10
BROCHURE | IONIC™ PURIFICATION SYSTEM
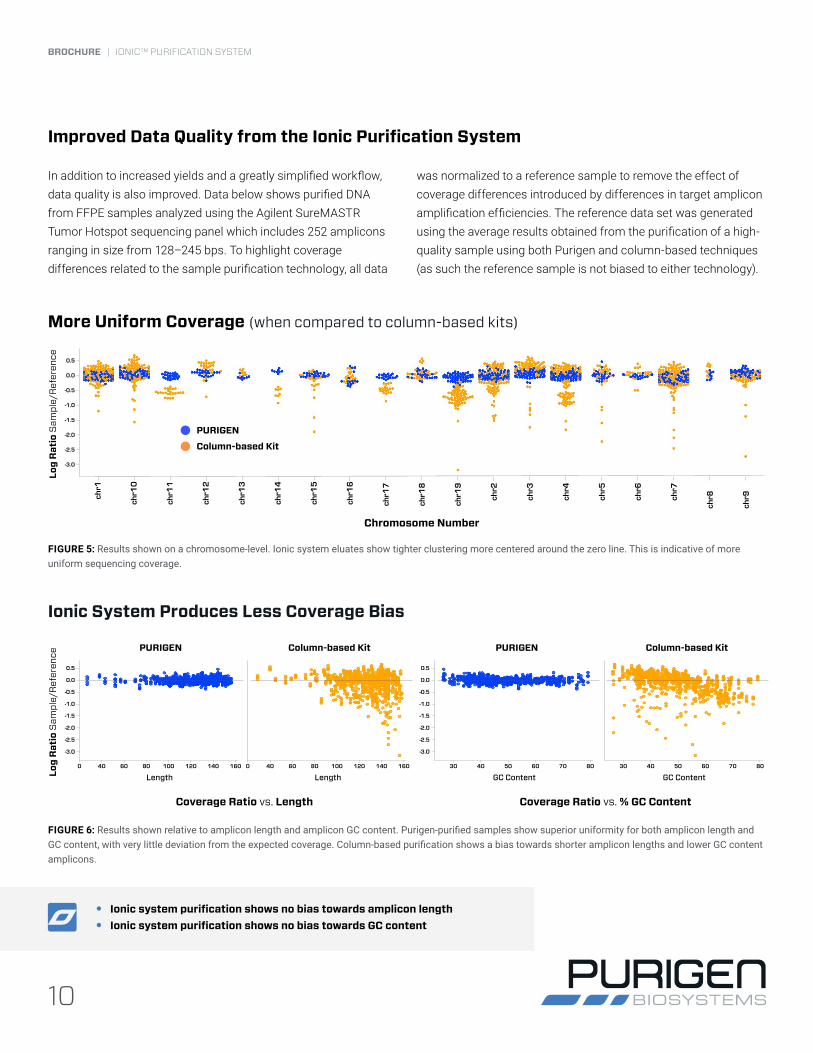
In addition to increased yields and a greatly simplified workflow, data quality is also improved. Data below shows purified DNA from FFPE samples analyzed using the Agilent SureMASTR Tumor Hotspot sequencing panel which includes 252 amplicons ranging in size from 128–245 bps. To highlight coverage differences related to the sample purification technology, all data
was normalized to a reference sample to remove the effect of coverage differences introduced by differences in target amplicon amplification efficiencies. The reference data set was generated using the average results obtained from the purification of a high-quality sample using both Purigen and column-based techniques (as such the reference sample is not biased to either technology).
Improved Data Quality from the Ionic Purification System
More Uniform Coverage (when compared to column-based kits)
Chromosome Number
0.5
0.0
-0.5
-1.0
-1.5
-2.0
-2.5
-3.0
chr1
chr1
0
chr1
1
chr1
2
chr1
3
chr1
4
chr1
5
chr1
6
chr1
7
chr1
8
chr1
9
chr2
chr3
chr4
chr5
chr6
chr7
chr8
chr9
PURIGEN
Column-based Kit
FIGURE 5: Results shown on a chromosome-level. Ionic system eluates show tighter clustering more centered around the zero line. This is indicative of more uniform sequencing coverage.
Ionic system purification shows no bias towards amplicon lengthIonic system purification shows no bias towards GC content
FIGURE 6: Results shown relative to amplicon length and amplicon GC content. Purigen-purified samples show superior uniformity for both amplicon length and GC content, with very little deviation from the expected coverage. Column-based purification shows a bias towards shorter amplicon lengths and lower GC content amplicons.
0 40 60 80 100 120 140 160
0.5
0.0
-0.5
-1.0
-1.5
-2.0
-2.5
-3.0
30 40 50 60 70 80
0.5
0.0
-0.5
-1.0
-1.5
-2.0
-2.5
-3.0
Log
Rat
io S
ampl
e/R
efer
ence
0 40 60 80 100 120 140 160
Length GC ContentLength GC Content30 40 50 60 70 80
Coverage Ratio vs. Length Coverage Ratio vs. % GC Content
PURIGEN Column-based Kit PURIGEN Column-based Kit
Ionic System Produces Less Coverage Bias
Log
Rat
io S
ampl
e/R
efer
ence

11
No Bias Toward Length or GC Content of Amplicons
FIGURES 7 and 8: Data points highlighted in teal indicate that “tailing” data points in column-based purifications seem to be a result of bias against longer length amplicons. Data points highlighted in maroon indicate that “downward shifts” of chromosome specific data seem to be a result of bias against longer amplicons and higher GC content amplicons.
Chromosome Number
0.5
0.0
-0.5
-1.0
-1.5
-2.0
-2.5
-3.0
chr1
chr1
0
chr1
1
chr1
2
chr1
3
chr1
4
chr1
5
chr1
6
chr1
7
chr1
8
chr1
9
chr2
chr3
chr4
chr5
chr6
chr7
chr8
chr9
Purigen-purified FFPE samples demonstrate:
3.5x higher yield on average from scrolls or slides
No bias toward length or GC content
More uniform sequence coverage
Length
Coverage Ratio vs. Length
Length
Coverage Ratio vs. Length
PURIGEN
0.5
0.0
-0.5
-1.0
-1.5
-2.0
-2.5
-3.0
20 40 60 80 100 120 140 160
uniform coverage at all lengths
GC Content
Coverage Ratio vs. % GC Content
Column-based Kit
0.5
0.0
-0.5
-1.0
-1.5
-2.0
-2.5
-3.0
30 40 50 60 70 80
lower coverage at higher GC content
Purigen Biosystems
GC Content
Coverage Ratio vs. % GC Content
PURIGEN
0.5
0.0
-0.5
-1.0
-1.5
-2.0
-2.5
-3.0
30 40 50 60 70 80
uniform coverage for all GC content
Column-based Kit
0.5
0.0
-0.5
-1.0
-1.5
-2.0
-2.5
-3.0
20 40 60 80 100 120 140 160
lower coverage at longer length
Log
Rat
io S
ampl
e/R
efer
ence
Log
Rat
io S
ampl
e/R
efer
ence
Log
Rat
io S
ampl
e/R
efer
ence

Purigen Biosystems, Inc.5700 Stoneridge Drive, Suite 100Pleasanton, CA 94588
TEL: +1 925 264-1364 EMAIL: [email protected]
© 2019 Purigen Biosystems, Inc. All rights reserved.Ionic™ is a trademark of Purigen Biosystems, Inc., in the U.S. PUR-DOC-10