Embed Size (px)
Citation preview
Purpose
This document describes how to use the NagVis network status visualization tool with Nagios
XI. NagVis is a visualization add-on for Nagios, which allows you to display host and service
objects in a visual manner.
Target Audience
This document is intended for use by Nagios XI
administrators who wish to deploy NagVis for
visualization of their monitored devices.
Accessing NagVis
NagVis is included as part of the Nagios XI. To access
NagVis, open the following URL in your web browser
(replacing <yourserver> with your Nagios XI server's
address).
http://<yourserver>/nagvis
NagVis uses a different authentication mechanism than Nagios XI, so you will need to re-authenticate in order
access NagVis. When prompted, use the same username and password you use to login to Nagios XI. Once
you authenticate you should see a default NagVis view with some demo maps:
1295 Bandana Blvd N, St. Paul, MN 55108 [email protected] US: 1-888-624-4671 INTL: 1-651-204-9102
© 2017 Nagios Enterprises, LLC. All rights reserved. Nagios, the Nagios logo, and Nagios graphics are the servicemarks, trademarks, or registered trademarks owned by Nagios Enterprises. All other servicemarks and trademarks are the property of their respective owner.
www.nagios.comPage 1 / 18
Updated – January, 2018
Nagios XI
The Industry Standard In Infrastructure Monitoring
Integrating NagVis With Nagios XI

WUI
NagVis has an included web based config tool
called WUI. To use it click the drop down menu
Open and select WUI. You may need to disable
script or popup blockers to use the WUI.
Refer to the official NagVis documentation for
usage, configuration, and map creation information at:
http://www.nagvis.org/documentation
Customizing The Automap
Automap is an automatically generated display of defined hosts. Automap
can be accessed by clicking the drop down menu Open and select Default
Automap.
By default, the Automap shows a rather plain page with a single bubble for
localhost (your monitoring server) in the middle, even if you have other
hosts defined.
In order for those other hosts to show up in the Automap, you will need to define parent/child relationships for
each host you wish to appear. Those hosts must have a parent/child path back to localhost.
Keep reading for instructions on how to configure parent/child relationships and customize the look of the
Automap.
1295 Bandana Blvd N, St. Paul, MN 55108 [email protected] US: 1-888-624-4671 INTL: 1-651-204-9102
© 2017 Nagios Enterprises, LLC. All rights reserved. Nagios, the Nagios logo, and Nagios graphics are the servicemarks, trademarks, or registered trademarks owned by Nagios Enterprises. All other servicemarks and trademarks are the property of their respective owner.
www.nagios.comPage 2 / 18
Updated – January, 2018
Nagios XI
The Industry Standard In Infrastructure Monitoring
Integrating NagVis With Nagios XI
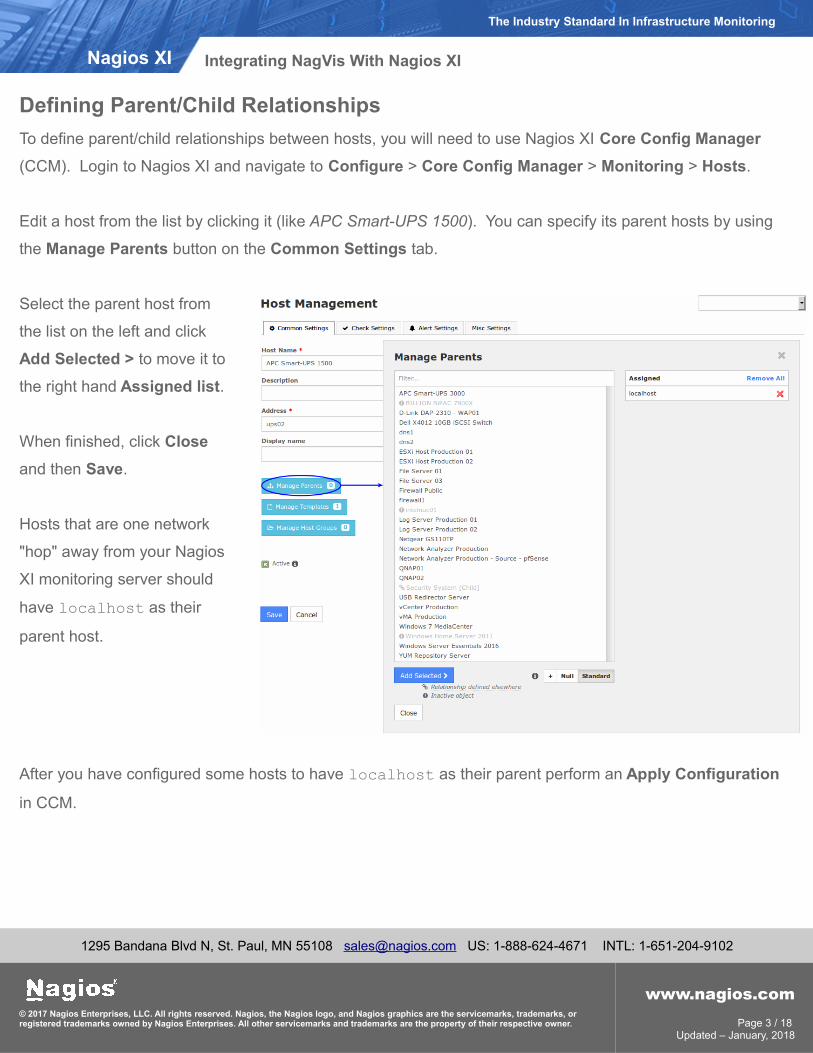
Defining Parent/Child Relationships
To define parent/child relationships between hosts, you will need to use Nagios XI Core Config Manager
(CCM). Login to Nagios XI and navigate to Configure > Core Config Manager > Monitoring > Hosts.
Edit a host from the list by clicking it (like APC Smart-UPS 1500). You can specify its parent hosts by using
the Manage Parents button on the Common Settings tab.
Select the parent host from
the list on the left and click
Add Selected > to move it to
the right hand Assigned list.
When finished, click Close
and then Save.
Hosts that are one network
"hop" away from your Nagios
XI monitoring server should
have localhost as their
parent host.
After you have configured some hosts to have localhost as their parent perform an Apply Configuration
in CCM.
1295 Bandana Blvd N, St. Paul, MN 55108 [email protected] US: 1-888-624-4671 INTL: 1-651-204-9102
© 2017 Nagios Enterprises, LLC. All rights reserved. Nagios, the Nagios logo, and Nagios graphics are the servicemarks, trademarks, or registered trademarks owned by Nagios Enterprises. All other servicemarks and trademarks are the property of their respective owner.
www.nagios.comPage 3 / 18
Updated – January, 2018
Nagios XI
The Industry Standard In Infrastructure Monitoring
Integrating NagVis With Nagios XI

After defining the parent/child relationships they will show up on the NagVis Automap.
Here is a simple example:
You can define multiple levels of parents, which will
result in a more complex map.
In this example you can see that the APC Smart-
UPS 3000 appears to be the center of the map.
ESXi Host Production 01 and ESXi Host
Production 02 are children with further children
hanging off them.
You'll also see that the map appears cluttered and
the objects are too close to each other. To resolve
this you can define the Default Automap
parameters, which is covered in the next section.
It's also worth pointing out that the lines that show the parent/child relationship have an arrow at one end. The
arrow head is pointing to the child object.
1295 Bandana Blvd N, St. Paul, MN 55108 [email protected] US: 1-888-624-4671 INTL: 1-651-204-9102
© 2017 Nagios Enterprises, LLC. All rights reserved. Nagios, the Nagios logo, and Nagios graphics are the servicemarks, trademarks, or registered trademarks owned by Nagios Enterprises. All other servicemarks and trademarks are the property of their respective owner.
www.nagios.comPage 4 / 18
Updated – January, 2018
Nagios XI
The Industry Standard In Infrastructure Monitoring
Integrating NagVis With Nagios XI

Default Automap Options
From the previous screenshot you saw a very cluttered default Automap. This can be resolved by defining the
renderMode in the __automap.cfg file using the default_params= option.
Establish a terminal session to your Nagios XI server as the root user and execute the following command:
vi /usr/local/nagvis/etc/automaps/__automap.cfg
When using the vi editor, to make changes press i on the keyboard first to enter insert mode. Press Esc to
exit insert mode.
At the top of the file is this section:
define global {
alias=Default Automap
iconset=std_small
hover_childs_sort=s
hover_childs_order=asc
label_show=1
label_border=transparent
}
We need to add the line default_params=&renderMode=undirected2 after the label_border line as
follows:
define global {
alias=Default Automap
iconset=std_small
hover_childs_sort=s
1295 Bandana Blvd N, St. Paul, MN 55108 [email protected] US: 1-888-624-4671 INTL: 1-651-204-9102
© 2017 Nagios Enterprises, LLC. All rights reserved. Nagios, the Nagios logo, and Nagios graphics are the servicemarks, trademarks, or registered trademarks owned by Nagios Enterprises. All other servicemarks and trademarks are the property of their respective owner.
www.nagios.comPage 5 / 18
Updated – January, 2018
Nagios XI
The Industry Standard In Infrastructure Monitoring
Integrating NagVis With Nagios XI
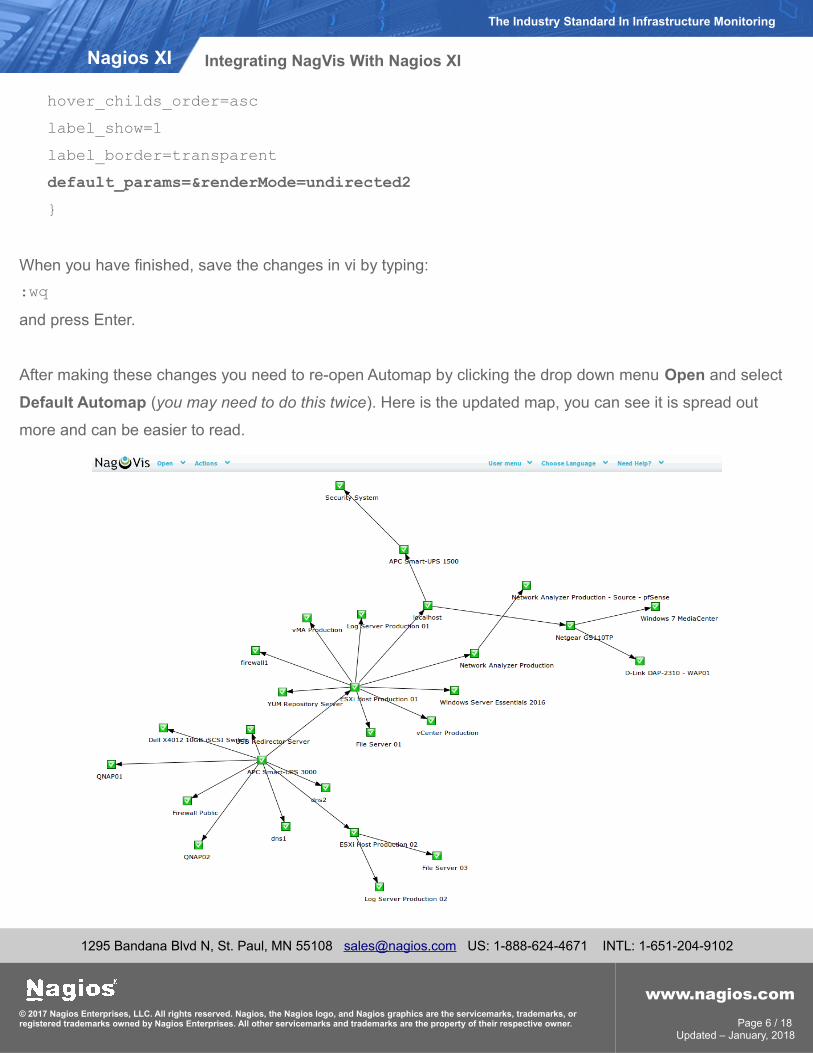
hover_childs_order=asc
label_show=1
label_border=transparent
default_params=&renderMode=undirected2
}
When you have finished, save the changes in vi by typing:
:wq
and press Enter.
After making these changes you need to re-open Automap by clicking the drop down menu Open and select
Default Automap (you may need to do this twice). Here is the updated map, you can see it is spread out
more and can be easier to read.
1295 Bandana Blvd N, St. Paul, MN 55108 [email protected] US: 1-888-624-4671 INTL: 1-651-204-9102
© 2017 Nagios Enterprises, LLC. All rights reserved. Nagios, the Nagios logo, and Nagios graphics are the servicemarks, trademarks, or registered trademarks owned by Nagios Enterprises. All other servicemarks and trademarks are the property of their respective owner.
www.nagios.comPage 6 / 18
Updated – January, 2018
Nagios XI
The Industry Standard In Infrastructure Monitoring
Integrating NagVis With Nagios XI

There are other modes available and are explained in the following documentation:
http://docs.nagvis.org/1.5/en_US/automap.html
It's also worth looking at the following documentation as it explains the default_params= option:
http://docs.nagvis.org/1.5/en_US/automap_config_format.html
Building A Useful Nagios Visualization
Up to now you've seen the automap functionality, but it doesn't scratch the surface of what NagVis can really
do. One of the great features of NagVis is the ability to take a picture and place Nagios XI host and service
objects on the picture to create something that visually represents what is going on.
In my environment I connect to the internet via a firewall and that firewall is connected to a DSL modem. This
example is going to use images of those devices and overlay the Nagios Services that monitor these devices.
In NagVis, an image/picture is called a Shape.
The first step is to click the drop down menu Open and select WUI.
Create A New Map
Click the menu Options and select Manage Maps.
1295 Bandana Blvd N, St. Paul, MN 55108 [email protected] US: 1-888-624-4671 INTL: 1-651-204-9102
© 2017 Nagios Enterprises, LLC. All rights reserved. Nagios, the Nagios logo, and Nagios graphics are the servicemarks, trademarks, or registered trademarks owned by Nagios Enterprises. All other servicemarks and trademarks are the property of their respective owner.
www.nagios.comPage 7 / 18
Updated – January, 2018
Nagios XI
The Industry Standard In Infrastructure Monitoring
Integrating NagVis With Nagios XI
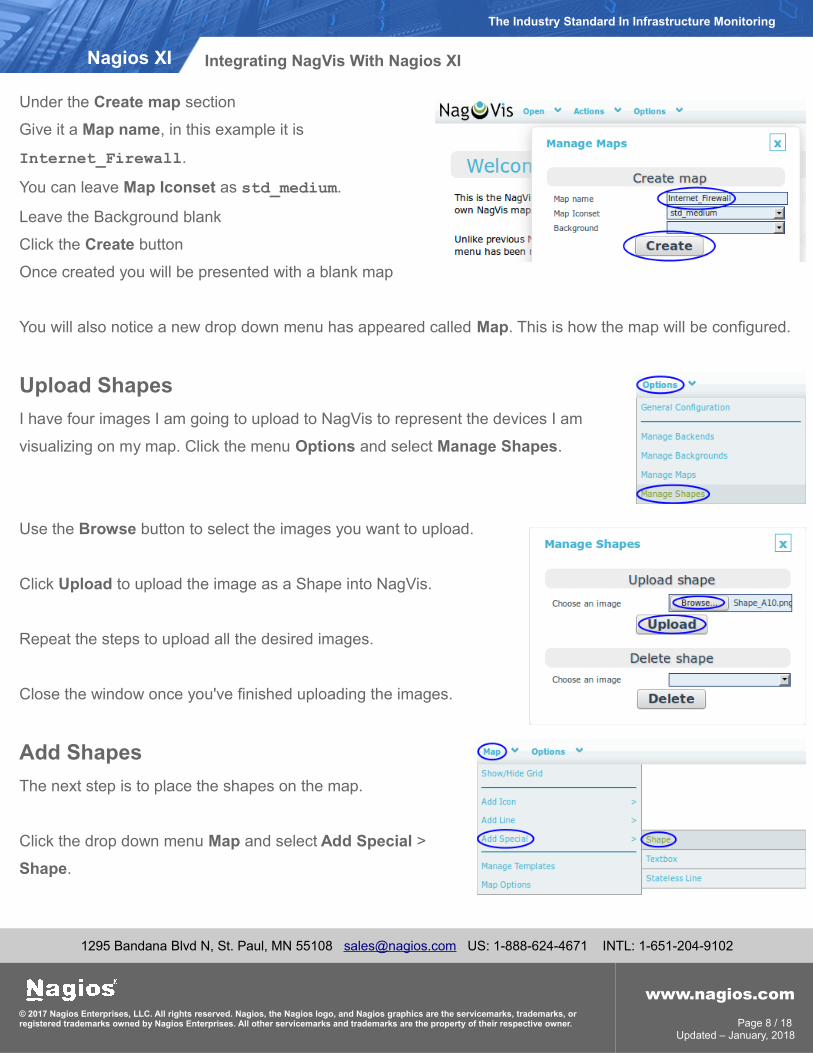
Under the Create map section
Give it a Map name, in this example it is
Internet_Firewall.
You can leave Map Iconset as std_medium.
Leave the Background blank
Click the Create button
Once created you will be presented with a blank map
You will also notice a new drop down menu has appeared called Map. This is how the map will be configured.
Upload Shapes
I have four images I am going to upload to NagVis to represent the devices I am
visualizing on my map. Click the menu Options and select Manage Shapes.
Use the Browse button to select the images you want to upload.
Click Upload to upload the image as a Shape into NagVis.
Repeat the steps to upload all the desired images.
Close the window once you've finished uploading the images.
Add Shapes
The next step is to place the shapes on the map.
Click the drop down menu Map and select Add Special >
Shape.
1295 Bandana Blvd N, St. Paul, MN 55108 [email protected] US: 1-888-624-4671 INTL: 1-651-204-9102
© 2017 Nagios Enterprises, LLC. All rights reserved. Nagios, the Nagios logo, and Nagios graphics are the servicemarks, trademarks, or registered trademarks owned by Nagios Enterprises. All other servicemarks and trademarks are the property of their respective owner.
www.nagios.comPage 8 / 18
Updated – January, 2018
Nagios XI
The Industry Standard In Infrastructure Monitoring
Integrating NagVis With Nagios XI
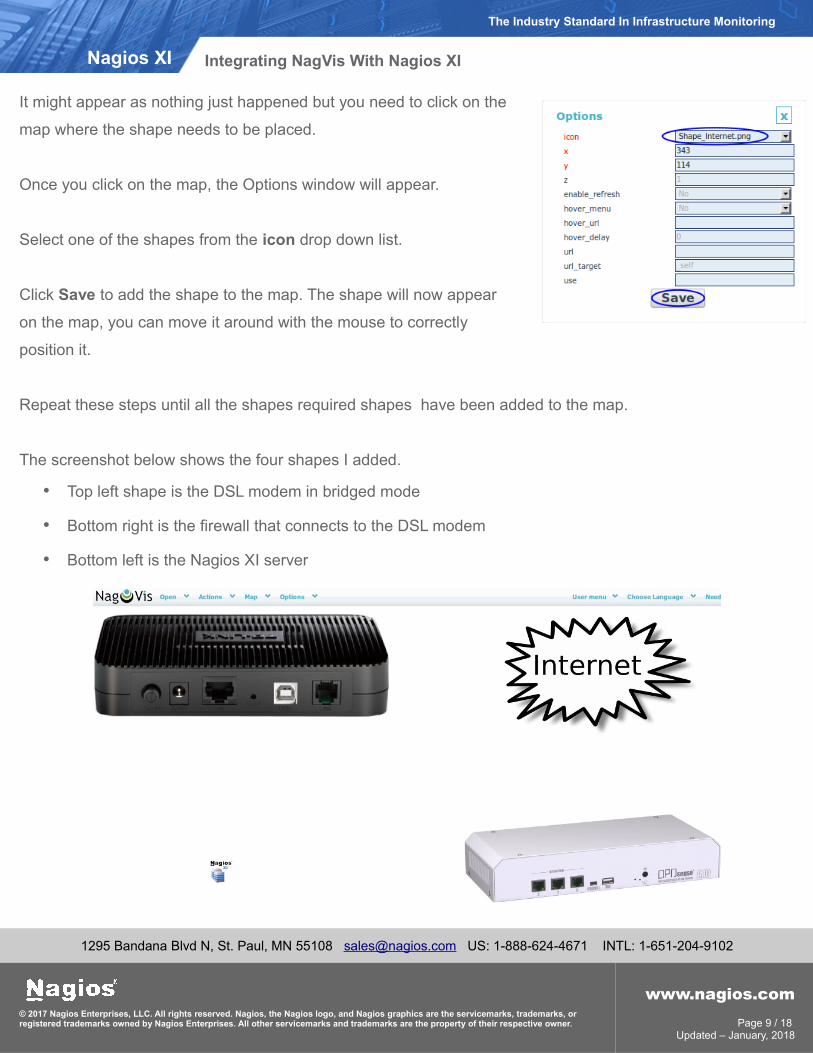
It might appear as nothing just happened but you need to click on the
map where the shape needs to be placed.
Once you click on the map, the Options window will appear.
Select one of the shapes from the icon drop down list.
Click Save to add the shape to the map. The shape will now appear
on the map, you can move it around with the mouse to correctly
position it.
Repeat these steps until all the shapes required shapes have been added to the map.
The screenshot below shows the four shapes I added.
• Top left shape is the DSL modem in bridged mode
• Bottom right is the firewall that connects to the DSL modem
• Bottom left is the Nagios XI server
1295 Bandana Blvd N, St. Paul, MN 55108 [email protected] US: 1-888-624-4671 INTL: 1-651-204-9102
© 2017 Nagios Enterprises, LLC. All rights reserved. Nagios, the Nagios logo, and Nagios graphics are the servicemarks, trademarks, or registered trademarks owned by Nagios Enterprises. All other servicemarks and trademarks are the property of their respective owner.
www.nagios.comPage 9 / 18
Updated – January, 2018
Nagios XI
The Industry Standard In Infrastructure Monitoring
Integrating NagVis With Nagios XI
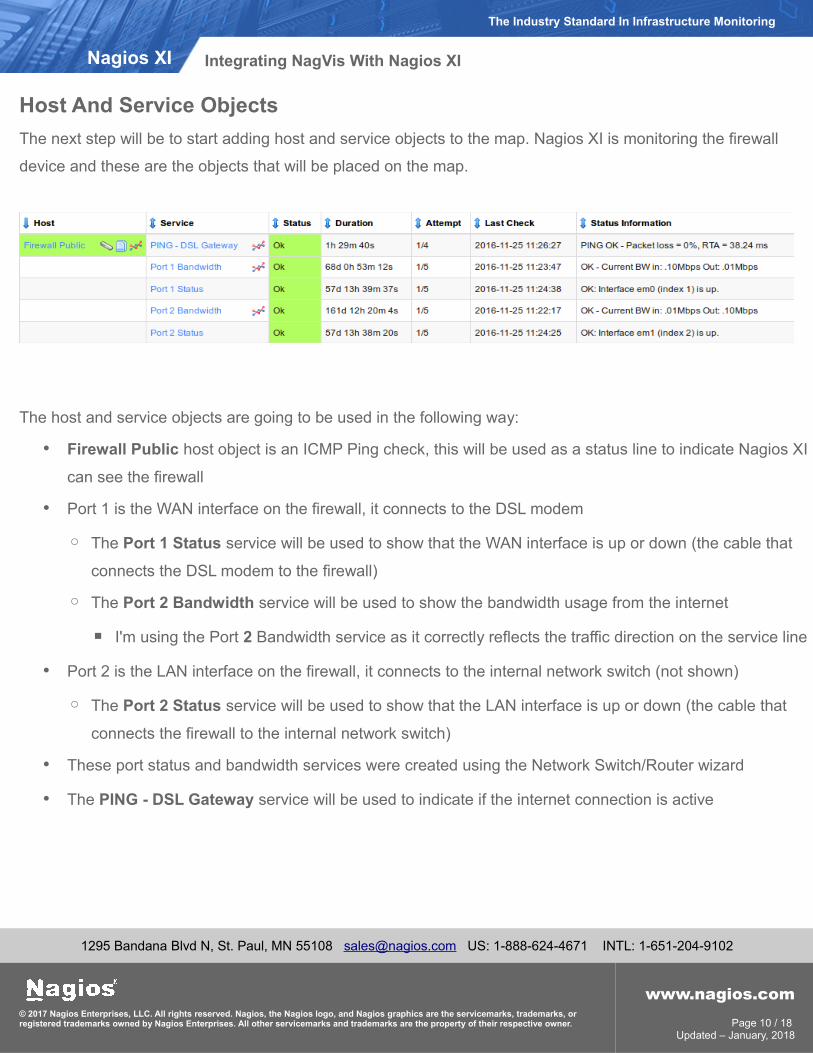
Host And Service Objects
The next step will be to start adding host and service objects to the map. Nagios XI is monitoring the firewall
device and these are the objects that will be placed on the map.
The host and service objects are going to be used in the following way:
• Firewall Public host object is an ICMP Ping check, this will be used as a status line to indicate Nagios XI
can see the firewall
• Port 1 is the WAN interface on the firewall, it connects to the DSL modem
◦ The Port 1 Status service will be used to show that the WAN interface is up or down (the cable that
connects the DSL modem to the firewall)
◦ The Port 2 Bandwidth service will be used to show the bandwidth usage from the internet
▪ I'm using the Port 2 Bandwidth service as it correctly reflects the traffic direction on the service line
• Port 2 is the LAN interface on the firewall, it connects to the internal network switch (not shown)
◦ The Port 2 Status service will be used to show that the LAN interface is up or down (the cable that
connects the firewall to the internal network switch)
• These port status and bandwidth services were created using the Network Switch/Router wizard
• The PING - DSL Gateway service will be used to indicate if the internet connection is active
1295 Bandana Blvd N, St. Paul, MN 55108 [email protected] US: 1-888-624-4671 INTL: 1-651-204-9102
© 2017 Nagios Enterprises, LLC. All rights reserved. Nagios, the Nagios logo, and Nagios graphics are the servicemarks, trademarks, or registered trademarks owned by Nagios Enterprises. All other servicemarks and trademarks are the property of their respective owner.
www.nagios.comPage 10 / 18
Updated – January, 2018
Nagios XI
The Industry Standard In Infrastructure Monitoring
Integrating NagVis With Nagios XI

Add Port Status Icons
The Port Status services will be added to the map on top of
the firewall shape.
Click the drop down menu Map and select Add Icon >
Service.
It might appear as nothing just happened but you need to click on the map where the icon needs to be placed.
I am clicking above the physical WAN port on the firewall shape.
Once you click on the map the Options window will appear.
Select the host from the host_name drop down list.
Select the service from the service_description drop down list.
From the label_show drop down list select Yes.
In the label_text field type WAN Port Status.
In the label_background field type #ffffff.
Click Save to add the icon to the map.
Once the icon has been added to the map, you can move it around with
the mouse to correctly position it.
You can also separately move the label to a desired spot on the map.
1295 Bandana Blvd N, St. Paul, MN 55108 [email protected] US: 1-888-624-4671 INTL: 1-651-204-9102
© 2017 Nagios Enterprises, LLC. All rights reserved. Nagios, the Nagios logo, and Nagios graphics are the servicemarks, trademarks, or registered trademarks owned by Nagios Enterprises. All other servicemarks and trademarks are the property of their respective owner.
www.nagios.comPage 11 / 18
Updated – January, 2018
Nagios XI
The Industry Standard In Infrastructure Monitoring
Integrating NagVis With Nagios XI
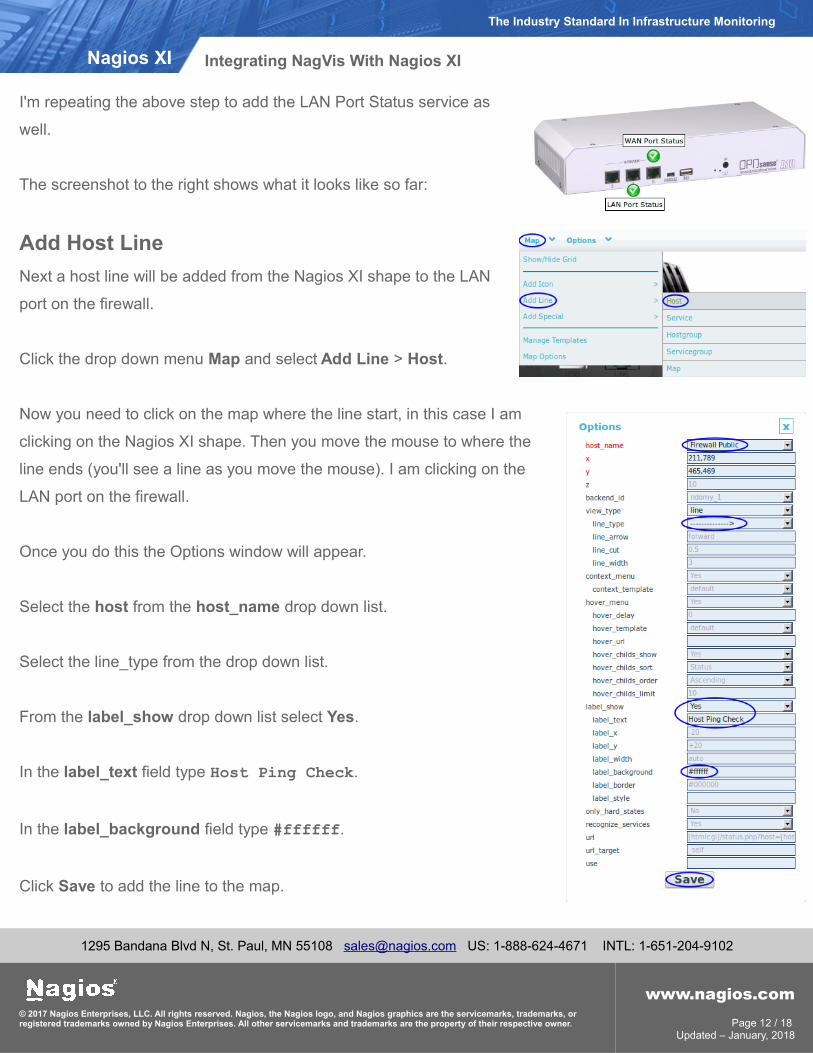
I'm repeating the above step to add the LAN Port Status service as
well.
The screenshot to the right shows what it looks like so far:
Add Host Line
Next a host line will be added from the Nagios XI shape to the LAN
port on the firewall.
Click the drop down menu Map and select Add Line > Host.
Now you need to click on the map where the line start, in this case I am
clicking on the Nagios XI shape. Then you move the mouse to where the
line ends (you'll see a line as you move the mouse). I am clicking on the
LAN port on the firewall.
Once you do this the Options window will appear.
Select the host from the host_name drop down list.
Select the line_type from the drop down list.
From the label_show drop down list select Yes.
In the label_text field type Host Ping Check.
In the label_background field type #ffffff.
Click Save to add the line to the map.
1295 Bandana Blvd N, St. Paul, MN 55108 [email protected] US: 1-888-624-4671 INTL: 1-651-204-9102
© 2017 Nagios Enterprises, LLC. All rights reserved. Nagios, the Nagios logo, and Nagios graphics are the servicemarks, trademarks, or registered trademarks owned by Nagios Enterprises. All other servicemarks and trademarks are the property of their respective owner.
www.nagios.comPage 12 / 18
Updated – January, 2018
Nagios XI
The Industry Standard In Infrastructure Monitoring
Integrating NagVis With Nagios XI

Once the line has been added to the map, it will be shown as a thin line. Note: this is not how it will appear on
the live map, currently you are in edit mode so it does not show all the line styling options.
You can also separately move the label to a desired spot on the map, I've placed it on the line.
The two screenshots below show the difference between edit map (top) and live map (bottom). You can
switch to the live map by click the drop down menu Open and select Internet_Firewall.
You can see the bottom
screenshot has a green line
which is the current status of
the host check.
If the host was to go down
then the line would be red in
color.
Add Service Lines
Next a service line will be added from the WAN port on
the firewall shape to the LAN port on the DSL modem.
The service will be the Port 2 Bandwidth service so it
will represent the internet traffic.
Click the drop down menu Map and select Add Line >
Service.
1295 Bandana Blvd N, St. Paul, MN 55108 [email protected] US: 1-888-624-4671 INTL: 1-651-204-9102
© 2017 Nagios Enterprises, LLC. All rights reserved. Nagios, the Nagios logo, and Nagios graphics are the servicemarks, trademarks, or registered trademarks owned by Nagios Enterprises. All other servicemarks and trademarks are the property of their respective owner.
www.nagios.comPage 13 / 18
Updated – January, 2018
Nagios XI
The Industry Standard In Infrastructure Monitoring
Integrating NagVis With Nagios XI

Now you need to click on the map where the line start, in this case I
am clicking on the WAN port on the firewall shape. Then you move
the mouse to where the line ends (you'll see a line as you move the
mouse), I am clicking on the LAN port on the DSL modem.
Once you do this the Options window will appear.
Select the host from the host_name drop down list.
Select the service from the service_description drop down list.
Select the line_type from the drop down list. --%--><--%-- is
being used as this will display the numbers from the service on the
lines to show the current in/out rate.
From the label_show drop down list select Yes.
In the label_text field type [service_description].
In the label_background field type #ffffff.
Click Save to add the line to the map.
Once the line has been added to the map, it will be shown as a thin line. Note: this is not how it will appear on
the live map, currently you are in edit mode so it does not show all the line styling options.
You can also separately move the label to a desired spot on the map, I've placed it on the line.
1295 Bandana Blvd N, St. Paul, MN 55108 [email protected] US: 1-888-624-4671 INTL: 1-651-204-9102
© 2017 Nagios Enterprises, LLC. All rights reserved. Nagios, the Nagios logo, and Nagios graphics are the servicemarks, trademarks, or registered trademarks owned by Nagios Enterprises. All other servicemarks and trademarks are the property of their respective owner.
www.nagios.comPage 14 / 18
Updated – January, 2018
Nagios XI
The Industry Standard In Infrastructure Monitoring
Integrating NagVis With Nagios XI

Here's a screenshot from the view mode showing the service line that was added (black line).
You can see the line has two arrows that meet in the middle and on each part of the line there are the
bandwidth numbers from the current service output. You can see the number on the upper part of the line is
the download from the internet and the number on the lower part of the line is the upload to the internet.
The last service line to add is the PING - DSL Gateway service will be used to indicate that the internet
connection is active.
Click the drop down menu Map and select Add Line > Service.
Now you need to click on the map where the line start, in this case I am clicking on the phone line port on the
DSL modem shape. Then you move the mouse to where the line ends (you'll see a line as you move the
mouse), I am clicking on the Internet shape.
1295 Bandana Blvd N, St. Paul, MN 55108 [email protected] US: 1-888-624-4671 INTL: 1-651-204-9102
© 2017 Nagios Enterprises, LLC. All rights reserved. Nagios, the Nagios logo, and Nagios graphics are the servicemarks, trademarks, or registered trademarks owned by Nagios Enterprises. All other servicemarks and trademarks are the property of their respective owner.
www.nagios.comPage 15 / 18
Updated – January, 2018
Nagios XI
The Industry Standard In Infrastructure Monitoring
Integrating NagVis With Nagios XI
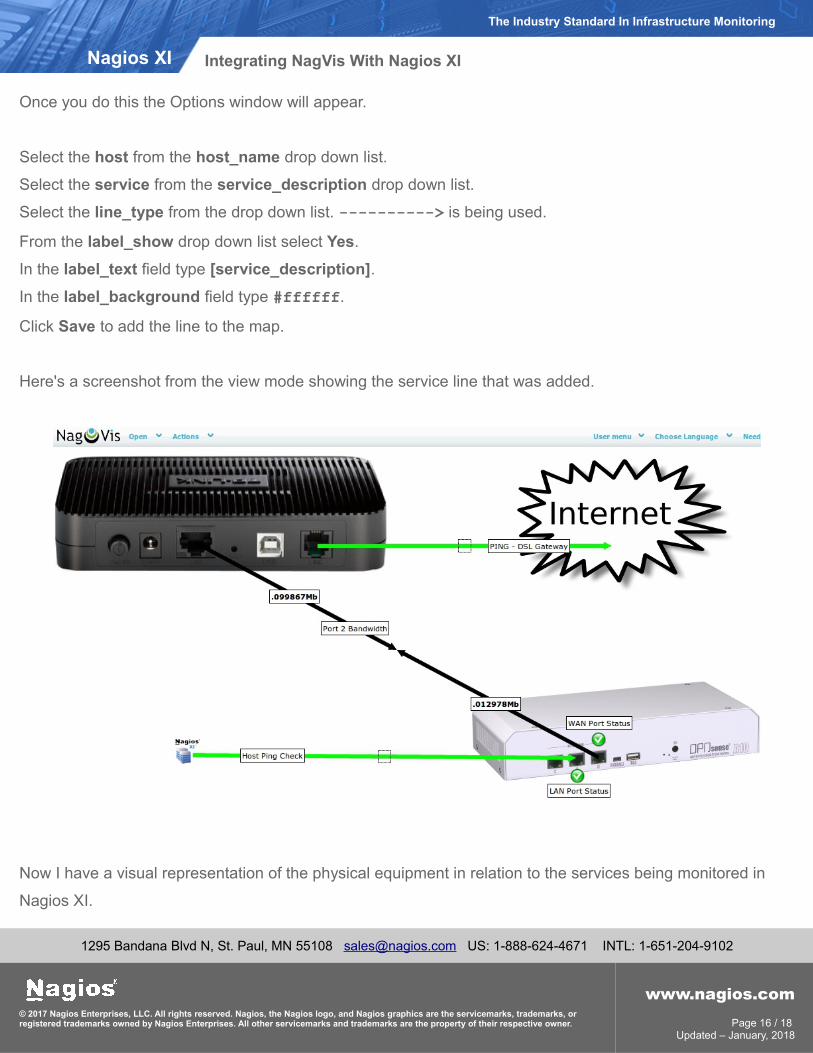
Once you do this the Options window will appear.
Select the host from the host_name drop down list.
Select the service from the service_description drop down list.
Select the line_type from the drop down list. ----------> is being used.
From the label_show drop down list select Yes.
In the label_text field type [service_description].
In the label_background field type #ffffff.
Click Save to add the line to the map.
Here's a screenshot from the view mode showing the service line that was added.
Now I have a visual representation of the physical equipment in relation to the services being monitored in
Nagios XI.
1295 Bandana Blvd N, St. Paul, MN 55108 [email protected] US: 1-888-624-4671 INTL: 1-651-204-9102
© 2017 Nagios Enterprises, LLC. All rights reserved. Nagios, the Nagios logo, and Nagios graphics are the servicemarks, trademarks, or registered trademarks owned by Nagios Enterprises. All other servicemarks and trademarks are the property of their respective owner.
www.nagios.comPage 16 / 18
Updated – January, 2018
Nagios XI
The Industry Standard In Infrastructure Monitoring
Integrating NagVis With Nagios XI

• I can see the port up/down status for the firewall.
• There is a line indicating the in/out bandwidth from the internet.
• There is a line indicating if the internet is active.
• There is a line indicating if Nagios XI can connect to the firewall.
Now to generate an issue so we can see what the map looks like when there is a problem. I'm disconnecting
the cable that connects the WAN port on the firewall to the LAN port on the DSL modem.
The WAN Port Status icon is an X, indicating that the Port Status service is in a critical state.
The Ping - DSL Gateway service line is RED which indicates the service is in a critical state.
1295 Bandana Blvd N, St. Paul, MN 55108 [email protected] US: 1-888-624-4671 INTL: 1-651-204-9102
© 2017 Nagios Enterprises, LLC. All rights reserved. Nagios, the Nagios logo, and Nagios graphics are the servicemarks, trademarks, or registered trademarks owned by Nagios Enterprises. All other servicemarks and trademarks are the property of their respective owner.
www.nagios.comPage 17 / 18
Updated – January, 2018
Nagios XI
The Industry Standard In Infrastructure Monitoring
Integrating NagVis With Nagios XI
The Host Ping Check line is RED, however the LAN Port Status service is green. The reason why the Host
Ping Check line is RED is because the HOST object was used and the host has services in a non-OK state,
which forces it to go into a RED state. To overcome this you could modify the Host Ping Check line and
configure the option recognize_services to No.
You can also hover your mouse over the lines and icons and you will see a summary of the objects. Clicking
on the lines or icons will take you to the Nagios XI Status Detail page for that object.
Finishing Up
This completes the documentation on integrating NagVis with Nagios XI.
If you have additional questions or other support related questions, please visit us at our Nagios Support
Forums:
https://support.nagios.com/forum
The Nagios Support Knowledgebase is also a great support resource:
https://support.nagios.com/kb
1295 Bandana Blvd N, St. Paul, MN 55108 [email protected] US: 1-888-624-4671 INTL: 1-651-204-9102
© 2017 Nagios Enterprises, LLC. All rights reserved. Nagios, the Nagios logo, and Nagios graphics are the servicemarks, trademarks, or registered trademarks owned by Nagios Enterprises. All other servicemarks and trademarks are the property of their respective owner.
www.nagios.comPage 18 / 18
Updated – January, 2018
Nagios XI
The Industry Standard In Infrastructure Monitoring
Integrating NagVis With Nagios XI