Embed Size (px)
Citation preview

1E U R O P E A NC O M M I S S I O N
THEME 1General statistics
Push and pull factors of international
migrationA comparative report
20
00
ED
ITIO
N

A great deal of additional information on the European Union is available on the Internet.It can be accessed through the Europa server (http://europa.eu.int).
Cataloguing data can be found at the end of this publication.
Luxembourg: Office for Official Publications of the European Communities, 2000
ISBN 92-828-9721-4
© European Communities, 2000
Printed in Luxembourg
PRINTED ON WHITE CHLORINE-FREE PAPER
iii
FOREWORD
International migration flows have increased in magnitude and complexity over the pastdecades. As a result, migration and potential migration to, for instance, the European Unionare receiving ever more attention at policy level. Within this context, the Commission of theEuropean Communities entrusted Eurostat, its Statistical Bureau, and the NetherlandsInterdisciplinary Demographic Institute (NIDI) with a project to study the push and pull factorsdetermining international migration flows.
The objective of the study is to improve our understanding of the direct and indirect causesand mechanisms of international migration to the European Union, from an internationallycomparative perspective. The results are intended to serve as a basis for the development ofpolicy instruments and to provide tools for estimating future migration.
The project started in 1994 with the preparation of a study on the ‘state of the art’ in migrationtheory and research, the identification of national and international research institutes active inthis field, and a workshop. Based on the results of this preparatory stage, surveys were setup in a number of countries. The results are being reported on in the present comparativereport, as well as in a series of eight individual country monographs.
The focus of the project is on migration from the Southern and Eastern Mediterranean regionand from Sub-Saharan Africa to the European Union. Within these regions, seven countrieshave been selected for primary data collection on migration. The five predominantly migrant-sending countries participating in the project are - in the Mediterranean region - Turkey,Morocco and Egypt; and - in West Africa - Senegal and Ghana. Three migrant-receivingcountries are included: Italy and Spain on the northern Mediterranean border, and theNetherlands, in western Europe. Analysis for the latter country is based on secondary data.
In each of the countries involved in the project, local research teams were responsible fordata collection and, to a large extent, for data processing and analysis. These country teamsconsist of researchers of local research institutes, and were invited to participate because oftheir extensive knowledge of international migration research, experience with survey datacollection, and the institutional capacity to carry out surveys. In close consultation with therespective country teams and external experts, NIDI developed the research instruments forthe project and provided methodological and technical feedback.
Yves Franchet Prof. Dr. Jenny GierveldDirector-General DirectorEUROSTAT NIDI
v
ACKNOWLEDGEMENTS
Many persons have contributed to the current volume and we gratefully acknowledge theirsupport. In the first place, of course, we thank the members of the country teams participatingin the project, who were of vital importance in all its stages. Their names are included in thelist of teams in Appendix 10.5. One of the joys of working in a project like this is that it bringstogether researchers from many different backgrounds, both scientifically and culturally,providing a fertile soil for ideas and solutions to challenging issues.
Apart from the members of the teams, many others have made important contributions.Richard Bilsborrow (University of North Carolina, USA) was of invaluable help in solvingcomplicated sampling issues. Furthermore, a group of experts from different backgroundscommented upon the draft questionnaires. Their constructive criticism and innovative ideashave contributed much to the questionnaires’ improvement. They were, in alphabetical order:Joaquín Arango (Complutense University and University Institute Ortega y Gasset, Spain),Richard Bilsborrow (University of North Carolina, USA), Francis Dodoo (African Populationand Health Research Centre, Kenya), Sally Findley (Columbia University, USA), MustafaKharoufi (National Council for Youth and the Future, Morocco), Brendan Mullan (MichiganState University, USA) and Klaus Zimmermann (University of Munich, Germany).
We also extend our gratitude to the European Commission which, with foresight,commissioned such a large study extending over a number of years. Much of our thanks, ofcourse, goes to our colleagues at Eurostat, in particular to Bernard Langevin, who instigatedthe project and whose enthusiasm and support were always stimulating; to Luca Ascoli andThana Chrissanthaki for the many times they helped us with useful advice and for sharingtheir well-informed knowledge with us; to Gilles Rambaud-Chanoz, as successor of BernardLangevin, and to Gilles Decand, for their continued and valuable support; and to AntonellaGerard for her cheerful and efficient assistance in administrative matters. Furthermore, w ewish to thank Sandrine Beaujean (CESD-Communautaire), for sharing in the organisation ofthe final Conference that took place in October 1999.
The many valuable and insightful comments made by the discussants during that Conference,where the research teams presented their first results, have helped us to review the presentreport, and provided interesting ideas for future research: Richard Bilsborrow and FrancisDodoo, both of whom were mentioned before, as well as Thomas Faist (University of Bremen,Germany), Ahmet Gökdere (University of Ankara, Turkey), Bachir Hamdouch (National Institutefor Statistics and Applied Economics, Morocco), Graeme Hugo (University of Adelaide,Australia), Dieudonné Ouedraogo (International Development Research Center, Senegal), andCarlota Solé (Autonomous University of Barcelona, Spain),
At NIDI too, we are grateful to our Director, Jenny Gierveld, and the Deputy-Director, Nico vanNimwegen, for their support in completing this large project, and especially to Kène Henkensfor his very effective guidance during the last year of the project. Furthermore, we areindebted to all NIDI-colleagues who have contributed at one stage or another: Frank Eelens forhis work on the lay-out and contents of the questionnaire, Hans van Leusden for advice ondata processing, Marlies Idema and Philippe Oberknezev for research assistance, VeraHolman and Elly Huzen as the projects’ tireless secretaries, and Jacqueline van der Helm andTonny Nieuwstraten for their precise and efficient editorial work.
As this has been a bilingual project, we owe thanks to those who corrected and/or translatedour English and French: Willemien Kneppelhout and Catherine van der Wijst-Pineau, and thetranslators team at Eurostat.

vi
Last but not least, we want to put into the limelight the contribution of all those who are toomany to mention by name: the interviewer teams who carried out the field work, with suchcommitment; and the many thousands of men and women who were willing to answer ournumerous questions on their lives, hopes, and experiences.
Jeannette SchoorlLiesbeth HeeringIngrid EsveldtGeorge GroenewoldRob van der ErfAlinda BoschHelga de ValkBart de Bruijn

Push and pull factors of international migration: a comparative report
vii
TABLE OF CONTENTS
FOREWORD............................................................................................................................III
ACKNOWLEDGEMENTS .......................................................................................................V
TABLE OF CONTENTS.........................................................................................................VII
LIST OF TABLES.....................................................................................................................IX
LIST OF FIGURES..................................................................................................................XI
SUMMARY AND CONCLUSIONS......................................................................................XIII
1. INTRODUCTION ............................................................................................................11.1 Introduction...............................................................................................................11.2 Contents of report....................................................................................................2
2. THEORETICAL APPROACHES IN MIGRATION RESEARCH................................32.1 Existing theoretical approaches...............................................................................32.2 Implications for data collection .................................................................................72.3 Surveys of international migration..........................................................................10
3. STUDY DESIGN .......................................................................................................... 133.1 Research design....................................................................................................13
3.1.1 Key concepts.................................................................................................153.2 Questionnaire design .............................................................................................17
3.2.1 Micro-level ....................................................................................................173.2.2 Macro-level ...................................................................................................21
3.3 Sample designs......................................................................................................223.4 Data processing.....................................................................................................243.5 Conclusions: some strengths and limitations .........................................................26
4. CHARACTERISTICS OF THE SURVEY COUNTRIES.......................................... 294.1 Introduction.............................................................................................................294.2 Italy.........................................................................................................................294.3 Spain ......................................................................................................................344.4 Turkey ....................................................................................................................384.5 Morocco .................................................................................................................434.6 Egypt ......................................................................................................................464.7 Ghana.....................................................................................................................494.8 Senegal ..................................................................................................................53
5. RECENT MIGRATION: WHO MOVES AND WHO STAYS..................................... 575.1 Introduction.............................................................................................................575.2 Characteristics of migrant and non-migrant households .......................................57
5.2.1 Regional migration patterns ..........................................................................575.2.2 Demographic characteristics.........................................................................605.2.3 Socio-economic characteristics....................................................................64
5.3 Conclusions............................................................................................................70
6. WHY AND WHERE: MOTIVES AND DESTINATIONS ........................................... 736.1 Introduction.............................................................................................................736.2 Motives for migration..............................................................................................736.3 Countries of destination .........................................................................................776.4 Attractiveness of countries ...................................................................................796.5 Conclusions............................................................................................................83
7. ON THE MOVE: MECHANISMS OF MIGRATION.................................................... 877.1 Introduction.............................................................................................................87

Push and pull factors of international migration: a comparative report
viii
7.2 The role of information ...........................................................................................887.2.1 Information....................................................................................................887.2.2 Information topics..........................................................................................907.2.3 Sources of information ..................................................................................92
7.3 Migration networks.................................................................................................937.4 Admission and migration strategies .......................................................................997.5 Conclusions..........................................................................................................103
8. THE FUTURE OF MIGRATION: INTENTIONS AND POTENTIAL......................1058.1 Introduction...........................................................................................................1058.2 Migration intentions...............................................................................................106
8.2.1 Sending countries .......................................................................................1068.2.2 Receiving countries.....................................................................................110
8.3 Realisation of migration intentions........................................................................1148.3.1 Sending countries .......................................................................................1148.3.2 Receiving countries.....................................................................................119
8.4 Preferred destinations..........................................................................................1198.5 Conclusions..........................................................................................................126
9. REFERENCES ..........................................................................................................130
10. APPENDICES ............................................................................................................13810.1 Country-specific sample designs and their implementation .................................138
10.1.1 Introduction...............................................................................................13810.1.2 Sending countries.....................................................................................13910.1.3 Receiving countries ..................................................................................146
10.2 Database design for comparative analyses ........................................................14910.3 Micro and macro questionnaires..........................................................................15310.4 Concepts and definitions......................................................................................15410.5 Participating research teams................................................................................16010.6 List of country reports .........................................................................................162
Push and pull factors of international migration: a comparative report
ix
LIST OF TABLES
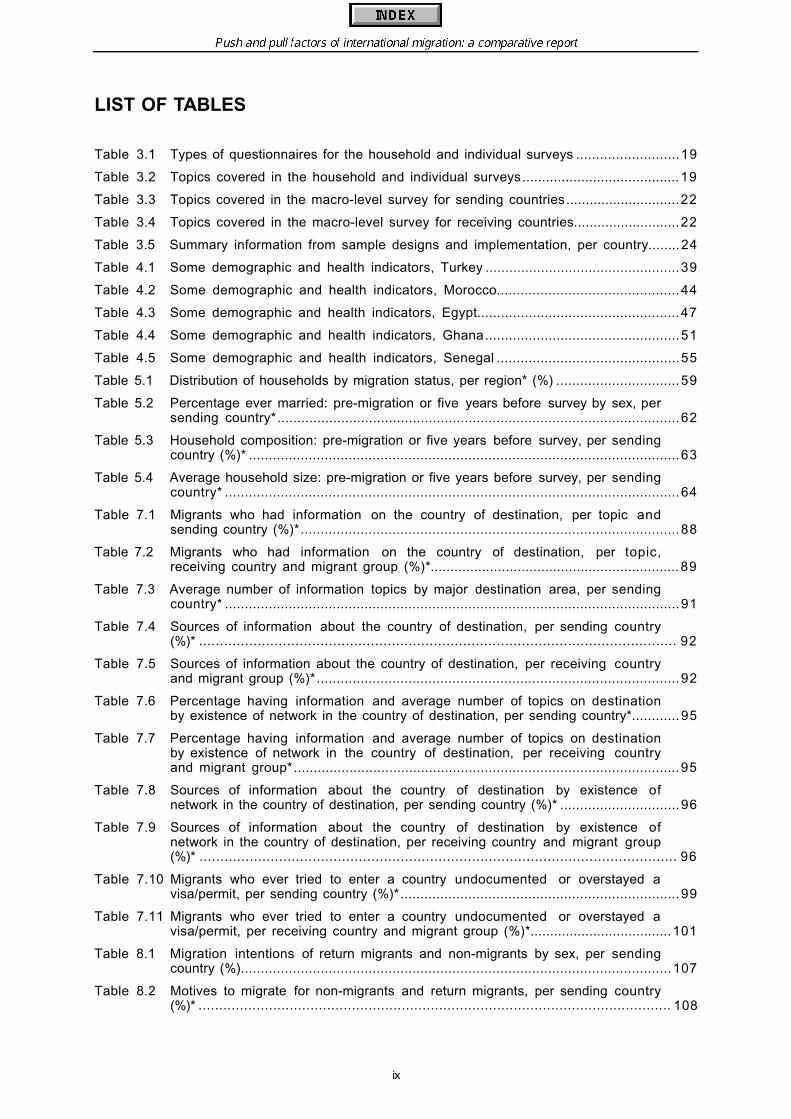
Table 3.1 Types of questionnaires for the household and individual surveys ..........................19
Table 3.2 Topics covered in the household and individual surveys........................................19
Table 3.3 Topics covered in the macro-level survey for sending countries.............................22
Table 3.4 Topics covered in the macro-level survey for receiving countries...........................22
Table 3.5 Summary information from sample designs and implementation, per country........24
Table 4.1 Some demographic and health indicators, Turkey .................................................39
Table 4.2 Some demographic and health indicators, Morocco..............................................44
Table 4.3 Some demographic and health indicators, Egypt...................................................47
Table 4.4 Some demographic and health indicators, Ghana.................................................51
Table 4.5 Some demographic and health indicators, Senegal ..............................................55
Table 5.1 Distribution of households by migration status, per region* (%) ...............................59
Table 5.2 Percentage ever married: pre-migration or five years before survey by sex, persending country*.....................................................................................................62
Table 5.3 Household composition: pre-migration or five years before survey, per sendingcountry (%)* ............................................................................................................63
Table 5.4 Average household size: pre-migration or five years before survey, per sendingcountry* ..................................................................................................................64
Table 7.1 Migrants who had information on the country of destination, per topic andsending country (%)*...............................................................................................88
Table 7.2 Migrants who had information on the country of destination, per topic,receiving country and migrant group (%)*...............................................................89
Table 7.3 Average number of information topics by major destination area, per sendingcountry* ..................................................................................................................91
Table 7.4 Sources of information about the country of destination, per sending country(%)* 92
Table 7.5 Sources of information about the country of destination, per receiving countryand migrant group (%)*...........................................................................................92
Table 7.6 Percentage having information and average number of topics on destinationby existence of network in the country of destination, per sending country*............95
Table 7.7 Percentage having information and average number of topics on destinationby existence of network in the country of destination, per receiving countryand migrant group*.................................................................................................95
Table 7.8 Sources of information about the country of destination by existence ofnetwork in the country of destination, per sending country (%)* ..............................96
Table 7.9 Sources of information about the country of destination by existence ofnetwork in the country of destination, per receiving country and migrant group(%)* 96
Table 7.10 Migrants who ever tried to enter a country undocumented or overstayed avisa/permit, per sending country (%)*......................................................................99
Table 7.11 Migrants who ever tried to enter a country undocumented or overstayed avisa/permit, per receiving country and migrant group (%)*....................................101
Table 8.1 Migration intentions of return migrants and non-migrants by sex, per sendingcountry (%)............................................................................................................107
Table 8.2 Motives to migrate for non-migrants and return migrants, per sending country(%)* 108
..................................................................................................................
..................................................................................................................
..................................................................................................................
Push and pull factors of international migration: a comparative report
x
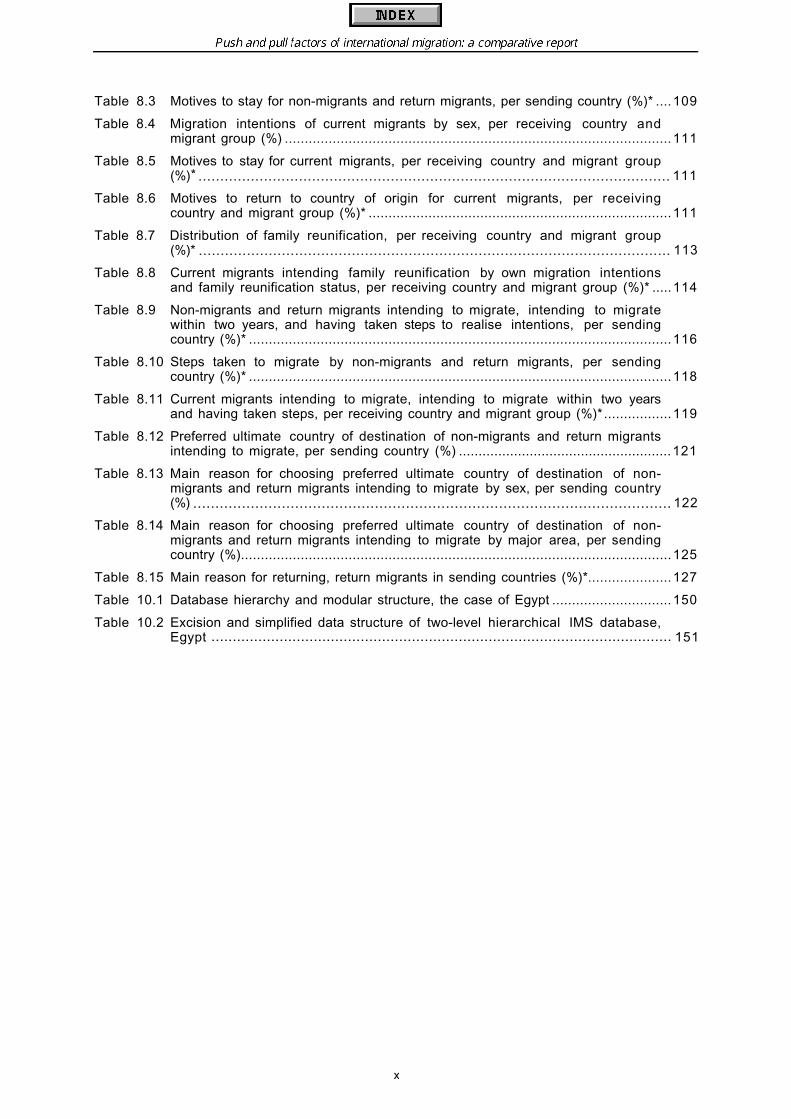
Table 8.3 Motives to stay for non-migrants and return migrants, per sending country (%)* ....109
Table 8.4 Migration intentions of current migrants by sex, per receiving country andmigrant group (%) .................................................................................................111
Table 8.5 Motives to stay for current migrants, per receiving country and migrant group(%) 111
Table 8.6 Motives to return to country of origin for current migrants, per receivingcountry and migrant group (%)* ............................................................................111
Table 8.7 Distribution of family reunification, per receiving country and migrant group(%)* 113
Table 8.8 Current migrants intending family reunification by own migration intentionsand family reunification status, per receiving country and migrant group (%)* .....114
Table 8.9 Non-migrants and return migrants intending to migrate, intending to migratewithin two years, and having taken steps to realise intentions, per sendingcountry (%)* ..........................................................................................................116
Table 8.10 Steps taken to migrate by non-migrants and return migrants, per sendingcountry (%)* ..........................................................................................................118
Table 8.11 Current migrants intending to migrate, intending to migrate within two yearsand having taken steps, per receiving country and migrant group (%)*.................119
Table 8.12 Preferred ultimate country of destination of non-migrants and return migrantsintending to migrate, per sending country (%) ......................................................121
Table 8.13 Main reason for choosing preferred ultimate country of destination of non-migrants and return migrants intending to migrate by sex, per sending country(%) 122
Table 8.14 Main reason for choosing preferred ultimate country of destination of non-migrants and return migrants intending to migrate by major area, per sendingcountry (%)............................................................................................................125
Table 8.15 Main reason for returning, return migrants in sending countries (%)*.....................127
Table 10.1 Database hierarchy and modular structure, the case of Egypt ..............................150
Table 10.2 Excision and simplified data structure of two-level hierarchical IMS database,Egypt 151
............................................................................................................*
............................................................................................................
............................................................................................................
............................................................................................................

Push and pull factors of international migration: a comparative report
xi
LIST OF FIGURES
Figure 4.1 Population change, 1985-1997, Italy .....................................................................29
Figure 4.2 Age distribution on 1 January 1992 and 1998, Italy................................................30
Figure 4.3 Foreign population in Italy, 1 January 1996 ...........................................................31
Figure 4.4 GDP per capita in US dollars, 1997, Italy ...............................................................32
Figure 4.5 Annual growth of real GDP, 1985-1997, Italy (%)....................................................32
Figure 4.6 Percentage unemployed in the labour force, 1997, Italy........................................33
Figure 4.7 Labour force participation by sex and age, 1997, Italy (%).....................................33
Figure 4.8 Population change, 1985-1997, Spain...................................................................34
Figure 4.9 Age distribution on 1 January 1992 and 1998, Spain.............................................35
Figure 4.10 Foreign population in Spain, 1 January 1998.........................................................35
Figure 4.11 GDP per capita in US dollars, 1997, Spain.............................................................36
Figure 4.12 Annual growth of real GDP, 1985-1997, Spain (%).................................................36
Figure 4.13 Percentage unemployed in the labour force, 1997, Spain.....................................37
Figure 4.14 Labour force participation by sex and age, 1997, Spain (%) ..................................37
Figure 4.15 Population change, 1985-1997, Turkey..................................................................38
Figure 4.16 Age distribution on 1 January 1992 and 1998, Turkey............................................39
Figure 4.17 Foreign population in Turkey, 21 October 1990 .....................................................40
Figure 4.18 Annual growth of real GDP, 1985-1997, Turkey (%)................................................41
Figure 4.19 GDP per capita in US dollars, 1997, Turkey............................................................41
Figure 4.20 Percentage unemployed in the labour force, 1997, Turkey....................................42
Figure 4.21 Labour force participation by sex and age, 1997, Turkey (%) .................................42
Figure 4.22 Population change, Morocco.................................................................................43
Figure 4.23 Age distribution on 1 July 1995, Morocco ..............................................................43
Figure 4.24 GDP per capita in US dollars, 1995, Morocco........................................................45
Figure 4.25 Annual growth of real GDP, 1975-1994, Morocco (%) ............................................46
Figure 4.26 Population change, 1990-1996, Egypt ...................................................................46
Figure 4.27 Age distribution in 1986 and 1996 (census dates), Egypt........................................47
Figure 4.28 GDP per capita in US dollars, 1995, Egypt.............................................................49
Figure 4.29 Annual growth of real GDP, 1975-1994, Egypt (%) .................................................49
Figure 4.30 Population change, 1990-1996, Ghana .................................................................50
Figure 4.31 Age distribution in 1998, Ghana.............................................................................50
Figure 4.32 GDP per capita in US dollars, 1995, Ghana ...........................................................52
Figure 4.33 Annual growth of real GDP, 1975-1994, Ghana (%)................................................52
Figure 4.34 Population change, 1990-1996, Senegal...............................................................53
Figure 4.35 Age distribution on 20 November 1991, Senegal ...................................................54
Figure 4.36 Annual growth of real GDP, 1995, Senegal (%)......................................................55
Figure 4.37 GDP per capita in US dollars, 1975-1994, Senegal................................................56
Figure 5.1 Sex and age distribution: pre-migration or five years before survey, per sendingcountry (‰)*............................................................................................................61

Push and pull factors of international migration: a comparative report
xii
Figure 5.2 Educational level: pre-migration or five years before survey, per sendingcountry (%)* ............................................................................................................65
Figure 5.3 Economic activity or employment status: pre-migration or five years beforesurvey, per sending country (%)* .............................................................................67
Figure 5.4 Adequacy of financial situation of household: pre-migration or five yearsbefore survey, per sending country (%)* ..................................................................69
Figure 6.1 Main reason for last emigration from country of origin by sex, per sendingcountry (%)* ............................................................................................................74
Figure 6.2 Main reason for last emigration by sex, per receiving country and migrantgroup (%)*...............................................................................................................75
Figure 6.3 Main reason for last emigration from country of origin by area of destination,per sending country (%)*.........................................................................................76
Figure 6.4 Main countries of destination, per sending country (%)* .........................................78
Figure 6.5 Main reason for choosing last country of destination by sex, per sendingcountry (%)* ............................................................................................................80
Figure 6.6 Main reason for choosing last country of destination by sex, per receivingcountry and migrant group (%)* ..............................................................................81
Figure 6.7 Main reason for choosing EU or non-EU destination, per sending country (%)*.......82
Figure 7.1 Network before migration to the country of destination by sex, per sendingcountry (%)* ............................................................................................................93
Figure 7.2 Network before migration to the country of destination by sex, per receivingcountry and migrant group (%)* ..............................................................................94
Figure 7.3 Network before migration to the country of destination by area of destination,per sending country (%)*.........................................................................................94
Figure 7.4 Migrants expecting help and migrants who actually received help, persending country (%)*...............................................................................................97
Figure 7.5 Migrants expecting help and migrants who actually received help, perreceiving country and migrant group (%)*...............................................................97
Figure 7.6 Migrants followed by family or friends from the country of origin by area ofdestination, per sending country (%)*......................................................................98
Figure 7.7 Migrants followed by family or friends from the country of origin, per receivingcountry and migrant group (%)* ..............................................................................98
Figure 7.8 Percentage having a network of those who entered the current or last countryof destination with or without the required papers, per sending country*...............102
Figure 7.9 Percentage having a network of those who entered the current or last countryof destination with or without the required papers, per receiving country andmigrant group*......................................................................................................103
Figure 8.1 Main reason for choosing preferred ultimate country of destination of non-migrants and return migrants intending to migrate by sex, per sending country(%) 123
Figure 8.2 Main reason for choosing preferred ultimate country of destination of non-migrants and return migrants intending to migrate by major area, per sendingcountry (%)............................................................................................................124
............................................................................................................
Push and pull factors of international migration: a comparative report
xiii
SUMMARY AND CONCLUSIONS
Project backgroundInternational migration flows have increased in magnitude and complexity over the pastdecades. As a result, migration and potential migration to, for instance, the European Unionare receiving ever more attention at policy level. Within this context, the Commission of theEuropean Communities entrusted Eurostat, its statistical Bureau, and the NetherlandsInterdisciplinary Demographic Institute (NIDI) with a project to study the push and pull factorsdetermining international migration flows. The objective of the project, of which the firstresults are presented in this comparative report and in a series of eight country reports, is toimprove our understanding of the direct and indirect causes and mechanisms of internationalmigration to the European Union, from an internationally comparative perspective. The resultsare intended to serve as a basis for the development of policy instruments and to providetools for estimating future migration.
The focus of the project is on migration from the Southern and Eastern Mediterranean regionand from Sub-Saharan Africa to the European Union. Within these regions a number ofcountries have been selected for primary data collection on migration. The five predominantlymigrant-sending countries participating in the project are - in the Mediterranean region -Turkey, Morocco and Egypt; and - in West Africa - Senegal and Ghana. With respect toprimary data collection in predominantly immigrant-receiving countries, two countries in theMediterranean region - Italy and Spain - were selected, primarily because of the limitedavailability of migration data in these countries and because of the fairly recent presence ofsizeable immigrant populations. In addition, the Netherlands has been included in the project,based on an analysis of secondary data. In Spain, migrants from Morocco and Senegal werestudied, in Italy, migrants from Ghana and Egypt, and in the Netherlands, migrants from Turkeyand Morocco.
In each of the countries involved in the project, local research teams were responsible fordata collection and, to a large extent, for data processing and analysis. These country teamsconsist of researchers of local research institutes, and were invited to participate because oftheir extensive knowledge of international migration research, experience with survey datacollection, and their institutional capacity to carry out surveys. In close consultation with therespective country teams and external experts, NIDI developed the research instruments forthe project and provided methodological and technical feedback.
Study designFor an explanation of the process of migration (rather than for the measurement of migrationflows), specialised migration surveys are the most appropriate method of data collection. Asfrom a theoretical point of view, the aim was to capture both individual, household, andcontextual factors that influence people’s decisions to move or stay, the project includes botha single-round micro-level survey (household and individual data for migrants and non-migrants) and a macro-level survey (contextual data at the national, regional, and local orcommunity levels) in each of the selected sending and receiving countries.
The incorporation of non-migrants is an essential and self-evident necessity in order toexplain the determinants of migration, and to enhance our understanding of why the majorityof people do not migrate. The surveys carried out in the sending countries therefore includeda comparison group of non-migrant households. As the project’s main interest lies withdeterminants rather than consequences of migration, non-migrant households were notincluded in the surveys carried out in the countries of destination.
Push and pull factors of international migration: a comparative report
xiv
A number of crucial concepts and definitions were adopted for the purpose of this study. Theusual concept of household was extended to include not only those persons who livetogether and have communal arrangements concerning subsistence and other necessities oflife, but also those who currently reside elsewhere but whose principal commitments andobligations are to that household and who are expected to return to that household in thefuture or whose family will join them in the future. Therefore, both the household and theshadow household are captured within the definition, a necessary extension for migrationstudies.
Migration is defined as a move from one place in order to go and live in another place for acontinuous period of at least one year. The line has been drawn at one year to allow forcomparison with international recommendations, as well as to exclude seasonal migrationacross international borders. There is a further distinction between recent and non-recent(international) migrants. Recent migrants are those who have migrated from the country oforigin at least once within a period of ten years preceding the survey. Consequently, a non-recent migrant is someone who has migrated from his/her country of origin at least once, butnot within the past ten years. Another distinction is that between current and return(international) migrants. Current migrants are those who migrated from their country of originand actually live abroad at the time of the interview. Return migrants have lived abroad for acontinuous period of at least one year, but have returned to their country of origin, wherethey live at the time of the interview. A non-migrant within the context of this study is a non-international migrant.
Households, too, are divided into recent migrant households, non-recent migrant households,and non-migrant households. A recent migrant household is defined as a household in whichat least one member - who is still considered a member of that household - has moved fromthe country of origin during the past ten years, and has since returned after having livedabroad for a continuous period of at least one year, or who is currently living abroad and leftthe country of origin at least three months ago. A non-recent migrant household then is ahousehold in which all moves (to live abroad) from the survey country of those persons whoare still members of the household took place more than ten years ago. Finally, a non-migranthousehold is a household from which no member has ever left the survey country to liveabroad for a period of at least one year or of which no member has currently been livingabroad for at least three months.
In principle, any recent migrant, whether return or current, qualified for interviewing about hisor her migration experience. However, in order to restrict the number of potential respondentswho would be presented with a long individual questionnaire (and therefore reducing theinterview burden on households) and in order to avoid getting duplicate answers, and/oranswers that may refer to different households in the past, only one recent migrant in anyhousehold was selected for a long interview. This migrant was named the main migrationactor, or MMA.
In the sending countries, in principle four regions were purposively selected, based on acombination of criteria related to development and migration history. The focus was on thesampling of migrants to any international destination as well as non-migrants, and in each ofthe four types of regions that were deduced from these criteria, independent multistagestratified disproportionate probability sampling took place to sample this target population forthe survey. The statistical aim was to generate survey data that are representative at thelevel of these regions. In the receiving countries the aforementioned regionalisation was notexplicitly taken into account into the sample designs. In fact, the a priori objective was togenerate survey results that were representative at the level of the country as a whole.Moreover, the focus in receiving countries was on the sampling of immigrants from twoparticular immigrant groups. Immigrants that originate from other countries as well as nativeswere excluded.

Push and pull factors of international migration: a comparative report
xv
In the sending countries, the number of households interviewed was between 1,550 and1,950, while in the receiving countries 500-670 households were interviewed per immigrantgroup. Overall, sample designs and sample allocation procedures in the countries aimed toensure that sufficient numbers of the migrant population were sampled in an efficient andcost-effective manner.
Main conclusionsGiven the complexity of the process of international migration and the multitude of factorscontributing to it, as well as the varying policy goals of sending and receiving authorities,potential policy responses to migration may vary greatly. For instance, policies may be gearedto preventing immigration except for types of movement covered by international treaties,such as those concerning family reunification and political asylum. Or, in response tochanging labour market conditions and the consequences of ageing populations, policies maybe geared to attracting certain types of labour migration, while aiming to prevent illegalmigration. The booming economies in a number of European countries are beginning to showevidence for this, even in the face of persisting unemployment. In practice, it proves hard tocontrol immigration to the extent that only ‘wanted’ migrants enter countries of destination, andthat they only stay for certain periods of time. For, from the migrants’ point of view, aiming toimprove the conditions of life for themselves and for their families, is a powerful motivation formigration, the more so if conditions at home are poor and offer little or no opportunities forimprovement.
Apart from the – at times contradictory - benefits of migration for the countries of destinationand for the individual migrants and their families, migration also has an impact on the societiesof origin. Migration may be considered a tool for development, through remittances, andthrough investment of human capital by returning migrants. On the other hand, migration maydrain the countries of origin of valuable human resources, especially if too many of those withthe highest level of education, the best skills, and the most initiative leave the country. Incountries characterised by a true ‘culture of migration’ combined with poverty and the senseof there being a lack of individual opportunities for improvement of living conditions, energiesnormally geared towards economic enterprise in the home country are channelled into findingopportunities for migration instead.
Far from being able to answer such complicated questions on migration control and on the linkwith development in a report presenting first results, we have made some attempts here.Future research on the extensive data sets collected is planned to study many of the issuesin much greater detail. Nevertheless, policy responses always remain a matter of choice,research being a major tool to pave the way for well-informed policies and to estimate thepotential effects of measures proposed.
Migration versus non-migrationHow many people are international migrants, at some point in their lives? Are most householdsaffected by migration of one or more household members? Or is, despite the increasedimportance of migration, an overwhelming majority of a country’s population non-mobile, livingin their country of birth all their lives? From the surveys carried out in relatively high-mobilityregions in five emigration countries, we can clearly conclude that international migrationaffects a sizeable percentage of households in those regions. In 16 of the 19 regions studiedin five countries, at least one in five households has a household member who migratedabroad within the past ten years. Only in three of the four Turkish regions was recentmigration less common. Nevertheless, households without any international migrant in theirmidst, whether in the past ten years or longer ago, form a clear majority (60 per cent or more)in most regions. But in Tiznit and Nador (Morocco), rural upper and rural lower Egypt, andTouba (Senegal), migration has affected one in two households, or more. In Morocco,migration has become an all-pervasive phenomenon. Among those who have not yetmigrated, many say they intend to.

Push and pull factors of international migration: a comparative report
xvi
Obviously, lower-mobility regions in the same countries are likely to have fewer migranthouseholds, resulting in lower overall importance of international migration for each countryas a whole.
Irrespective of their country of origin, international migrants have a number of characteristicsin common: most are men who migrated when they were in their twenties or thirties. Only inGhana is there a relatively large representation of female migrants. Furthermore, connectedwith the young age structure of migration, migrants are more often single than non-migrantsare, and more often lived at their parent’s home, especially in Morocco, Egypt and Senegal.Only in Ghana is living alone a common alternative, but this is a rare and socially not fullyaccepted household arrangement in the four other, Muslim, countries included in the study.Female migrants are more likely to be married at migration than men, influenced by the fact thatwomen’s migration is frequently related to family reunification. Migration of unaccompanied orsingle women is unusual in the four Muslim countries. Family reunification has occurredespecially in the cases of Turkish and Moroccan migration, although this does not show upvery prominently in the surveys given the fact that family reunification tends to result in thecomplete disappearance of the household from the country of origin. Migration of completehouseholds is less important in Senegal and Egypt. The traditional countries of destination ofEgyptian migrants have far more restrictive policies on family reunification than the Europeancountries do, and this explains at least partly why wives and children stay behind. The sameapplies to Senegalese migration in so far as it is migration to new destinations; furthermore,the polygamous family structure has probably both facilitated and necessitated arrangementswhere wives and children stay in the home country.
In comparison with western countries of destination, the educational level of most of themigrants is still low. Nevertheless, educational levels have risen, in some countries rapidly. InTurkey, Egypt and Ghana migrants are better educated than non-migrants, also aftercontrolling for age differences between the non-migrants and migrants interviewed on thistopic. However, in the Senegalese and Moroccan regions studied, where educational levelsare lowest, both migrants and non-migrants are equally less-educated.
In each of the five countries, the vast majority of migrant and non-migrant men worked prior tomigration or five years prior to the survey, respectively; it is definitely not only the unemployedwho are looking across borders for improvement of their situation. Nevertheless,unemployment, too, seems to be a factor influencing migration: in all countries migrantsreported consistently higher levels of pre-migration unemployment (compared with non-migrants five years prior to the survey). In Morocco a large number of mostly young men(non-students) were not working but were not looking for work either. Apart from the limitedopportunities for finding work, perhaps the pervasive ‘culture of migration’ plays a role, inwhich young people prefer to look for opportunities to migrate, as so many of their friends andrelatives have done, rather than to try to build their future in Morocco.
Another way in which difficult economic conditions were measured was to ask householdsto evaluate their past financial situation: was it sufficient to supply the basic needs for thehousehold? The results point to poverty as an incentive for migration. Although migrants didhave work, it was not sufficient to meet their needs. In Turkey, Egypt and Ghana, migrantsmore often reported that they had considered their financial resources to be insufficient thannon-migrants did. In Senegal, the same applied for the group who considered their financialsituation barely sufficient, but for those in the poorest conditions there were no differencesbetween migrants and non-migrants, which may perhaps be explained by the difficulties verypoor migrants face in financing a trip. Only in Morocco did migrants evaluate their financialsituation more positively than non-migrants, which is unexpected given the fact thatunemployment was relatively high among migrants. Perhaps migrants in this country, althoughunemployed themselves, lived in (their parents’) households that were relatively well off.
Push and pull factors of international migration: a comparative report
xvii
Motives for migration and the choice of a country of destinationThe five sending countries show many similarities both with regard to the motives for leavingthe country of origin and with regard to the motives for choosing a particular country ofdestination. However, important differences exist in the distribution of the emigration flows ofthe respective countries, including the degree of orientation towards destinations in theEuropean Union. The history of each of the countries is reflected in their emigration patterns.Previous colonial bonds continue to have an impact on migration flows long after formalcolonisation has ended. Of course, a common language and well-established networkscontribute to this, also where colonial ties are lacking. Apart from that, historical events suchas the mass recruitment of Turkish and Moroccan workers at the end of the 1960s and thebeginning of the 1970s, still have a strong influence on the continuation of migration flows.Here too, the role of migrant networks should not be underestimated. Other events, such aswar and civil conflict, may suddenly generate mass refugee migration from the countryconcerned and stop immigration flows from other countries. Furthermore, the role of(changing) admission policies and the perception of these policies by (potential) migrants maystrongly influence the distribution patterns of emigration flows. For example, frequentcampaigns to regularise residence of specific categories of undocumented migrants, (as inItaly and Spain) could encourage undocumented migration to these countries. Last but notleast, the geographical situation and distance to other countries should be mentioned as arelevant factor in choosing a country of destination, whether or not in combination with otherfactors.
The general emigration pattern of sending countries - individual migration, primarily involvingmen looking for a job or education, or escaping from persecution, followed gradually over timeby family reunification migration and family formation migration, primarily involving women - isreflected clearly in the research results from the five sending countries. For male migrantseconomic motives dominate while for female migrants family-related reasons are moreimportant. The relevance of other reasons, as a main reason, is often limited; for a small groupof migrants educational opportunities abroad are the reason for migrating. An exception to therule that most female migrants leave for family-related motives can be observed in Ghana:economic motives appear to be more important for Ghanaian women. Probably, the minor roleof Islam in Ghana compared with the other surveyed countries, and the importance attachedto economic independence of women in West African societies, contributes to this. Thestrong male-female contrast in motives for leaving the country of origin (except forGhanaians), is confirmed by the Egyptian migrants who were interviewed in Italy and by theMoroccan and Senegalese migrants who were interviewed in Spain.
Reasons for emigration are fairly independent of the choice for an EU country or for anotherdestination. Family reasons are mentioned more often by Turkish and Moroccan recentmigrants who left for EU countries, while the opposite is true for Senegalese migrants.Furthermore, there are some remarkable differences with regard to the category ‘otherreasons’. Except for Egypt, other reasons (which are mostly related to school/study) morefrequently underlie migration to non-EU countries. This may indicate that EU countriesgenerally attract fewer migrants for educational purposes than other countries do. This is notsurprising given the restrictive admission policies in the European Union, which in practiceleave almost only family reunification of close kin and marriage as options to legally enter(most of) the EU countries.
Emigration from Turkey and Morocco is strongly EU-oriented. However, this does not meanthat Turkish and Moroccan migrants opt for the same EU countries. When looking at the topfive destination countries for recent migrants, Turkey and Morocco have only France and theNetherlands in common. Germany (number one destination for Turks) and Austria (numbertwo) do not attract Moroccans, whereas Italy (number two destination for Moroccans) andSpain (number three) do not attract Turks. Only a minority of Ghanaian and Senegalese recentemigrants are heading for EU countries. The emigration pattern of Ghanaians is clearly mixed,with the USA, Germany, Italy and Nigeria as the top four. This is less true for Senegal: apartfrom a strong orientation on Italy, Senegalese emigrants tend to move to other Africancountries (Gambia, Mauritania and Ivory Coast). In addition, France and Spain play modest
Push and pull factors of international migration: a comparative report
xviii
roles as destinations for recent migrants from the Dakar and Touba regions. Emigration to EUcountries is hardly important among Egyptians; they mainly migrate to Middle Eastern countries(Saudi Arabia, Iraq, Kuwait and Jordan). After the Gulf War, migration to Iraq came to a halt.
Especially in Turkey, Egypt and Ghana, the difference between male and female migrants withrespect to the motivation to leave the country of origin decreases when we consider themotivation to choose a particular destination. For Turkish, Egyptian and Ghanaian men theprevalence of economic factors declines notably in the decision to opt for a specific country,in favour of family motives. The reasons for leaving and for choosing a destination do notdiffer much for male Moroccan and Senegalese migrants. The differences for female migrantsare also insignificant. For Egyptian and Ghanaian migrants in Italy, as well as for Senegalesemigrants in Spain, the main reasons for choosing that country of destination hardly divergefrom the reasons for choosing a country of destination given in the respective countries oforigin. Notably different results can only be observed for Moroccans interviewed in Spain: forMoroccan women in Spain, choosing Spain was more often determined by economic motivesthan would be expected on the basis of the answers that were given in the Moroccansurvey, while the opposite is true for Moroccan men. This may indicate a special position ofSpain compared with other destinations of Moroccans, both geographically (Spain is thenearest EU country to Morocco) and mentally (Moroccans consider Spain to be relatively easyto enter, even without the required documents).
There are clear differences in motivation for choosing EU countries and for choosing othercountries among Turkish migrants: family motives determine two out of every three moves tothe EU against one out of every four moves to other countries. Economic reasons appear tobe more important in opting for non-EU countries. Other reasons for moving to the EU arehardly mentioned. Other reasons for moving to destinations outside the EU often relate toeducational opportunities and easy admission. This conclusion mirrors the history of Turkishmigration to the EU against the background of changed admission policies, starting with labourmigration towards the end of the 1960s and early 1970s, and followed by family reunificationand family formation in the years since. Although a similar conclusion would be expected withregard to Moroccan migration towards the EU, the survey yields diverging results in the sensethat economic reasons remain predominant among recent migrants who chose to migrate to aparticular EU country in the past ten years. This might indicate that given their perception ofthe socio-economic situation in the county of origin, Moroccan recent migrants, much moreoften than Turkish ones, primarily motivate their choice on economic grounds, even when theyhave actually entered a country on family grounds. The less favourable economic conditionsin Morocco compared with Turkey may have contributed to this.
The motivation of Ghanaians to choose a specific country of destination is not substantiallyinfluenced by the distinction between EU and non-EU. The orientation of Ghanaian emigrationtowards ‘western’ non-EU countries (USA) may explain this. For Senegalese, economicreasons for choosing a specific country of destination are important for three out of everyfour moves to the EU against one in two moves to other countries. Family reasons are moreimportant when it comes to emigration to non-EU countries (mostly other African countries).
Networks, information and undocumented migrationThe majority of recent migrant MMAs, irrespective of their country of origin, have someinformation on the country of destination before they migrate. The Senegalese in Spain formthe only exception to this ‘rule’. But even among them, almost one in two had at least someinformation prior to migration. The topics the respondents from distinct migrant groups hadinformation on differ clearly. In general, most is known on economic topics, especially amongmale migrants. Surprisingly few migrants professed to know anything on admissionregulations. Because of the changes in the admission rules in the EU countries (in generalbecoming more strict) and because of the long migration histories of some migrant groups,one would expect migrants to know more on the admission regulations. Perhaps it is notknowledge of the regulations themselves that is important but, given the overwhelmingimpression of limited legal admission options to ‘Fortress Europe’, knowledge on how to gainaccess regardless of the rules.
Push and pull factors of international migration: a comparative report
xix
Male migrants have information on more topics than female migrants. This conclusion holds forall migrant groups except for the Turks, and for the Egyptians in Italy. There is no informationdifference between Egyptian men and women in Italy. Only among the Turks (as studied in theTurkish survey), did women appear to be better informed. Among Turks in the Netherlands,however, as in the other countries, men were found to be better informed. Perhaps thiscontradictory finding on the Turks is related to the migration history of Turks in theNetherlands, and/or to the fact that a different questionnaire was used in the Dutch studywhich was, moreover, carried out a few years earlier than the other surveys.
Although in general women are less informed prior to migration, they do more often have anetwork of family, other relatives and/or friends in the country of destination. But the size ofthese networks is smaller than those of men. These results are not surprising and are clearlylinked with the different migration motives for men and women. Women tend to migratepredominantly in order to join parents or (future) partners whereas men mainly have economicreasons.
Family (and to a somewhat lesser extent friends) are of major importance as a source ofinformation for migrants. Indeed, agencies in the countries of origin and destination are hardlymentioned at all as a source from which migrants get information about their prospectivedestinations. The limited use of agencies as transmitters of information may also have beenaffected by their actual presence or absence in a country and, if present, by the type ofinformation these agencies are able to provide. Results from previous studies generallyindicate that migrants with a higher socio-economic status are more inclined than low-statusmigrants to use other sources, such as the media, in addition to relatives and friends.
Both legal and illegal migrants head for the same countries of destination. For example, thedestinations of undocumented Moroccans and Turks, just like the legal migrants from thesecountries, are mainly the EU countries. It is also evident that documented migrants havenetworks just as often as undocumented migrants do. The frequency with which migrantsresort to undocumented entry or stay differs significantly between the migrant groups. Thesurveys carried out in the sending countries indicate that Turks are most free in admitting thatthey have ever tried to enter a country illegally or that they have overstayed their visas (morethan one in five). Figures for Moroccans and Ghanaians are lower (one in ten), unlessrefusals to answer are included. In that case, they reach levels comparable to the Turkishfigures. The surveys in Italy and Spain show higher proportions of migrants who ever tried toenter or overstay without the proper papers (although not necessarily in Spain or Italy):between 22 and 32 per cent in Italy and between 37 and 51 per cent in Spain, not countingthose who refused to answer. These results are somewhat surprising given the fact thatundocumented migration is such a sensitive topic to discuss, and that respondents had beenexpected to be reluctant to answer, or give safe or socially desirable answers.
Among those who report illegal entry or overstay, the proportion reporting to have beensuccessful in their attempts is high, two thirds or more. Obviously, success rates are highestamong those in the receiving countries (as those caught and sent back are not surveyed).

Push and pull factors of international migration: a comparative report
xx
Migration intentions and potentialMost non-migrants and returnees in the migrant-sending countries do not intend to migrateabroad (again) at any time in the future. In so far as their intentions to stay at home aremotivated by economic reasons, they fall into two opposite categories: either they have noeconomic need to migrate or, for a smaller group, they lack the financial means to go abroad.In that sense, the general idea is confirmed that a certain threshold of wealth is required formigration to take place. In addition, and not surprisingly, non-mobility is strongly motivated byfamily ties and, for older people, by their advanced age.
Nevertheless, in some of the sending countries, especially Ghana and Senegal, migrationintentions are quite pronounced. As many as about 40 per cent of the Ghanaians andSenegalese interviewed said they intend to migrate, and also among the Turks (27 per cent)and the Moroccans (20 per cent) the figures are significant. Egyptians seem least inclined tomigrate, with only 14 per cent expressing future migration intentions. Men more than women,and those with migration experience more than those without, express their intention tomigrate. And, as among actual migrants, those intending to migrate tend to be young andsingle. The intention to migrate is overwhelmingly motivated by economic reasons. As a mainmotive, family-related reasons or other reasons, such as pursuing an education, arementioned much less frequently.
In the receiving countries Spain and Italy, both staying and returning are popular options,although quite a large number of migrants profess they do not know yet. In any case, veryfew want to migrate on to a third country. Generally, 30 per cent of the migrants currently inSpain or Italy intend to return, with the exception of Moroccans among whom the intention toreturn is half that. But very few plan their return within the near future, that is, within the nexttwo years. The intention to stay is motivated by the relatively secure positions migrants haveobtained, or by the fact that the goals set have not (yet) been reached. In some casesmigrants say they are prevented from going home because of a lack of financial resources.Economic pull factors, especially the intention to start a business, family-related reasons(such as joining the family, or problems with the children), or dissatisfaction with life in thecountry of destination are all important factors motivating return.
But, judging from evidence regarding the reasons for returning among those who havealready returned, migrants intending to return to the country of origin may well underestimatethe risk that they are more or less forced to return, and overestimate their chances of beingable to start a business in the country of origin. Family ties are a relevant factor for return butin practice seem less important than they are in the minds of those who intend to return.
Although the intention to migrate is strong in some countries (but keeping in mind that themajority of people have no intention to migrate abroad), intentions appear to be difficult torealise. While general migration intentions vary between 14 per cent (Egypt) and 42 per cent(Ghana), in fact far fewer people consider that they will actually migrate within the next twoyears. The percentage who intend to do so is generally below 5 per cent, with the exceptionof Ghana (14 per cent). Asked whether they have actually taken any steps to prepare formigration, the percentages drop even further. And rarely do such preparations include theapplication and/or acquisition of visas and or residence/work permits.
In general, it can be said that the ultimate preferred country of destination for non-migrantsand return migrants intending to migrate resembles the actual country of destination of recentmigrants. However, there are some remarkable exceptions to this rule. Especially the wish ofmany Senegalese and Ghanaians to move to the USA is not reflected in actual patterns. Inparticular for the non-migrants among them, the USA seems to be the country of their dreams.Furthermore, the attractiveness of Germany to Turks is worth mentioning. Despite therelatively strong representation of Germany in the distribution of actual Turkish emigration,there is room for a considerable increase in the event that the migration intentions of Turkishnon-migrants and return migrants would come true. Finally, there is a notable differenceamong Egyptians in their preference for Saudi Arabia: while almost half of the interviewed

Push and pull factors of international migration: a comparative report
xxi
Egyptian non-migrants with migration intentions would like to leave for Saudi Arabia, only aquarter of the return migrants wish to do so.
Most people prefer to move to a certain country for economic reasons but when it comes tothe actual move, family-related reasons determine the choice of country. Undoubtedly,admission policies, which generally provide more scope for family migration than for economicmigration, contribute to this.
Push and pull factors of international migration: a comparative report
1
1. INTRODUCTION
1.1 Introduction
International migration flows have increased in magnitude and complexity over the pastdecades. From an original predominance of labour migration and post-colonial migration flows,migration flows have diversified: family reunion and marriage migration have become muchmore common and in the past decade refugees and asylum-seekers have arrived inincreasing numbers, from many regions in the world stricken by war, civil conflict andpoverty. As a result of these developments, migration and potential migration to, for instance,the European Union are receiving ever more attention at policy level. In order to help preparepolicies in the broad field of migration, development and integration, there is a need forstatistics as well as in-depth research. It is within this context that the Commission of theEuropean Communities entrusted Eurostat, its Statistical Bureau, and NIDI with a project tostudy the push and pull factors determining international migration flows.
Thus, the object of the study is to improve our understanding of the direct and indirect causesand mechanisms of international migration to the European Union, from an internationallycomparative perspective. As a supplement to migration statistics that are collected on aregular basis, from administrative sources, the results are intended to serve as a basis for thedevelopment of policy instruments and to provide tools for estimating future migration.
As a preparation to the survey project, a study on the ‘state of the art’ in migration theory andresearch, the identification of national and international research institutes active in this field,and a workshop (see Van der Erf and Heering, eds., 1995) were carried out. Based on theresults of this preparatory stage, surveys have been set up in a number of countries. Theresults are being reported on in the present comparative report, as well as in a series of eightindividual country monographs (see Appendix 10.6).
The focus of the project is on migration from the Southern and Eastern Mediterranean regionand from Sub-Saharan Africa to the European Union. Within these regions a number ofcountries have been selected for primary data collection on migration. The five predominantlymigrant-sending countries participating in the project are Turkey, Morocco and Egypt in theMediterranean region, and Senegal and Ghana in West Africa.
With respect to primary data collection in predominantly immigrant-receiving countries, twocountries in the Mediterranean region - Italy and Spain - were selected, primarily because ofthe limited availability of migration data in these countries and because of the fairly recentpresence of sizeable immigrant populations. In Spain, migrants from Morocco and Senegalwere studied, while in Italy the focus was on migrants from Ghana and Egypt. In addition, inthe original plans it was foreseen that secondary data from several other receiving countrieswould be used for an analysis of migration flows to these countries, but in the end, forbudgetary reasons, this was limited to the Netherlands only (where migrants from Turkey andMorocco were studied). This approach restricts comparability to a certain degree but it wasconsidered an appropriate ‘budget-conscious’ decision with respect to countries that alreadyhave a fair amount of available data and research on the topic.
In each of the countries involved in the project, local research teams were responsible fordata collection and, to a large extent, for data processing and analysis. A list of participatingresearch teams is included in Appendix 10.5. In close consultation with the respective countryteams and external experts, NIDI developed the research instruments for the project andprovided methodological and technical feedback.
Push and pull factors of international migration: a comparative report
2
1.2 Contents of report
Chapter 2 places the International Migration Survey (IMS) project in the wider context oftheoretical approaches to international migration and existing empirical evidence. In Chapter 3the research design of the project and the key concepts are discussed, as well asquestionnaire and sample designs, data processing, data quality, and the strengths andlimitations of the project. Appendices 10.1, 10.2 and 10.4 respectively, contain more details onsample designs, data processing, and concepts and definitions used. After a generaldemographic and socio-economic description of the countries included in the study (Chapter4), the main body of the report is devoted to a presentation of the main first results. Thecharacteristics of migrant and non-migrant households are discussed in Chapter 5, andmigration motives and destinations in Chapter 6. In Chapter 7, several issues related to themechanisms of migration, in particular the role of information and of migration networks in themigration process and admission strategies, are discussed. Chapter 8 focuses on migrationintentions and potential. Finally, the results are summarised in a separate section.

Push and pull factors of international migration: a comparative report
3
2. THEORETICAL APPROACHES IN MIGRATION RESEARCH1
2.1 Existing theoretical approaches
Several authors have reviewed the existing theories and models of international migration(see e.g. Kritz et al., 1981; and more recently Portes and Böröcz, 1989; Kritz et al., 1992;Massey et al., 1993; Bauer and Zimmermann, 1995). From these and other studies, it isobvious that there is no integrated theory on the process of international migration, but rathera set of partial theories and models that have been developed from different disciplinaryviewpoints. Many, especially earlier, theoretical models concentrate exclusively on theprocess of labour migration, while more recent theoretical models have tried to explain whymigration continues once it has started. Data requirements, as well as the level of datacollection, vary across models and approaches.
One of the most commonly known theoretical concepts in migration research, implicit ineconomic models of migration, is the so-called push-pull model for the explanation of thecauses of migration. In its most limited form, the push-pull model consists of a number ofnegative or push factors in the country of origin that cause people to move away, incombination with a number of positive or pull factors that attract migrants to a receivingcountry. Lists of push factors include such elements as economic, social, and politicalhardships in the poorer countries, while the pull factors include the comparative advantagesin the richer countries. Combinations of push and pull factors would then determine the sizeand direction of flows (Portes and Böröcz, 1989). The fundamental assumptions are that themore disadvantaged a place is, the more likely it will produce migration, and that, giveninequalities, there will be migration. The general criticism is that such models do not explainwhy some regions supply migrants while others do not, or not to the same extent, or whywithin regions some people move and others stay, nor can they explain the direction of flows.
Neoclassical macro-economic theory explains the development of labour migration within theprocess of economic development (see e.g. Ranis and Fei, 1961; Harris and Todaro, 1970;Todaro, 1976). Wage differentials, caused by differences in the ratio of labour to capital,induce workers from low-wage countries to migrate to countries with high wages, therebyseeking to maximise individual incomes. Migration causes wage differentials to decrease,ultimately leading to an equilibrium in which the remaining wage differential only reflects thematerial and immaterial costs of moving (Massey et al., 1993). In this type of model thatfocuses completely on labour markets, wage differentials measured in terms of observedwage rates at origin and at destination are the main explanatory variables.
Neoclassical micro-economic models focus on labour markets as well, but assume thatindividuals make rational cost-benefit calculations, not only about the decision whether tomigrate or not, but also when considering alternative destinations. Against the benefits ofexpected higher wages - being a function of wage differentials and employment rates - thereare various costs. Such costs are, for instance, those related to travel, to wages foregonewhile looking for work, to efforts involved in adapting to another country (learning a newlanguage and culture, making new friends, etc.), and to the psychological costs of leavingfriends and family (e.g. Sjaastad, 1962; Todaro, 1976, 1989; Burda, 1993). Individualcharacteristics explain why individual cost-benefit calculations produce different outcomeswith regard to the decision to migrate. In general, the larger the difference between countriesin terms of expected returns, the larger the size of the migration flow. However, even insituations of sizeable (expected) wage gaps, migration may be limited due to the fact thatpotential migrants expect those gaps to converge in the foreseeable future (option value ofwaiting). Variables included in these micro-economic models are not only observed earningsin the country of origin and expected earnings in the country of destination, but also the
1 This chapter draws upon an article written earlier for the project concerned (Schoorl, 1995). See also
Schoorl, 1998.
Push and pull factors of international migration: a comparative report
4
likelihood of finding work, as well as individual characteristics (education, experience,training, language skills), and variables measuring the costs of migration.
A more recent introduction to economic theory, the new economics of migration, is the notionthat not individuals but rather families or households are the main decision-makers withrespect to migration. Their goal is not only to maximise income, but also to minimise risk.Moreover, recent economic models include the functioning of other markets (such as thoserelated to credits and social insurance) in addition to the workings of labour markets (seeStark, 1984, 1991; Katz and Stark, 1986; Taylor, 1986; Ghatak and Levine, 1993). Householdrisk minimisation, especially in the absence of collective and social insurance systems and ofcredit systems, takes the form of a diversification of household resources, such as enablingone family member to receive advanced education, while sending another abroad to work andbring in remittances. Economic development does not necessarily reduce the pressures oninternational migration, as an increase in returns to local economic activities tends to makemigration more attractive because remittances can be successfully invested (Massey et al.,1993). Variables included in this type of model are thus both individual and householdcharacteristics, the structure and source of economic production and earnings, data on thetype and use of remittances, as well as data on the (perceived) functioning of variousmarkets and the perception of deprivation relative to other households.
Some researchers argue that labour market factors in receiving countries rather than insending countries determine migration (e.g. Piore, 1979). Intrinsic labour demands in modernindustrial societies create a constant need for new workers at the bottom of the socialhierarchy, who will accept low wages and a lack of social mobility perspectives, motivated bya desire to increase status in their community of origin rather than at destination. Thedemographic ageing process taking place in modern industrial states may further enhance thedemand for low-skilled immigrant labour. Native women have become better educated andhave started to look for better paid jobs, the increase in single-parent households has furtherincreased female labour force participation, and the new generations entering the labourmarket are becoming successively smaller (Massey et al., 1993). Measurement in suchmodels requires information on the structure of labour markets in receiving countries,particularly its segmentation into primary sectors characterised by formal and secure, high-skilled jobs, and secondary sectors with informal, low-status, insecure, and low-skilled jobs,as well as information on wages, employment conditions, etc.
In a separate group of models, the politically induced movement of refugees is originally seenas quite distinct from the economically-motivated movement of workers, in the sense that theformer move involuntarily, while for the latter there is an element of free choice. In practice,such classifications of ‘economic migrants’ and ‘political refugees’ appeared to beoversimplifications, as political and economic causes frequently join forces in producingmovement, and freedom of choice has many gradations (see e.g. Kunz, 1981; Zolberg et al.,1989; Suhrke, 1995). Based on this realisation, Richmond (1993) constructed a framework ofmovement characterised by free decision-making and rational choice (‘proactive’ migration) atone end of a continuous scale, and by conditions of crisis and intolerable threat (resulting in‘reactive’ migration) at the other end. The framework distinguishes underlying predisposingfactors (such as extreme inequalities between countries, and political instability) andstructural constraints (e.g. border controls) influencing the likelihood of reactive migration, aswell as more immediate precipitating events (for instance, the outbreak of war, ethnic conflict,violations of human rights) and enabling circumstances (e.g. individual availability ofresources), in addition to feed-back effects.
Push and pull factors of international migration: a comparative report
5
The models briefly outlined above focus predominantly on labour migration, explaining whylabour migration starts and continues under conditions of inequality between labour markets.Some models extend to include factors of political violence among the determinants ofmigration. However, although these economic and political conditions may continue to play arole, additional causes arise in the course of the migration process. The fact that migrant orrefugee communities have been established in countries of immigration leads to the growth ofmigrant networks that may foster the continuation of migration. In many countries, familyreunion has followed labour migration, creating migrant flows in some cases larger than theoriginal labour flows, and generally making migration less selective. This may be illustrated bythe migration of Turkish and Moroccan workers and their families to Western Europe (see e.g.Penninx et al., 1993, for the case of the Netherlands). Immigrant-receiving countries haveformulated various policies to facilitate integration and/or facilities for return migration. Socialinstitutions supporting migrants have come into existence, as well as mediating organisationsthat facilitate transportation. Furthermore, by incorporating migrants into society, the socialstructure and status of work may change, influencing the context for future migration.
A relatively neglected aspect of migration analysis has been the explanation of the direction ofmigration flows. At the very beginning of a migration process, information and chance factorsmay partly determine the choice of a particular country. Previous colonial bonds oftencontinue to be reflected in migration flows long after formal colonisation has ended (seeFassmann and Münz, 1992). Obviously, once migration connections have been established,the presence of relatives, friends, and/or others from the same community of origin may forma strong incentive to choose a particular destination. Other factors could be a commonlanguage, information about and perceived images of countries through media and otherinformation channels, perception of the likelihood of finding a job, perception of the functioningof admission and integration policies, etc. However, powerful ‘push’ and ‘pull’ factors linked tolabour market and economic imbalances and political as well as environmental conditions, plusthe spectacular advancement of transportation and communication systems may also inducemigrants to move to new destinations. The widening of the geographical scope of migration isaccelerated by new links established between countries as a result of changing patterns oftrade and capital flows in the global economy (Ghosh, 1992).
These and other factors involving the explanation of the continuation of migration and thedirection of flows have gradually been incorporated into the body of theory on internationalmigration. Such explanations continue to contain a strong economic core, but these modelsmay help to answer the question why migration continues and even increases, despite highunemployment in receiving countries, tightened admission policies, and increasingly negativeattitudes towards migration.
Building on a history of research on the phenomenon of ‘chain migration’ in recent years, anincreasing number of studies have focused on the shape and functioning of networks ininternational migration (see e.g. Harbison, 1981; Massey et al., 1987; Boyd, 1989; Fawcett,1989; Kritz et al., 1992). Migrant networks may be defined as sets of interpersonal ties thatconnect migrants, former migrants, and non-migrants in areas of origin and destinationthrough ties of kinship, friendship, and shared community origin (Boyd, 1989; Massey et al.,1993). Networks facilitate potential migrants’ decisions to migrate by the provision ofinformation and assistance, for instance, with regard to finding work and housing. Migrationnetworks may help overcome restrictions in admission policies, for instance throughmarriages between members of networks. If marriage markets are bounded by kinship and/orcommunity groups, if ties between countries and communities are reinforced by frequentvisits, and if marriage decisions are influenced by families rather than only by individuals,migrant networks may have a strong influence on the continuation of migration (see e.g.Esveldt et al., 1995). Integration policies directed at creating a sound legal position for long-term immigrant residents may independently attract new immigrants, but may also increase theopportunities for those already in such a position to assist new arrivals. In general, networkshave a tendency to expand, as in reducing the cost of migration and decreasing its risks, theystimulate new migration. Therefore, migration may be seen as a self-sustaining diffusionprocess (Massey et al., 1993). However, both a gradual weakening of links between origin

Push and pull factors of international migration: a comparative report
6
and destination communities (e.g. among the second generation) and an increase in theburden put upon the resident migrant community by an increasing number of potential migrantsmay in time lead to a decline in the effectiveness of such networks. For instance, earlierarrivals may grow weary of yet another cousin arriving at their doorstep demandingassistance that is sometimes difficult to provide (see e.g. Böcker, 1994; Pohjola, 1991). Interms of causal factors, network theory greatly expands the requirement of data andtherefore the burden on data collection. Migrant networks are notoriously difficult to measure,as network ties (type and intensity) are cumbersome to define and risk being understooddifferently by researchers and by individual respondents.
The migration process, once underway, alters circumstances both at origin and at destination.This phenomenon, termed cumulative causation, often increases the likelihood of futuremigration (Massey, 1990). Outmigration influences social and economic structures and incomedistributions in the region of origin, depending on the stage in the migration process. Before arural region starts to participate in a migration system, income inequalities and thereforefeelings of relative deprivation may be limited; as the migration process gets underway,remittances of the first group of migrants cause inequalities to increase, and thereby increasethe sense of deprivation among those left behind. According to this reasoning, only after amajority in a community have become involved in the migration economy, will incomeinequalities again decrease (see e.g. Taylor, 1992). Furthermore, the organisation ofagricultural production may change as migrants may be more likely to afford and use capital-intensive production methods, or may buy land for investment purposes rather than forproduction, causing demand for local labour to decrease. On the other hand, the constructionof new houses may increase labour demand. Finally, the experience migrants gain in thecountries they have moved to is likely to change tastes and motivations, creating a true‘culture of migration’ in some societies if migration becomes part of the value system of acommunity. This approach requires fairly complicated contextual data, including extensivedata on income inequalities and on the perception of relative deprivation, migrant networks,economic structure and property distributions, and cultural attitudes and values aboutmigration. At the destination end as well, migration tends to change circumstances. Forinstance, the social acceptability of work is altered as people start to view certain jobs aslow-status immigrant jobs, and refuse to enter those occupations any longer. Therefore,despite high unemployment rates there may be a structural demand for immigrant labour.Immigrants may perceive status differently, at least as long as their primary goal is to earnmoney and improve their status in their community of origin, or if the fact that by earning anincome they have gained independence provides them with a sense of status improvement.
Migration systems theory incorporates many of the theoretical models and elements brieflydescribed above. Migration flows acquire a measure of stability and structure over space andtime, allowing for the identification of stable, international migration systems. A migrationsystem may be seen as a set of places linked by flows and counter flows of people, goods,services, and information (Fawcett and Arnold, 1987a; Boyd, 1989; Fawcett, 1989; MoulierBoutang and Papademetriou, 1994; Zlotnik, 1992). Considering migration as taking place withina system where countries and regions are connected by several types of linkages, as wellas viewing it as a dynamic process rather than a static phenomenon, inevitably calls for theintegration of micro- and macro-level processes. Therefore, research on the causes ofmigration has to consider both individuals and households (including their migration-relatedbehaviour, motivations, perceptions, etc.) and the economic, social, environmental and politicalcircumstances which create the context for migration and influence individual behaviour.Within a systems framework, individuals and households are regarded as active decision-makers about migration or alternatives to it. They develop strategies for migration, taking intoaccount both influences acting within the system that originate in the potential country ofdestination and those related to the country of origin (Kulu-Glasgow, 1992). Questions posedby systems-oriented studies include the reasons for migration versus non-migration, the roleof states in controlling migration, and the role of networks and information, etc.
The main advantages of systems studies are outlined by Fawcett and Arnold (1987a):
Push and pull factors of international migration: a comparative report
7
• they pay attention to both origin and destination areas;• they attempt to explain both mobility and stability;• elements in the system are in principle studied in combination rather than in isolation;• other flows than the flow of people are included;• elements in the system are recognised as interconnected and changes in one part will
affect other parts;• migration is considered to be a dynamic process consisting of a sequence of events over
time.
Counterbalancing this impressive list of potential accomplishments of systems-orientedresearch is an equally impressive list of data requirements at the various levels and places ofanalysis, implying time series of data.
2.2 Implications for data collection
Existing theoretical approaches are, of course, not mutually exclusive in all respects.Overlaps exist, even under seemingly contradictory assumptions. In terms of datarequirements, the more recent approaches tend to be highly demanding, especially thosecovering migration networks and migration systems. In principle, data at both the individual,household, community, and sometimes wider contextual levels are required, both in sendingand receiving countries, for migrants as well as non-migrants, and viewed from a historicalperspective. Obviously this places serious demands on data collection, as well as onsubsequent analysis (see e.g. Bilsborrow and Zlotnik, 1995).
Registration systems do not offer sufficient information by themselves to explain the processof migration, in order to understand why some people move and others do not. Given theamount of detail required in recent theoretical models of migration, censuses, and/or large-scale surveys, though generally providing more data on the characteristics of migrants thandata from administrative registers, are equally inadequate to cover the migration processadequately, due to questionnaire limitations. Special migration surveys are most suitable forexplanation purposes, but the costs are often prohibitive, especially where national coverageand/or large samples are required.
Fawcett and Arnold (1987b) list a number of advantages and disadvantages of surveydesigns, compared with other forms of data collection, including their flexibility andmanageability, their relative accuracy, and the possibility of advanced and innovativeresearch designs involving multi-site sampling and multi-level data collection. In addition, the listof topics that can be addressed in surveys is virtually inexhaustible (although both therespondents' and the interviewers' stamina may fall short).
Against the advantages of surveys, the disadvantages are also well known (see e.g.Fawcett and Arnold, 1987b): the difficulty of obtaining representative samples of relevantgroups and the costs involved in creating sufficiently large samples in specialised surveys. Inpractice, sampling strategies are less than ideal, especially for groups that are difficult tolocate, such as undocumented migrants. Furthermore, countries have widely divergentsources of data on international migrants, even leaving aside the fact that there are nouniform definitions of the concept of a migrant. Therefore, sampling for internationallycomparative research designs may in practice turn out to be far from ideal. Due to the relativeease of identifying actual or potential international migrants, many studies focus exclusivelyon areas of high out-migration or in-migration. In any case, the majority of studies are carriedout at the destination end only; thus such studies are unable to grasp the determinants ofmigration and migrant selectivity. Moreover, those who have moved again (either to return orto go elsewhere) are excluded.
A rather wide consensus on the necessity of combining data from different levels hasemerged, by sampling households and interviewing various members (e.g. heads ofhouseholds and/or those members of the household that have migratory experience). In
Push and pull factors of international migration: a comparative report
8
addition, the need for community-level data - and occasionally data relating to a widergeographical context - has become accepted. However, if such data are collected, they oftentend to be collected only with reference to the time of the survey. Obviously, relating suchcontextual data to individual and household migration decision-making - which may have takenplace a number of years earlier - can only be done under the often false assumption that nochanges have taken place since. If feasible, community-level data should therefore beobtained in time series.
In research on international migration, non-migrants (including potential migrants) tend to be arather neglected group. However, in order to study the determinants of migration, it is not onlyimportant to study the motivations, characteristics, and circumstances of those individuals andhouseholds that have actually migrated, but also of those who decided not to migrate or whohave not yet decided, or who have returned after a longer or shorter period abroad (see alsoe.g. Hammar, 1995; Hammar et al., eds., 1997). Surveys should therefore include bothhouseholds with migratory experience and households without migratory experience, thoughthe former may be over-sampled relative to the latter category. If the focus is on the causesof international migration, the reference group of (native) non-migrants at destination may beomitted (Bilsborrow et al., 1997).
For practical and funding reasons, research efforts are usually, though not always, limited tostudying the migration process either at the receiving or the sending end. Surveys limited toimmigrant-receiving countries suffer from the fact that only those who have chosen to migrateto that particular country can be studied, thereby omitting those that have either chosendifferent destinations, those that have returned, and those that have not (or not yet) migrated.Therefore, such studies alone are insufficient to explain the determinants of migration. Studieslimited to migrant-sending countries, on the other hand, may include non-migrants but omitthose who have out-migrated, with or without other members of their households. Obtaininginformation on migration from proxies is less reliable, if not impossible, on topics concerningattitudes and experience abroad. In principle, a linked approach seems most suitable, studyinghouseholds without migratory experience at origin (if not also at destination), and householdswith migratory experience both at origin and at destination. There are several ways toapproach such linked samples. First, through so- called linked samples, in which migranthouseholds may be interviewed at destination, and their relatives or shadow households atorigin. One may either start in the country of origin and follow forward after having obtainedaddresses of household members/relatives abroad, or in the country of destination and followbackward after having obtained addresses of household members/relatives in the country oforigin. In the latter case, additional sampling has to be carried out in order to select householdswithout migratory experience, as well as households of return migrants and households ofmigrants to other destinations.
Push and pull factors of international migration: a comparative report
9
An alternative approach is to first interview, at destination, a representative group of migrantsfrom a particular region of origin. By obtaining details on the place of origin of the interviewedmigrants, a second sample may be drawn at origin, containing households with migrationexperience to particular destinations, households with migration experience to otherdestinations, households of return migrants, and finally households without migrationexperience.
There are some serious practical sampling problems for both types of research design, inparticular for the former. When starting a linked sample at origin, sampling and organisationalproblems that are likely to arise include, for instance, ensuring sufficient follow-up byobtaining addresses. Respondents often do not know where those who migrated are living,especially not in a situation of irregular migration. Moreover, even if they do know, providingan address requires confidence that the knowledge will not be used against the migrantand/or his/her relatives. Furthermore, follow-up addresses may well be far apart. Extensivetravelling by interviewers to locations far apart in the country of destination may be avoidedby selecting specific chains of migration. Finally, households that have emigrated as a wholeare omitted from the survey.
Sampling and organisational problems may also arise if the process is started at destination. Indestination samples, undocumented migrants are more likely to be underrepresented. And, iffor instance only those who migrated during the last x years are included - assuming anemphasis on recent trends - sampling issues would be burdened with an additional problem inthe selection of respondents, especially in cases of long-established flows. In addition, it maybe difficult to obtain sufficient follow-up addresses, although in this case the problem may beless severe, as providing approximate addresses may be perceived as less threatening byrespondents. Finally, additional sampling on non-migrant households is necessary.
In order to properly capture the dynamic nature of the migration process and especially thedecision-making aspects underlying it, research designs should be longitudinal, so thatmigrants may be followed from before migration to some time after migration, rather thancross-sectional/retrospectively oriented. Sampling then takes place among the non-migrantpopulation and potential or prospective migrants are followed and interviewed repeatedlystarting from (just) before migration for a period of several years. However, in practice, thereare limitations and disadvantages to such designs. First, random sampling tends to include toofew people who are actually going to migrate within the time framework of the survey;therefore, sampling is often focused on those who are already in an advanced stage ofpreparing for their migration (e.g. by sampling among visa applicants or upon arrival atdestination). Secondly, there is the risk of a high rate of loss of respondents in second andlater rounds due to mobility. And, thirdly, longitudinal projects suffer from often prohibitivecosts and their time-consuming nature.
There is as yet no integrated set of theoretical models on the causes of international migrationnor on the migration process in general. Theoretical models have gradually involved anincreasing number of interrelated factors influencing the process of migration, and thedecisions people make about migration or alternative options. While economic factors and(perceived) differences in welfare and employment continue to play an important role in allmodels, major additions involve the inclusion of households; the inclusion of contextualfactors, not only those directly related to the places of origin and destination, but also thosethat are shaped by the migration process itself; the role of migrant networks; the role ofadmission and integration policies, as well as the perceptions of (potential) migrants of theconsequences and effectiveness of such policies. Furthermore, recent research has beenincreasingly oriented towards viewing the migration process as a dynamic system.
Push and pull factors of international migration: a comparative report
10
As theoretical models and insights have developed, so have the data requirements to testthem. The more recent economic and systems models require increasingly detailed andcomplex data at different levels of aggregation. Though different theoretical models requiredifferent data for their hypotheses to be tested, there is also considerable overlap in datarequirements. Nevertheless, as a study of a complete migration system cannot be effectuatedwithin the framework of one (or even several) studies, careful consideration of the choice ofresearch topics and hypotheses is necessary. In this respect, research topics could focus onthe determinants of migration decisions and alternative decisions, with particular attention tosuch factors as individual and household characteristics (including economic factors such asproperty, remittances), economic, environmental, socio-political, structural, and ethniccontextual factors that influence options and decisions to migrate or stay, information on andperceptions of life and opportunities in destination countries, information on and perceptionsof migration control policies, and the shape and function of migration networks.
2.3 Surveys of international migration
To what extent are existing surveys able to comply with the data requirements implied byrecent theoretical approaches? If a complete migration system is to be studied, fieldwork hasto be carried out in all countries that form part of the particular system, in more or less thesame period of time. Few studies have attempted to explain migration from an internationallycomparative perspective. Comparing migration processes between countries is already anextremely difficult exercise if based on existing statistics (that vary according to the type ofdata source and the definition of a migrant, to name but the two most important sources ofincomparability). Relatively few survey-based studies have been carried out across countriesof origin and/or across countries of destination, or at both the sending and receiving end ofmigration flows. Those that exist most often concern one country of origin and one country ofdestination, and are frequently based on (very) small samples. One example among the mostcommon type of study - the qualitative study based on small or very small samples - is ananthropological study by Böcker (1994, 1995) among Turkish immigrants in the Netherlands. In1988-1989, she studied 28 Turkish households containing 80 adults and 52 children under 18in one municipality in the Netherlands. A follow-up in Turkey was achieved by interviewingrelatives of some of the households interviewed in the Netherlands. Although the studyprovides many new insights into migration motivations and the functioning of networks, thesmall numbers do not justify generalisation.
In a study by Massey et al. (1987), various forms of data collection were used to study theprocess of migration from Mexico to the United States. Contrary to the follow-backwardprocedure applied by Böcker, the Mexican study used an adapted follow-forward procedure.In the original study, four villages were selected from a region in Mexico that formed a majorsource of migrants to the United States. In the villages concerned, a randomly selected total of825 households were included in the survey, containing 5,945 persons. Data were collectedfrom these households with the aid of semi-structured questionnaires. In addition, those withprior migration experience were interviewed about their migration histories and experience.Apart from the household and individual data, community-level contextual data were collected,as well as a number of ethnographic case studies. In order to obtain missing information onabsent migrants, a further 60 households (367 persons), resident in California for a period ofat least three years, and originating from the Mexican villages in the study were interviewed.Chain-referral (‘snowballing’) was used to locate the US-based migrants. Again, due tosampling procedures and sample sizes, generalisation to Mexico as a whole is not possible.

Push and pull factors of international migration: a comparative report
11
A study on migration from Eastern and Central Europe, co-ordinated by the UN/ECE PopulationActivities Unit, used a methodology comparable to the Mexico-United States study but, partlybecause of the multi-destination character of the migration, the inclusion of countries ofdestination was problematic. The design was more complicated in the sense that threesending countries were included instead of just one, and because the destinations were morevaried. Furthermore, the intensity of migration is different from the Mexican case, making itmore difficult to sample sufficient households with migration experience (Mullan and Frejka,1995, Jazwinska and Okolski, eds., 1996). Due to a lack of appropriate sampling frames, thefirst step was to purposively select regions and, within regions, communities to be included inthe study, aiming at those in which, according to expert opinion, migration was assumed to beimportant. If available, registers were then used to draw samples of individuals orhouseholds. In the first stage of the two-phase sampling strategy, a preliminary shortquestionnaire was applied to all randomly selected households to identify households asmigrant or non-migrant. The full questionnaire was then used in migrant households only. Thepreliminary questionnaire included information necessary to identify migration experience, aswell as information on household composition, education, age and professional level of thehousehold members. Where the sampling procedure did not result in a sufficient number ofmigrant households, chain-referral techniques were used to identify additional migranthouseholds. Chain-referral procedures were thus used in Lithuania and in Ukraine, due tohigh refusal rates among the originally sampled households. Sample sizes were originally setat 600 households in Lithuania, 450 in Poland, and 460 in Ukraine (Mullan and Frejka, 1995). InPoland, of the 1,281 households selected from the sample frame, the short preliminaryquestionnaire was administered to 900 households, 425 of which appeared to qualify asmigrant households. The reasons why households were not surveyed were most often thathouses were found to be uninhabited (which is likely to be related to migration), or that theyrefused to co-operate (due to the sensitivity of the topic) (Jazwinska, 1996).
A fourth example is an older study on migration from the Senegal River valley to France, forwhich data were collected in 1982 both in France and in a large number of villages in theSenegal River valley (see Condé et al., 1986; Findley et al., 1988). The study started with asurvey among 1,219 Senegalese, Malinese and Mauritanians working in two major migrantdestination regions in France. As part of the survey, the respondents were asked to nametheir place of origin and a second sample was drawn in 99 villages selected from the placesof origin named by the respondents in France. The villages were stratified according to thenumber of respondents in France who originated from there, and each village was given asample fraction targeted to include one hundred individual respondents per village. A total of12,558 individuals (in 1,032 households) were included in the valley survey. Household socio-demographic variables and census-type migration questions were included in thequestionnaires, as well as information on the economic characteristics of the household andmigration histories for all men older than 15 (including information on migrations to otherAfrican destinations). Finally, there was a community-level questionnaire for villagecharacteristics. However, as community and household characteristics were only asked forthe date of the survey and not at the date of migration, subsequent analyses are lacking inthis respect.
More recently, in 1993, a series of migration surveys were carried out in eight West Africancountries (Burkina Faso, Guinea, Ivory Coast, Mali, Mauritania, Niger, Nigeria, and Senegal).The study, co-ordinated by CERPOD, was entitled Réseau d’enquêtes sur les migrations eturbanisation en Afrique de l’ouest (network of surveys on migration and urbanisation in WestAfrica). It tried to measure migration flows in the five-year period preceding the surveys,1988-1992 (Bocquier and Traoré, 1998; CERPOD, 1995). The main goal of those surveys wasto measure characteristics of the migration and urbanisation process, ambitiously includingboth levels and trends, and determinants and consequences. In nationally representativesamples, all changes of residence were recorded for individuals interviewed.

Push and pull factors of international migration: a comparative report
12
Migrants currently abroad were covered through a special questionnaire if they had been amember of the household during the five-year reference period. In that case the questions onthat migrant were asked to the head of household or the other oldest household memberpresent. The number of households surveyed varied between almost 7 thousand to 13thousand, Nigeria being an outlier with as many as 34 thousand households. The eightcountries together covered nearly 100 thousand non-migrant and migrant households, but asthere was no over-sampling of households with international migrants, the number ofinternational migrants included ended up being small (Bilsborrow et al., 1997). As in the othersurveys described above, apart from household and individual data, data were collected atthe community level too.
One of the rare examples of a longitudinal research design in the study of internationalmigration is formed by a study among Korean and Filipino migrants to the United States (Cariñoet al., 1990; Park et al., 1990). For the purpose of the study, one in ten persons aged 18-69who were issued a visa in 1986 was interviewed, prior to departure. In the two countries,3,911 persons were interviewed on their socio-demographic characteristics, their familynetworks, their plans and expectations regarding life in the United States, and their migrationhistories. In addition, in order to correct for the omission of those who did not apply for animmigrant visa in their home countries but who only adjusted their status after arrival in theUnited States, a mail survey was carried out among 2,114 Korean and Filipino status-adjusters in 1986. Longitudinal follow-ups took place in 1988-1989, in which 2,079respondents were traced, and again in 1991-1992 (Fawcett and Gardner, 1994).
Push and pull factors of international migration: a comparative report
13
3. STUDY DESIGN
3.1 Research design
The objective of the project is to increase our understanding of the determinants andmechanisms of international migration, from a comparative perspective. How do migrationflows start? What causes these flows to continue and to eventually decline over time? Andwhich factors influence the direction of migration flows? Although general sources ofmigration pressure are well known, it is more difficult to discern how and to what extent theymay affect specific migration flows. Assuming that many movements are initiated oraccentuated by economic factors, and that extreme poverty and social and economicinsecurity create a large migration potential, what are the circumstances that turn a potentialinto an actual migration flow? And why, even though an increasing number of people arebecoming migrants, do so many decide not to move, given often sizeable gaps in welfarebetween places? In other words, what individual characteristics and circumstances setmigrants apart from non-migrants? Furthermore, to what extent do these factors change overtime with the development of the migration process and within the particular set of countriesconcerned?
In order to study such questions, the project has tried to incorporate a number of the principalelements that follow from the design and data requirements set by the more recent theoreticalapproaches to studying processes of international migration.
When explaining the process of migration (rather than measuring migration flows), specialisedmigration surveys are the most appropriate method of data collection. As, from a theoreticalpoint of view, the aim was to capture both individual, household, and contextual factors thatinfluence people’s decisions to move or stay, the project includes both a micro-level survey(household and individual data for migrants and non-migrants) and a macro-level survey(contextual data at the national, regional, and local or community levels) in each of theselected sending and receiving countries.
Rather than opting for more time-consuming and costly longitudinal surveys, the practicalsolution of single-round cross-sectional surveys with retrospective questioning wasadopted. The historical-time dimension is captured by retrospective questioning in thehousehold and individual surveys, and by time-series data collection at the macro-level. Theperiod of ten years preceding the surveys was chosen as the period of interest, for severalreasons. First, from a policy point of view a focus on recent migration processes wasconsidered most relevant. Secondly, by narrowing down the time dimension, demands onsample size are decreased, as the need to control for the period of migration becomes lessurgent. Both arguments may easily point to an even shorter period. The more limited thedelineation of a ‘migrant’, however, the more complicated it will be to sample for migrants in apopulation.
As data collection should be sufficiently broad to accommodate subsequent analyses fromdifferent angles, a multidisciplinary approach was considered most appropriate. A systemsapproach, including elements of the network and cumulative causation approaches, servedas a broad theoretical framework for the construction of the questionnaires. In terms of datarequirements, this approach tends to be very demanding. In principle, data at both theindividual, household, community, and sometimes wider contextual levels are required, both insending and receiving countries, for migrants as well as non-migrants, and incorporating ahistorical perspective.
Push and pull factors of international migration: a comparative report
14
Both migrant-sending and migrant-receiving countries were included. This principle wasadhered to less fully than originally intended, however, due to compromises that had to bemade - given budget constraints - between sample sizes and the number of countries to beincluded. Surveys were carried out in five countries that are predominantly senders ofmigrants: Egypt, Morocco, Turkey, Ghana and Senegal; and in two countries that mainlyreceive migrants (Spain and Italy), while survey data from the Netherlands were used forsecondary analysis. In Spain, migrants from Morocco and Senegal were interviewed, in Italymigrants from Ghana and Egypt. Secondary analysis in the Netherlands includes Turkish andMoroccan migrants; results from these analyses are included and/or referred to in Chapters 6and 7.
Each of the sending countries selected is characterised by:
• a differentiation between long-established and more recent migration flows;• a certain magnitude of out-migration;• a regional differentiation between the levels of development;• the possibility of finding populations of emigrants from these countries in different receiving
countries in the European Union.
Morocco and Turkey were chosen as examples of countries with established migrationhistories, and an increasing variety of destinations in Europe. Moroccans have traditionallymigrated to France, and to a lesser extent to the Netherlands and Belgium, but they haverecently been migrating, in greater numbers than in the past, to countries such as Spain andItaly. For Turks, the main destinations are Germany and, at a distance, the Netherlands, otherEuropean countries, the United States and, more recently, Middle Eastern countries.Ghanaians have a strong culture of migration, originally linked to the United Kingdom and theUnited States, but more recently also to such destinations as Italy, Germany and theNetherlands. Among the francophone countries in Africa, Senegal stands out as the countrywith the largest variation in destinations. France is still an important destination for Senegalesemigrants, but Spain, Italy, the United States and others increasingly receive migrants fromSenegal. Egypt is perhaps the odd one out, as most of its migration has been to the GulfStates and Libya rather than to Europe. Nevertheless, in smaller numbers Egyptian migrantshave moved to southern Europe and Germany as well, and Egypt’s migration potential remainssignificant.
As far as the receiving countries are concerned, Italy and Spain were selected primarilybecause of the limited availability of migration data in these countries and because of the fairlyrecent presence of sizeable immigrant populations. The Netherlands on the other hand is acountry characterised by an established migration history. Partly because of this, asubstantial body of research on migration is available in the Netherlands, based on surveydata as well as on statistics derived from the population registers.
The secondary data used for the country report on the Netherlands within the framework ofthe project were provided by a survey on Turkish and Moroccan migrants, carried out by theNetherlands Interdisciplinary Demographic Institute (NIDI) in 1993 (Esveldt et al., 1995). TheNIDI Migration Study (NMS) was a single-round cross-sectional survey with retrospectivequestioning, using a structured questionnaire. The survey was combined with in-depthinterviewing on sensitive issues and on topics that needed clarification. As macro-level datacollection was not part of the NMS project, such data have been collected within theframework of the current study, for purposes of comparison within the IMS project.
The objective of the NMS was to study determinants of migration from Turkey and Morocco tothe Netherlands, and their consequences for the future perspectives of migrants, as well asfor the size and composition of potential future migration flows. Main themes in the NMS were,amongst others, migration motives (reasons for leaving the country of origin, and for choosingthe Netherlands in particular) and mechanisms of migration (networks and information).
Push and pull factors of international migration: a comparative report
15
A detailed description of the research design, key concepts, sample design and questionnaireis given in the Dutch country report (see appendix 10.6). The report also discusses the maindifferences between the IMS and the NMS and the consequences that these differences mayhave for comparability.
In order to allow for the comparison of migrants from a specific country of origin in differentcountries of destination or for the comparison of migration from different countries of origin toa specific country of destination, the IMS project should preferably have included moresurveys in receiving countries than were actually realised. The advantage of suchcomparisons is that they may shed light on the influence of differential economic situationsand of political factors on the migration process, as well as on the shaping and functioning ofnetworks under different conditions, for example. Nevertheless, the design still permitsvarious types of comparison across countries.
The incorporation of non-migrants is an essential and self-evident necessity in order toexplain the determinants of migration, and to increase our understanding of why the majorityof people do not migrate. The surveys carried out in the sending countries therefore includeda comparison group of non-migrant households. As the project’s main interest lies with thedeterminants rather than the consequences of migration, non-migrant households were notincluded in the surveys carried out in the countries of destination.
3.1.1 Key concepts2
A number of crucial concepts and definitions were adopted for the purpose of the study,after discussion with a group of external experts and after consulting the country researchteams. As cross-country comparability was a priority goal, compromises had to be made thatwere acceptable to all research teams. The concept of the household and the definition ofmigration were particularly important in this respect, given differences between countriesboth in cultural aspects and in the history of migration. In addition, the concept of the ‘mainmigration actor’ was developed, essentially to limit the burden of interviewing within eachhousehold.
For the purpose of the study the usual concept of household was extended to include notonly those persons who live together and have communal arrangements concerningsubsistence and other necessities of life, but also those who are presently residingelsewhere but whose principal commitments and obligations are to that household and whoare expected to return to that household in the future or whose family will join them in thefuture. Therefore, both the household and the shadow household are captured within thedefinition, a necessary extension for migration studies. The household concept appeared tobe one of the most difficult to deal with in the study, not only because of the complication ofmigration (involving another residence), but also because the type of households variedsubstantially from one country to another. For instance, the practice of polygamy in Senegaltends to result in large households who either live concentrated in one compound, orgeographically separated with each wife and her children occupying their own housing unit.In addition, as a consequence of the migration of the husband, the individual wives maytemporarily fall under the responsibility of another man in the family of the husband, usually hisfather or a brother. In contrast, many of the households in Turkey are of the nuclear type. Thelatter, though easier to deal with in a survey, is often also more likely to have moved as awhole (and therefore no longer accessible to be interviewed in the country of origin).
2 See also Appendix 10.4.
Push and pull factors of international migration: a comparative report
16
Migration is defined as a move from one place in order to go and live in another place for acontinuous period of at least one year. The line has been drawn at one year to allow forcomparison with international recommendations, as well as to exclude seasonal migrationacross international borders. Therefore, the migration history module in the surveyquestionnaires asks only for those places in which someone has lived for at least one year (amunicipality in the case of internal migration in the country of origin, and a country in the caseof international migration). There is one exception to this rule. If a migrant has left the countryof origin (i.e., the respective sending country included in the project; more precisely definedas the country of birth) at least three months ago and has been currently living abroad for atleast three months he/she is also considered a migrant as it is still unknown whether he/shewill stay there for at least a year.
A further distinction is made between recent and non-recent (international) migrants. Recentmigrants are those who have migrated from the country of origin at least once within theperiod of ten years preceding the survey. Consequently, a non-recent migrant is someonewho has migrated from his/her country of origin at least once, but not within the past tenyears.
Another distinction is that between current and return (international) migrants. Currentmigrants are those who have migrated from their country of origin and actually live abroad atthe time of the interview. They may, however, temporarily be in their country of birth, forinstance for a holiday or to visit relatives. Return migrants have lived abroad for a continuousperiod of at least one year, but have returned to their country of origin, where they live at thetime of the interview.
Both current and return migrants can be either recent or non-recent. Note that, because of theinterest of the study in recent (e)migration, recent return migrants are those who have bothleft the country of origin and returned there within the past ten years, most likely a limitedselection of all return migrants.
A non-migrant within the context of this study is a non-international migrant.
Households too are divided into recent migrant households, non-recent migrant households,and non-migrant households. A recent migrant household is defined as a household in whichat least one member - who is still considered a member of that household - has moved fromthe country of origin during the past ten years, and has since returned after having livedabroad for a continuous period of at least one year, or who is currently living abroad and leftthe country of origin at least three months ago. A non-recent migrant household then is ahousehold in which all moves (to live abroad) from the survey country of those persons whoare still members of the household took place more than ten years ago. Both recent and non-recent migrant households may be classified as belonging to either the current or the returntype, or a combination of the two.
Finally, a non-migrant household is a household from which no member has ever left thesurvey country to live abroad for a period of at least one year or of which no member hasbeen living abroad for at least three months.
In principle, any recent migrant, whether return or current, qualified for interviewing about hisor her migration experience. However, in order to restrict the number of potential respondentswho would be presented with a long individual questionnaire (and therefore reducing theinterview burden on households) and in order to avoid getting duplicate answers, and/oranswers that may refer to different households in the past, only one recent migrant in anyhousehold was selected for a long interview (see also Section 3.2.1). This migrant wasnamed the main migration actor, or MMA. Rules were set to select MMAs: potential mainmigration actors (PMMAs) are all recent migrants in the household aged 18-65 who were bornin the survey country and who were 18 years or older at the time of their last migration fromthe survey country. According to these criteria, in any particular household, more than onemember of the household may qualify. But from among the PMMAs identified, only the one
Push and pull factors of international migration: a comparative report
17
who was the first to have left within the ten-year period was selected as the MMA. Additionalrules were established to decide on the MMA if several PMMAs had migrated simultaneously.
Choosing the MMA in the way described above implies that it is not necessarily the personwho started the migration process in that household who was interviewed on his/hermigration experience. Restricting extensive interviewing on migration experience and livingconditions prior to migration to the ten-year limit, serves to minimise recall error, and has theadditional advantage that insight is gained on heads of household or economic migrants aswell as on those who migrated as dependants (with the exception of those who migrated aschildren). In every household, one person was selected as the reference person. In principle,the reference person is the economic head of household, defined as the person who bringsin the largest share of the household income. He or she was asked to answer the questionsin the household questionnaire; furthermore, the reference person in households that did notcontain an MMA, was asked the questions in modules H and J (see Section 3.2.1).
3.2 Questionnaire design3
3.2.1 Micro-levelThe aim of the micro-level survey is to describe and interpret the individual and householdbackgrounds that underlie decisions to migrate or to stay. Given the broad theoreticalframework used as a guideline for the development of the questionnaires, a large amount ofdata had to be collected. In constructing the questionnaires we benefited from the work ofother researchers in the field, especially those connected with some of the studies mentionedin section 2.3, and from studies on the design of migration surveys (Bilsborrow et al., 1984,1997). In order to keep the size of the questionnaires more or less manageable, priority topicsfor questioning were identified. Draft questionnaires were sent to country teams forcomments, and were discussed in a meeting with experts from different disciplinary andregional/cultural backgrounds. An important goal of the project was to make questionnaires ascomparable as possible, but to some extent teams were allowed to either add questions thatwere of particular relevance to their country only; or to drop questions, either for the oppositereason, or because the topic/questions were considered too sensitive and were feared toseriously jeopardise fieldwork results. Examples of additions were some questions in theGhanaian and Senegalese surveys on dual citizenship of children of migrants; a series offairly detailed questions in the Senegalese household questionnaire on expenditures (whetherin cash or in kind), and the extent to which funds derived from migration were used for this;etc. Questions that were dropped were, for instance, those on ethnicity and religion in Egyptand Morocco. Furthermore, during the pilot tests in several of the participating countries, aquestion on relative deprivation (asking respondents to rate their household’s economicsituation relative to that of other households) did not work well, either because admitting tobeing relatively well-off could induce others to ask for a share in their riches, or because itwas considered ‘not done’ to compare oneself with others. In those cases, the question wasdropped. Perhaps most importantly, the series of questions on undocumented migration wereleft out in Senegal. Of course, it is never easy to interview people about such a very sensitiveissue, but it was rendered impossible in Senegal due to a simultaneous general informationcampaign that tried to explain why migration is not the solution to the population’s problems.As this campaign was partly funded by the European Union, it was hard to convince localauthorities and respondents that the IMS-project was not connected with the campaign.
3 Questionnaires are available on request.
Push and pull factors of international migration: a comparative report
18
In some cases, it appeared to be necessary to change the wording of a question in order tobetter fit the cultural environment. The most obvious examples are those of educational levelsand of marital status, that were coded according to each country’s educational system andmarital practice, respectively. The differential land property structures and land use inMorocco and Senegal, which required adaptations of the series of questions dealing withhousehold (land) property and assets, form a more interesting example.
Survey questionnaires and background material were available in English and French. Whereappropriate, the respective country teams took care of translation into local language(s). Inaddition, teams in the countries of origin provided support with translations for teams incountries of destination. In order to minimise the risk that translations resulted in changes inmeaning, frequent contact was maintained with country teams to discuss and explain surveyquestions and concepts, particularly when evaluating the pilot results, and during interviewertraining and the start of the main fieldwork, through visits from a member of the NIDI co-ordinating team to country teams.
Sets of questionnaires cover households and, within each household, its individual membersaged 18-65 years. In the sending countries, the targeted groups were:
• recent current and recent return migrant households: households with at least one personwho emigrated ten years ago or less;
• non-migrant or non-recent migrant households: households with non-recent migrantsand/or non-migrants only.
In receiving countries, only recent migrant households were included.
All sets of questionnaires share the same basic modular design and layout. Each householdreceived a household questionnaire and one or more individual questionnaires. For the sake ofcomparability, modules were standardised, although, as mentioned above, there was apossibility to accommodate specific conditions and issues relevant to individual countries.There are eight types of questionnaires, three for receiving countries and four for sendingcountries (see Table 3.1). In Senegal, an additional individual questionnaire - essentially amuch shorter version of the other individual questionnaires - was designed for co-wivesexcept the first wife. Pilot testing had revealed that the information acquired from such co-wives tended to be more or less a repetition of the information provided by the first wife (thiswas influenced by the fact that wives could normally only be interviewed in the presence ofother family members). The individual questionnaires are largely identical except forappropriate variations in wording and inclusion or exclusion of some of the questionsdepending on the type of respondent (current migrant, return migrant, non-migrant), or on thetype of country (sending or receiving). However, the non-migrant questionnaire for receivingcountries differs from the others in that it includes only two modules (E and F, see Table 3.2below).
Individual questionnaires were applied depending on the classification of the person, ratherthan the household. For instance, non-migrant questionnaires were administered not only tomembers of non-migrant households (in the sending countries), but also to non-migrants inmigrant households.
The household section of the questionnaires contains four modules, and the individualquestionnaires are divided into ten modules (see Table 3.2). Depending on the type ofrespondent, shorter or longer versions of the individual questionnaire were used.

Push and pull factors of international migration: a comparative report
19
Table 3.1 Types of questionnaires for the household and individual surveys
Household questionnaires1 Sending countries2 Receiving countries
Individual questionnaires*3 Non-migrant, sending countries 4 Return migrant, sending countries5 Current migrant, sending countries6 Current migrant, receiving countries7 Non-migrant, receiving countries8 Co-wives (Senegal only)
* Questionnaires 3-6 each consist of a long and a short version. Long versions are asked from MMAs inrecent migrant households and from reference persons in non-migrant households only.
Table 3.2 Topics covered in the household and individual surveys
Household modulesA Household rosterB Information about living quarters and housing conditionsC Economic conditions of the householdD Remittances
Individual modulesE Social and demographic characteristics and social interaction (and integration)F Information about workG Migration historyH Household composition in country of origin before the last migrationJ Economic situation before the last migrationK Motives for move(s) abroadL Information about the last/current destinationM Migration networks and assistanceN Experiences at destinationP Intentions for future migration
In the household roster (module A) the usual information on each individual member of thehousehold (year and month of birth, sex, relationship to head of household, etc.) wascollected from the economic head of household (or, in his/her absence, another member ofthe household best qualified to respond). The household roster was also used to identify theeligibility of household members for individual questionnaires.
In the three remaining modules of the household questionnaire (modules B through D), thehead of household was then asked questions on housing conditions, on economic conditionsand assets of the household, and on its perceived financial/economic position relative to otherhouseholds, as well as questions about remittances received from abroad, and the usesthese were put to. Any adult aged 18-65 years qualified for individual interviewing, either as a currentinternational migrant, as a return international migrant, or as a non-international migrant or anon-migrant. However, only MMAs received a so-called migrant long list (modules E throughP), while reference persons in non-migrant households received the non-migrant long list(modules E through J and module P). All others eligible for interviewing received a short listonly (modules E, F, G and P; for non-migrants in receiving countries modules E and F only).However, in order to reduce the interview burden, in a sub-sample of households in Moroccoand Senegal, short-list interviewing was replaced by a more limited series of questionsappended to the household roster (see Appendix 10.1).

Push and pull factors of international migration: a comparative report
20
If eligible household members were not available for an individual interview, direct questioningwas substituted - if possible - by interviews with proxy persons. Proxies were allowed forcurrent migrants (including MMAs) in sending countries, but not for return migrant MMAs, whoalways had to be interviewed in person. In the event that proxies had to be used, questionson attitudes and opinions, as well as certain questions on migrant experience abroad weredropped.
Module E includes questions on marital status and number of children, both at the time of theinterview and, if applicable, at the time of (last) migration; on literacy, level of education andlanguages spoken; on the country of residence of parents and siblings; on attitudes towardsgender roles, partly in relation to migration, and on participation in organisations.
Module F asks questions about work, unemployment and benefits, and includes a number ofattitudinal questions about planning for the future, partly in relation to migration issues.
Module G contains the person’s migration history (all places where he/she has lived a year orlonger), including timing or duration, and overall reasons for leaving each place. A fewquestions to assess the importance of seasonal migration are included in this module as well.
All the modules reserved for detailed questioning on migration (modules H through N) focus onthe situation surrounding the last migration from the country of origin. The last rather than thefirst migration was chosen both to minimise the risks of recall lapse, and because of theproject’s interest in recent migration.
A small but important part of the individual questionnaires are modules H and J, where theMMA was asked about household composition prior to (last) migration and about his/heremployment situation at the time, including an assessment of relative deprivation. Theanswers to these questions should facilitate analysis of the determinants of migration, incomparison with non-migrant households. Therefore, the reference person in non-migranthouseholds was asked a comparable series of questions: in this case, the reference periodwas taken as five years prior to the interview, that is, halfway the reference period of tenyears for recent migrants.
Module K asks about the MMA’s motives to migrate, that is, reasons to leave the country oforigin and the reasons to choose a particular country of destination. In addition, motives forreturn migration are investigated. The questions in this module thus deal with the person’sown motives rather than with the formal reason for admission to a country. Finally, the moduleincludes questions on family reunification.
The short module L tries to capture the (perceived) information a migrant had on a number ofissues relating to the last or current country of destination at the time of migration, the sourcesof information, and the role such information may have played in the decision about migrationto that country.
Module M focuses entirely on migrants’ networks, and the role they played, according to therespondent, in facilitating - or not - the process of migration, either for him/herself, or forrelatives and/or friends. The module also asks questions about formal reasons for admission,undocumented migration, routes travelled, and resources used to pay for migration, etc.
The last MMA module (N) contains a series of questions on work experience in the country ofdestination, and some questions on citizenship, naturalisation, and ethnic identity.
Push and pull factors of international migration: a comparative report
21
Module P asks questions about people’s intentions regarding future migration and, if there aresuch intentions, to what extent their plans have materialised. Again, there are severalattitudinal and opinion questions on the possibility to improve one’s life by migrating and onrespect for migrants in the community. The module ends with a question on income,categorised in most countries.
In some of the participating countries, qualitative fieldwork formed part of the study. In theGhanaian study, focus group discussions were organised to investigate people’s perceptionsof and experiences with international migration. Furthermore, because it was feared that inEgypt it would be hard to find households with migrants to European countries, the originalplan was to carry out a small airport survey, in which Egyptians returning from Italy would befollowed-up and interviewed. During the screening operation in Egypt, however, it turned outthat in one of the screened villages a significant number of households had migrant membersliving in Italy. It was decided to replace the airport survey with a case study of this village, anda few surrounding villages with the same migration-destination pattern, including bothhouseholds with migrants to Italy and other households.
3.2.2 Macro-levelThe objective of the macro-level questionnaire is to provide information about the contextual orstructural aspects of people’s environments - both in the countries of origin and in thecountries of destination - that influence their choices and possibilities to migrate.
Three levels of observation are distinguished, with a view to incorporating the variousdeterminants contained in the environment: the local (or community) level, the regional leveland the national level. The survey incorporates a time dimension by collecting contextualinformation for three points within the past ten years, to assess the particular situation at thetime when decisions with regard to migration (or non-migration) were made. For each of thelevels, broad guidelines were developed, consisting of core (high-priority) and supplementary(low-priority) questionnaires. It was expected that not all information would be available in allcountries and at all levels, and that part of the information collected would be of a qualitativenature, or would take the form of estimates.
The macro-level survey predominantly relies on existing and written data (of either aquantitative or a qualitative nature), although at the community level primary data collection bymeans of interviews with key informants is usually required. Administrative records,censuses and surveys, central data banks, international, national and regional organisationsas well as research publications constitute the major data sources. Therefore, no fixed formathas been prescribed for data collection, although preferred formats and definitions areincorporated in the guidelines.
Tables 3.3 and 3.4 list the topics covered in the macro-level surveys for sending andreceiving countries, respectively. In the sending countries, information was collected at thenational and/or regional level on demographic and health indicators (population compositionand growth, mortality and fertility levels, child health, migration, etc.), economic indicators(GDP, debt, inflation and interest rates, remittances, market prices for cash crops, wagelevels, income distribution, etc.), development indicators (such as health and utility services,government expenditure in certain sectors, transportation and communication infrastructure,existence of a system of social security), and on employment structure and unemployment,education, presence of development and economic restructuring programmes, gender-specific aspects of access to and control over resources, etc. Furthermore, the ethnic,linguistic and/or religious composition of the population was assessed. Geographical aspects,such as arable land, topography and seasonal fluctuations in, for example, rainfall weredescribed. An important place was reserved for legislation in several fields (includinginheritance and migration), and for potentially relevant political aspects, such as the type ofgovernment, the human rights situation, international relations, etc.

Push and pull factors of international migration: a comparative report
22
Table 3.3 Topics covered in the macro-level survey for sending countries
National and regional levelA Population, health and migrationB Macro-economic and social indicatorsC Socio-cultural aspectsD Indicators of modernisation and developmentE Legislation and political aspects (national level only)F Geographical aspects
Community levelA Population, health and migrationB Social and economic aspectsC Socio-cultural aspectsD Availability of services and facilities in the communityE Geographical and physical aspects
Table 3.4 Topics covered in the macro-level survey for receiving countries
National and regional levelA Migration issues (including statistics and policy-related aspects)B Macro-economic indicatorsC Social and demographic aspects
Community levelA Population and migrationB Economic aspectsC Social aspects and living environment
Several of the national and/or regional indicators are relevant at the local level too (e.g.,migration situation, health aspects, employment structure and wage levels, presence ofdevelopment projects, educational attainment, ethnic composition, local inheritance customs,local interest rates, etc.). In addition, the presence in the community of various facilities isrecorded, as well as information on communication and transportation structures and travelcosts, on the local agricultural situation including changes in production and technology, anynatural disasters, and pollution problems.
Macro-level data collection in the receiving countries stresses the importance of rules andregulations concerning admission and integration, the presence of migrant populations fromspecific countries of origin, feelings of the native population towards immigration andimmigrants; as well as economic indicators, including employment structure, wage levels, theneed for seasonal labour, unemployment levels, presence of migrant organisations, trade andinvestments abroad, etc. At the local level, housing conditions were recorded as well.
3.3 Sample designs
To develop appropriate sample designs in each country that participated in the InternationalMigration Survey project (IMS), at least three constraints must be adequately accounted for inthe designs.
• Recognition of the fact that migration is a chain process, whereby migrants tend tooriginate from specific places and, once they have migrated, tend to concentrate inspecific places. Thus, from a theoretical point of view, it is important to collect data thatfacilitate meaningful analysis of the migration process within the context of particulargeographical areas. Therefore, sampling procedures must ensure that a sufficient numberof households are sampled in particular geographical areas, rather than to scatter thesample nation-wide.
Push and pull factors of international migration: a comparative report
23
• The manner in which international migrants can be located and sampled in sufficientnumbers as they tend to be - very - rare elements in a country’s total population.
• How to overcome, in an efficient and cost-effective manner, the lack of sampling framesand of information on the geographical distribution of international migrants. In this respect,nationally representative sample surveys will place a heavy burden on available financialresources because national-level sampling frames would need to be constructed.Moreover, the financing of the implementation and logistic management of nation-wide fieldsurveys is very costly.
These constraints are recognised in all country-specific sample designs. In the sendingcountries, teams were advised to purposively identify four regions4 by using a combination ofthe following criteria: (1) a relatively high versus a relatively low level of economicdevelopment, and (2) an established versus a recent migration history, thus allowing for thestudy of different types of migration flows under different economic conditions. The focus insending countries was on the sampling of migrants to any international destination as well asnon-migrants, and in each of the four types of regions that were deduced from these criteria,independent multistage stratified disproportionate probability sampling took place to sample thistarget population for the survey. The statistical aim was to generate survey data that arerepresentative at the level of these regions. To avoid misunderstandings regarding thereference population for which survey results are representative, the concept of ‘region’requires clarification. In most countries where surveys were carried out, a region is anartificial construct and is created by purposively selecting a number of geographical oradministrative areas for which it is known or expected that the areas contain relatively highproportions of migrant households. Such areas can be, for instance, existing provinces orvoting districts, which may each consist of smaller geographical or administrative units.Moreover, a region that is constructed in this way may contain areas that are not necessarilycontiguous and they can be made up of one or more of such areas.
In the receiving countries the aforementioned regionalisation was not explicitly taken intoaccount into the sample designs. In fact, the a priori objective was to generate survey resultsthat are representative at the level of the country as a whole. Moreover, the focus inreceiving countries was on the sampling of immigrants from two particular immigrant groups.Immigrants that originate from other countries as well as natives were excluded. In thesecountries, sample designs faced particular problems: (1) the target population is even more‘rare’; (2) an unknown but expected large number of immigrants reside illegally in thesecountries. Despite these differences between sending and receiving countries, sampledesigns have a number of features in common.
• All designs attempted to use available quantitative and qualitative information to developsample designs that sample the target population in sufficient numbers. Among others,information sources that were consulted are recent censuses, household surveys and theexpert opinion of key informants.
• Households or individuals were only sampled after multiple sampling stages had beencarried out; that is, they were sampled after certain geographical and/or administrativeareas had been sampled at different levels of spatial aggregation; for instance, thesampling of villages within districts, and of districts within provinces.
• A screening and stratification stage in the penultimate sampling stage was included in mostdesigns. Prior to the sampling of households, large-scale screening operations werecarried out in the fieldwork areas which were sampled in this penultimate stage. With thehelp of a short screening questionnaire, questions were asked in households in fieldworkareas that made it possible to minimally assign to the household a status of ‘recent migranthousehold’ or ‘other household’. In most countries, the screening resulted in a stratificationthat was more detailed in the sense that the group of ‘recent migrant households’ wasfurther subdivided into ‘recent current migrant households’ and ‘recent return migranthouseholds’, while the category of ‘other households’ was further subdivided into ‘non-recent migrant households’ and ‘non-migrant households’.
4 With the exception of Senegal, where only two regions were selected.
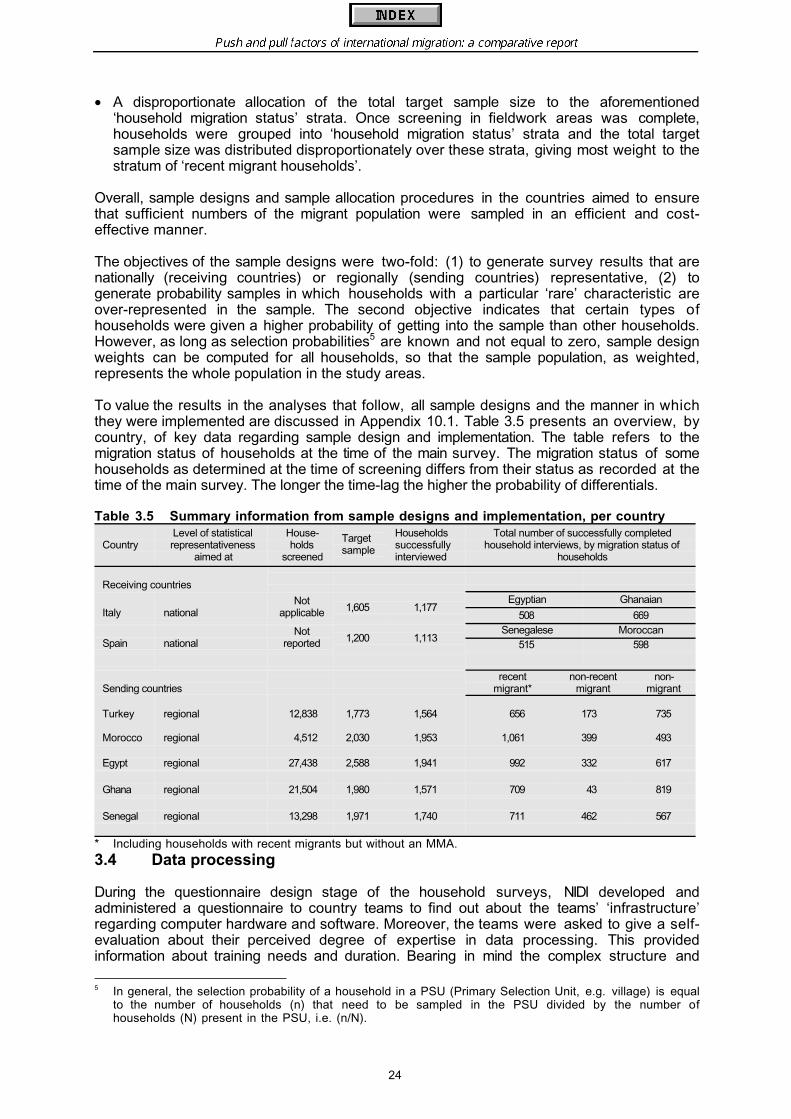
Push and pull factors of international migration: a comparative report
24
• A disproportionate allocation of the total target sample size to the aforementioned‘household migration status’ strata. Once screening in fieldwork areas was complete,households were grouped into ‘household migration status’ strata and the total targetsample size was distributed disproportionately over these strata, giving most weight to thestratum of ‘recent migrant households’.
Overall, sample designs and sample allocation procedures in the countries aimed to ensurethat sufficient numbers of the migrant population were sampled in an efficient and cost-effective manner.
The objectives of the sample designs were two-fold: (1) to generate survey results that arenationally (receiving countries) or regionally (sending countries) representative, (2) togenerate probability samples in which households with a particular ‘rare’ characteristic areover-represented in the sample. The second objective indicates that certain types ofhouseholds were given a higher probability of getting into the sample than other households.However, as long as selection probabilities5 are known and not equal to zero, sample designweights can be computed for all households, so that the sample population, as weighted,represents the whole population in the study areas.
To value the results in the analyses that follow, all sample designs and the manner in whichthey were implemented are discussed in Appendix 10.1. Table 3.5 presents an overview, bycountry, of key data regarding sample design and implementation. The table refers to themigration status of households at the time of the main survey. The migration status of somehouseholds as determined at the time of screening differs from their status as recorded at thetime of the main survey. The longer the time-lag the higher the probability of differentials.
Table 3.5 Summary information from sample designs and implementation, per country
CountryLevel of statisticalrepresentativeness
aimed at
House-holds
screened
Targetsample
Householdssuccessfullyinterviewed
Total number of successfully completedhousehold interviews, by migration status of
households
Receiving countriesEgyptian Ghanaian
Italy nationalNot
applicable 1,605 1,177508 669
Senegalese MoroccanSpain national
Notreported 1,200 1,113
515 598
Sending countriesrecent
migrant*non-recent
migrantnon-
migrant
Turkey regional 12,838 1,773 1,564 656 173 735
Morocco regional 4,512 2,030 1,953 1,061 399 493
Egypt regional 27,438 2,588 1,941 992 332 617
Ghana regional 21,504 1,980 1,571 709 43 819
Senegal regional 13,298 1,971 1,740 711 462 567
* Including households with recent migrants but without an MMA.
3.4 Data processing
During the questionnaire design stage of the household surveys, NIDI developed andadministered a questionnaire to country teams to find out about the teams’ ‘infrastructure’regarding computer hardware and software. Moreover, the teams were asked to give a self-evaluation about their perceived degree of expertise in data processing. This providedinformation about training needs and duration. Bearing in mind the complex structure and
5 In general, the selection probability of a household in a PSU (Primary Selection Unit, e.g. village) is equal
to the number of households (n) that need to be sampled in the PSU divided by the number ofhouseholds (N) present in the PSU, i.e. (n/N).
Push and pull factors of international migration: a comparative report
25
selection procedures for field data collection, the country teams were requested to give theirsupport to NIDI for the development of an integrated data-processing strategy for all countrysurveys. All countries supported the initiative.
To arrive at an appropriate integrated data-processing strategy some important prerequisitesand assumptions had to be met:
• access to a fairly reliable Internet email connection for the sending and receiving ofupdates of most recent versions of data-entry programmes and of data files;
• agreement on and use of a data-entry programme, to be designed by NIDI, to processquestionnaire data in a standardised manner;
• implementation of a set of data-editing and file creation procedures, formulated by NIDI, tocreate a set of country-specific databases that have plausible and consistent data.
To facilitate comparative analyses of IMS data from the household sample surveys in theseven countries, it was necessary to strive for standardisation of database design and fileformat (see Appendix 10.2). It was decided to use the ISSA software as the instrument todevelop a common database definition and concomitant set of country specific data-entryprogrammes. Due to user-friendly data-entry programmes, training of data-entry staff couldbe short. More specifically, during a typical data-entry session, a set of data-entry screensthat mimics the layout of the questionnaire was presented to data-entry staff. All data thatwere entered and pertained to the same household were scrutinised by means of range andconsistency checks. The latter compared data that were entered in different parts ofquestionnaire(s), in household-level as well as individual-level questionnaires, to ensure thatplausible and consistent sets of data were entered into the database. If the data-entryprogramme detected an inconsistency, the data-entry typist was confronted with an errormessage on the screen that provided exact information about what the error was. Dependingon the error message, data entry was blocked until the error was resolved. Also, during dataentry of answers to questions in the household roster, data-entry programmes determined theinternational migration status of household members and that of the entire household. Thisinformation was used, among other things, to present to data-entry staff only those data-entry screens that were ‘applicable’. A large number of built-in data-entry verificationinstructions slowed data entry but ensured that, after completion of data-entry, a country-specific database contained a set of plausible and consistent data. Also, it ensured that in allcountries data were entered and scrutinised in an identical manner.
All country data sets conform to the Standard Recode File format (United Nations, 1993). ISSAsoftware (Integrated System for Survey Analysis) has been developed by the Institute ofResource Development at Macro International Inc. for the Demographic and Health SurveysProject (DHS). The software is used, among other things, to process data of ECE/UNFPA-funded Fertility and Family Surveys (FFS) in countries of the ECE region. Although ISSAsoftware can be used to serve many data-processing tasks, it is mainly used for the designof a stand-alone run-time version of a data-entry programme and for interactive and batchediting operations.
Push and pull factors of international migration: a comparative report
26
Once an edited country-specific ISSA database had been created, a number of sub-setdatabases were generated that could be read by SPSS statistical software (SPSS, StatisticalPackage for the Social Sciences). These SPSS sub-set databases were used to carry outanalyses for country reports and the comparative report.
Database design, including the development of a user-friendly data-entry interface, wenthand in hand with questionnaire design. In a number of cases, after a country-specific ISSAdata-entry application was developed, a NIDI staff member visited the country or a country-team member visited NIDI, to test and train country-team members in data-processingprocedures and the proper use of the data-entry application. Following this training, teamswere also provided with technical backstopping to support local data-processing activities.Although there has been considerable variation in the timing and manner of implementation ofthe procedures set by NIDI, eventually country-specific databases were produced thatcontained plausible and consistent data in each participating country.
3.5 Conclusions: some strengths and limitations
Specialised migration surveys offer a unique opportunity to study the determinants ofmigration, as many earlier surveys have shown. The advantage of the current approach isthat the surveys were carried out in several countries, both at the sending and at thereceiving end, in more or less the same period, and that comparable survey instruments wereused. Furthermore, particular attention has been paid to sampling procedures, in an effort toadhere to rules of probability sampling and to find the migrant needles in the haystack.
Surveys were carried out in fewer receiving countries than originally intended, however (dueto budgetary constraints), limiting to some extent the comparative analyses that may becarried out.
The study was carried out in relatively stable countries, without explosive civil conflicts orextreme political upheaval. The type of project - surveys requiring a relatively long time ofpreparation - could not have been carried out in situations generating refugee flows and,therefore, such forced movements have been excluded from the study. This does not imply,however, that the phenomenon of asylum migration has been totally excluded, too, althoughperhaps only the margins overlapping with economic flight are touched upon.
Regional rather then nationally representative sample designs were opted for, particularly inthe sending countries, for both substantive and practical reasons: (1) the conceptualisation ofmigration as a chain process; and (2) given the lack of appropriate sampling frames, the highcost and time-consuming nature of preparing and implementing probability samples.
The sampling objective was that samples must generate survey results that arerepresentative for the population at the level of the region. However, the concept of ‘region’means something different in different countries and this has implications for the geographicalarea and population for which the survey results are representative. In most countries, whatis referred to as a ‘region’, must be interpreted as a geographical area that consists of anumber of non-adjacent administrative spatial units (e.g., provinces, districts). This requiresclarification. In Turkey, Egypt, Morocco, Senegal, and Spain, smaller-size spatial sub-units(sub-districts, census blocks, election areas) were randomly sampled within such regions bythe rules of probability sampling, often through multiple stages. Thus, survey results arerepresentative for the population that live in the geographical area defined as ‘region’. InGhana, within each identified region, a number of voting districts were identified using key-informant information and, within these, one election area was selected. This approachyielded survey results are, statistically speaking, not representative for the population in theidentified regions, but only for the populations that live in the selected election areas, whichare much smaller than the regions as a whole. Although the original objective in Spain was togenerate nationally representative survey results, various implementation problems made theresults partially representative for a number of provinces. In Italy, an unconventional but
Push and pull factors of international migration: a comparative report
27
innovative sampling approach resulted in survey results that are representative for the eightprovinces in northern and central Italy in which, according to official statistics, about 80 percent of Egyptian and 35 per cent of Ghanaian immigrants are living.
Surveys carried out in sending countries suffer from two problems. First, households thathave migrated as a whole are excluded, and to that extent the study of the determinants ofmigration is biased. Secondly, in households with migrants who are currently abroad, proxypersons have to supply information on the absent person. This implies that any questions onattitudes or opinions cannot be asked. In addition, proxies are likely to have difficulties inanswering questions dealing with the migrants’ experiences abroad. In cases where thoseleft behind have little knowledge of their relatives’ experiences and/or whereabouts (forinstance, if migrants are in an irregular situation, and/or have not yet had a chance tocommunicate with home, or if those left behind have no formal education and no experienceof life outside their own community), proxy information can be of poor quality, despite aproxy’s best intentions.
Surveys in the receiving countries necessarily include only those migrants who chose tomigrate there, while those who opted for other destinations, those who have returned and,especially, a control group of people who chose not to migrate are excluded. Therefore,surveys at destination have the advantage of collecting first-hand information from migrants,but are limited in the extent to which they can provide insight into the determinants ofmigration.
In the preparatory stages of the project, considerable thought was given to defining the keyconcepts, in particular the concepts of household, migration and the identification of keyrespondents in the household. In practice, it was perhaps hardest to formulate definitions ofthe household that were easily applicable in any cultural setting and that incorporated themigration context (including both the ‘usual’ household and the shadow household).
The screening operations may have resulted in some underreporting of migrants inhouseholds, to the extent that households considered it wiser to hide the fact that someonehad migrated. Country teams that managed to obtain the co-operation of the authorities, keyrepresentatives, and through them individual respondents, are likely to have been mostsuccessful in combating this problem.
The main fieldwork was carried out between the summer of 1996 (Turkey) and the winter of1997/1998 (Senegal). Therefore, there was no complete simultaneity. Although this isexpected to have some effect on comparability between countries, the effect will probably belimited, as the goal of the project is to study determinants, rather than to measure flows over aspecified period. The effect of non-simultaneity of surveys in eight West African countries(see Section 2.3) was thought to be minimal, according to Bocquier and Traoré (1998),although the time variation in that case was only nine months.
As international migration is perceived to be a sensitive topic in many of the participatingcountries, teams spent a considerable amount of time and effort ensuring good co-operationfrom the authorities and in the field. Most country teams reported that fieldwork wasinfluenced by the sensitive nature of the topic. In sending countries, for instance, somerespondents feared that due to the answers they gave, their relatives abroad would run therisk of being sent back (Morocco, Senegal, and Ghana especially); or that they would betaxed for the income received from migrants. As expected, the problem was more serious insituations characterised by undocumented migration. Again, working to achieve co-operationand confidence in the field appeared to be of crucial importance.
Some problems with dating of events are expected, as in any survey, although the importanceof migration in someone’s life indicates that answers are not necessarily lacking in precision,perhaps with the exception of proxy responses. It will in any case be important to study theinfluence of proxy respondents on the survey results. First, interviewing proxies obviouslyprecludes any of the survey questions on attitudes and opinions. Secondly, relatives in the
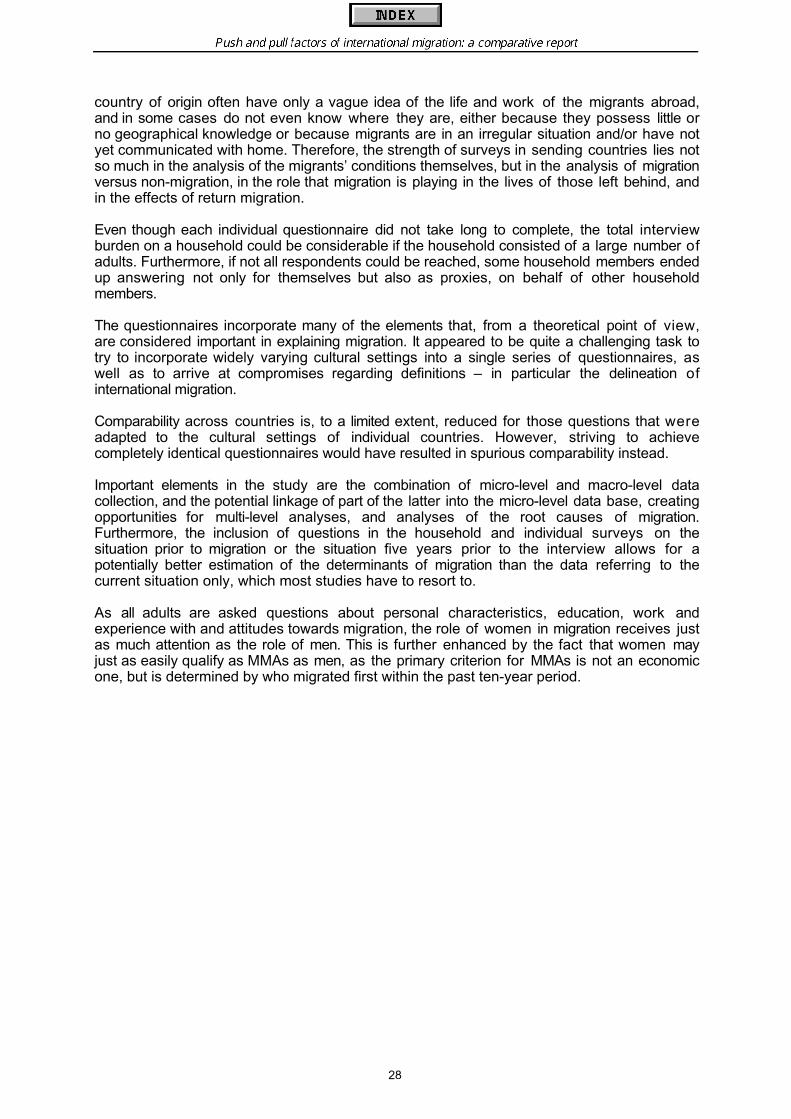
Push and pull factors of international migration: a comparative report
28
country of origin often have only a vague idea of the life and work of the migrants abroad,and in some cases do not even know where they are, either because they possess little orno geographical knowledge or because migrants are in an irregular situation and/or have notyet communicated with home. Therefore, the strength of surveys in sending countries lies notso much in the analysis of the migrants’ conditions themselves, but in the analysis of migrationversus non-migration, in the role that migration is playing in the lives of those left behind, andin the effects of return migration.
Even though each individual questionnaire did not take long to complete, the total interviewburden on a household could be considerable if the household consisted of a large number ofadults. Furthermore, if not all respondents could be reached, some household members endedup answering not only for themselves but also as proxies, on behalf of other householdmembers.
The questionnaires incorporate many of the elements that, from a theoretical point of view,are considered important in explaining migration. It appeared to be quite a challenging task totry to incorporate widely varying cultural settings into a single series of questionnaires, aswell as to arrive at compromises regarding definitions – in particular the delineation ofinternational migration.
Comparability across countries is, to a limited extent, reduced for those questions that wereadapted to the cultural settings of individual countries. However, striving to achievecompletely identical questionnaires would have resulted in spurious comparability instead.
Important elements in the study are the combination of micro-level and macro-level datacollection, and the potential linkage of part of the latter into the micro-level data base, creatingopportunities for multi-level analyses, and analyses of the root causes of migration.Furthermore, the inclusion of questions in the household and individual surveys on thesituation prior to migration or the situation five years prior to the interview allows for apotentially better estimation of the determinants of migration than the data referring to thecurrent situation only, which most studies have to resort to.
As all adults are asked questions about personal characteristics, education, work andexperience with and attitudes towards migration, the role of women in migration receives justas much attention as the role of men. This is further enhanced by the fact that women mayjust as easily qualify as MMAs as men, as the primary criterion for MMAs is not an economicone, but is determined by who migrated first within the past ten-year period.

Push and pull factors of international migration: a comparative report
29
4. CHARACTERISTICS OF THE SURVEY COUNTRIES
4.1 Introduction
In the following sections a brief description of the demographic and economic situation in eachof the seven survey countries will be presented. Attention will be focused on populationgrowth and composition, fertility, mortality and migration from a demographic point of view. Inaddition, some health indicators will be given for the five sending countries. Economic aspectswill be outlined by means of the development of the Gross Domestic Product (GDP) and thesituation in the labour market. For the receiving countries, Italy and Spain, as well as forTurkey, comparisons in this respect are made with the European Union as a whole. Economicconditions in the four remaining sending countries are compared with the ‘surveycounterparts’ (Italy for Egypt and Ghana, Spain for Morocco and Senegal).
Due to the limitations of data availability and reliability, not all topics could be adequatelydescribed for the countries concerned. Furthermore, for the same reasons, one should becareful in drawing conclusions.
4.2 Italy
On January 1st 1998, the total resident population of Italy was estimated at 57.6 million. Duringthe past few years the Italian population has experienced modest growth. This growth islargely due to net migration, while natural growth is negative (Figure 4.1).
The Italian fertility rate is one of the lowest in the world. The decline in fertility began in the1970s and differed greatly between regions. In southern Italy, the generational replacementwas guaranteed until the beginning of the 1980s, while in the rest of the country the decline infertility was much faster. The national total fertility rate (TFR) in 1995 is 1.18 children perwoman, the lowest figure ever registered in Italy.
Figure 4.1 Population change, 1985-1997, Italy
Source: Council of Europe, 1998.
0
10
20
30
40
50
60
1985 1988 1991 1994 1997
-1.0
0.0
1.0
2.0
3.0
4.0
5.0
Population size Natural increase per 1,000 Migration surplus per 1,000
millions per 1,000 average population
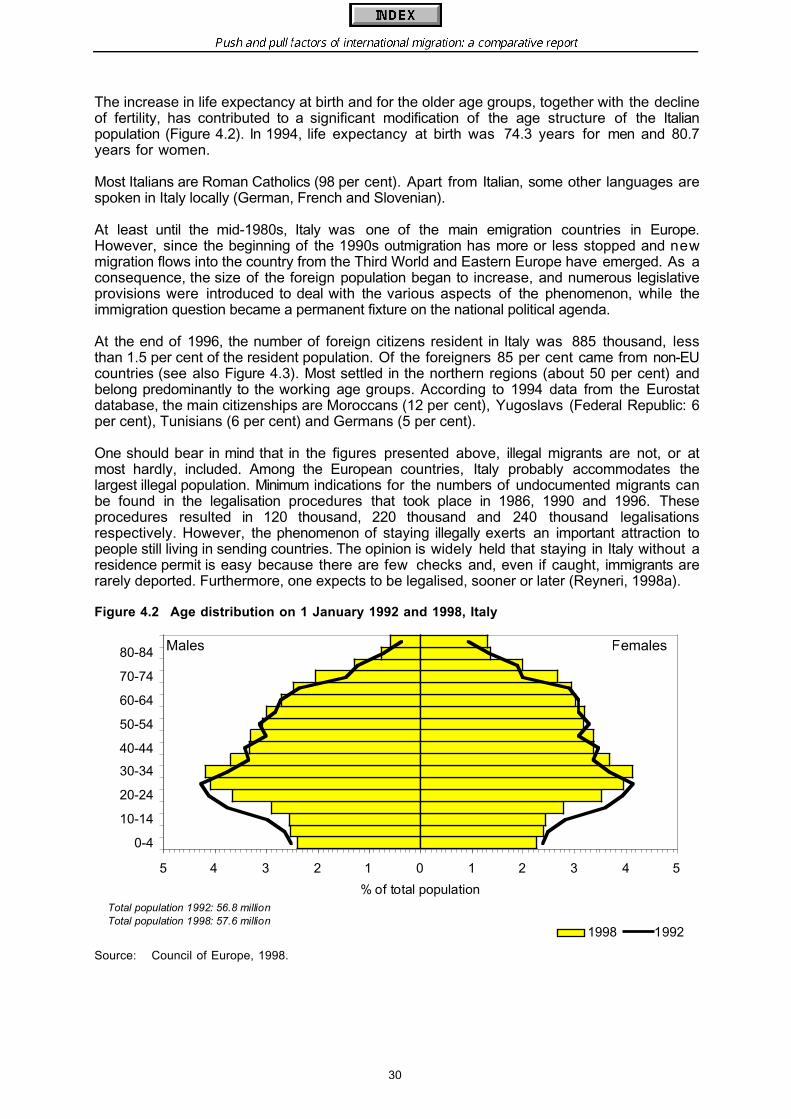
Push and pull factors of international migration: a comparative report
30
The increase in life expectancy at birth and for the older age groups, together with the declineof fertility, has contributed to a significant modification of the age structure of the Italianpopulation (Figure 4.2). In 1994, life expectancy at birth was 74.3 years for men and 80.7years for women.
Most Italians are Roman Catholics (98 per cent). Apart from Italian, some other languages arespoken in Italy locally (German, French and Slovenian).
At least until the mid-1980s, Italy was one of the main emigration countries in Europe.However, since the beginning of the 1990s outmigration has more or less stopped and newmigration flows into the country from the Third World and Eastern Europe have emerged. As aconsequence, the size of the foreign population began to increase, and numerous legislativeprovisions were introduced to deal with the various aspects of the phenomenon, while theimmigration question became a permanent fixture on the national political agenda.
At the end of 1996, the number of foreign citizens resident in Italy was 885 thousand, lessthan 1.5 per cent of the resident population. Of the foreigners 85 per cent came from non-EUcountries (see also Figure 4.3). Most settled in the northern regions (about 50 per cent) andbelong predominantly to the working age groups. According to 1994 data from the Eurostatdatabase, the main citizenships are Moroccans (12 per cent), Yugoslavs (Federal Republic: 6per cent), Tunisians (6 per cent) and Germans (5 per cent).
One should bear in mind that in the figures presented above, illegal migrants are not, or atmost hardly, included. Among the European countries, Italy probably accommodates thelargest illegal population. Minimum indications for the numbers of undocumented migrants canbe found in the legalisation procedures that took place in 1986, 1990 and 1996. Theseprocedures resulted in 120 thousand, 220 thousand and 240 thousand legalisationsrespectively. However, the phenomenon of staying illegally exerts an important attraction topeople still living in sending countries. The opinion is widely held that staying in Italy without aresidence permit is easy because there are few checks and, even if caught, immigrants arerarely deported. Furthermore, one expects to be legalised, sooner or later (Reyneri, 1998a).
Figure 4.2 Age distribution on 1 January 1992 and 1998, Italy
Source: Council of Europe, 1998.
5 4 3 2 1 0 1 2 3 4 5
0-4
10-14
20-24
30-34
40-44
50-54
60-64
70-74
80-84
% of total population
1998 1992
Males Females
Total population 1992: 56.8 millionTotal population 1998: 57.6 million
Push and pull factors of international migration: a comparative report
31
Figure 4.3 Foreign population in Italy, 1 January 1996
Source: Council of Europe, 1998.
The radical change in Italy’s role within the European migratory system was largely influencedby a series of profound transformations in the demographic, economic and socialcharacteristics of the country. As so often happens, demographic changes accurately reflectthis set of transformations. In fact, from a demographic point of view, in little more than 30years Italy has witnessed some extraordinary changes. There is no longer any demographiccharacteristic today that does not present values and trends that are diametrically opposed towhat was still happening in the 1960s. At that time, besides the economic boom, the countrywas also experiencing a baby boom of considerable proportions. Furthermore, Italy then wasstill one of the main suppliers of labour for the industrial systems of central and northernEurope, while internal south/north mobility reached its highest values in those years. In brief,the demographic challenge of that time was still that of trying to balance the relationshipbetween growth of the population and growth of resources, which was particularlyunbalanced in the south of the country.
From this situation - typical of a society in rapid transition from a basically agricultural and ruralsystem to an industrial and urban one - Italy passed very quickly to being a post-industrialsociety. Indeed, thirty years onwards, the continuous and decisive decline in the birth ratehas brought Italian fertility to the lowest levels in Europe. Now, the main demographic problemfaced is adjusting the social and economic structure of the country to the increased weight(both absolutely and relatively) of the elderly population.
Italy now appears to be participating fully in the stage of demographic change whichcharacterises post-industrial, developed societies, and which has been defined as thesecond demographic transition in order to differentiate it from the demographic system typicalof the industrial period. The characteristic features of this new demographic model are:
• a basic stability in population size;• an absolute and a relative increase in the size of the elderly population;• the development of different forms of family life;• an increase in immigration and internal mobility which is linked more to the cycle of family
life than to economic necessity and which is mainly directed outside the larger urbanagglomerations.
0 50 100 150 200 250 300
other
America
Asia
Africa
Europe
x 1,000Percentage of total population: 1.29
Egypt: 15 thousand; Ghana: 10 thousand

Push and pull factors of international migration: a comparative report
32
Within this framework of general development, the Italian situation has some particularfeatures, linked above all to the marked geographical differentiation in economic and socialterms between the north and the south of the country.
From an economic point of view, welfare per head of population in Italy equals more or lessthe average European Union level. Measured by means of the current exchange rates, theGross Domestic Product (GDP) per capita is somewhat lower than the EU average. Based onpurchasing power parities however, the per capita GDP is somewhat higher (Figure 4.4).
The changes in a country’s GDP can be seen as an overall indicator of economicdevelopment. From Figure 4.5 it appears that during the years 1985-1995 annual GDP growthin Italy was similar to that in the European Union as a whole (two per cent). However, in thefollowing years, the growth of Italian GDP remained below the EU average, indicating lessfavourable economic development.
Figure 4.4 GDP per capita in US dollars, 1997, Italy
Source: OECD, 1999.
Figure 4.5 Annual growth of real GDP, 1985-1997, Italy (%)
Source: OECD, 1998.
0
5,000
10,000
15,000
20,000
25,000
Based on current exchangerates
Based on current purchasingpower parities
Italy EU
0.0
1.0
2.0
3.0
1985-1995 1996 1997
Italy EU

Push and pull factors of international migration: a comparative report
33
Italy is considered a high unemployment country; its total unemployment rate is among thehighest in Europe (12 per cent in 1997). However; according to Figure 4.6 this conclusionaffects women much more than men.
This picture is confirmed by Figure 4.7, showing participation rates by sex and age. Italy hasan employment pattern unfavourable to women and young people living with their parents,while protecting men in their prime working ages and heads of households (Reyneri, 1998b).
At first sight, high unemployment seems to contradict high (illegal) immigration. However, acareful analysis of the Italian labour market shows that few Italians are in real competitionwith migrant workers. For the latter category, especially for the undocumented migrants, theso-called Italian underground economy exerts a special pull effect (Reyneri, 1998a).
Figure 4.6 Percentage unemployed in the labour force, 1997, Italy
Source: OECD, 1998.
Figure 4.7 Labour force participation by sex and age, 1997, Italy (%)
Source: OECD, 1998.
0
5
10
15
20
Men Women Total
Italy EU
0 20 40 60 80 100
Women: 55-64
Women: 25-54
Women: 15-24
Men: 55-64
Men: 25-54
Men: 15-24
Italy EU

Push and pull factors of international migration: a comparative report
34
4.3 Spain
At the beginning of 1998, the estimated population of Spain was 39.3 million inhabitants(Figure 4.8). Compared to the year before, this implies a population increase of only 0.13 percent. The main reason why the growth of the Spanish population is slowing down, is thediminishing natural increase as a consequence of the constant and considerable decline offertility since the late 1970s. Whereas in 1980 the total fertility rate was at replacement level(2.2), the constant decrease lowered it to 1.36 in 1990 and 1.15 in 1997 (Council of Europe,1998).
Fertility decline is also the main factor influencing the ageing of the population in Spain (seeFigure 4.9). The second important factor is the decrease in mortality. In 1994, life expectancyat birth was 74.4 years for men and 81.5 years for women.
Net (im)migration has been positive since 1991 but it has not yet attained sufficient impact tosignificantly influence the age structure. The recent positive net migratory balance is mainlydue to increasing numbers of immigrants from less developed countries in Africa, Asia andLatin America, as well as from other nations in the European Union (Hoggart and Lardiés,1996). According to official Spanish immigration data for 1996, most immigrants came fromMorocco, Germany, the United Kingdom and Peru.
The vast majority of Spaniards are Roman Catholic (99 per cent). Languages spoken in Spainare Castilian Spanish (74 per cent), Catalan (17 per cent), Galician (7 per cent) and Basque (2per cent; CIA Factbook, 1999).
At the beginning of 1998, the number of (legal) foreign citizens residing in Spain was 610thousand, 1.5 per cent of the total population. The main citizenships were Moroccans (18 percent), British (11 per cent) and Germans (8 per cent). Furthermore, citizens from theAmericas were more numerous than Asian citizens (see Figure 4.10).
Figure 4.8 Population change, 1985-1997, Spain
Source: Council of Europe, 1998.
0
10
20
30
40
50
1985 1988 1991 1994 1997
-1.0
0.0
1.0
2.0
3.0
4.0
Population size Natural increase per 1,000 Migration surplus per 1,000
millions per 1,000 average population
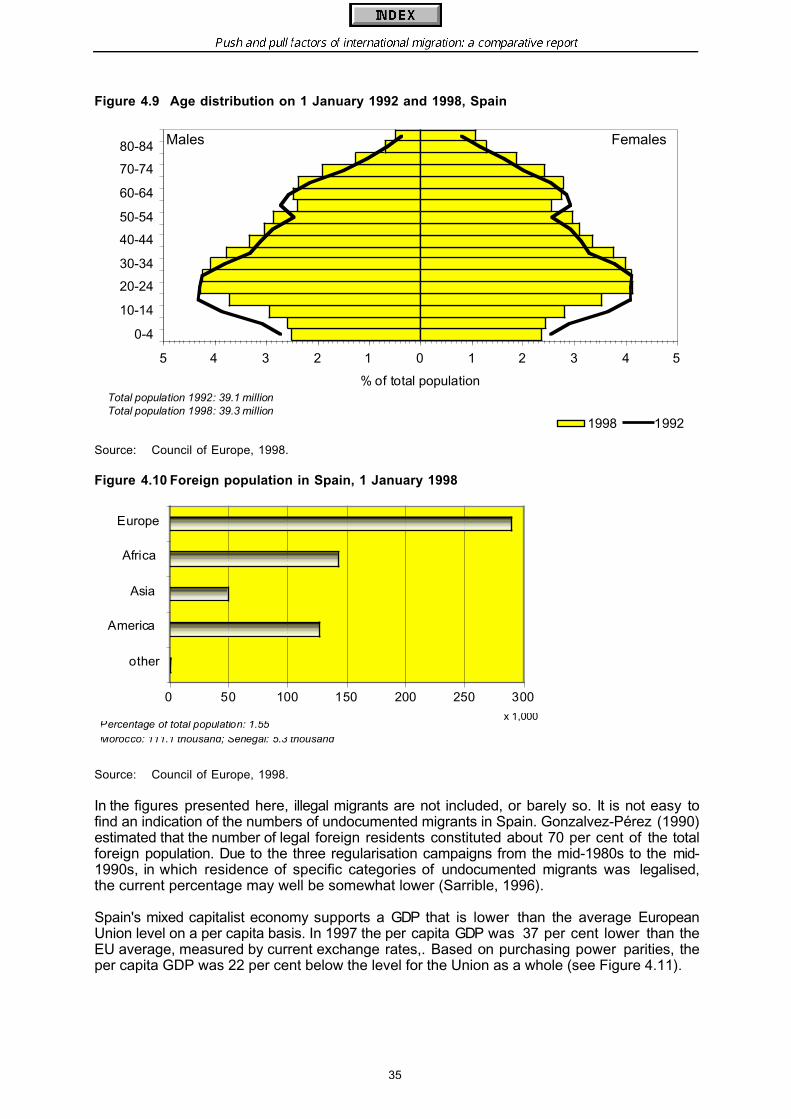
Push and pull factors of international migration: a comparative report
35
Figure 4.9 Age distribution on 1 January 1992 and 1998, Spain
Source: Council of Europe, 1998.
Figure 4.10 Foreign population in Spain, 1 January 1998
Source: Council of Europe, 1998.
In the figures presented here, illegal migrants are not included, or barely so. It is not easy tofind an indication of the numbers of undocumented migrants in Spain. Gonzalvez-Pérez (1990)estimated that the number of legal foreign residents constituted about 70 per cent of the totalforeign population. Due to the three regularisation campaigns from the mid-1980s to the mid-1990s, in which residence of specific categories of undocumented migrants was legalised,the current percentage may well be somewhat lower (Sarrible, 1996).
Spain's mixed capitalist economy supports a GDP that is lower than the average EuropeanUnion level on a per capita basis. In 1997 the per capita GDP was 37 per cent lower than theEU average, measured by current exchange rates,. Based on purchasing power parities, theper capita GDP was 22 per cent below the level for the Union as a whole (see Figure 4.11).
5 4 3 2 1 0 1 2 3 4 5
0-4
10-14
20-24
30-34
40-44
50-54
60-64
70-74
80-84
% of total population
1998 1992
Total population 1992: 39.1 millionTotal population 1998: 39.3 million
Males Females
0 50 100 150 200 250 300
other
America
Asia
Africa
Europe
x 1,000Percentage of total population: 1.55Morocco: 111.1 thousand; Senegal: 5.3 thousand

Push and pull factors of international migration: a comparative report
36
Figure 4.11 GDP per capita in US dollars, 1997, Spain
Source: OECD, 1999.
However, Figure 4.12 shows that Spain has been continuously reducing the difference in percapita GDP. This is due amongst other things to the ongoing liberalisation, privatisation andderegulation of the economy, and the introduction of some tax reforms to that end. For 1997,the annual growth rate of GDP was 3.4 against 2.6 for the Union as a whole. The prospectsfor the years to come are favourable too (OECD, 1997).
Nonetheless, unemployment, at 21 per cent, remains the highest in the EU. The government,for political reasons, has made only limited progress in changing labour laws or reformingpension schemes, which are the key to the sustainability of both Spain's internal economicadvances and its competitiveness in a single currency area (CIA Factbook, 1999).
According to Figure 4.13, unemployment affects women much more than men. However, thephenomenon of non-employment requires careful interpretation when drawing conclusionsabout economic welfare. In countries such as Spain and Italy, high non-employment rates canprobably be sustained since many unemployed and inactive individuals share a dwelling withsomeone in employment which softens the impact of unemployment on households (OECD,1998).
Figure 4.12 Annual growth of real GDP, 1985-1997, Spain (%)
Source: OECD, 1998.
0
5,000
10,000
15,000
20,000
25,000
Based on current exchangerates
Based on current purchasingpower parities
Spain EU
0.0
1.0
2.0
3.0
4.0
1985-1995 1996 1997
Spain EU
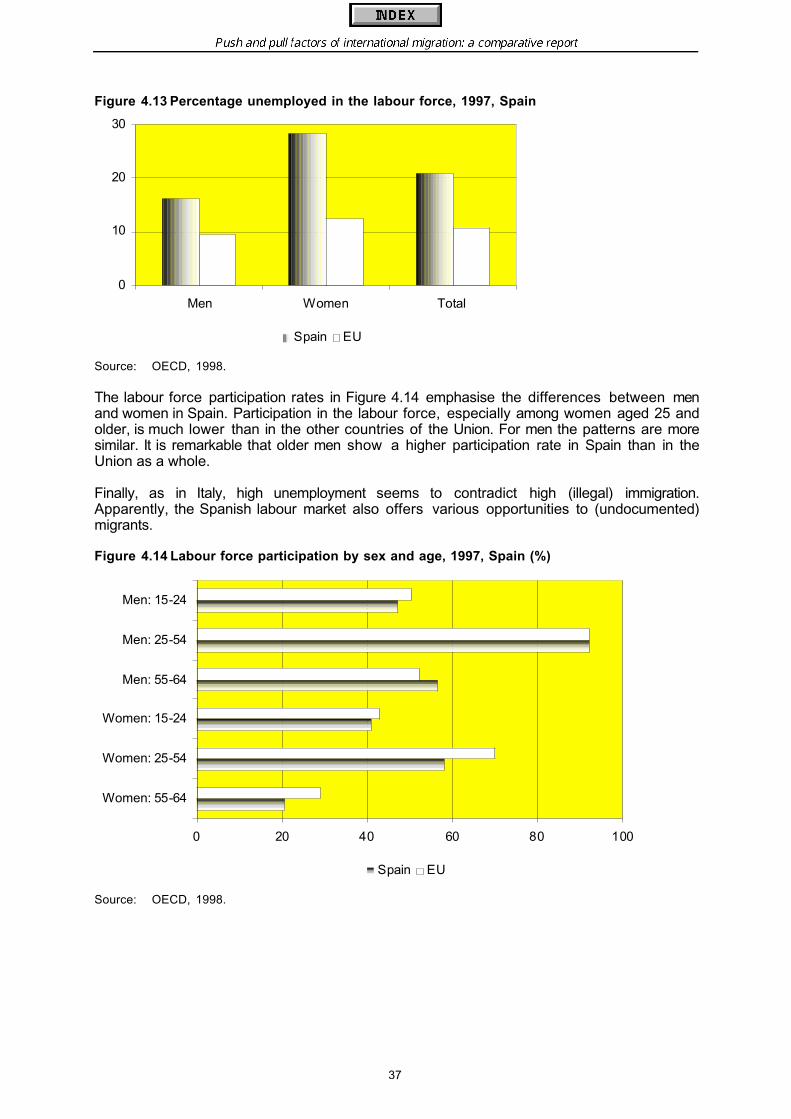
Push and pull factors of international migration: a comparative report
37
Figure 4.13 Percentage unemployed in the labour force, 1997, Spain
Source: OECD, 1998.
The labour force participation rates in Figure 4.14 emphasise the differences between menand women in Spain. Participation in the labour force, especially among women aged 25 andolder, is much lower than in the other countries of the Union. For men the patterns are moresimilar. It is remarkable that older men show a higher participation rate in Spain than in theUnion as a whole.
Finally, as in Italy, high unemployment seems to contradict high (illegal) immigration.Apparently, the Spanish labour market also offers various opportunities to (undocumented)migrants.
Figure 4.14 Labour force participation by sex and age, 1997, Spain (%)
Source: OECD, 1998.
0
10
20
30
Men Women Total
Spain EU
0 20 40 60 80 100
Women: 55-64
Women: 25-54
Women: 15-24
Men: 55-64
Men: 25-54
Men: 15-24
Spain EU
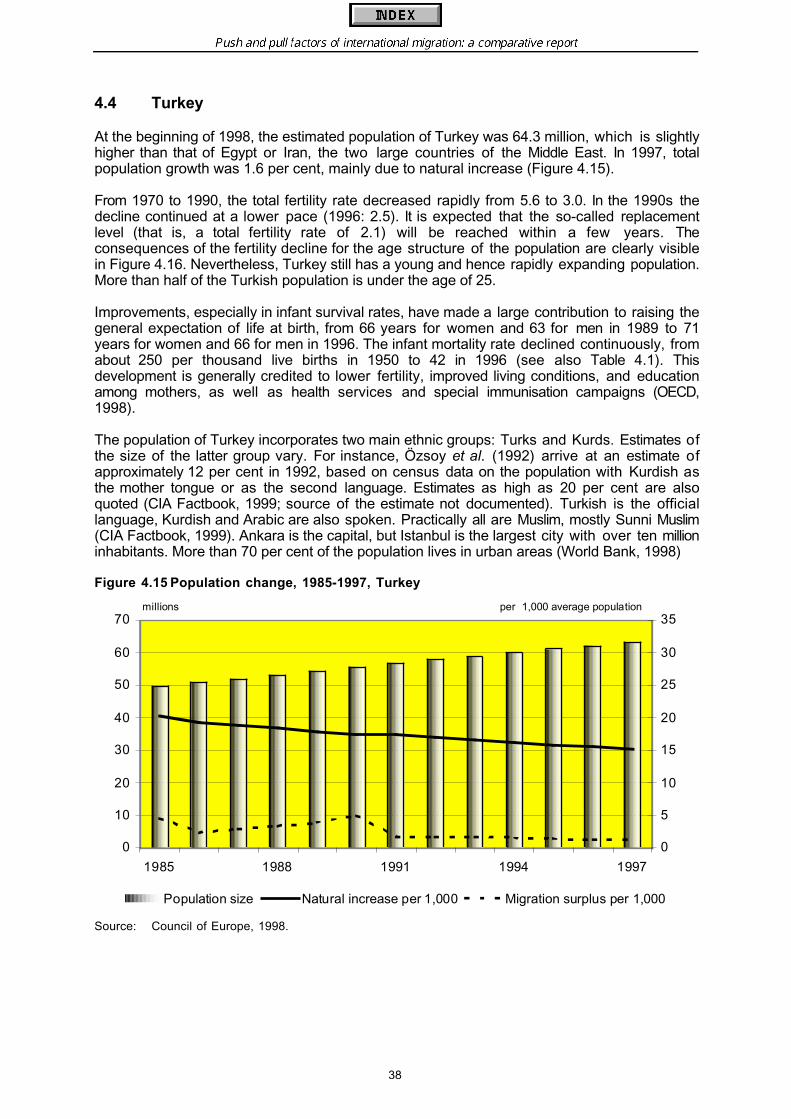
Push and pull factors of international migration: a comparative report
38
4.4 Turkey
At the beginning of 1998, the estimated population of Turkey was 64.3 million, which is slightlyhigher than that of Egypt or Iran, the two large countries of the Middle East. In 1997, totalpopulation growth was 1.6 per cent, mainly due to natural increase (Figure 4.15).
From 1970 to 1990, the total fertility rate decreased rapidly from 5.6 to 3.0. In the 1990s thedecline continued at a lower pace (1996: 2.5). It is expected that the so-called replacementlevel (that is, a total fertility rate of 2.1) will be reached within a few years. Theconsequences of the fertility decline for the age structure of the population are clearly visiblein Figure 4.16. Nevertheless, Turkey still has a young and hence rapidly expanding population.More than half of the Turkish population is under the age of 25.
Improvements, especially in infant survival rates, have made a large contribution to raising thegeneral expectation of life at birth, from 66 years for women and 63 for men in 1989 to 71years for women and 66 for men in 1996. The infant mortality rate declined continuously, fromabout 250 per thousand live births in 1950 to 42 in 1996 (see also Table 4.1). Thisdevelopment is generally credited to lower fertility, improved living conditions, and educationamong mothers, as well as health services and special immunisation campaigns (OECD,1998).
The population of Turkey incorporates two main ethnic groups: Turks and Kurds. Estimates ofthe size of the latter group vary. For instance, Özsoy et al. (1992) arrive at an estimate ofapproximately 12 per cent in 1992, based on census data on the population with Kurdish asthe mother tongue or as the second language. Estimates as high as 20 per cent are alsoquoted (CIA Factbook, 1999; source of the estimate not documented). Turkish is the officiallanguage, Kurdish and Arabic are also spoken. Practically all are Muslim, mostly Sunni Muslim(CIA Factbook, 1999). Ankara is the capital, but Istanbul is the largest city with over ten millioninhabitants. More than 70 per cent of the population lives in urban areas (World Bank, 1998)
Figure 4.15 Population change, 1985-1997, Turkey
Source: Council of Europe, 1998.
0
10
20
30
40
50
60
70
1985 1988 1991 1994 1997
0
5
10
15
20
25
30
35
Population size Natural increase per 1,000 Migration surplus per 1,000
millions per 1,000 average population
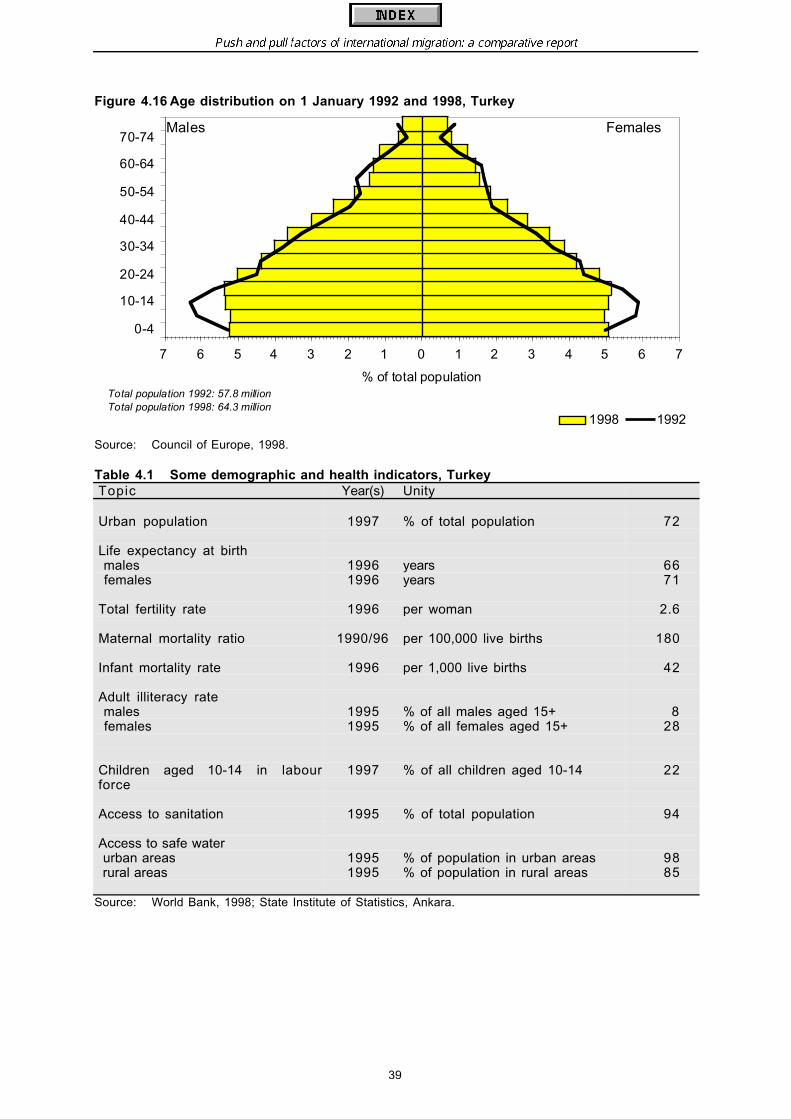
Push and pull factors of international migration: a comparative report
39
Figure 4.16 Age distribution on 1 January 1992 and 1998, Turkey
Source: Council of Europe, 1998.
Table 4.1 Some demographic and health indicators, TurkeyTopic Year(s) Unity
Urban population 1997 % of total population 72
Life expectancy at birth males 1996 years 66 females 1996 years 71
Total fertility rate 1996 per woman 2.6
Maternal mortality ratio 1990/96 per 100,000 live births 180
Infant mortality rate 1996 per 1,000 live births 42
Adult illiteracy rate males 1995 % of all males aged 15+ 8 females 1995 % of all females aged 15+ 28
Children aged 10-14 in labourforce
1997 % of all children aged 10-14 22
Access to sanitation 1995 % of total population 94
Access to safe water urban areas 1995 % of population in urban areas 98 rural areas 1995 % of population in rural areas 85
Source: World Bank, 1998; State Institute of Statistics, Ankara.
7 6 5 4 3 2 1 0 1 2 3 4 5 6 7
0-4
10-14
20-24
30-34
40-44
50-54
60-64
70-74
% of total population
1998 1992
Males Females
Total population 1992: 57.8 millionTotal population 1998: 64.3 million
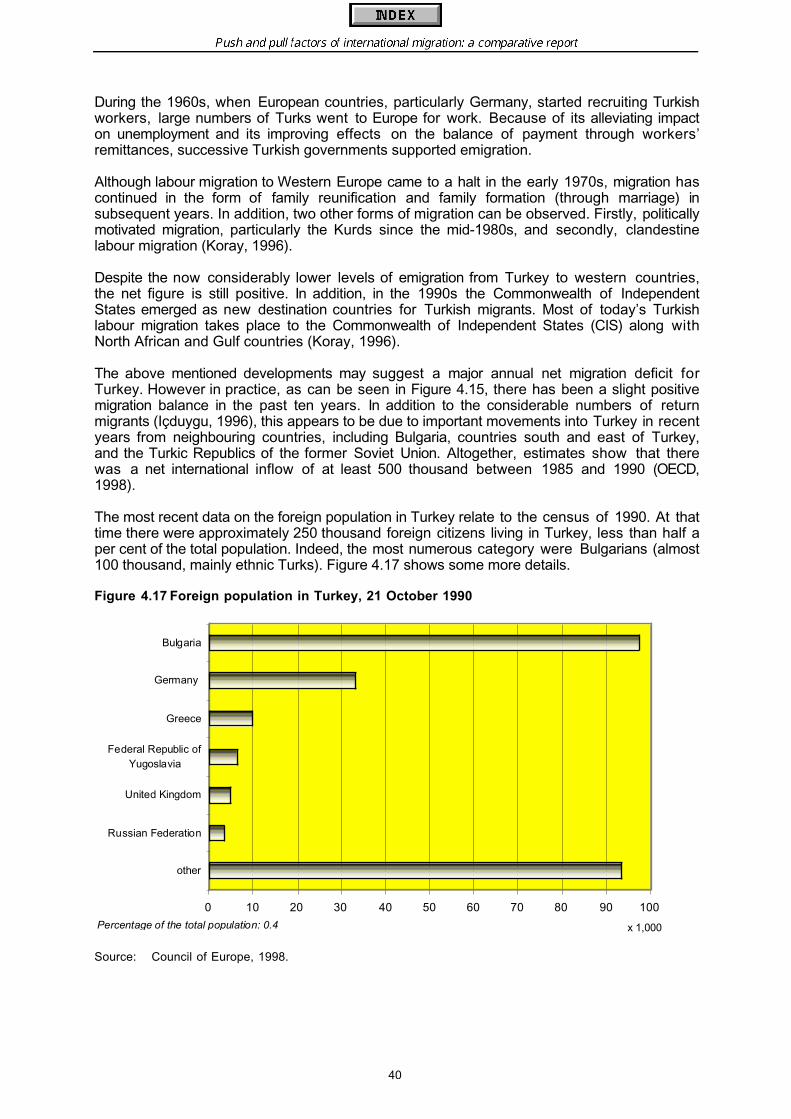
Push and pull factors of international migration: a comparative report
40
During the 1960s, when European countries, particularly Germany, started recruiting Turkishworkers, large numbers of Turks went to Europe for work. Because of its alleviating impacton unemployment and its improving effects on the balance of payment through workers’remittances, successive Turkish governments supported emigration.
Although labour migration to Western Europe came to a halt in the early 1970s, migration hascontinued in the form of family reunification and family formation (through marriage) insubsequent years. In addition, two other forms of migration can be observed. Firstly, politicallymotivated migration, particularly the Kurds since the mid-1980s, and secondly, clandestinelabour migration (Koray, 1996).
Despite the now considerably lower levels of emigration from Turkey to western countries,the net figure is still positive. In addition, in the 1990s the Commonwealth of IndependentStates emerged as new destination countries for Turkish migrants. Most of today’s Turkishlabour migration takes place to the Commonwealth of Independent States (CIS) along withNorth African and Gulf countries (Koray, 1996).
The above mentioned developments may suggest a major annual net migration deficit forTurkey. However in practice, as can be seen in Figure 4.15, there has been a slight positivemigration balance in the past ten years. In addition to the considerable numbers of returnmigrants (Içduygu, 1996), this appears to be due to important movements into Turkey in recentyears from neighbouring countries, including Bulgaria, countries south and east of Turkey,and the Turkic Republics of the former Soviet Union. Altogether, estimates show that therewas a net international inflow of at least 500 thousand between 1985 and 1990 (OECD,1998).
The most recent data on the foreign population in Turkey relate to the census of 1990. At thattime there were approximately 250 thousand foreign citizens living in Turkey, less than half aper cent of the total population. Indeed, the most numerous category were Bulgarians (almost100 thousand, mainly ethnic Turks). Figure 4.17 shows some more details.
Figure 4.17 Foreign population in Turkey, 21 October 1990
Source: Council of Europe, 1998.
0 10 20 30 40 50 60 70 80 90 100
other
Russian Federation
United Kingdom
Federal Republic ofYugoslavia
Greece
Germany
Bulgaria
x 1,000Percentage of the total population: 0.4
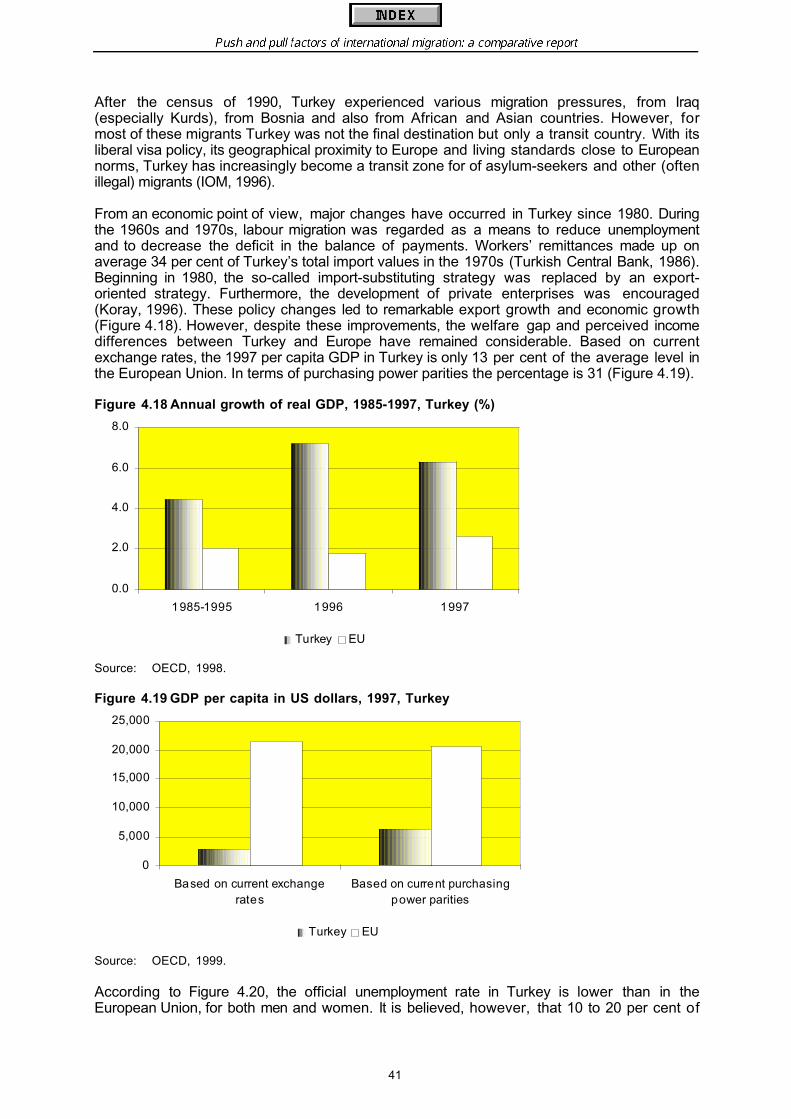
Push and pull factors of international migration: a comparative report
41
After the census of 1990, Turkey experienced various migration pressures, from Iraq(especially Kurds), from Bosnia and also from African and Asian countries. However, formost of these migrants Turkey was not the final destination but only a transit country. With itsliberal visa policy, its geographical proximity to Europe and living standards close to Europeannorms, Turkey has increasingly become a transit zone for of asylum-seekers and other (oftenillegal) migrants (IOM, 1996).
From an economic point of view, major changes have occurred in Turkey since 1980. Duringthe 1960s and 1970s, labour migration was regarded as a means to reduce unemploymentand to decrease the deficit in the balance of payments. Workers’ remittances made up onaverage 34 per cent of Turkey’s total import values in the 1970s (Turkish Central Bank, 1986).Beginning in 1980, the so-called import-substituting strategy was replaced by an export-oriented strategy. Furthermore, the development of private enterprises was encouraged(Koray, 1996). These policy changes led to remarkable export growth and economic growth(Figure 4.18). However, despite these improvements, the welfare gap and perceived incomedifferences between Turkey and Europe have remained considerable. Based on currentexchange rates, the 1997 per capita GDP in Turkey is only 13 per cent of the average level inthe European Union. In terms of purchasing power parities the percentage is 31 (Figure 4.19).
Figure 4.18 Annual growth of real GDP, 1985-1997, Turkey (%)
Source: OECD, 1998.
Figure 4.19 GDP per capita in US dollars, 1997, Turkey
Source: OECD, 1999.
According to Figure 4.20, the official unemployment rate in Turkey is lower than in theEuropean Union, for both men and women. It is believed, however, that 10 to 20 per cent of
0.0
2.0
4.0
6.0
8.0
1985-1995 1996 1997
Turkey EU
0
5,000
10,000
15,000
20,000
25,000
Based on current exchangerates
Based on current purchasingpower parities
Turkey EU
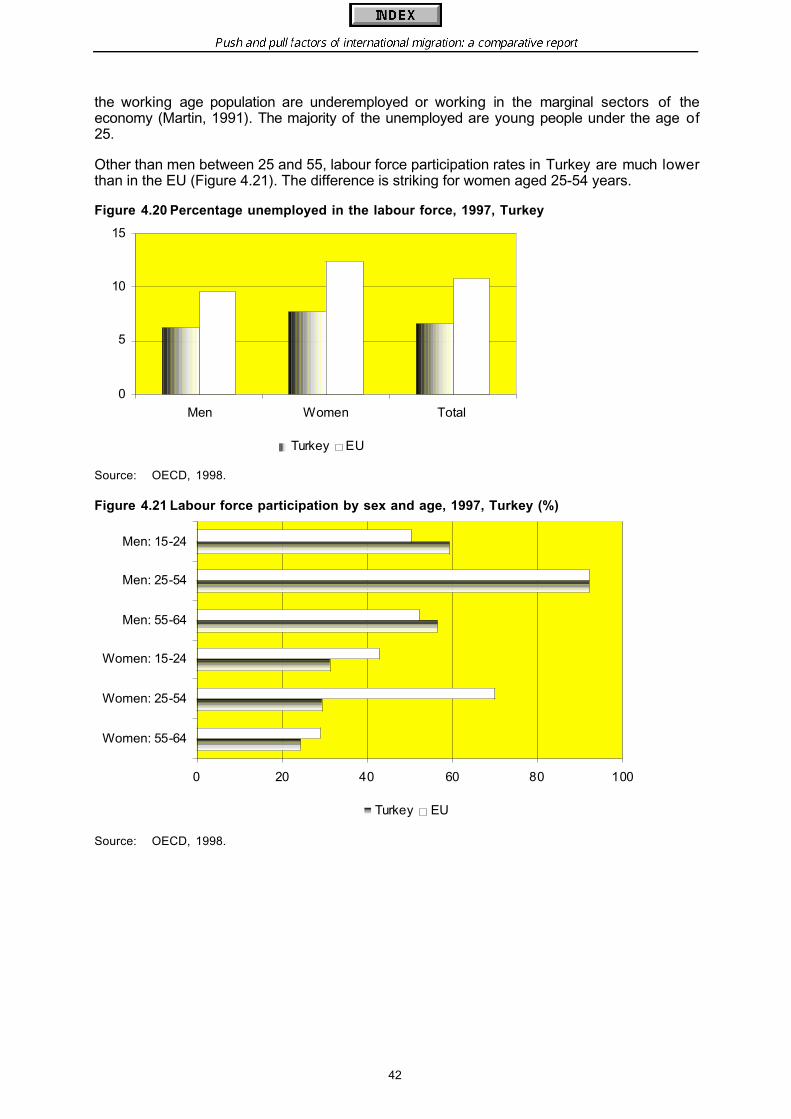
Push and pull factors of international migration: a comparative report
42
the working age population are underemployed or working in the marginal sectors of theeconomy (Martin, 1991). The majority of the unemployed are young people under the age of25.
Other than men between 25 and 55, labour force participation rates in Turkey are much lowerthan in the EU (Figure 4.21). The difference is striking for women aged 25-54 years.
Figure 4.20 Percentage unemployed in the labour force, 1997, Turkey
Source: OECD, 1998.
Figure 4.21 Labour force participation by sex and age, 1997, Turkey (%)
Source: OECD, 1998.
0
5
10
15
Men Women Total
Turkey EU
0 20 40 60 80 100
Women: 55-64
Women: 25-54
Women: 15-24
Men: 55-64
Men: 25-54
Men: 15-24
Turkey EU
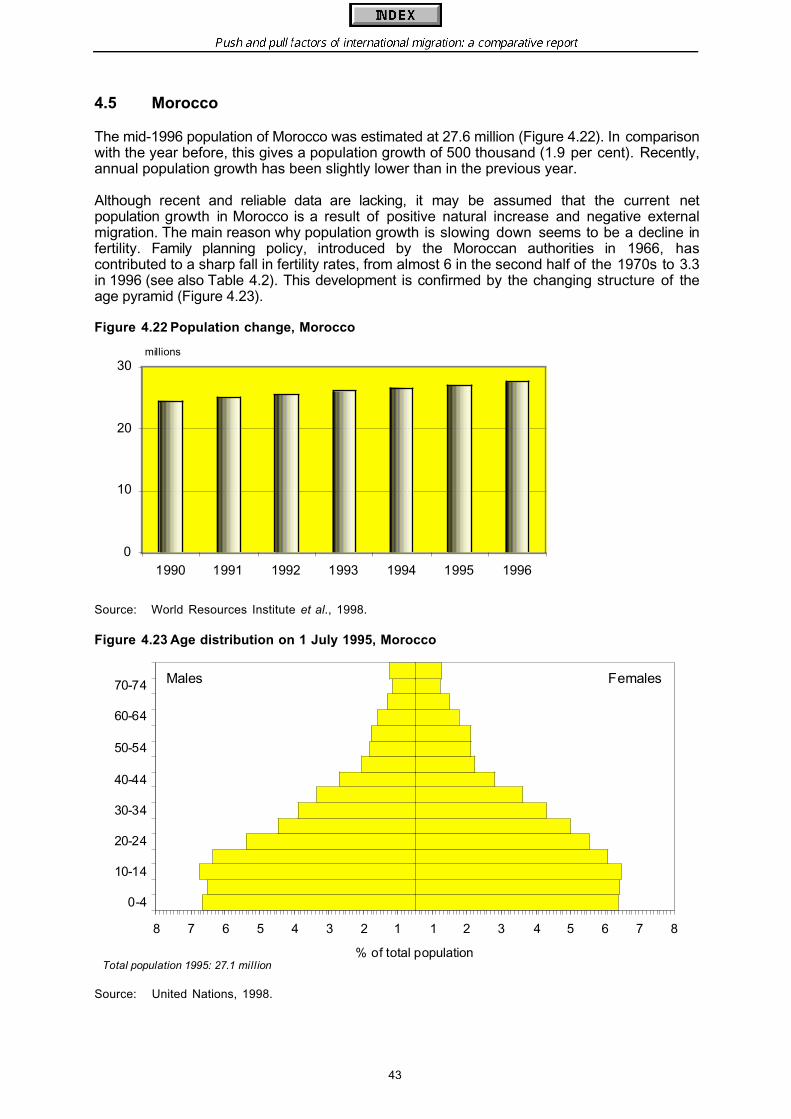
Push and pull factors of international migration: a comparative report
43
4.5 Morocco
The mid-1996 population of Morocco was estimated at 27.6 million (Figure 4.22). In comparisonwith the year before, this gives a population growth of 500 thousand (1.9 per cent). Recently,annual population growth has been slightly lower than in the previous year.
Although recent and reliable data are lacking, it may be assumed that the current netpopulation growth in Morocco is a result of positive natural increase and negative externalmigration. The main reason why population growth is slowing down seems to be a decline infertility. Family planning policy, introduced by the Moroccan authorities in 1966, hascontributed to a sharp fall in fertility rates, from almost 6 in the second half of the 1970s to 3.3in 1996 (see also Table 4.2). This development is confirmed by the changing structure of theage pyramid (Figure 4.23).
Figure 4.22 Population change, Morocco
Source: World Resources Institute et al., 1998.
Figure 4.23 Age distribution on 1 July 1995, Morocco
Source: United Nations, 1998.
0
10
20
30
1990 1991 1992 1993 1994 1995 1996
millions
8 7 6 5 4 3 2 1 1 2 3 4 5 6 7 8
0-4
10-14
20-24
30-34
40-44
50-54
60-64
70-74
% of total population
Males Females
Total population 1995: 27.1 million
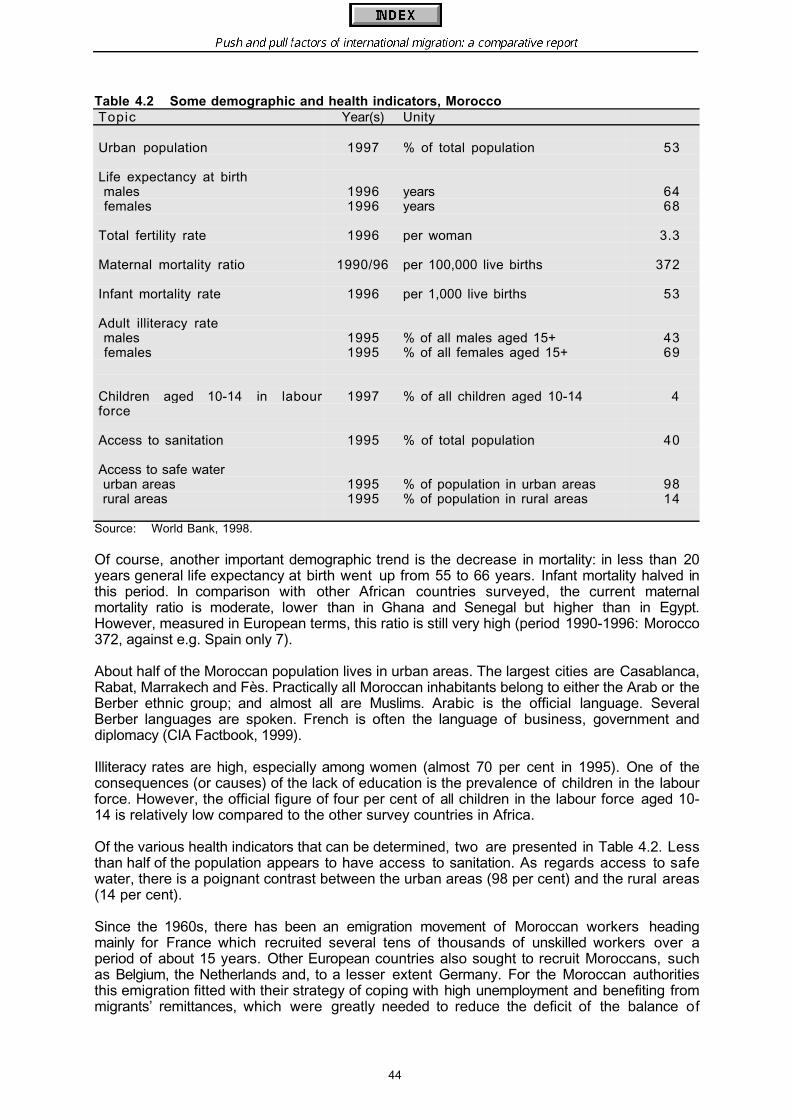
Push and pull factors of international migration: a comparative report
44
Table 4.2 Some demographic and health indicators, MoroccoTopic Year(s) Unity
Urban population 1997 % of total population 53
Life expectancy at birth males 1996 years 64 females 1996 years 68
Total fertility rate 1996 per woman 3.3
Maternal mortality ratio 1990/96 per 100,000 live births 372
Infant mortality rate 1996 per 1,000 live births 53
Adult illiteracy rate males 1995 % of all males aged 15+ 43 females 1995 % of all females aged 15+ 69
Children aged 10-14 in labourforce
1997 % of all children aged 10-14 4
Access to sanitation 1995 % of total population 40
Access to safe water urban areas 1995 % of population in urban areas 98 rural areas 1995 % of population in rural areas 14
Source: World Bank, 1998.
Of course, another important demographic trend is the decrease in mortality: in less than 20years general life expectancy at birth went up from 55 to 66 years. Infant mortality halved inthis period. In comparison with other African countries surveyed, the current maternalmortality ratio is moderate, lower than in Ghana and Senegal but higher than in Egypt.However, measured in European terms, this ratio is still very high (period 1990-1996: Morocco372, against e.g. Spain only 7).
About half of the Moroccan population lives in urban areas. The largest cities are Casablanca,Rabat, Marrakech and Fès. Practically all Moroccan inhabitants belong to either the Arab or theBerber ethnic group; and almost all are Muslims. Arabic is the official language. SeveralBerber languages are spoken. French is often the language of business, government anddiplomacy (CIA Factbook, 1999).
Illiteracy rates are high, especially among women (almost 70 per cent in 1995). One of theconsequences (or causes) of the lack of education is the prevalence of children in the labourforce. However, the official figure of four per cent of all children in the labour force aged 10-14 is relatively low compared to the other survey countries in Africa.
Of the various health indicators that can be determined, two are presented in Table 4.2. Lessthan half of the population appears to have access to sanitation. As regards access to safewater, there is a poignant contrast between the urban areas (98 per cent) and the rural areas(14 per cent).
Since the 1960s, there has been an emigration movement of Moroccan workers headingmainly for France which recruited several tens of thousands of unskilled workers over aperiod of about 15 years. Other European countries also sought to recruit Moroccans, suchas Belgium, the Netherlands and, to a lesser extent Germany. For the Moroccan authoritiesthis emigration fitted with their strategy of coping with high unemployment and benefiting frommigrants’ remittances, which were greatly needed to reduce the deficit of the balance of
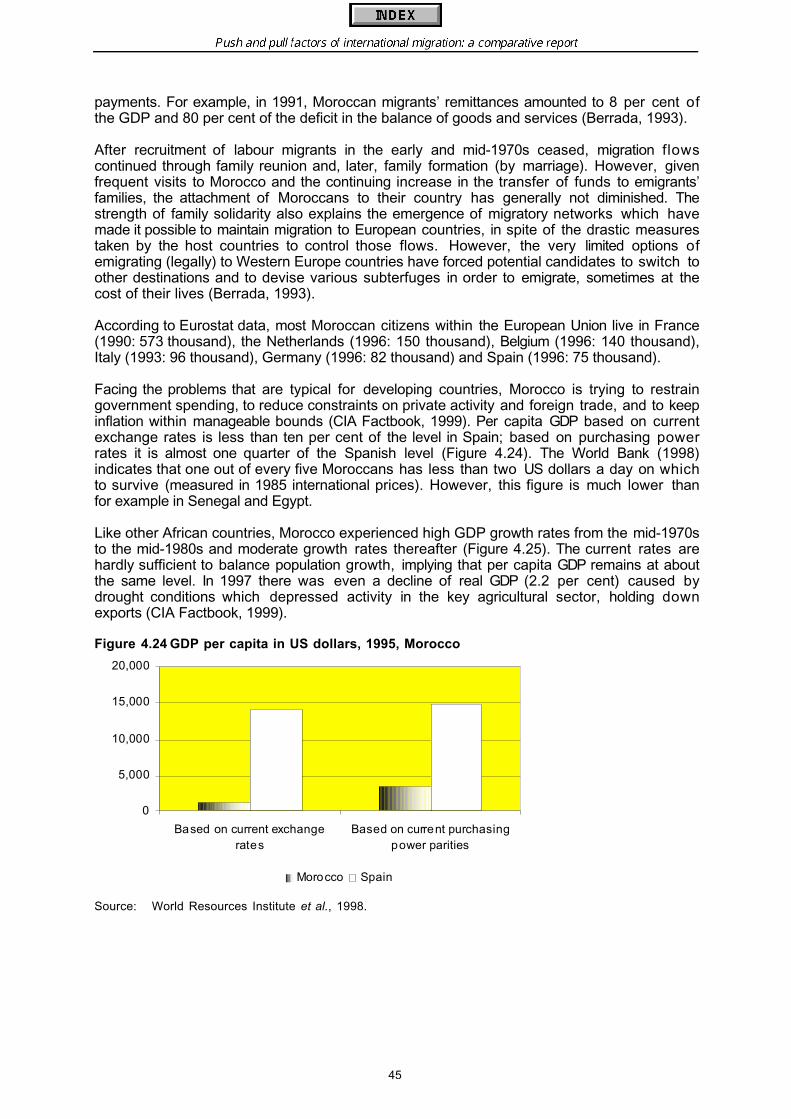
Push and pull factors of international migration: a comparative report
45
payments. For example, in 1991, Moroccan migrants’ remittances amounted to 8 per cent ofthe GDP and 80 per cent of the deficit in the balance of goods and services (Berrada, 1993).
After recruitment of labour migrants in the early and mid-1970s ceased, migration flowscontinued through family reunion and, later, family formation (by marriage). However, givenfrequent visits to Morocco and the continuing increase in the transfer of funds to emigrants’families, the attachment of Moroccans to their country has generally not diminished. Thestrength of family solidarity also explains the emergence of migratory networks which havemade it possible to maintain migration to European countries, in spite of the drastic measurestaken by the host countries to control those flows. However, the very limited options ofemigrating (legally) to Western Europe countries have forced potential candidates to switch toother destinations and to devise various subterfuges in order to emigrate, sometimes at thecost of their lives (Berrada, 1993).
According to Eurostat data, most Moroccan citizens within the European Union live in France(1990: 573 thousand), the Netherlands (1996: 150 thousand), Belgium (1996: 140 thousand),Italy (1993: 96 thousand), Germany (1996: 82 thousand) and Spain (1996: 75 thousand).
Facing the problems that are typical for developing countries, Morocco is trying to restraingovernment spending, to reduce constraints on private activity and foreign trade, and to keepinflation within manageable bounds (CIA Factbook, 1999). Per capita GDP based on currentexchange rates is less than ten per cent of the level in Spain; based on purchasing powerrates it is almost one quarter of the Spanish level (Figure 4.24). The World Bank (1998)indicates that one out of every five Moroccans has less than two US dollars a day on whichto survive (measured in 1985 international prices). However, this figure is much lower thanfor example in Senegal and Egypt.
Like other African countries, Morocco experienced high GDP growth rates from the mid-1970sto the mid-1980s and moderate growth rates thereafter (Figure 4.25). The current rates arehardly sufficient to balance population growth, implying that per capita GDP remains at aboutthe same level. In 1997 there was even a decline of real GDP (2.2 per cent) caused bydrought conditions which depressed activity in the key agricultural sector, holding downexports (CIA Factbook, 1999).
Figure 4.24 GDP per capita in US dollars, 1995, Morocco
Source: World Resources Institute et al., 1998.
0
5,000
10,000
15,000
20,000
Based on current exchangerates
Based on current purchasingpower parities
Morocco Spain
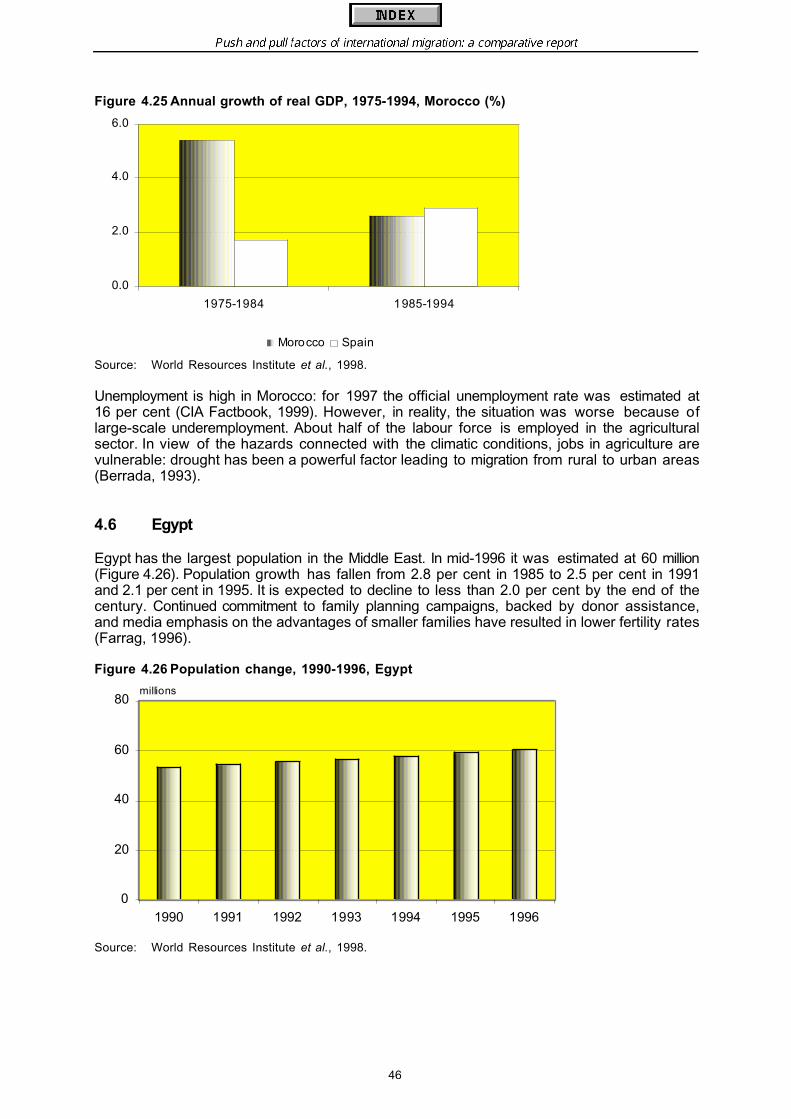
Push and pull factors of international migration: a comparative report
46
Figure 4.25 Annual growth of real GDP, 1975-1994, Morocco (%)
Source: World Resources Institute et al., 1998.
Unemployment is high in Morocco: for 1997 the official unemployment rate was estimated at16 per cent (CIA Factbook, 1999). However, in reality, the situation was worse because oflarge-scale underemployment. About half of the labour force is employed in the agriculturalsector. In view of the hazards connected with the climatic conditions, jobs in agriculture arevulnerable: drought has been a powerful factor leading to migration from rural to urban areas(Berrada, 1993).
4.6 Egypt
Egypt has the largest population in the Middle East. In mid-1996 it was estimated at 60 million(Figure 4.26). Population growth has fallen from 2.8 per cent in 1985 to 2.5 per cent in 1991and 2.1 per cent in 1995. It is expected to decline to less than 2.0 per cent by the end of thecentury. Continued commitment to family planning campaigns, backed by donor assistance,and media emphasis on the advantages of smaller families have resulted in lower fertility rates(Farrag, 1996).
Figure 4.26 Population change, 1990-1996, Egypt
Source: World Resources Institute et al., 1998.
0.0
2.0
4.0
6.0
1975-1984 1985-1994
Morocco Spain
0
20
40
60
80
1990 1991 1992 1993 1994 1995 1996
millions
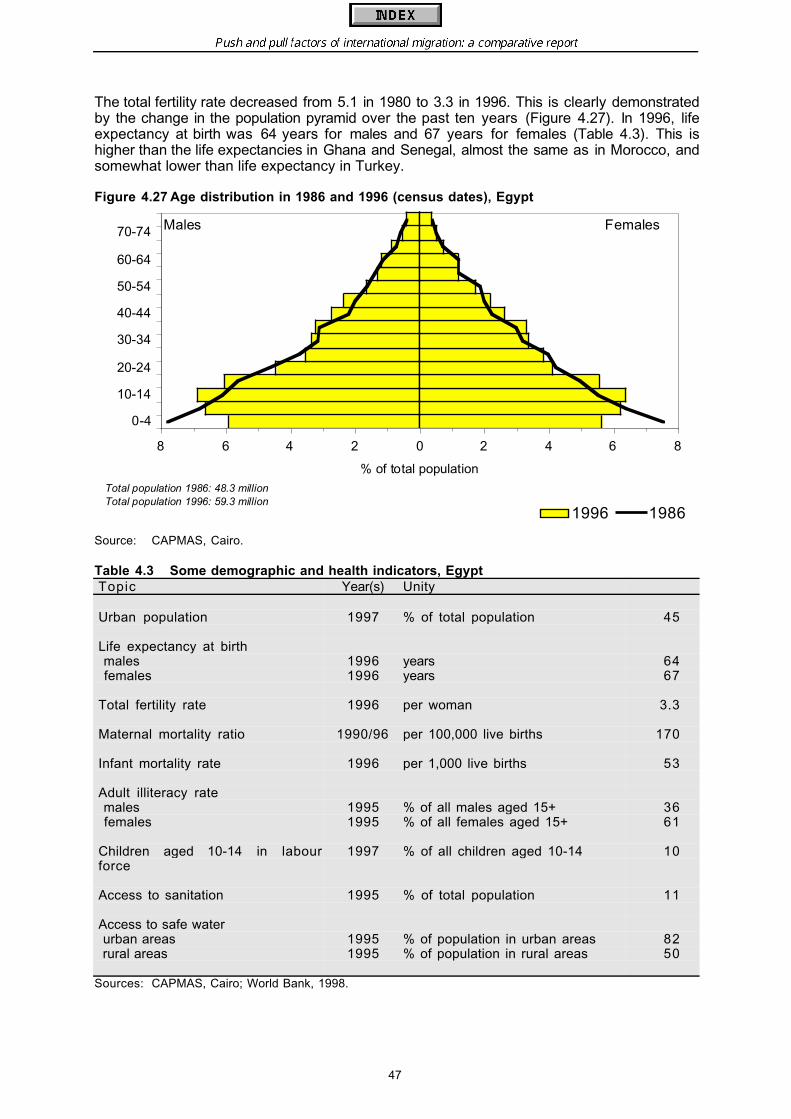
Push and pull factors of international migration: a comparative report
47
The total fertility rate decreased from 5.1 in 1980 to 3.3 in 1996. This is clearly demonstratedby the change in the population pyramid over the past ten years (Figure 4.27). In 1996, lifeexpectancy at birth was 64 years for males and 67 years for females (Table 4.3). This ishigher than the life expectancies in Ghana and Senegal, almost the same as in Morocco, andsomewhat lower than life expectancy in Turkey.
Figure 4.27 Age distribution in 1986 and 1996 (census dates), Egypt
Source: CAPMAS, Cairo.
Table 4.3 Some demographic and health indicators, EgyptTopic Year(s) Unity
Urban population 1997 % of total population 45
Life expectancy at birth males 1996 years 64 females 1996 years 67
Total fertility rate 1996 per woman 3.3
Maternal mortality ratio 1990/96 per 100,000 live births 170
Infant mortality rate 1996 per 1,000 live births 53
Adult illiteracy rate males 1995 % of all males aged 15+ 36 females 1995 % of all females aged 15+ 61
Children aged 10-14 in labourforce
1997 % of all children aged 10-14 10
Access to sanitation 1995 % of total population 11
Access to safe water urban areas 1995 % of population in urban areas 82 rural areas 1995 % of population in rural areas 50
Sources: CAPMAS, Cairo; World Bank, 1998.
8 6 4 2 0 2 4 6 8
0-4
10-14
20-24
30-34
40-44
50-54
60-64
70-74
% of total population
1996 1986
Males Females
Total population 1986: 48.3 millionTotal population 1996: 59.3 million
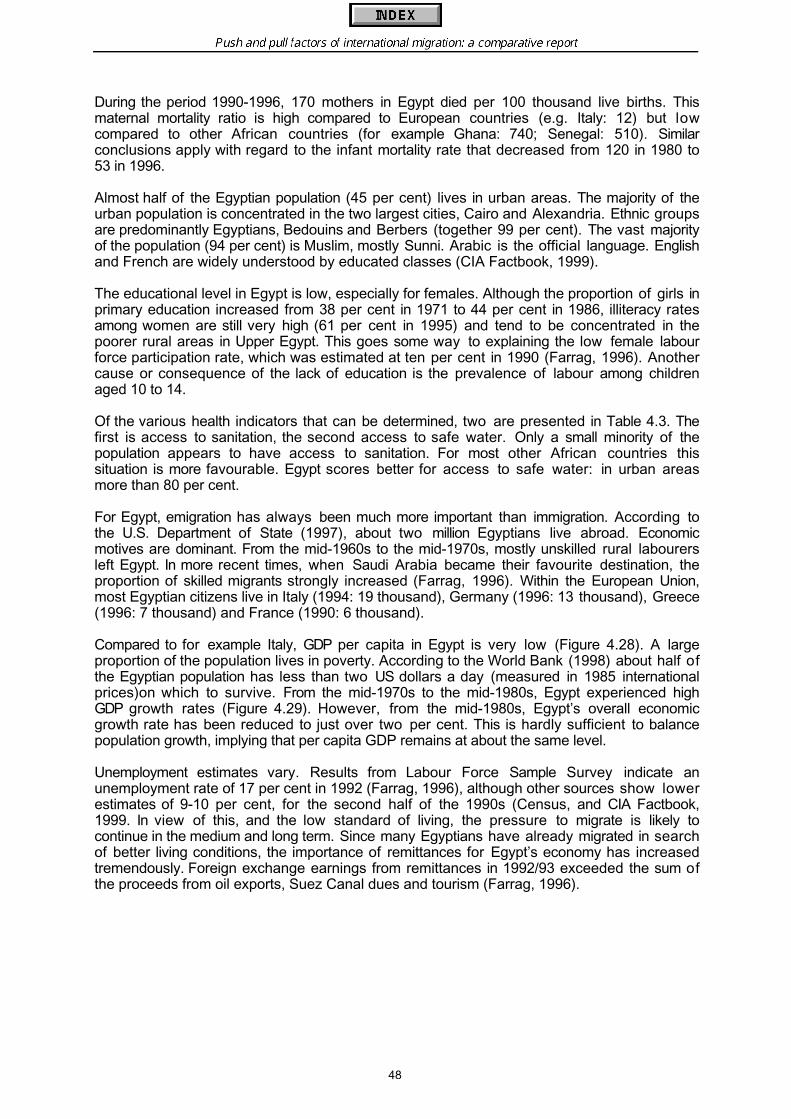
Push and pull factors of international migration: a comparative report
48
During the period 1990-1996, 170 mothers in Egypt died per 100 thousand live births. Thismaternal mortality ratio is high compared to European countries (e.g. Italy: 12) but lowcompared to other African countries (for example Ghana: 740; Senegal: 510). Similarconclusions apply with regard to the infant mortality rate that decreased from 120 in 1980 to53 in 1996.
Almost half of the Egyptian population (45 per cent) lives in urban areas. The majority of theurban population is concentrated in the two largest cities, Cairo and Alexandria. Ethnic groupsare predominantly Egyptians, Bedouins and Berbers (together 99 per cent). The vast majorityof the population (94 per cent) is Muslim, mostly Sunni. Arabic is the official language. Englishand French are widely understood by educated classes (CIA Factbook, 1999).
The educational level in Egypt is low, especially for females. Although the proportion of girls inprimary education increased from 38 per cent in 1971 to 44 per cent in 1986, illiteracy ratesamong women are still very high (61 per cent in 1995) and tend to be concentrated in thepoorer rural areas in Upper Egypt. This goes some way to explaining the low female labourforce participation rate, which was estimated at ten per cent in 1990 (Farrag, 1996). Anothercause or consequence of the lack of education is the prevalence of labour among childrenaged 10 to 14.
Of the various health indicators that can be determined, two are presented in Table 4.3. Thefirst is access to sanitation, the second access to safe water. Only a small minority of thepopulation appears to have access to sanitation. For most other African countries thissituation is more favourable. Egypt scores better for access to safe water: in urban areasmore than 80 per cent.
For Egypt, emigration has always been much more important than immigration. According tothe U.S. Department of State (1997), about two million Egyptians live abroad. Economicmotives are dominant. From the mid-1960s to the mid-1970s, mostly unskilled rural labourersleft Egypt. In more recent times, when Saudi Arabia became their favourite destination, theproportion of skilled migrants strongly increased (Farrag, 1996). Within the European Union,most Egyptian citizens live in Italy (1994: 19 thousand), Germany (1996: 13 thousand), Greece(1996: 7 thousand) and France (1990: 6 thousand).
Compared to for example Italy, GDP per capita in Egypt is very low (Figure 4.28). A largeproportion of the population lives in poverty. According to the World Bank (1998) about half ofthe Egyptian population has less than two US dollars a day (measured in 1985 internationalprices)on which to survive. From the mid-1970s to the mid-1980s, Egypt experienced highGDP growth rates (Figure 4.29). However, from the mid-1980s, Egypt’s overall economicgrowth rate has been reduced to just over two per cent. This is hardly sufficient to balancepopulation growth, implying that per capita GDP remains at about the same level.
Unemployment estimates vary. Results from Labour Force Sample Survey indicate anunemployment rate of 17 per cent in 1992 (Farrag, 1996), although other sources show lowerestimates of 9-10 per cent, for the second half of the 1990s (Census, and CIA Factbook,1999. In view of this, and the low standard of living, the pressure to migrate is likely tocontinue in the medium and long term. Since many Egyptians have already migrated in searchof better living conditions, the importance of remittances for Egypt’s economy has increasedtremendously. Foreign exchange earnings from remittances in 1992/93 exceeded the sum ofthe proceeds from oil exports, Suez Canal dues and tourism (Farrag, 1996).

Push and pull factors of international migration: a comparative report
49
Figure 4.28 GDP per capita in US dollars, 1995, Egypt
Source: World Resources Institute et al., 1998.
Figure 4.29 Annual growth of real GDP, 1975-1994, Egypt (%)
Source: World Resources Institute et al., 1998.
4.7 Ghana
The Republic of Ghana became the first black African colony to gain independence, in 1957.The current population is estimated at about 19 million. Population growth is around three percent per year and tends to decrease (Figure 4.30). Although there are no recent reliable data,it may be assumed that this growth results from a considerable positive natural increase anda modest negative migration balance.
For 1996, the total fertility rate per woman is estimated at 5.0 (Table 4.4). Compared to otherAfrican countries in the survey, this rate is much higher than in Egypt and Morocco andsomewhat lower than in Senegal. Similar to the general trend, the total fertility rate in Ghana israpidly decreasing (from 6.1 in 1992 to 4.3 in 1998; CIA Factbook, 1999).
The high fertility level is reflected in the age structure (Figure 4.31). Almost half of thepopulation in 1998 was younger than 15; only three per cent was 65 or older.6
6 Because of significant differences between the sources used for Figure 4.31 and Figure 4.30, the latter
series have not been extended to 1998.
0
5,000
10,000
15,000
20,000
25,000
Based on current exchangerates
Based on current purchasingpower parities
Egypt Italy
0.0
2.0
4.0
6.0
8.0
10.0
1975-1984 1985-1994
Egypt Italy

Push and pull factors of international migration: a comparative report
50
Figure 4.30 Population change, 1990-1996, Ghana
Source: World Resources Institute et al., 1998.
Figure 4.31 Age distribution in 1998, Ghana
Source: University of Ghana, 1999.
However, in view of improved life expectancy at birth, the latter percentage will undoubtedlyrise in the coming years. For men, life expectancy at birth in 1996 was 57 years, for women61 years.
Between 1990 and 1996, 740 mothers in Ghana died per 100 thousand live births. Thismaternal mortality ratio is highest of the African countries surveyed. The same conclusionapplies to the infant mortality rate (71 per thousand live births in 1996).
Although Ghana used to attract many migrants from other African countries to work in cocoaproduction, due to economic crises it has now become a major emigration country. It isestimated that about ten per cent of the Ghanaian population live abroad, especially in Nigeria(Adepoju, 1995). As a consequence of historic colonial ties, most Ghanaians within theEuropean Union live in the United Kingdom (1996: 31 thousand), followed by Germany (22thousand).
0
5
10
15
20
1990 1991 1992 1993 1994 1995 1996
millions
10 9 8 7 6 5 4 3 2 1 0 1 2 3 4 5 6 7 8 9 10
0-4
10-14
20-24
30-34
40-44
50-54
60-64
70-74
80+
% of total population
Males Females
Total population 1998: 19.6 million

Push and pull factors of international migration: a comparative report
51
Table 4.4 Some demographic and health indicators, GhanaTopic Year(s) Unity
Urban population 1997 % of total population 37
Life expectancy at birth males 1996 years 57 females 1996 years 61
Total fertility rate 1996 per woman 5.0
Maternal mortality ratio 1990/96 per 100,000 live births 740
Infant mortality rate 1996 per 1,000 live births 71
Adult illiteracy rate males 1995 % of all males aged 15+ 24 females 1995 % of all females aged 15+ 47
Children aged 10-14 in labourforce
1997 % of all children aged 10-14 13
Access to sanitation 1995 % of total population 27
Access to safe water urban areas 1995 % of population in urban areas 70 rural areas 1995 % of population in rural areas 49
Source: World Bank, 1998.
Another factor affecting Ghana's demography was refugee movements. By the end of 1994,approximately 110 thousand refugees resided in Ghana. About 90 thousand were Togolesewho had fled political violence in their homeland beginning in early 1993. Most Togolese hadsettled in the Volta Region among their ethnic kinsmen. About 20 thousand Liberians wereliving in Ghana by the end of 1994, having fled the civil war in their country. Many were long-term residents. As a result of ethnic fighting in northeastern Ghana in early 1994, at least 20thousand Ghanaians from an original group of 150 thousand were still internally displaced atthe end of the year. About five thousand had taken up residence in Togo because of the strife(Ghana homepage, 1999).
Ghanaians come from six main ethnic groups. The Akan (Ashanti and Fanti) are the mostnumerous group, followed by the Mole-Dagbane, the Ewe, the Ga-Adangbe, the Guan, andthe Gurma. Half of the population is Christian, one third follows a traditional religion, the rest(13 per cent) is Muslim. English is the official language. Ga is the main native language. Fanti,Haussa, Fantéewe, Gaadanhe, Akan, Dagbandim and Mampusi are also spoken (CIAFactbook, 1999).
As part of the 1988 economic reform measures, the government of Ghana initiated afunctional literacy programme. As a result of the success of the programme’s pilot phase, itwas expanded nation-wide in 1991. The Non-Formal Education Division (NFED) of the Ministryof Education was established and given the responsibility for the programme aimed atreducing the illiteracy rate within a decade and helping the 5.6 million illiterates becomefunctionally literate by the year 2000 (Buagbe, 1999). In view of the relatively low illiteracyrates, in African terms, this programme has been quite successful.
About one third of the population live in urban areas. Most of the population is concentrated inthe southern part of the country, with the highest densities occurring in urban areas andcocoa-producing areas. The largest regions in terms of population are Ashanti (about 2million), Eastern (about 1.7 million) and Greater Accra (about 1.5 million).
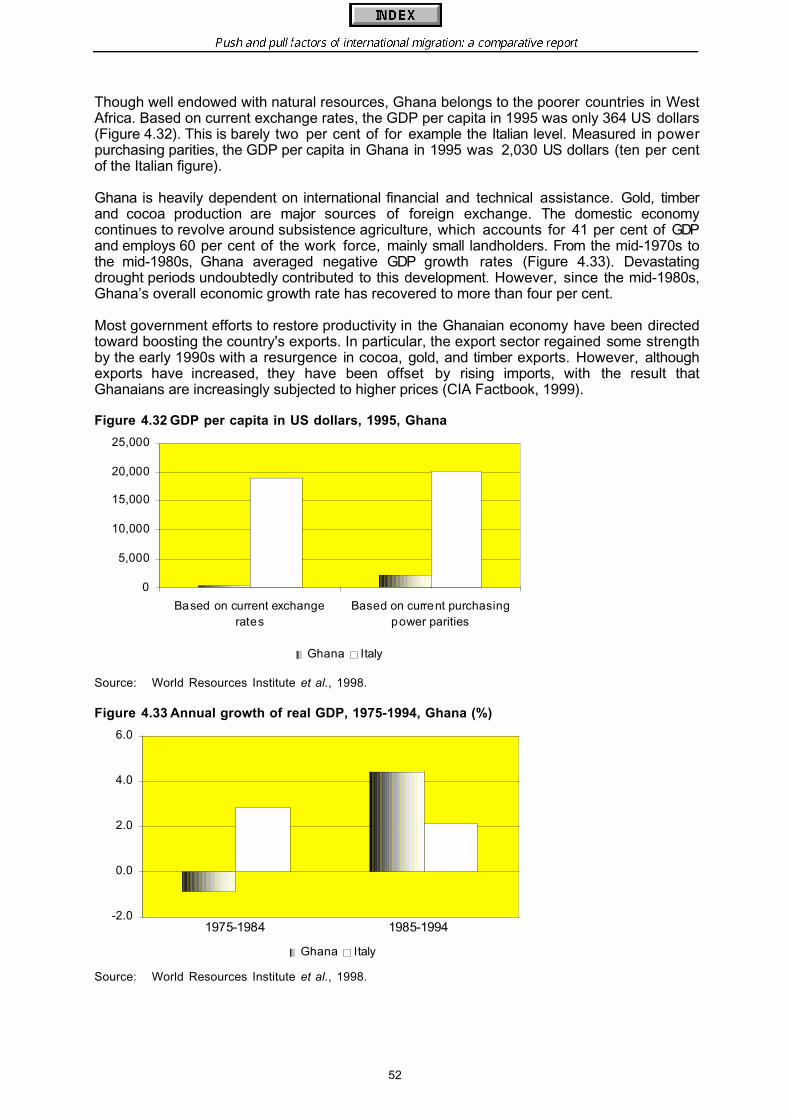
Push and pull factors of international migration: a comparative report
52
Though well endowed with natural resources, Ghana belongs to the poorer countries in WestAfrica. Based on current exchange rates, the GDP per capita in 1995 was only 364 US dollars(Figure 4.32). This is barely two per cent of for example the Italian level. Measured in powerpurchasing parities, the GDP per capita in Ghana in 1995 was 2,030 US dollars (ten per centof the Italian figure).
Ghana is heavily dependent on international financial and technical assistance. Gold, timberand cocoa production are major sources of foreign exchange. The domestic economycontinues to revolve around subsistence agriculture, which accounts for 41 per cent of GDPand employs 60 per cent of the work force, mainly small landholders. From the mid-1970s tothe mid-1980s, Ghana averaged negative GDP growth rates (Figure 4.33). Devastatingdrought periods undoubtedly contributed to this development. However, since the mid-1980s,Ghana’s overall economic growth rate has recovered to more than four per cent.
Most government efforts to restore productivity in the Ghanaian economy have been directedtoward boosting the country's exports. In particular, the export sector regained some strengthby the early 1990s with a resurgence in cocoa, gold, and timber exports. However, althoughexports have increased, they have been offset by rising imports, with the result thatGhanaians are increasingly subjected to higher prices (CIA Factbook, 1999).
Figure 4.32 GDP per capita in US dollars, 1995, Ghana
Source: World Resources Institute et al., 1998.
Figure 4.33 Annual growth of real GDP, 1975-1994, Ghana (%)
Source: World Resources Institute et al., 1998.
0
5,000
10,000
15,000
20,000
25,000
Based on current exchangerates
Based on current purchasingpower parities
Ghana Italy
-2.0
0.0
2.0
4.0
6.0
Ghana Italy
1985-19941975-1984
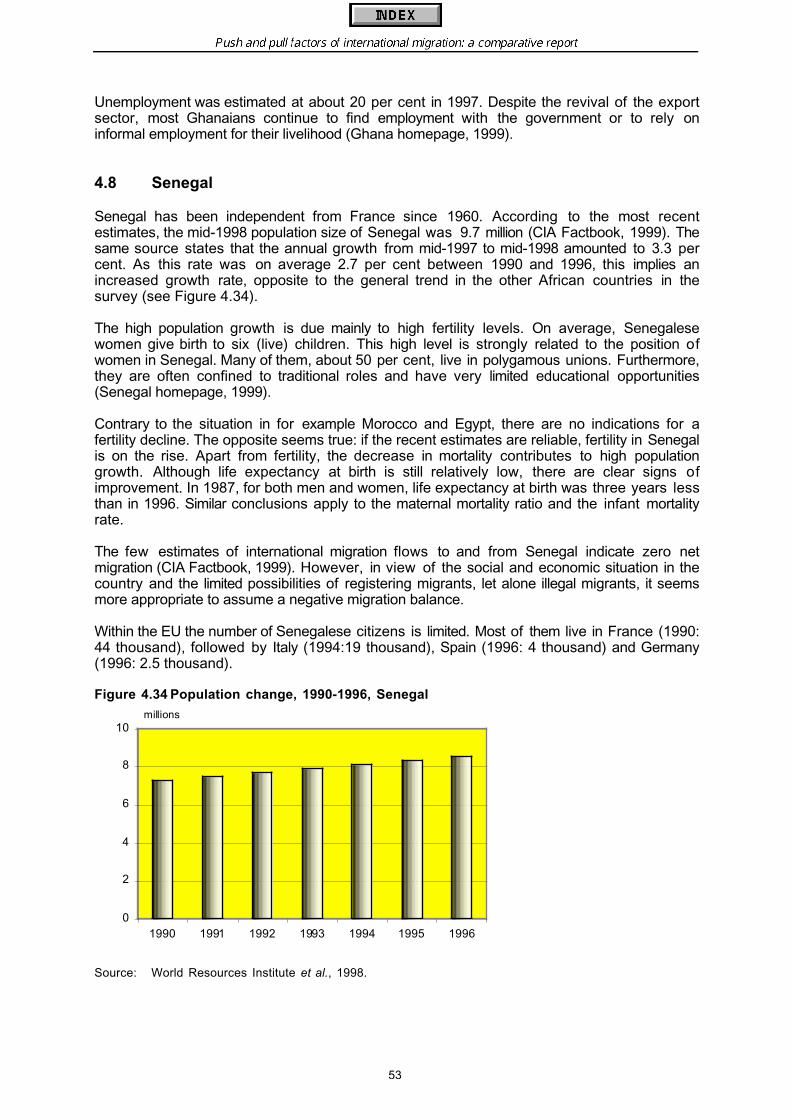
Push and pull factors of international migration: a comparative report
53
Unemployment was estimated at about 20 per cent in 1997. Despite the revival of the exportsector, most Ghanaians continue to find employment with the government or to rely oninformal employment for their livelihood (Ghana homepage, 1999).
4.8 Senegal
Senegal has been independent from France since 1960. According to the most recentestimates, the mid-1998 population size of Senegal was 9.7 million (CIA Factbook, 1999). Thesame source states that the annual growth from mid-1997 to mid-1998 amounted to 3.3 percent. As this rate was on average 2.7 per cent between 1990 and 1996, this implies anincreased growth rate, opposite to the general trend in the other African countries in thesurvey (see Figure 4.34).
The high population growth is due mainly to high fertility levels. On average, Senegalesewomen give birth to six (live) children. This high level is strongly related to the position ofwomen in Senegal. Many of them, about 50 per cent, live in polygamous unions. Furthermore,they are often confined to traditional roles and have very limited educational opportunities(Senegal homepage, 1999).
Contrary to the situation in for example Morocco and Egypt, there are no indications for afertility decline. The opposite seems true: if the recent estimates are reliable, fertility in Senegalis on the rise. Apart from fertility, the decrease in mortality contributes to high populationgrowth. Although life expectancy at birth is still relatively low, there are clear signs ofimprovement. In 1987, for both men and women, life expectancy at birth was three years lessthan in 1996. Similar conclusions apply to the maternal mortality ratio and the infant mortalityrate.
The few estimates of international migration flows to and from Senegal indicate zero netmigration (CIA Factbook, 1999). However, in view of the social and economic situation in thecountry and the limited possibilities of registering migrants, let alone illegal migrants, it seemsmore appropriate to assume a negative migration balance.
Within the EU the number of Senegalese citizens is limited. Most of them live in France (1990:44 thousand), followed by Italy (1994:19 thousand), Spain (1996: 4 thousand) and Germany(1996: 2.5 thousand).
Figure 4.34 Population change, 1990-1996, Senegal
Source: World Resources Institute et al., 1998.
0
2
4
6
8
10
1990 1991 1992 1993 1994 1995 1996
millions
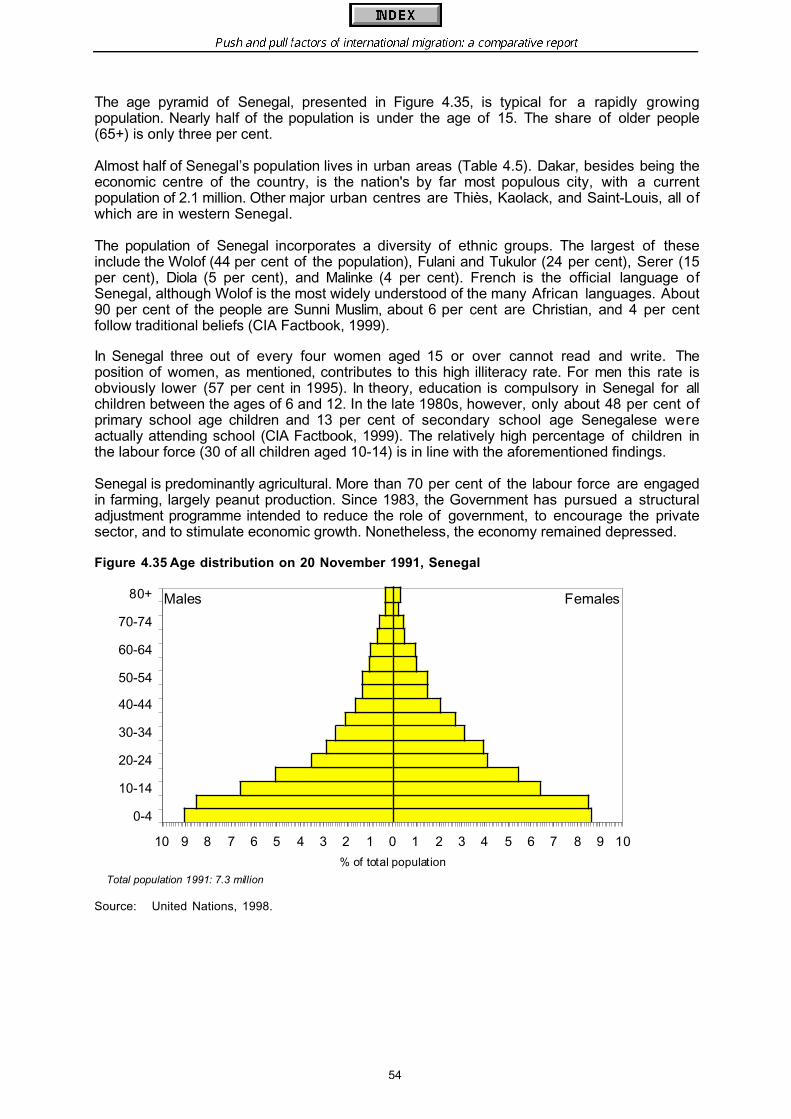
Push and pull factors of international migration: a comparative report
54
The age pyramid of Senegal, presented in Figure 4.35, is typical for a rapidly growingpopulation. Nearly half of the population is under the age of 15. The share of older people(65+) is only three per cent.
Almost half of Senegal’s population lives in urban areas (Table 4.5). Dakar, besides being theeconomic centre of the country, is the nation's by far most populous city, with a currentpopulation of 2.1 million. Other major urban centres are Thiès, Kaolack, and Saint-Louis, all ofwhich are in western Senegal.
The population of Senegal incorporates a diversity of ethnic groups. The largest of theseinclude the Wolof (44 per cent of the population), Fulani and Tukulor (24 per cent), Serer (15per cent), Diola (5 per cent), and Malinke (4 per cent). French is the official language ofSenegal, although Wolof is the most widely understood of the many African languages. About90 per cent of the people are Sunni Muslim, about 6 per cent are Christian, and 4 per centfollow traditional beliefs (CIA Factbook, 1999).
In Senegal three out of every four women aged 15 or over cannot read and write. Theposition of women, as mentioned, contributes to this high illiteracy rate. For men this rate isobviously lower (57 per cent in 1995). In theory, education is compulsory in Senegal for allchildren between the ages of 6 and 12. In the late 1980s, however, only about 48 per cent ofprimary school age children and 13 per cent of secondary school age Senegalese wereactually attending school (CIA Factbook, 1999). The relatively high percentage of children inthe labour force (30 of all children aged 10-14) is in line with the aforementioned findings.
Senegal is predominantly agricultural. More than 70 per cent of the labour force are engagedin farming, largely peanut production. Since 1983, the Government has pursued a structuraladjustment programme intended to reduce the role of government, to encourage the privatesector, and to stimulate economic growth. Nonetheless, the economy remained depressed.
Figure 4.35 Age distribution on 20 November 1991, Senegal
Source: United Nations, 1998.
10 9 8 7 6 5 4 3 2 1 0 1 2 3 4 5 6 7 8 9 10
0-4
10-14
20-24
30-34
40-44
50-54
60-64
70-74
80+
% of total population
Males Females
Total population 1991: 7.3 million

Push and pull factors of international migration: a comparative report
55
Table 4.5 Some demographic and health indicators, SenegalTopic Year(s) Unity
Urban population 1997 % of total population 45
Life expectancy at birth males 1996 years 49 females 1996 years 52
Total fertility rate 1996 per woman 5.7
Maternal mortality ratio 1990/96 per 100,000 live births 510
Infant mortality rate 1996 per 1,000 live births 60
Adult illiteracy rate males 1995 % of all males aged 15+ 57 females 1995 % of all females aged 15+ 77
Children aged 10-14 in labourforce
1997 % of all children aged 10-14 30
Access to sanitation 1995 % of total population 58
Access to safe water urban areas 1995 % of population in urban areas 82 rural areas 1995 % of population in rural areas 28
Source: World Bank, 1998.
A fifty per cent devaluation in January 1994 of the CFA (the local currency pegged to theFrench franc) has encouraged a regeneration of tourism and other major exports. However,this regeneration of tourism has been offset by internal conflicts.
Government price controls and subsidies have been steadily dismantled. After seeing itseconomy contract by 2.1 per cent in 1993, Senegal made an important turnaround, thanks tothe reform programme, with real GDP growth of 5.6 per cent in 1996 and 4.7 per cent in 1997(see also Figure 4.36). Annual inflation has been pushed below three per cent and the fiscaldeficit has been cut to less than 1.5 per cent of GDP (Senegal homepage, 1999).
Figure 4.36 Annual growth of real GDP, 1995, Senegal (%)
Source: World Resources Institute et al., 1998.
0.0
1.0
2.0
3.0
4.0
1975-1984 1985-1994
Senegal Spain
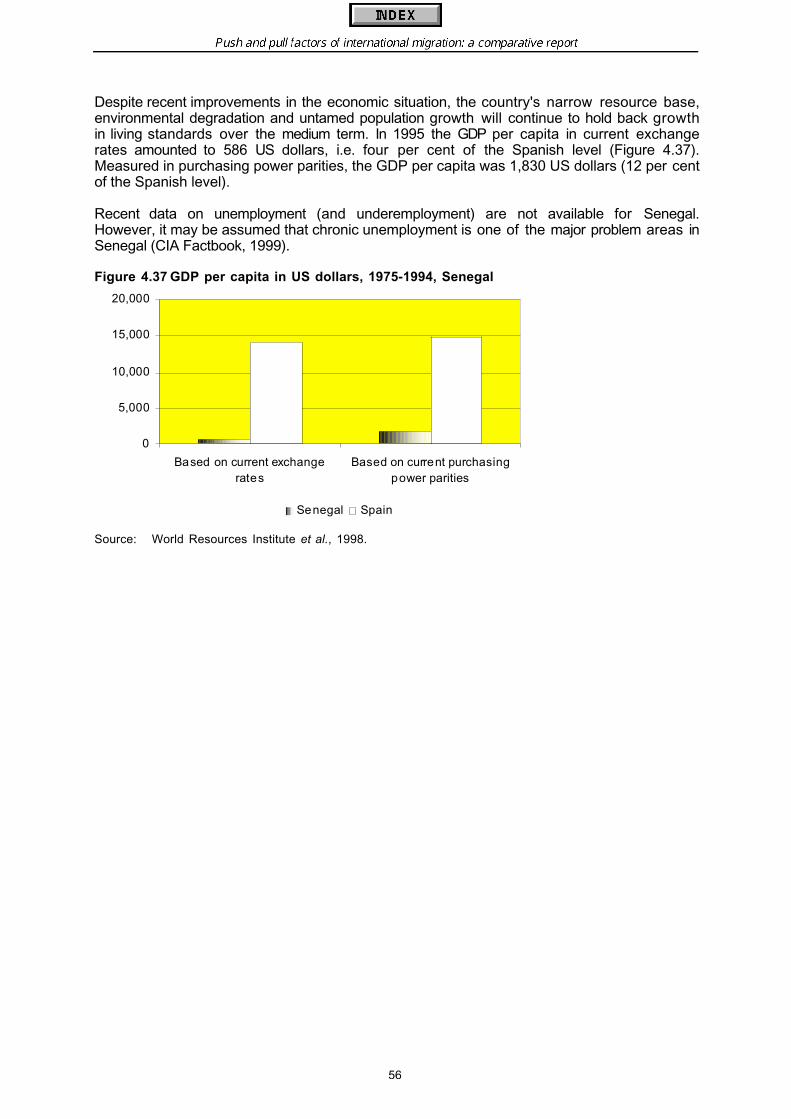
Push and pull factors of international migration: a comparative report
56
Despite recent improvements in the economic situation, the country's narrow resource base,environmental degradation and untamed population growth will continue to hold back growthin living standards over the medium term. In 1995 the GDP per capita in current exchangerates amounted to 586 US dollars, i.e. four per cent of the Spanish level (Figure 4.37).Measured in purchasing power parities, the GDP per capita was 1,830 US dollars (12 per centof the Spanish level).
Recent data on unemployment (and underemployment) are not available for Senegal.However, it may be assumed that chronic unemployment is one of the major problem areas inSenegal (CIA Factbook, 1999).
Figure 4.37 GDP per capita in US dollars, 1975-1994, Senegal
Source: World Resources Institute et al., 1998.
0
5,000
10,000
15,000
20,000
Based on current exchangerates
Based on current purchasingpower parities
Senegal Spain
Push and pull factors of international migration: a comparative report
57
5. RECENT MIGRATION: WHO MOVES AND WHO STAYS
5.1 Introduction
How many people migrate, and to what extent are they selective of the population of theircountry or region of origin? How many households are affected by migration? Does migrationtend to attract the educated, and/or those who are unemployed? Given high rates ofpopulation growth in the countries studied, does migration serve as a welcome outlet forthose for whom there is no place in the labour market, or are countries losing valuable humancapital in terms of both skills and experience?
Micro-level research, often carried out in the migrant-receiving countries, usually focuses onmigrants themselves: who they are, where do they come from and why do they migrate? Forinstance, it is well known that young men are strongly represented among migrants, and thereare many studies describing the socio-economic characteristics of migrants after migration.The present study has two main advantages. Firstly, data were collected on both migrant andnon-migrant households in the countries of origin, allowing for a comparison between the twogroups. Secondly, since one should have information on the migrants’ situation before theirmigration in order to analyse the determinants of international migration, MMAs in recentmigrant households were asked a number of questions about their situation immediately priorto their last migration from their country of origin.7 In addition, the comparison with non-migrants requires information about the latter to be collected over a period in timecorresponding to the pre-migration situation of the migrants. As the migration experiencestudied could date back to a maximum of ten years before the survey date, non-migrantreference persons were interviewed about aspects of their household and economicsituation approximately five years ago.
It is important to keep in mind that the samples are not nationally selective. Therefore, theresults can only be interpreted at the regional level, and countries cannot be compared as awhole. As the sample regions were chosen for their relatively high incidence of internationaloutmigration (among other criteria), if anything, the data are likely to show a higher incidenceof migration than would be the case for each country as a whole.
The determinants of migration are complex and interrelated. Macro-level factors such asemployment structure and opportunities, wage levels, land and tenure systems, transportationand communication, kinship ties and inheritance systems, community facilities, economicdevelopment, regional inequality, ethnic structure, etc., may have a role to play in explainingdifferences in migration intensity between communities and/or regions. In addition, personaland household characteristics influence the decision to migrate, and these form the topic ofthis chapter. In particular, demographic factors are taken into account (Section 5.2.2), as areselected socio-economic characteristics of individuals and households (Section 5.2.3).Section 5.2.1 describes the extent of migration in the regions studied.
5.2 Characteristics of migrant and non-migrant households
5.2.1 Regional migration patternsIn most countries, four regions were selected for the survey (see Section 3.3 and Appendix10.1). Of these, two are characterised by an established migration history, and these maytherefore be expected to have a relatively high prevalence of migration. In the two otherregions migration is a more recent although significant phenomenon.
7 See Section 3.1 for details on the concepts used.
Push and pull factors of international migration: a comparative report
58
Regions with expected negligible levels of migration have not been included in the studybecause of the problems involved in locating households with international migrants.Therefore, the overall levels of international migration in the respective countries are likely tobe considerably lower than the regional levels reported here.
Nevertheless, as expected, even in these ‘high migration regions’, most households have nointernational migrants at all, especially in the regions studied in Ghana (62-77 per cent) andTurkey (66-86 per cent) (see Table 5.1). But in rural Lower Egypt, as well as in Touba(Senegal) and in Moroccan Nador and Tiznit, the percentage of households withoutinternational migrants is below 50 per cent. Therefore, in the regions studied, internationalmigration affects a surprisingly high proportion of all households.
In Egypt and Turkey, there tend to be more households with recent migrants in the lessdeveloped regions studied, but this is not apparent in the other countries. Recent migranthouseholds are most common in Egypt, especially in the rural areas of Lower and UpperEgypt, and in Moroccan Tiznit. Households with recent migrants are least frequent (less thanten per cent of all households) in the Turkish regions of Denizli/U_ak and Gaziantep/Kahramanmara_, both relatively developed regions. In general, most regions have 20-30 percent recent migrant households.
Cairo/Alexandria in Egypt, Denizli/U_ak in Turkey, Nador and Tiznit in Morocco, and the twoSenegalese regions have a relatively high proportion of non-recent migrant households, over20 per cent. Other than the two Senegalese regions, these are all regions characterised byestablished migration patterns. Everywhere except in Denizli/U_ak, Cairo/Alexandria andDakar/Pikine, recent migrant households are more numerous than non-recent ones, althoughthe difference in the latter two regions is small. Of course, we may partly attribute this to thefact that non-recent migrant households have had a longer chance to move out altogether. Butit also seems an indication of the importance of the continuation of out-migration of those wholeft at least ten years ago, at least when measured against return migration.
The differences between regions are largest in Morocco and Egypt, followed by Turkey. Theregions studied in Turkey and Ghana all have between 14 and 38 per cent migranthouseholds, while Morocco, Egypt, and Senegal have between 34 and 57 per cent (withoutlying Tiznit reaching as high as 79 per cent). The relatively low levels in Turkey may partlybe explained by the fact that migration often involves complete households, albeit that theyhave moved in stages (family reunification). In addition, Turkey’s gradually increasing level ofeconomic development may make emigration less of an attractive choice today than it hasbeen in the past. In Ghana, households tend to be relatively small (see Section 5.2.3), andmigration seems more often to involve whole households which, once they have emigrated,are excluded from the survey. Migration from Senegal and Egypt more often takes the form ofindividual migrants who leave their families behind. Morocco appears to take an intermediateplace.
Overall, we found quite a high proportion of households affected by migration, in most of theregions. But there appear to be remarkable differences between the various countries aswell. How can these been explained? Apart from macro-level influences, such as differencesin historical migration processes and in regional or national socio-economic structures, factorsat the household and individual level could play a part in explaining migration. Several of thesefactors will be explored in the following sections.8
8 For a more detailed analysis of regional differences we refer to the individual country reports(see Appendix
10.6). In the following chapters of the present comparative report, the regional aspect is excluded fromthe analyses.

Push and pull factors of international migration: a comparative report
59
Table 5.1 Distribution of households by migration status, per region* (%)Recent
migrationhousehold
Non-recentmigrationhousehold
Non-migrationhousehold
N(unweighted)
Turkey Denizli/U_ak 7 24 69 393Gaziantep/Kahramanmara_ 8 6 86 393Yozgat/Aksaray 24 10 66 374Adıyaman/_anlıurfa 16 8 76 404
Morocco Nador 30 21 49 335Larache 28 12 61 402Settat 30 10 60 427Tiznit 47 32 21 343Khenifra 22 15 63 446
Egypt Cairo/Alexandria 19 21 60 532Urban lower & upper 23 11 66 461Rural lower 44 13 43 552Rural upper 39 8 52 396
Ghana Greater Accra 19 5 76 410Ashanti 32 6 62 267Eastern 25 5 69 460Brong Ahafo 23 0 77 434
Senegal Dakar/Pikine 20 21 59 789Diourbel/Touba 28 21 50 951
* Turkey: Denizli and U_ak: developed region with more established migration flows.Gaziantep and Kahramanmara_: developed region with more recent migration flows.Yozgat and Aksaray: less developed region with more established migration flows.Adıyaman and _anlıurfa: less developed region with more recent migration flows.
Morocco: Nador: developed region with more established migration flows.Larache: developed region with more recent migration flows.Settat: developed region with more recent migration flows.Tiznit: less developed region with more established migration flows.Khenifra: less developed region with more recent migration flows.
Egypt: Cairo, Alexandria: developed region with more established migration flows.Urban lower & upper: developed region with more recent migration flows (Dakhalia, Sharkia,Menoufia, Bahera, Giza, Souhag, Menia, Qena).Rural lower: less developed region with more established migration flows (Dakhalia, Sharkia,Menoufia, Bahera).Rural upper: less developed region with more recent migration flows (Giza, Souhag, Menia, Qena).
Ghana: Greater Accra: developed region with more established migration flows.Ashanti: developed region with more recent migration flows.Eastern: less developed region with more established migration flows.Brong Ahafo: less developed region with more recent migration flows.
Senegal: Dakar/Pikine: developed region with more recent migration flows.Diourbel/Touba: less developed region with more recent migration flow.
Push and pull factors of international migration: a comparative report
60
5.2.2 Demographic characteristicsMost research shows that migration is selective of young men, especially in labour migration,in illegal (undocumented) migration and where cultural settings impede the migration ofunaccompanied women, as is the case in many Muslim countries. However, in somecountries, emigration of young women is important. An example are the Philippines fromwhere women migrate to for instance the Gulf Countries or Italy to work as domestic servants(see e.g., Barsotti and Lecchini, 1994; Eelens et al., eds. 1992; Lim, 1998; Santo Tomas,1998); and Turkey and Morocco, from where many women have left for family reunificationwith their husbands living in western Europe, or for marriage to a compatriot living there (seee.g. Esveldt et al., 1995).
The data from the five migrant-sending countries included in our study confirm thesewidespread general findings regarding the selectivity of young men (Figure 5.1). Most of theinternational migrants (recent and non-recent) in the five countries concerned are men.Furthermore, at the time of their last emigration, many of these men were in their twenties:well over 40 per cent of the migrants, except in Ghana (35 per cent). Men aged 30-39 formthe next important group in all countries, around 20-25 per cent of all migrants. In Turkey andMorocco, teenage men are also relatively numerous among the migrants, which is probablyrelated to the regulations in many European Union countries concerning family reunification forthese long-established migrant groups.
There are far fewer female migrants. Only in Ghana is almost one in four of the migrants awoman in her twenties or thirties. Both Turkish and Moroccan migration is dominated by men,despite the important phenomenon of family reunification and marriage migration. This findingis probably influenced by the fact that only those still forming part of a household in thecountry of origin are included in the survey. Women, who more often than men migrate for thepurpose of family reunification and marriage, are therefore less likely to surface in country-of-origin surveys.
The majority of the non-migrant reference persons (mainly economic heads of household)were ever married, five years prior to the survey: about 80 per cent or over, except forGhana (69 per cent) (see Table 5.2). Given the young age structure of the migrants, it comesas no surprise that their marital status reflects this: the percentage of ever-married migrants isin the region of 55-60 per cent in Ghana and Egypt, and around 45 per cent in Senegal andMorocco. Only in Turkey two out of three MMAs were married before migration. Among thoseunder 30 years of age, male migrants are more often married than male non-migrants, exceptin Morocco, where only one in four migrant men said they were married, against one in twoamong the non-migrants.
The few female MMAs are more likely to be married than the male MMAs. The difference isgreatest in Senegal, where 91 per cent of female migrants were married, but only 37 per centof the male migrants. These women migrate for family reunification. Migration of single womenis rare and is generally not viewed positively in this Muslim society.
In line with the migrants’ young age structure and the relatively high proportion who havenever been married, it comes as no surprise that many MMAs were still living with theirparents immediately prior to their last migration. The other important category is that ofmigrants living with their spouse (and children). Young people migrating from their parents’household are especially common in Morocco, Senegal and Egypt (about 40-50 per cent). Thisis in marked contrast with Ghana, where only 16 per cent were living with their parents, andalmost one in three MMAs were living alone before they migrated, something that is generallynot socially well accepted in the other countries.
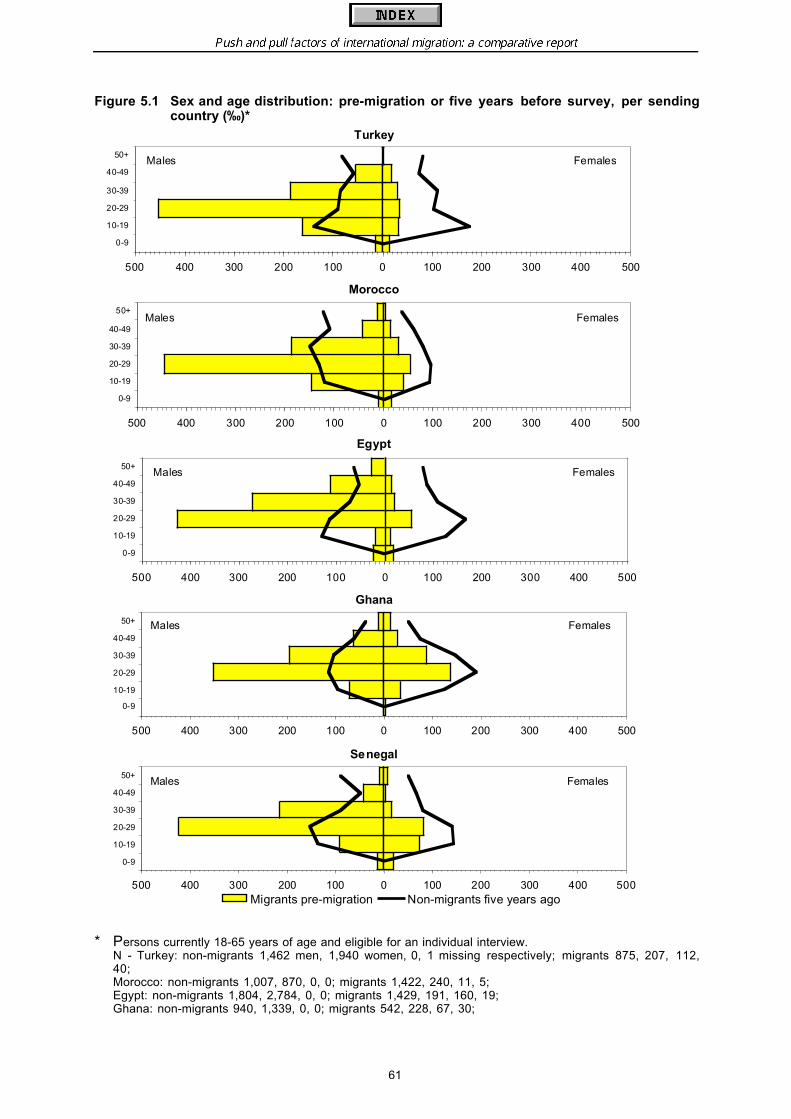
Push and pull factors of international migration: a comparative report
61
Figure 5.1 Sex and age distribution: pre-migration or five years before survey, per sendingcountry (‰)*
* Persons currently 18-65 years of age and eligible for an individual interview.N - Turkey: non-migrants 1,462 men, 1,940 women, 0, 1 missing respectively; migrants 875, 207, 112,40;Morocco: non-migrants 1,007, 870, 0, 0; migrants 1,422, 240, 11, 5;Egypt: non-migrants 1,804, 2,784, 0, 0; migrants 1,429, 191, 160, 19;Ghana: non-migrants 940, 1,339, 0, 0; migrants 542, 228, 67, 30;
Turkey
Morocco
Egypt
Ghana
Senegal
500 400 300 200 100 0 100 200 300 400 500
0-9
10-19
20-29
30-39
40-49
50+Males Females
500 400 300 200 100 0 100 200 300 400 500
0-9
10-19
20-29
30-39
40-49
50+Males Females
500 400 300 200 100 0 100 200 300 400 500
0-9
10-19
20-29
30-39
40-49
50+
Migrants pre-migration Non-migrants five years ago
Males Females
500 400 300 200 100 0 100 200 300 400 500
0-9
10-19
20-29
30-39
40-49
50+ Males Females
500 400 300 200 100 0 100 200 300 400 500
0-9
10-19
20-29
30-39
40-49
50+Males Females

Push and pull factors of international migration: a comparative report
62
Senegal: non-migrants 1,899, 2,388, 1, 0; migrants 1,467, 201, 167, 38.Table 5.2 Percentage ever married: pre-migration or five years before survey by sex, per
sending country*Non-migrants five years ago Migrants pre-migrationM F T M F T
Turkey % ever married 84 74 79 64 80 66 N 374 350 724 476 48 524 missing 6 1 7 5 1 6
Morocco % ever married 87 81 86 38 81 44 N 419 39 458 782 104 886 missing 22 1 23 2 - 2
Egypt % ever married 78 89 84 60 60 60 N 280 334 614 870 31 901 missing - - - - - -
Ghana % ever married 60 77 69 54 63 56 N 370 398 768 501 174 675 missing 11 15 26 7 5 12
Senegal % ever married 80 97 84 37 91 45 N 484 82 566 602 48 650 missing 1 - 1 1 - 1
* MMAs and non-migrant reference persons.
Among the non-migrant reference persons interviewed about their situation five years beforethe survey, about three out of four were living with their spouse or with their spouse andchildren (see Table 5.3). Only in Ghana were one-person households a significant alternative(27 per cent of reference persons).
The difference between migrants and non-migrants is particularly striking in Senegal andMorocco. In these two countries, 71 and 78 per cent of the non-migrant reference personsrespectively were living with their spouse, but only 28 and 38 per cent of the MMAs were.Instead, around half the MMAs (47 per cent in Senegal and 51 per cent in Morocco) wereliving with their parents.
Household size differs significantly between the countries, varying from often large andpolygamous households in Senegal to smaller nuclear households in Ghana. Irrespective ofdifferences in household size between the countries, households of MMA migrants prior totheir last emigration were on average larger than households of reference persons in non-migrant households five years prior to the survey. While average non-migrant household sizein Egypt, Turkey and Morocco was between 5.2 and 5.5, it was 6.0 to 6.5 in the recent-migrant households (Table 5.4). Senegalese households are much larger in general: theaverage household count was 9.0 members in non-migrant households, and 10.6 in migranthouseholds. The Ghanaian households are smallest: 3.8 among non-migrants and 4.3 amongmigrants; there are relatively many one-person households among them, as was shown inTable 5.3.

Push and pull factors of international migration: a comparative report
63
Table 5.3 Household composition: pre-migration or five years before survey, per sendingcountry (%)*
Non-migrants Migrants
Turkey living alone 12 19 with spouse/children (and others) 73 61 with children (and others excluding spouse) 2 3 with parents (and others excluding spouse and children) 13 16 with other relatives and non-relatives 0 0 total 100 100 N 728 524 missing 3 6
Morocco living alone 9 4 with spouse/children (and others) 78 38 with children (and others excluding spouse) 5 6 with parents (and others excluding spouse and children) 7 51 with other relatives and non-relatives 1 1 total 100 100 N 455 885 missing 26 3
Egypt living alone 5 2 with spouse/children (and others) 69 55 with children (and others excluding spouse) 11 4 with parents (and others excluding spouse and children) 15 39 with other relatives and non-relatives 1 1 total 100 100 N 610 900 missing 4 1
Ghana living alone 27 31 with spouse/children (and others) 53 41 with children (and others excluding spouse) 9 5 with parents (and others excluding spouse and children) 8 16 with other relatives and non-relatives 3 7 total 100 100 N 757 673 missing 37 14
Senegal living alone 8 6 with spouse/children (and others) 71 28 with children (and others excluding spouse) 10 9 with parents (and others excluding spouse and children) 5 47 with other relatives and non-relatives 7 10 total 100 100 N 565 649 missing 2 2
* MMAs and non-migrant reference persons.

Push and pull factors of international migration: a comparative report
64
Table 5.4 Average household size: pre-migration or five years before survey, per sendingcountry*
Non-migrants five years ago Migrants pre-migrationhousehold
sizeN missing household size N missing
Turkey 5.4 728 3 6.0 521 9Morocco 5.5 465 16 6.5 885 3Egypt 5.2 613 1 6.0 901 -Ghana 3.8 763 31 4.3 675 12Senegal 9.0 553 14 10.6 622 29
* MMAs and non-migrant reference persons.
MMAs are generally younger than the reference persons in non-migrant households, but thisdifference does not explain the differences in household sizes found. Indeed, for MMAs andreference persons under the age of 30, the difference between migrant and non-migranthouseholds is greater in Senegal (6.5 versus 10.4) and in Morocco (4.1 versus 6.6). Thus,non-migrant heads of households under 30 have relatively small households, but MMAs under30 come from relatively large households.
Summing up, migrants are mostly men in their twenties and thirties, and in some cases(Turkey) teenage men. Only in Ghana is female migration fairly important too. The young agestructure is reflected in the household situation of migrants. Many migrants were living withtheir parents, although a sizeable group were married and living with their spouse (andchildren) when they left to go abroad.
The limited representation of women in all countries other than Ghana is related to the culturalconditions in the countries of origin: migration of unmarried or unaccompanied women isgenerally not favoured in Muslim societies. Among the five countries included in the study,only the four survey regions in Ghana are predominantly non-Muslim. Family reunification doesoccur, especially in Morocco and Turkey; witness the large communities residing in manyEuropean countries. Men migrating from Egypt and Senegal leave their families at home muchmore often. For Egyptians, this is influenced by the fact that family reunification is not allowedin many of their main countries of destination (Gulf and Middle Eastern countries). InSenegalese society, with its large polygamous families, wives and children of migranthusbands/fathers are often incorporated into the household of the husband’s father (oranother senior male relative). Nowadays, with fewer options for legal admission to manycountries, migration of families and family reunification have become much more difficult for‘new’ migrant flows without a link to extensive migrant communities with established rights.
5.2.3 Socio-economic characteristicsDuring the 1960s, many of the migrants recruited for the European labour markets wererelatively uneducated, especially compared to the population in the receiving countries butalso to a certain extent compared to the population at origin. Many of those who went to workabroad had received little or no formal education at home. However, a brain drain has alsotaken place, partly because students did not always return home after studying abroad, andpartly because of migration of skilled workers. (See e.g., Fadayomi, 1996; Kritz and Caces,1992; Twum-Baah et al., eds., 1995). Countries have at times indicated concern about losingskilled workers, but these have usually been overshadowed by the positive effect ofmigration in the form of workers’ remittances. With educational levels in the main sendingcountries increasing, all other things being equal, migrants should nowadays be bettereducated as well. But are they more so than their non-migrating compatriots? Does migrationfavour the educated?
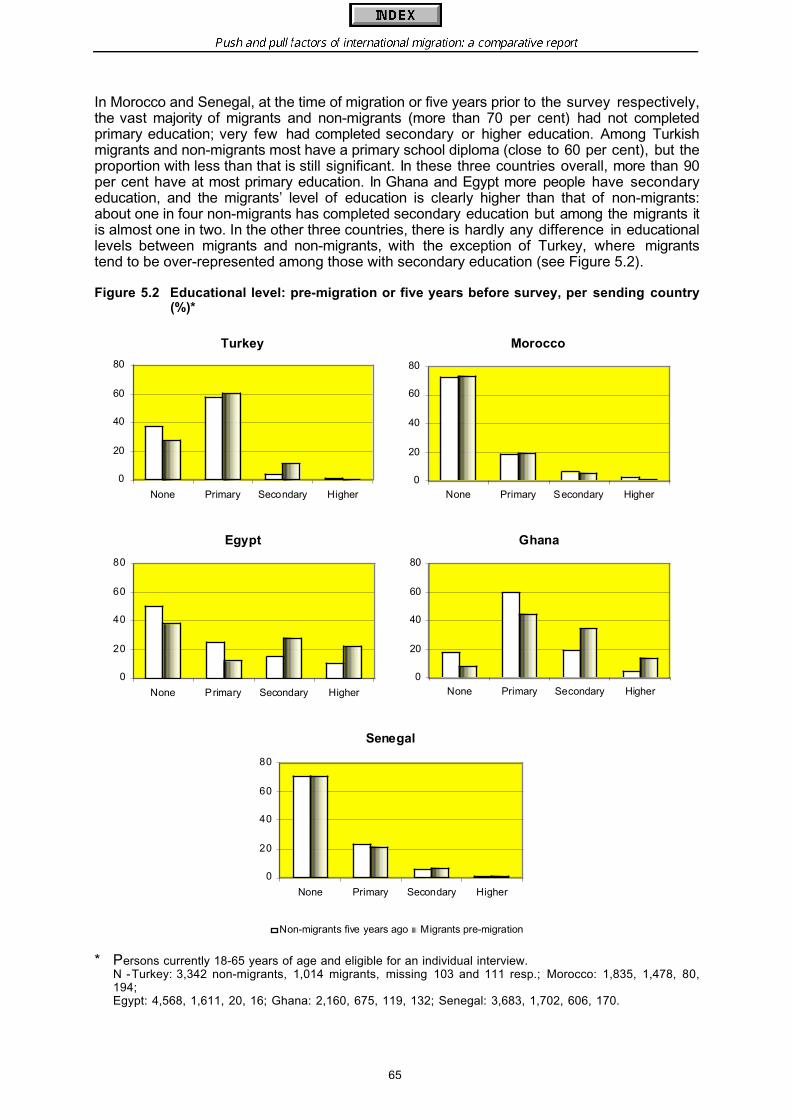
Push and pull factors of international migration: a comparative report
65
In Morocco and Senegal, at the time of migration or five years prior to the survey respectively,the vast majority of migrants and non-migrants (more than 70 per cent) had not completedprimary education; very few had completed secondary or higher education. Among Turkishmigrants and non-migrants most have a primary school diploma (close to 60 per cent), but theproportion with less than that is still significant. In these three countries overall, more than 90per cent have at most primary education. In Ghana and Egypt more people have secondaryeducation, and the migrants’ level of education is clearly higher than that of non-migrants:about one in four non-migrants has completed secondary education but among the migrants itis almost one in two. In the other three countries, there is hardly any difference in educationallevels between migrants and non-migrants, with the exception of Turkey, where migrantstend to be over-represented among those with secondary education (see Figure 5.2).
Figure 5.2 Educational level: pre-migration or five years before survey, per sending country(%)*
* Persons currently 18-65 years of age and eligible for an individual interview.N -Turkey: 3,342 non-migrants, 1,014 migrants, missing 103 and 111 resp.; Morocco: 1,835, 1,478, 80,194;Egypt: 4,568, 1,611, 20, 16; Ghana: 2,160, 675, 119, 132; Senegal: 3,683, 1,702, 606, 170.
Turkey
0
20
40
60
80
None Primary Secondary Higher
Morocco
0
20
40
60
80
None Primary Secondary Higher
Egypt
0
20
40
60
80
None Primary Secondary Higher
Ghana
0
20
40
60
80
None Primary Secondary Higher
Senegal
0
20
40
60
80
None Primary Secondary Higher
Non-migrants five years ago Migrants pre-migration
Push and pull factors of international migration: a comparative report
66
As on average MMAs are younger than non-migrant reference persons, age differences maybe confounding these findings. In most countries (with the exception of Ghana), there hasbeen a rapid improvement in education, which is reflected in the significant difference acrossage groups: among those younger than 30 there are far fewer without any education and/orwith no more than primary education, compared to the age group of 30 or older. Thedifferences observed between migrants and non-migrants are generally maintained for thetwo age groups, although the differences have decreased among Ghanaians under 30.
In conclusion, in Turkey, Egypt and Ghana, migrants generally have a higher level of educationthan non-migrants. In Senegal and Morocco, where the overall educational levels are lowest,there is hardly any educational difference between migrants and non-migrants. In comparisonto western countries of destination, migrants’ educational levels, although increasing, are stilllow, with many having no more than primary education.
Is migration a solution for a country’s surplus labour, that is, are those who are unemployedmore likely to migrate, in order to find work elsewhere? Are young people discouraged ineven looking for work, knowing their slim chances of finding any job, or any work suited totheir qualifications and skills?
It is clear from Figure 5.3 that in most countries the majority of migrants worked beforemigration and most non-migrants worked five years prior to the survey. The most importantdifference between migrants and non-migrants is the higher pre-migration unemploymentamong migrants. In that sense, migration may be seen as a welcome solution for the surplus inthe labour markets.
The patterns summarised in Figure 5.3 are strongly influenced by differences in the age-sexdistributions between the non-migrant and the migrant groups. In Egypt, 82 per cent of migrantmen and 84 per cent of non-migrant men were working. Men aged 30 or older were morelikely to work than those under 30, the difference being due partly to the higher proportion ofstudents among the younger men. Although relatively few respondents indicated that theywere unemployed before migration of five years before the survey, unemployment wasclearly more pronounced among migrants than among non-migrants. Ten per cent of migrantmen under 30 said they were unemployed before they migrated, against only four per cent ofnon-migrant men. Most non-migrant women were housewives. The few migrant womenMMAs in the survey were more often economically active; housewives were in the minority.
In Turkey too the vast majority of both migrant and non-migrant men were working (74 and 87per cent, respectively). The lower figure among migrant men can be explained by theirsignificantly higher unemployment: 20 per cent against only 5 per cent among non-migrantmen. Non-migrant women were more likely to be housewives than migrant women MMAs(although the number of female MMAs was low); nevertheless, over one third of non-migrantwomen were working too.
Morocco differs from the other countries in the significantly lower percentage of migrant menworking before migration: only 50 per cent, compared to 91 per cent among non-migrant men.The difference is most pronounced among men under the age of 30, where almost twice asmany non-migrants as migrants had work. The difference is partly due to the higherpercentage of migrant men reporting unemployment prior to migration (17 per cent, againstonly 5 per cent among young non-migrant men). But what is most striking is the highpercentage of men reporting that they were not working for other reasons. Some of themwere students. But most in this category said they were not working and were not looking forwork either: 26 per cent of migrant men under 30 (against only 3 per cent of non-migrantmen), and 16 per cent of migrant men aged 30 or over (against 6 per cent of the non-migrantmen in that age group).
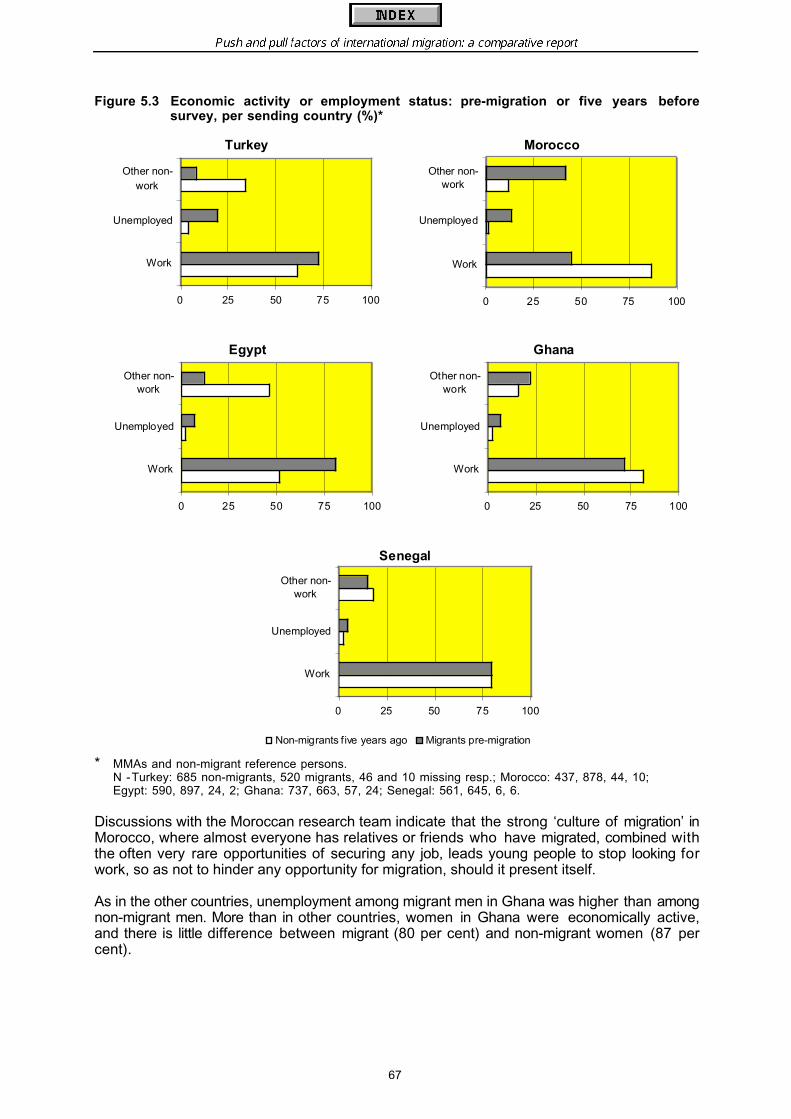
Push and pull factors of international migration: a comparative report
67
Figure 5.3 Economic activity or employment status: pre-migration or five years beforesurvey, per sending country (%)*
* MMAs and non-migrant reference persons.N -Turkey: 685 non-migrants, 520 migrants, 46 and 10 missing resp.; Morocco: 437, 878, 44, 10;Egypt: 590, 897, 24, 2; Ghana: 737, 663, 57, 24; Senegal: 561, 645, 6, 6.
Discussions with the Moroccan research team indicate that the strong ‘culture of migration’ inMorocco, where almost everyone has relatives or friends who have migrated, combined withthe often very rare opportunities of securing any job, leads young people to stop looking forwork, so as not to hinder any opportunity for migration, should it present itself.
As in the other countries, unemployment among migrant men in Ghana was higher than amongnon-migrant men. More than in other countries, women in Ghana were economically active,and there is little difference between migrant (80 per cent) and non-migrant women (87 percent).
Turkey
0 25 50 75 100
Work
Unemployed
Other non-work
Morocco
0 25 50 75 100
Work
Unemployed
Other non-work
Egypt
0 25 50 75 100
Work
Unemployed
Other non-work
Ghana
0 25 50 75 100
Work
Unemployed
Other non-work
Senegal
0 25 50 75 100
Work
Unemployed
Other non-work
Non-migrants five years ago Migrants pre-migration
Push and pull factors of international migration: a comparative report
68
Finally, Senegal repeats the familiar pattern of a dominance of workers among the men. Thereis little difference between migrants and non-migrants, and between younger and older men.The sample contained few female reference persons (heads of household) and few migrantwomen (MMAs).
Although with the exception of Ghana, there were relatively few migrant women MMAs, thegeneral picture is that these women were comparatively more often economically active priorto migration than non-migrant women (five years prior to the survey).
The majority of migrants and non-migrants work. Nevertheless from the above unemploymentemerges to a certain extent as a stimulus for migration. In a wider context, does theperception of poverty influence the decision to migrate? That is, do the poorest migrate, or is acertain threshold of wealth required for potential migrants to realise a move? Evidence frommacro-level studies indicates that migration levels associated with the poorest countries arelower than those connected with countries characterised by some economic development.Therefore, the argument that economic development will lead to a decrease in migration isconsidered to be valid only in the long term. Classic examples in Europe are Italy and Spain,which have shifted from emigration countries to immigration countries during the past decade.
To explore this issue, reference persons in non-migrant households and MMAs in recent-migrant households were asked if the financial situation of their household was sufficient orinsufficient (measured in four categories, see Figure 5.4) to buy all the basic needs for thehousehold, five years before the survey, or prior to the last migration respectively. Obviously,the answers should be interpreted with care, as they reflect retrospective opinions that maywell have been coloured by experience. In addition, cross-country comparison is hazardous,as the question may be viewed differently in different cultural settings. For example, in Ghana,it is not done to display one’s wealth in public as this may result in others demanding a share.In other cultural settings, indicating that one thinks one is better off than others may beconsidered evidence of unjustified pride and arrogance. On the other hand, some people maybe reluctant to admit poverty to an outsider.
Nevertheless, some findings emerge from Figure 5.4. In Turkey, Egypt and Ghana, migrantspronounce their household’s past financial situation insufficient more often than non-migrants.The difference between migrants and non-migrants is most striking in Turkey where themajority of migrants described their situation as insufficient (60 per cent) or barely sufficient(32 per cent), while non-migrants were much more likely to say their situation was sufficientor more than that (31 per cent, against only 8 per cent among migrants).
In Egypt, fewer people reported insufficient financial resources, but twice as many migrantsas non-migrants said so (15 versus 7 per cent, respectively). The fact that almost two out ofthree said that their financial situation prior to migration was sufficient could perhaps be partlyinfluenced by reluctance on the part of migrants to admit their lack of wealth.
As in Egypt, a majority of the respondents in Ghana considered their situation to be sufficientor barely sufficient, non-migrants more so (80 per cent) than migrants (66 per cent). Butalmost twice as many migrants as non-migrants considered their resources insufficient (18and 32 per cent, respectively).
Senegal differs from these three countries in that there is hardly any difference betweenmigrants and non-migrants reporting insufficient resources (21-23 per cent). The migrantsstand out among those who evaluate their financial situation as barely sufficient, whilst thenon-migrants are more likely to consider their situations as sufficient.
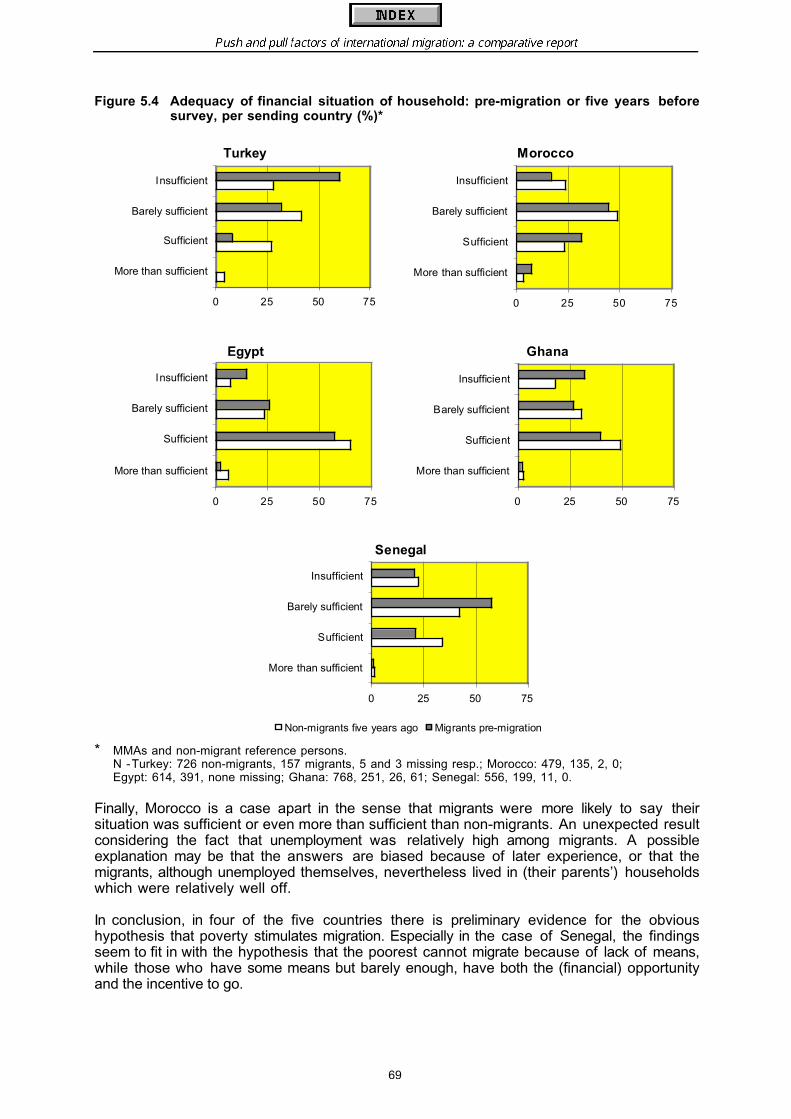
Push and pull factors of international migration: a comparative report
69
Figure 5.4 Adequacy of financial situation of household: pre-migration or five years beforesurvey, per sending country (%)*
* MMAs and non-migrant reference persons.N -Turkey: 726 non-migrants, 157 migrants, 5 and 3 missing resp.; Morocco: 479, 135, 2, 0;Egypt: 614, 391, none missing; Ghana: 768, 251, 26, 61; Senegal: 556, 199, 11, 0.
Finally, Morocco is a case apart in the sense that migrants were more likely to say theirsituation was sufficient or even more than sufficient than non-migrants. An unexpected resultconsidering the fact that unemployment was relatively high among migrants. A possibleexplanation may be that the answers are biased because of later experience, or that themigrants, although unemployed themselves, nevertheless lived in (their parents’) householdswhich were relatively well off.
In conclusion, in four of the five countries there is preliminary evidence for the obvioushypothesis that poverty stimulates migration. Especially in the case of Senegal, the findingsseem to fit in with the hypothesis that the poorest cannot migrate because of lack of means,while those who have some means but barely enough, have both the (financial) opportunityand the incentive to go.
Turkey
0 25 50 75
More than sufficient
Sufficient
Barely sufficient
Insufficient
Morocco
0 25 50 75
More than sufficient
Sufficient
Barely sufficient
Insufficient
Egypt
0 25 50 75
More than sufficient
Sufficient
Barely sufficient
Insufficient
Ghana
0 25 50 75
More than sufficient
Sufficient
Barely sufficient
Insufficient
Senegal
0 25 50 75
More than sufficient
Sufficient
Barely sufficient
Insufficient
Non-migrants five years ago Migrants pre-migration

Push and pull factors of international migration: a comparative report
70
5.3 Conclusions
International migration has affected a large proportion of households, at least in the regionsthat were included in the study. As these were selected because of their expected highincidence of migration, it is important to emphasise that the strong presence of migration is notrepresentative of each of the countries as a whole.
The preceding sections show many similarities between countries, such as the well-established fact that most international migrants are men who migrated when they were intheir twenties or thirties. Only in Ghana did we find a relatively large representation of femalemigrants.
Given the young age structure of migration, it is no surprise that migrants are more oftensingle and more often migrate from their parent’s home than non-migrants, especially inMorocco, Egypt and Senegal. Only in Ghana is living alone common, but this is a rare andsocially not well accepted household arrangement in the Muslim countries. Non-migrants areusually married men living in households with their wives (and children).
Female migrants are more likely to be married when they migrate than the men, influenced bythe fact that some of the women migrate for the purpose of family reunification. Migration ofunaccompanied or single women is often not looked upon favourably in the Muslim countries.Family reunification has taken place, particularly in Turkish and Moroccan migration, although itis not revealed clearly in the surveys, since family reunification tends to result in the completeremoval of the household from the country of origin. Senegal and Egypt are less influenced inthis respect. The traditional countries of destination of Egyptian migrants restrict familyreunification much more severely than European countries, resulting in wives and childrenstaying behind. The same applies to Senegalese migration in so far as it is migration to newdestinations; furthermore, the polygamous family structure has probably both facilitated andnecessitated arrangements where wives and children stay in the home country.
In comparison with western countries of destination the educational level of most migrants isstill low. Nevertheless, educational levels have increased, rapidly in some countries. InTurkey, Egypt and Ghana migrants have better education than non-migrants, even aftercontrolling for age differences between the non-migrants and migrants interviewed.However, in the Senegalese and Moroccan regions studied, where educational levels arelowest, there is hardly any difference between migrants and non-migrants.
In each of the five countries the vast majority of migrant and non-migrant men worked beforemigration or five years before the survey respectively. The common factor in all countries isthe higher pre-migration level of unemployment among migrants. Morocco seems to be aspecial case because of the large number of young men in particular (students excluded)reporting that they were not working and were not looking for work either. This may perhapsbe attributed to the limited opportunities for finding work, in combination with the pervasiveculture of migration. It leads young people to look for ways to migrate (as so many of theirfriends and relatives have done) rather than to try to build their future in Morocco.
Unemployment emerges as one of the factors influencing migration. Another way in whichdifficult economic conditions were measured was to ask households to evaluate their pastfinancial situation: was it sufficient to supply the basic needs for the household? The resultspoint to poverty as an incentive for migration: in Turkey, Egypt and Ghana, migrants moreoften reported that they had considered their financial resources insufficient than non-migrants. In Senegal, the same applied to the group which considered its financial situationbarely sufficient, but for those in the poorest condition there were no differences betweenmigrants and non-migrants, which may perhaps be explained by the difficulties very poormigrants face in financing their trip. It was only in Morocco that migrants evaluated theirfinancial situation more positively than non-migrants, which is unexpected if taken togetherwith the fact that unemployment was relatively high among migrants. Perhaps migrants in this

Push and pull factors of international migration: a comparative report
71
country, although unemployed themselves, lived in (their parents’) households which wererelatively well off.
This chapter has explored some of the characteristics of migrants and non-migrants and theirhouseholds. It provides us with some indications of the determinants of migration. Thefollowing chapter will explore individual motivations as another aspect of the determinants ofmigration.
Push and pull factors of international migration: a comparative report
73
6. WHY AND WHERE: MOTIVES AND DESTINATIONS
6.1 Introduction
This chapter begins with a discussion of recent migrants9 main reasons for their lastemigration from their country of origin (Section 6.2). Although the surveys allow for a fairlydetailed analysis of the often multiple motivations for migration, within the framework of thisfirst report motives will be grouped into three overall categories only: economic, family-relatedand other reasons.
For each of the sending countries surveyed, recent migrants’ main motives for leaving will bestudied by sex and by area of destination. For the latter variable a distinction between EU andother countries will be made. In addition, the main motives for leaving will be studied for recentcurrent migrants in the receiving countries. Comparisons between the corresponding migrantgroups will be made: for instance the motives of recent Egyptian migrants interviewed inEgypt and the motives of recent current Egyptian migrants interviewed in Italy. The data qualityconcerning the latter group may be considered higher because of the lower proportion ofproxy answers.
Section 6.3 focuses on the most important countries of (last) destination of recent migrants.Similarities and differences will be shown with regard to the distribution patterns of emigrationflows for the five sending countries. Also the degree of orientation towards the EU will becovered.
In addition to the motives for leaving the country of origin, the motives for choosing a specificcountry of destination are analysed in Section 6.4. In order to avoid getting duplicate answersin the survey, only MMAs were asked for their motives in moving to a particular country.10
Here too, for each of the sending and receiving countries surveyed the reasons are examinedby sex per EU or other destination.
Furthermore, the relation between the reasons for the last emigration from the country oforigin and the reasons for moving to a particular destination (again, in relation to the lastmigration) will be analysed. However, this analysis is hampered by the fact that the groups ofrespondents differ: MMAs (reasons for moving to a particular country) are only a selectedpart of the recent migrants (reasons for leaving the country of origin). This implies theexclusion of recent migrants aged under 18 at the time of their last migration, as well as ofother recent migrants who did not qualify for MMA. Together with the possibly disturbingeffects of proxy answers, especially for current migrants (including MMAs) in the sendingcountries this means that conclusions should be drawn with care.
Finally, Section 6.5 will summarise the main findings.
6.2 Motives for migration
For all international migrants, the migration history is recorded in Module G11 of thequestionnaire. Respondents were asked to indicate the main reason for leaving the country oforigin.
9 This category includes both current migrants and return migrants.10 For more details see Section 3.1.11 The module contains questions on all places where the person concerned lived for at least one year,
including timing or duration, and on overall reasons for leaving each place.
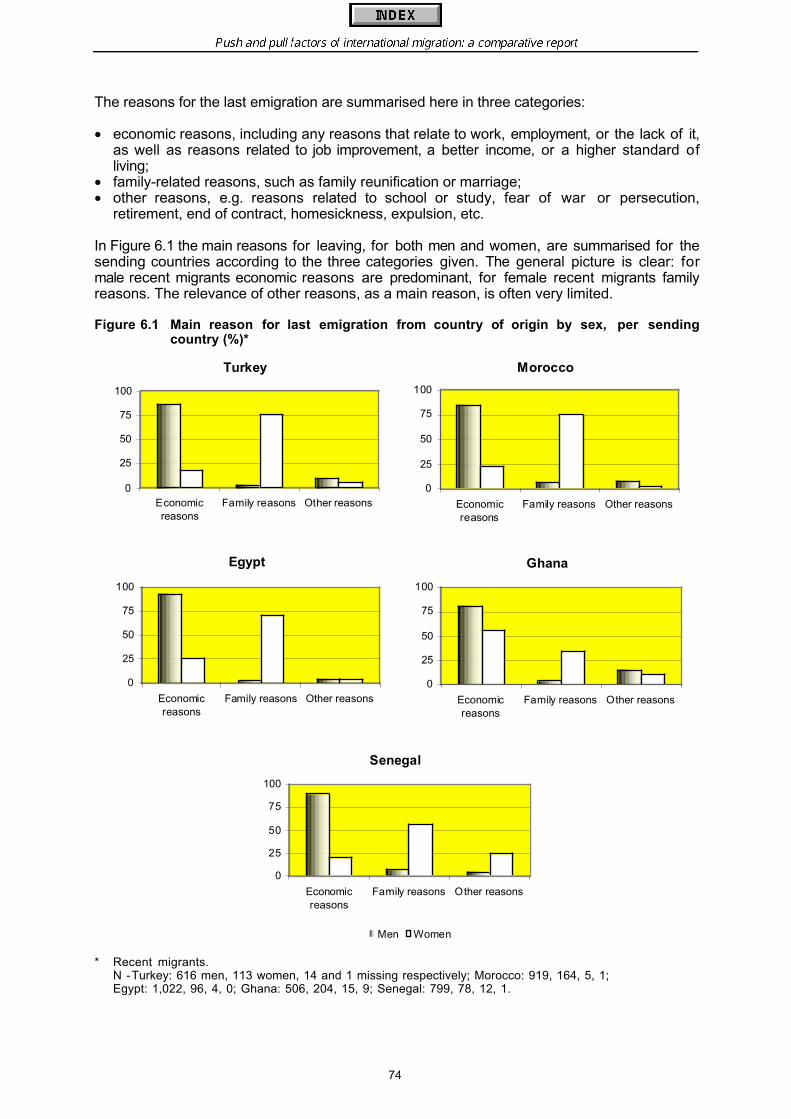
Push and pull factors of international migration: a comparative report
74
The reasons for the last emigration are summarised here in three categories:
• economic reasons, including any reasons that relate to work, employment, or the lack of it,as well as reasons related to job improvement, a better income, or a higher standard ofliving;
• family-related reasons, such as family reunification or marriage;• other reasons, e.g. reasons related to school or study, fear of war or persecution,
retirement, end of contract, homesickness, expulsion, etc.
In Figure 6.1 the main reasons for leaving, for both men and women, are summarised for thesending countries according to the three categories given. The general picture is clear: formale recent migrants economic reasons are predominant, for female recent migrants familyreasons. The relevance of other reasons, as a main reason, is often very limited.
Figure 6.1 Main reason for last emigration from country of origin by sex, per sendingcountry (%)*
* Recent migrants.N -Turkey: 616 men, 113 women, 14 and 1 missing respectively; Morocco: 919, 164, 5, 1;Egypt: 1,022, 96, 4, 0; Ghana: 506, 204, 15, 9; Senegal: 799, 78, 12, 1.
Turkey
0
25
50
75
100
Economicreasons
Family reasons Other reasons
Morocco
0
25
50
75
100
Economicreasons
Family reasons Other reasons
Egypt
0
25
50
75
100
Economicreasons
Family reasons Other reasons
Ghana
0
25
50
75
100
Economicreasons
Family reasons Other reasons
Senegal
0
25
50
75
100
Economicreasons
Family reasons Other reasons
Men Women
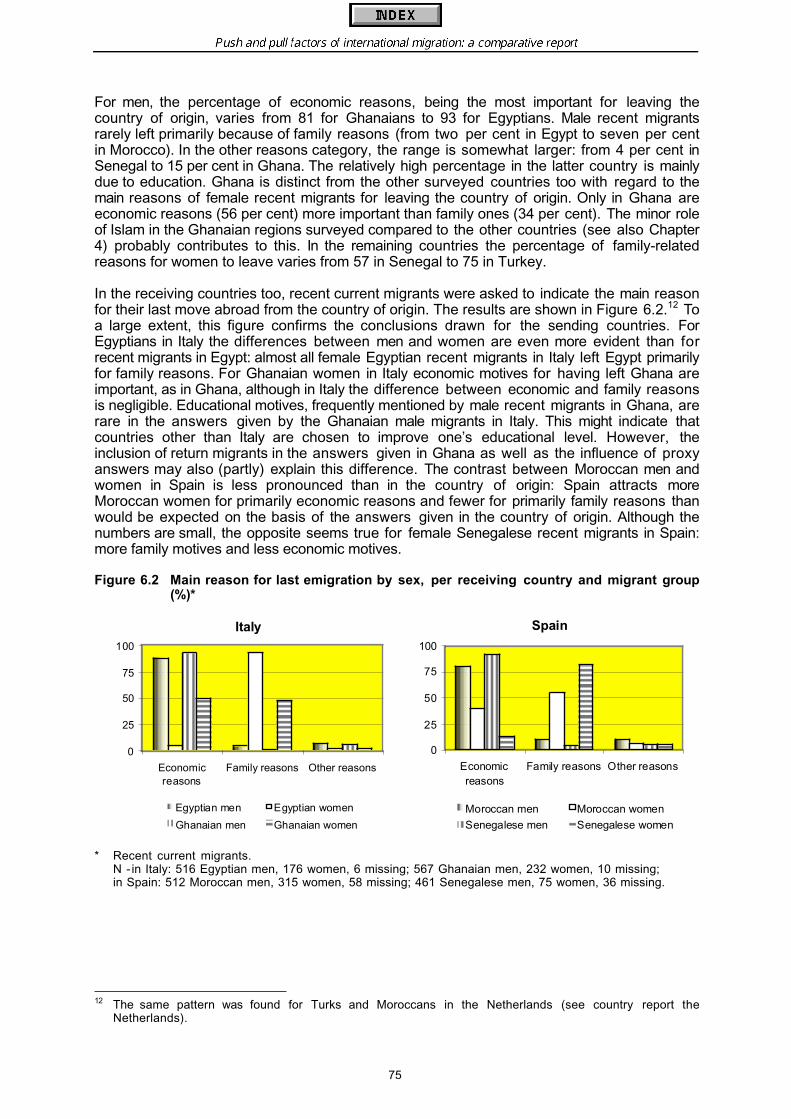
Push and pull factors of international migration: a comparative report
75
For men, the percentage of economic reasons, being the most important for leaving thecountry of origin, varies from 81 for Ghanaians to 93 for Egyptians. Male recent migrantsrarely left primarily because of family reasons (from two per cent in Egypt to seven per centin Morocco). In the other reasons category, the range is somewhat larger: from 4 per cent inSenegal to 15 per cent in Ghana. The relatively high percentage in the latter country is mainlydue to education. Ghana is distinct from the other surveyed countries too with regard to themain reasons of female recent migrants for leaving the country of origin. Only in Ghana areeconomic reasons (56 per cent) more important than family ones (34 per cent). The minor roleof Islam in the Ghanaian regions surveyed compared to the other countries (see also Chapter4) probably contributes to this. In the remaining countries the percentage of family-relatedreasons for women to leave varies from 57 in Senegal to 75 in Turkey.
In the receiving countries too, recent current migrants were asked to indicate the main reasonfor their last move abroad from the country of origin. The results are shown in Figure 6.2.12 Toa large extent, this figure confirms the conclusions drawn for the sending countries. ForEgyptians in Italy the differences between men and women are even more evident than forrecent migrants in Egypt: almost all female Egyptian recent migrants in Italy left Egypt primarilyfor family reasons. For Ghanaian women in Italy economic motives for having left Ghana areimportant, as in Ghana, although in Italy the difference between economic and family reasonsis negligible. Educational motives, frequently mentioned by male recent migrants in Ghana, arerare in the answers given by the Ghanaian male migrants in Italy. This might indicate thatcountries other than Italy are chosen to improve one’s educational level. However, theinclusion of return migrants in the answers given in Ghana as well as the influence of proxyanswers may also (partly) explain this difference. The contrast between Moroccan men andwomen in Spain is less pronounced than in the country of origin: Spain attracts moreMoroccan women for primarily economic reasons and fewer for primarily family reasons thanwould be expected on the basis of the answers given in the country of origin. Although thenumbers are small, the opposite seems true for female Senegalese recent migrants in Spain:more family motives and less economic motives.
Figure 6.2 Main reason for last emigration by sex, per receiving country and migrant group(%)*
* Recent current migrants.N - in Italy: 516 Egyptian men, 176 women, 6 missing; 567 Ghanaian men, 232 women, 10 missing;in Spain: 512 Moroccan men, 315 women, 58 missing; 461 Senegalese men, 75 women, 36 missing.
12 The same pattern was found for Turks and Moroccans in the Netherlands (see country report the
Netherlands).
Italy
0
25
50
75
100
Economicreasons
Family reasons Other reasons
Egyptian men Egyptian women
Ghanaian men Ghanaian women
Spain
0
25
50
75
100
Economicreasons
Family reasons Other reasons
Moroccan men Moroccan women
Senegalese men Senegalese women

Push and pull factors of international migration: a comparative report
76
One might wonder whether the main reasons for leaving the country of origin are connectedwith the country of destination. In this respect a distinction is made in Figure 6.3 between EUand other countries for the five sending countries. From this figure it appears that there areonly slight differences when the main reasons for the last emigration are crossed with thearea of destination.
Family reasons are given more often for Turkish and Moroccan recent migrants who left forEU countries, while the opposite is true for Senegalese migrants. Given the migration historyto EU countries (long for Turks and Moroccans, short for Senegalese, except for those inFrance) this conclusion is as expected. In the cases of Ghana and Egypt, family reasonsseem to be not related to the area of destination. Furthermore, there are some remarkabledifferences in the ‘other reasons’ category. With the exception of Egypt, other reasons(mostly related to school/study) underlie migration to non-EU countries more frequently.
Figure 6.3 Main reason for last emigration from country of origin by area of destination, persending country (%)*
* Recent migrants.N -Turkey: 553 EU, 170 non-EU, 21 missing; Morocco: 1,024, 50, 17;Egypt: 113, 1,002, 7; Ghana: 256, 408, 70; Senegal: 488, 388, 14.
Turkey
0
25
50
75
100
Economicreasons
Family reasons Other reasons
Morocco
0
25
50
75
100
Economicreasons
Family reasons Other reasons
Egypt
0
25
50
75
100
Economicreasons
Family reasons Other reasons
Ghana
0
25
50
75
100
Economicreasons
Family reasons Other reasons
Senegal
0
25
50
75
100
Economicreasons
Family reasons Other reasons
EU non-EU

Push and pull factors of international migration: a comparative report
77
This may indicate that EU countries generally attract fewer migrants for educational purposesthan other countries. This would not be surprising given the restrictive admissions policies inthe European Union. Almost the only options to enter (most of) the EU countries legally are forfamily reunification of close kin, marriage or, with less certainty, for asylum (see e.g. Schoorland Idema, 1997). A few exceptions are made only for high-level education, or specificprofessional categories. Remembering the relatively high educational level of Egyptianmigrants (see Chapter five), this may help to explain the special position of Egyptians in thiscontext.
6.3 Countries of destination
In Figure 6.4 the main countries of last destination of all recent migrants are shown for eachof the sending countries surveyed. It is worth repeating here that households that migrated asa whole are not included in the surveys in the sending countries. To that extent there may bea bias in the study of the determinants of migration. This should be kept in mind when judgingthe following results.13
While reasons for emigration show a remarkable resemblance between the countries, largedifferences appear to exist in the distribution pattern of the emigration flows in the respectivecountries (cf. Chapter 4). Emigration from Turkey and Morocco (as measured in the survey) isstrongly EU-oriented. From Morocco, only four per cent leave for a non-EU country. Althoughthe equivalent Turkish percentage is significantly higher (21), it includes a substantial flow to(non-EU) Switzerland (8 per cent). The conclusion that emigration from both Turkey andMorocco is mainly directed towards EU countries does not mean that the same EU countriesare involved. Only France and the Netherlands are common destination countries whenconsidering the top five for Turkey and Morocco. Almost half of the Turkish migration isdirected towards Germany, followed at some considerable distance by Austria and France(both about ten per cent). However, Germany and Austria do not attract Moroccans, whereasFrance is the number one destination for Moroccans, closely followed by Italy (28 per cent)and Spain (20 per cent). These last two countries in turn do not seem to be attractive toTurks.
The Sub-Saharan African countries show completely different emigration patterns. Only aminority of Ghanaian and Senegalese emigrants head for EU countries (43 and 41 per centrespectively). The emigration pattern of Ghanaians is clearly mixed, with the USA, Germany,Nigeria and Italy as the top four. This is less so for Senegal: apart from a strong orientationtowards Italy, Senegalese emigrants in particular leave for other African countries (Gambia,Mauritania and Ivory Coast). In addition, France and Spain play modest roles.
For Egyptians, emigration to EU countries is of minor importance (only six per cent). Instead,Egyptian migrants move mainly to other Middle East countries. Saudi Arabia is the mostfavourite destination (almost 40 per cent), followed by Iraq (17 per cent), Kuwait (11 per cent)and Jordan (10 per cent).
The great variety in the emigration distribution patterns of the countries surveyed underlines,amongst other things, the relevance of the (migration) history of each of those countries.Previous colonial bonds (e.g. Morocco and France, Morocco and Spain, Ghana and the UK,Senegal and France) continue to be reflected in migration flows long after the end of formalcolonisation. Of course, a common language and well-established networks do contribute tothis, also where there are no previous colonial ties (for instance Egyptians moving to Arabspeaking countries).
13 For Turks and Moroccans this bias is probably more evident than for the other populations surveyed.
However, the bias effects may be weakened by the fact that migration of whole households often relatesto ‘old’ migration, while this study concentrates on recent migration.
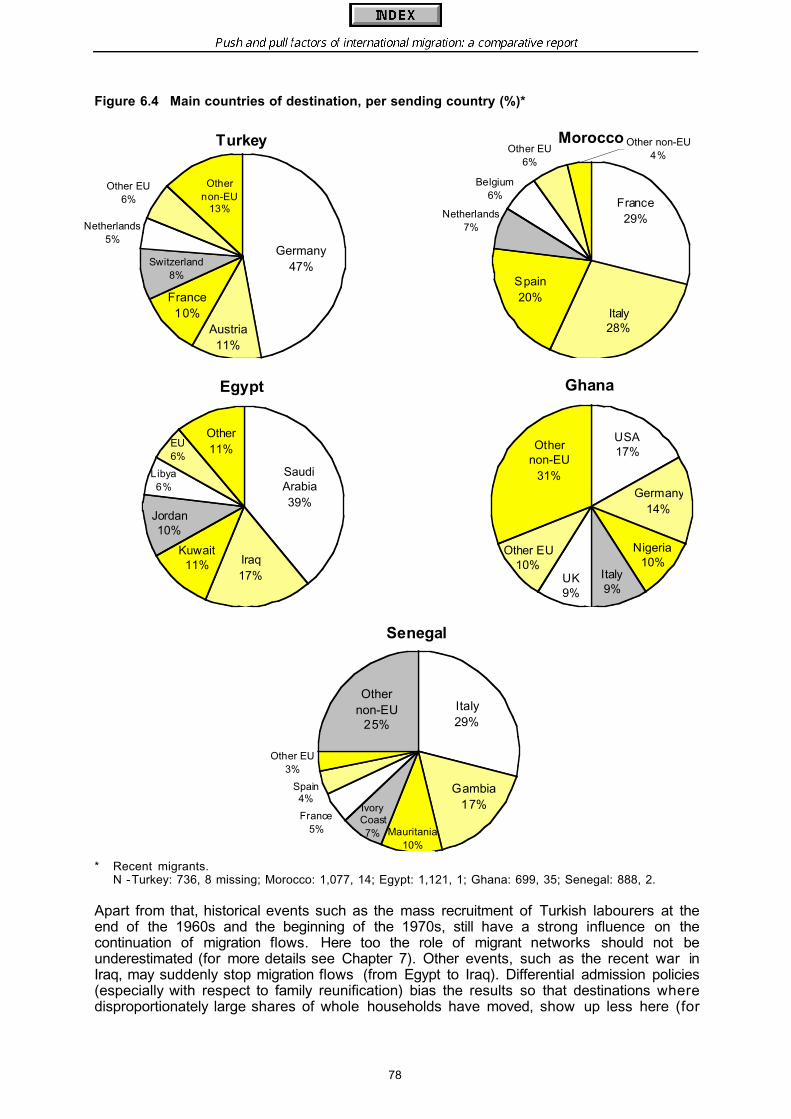
Push and pull factors of international migration: a comparative report
78
Figure 6.4 Main countries of destination, per sending country (%)*
* Recent migrants.N -Turkey: 736, 8 missing; Morocco: 1,077, 14; Egypt: 1,121, 1; Ghana: 699, 35; Senegal: 888, 2.
Apart from that, historical events such as the mass recruitment of Turkish labourers at theend of the 1960s and the beginning of the 1970s, still have a strong influence on thecontinuation of migration flows. Here too the role of migrant networks should not beunderestimated (for more details see Chapter 7). Other events, such as the recent war inIraq, may suddenly stop migration flows (from Egypt to Iraq). Differential admission policies(especially with respect to family reunification) bias the results so that destinations wheredisproportionately large shares of whole households have moved, show up less here (for
Turkey
Germany47%
Other non-EU
13%
Other EU6%
Netherlands5%
Switzerland8%
France10%
Austria11%
MoroccoOther EU
6%
Belgium6%
Netherlands7%
Other non-EU4%
Spain20%
France29%
Italy28%
Ghana
USA17%
Germany14%
Nigeria10%
Italy9%
UK9%
Other EU10%
Other non-EU
31%
Senegal
Italy29%
Gambia17%
Mauritania10%
Ivory Coast
7%
France5%
Spain4%
Other EU3%
Other non-EU
25%
Egypt
Iraq17%
Saudi Arabia39%
Other11%EU
6%
Libya6%
Jordan10%
Kuwait11%
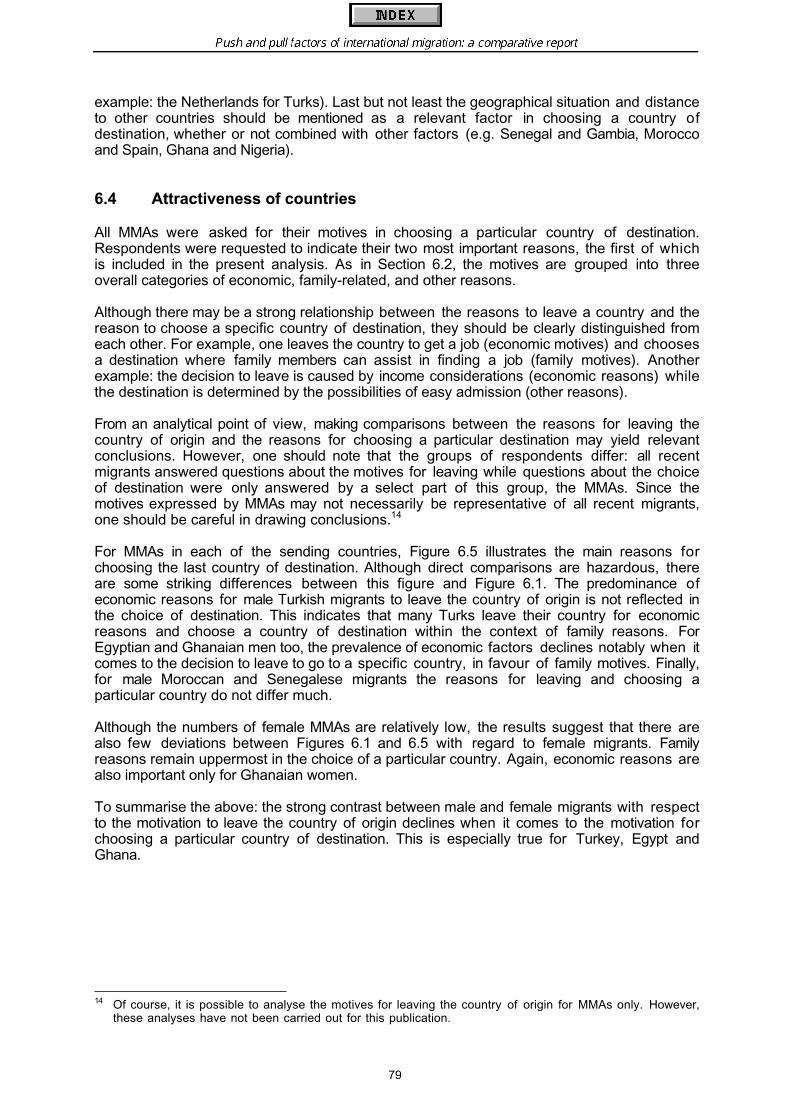
Push and pull factors of international migration: a comparative report
79
example: the Netherlands for Turks). Last but not least the geographical situation and distanceto other countries should be mentioned as a relevant factor in choosing a country ofdestination, whether or not combined with other factors (e.g. Senegal and Gambia, Moroccoand Spain, Ghana and Nigeria).
6.4 Attractiveness of countries
All MMAs were asked for their motives in choosing a particular country of destination.Respondents were requested to indicate their two most important reasons, the first of whichis included in the present analysis. As in Section 6.2, the motives are grouped into threeoverall categories of economic, family-related, and other reasons.
Although there may be a strong relationship between the reasons to leave a country and thereason to choose a specific country of destination, they should be clearly distinguished fromeach other. For example, one leaves the country to get a job (economic motives) and choosesa destination where family members can assist in finding a job (family motives). Anotherexample: the decision to leave is caused by income considerations (economic reasons) whilethe destination is determined by the possibilities of easy admission (other reasons).
From an analytical point of view, making comparisons between the reasons for leaving thecountry of origin and the reasons for choosing a particular destination may yield relevantconclusions. However, one should note that the groups of respondents differ: all recentmigrants answered questions about the motives for leaving while questions about the choiceof destination were only answered by a select part of this group, the MMAs. Since themotives expressed by MMAs may not necessarily be representative of all recent migrants,one should be careful in drawing conclusions.14
For MMAs in each of the sending countries, Figure 6.5 illustrates the main reasons forchoosing the last country of destination. Although direct comparisons are hazardous, thereare some striking differences between this figure and Figure 6.1. The predominance ofeconomic reasons for male Turkish migrants to leave the country of origin is not reflected inthe choice of destination. This indicates that many Turks leave their country for economicreasons and choose a country of destination within the context of family reasons. ForEgyptian and Ghanaian men too, the prevalence of economic factors declines notably when itcomes to the decision to leave to go to a specific country, in favour of family motives. Finally,for male Moroccan and Senegalese migrants the reasons for leaving and choosing aparticular country do not differ much.
Although the numbers of female MMAs are relatively low, the results suggest that there arealso few deviations between Figures 6.1 and 6.5 with regard to female migrants. Familyreasons remain uppermost in the choice of a particular country. Again, economic reasons arealso important only for Ghanaian women.
To summarise the above: the strong contrast between male and female migrants with respectto the motivation to leave the country of origin declines when it comes to the motivation forchoosing a particular country of destination. This is especially true for Turkey, Egypt andGhana.
14 Of course, it is possible to analyse the motives for leaving the country of origin for MMAs only. However,
these analyses have not been carried out for this publication.
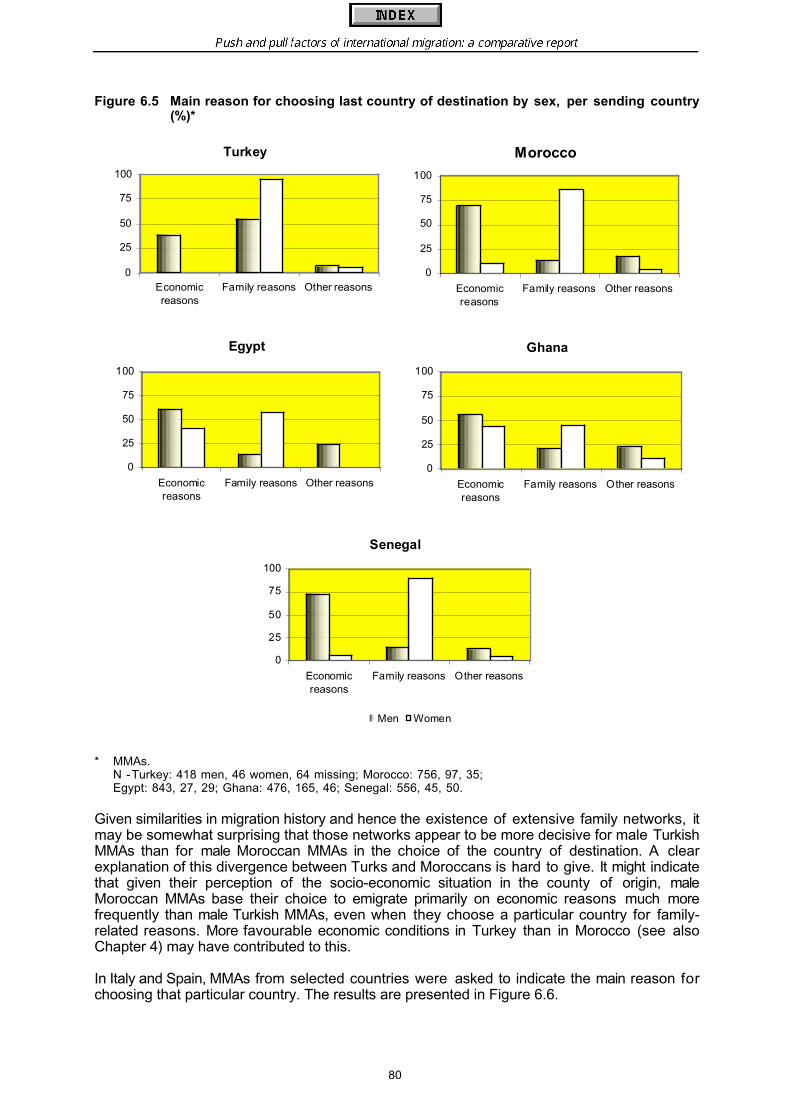
Push and pull factors of international migration: a comparative report
80
Figure 6.5 Main reason for choosing last country of destination by sex, per sending country(%)*
* MMAs.N -Turkey: 418 men, 46 women, 64 missing; Morocco: 756, 97, 35;Egypt: 843, 27, 29; Ghana: 476, 165, 46; Senegal: 556, 45, 50.
Given similarities in migration history and hence the existence of extensive family networks, itmay be somewhat surprising that those networks appear to be more decisive for male TurkishMMAs than for male Moroccan MMAs in the choice of the country of destination. A clearexplanation of this divergence between Turks and Moroccans is hard to give. It might indicatethat given their perception of the socio-economic situation in the county of origin, maleMoroccan MMAs base their choice to emigrate primarily on economic reasons much morefrequently than male Turkish MMAs, even when they choose a particular country for family-related reasons. More favourable economic conditions in Turkey than in Morocco (see alsoChapter 4) may have contributed to this.
In Italy and Spain, MMAs from selected countries were asked to indicate the main reason forchoosing that particular country. The results are presented in Figure 6.6.
Turkey
0
25
50
75
100
Economicreasons
Family reasons Other reasons
Morocco
0
25
50
75
100
Economicreasons
Family reasons Other reasons
Egypt
0
25
50
75
100
Economicreasons
Family reasons Other reasons
Ghana
0
25
50
75
100
Economicreasons
Family reasons Other reasons
Senegal
0
25
50
75
100
Economicreasons
Family reasons Other reasons
Men Women
Push and pull factors of international migration: a comparative report
81
Figure 6.6 Main reason for choosing last country of destination by sex, per receivingcountry and migrant group (%)*
* MMAs.N - in Italy: 482 Egyptian men, 24 women, 2 missing; 543 Ghanaian men, 123 women, none missing;in Spain: 410 Moroccan men, 136 women, 52 missing; 399 Senegalese men, 43 women, 72 missing.
For Egyptian and Ghanaian migrants in Italy, as well as for Senegalese migrants in Spain, theresemblance to Figure 6.5 is clearly visible. Obviously, the motivation by Egyptians andGhanaians in Italy in choosing that country corresponds with the general motivation ofEgyptians and Ghanaians in choosing a country of destination. The same holds forSenegalese in Spain.
Notably different results are observed only for Moroccans interviewed in Spain: for Moroccanwomen the choice of Spain was more often determined by economic motives than could beexpected on the basis of the results in Figure 6.5, while the opposite is true for Moroccanmen.15 This might indicate a special position for Spain compared to other destinations ofMoroccans, both geographically (Spain is the nearest EU country to Morocco) and mentally(Moroccans consider Spain relatively easy to enter, even without the required documents;see Chapter 7).
Finally, Figure 6.7 focuses on differences in motivation between the choice of EU and othercountries. These differences are manifest for Turkish MMAs: family motives determine twoout of every three moves to the EU against one out of every four to other countries. Economicreasons appear to be more important when a non-EU country is chosen. Other reasons formoving to the EU are hardly mentioned by Turkish MMAs; other reasons for moving todestinations outside the EU often relate to educational opportunities and perceived easyadmission.
As noted before, the picture for Moroccan MMAs is quite different from the Turkish one.Although family reasons play a more substantial role in choosing the EU (23 per cent) than inchoosing other destinations (5 per cent), economic reasons remain dominant (62 per cent).Again this might indicate that given their perception of the socio-economic situation in thecounty of origin, male Moroccan MMAs base their choice primarily on economic reasons muchmore often than male Turkish MMAs do, even when they have actually entered a country forfamily reasons. Less favourable economic conditions in Morocco than in Turkey (see alsoChapter 4) may have contributed to this.
15 A similar conclusion was drawn with regard to the motives for leaving the country of origin (Figure 6.2
compared to Figure 6.1).
Italy
0
25
50
75
100
Economicreasons
Family reasons Other reasons
Egyptian men Egyptian women
Ghanaian men Ghanaian women
Spain
0
25
50
75
100
Economicreasons
Family reasons Other reasons
Moroccan men Moroccan women
Senegalese men Senegalese women
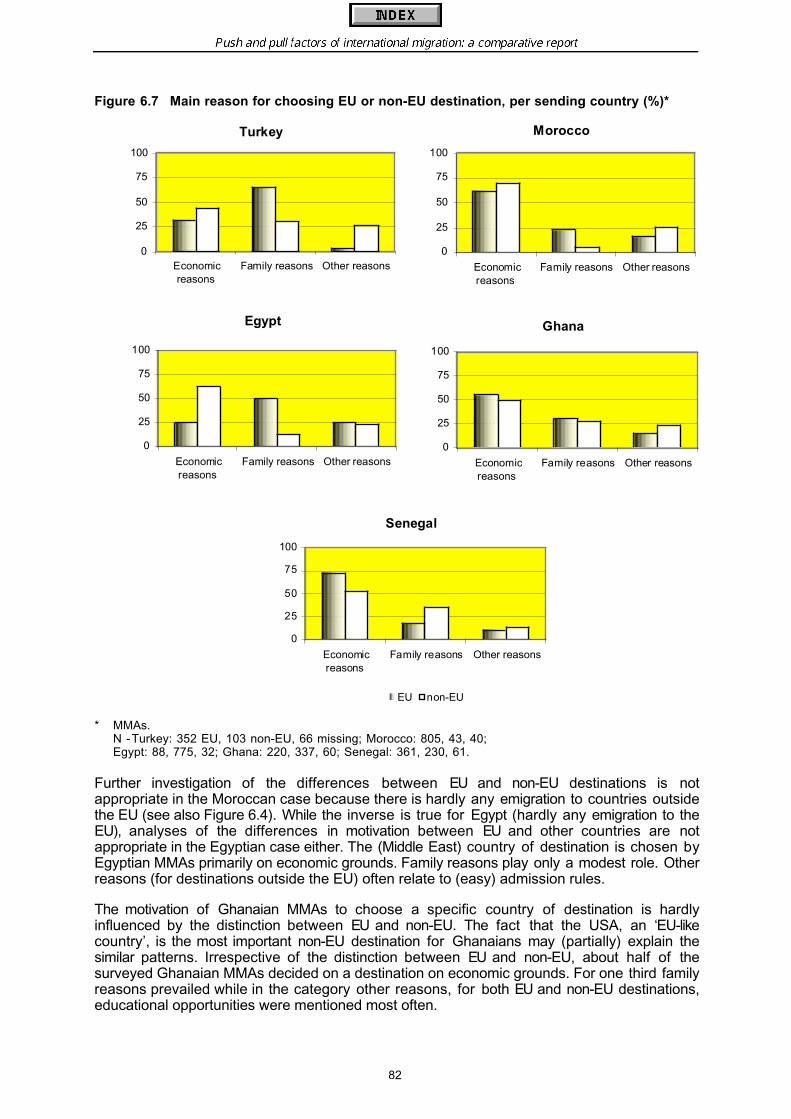
Push and pull factors of international migration: a comparative report
82
Figure 6.7 Main reason for choosing EU or non-EU destination, per sending country (%)*
* MMAs.N -Turkey: 352 EU, 103 non-EU, 66 missing; Morocco: 805, 43, 40;Egypt: 88, 775, 32; Ghana: 220, 337, 60; Senegal: 361, 230, 61.
Further investigation of the differences between EU and non-EU destinations is notappropriate in the Moroccan case because there is hardly any emigration to countries outsidethe EU (see also Figure 6.4). While the inverse is true for Egypt (hardly any emigration to theEU), analyses of the differences in motivation between EU and other countries are notappropriate in the Egyptian case either. The (Middle East) country of destination is chosen byEgyptian MMAs primarily on economic grounds. Family reasons play only a modest role. Otherreasons (for destinations outside the EU) often relate to (easy) admission rules.
The motivation of Ghanaian MMAs to choose a specific country of destination is hardlyinfluenced by the distinction between EU and non-EU. The fact that the USA, an ‘EU-likecountry’, is the most important non-EU destination for Ghanaians may (partially) explain thesimilar patterns. Irrespective of the distinction between EU and non-EU, about half of thesurveyed Ghanaian MMAs decided on a destination on economic grounds. For one third familyreasons prevailed while in the category other reasons, for both EU and non-EU destinations,educational opportunities were mentioned most often.
Turkey
0
25
50
75
100
Economicreasons
Family reasons Other reasons
Morocco
0
25
50
75
100
Economicreasons
Family reasons Other reasons
Egypt
0
25
50
75
100
Economicreasons
Family reasons Other reasons
Ghana
0
25
50
75
100
Economicreasons
Family reasons Other reasons
Senegal
0
25
50
75
100
Economicreasons
Family reasons Other reasons
EU non-EU
Push and pull factors of international migration: a comparative report
83
For Senegalese, three quarters of moves to the EU are motivated by economic reasonsagainst one in two to other countries. On the other hand, family reasons are more importantwhen it comes to emigration to non-EU countries (35 per cent against 17 per cent). This is notsurprising given their short EU migration history (with the exception of France) and themigration links with other African countries that have been in existence for longer.
6.5 Conclusions
In general terms, the five sending countries show many similarities in motives for leaving thecountry of origin as well as in motives for choosing a particular destination. However, largedifferences appear to exist in the distribution pattern of the emigration flows of the respectivecountries, including the degree of EU orientation. The great variety in the emigration distributionpatterns of the countries surveyed underlines amongst other things the relevance of the(migration) history of each of those countries. Previous colonial bonds continue to bereflected in migration flows long after formal colonisation has ended. Of course, a commonlanguage and well established networks contribute to this, also where colonial ties arelacking. Apart from that, historical events such as the mass recruitment of Turkish andMoroccan labourers at the end of the 1960s and the beginning of the 1970s, still have astrong influence on the continuation of migration flows. Here too, the role of migrant networksshould not be underestimated (see also Chapter 7). Other events, such as wars and civilconflicts, may suddenly generate mass emigration (refugee) flows from the countryconcerned and stop immigration flows from other countries. Furthermore, the role of(changing) admission policies and the perception of these policies by (potential) migrants maystrongly influence the distribution patterns of emigration flows. For example, frequentregularisation campaigns (as in Italy and Spain) could encourage undocumented migration tothese countries. Last but not least the geographical situation and distance to other countriesshould be mentioned as a relevant factor in choosing a country of destination, whether or notcombined with other factors.
The main reasons for deciding to leave the country of origin are strongly related to thedistinction between men’s and women’s motives. In general, economic motives predominatefor male migrants while family-related reasons predominate for female migrants. Therelevance of other reasons, as a main motive, is often limited. Mostly, those other reasonsinvolve educational opportunities. This conclusion reflects the general emigration pattern ofsending countries, starting with individual migration, primarily involving men looking for a job oreducation, or escaping from persecution, and is followed gradually over time by familyreunification migration and family formation migration, primarily involving women.
Ghana is the exception to the rule that by far most female migrants leave for family motives:economic motives appear to be more important for Ghanaian women. The minor role of Islam inGhana compared to the other countries surveyed probably contributes to this.
Other than for Ghanaians, the sharp contrast in motives between male and female migrantsfor leaving the country of origin is confirmed by Egyptian migrants who were interviewed inItaly, and by Moroccan and Senegalese migrants who were interviewed in Spain.
Comparison of EU destinations with others tells us that there are only slight differences in themain reasons for emigration. Family reasons are given more often for Turkish and Moroccanrecent migrants who left for EU countries, while the opposite is true for Senegalese migrants.Furthermore, there are some remarkable differences with regard to the category ‘otherreasons’. With the exception of Egypt, other reasons (mostly related to school/study) morefrequently underlie migration to non-EU countries. This may indicate that EU countriesgenerally attract fewer migrants for educational purposes, than other countries. This is notsurprising given the restrictive admission policies in the European Union, which in practiceleave almost only family reunification of close kin and marriage as options to enter (most of)the EU countries legally.
Push and pull factors of international migration: a comparative report
84
Emigration from Turkey and Morocco is strongly EU-oriented. However, this does not meanthat the same EU countries are concerned. When looking at the top five destination countries,Turkey and Morocco have only France and the Netherlands in common. On the other hand,Germany (number one destination for Turks) and Austria (number two) do not attractMoroccans, whereas Italy (number two destination for Moroccans) and Spain (number three)do not attract Turks. Only a minority of Ghanaian and Senegalese emigrants head for EUcountries. The emigration pattern of Ghanaians is clearly mixed with the USA, Germany, Italyand Nigeria as the top four. This is less true for Senegal: apart from a strong orientationtowards Italy, Senegalese emigrants moved to other African countries (Gambia, Mauritaniaand Ivory Coast). In addition, France and Spain play modest roles. Emigration to EU countriesis hardly important to Egyptians. Instead, Egyptian migrants moved mainly to Middle Eastcountries (Saudi Arabia, Iraq, Kuwait and Jordan). After the Gulf War migration to Iraq came toan end.
The strong contrast between male and female migrants with respect to their motivation toleave their country of origin declines, especially in Turkey, Egypt and Ghana, when focusingon the motivation for choosing a particular destination. For Turkish, Egyptian and Ghanaianmen the prevalence of economic factors in the decision to choose a specific country declinesnoticeably in favour of family motives. The reasons for leaving and choosing do not differmuch for male Moroccan and Senegalese migrants. The deviations for female migrants arealso insignificant. For Egyptian and Ghanaian migrants in Italy, as well as for Senegalesemigrants in Spain, the main reasons for choosing the country of destination hardly divergefrom the results of the choice of destination obtained in the respective countries of origin.Notably different results are observed only for Moroccans interviewed in Spain: for Moroccanwomen, choosing Spain was determined more often by economic motives than could beexpected on the basis of the answers that were given in the Moroccan survey, while theopposite was true for Moroccan men. This may indicate a special position for Spain comparedto other destinations of Moroccans, both geographically (Spain is the nearest EU country toMorocco) and mentally (Moroccans consider Spain relatively easy to enter, even without therequired documents; see Chapter 7).
The differences in motivation between the choice of EU and other countries are manifest forTurkish migrants: family motives determine two out of three moves to the EU against one infour moves to other countries. Economic reasons appear to be more important in the choice ofnon-EU countries. Other reasons for moving to the EU are hardly mentioned. Other reasonsfor moving to destinations outside the EU often relate to educational opportunities and easyadmission. This conclusion mirrors the history of Turkish migration to the EU against thebackground of changed admission policies, starting with labour migration towards the end ofthe 1960s and early 1970s, and followed by family reunification and family formation in theyears thereafter. Although a similar conclusion could be expected pertaining to Moroccanmigration towards the EU, the survey yields diverging results in the sense that economicreasons remain predominant for the MMAs who chose to migrate to a particular EU countryduring the past ten years. This might indicate that Moroccan MMAs, given their perception ofthe socio-economic situation in the county of origin, base their choice primarily on economicreasons much more often than Turkish MMAs, even when they have actually entered acountry for family reasons. Less favourable economic conditions in Morocco than in Turkey(see also Chapter 4) may have contributed to this.

Push and pull factors of international migration: a comparative report
85
The motivation of Ghanaians in choosing a specific country of destination is not substantiallyinfluenced by the distinction between EU and non-EU. The orientation of Ghanaian emigrationto ‘western’ non-EU countries (USA) may explain this. For the Senegalese, economic reasonsfor choosing a country are important for three out of every four moves to the EU against onein two to other countries. On the other hand, family reasons are more important when itcomes to emigration to non-EU countries (mostly other African countries).
Push and pull factors of international migration: a comparative report
87
7. ON THE MOVE: MECHANISMS OF MIGRATION
7.1 Introduction
Information plays an essential role in migration decision-making. It not only affects the decisionas to whether or not to migrate, but also the choice of destination. In addition to individualbackground characteristics such as sex, education and life-cycle stage, other factors suchas for example the nature, amount and source of information are also perceived to beessential in the migration decision (Hugo, 1987). Information allows the potential migrant animproved assessment of the costs and benefits of migration and also has a motivationalaspect.
Amongst other sources, information is channelled through networks. Personal networks(based on family, friendship and community ties) in potential destination countries are one ofthe main factors in shaping and sustaining international migration (Massey et al., 1987; Boyd,1989; Hugo, 1981; Gurak and Caces, 1992). An elaborate study on the migration system in thePhilippines showed network support variables to be the most important factor in predictingmigration behaviour (Sycip and Fawcett, 1988). For instance networks not only take care ofpassing on information, but also transmitting remittances, organising a job or housingbeforehand and giving financial assistance. In this way the network reduces costs and risksand thereby facilitates the decision to migrate.
Networks are also a way to gain access (legally or illegally) to a particular country, forinstance through marriage between members of networks. This is especially the case ifkinship and/or community groups play an important role in the selection of a mate. The role ofkin and networks is actually enhanced by the European Union’s restrictive admission policies,which in practice leave almost only family reunification of close kin and marriage as options toenter (most of) the EU countries legally (Schoorl and Idema, 1997).
The functioning of networks in the migration process may be powerfully affected by the typeof society the migrant comes from. Migrant networks may exert strong influences on thecontinuation of migration in societies characterised by family obligation and reciprocalexchange, with strong ties between migrants and their communities of origin (reinforced byvisits or remittances), and family decision making (see e.g. Esveldt et al., 1995).
Migration networks play a role in legal as well as illegal migration processes. More restrictiveadmission policies in the countries of the European Union imply that residence permits canalmost exclusively be acquired by close family and marriage partners of resident migrants.This implies that other migrants who do not fulfil these requirements have to use othermethods to enter and reside in a country. Networks will play a facilitating role in thesemigration processes too.
The first part of this chapter (Section 7.2) deals with the role of information in the migrationprocess. It will focus on the question of whether migrants have information on the country ofdestination, the topics they have information about and the sources of information. Thesecond part (Section 7.3) discusses the role of migration networks. Analyses are carried outon network size, variation in networks between men and women, and migrants moving to EUand other destinations. In addition, the relationship between networks and information on thecountry of destination is explored. For example, do migrants with a network more often haveinformation and use other sources than those without a network? The last network issueexamined here, is the frequency with which migrants are followed by family or friends.

Push and pull factors of international migration: a comparative report
88
Section 7.4 refers to admission and migration strategies. Undocumented migration to anydestination in the past as well as undocumented migration to the current (last) country ofdestination is analysed. One of the main issues is whether networks of irregular migrants aredistinct from those of regular migrants. Do migrants who say that they entered their lastcountry of destination undocumented, more often have networks at destination than thosewho say that they did have the required papers when entering the country? This informationis limited to the last destination since questions on networks referred to migration to the lastdestination (whether undocumented or not) only. Moreover, those migrants who entered withlegal papers but overstayed their visa are not included in the analyses. Therefore the resultson illegal migrants’ use of networks can only be indicative. This section also examinesirregular migration to any past destination. Analysis is carried out on the migrants who reportever having entered or stayed in a country without the required papers. Other analyses coverthe strategies used, the degree of success of attempts to stay and reside undocumented andthe most important destinations. The final section of the chapter (7.5) will summarise the majorfindings and conclusions.
As in the previous chapters a distinction will be made in terminology between thoserespondents in the receiving country and those in the sending country. For example‘Moroccans’, ‘Moroccans at origin’ and ‘Moroccans in the sending country’, refers toMoroccans who were part of the survey in Morocco whereas ‘Moroccans in Spain’ refers tothe Moroccans who were interviewed in Spain. ‘Moroccans in the country of origin’ alsoinclude Moroccans living abroad (outside Morocco, probably even in Spain), but all of them arepart of the survey which was carried out in Morocco.
7.2 The role of information
7.2.1 InformationIn general the vast majority of the respondents say that they had information on their lastcountry of destination before migration. Tables 7.1 and 7.2 present the figures for thedifferent migrant groups in the sending and receiving countries separately. When interpretingthe results on information before migration, one should bear in mind that nothing is knownregarding the quality of the information.
Table 7.1 Migrants who had information on the country of destination, per topic andsending country (%)*
Turkey Morocco Egypt Ghana Senegal
Topics level of wages 36 63 64 54 42 opportunities to find work 46 64 62 68 64 cost of living 26 28 50 55 35 unemployment/disability benefits 17 14 7 18 3 child allowance 20 12 4 22 4 health care system 28 13 14 25 10 admission regulations forforeigners
25 24 26 35 36
school system 15 10 12 31 12 attitude towards foreigners 23 12 15 33 26 taxes 7 8 5 17 4
No information at all 40 28 24 20 22
N 514 854 901 643 581Missing 18 34 - 44 70
* MMAs; percentages do not add up to 100 because more than one topic could be mentioned.

Push and pull factors of international migration: a comparative report
89
Table 7.2 Migrants who had information on the country of destination, per topic, receivingcountry and migrant group (%)*
Italy SpainEgyptians Ghanaians Moroccans Senegalese
Topics level of wages 45 32 57 15 opportunities to find work 56 57 68 27 cost of living 26 17 49 14 unemployment/disability benefits 9 2 26 8 child allowance 9 3 20 6 health care system 13 9 27 11 admission regulations forforeigners
33 21 13 12
school system 10 5 20 4 attitude towards foreigners 33 21 14 15 taxes 8 4 9 7
No information at all 31 31 15 64
N 508 665 594 508Missing - 1 4 6
* MMAs; percentages do not add up to 100 because more than one topic could be mentioned.
For the sending countries the percentages of migrants without information vary roughly from20 to 40 per cent. The Ghanaians seem to have been best informed whereas the Turks quiteoften have no information at all. Ghanaians did not only most often have information on almostall topics compared to the other migrant groups, but they also relatively frequently said thatthey had information on many different topics.
For the receiving countries, the percentage of Senegalese in Spain without information is themost striking. Almost two thirds of the Senegalese migrants seem to have had no knowledgeof Spain at all before arrival. There is no easy and clear explanation for this extremely lowpercentage. The influencing factors could be the relatively short migration history ofSenegalese to Spain, the great distance between Senegal and Spain and the still smallnumbers of Senegalese moving to Spain (see Chapter 4). On the other hand, the Moroccansin Spain are relatively well informed. Only 15 per cent of them indicated they did not knowanything at all about Spain before migration (this is considerably lower than what theircompatriots in Morocco reported). The explanation might be that Moroccans live relativelyclose to Spain. Other research results have shown that potential migrants have moreinformation on nearby destinations than on distant locations (Gould and White, 1974;Schwartz, 1973). Information is probably easier to get from television and other media as wellas from migrants who had gone to Spain earlier.
The results concerning information before migration show a difference between men andwomen. However, these conclusions should be interpreted carefully because of the smallnumber of female respondents.16 The results seem to indicate that men generally are moreinformed than women, meaning that men less often have no information at all. Turkish menseem to be an exception here: 43 per cent of them knew nothing about the destination countrybefore migration, compared to only 20 per cent of the Turkish women.
Contrary to Turkish women, Moroccan women mostly do not have any information at all (68per cent). Moroccan men seem to be more informed (22 per cent had no information at all)compared to Moroccan women and Turkish men. Of the Egyptian migrants almost one quartersay they had no information at all about their future country of residence. The percentages ofmen and women having no information only differ slightly (women do have information
16 In the case of Turkey, Egypt, Senegal, Egyptians in Italy, and Senegalese in Spain the number of female
MMA respondents was less than 50.
Push and pull factors of international migration: a comparative report
90
somewhat less often than men). There is no difference here between the sexes forGhanaians and Senegalese.
The general conclusion that men tend to be more informed than women is also valid formigrant groups in the receiving countries. Among Ghanaian migrants in Italy, the percentage ofwomen with no information is 45, versus 28 per cent of the men. The Moroccan women inSpain also confirm the general pattern; almost 20 per cent of them had no information at all onSpain before arrival (compared to 14 per cent of the men). Senegalese women in particularoften indicated that they were not informed at all about Spain before they moved there (82 percent, versus 62 per cent of the men). These results are in line with earlier findings for Turksand Moroccans in the Netherlands (see country report for the Netherlands). The Egyptians inItaly are the only exception to the general pattern. Around one third (31 per cent) had noinformation at all, but there is no significant difference between men and women(percentages are 31 and 36 respectively).
Part of the difference between men and women can be explained by the fact that mostwomen migrate for family reasons, either to follow their parents or husband, or in order to getmarried (see Chapter 6). The destination is thus already set by the presence of the parents or(future) husband. Information on potential countries of destination is not directly necessary tothem. However men’s migration goals are mainly economic, which means that it is essentialfor them to know for example in which country they might have the best opportunities to findwork.
7.2.2 Information topicsTables 7.1 and 7.2 above list the topics migrants knew something about before migration. Thesubjects that are mentioned most often by the migrants are the economic topics ‘opportunitiesto work’ and ‘level of wages’, generally in this order. This is not really surprising since mostrespondents are men from countries where they are in general the main family wage earner.The information the migrant had will have been about those subjects that are of directrelevance to the person.
The least mentioned information topic in sending as well as receiving countries is ‘taxes’. Forthe sending countries only Ghanaian migrants say they knew something about this subject.Other subjects not many migrants knew anything about before arrival were unemployment ordisability benefits, child allowances, health care systems, and school systems. Turkish andGhanaian migrants most often report knowledge on these topics. Roughly one quarter of theTurkish and Ghanaian migrants had some information on the health care system. These twomigrant groups and the Senegalese often had information on the attitude towards foreignersas well. The Moroccans and Egyptians are less informed on these subjects. Again, only theGhanaian migrants (in Ghana) say that they had some information on the school system. Theirinterest in the school system is, however, directly related to their migration goal: a relativelylarge proportion of the Ghanaian migrants migrated for educational reasons (often to the USAor the United Kingdom).
In general, roughly 20 to 35 per cent of the migrants in both the sending and the receivingcountries said they had information on admission regulations for foreigners. From thesefigures one may conclude that a high 65 to 80 per cent of the migrants did not know anythingat all about the admission regulations when moving to their migration destination. The result forthe Moroccan and Senegalese migrants in Spain is most striking. Almost 90 per cent of themclaim that they did not know anything about Spanish admission regulations for foreignersbefore they came to Spain. This might be an indication that people, knowing in general that theadmission rules are strict, just try to migrate, attracted by the presence of their family orfriends in the country of destination, and trusting that they will help. In particular theSenegalese migrants in Spain seem to have had hardly any information at all before arrival inSpain (see above). A possible explanation is that they migrate with assistance of Muslimbrotherhoods they belong to in Senegal, especially those from the Touba region. It seems thatfor the Senegalese the presence of a network in Spain is the most important ‘pull factor’,although they say that their motives to go to Spain are mainly economic (see Chapter 6).
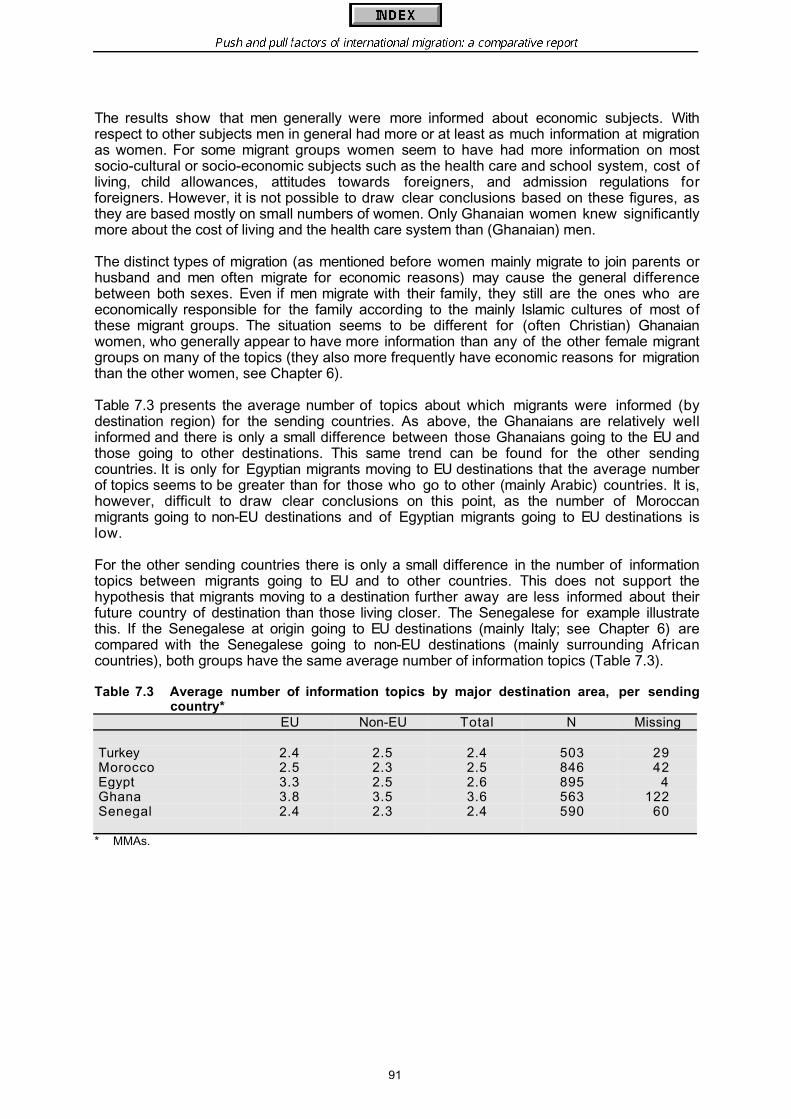
Push and pull factors of international migration: a comparative report
91
The results show that men generally were more informed about economic subjects. Withrespect to other subjects men in general had more or at least as much information at migrationas women. For some migrant groups women seem to have had more information on mostsocio-cultural or socio-economic subjects such as the health care and school system, cost ofliving, child allowances, attitudes towards foreigners, and admission regulations forforeigners. However, it is not possible to draw clear conclusions based on these figures, asthey are based mostly on small numbers of women. Only Ghanaian women knew significantlymore about the cost of living and the health care system than (Ghanaian) men.
The distinct types of migration (as mentioned before women mainly migrate to join parents orhusband and men often migrate for economic reasons) may cause the general differencebetween both sexes. Even if men migrate with their family, they still are the ones who areeconomically responsible for the family according to the mainly Islamic cultures of most ofthese migrant groups. The situation seems to be different for (often Christian) Ghanaianwomen, who generally appear to have more information than any of the other female migrantgroups on many of the topics (they also more frequently have economic reasons for migrationthan the other women, see Chapter 6).
Table 7.3 presents the average number of topics about which migrants were informed (bydestination region) for the sending countries. As above, the Ghanaians are relatively wellinformed and there is only a small difference between those Ghanaians going to the EU andthose going to other destinations. This same trend can be found for the other sendingcountries. It is only for Egyptian migrants moving to EU destinations that the average numberof topics seems to be greater than for those who go to other (mainly Arabic) countries. It is,however, difficult to draw clear conclusions on this point, as the number of Moroccanmigrants going to non-EU destinations and of Egyptian migrants going to EU destinations islow.
For the other sending countries there is only a small difference in the number of informationtopics between migrants going to EU and to other countries. This does not support thehypothesis that migrants moving to a destination further away are less informed about theirfuture country of destination than those living closer. The Senegalese for example illustratethis. If the Senegalese at origin going to EU destinations (mainly Italy; see Chapter 6) arecompared with the Senegalese going to non-EU destinations (mainly surrounding Africancountries), both groups have the same average number of information topics (Table 7.3).
Table 7.3 Average number of information topics by major destination area, per sendingcountry*
EU Non-EU Total N Missing
Turkey 2.4 2.5 2.4 503 29Morocco 2.5 2.3 2.5 846 42Egypt 3.3 2.5 2.6 895 4Ghana 3.8 3.5 3.6 563 122Senegal 2.4 2.3 2.4 590 60
* MMAs.
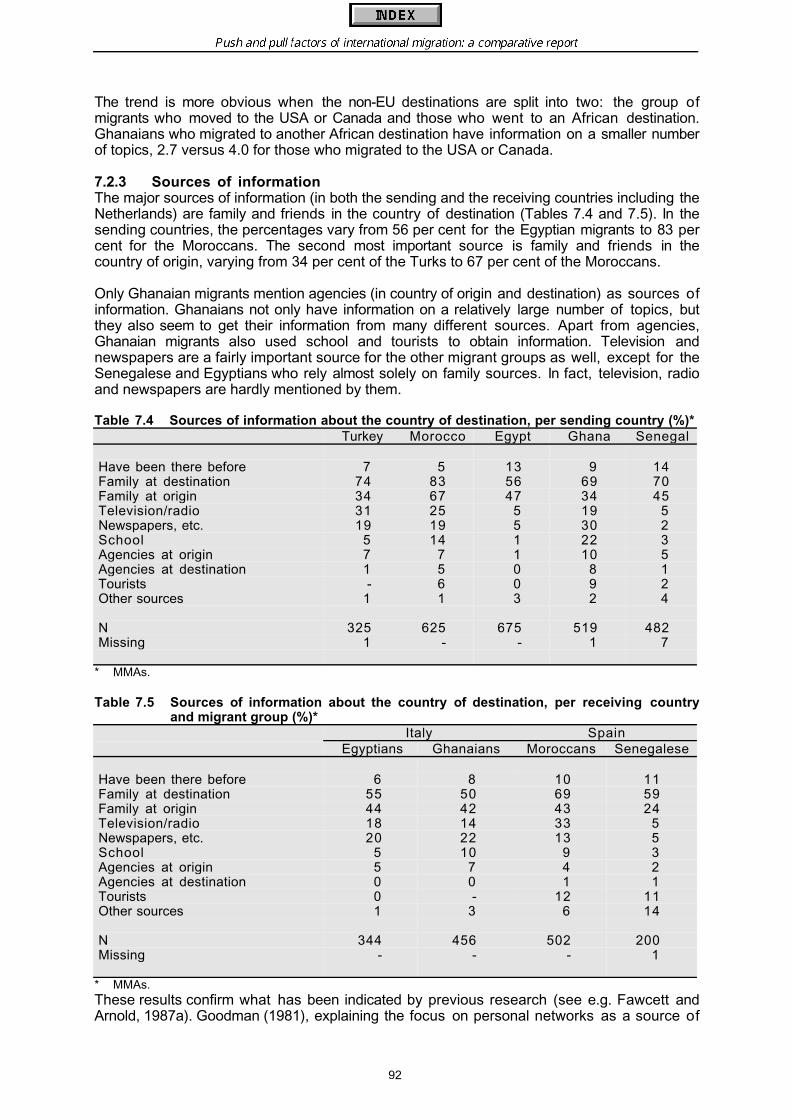
Push and pull factors of international migration: a comparative report
92
The trend is more obvious when the non-EU destinations are split into two: the group ofmigrants who moved to the USA or Canada and those who went to an African destination.Ghanaians who migrated to another African destination have information on a smaller numberof topics, 2.7 versus 4.0 for those who migrated to the USA or Canada.
7.2.3 Sources of informationThe major sources of information (in both the sending and the receiving countries including theNetherlands) are family and friends in the country of destination (Tables 7.4 and 7.5). In thesending countries, the percentages vary from 56 per cent for the Egyptian migrants to 83 percent for the Moroccans. The second most important source is family and friends in thecountry of origin, varying from 34 per cent of the Turks to 67 per cent of the Moroccans.
Only Ghanaian migrants mention agencies (in country of origin and destination) as sources ofinformation. Ghanaians not only have information on a relatively large number of topics, butthey also seem to get their information from many different sources. Apart from agencies,Ghanaian migrants also used school and tourists to obtain information. Television andnewspapers are a fairly important source for the other migrant groups as well, except for theSenegalese and Egyptians who rely almost solely on family sources. In fact, television, radioand newspapers are hardly mentioned by them.
Table 7.4 Sources of information about the country of destination, per sending country (%)*Turkey Morocco Egypt Ghana Senegal
Have been there before 7 5 13 9 14Family at destination 74 83 56 69 70Family at origin 34 67 47 34 45Television/radio 31 25 5 19 5Newspapers, etc. 19 19 5 30 2School 5 14 1 22 3Agencies at origin 7 7 1 10 5Agencies at destination 1 5 0 8 1Tourists - 6 0 9 2Other sources 1 1 3 2 4
N 325 625 675 519 482Missing 1 - - 1 7
* MMAs.
Table 7.5 Sources of information about the country of destination, per receiving countryand migrant group (%)*
Italy SpainEgyptians Ghanaians Moroccans Senegalese
Have been there before 6 8 10 11Family at destination 55 50 69 59Family at origin 44 42 43 24Television/radio 18 14 33 5Newspapers, etc. 20 22 13 5School 5 10 9 3Agencies at origin 5 7 4 2Agencies at destination 0 0 1 1Tourists 0 - 12 11Other sources 1 3 6 14
N 344 456 502 200Missing - - - 1
* MMAs.These results confirm what has been indicated by previous research (see e.g. Fawcett andArnold, 1987a). Goodman (1981), explaining the focus on personal networks as a source of
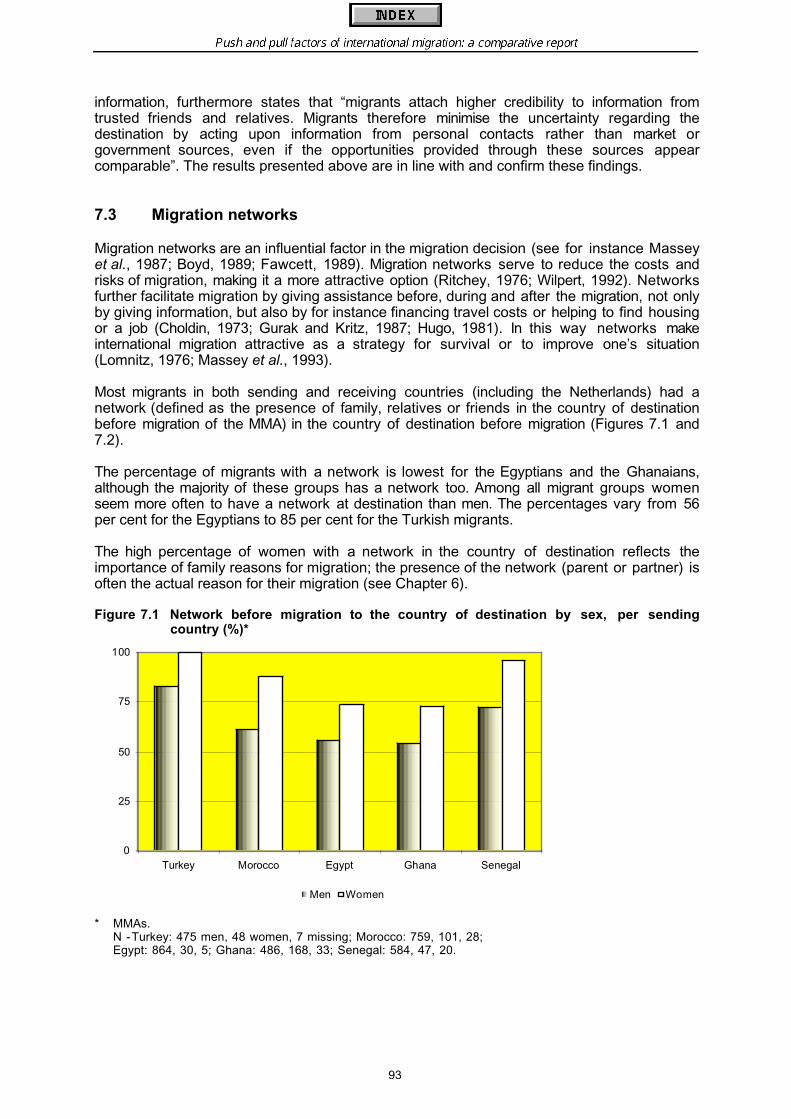
Push and pull factors of international migration: a comparative report
93
information, furthermore states that “migrants attach higher credibility to information fromtrusted friends and relatives. Migrants therefore minimise the uncertainty regarding thedestination by acting upon information from personal contacts rather than market orgovernment sources, even if the opportunities provided through these sources appearcomparable”. The results presented above are in line with and confirm these findings.
7.3 Migration networks
Migration networks are an influential factor in the migration decision (see for instance Masseyet al., 1987; Boyd, 1989; Fawcett, 1989). Migration networks serve to reduce the costs andrisks of migration, making it a more attractive option (Ritchey, 1976; Wilpert, 1992). Networksfurther facilitate migration by giving assistance before, during and after the migration, not onlyby giving information, but also by for instance financing travel costs or helping to find housingor a job (Choldin, 1973; Gurak and Kritz, 1987; Hugo, 1981). In this way networks makeinternational migration attractive as a strategy for survival or to improve one’s situation(Lomnitz, 1976; Massey et al., 1993).
Most migrants in both sending and receiving countries (including the Netherlands) had anetwork (defined as the presence of family, relatives or friends in the country of destinationbefore migration of the MMA) in the country of destination before migration (Figures 7.1 and7.2).
The percentage of migrants with a network is lowest for the Egyptians and the Ghanaians,although the majority of these groups has a network too. Among all migrant groups womenseem more often to have a network at destination than men. The percentages vary from 56per cent for the Egyptians to 85 per cent for the Turkish migrants.
The high percentage of women with a network in the country of destination reflects theimportance of family reasons for migration; the presence of the network (parent or partner) isoften the actual reason for their migration (see Chapter 6).
Figure 7.1 Network before migration to the country of destination by sex, per sendingcountry (%)*
* MMAs.N -Turkey: 475 men, 48 women, 7 missing; Morocco: 759, 101, 28;Egypt: 864, 30, 5; Ghana: 486, 168, 33; Senegal: 584, 47, 20.
0
25
50
75
100
Turkey Morocco Egypt Ghana Senegal
Men Women
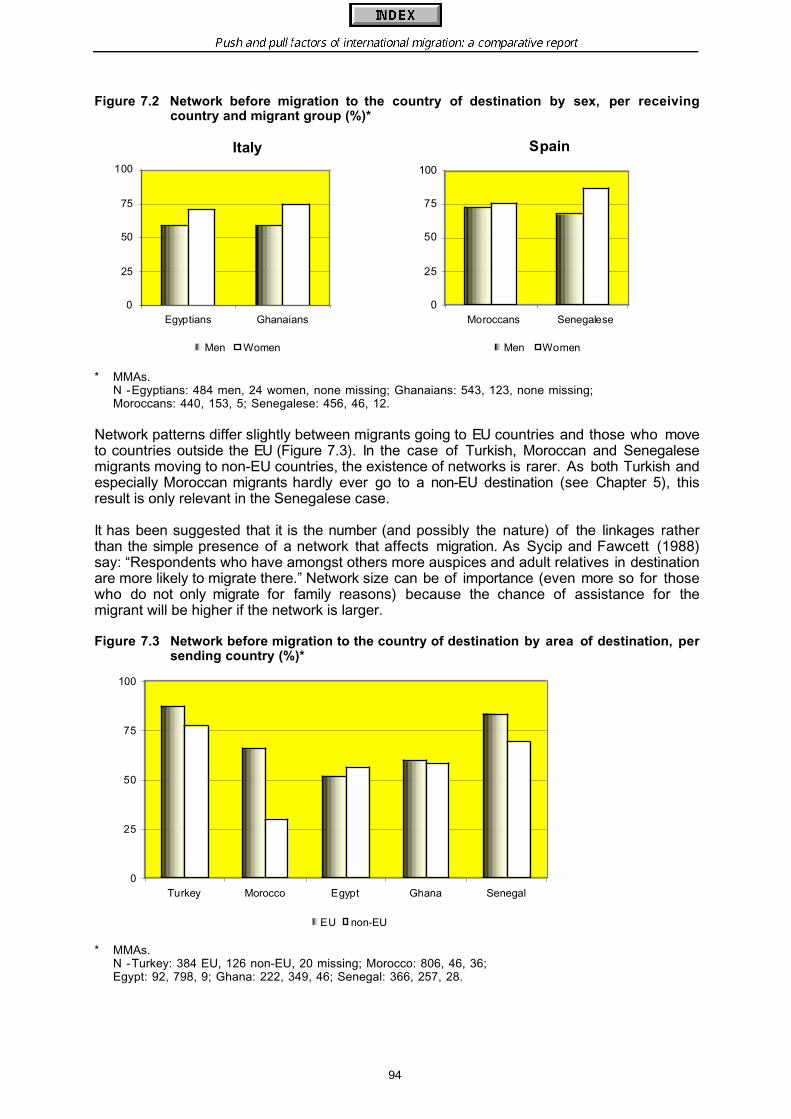
Push and pull factors of international migration: a comparative report
94
Figure 7.2 Network before migration to the country of destination by sex, per receivingcountry and migrant group (%)*
* MMAs.N -Egyptians: 484 men, 24 women, none missing; Ghanaians: 543, 123, none missing;Moroccans: 440, 153, 5; Senegalese: 456, 46, 12.
Network patterns differ slightly between migrants going to EU countries and those who moveto countries outside the EU (Figure 7.3). In the case of Turkish, Moroccan and Senegalesemigrants moving to non-EU countries, the existence of networks is rarer. As both Turkish andespecially Moroccan migrants hardly ever go to a non-EU destination (see Chapter 5), thisresult is only relevant in the Senegalese case.
It has been suggested that it is the number (and possibly the nature) of the linkages ratherthan the simple presence of a network that affects migration. As Sycip and Fawcett (1988)say: “Respondents who have amongst others more auspices and adult relatives in destinationare more likely to migrate there.” Network size can be of importance (even more so for thosewho do not only migrate for family reasons) because the chance of assistance for themigrant will be higher if the network is larger.
Figure 7.3 Network before migration to the country of destination by area of destination, persending country (%)*
* MMAs.N -Turkey: 384 EU, 126 non-EU, 20 missing; Morocco: 806, 46, 36;Egypt: 92, 798, 9; Ghana: 222, 349, 46; Senegal: 366, 257, 28.
0
25
50
75
100
Turkey Morocco Egypt Ghana Senegal
EU non-EU
Italy
0
25
50
75
100
Egyptians Ghanaians
Men Women
Spain
0
25
50
75
100
Moroccans Senegalese
Men Women

Push and pull factors of international migration: a comparative report
95
The size of the networks varies enormously between the countries. On average Turkishmigrants have the largest networks at destination (6.1) while Ghanaian migrants have thesmallest (2.3). The larger network size of the Turkish migrants is caused by the relatively highpercentage having a network of 4 persons or more (42 per cent, compared to roughly 20 percent for the other migrant groups). Most migrant groups have a network consisting of anaverage of approximately three persons.
There is a size difference in men’s and women’s networks in both the sending and thereceiving countries. Although women tend to have a network more often than men, theirnetworks are (often considerably) smaller than men’s networks. This applies to all femalemigrant groups. For women, the network size varies from 1.6 to 2.3 persons on averageagainst a network size of 2.2 to 6.7 persons on average for men. Once again this is probablyrelated to the migration pattern: most women migrate for family reasons (in the case of amarriage the network may even consist of one person only). So in fact approximately 70 percent of the female migrants of most migrant groups have a network that consists of oneperson. For men this percentage varies between 30 and 50 per cent. The women’s networkmay consist mainly of the person they want to join and this will be decisive, rather than thepresence or size of a network. One might conclude that for persons who do not migrate forfamily reasons, the network size seems to be of some importance, as it is generally larger.
Tables 7.6 and 7.7 show that migrants with a network have information more often, and thatthis information covers a greater variety of topics than migrants who did not have a network.The results for the separate migrant groups are remarkably similar. Turkish and Senegalesemigrants are in slight contrast with the other migrant groups as for them the discrepancy ininformation between those with and without a network is larger than for the other groups.Results for the migrant groups in Spain and Italy as receiving countries show a similar patternto those in the sending countries. Earlier findings among Turks and Moroccans in theNetherlands are also in line with this (see country report for the Netherlands).
Table 7.6 Percentage having information and average number of topics on destination byexistence of network in the country of destination, per sending country*
Turkey Morocco Egypt Ghana SenegalNetwork
yes no yes no yes no yes no yes no
Information (%) 64 37 79 63 84 66 87 71 88 53
Number of topics 2.6 1.4 2.9 1.8 2.9 2.2 3.9 3.2 2.5 1.5
N 384 126 522 313 483 411 376 251 470 116Missing 20 53 5 60 65
* MMAs.
Table 7.7 Percentage having information and average number of topics on destination byexistence of network in the country of destination, per receiving country andmigrant group*
Italy SpainNetwork Egyptians Ghanaians Moroccans Senegalese
yes no yes no yes no yes no
Information (%) 77 58 75 60 87 79 41 26
Number of topics 3.0 1.6 2.0 1.2 3.2 2.4 1.4 0.7
N 296 212 393 273 428 164 347 155Missing - - 6 12
* MMAs.To find out whether there is a relation between networks and information, an analysis hasbeen done on information sources of those with and without a network. The results are

Push and pull factors of international migration: a comparative report
96
presented in Tables 7.8 and 7.9. Those migrants who have relatives or friends at destinationmainly get their information from them. Migrants who did not know anyone in the country ofdestination before migration, still say that they used this information source, but to a muchlesser extent. It probably concerns friends or relatives who had previously given informationbut had since left the country. Migrants with no network at destination more often say that ingeneral they received information from relatives and friends living in the country of origin. Inaddition, most groups use the media (television, radio, newspapers), school, agencies atorigin, and sometimes tourists as sources of information.
Summing up, the ‘network-migrants’ concentrate on relatives and friends, especially thoseliving in the destination country, while the ‘no-network migrants’ use several differentsources. For Moroccan migrants this difference is not so clear-cut. Senegalese migrants inSpain and at origin remarkably often mention the category ‘other sources’ but what sourcesthese are is not known.
Table 7.8 Sources of information about the country of destination by existence of networkin the country of destination, per sending country (%)*
Turkey Morocco Egypt Ghana SenegalNetwork
yes no yes no yes no yes no yes no
Been there before 7 10 4 8 12 16 8 12 16 10Family at destination 78 40 88 71 73 29 84 44 84 -Family at origin 33 50 68 67 39 60 35 32 44 49Television/radio 31 40 26 20 5 6 11 31 3 8Newspapers, etc. 18 30 19 18 4 8 24 39 1 3School 4 10 12 16 0 1 16 32 2 8Agencies at origin 5 18 6 9 0 3 7 16 3 15Agencies atdestination
- - 3 8 - 1 7 12 2 -
Tourists ** ** 5 9 - 1 5 15 1 5Other sources - 9 1 2 2 4 2 2 - 28
N 264 60 420 198 399 271 326 179 402 76Missing 2 7 5 15 11
* MMAs.** Not asked.
Table 7.9 Sources of information about the country of destination by existence of networkin the country of destination, per receiving country and migrant group (%)*
Italy SpainNetwork Egyptians Ghanaians Moroccans Senegalese
yes no yes no yes no yes no
Been there before 7 6 12 - 10 10 12 8Family at destination 74 17 70 12 83 27 71 15Family at origin 35 62 38 49 45 38 23 31Television/radio 16 22 8 27 31 42 5 5Newspapers, etc. 18 22 14 36 11 21 4 10School 5 6 8 14 6 16 3 3Agencies at origin 2 10 5 9 1 10 1 3Agencies atdestination
0 - 1 - 1 - 1 -
Tourists 0 - - - 11 14 11 13Other sources 1 - 2 6 5 12 7 39
N 225 119 297 159 369 131 150 46Missing - - 2 4
* MMAs.The migrants’ expectations with regard to receiving assistance before, during or aftermigration may also influence the migration decision. The vast majority of migrants in the
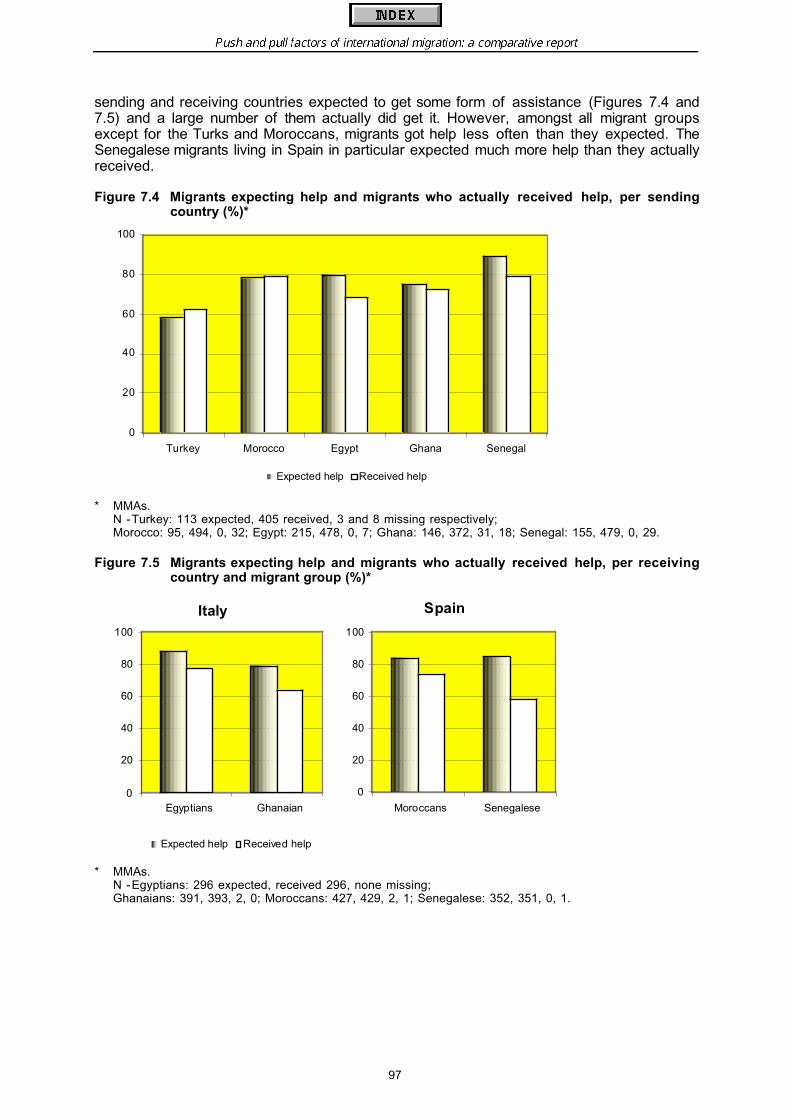
Push and pull factors of international migration: a comparative report
97
sending and receiving countries expected to get some form of assistance (Figures 7.4 and7.5) and a large number of them actually did get it. However, amongst all migrant groupsexcept for the Turks and Moroccans, migrants got help less often than they expected. TheSenegalese migrants living in Spain in particular expected much more help than they actuallyreceived.
Figure 7.4 Migrants expecting help and migrants who actually received help, per sendingcountry (%)*
* MMAs.N -Turkey: 113 expected, 405 received, 3 and 8 missing respectively;Morocco: 95, 494, 0, 32; Egypt: 215, 478, 0, 7; Ghana: 146, 372, 31, 18; Senegal: 155, 479, 0, 29.
Figure 7.5 Migrants expecting help and migrants who actually received help, per receivingcountry and migrant group (%)*
* MMAs.N -Egyptians: 296 expected, received 296, none missing;Ghanaians: 391, 393, 2, 0; Moroccans: 427, 429, 2, 1; Senegalese: 352, 351, 0, 1.
0
20
40
60
80
100
Turkey Morocco Egypt Ghana Senegal
Expected help Received help
Italy
0
20
40
60
80
100
Egyptians Ghanaian
Expected help Received help
Spain
0
20
40
60
80
100
Moroccans Senegalese
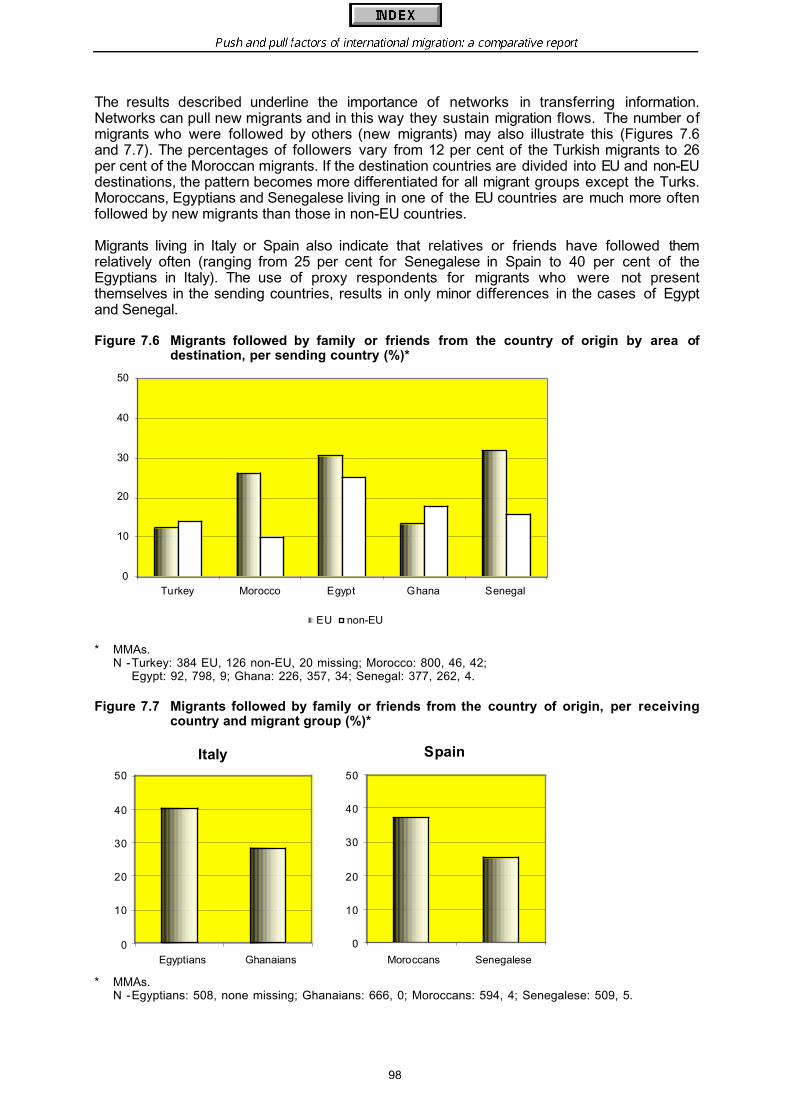
Push and pull factors of international migration: a comparative report
98
The results described underline the importance of networks in transferring information.Networks can pull new migrants and in this way they sustain migration flows. The number ofmigrants who were followed by others (new migrants) may also illustrate this (Figures 7.6and 7.7). The percentages of followers vary from 12 per cent of the Turkish migrants to 26per cent of the Moroccan migrants. If the destination countries are divided into EU and non-EUdestinations, the pattern becomes more differentiated for all migrant groups except the Turks.Moroccans, Egyptians and Senegalese living in one of the EU countries are much more oftenfollowed by new migrants than those in non-EU countries.
Migrants living in Italy or Spain also indicate that relatives or friends have followed themrelatively often (ranging from 25 per cent for Senegalese in Spain to 40 per cent of theEgyptians in Italy). The use of proxy respondents for migrants who were not presentthemselves in the sending countries, results in only minor differences in the cases of Egyptand Senegal.
Figure 7.6 Migrants followed by family or friends from the country of origin by area ofdestination, per sending country (%)*
* MMAs.N -Turkey: 384 EU, 126 non-EU, 20 missing; Morocco: 800, 46, 42;
Egypt: 92, 798, 9; Ghana: 226, 357, 34; Senegal: 377, 262, 4.
Figure 7.7 Migrants followed by family or friends from the country of origin, per receivingcountry and migrant group (%)*
* MMAs.N -Egyptians: 508, none missing; Ghanaians: 666, 0; Moroccans: 594, 4; Senegalese: 509, 5.
0
10
20
30
40
50
Turkey Morocco Egypt Ghana Senegal
EU non-EU
Italy
0
10
20
30
40
50
Egyptians Ghanaians
Spain
0
10
20
30
40
50
Moroccans Senegalese
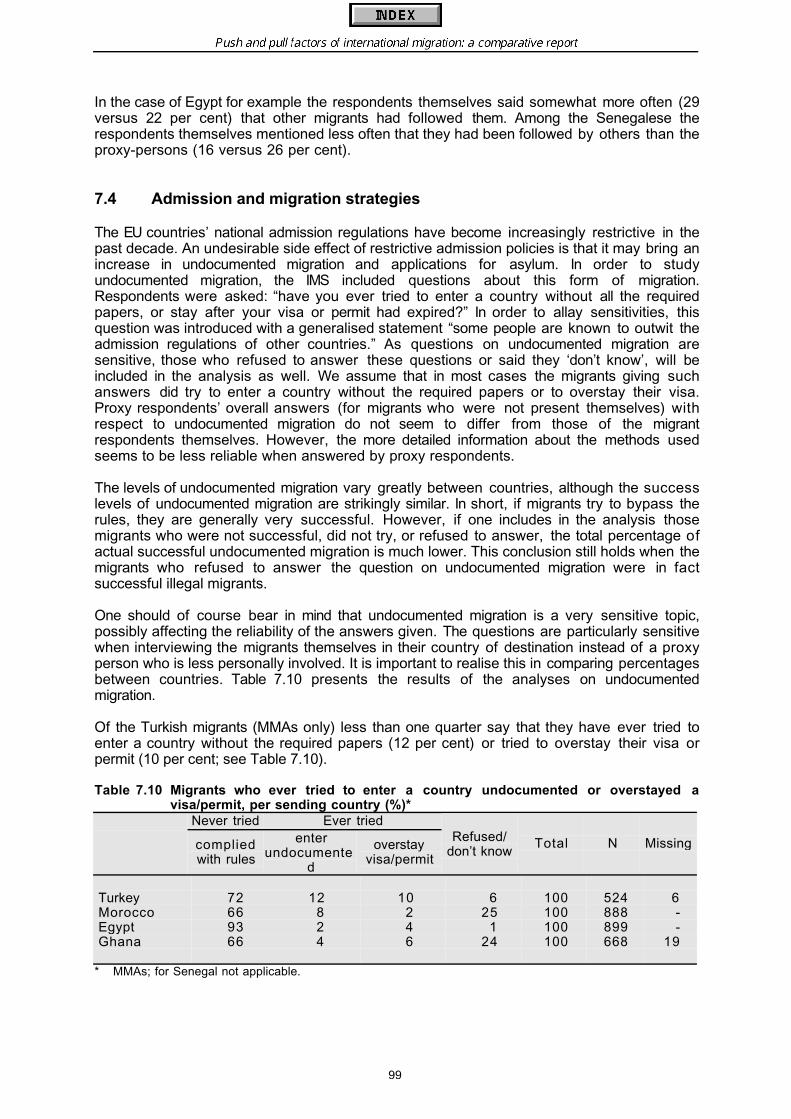
Push and pull factors of international migration: a comparative report
99
In the case of Egypt for example the respondents themselves said somewhat more often (29versus 22 per cent) that other migrants had followed them. Among the Senegalese therespondents themselves mentioned less often that they had been followed by others than theproxy-persons (16 versus 26 per cent).
7.4 Admission and migration strategies
The EU countries’ national admission regulations have become increasingly restrictive in thepast decade. An undesirable side effect of restrictive admission policies is that it may bring anincrease in undocumented migration and applications for asylum. In order to studyundocumented migration, the IMS included questions about this form of migration.Respondents were asked: “have you ever tried to enter a country without all the requiredpapers, or stay after your visa or permit had expired?” In order to allay sensitivities, thisquestion was introduced with a generalised statement “some people are known to outwit theadmission regulations of other countries.” As questions on undocumented migration aresensitive, those who refused to answer these questions or said they ‘don’t know’, will beincluded in the analysis as well. We assume that in most cases the migrants giving suchanswers did try to enter a country without the required papers or to overstay their visa.Proxy respondents’ overall answers (for migrants who were not present themselves) withrespect to undocumented migration do not seem to differ from those of the migrantrespondents themselves. However, the more detailed information about the methods usedseems to be less reliable when answered by proxy respondents.
The levels of undocumented migration vary greatly between countries, although the successlevels of undocumented migration are strikingly similar. In short, if migrants try to bypass therules, they are generally very successful. However, if one includes in the analysis thosemigrants who were not successful, did not try, or refused to answer, the total percentage ofactual successful undocumented migration is much lower. This conclusion still holds when themigrants who refused to answer the question on undocumented migration were in factsuccessful illegal migrants.
One should of course bear in mind that undocumented migration is a very sensitive topic,possibly affecting the reliability of the answers given. The questions are particularly sensitivewhen interviewing the migrants themselves in their country of destination instead of a proxyperson who is less personally involved. It is important to realise this in comparing percentagesbetween countries. Table 7.10 presents the results of the analyses on undocumentedmigration.
Of the Turkish migrants (MMAs only) less than one quarter say that they have ever tried toenter a country without the required papers (12 per cent) or tried to overstay their visa orpermit (10 per cent; see Table 7.10).
Table 7.10 Migrants who ever tried to enter a country undocumented or overstayed avisa/permit, per sending country (%)*
Never tried Ever tried
compliedwith rules
enterundocumente
d
overstayvisa/permit
Refused/don’t know
Total N Missing
Turkey 72 12 10 6 100 524 6Morocco 66 8 2 25 100 888 -Egypt 93 2 4 1 100 899 -Ghana 66 4 6 24 100 668 19
* MMAs; for Senegal not applicable.
Push and pull factors of international migration: a comparative report
100
If the group who refused to answer or said they don’t know are included, the percentage ofundocumented migration increases to 28 per cent. All other respondents said that they havenever tried anything like this, which means that about 72 per cent of the Turkish migrants claimto have never entered or stayed in a country without the required documents.
Those Turkish migrants who admitted to have ever tried to enter a country undocumented orto have overstayed their visa/permit, were reportedly the most successful. Only about 13 percent of the ones who tried did not succeed. However, if the total group of Turkish MMAs isincluded in the analysis only 17 per cent has ever been successful in illegal migration. If w etake into consideration that a substantial proportion of the MMAs refused to answer thesequestions and assuming that all of them did try to migrate illegally too, the percentage ofsuccessful illegal migration is between 17 and 28 per cent. Germany and Switzerland werethe most important destination countries (almost 90 per cent) for these undocumentedmigrants; about two thirds were destinations in the European Union, and almost all countrieswere European countries. This is in line with the main destination countries of legal Turkishmigrants and thus not very surprising (also taking the existing networks into consideration).
Of the Moroccan migrants only ten per cent indicated that they had ever tried to enter acountry without the required papers or to overstay their visa/permit. This percentage is quitelow, but a quarter of the Moroccan migrants refused to answer the question or said they didnot know. Taking into account that this group might indeed have tried to migrate illegally, amaximum of 65 per cent of the Moroccans complied with the admission regulations of thecountry of destination. The most used method for undocumented migration of Moroccans wasto enter without the required papers.
Two thirds of the Moroccans who said that they had tried to enter or stay illegally, weresuccessful. The destination countries most often mentioned by Moroccans in relation to illegalmigration were Italy and Spain. Over 80 per cent wanted to go to these two countries, and theremainder mentioned other EU countries. There are probably several reasons for this.Morocco has a long history of migration to EU countries such as Spain, France, Belgium andthe Netherlands. Moreover, EU countries are nearby and relatively easy to reach. In addition,in the case of Spain and Italy for instance, there is the advantage of a short distance andrelatively easy undocumented entry or overstaying on a visa in combination with the additionalbenefit of a fairly high chance of regularising one’s illegal position given the recurrent officialregularisations (European Commission, 1996; Reyneri, 1998a).
Almost all Egyptian migrants said that they had never tried to enter or stay in a countryundocumented. Only six per cent said that they had tried undocumented migration and onlyone per cent refused to answer. Of the six per cent who did try, all reported success.Favourite countries for the Egyptians were Saudi Arabia, Iraq and Jordan (each around 24per cent). Only 20 per cent of the undocumented migrating Egyptians went to one of the EUcountries (half of them to Italy). These countries reflect the destination patterns of legalmigrants. The main method used by the Egyptian migrants was overstaying their visa.
Like the Moroccans, ten per cent of the Ghanaian migrants said that they ever had tried toenter a country illegally or overstayed their visa or permit. About two thirds said they hadnever done this, and almost one quarter refused to answer this question or said they did notknow. Only the Moroccans equal this high percentage of refusals and ‘don’t knows’. Of thosemigrants who did try, only 14 per cent did not succeed. However, of the total group only fiveper cent both tried and succeeded in entering or staying illegally in a country.

Push and pull factors of international migration: a comparative report
101
Ghanaians differ from the other migrant groups in their preference for mainly other Africancountries as migration destination (e.g. Nigeria 29 per cent, Ivory Coast 13 per cent). In factroughly two thirds said they tried to enter or stay illegally in an African country, while lessthan 20 per cent went to an EU country (mainly Germany and Italy). For almost all migrantstheir last country of destination is the same country as the one they mentioned having enteredor stayed in without the required documents.
One has to bear in mind that the results presented above reflect the percentage of migrantswho were successful in their attempt to migrate or stay undocumented. When analysing thetotal group of MMAs for all migrant groups, the number of respondents saying they had triedsuccessfully to by-pass the admission rules are of course lower.
With respect to the results for the receiving countries it is important to note that the questionson undocumented migration refer to whether respondents have ever tried to enter or stay inany country illegally. Thus, the answers do not necessarily refer to Italy or Spain.
Approximately 60 per cent of the Egyptians in Italy said that they have never tried to enter acountry without the required papers or stayed after the visa or permit had expired (Table7.11).
Almost one third immediately admitted that they had tried undocumented migration in the past.And almost 90 per cent of those who admitted they had ever tried to enter or resideundocumented said that they had succeeded. This comes down to roughly one quarter of thetotal group and between 26 to 38 per cent if the refusals are included. For most of theEgyptian migrants Italy was the destination country.
The Ghanaians were more reluctant to answer the questions on undocumented migration.Almost 18 per cent refused to do so. Nevertheless, 60 per cent said they have never tried toenter or stay in a country illegally, which means that 22 per cent had tried to bypass theadmission regulations. All Ghanaian migrants named Italy as the country where they tried tobypass the rules. Of those who said that they had ever tried to do so, around two thirds didsucceed. Of the total group of Ghanaian migrants in Italy only 14 per cent had ever tried andsucceeded in bypassing the rules. Along with the migrants who refused to answer, thismeans that the percentage of successful illegal migration lies between 14 and 38.
In Spain more than one third of the Moroccan and half of the Senegalese migrants say theyhave ever tried to bypass the rules. Eight per cent of the Moroccans and 15 per cent of theSenegalese refused to answer or said they did not know.
Table 7.11 Migrants who ever tried to enter a country undocumented or overstayed avisa/permit, per receiving country and migrant group (%)*
Never tried Ever tried
compliedwith rules
enterundocumente
d
overstayvisa/permit
Refused/don’tknow
Total N Missing
Italy Egyptians 58 17 15 10 100 508 - Ghanaians 60 7 15 18 100 666 -
Spain Moroccans 55 17 20 8 100 591 7 Senegalese 34 15 36 15 100 504 10
* MMAs.
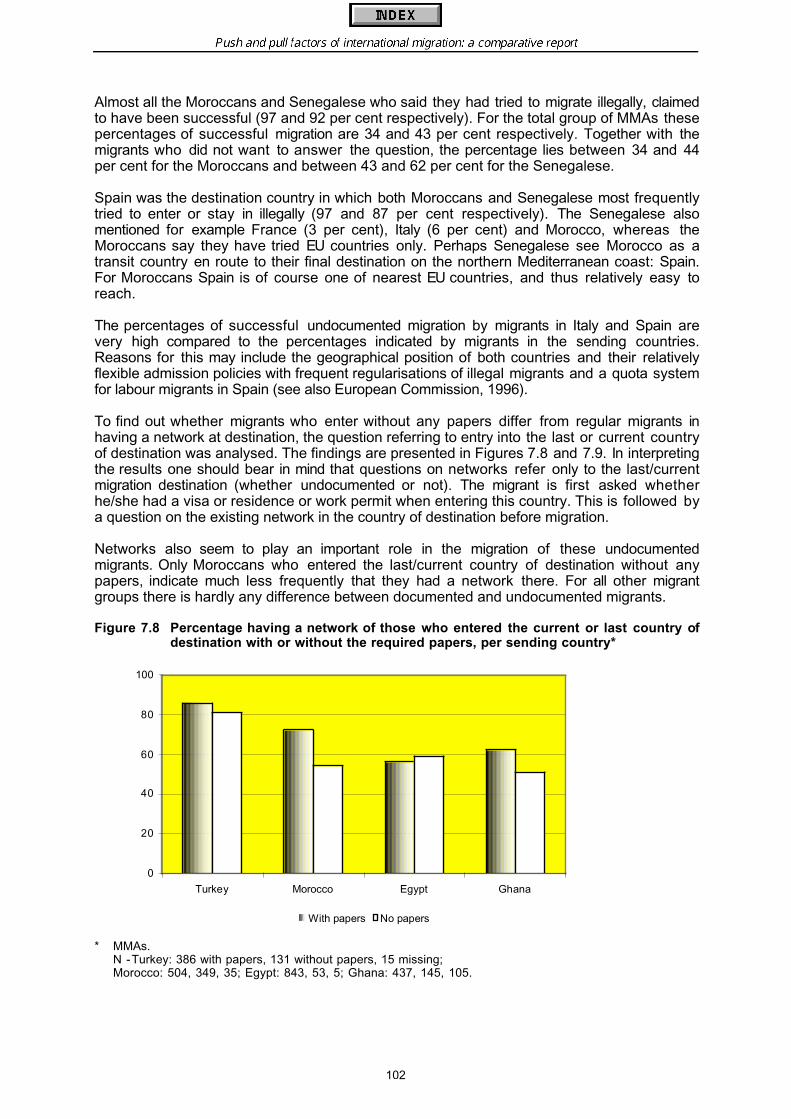
Push and pull factors of international migration: a comparative report
102
Almost all the Moroccans and Senegalese who said they had tried to migrate illegally, claimedto have been successful (97 and 92 per cent respectively). For the total group of MMAs thesepercentages of successful migration are 34 and 43 per cent respectively. Together with themigrants who did not want to answer the question, the percentage lies between 34 and 44per cent for the Moroccans and between 43 and 62 per cent for the Senegalese.
Spain was the destination country in which both Moroccans and Senegalese most frequentlytried to enter or stay in illegally (97 and 87 per cent respectively). The Senegalese alsomentioned for example France (3 per cent), Italy (6 per cent) and Morocco, whereas theMoroccans say they have tried EU countries only. Perhaps Senegalese see Morocco as atransit country en route to their final destination on the northern Mediterranean coast: Spain.For Moroccans Spain is of course one of nearest EU countries, and thus relatively easy toreach.
The percentages of successful undocumented migration by migrants in Italy and Spain arevery high compared to the percentages indicated by migrants in the sending countries.Reasons for this may include the geographical position of both countries and their relativelyflexible admission policies with frequent regularisations of illegal migrants and a quota systemfor labour migrants in Spain (see also European Commission, 1996).
To find out whether migrants who enter without any papers differ from regular migrants inhaving a network at destination, the question referring to entry into the last or current countryof destination was analysed. The findings are presented in Figures 7.8 and 7.9. In interpretingthe results one should bear in mind that questions on networks refer only to the last/currentmigration destination (whether undocumented or not). The migrant is first asked whetherhe/she had a visa or residence or work permit when entering this country. This is followed bya question on the existing network in the country of destination before migration.
Networks also seem to play an important role in the migration of these undocumentedmigrants. Only Moroccans who entered the last/current country of destination without anypapers, indicate much less frequently that they had a network there. For all other migrantgroups there is hardly any difference between documented and undocumented migrants.
Figure 7.8 Percentage having a network of those who entered the current or last country ofdestination with or without the required papers, per sending country*
* MMAs.N -Turkey: 386 with papers, 131 without papers, 15 missing;Morocco: 504, 349, 35; Egypt: 843, 53, 5; Ghana: 437, 145, 105.
0
20
40
60
80
100
Turkey Morocco Egypt Ghana
With papers No papers
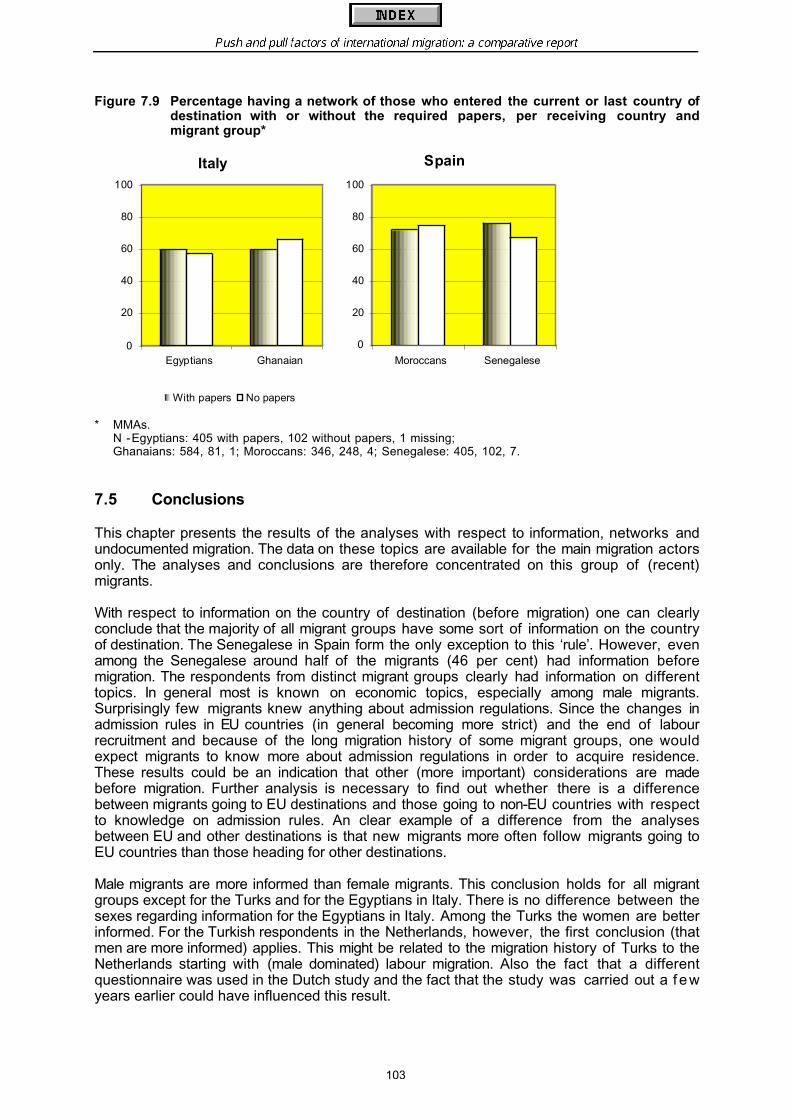
Push and pull factors of international migration: a comparative report
103
Figure 7.9 Percentage having a network of those who entered the current or last country ofdestination with or without the required papers, per receiving country andmigrant group*
* MMAs.N -Egyptians: 405 with papers, 102 without papers, 1 missing;Ghanaians: 584, 81, 1; Moroccans: 346, 248, 4; Senegalese: 405, 102, 7.
7.5 Conclusions
This chapter presents the results of the analyses with respect to information, networks andundocumented migration. The data on these topics are available for the main migration actorsonly. The analyses and conclusions are therefore concentrated on this group of (recent)migrants.
With respect to information on the country of destination (before migration) one can clearlyconclude that the majority of all migrant groups have some sort of information on the countryof destination. The Senegalese in Spain form the only exception to this ‘rule’. However, evenamong the Senegalese around half of the migrants (46 per cent) had information beforemigration. The respondents from distinct migrant groups clearly had information on differenttopics. In general most is known on economic topics, especially among male migrants.Surprisingly few migrants knew anything about admission regulations. Since the changes inadmission rules in EU countries (in general becoming more strict) and the end of labourrecruitment and because of the long migration history of some migrant groups, one wouldexpect migrants to know more about admission regulations in order to acquire residence.These results could be an indication that other (more important) considerations are madebefore migration. Further analysis is necessary to find out whether there is a differencebetween migrants going to EU destinations and those going to non-EU countries with respectto knowledge on admission rules. An clear example of a difference from the analysesbetween EU and other destinations is that new migrants more often follow migrants going toEU countries than those heading for other destinations.
Male migrants are more informed than female migrants. This conclusion holds for all migrantgroups except for the Turks and for the Egyptians in Italy. There is no difference between thesexes regarding information for the Egyptians in Italy. Among the Turks the women are betterinformed. For the Turkish respondents in the Netherlands, however, the first conclusion (thatmen are more informed) applies. This might be related to the migration history of Turks to theNetherlands starting with (male dominated) labour migration. Also the fact that a differentquestionnaire was used in the Dutch study and the fact that the study was carried out a fewyears earlier could have influenced this result.
Italy
0
20
40
60
80
100
Egyptians Ghanaian
With papers No papers
Spain
0
20
40
60
80
100
Moroccans Senegalese
Push and pull factors of international migration: a comparative report
104
Although women are less informed they do more often have a network. But their network sizeis smaller than that for men. This result can clearly be linked with the different migrationreasons for men and women. Women tend to migrate predominantly in order to join parents or(future) partners whereas men mainly have economic reasons. This implies that it is logical forwomen to more often know someone in the country of destination because this is the reasonfor their migration. The smaller network size is also the result of this specific family orientatedmigration reason; women know primarily those whom they are going to join in the country ofdestination.
Family (and to a somewhat lesser extent friends) are of major importance for migrants’information supply. Indeed, agencies in the countries of origin and destination are hardlymentioned at all as a source from which migrants get information about their prospectivedestinations. The low level of use of agencies as transmitter of information may also havebeen affected by their actual presence or absence in a country and, if present, by the type ofinformation these agencies are able to provide (see also Fawcett and Arnold, 1987a). Resultsfrom previous studies in general indicate that migrants with a higher socio-economic statusare more inclined than low-status migrants to use other sources, such as the media, inaddition to relatives and friends (Goodman, 1981). Further analysis is needed to examine thisrelationship.
The migration destinations for legal as well for as illegal migrants are found to be the same.For example, undocumented Moroccans and Turks, just like the legal migrants from thesecountries, mainly head for the EU countries. It is also evident that undocumented migrantshave networks just as often as documented migrants. This could be the explanation for thesimilarity in destination countries; networks are thus of great importance for legal as well asillegal migration. The final conclusion that can be drawn with respect to undocumentedmigration is that the level of undocumented entry or stay differs significantly between themigrant groups. The number of migrants who are successful in their attempts to enter or stayillegally is high. One should bear in mind that topics related to undocumented migration arevery sensitive and that respondents probably do not want to answer or give sociallydesirable answers. Our conclusions may also be affected by these biases and it is thereforehard to make general statements on undocumented migration.

Push and pull factors of international migration: a comparative report
105
8. THE FUTURE OF MIGRATION: INTENTIONS AND POTENTIAL
8.1 Introduction
International migration has an important place in today’s world. Nevertheless, given the lack ofsolid and comparable statistics in many countries, even simple past and current trends areoften hard to describe. And where statistics are available, the phenomenon of undocumentedmigration, perhaps the inevitable consequence of the decreased options for legal migrationand the continued gap in wealth and opportunities between countries, renders such data lessvalid.
Given the problems in measuring current migration trends, estimating future trends is an evenmore daunting task. Extrapolation of past trends tends to be hazardous, as can be easilydemonstrated from available population projections (see e.g. Keilman, 1990). Scenarios couldincorporate the influence of changing admission policies, approximating factors on thedemand side. In addition, survey data on migration intentions, in combination with macro-leveleconomic data, may provide some insight into the supply side.
However, as ‘intentions’ are vague and probably reflect unfulfillable dreams and wishes atleast as much as conscious planning, we cannot use the answers to such a question as astraightforward predictor of future migration behaviour. In both sending and receivingcountries, intentions about future migration are likely to have only limited predictive value.Perhaps a majority of prospective migrants in sending countries will never leave. Evenmigrants who originally arrived with the firm intention of returning and the idea that this wouldbe only a temporary move, often adjust their plans later on, because their economic goalschange or because adult children refuse to return with their parents, etc.
In order to approximate potential future behaviour somewhat better, respondents withmigration intentions were also asked to indicate when they intended to migrate and, if thiswas within the next two years, whether they had already taken specific steps in preparationof migration.
This chapter deals with these migration intentions. Among those who have never migrated sofar, do many intend to do so, and if so, who are they and have they taken any steps toprepare for migration? Do non-migrants differ in their intentions from return migrants, whoseexperiences abroad may influence their decisions about another move? Where do potentialmigrants prefer to go, and why there?
Obviously, intentions are likely to be influenced by both the socio-economic situation in thecountry of origin, and the expectations potential migrants have about countries of destination.
Everyone interviewed in the surveys in the sending countries was asked whether or not theyintended to migrate abroad. In the receiving countries the question was phrased slightlydifferently: respondents were asked whether they intended to stay in the country where theywere living now, whether they intended to return to their country of origin, or whether theyintended to move on to another country. Depending on the answers given, further questionswere then asked on the timing of, and reasons for intended future migration, or on thereasons for intended immobility. With respect to the latter, respondents were asked to statethe two main reasons affecting their intentions. However, only the first reason mentioned ispresented in the analyses in this chapter.

Push and pull factors of international migration: a comparative report
106
The questions on future intentions were posed to everyone in the age group 18-65 in each ofthe households. In this chapter we look at the following groups:
• non-migrants and return migrants in the sending countries. They were asked questions ontheir intentions to migrate abroad for the first time, or to migrate abroad again, respectively;
• current migrants in the receiving countries. The questions put to them referred to theirintentions to return to their country of origin, or to migrate on to a third country.
8.2 Migration intentions
8.2.1 Sending countriesTurning to overall migration intentions first, several things are clear from Table 8.1.
• Most people do not intend to migrate abroad.• Nevertheless, the overall intention to migrate is quite strong in the regions studied in Ghana
and Senegal: around 40 per cent of the population studied say they intend to migrate. With14 per cent, intentions are relatively weak in Egypt. Turkey and Morocco take intermediatepositions (27 and 20 per cent respectively).
• People with international migration experience (return migrants) more frequently intend tomigrate than those without migration experience (non-migrants). As many as one in tworeturn migrants in the two West African countries say they intend to migrate abroad again,and even in the country with the weakest intentions, Morocco, one in four returneesintends to migrate again. However, as the non-migrants are by far the larger group, theeffect of returnee intentions on the totals cited above is minimal.
• The difference between returnees and non-migrants is most pronounced in Egypt, amongboth men and women. In Ghana and Turkey the difference is due to male returnees’stronger intentions to migrate again, but there is no difference between female non-migrants and returnees. On the other hand, in Morocco and Senegal both return migrantmen and non-migrant men have the same migration intentions. Surprisingly, femalereturnees in Senegal (whatever their migration experience) say they intend to migrateagain as frequently as the men do. In Senegal, only female non-migrants are much lesslikely to express an intention to migrate. In Egypt, too, return migrant women are much moreintent on migrating than non-migrant women, and they are comparable to non-migrant menin that respect.
• Not unexpectedly, men consistently express an intention to migrate more frequently thanwomen do, among both returnees and non-migrants. And non-migrant men intend tomigrate more often than female returnees. This is undoubtedly related to the fact that menmore often end up migrating, but perhaps also by the fact that women are frequently –especially in Muslim countries – not the ones who make decisions in the family aboutmigration, at least not independently. The interview situation is likely to be of influence too:particularly in cases where other household members are present during the interview,women may be more inclined to withhold their own opinions and ideas. Having said that, inthese cases this is not reflected in a larger number of “don’t know” answers.
Why do people migrate, or intend to migrate, or why do they prefer to stay in their homecountry? In a study dealing with both internal and international migration, De Jong and Gardner(1981, p. 39) classify the commonly cited motives for migration as maximisation of actual orexpected returns, social mobility and social status attainment, residential satisfaction,affiliations with family and friends, and the attainment of life-style preferences.

Push and pull factors of international migration: a comparative report
107
Table 8.1 Migration intentions of return migrants and non-migrants by sex, per sendingcountry (%)
Return migrants Non-migrants TotalM F T M F T M F T
Turkey yes 41 21 38 33 21 26 34 21 27 no 59 79 62 67 79 74 66 79 73 don’t know - - - - - - - - - total 100 100 100 100 100 100 100 100 100 N 388 85 473 1,476 1,968 3,444 1,864 2,053 3,917 missing 2 - 2 1 - 1 3 - 3
Morocco yes 28 - 27 29 4 20 29 4 20 no 67 100 68 58 85 68 58 85 68 don’t know 5 - 5 13 11 12 12 11 12 total 100 100 100 100 100 100 100 100 100 N 243 11 254 1,020 895 1,915 1,263 906 2,169 missing - - - - - - - - -
Egypt yes 32 19 30 21 4 12 24 5 14 no 64 78 66 71 94 84 69 93 82 don’t know 4 3 4 8 2 5 7 2 4 total 100 100 100 100 100 100 100 100 100 N 877 147 1,024 1,816 2,814 4,630 2,693 2,961 5,654 missing - - - - - - - - -
Ghana yes 56 38 51 48 37 41 49 37 42 no 35 49 39 42 55 49 41 54 49 don’t know 9 13 10 10 9 9 10 9 9 total 100 100 100 100 100 100 100 100 100 N 235 93 328 942 1,328 2,270 1,177 1,421 2,598 missing 1 1 2 4 14 18 5 15 20
Senegal yes 47 48 47 48 26 38 48 28 39 no 46 52 48 41 70 54 42 68 53 don’t know 7 1 5 11 5 8 10 4 8 total 100 100 100 100 100 100 100 100 100 N 583 167 750 1,922 1,921 3,843 2,505 2,088 4,593 missing - - - 2 1 3 2 1 3
In comparison, the most commonly cited motive for not moving is the desire to maintain one’scommunity-based social and economic ties. But most research focuses on why people moverather than why people do not move, and this emphasis undoubtedly contributes to our limitedability to explain and predict the mover-non-mover decision.
Migration is usually a function of multiple motives (De Jong and Gardner, 1981, p. 43). Ourstudy does, indeed, try to capture multiple motives, although we restrict the presentation inthis chapter by only discussing the main motives mentioned. It is hardly surprising, therefore,that the main reason for the intention to migrate is overwhelmingly an economic one: in allcountries 80-90 per cent of non-migrants and return migrants give an economic reason, suchas unemployment or insufficient income, or more generally the wish to improve one’s standardof living (Table 8.2).
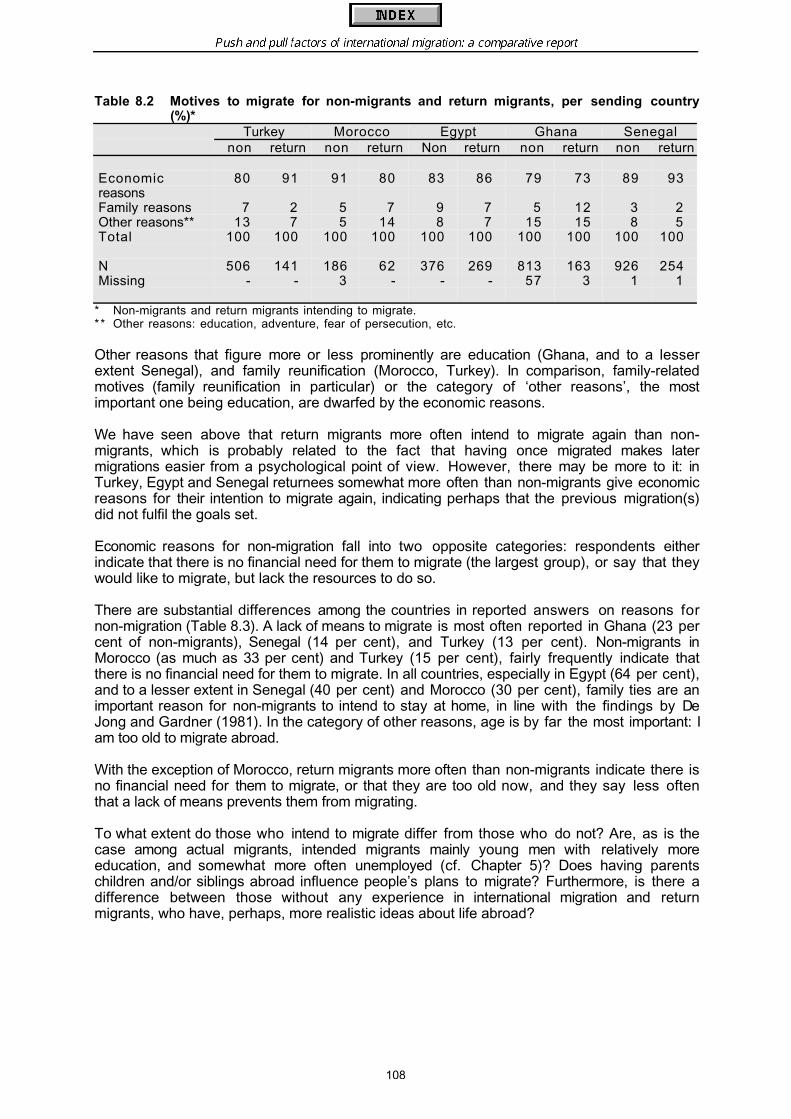
Push and pull factors of international migration: a comparative report
108
Table 8.2 Motives to migrate for non-migrants and return migrants, per sending country(%)*
Turkey Morocco Egypt Ghana Senegalnon return non return Non return non return non return
Economicreasons
80 91 91 80 83 86 79 73 89 93
Family reasons 7 2 5 7 9 7 5 12 3 2Other reasons** 13 7 5 14 8 7 15 15 8 5Total 100 100 100 100 100 100 100 100 100 100
N 506 141 186 62 376 269 813 163 926 254Missing - - 3 - - - 57 3 1 1
* Non-migrants and return migrants intending to migrate.** Other reasons: education, adventure, fear of persecution, etc.
Other reasons that figure more or less prominently are education (Ghana, and to a lesserextent Senegal), and family reunification (Morocco, Turkey). In comparison, family-relatedmotives (family reunification in particular) or the category of ‘other reasons’, the mostimportant one being education, are dwarfed by the economic reasons.
We have seen above that return migrants more often intend to migrate again than non-migrants, which is probably related to the fact that having once migrated makes latermigrations easier from a psychological point of view. However, there may be more to it: inTurkey, Egypt and Senegal returnees somewhat more often than non-migrants give economicreasons for their intention to migrate again, indicating perhaps that the previous migration(s)did not fulfil the goals set.
Economic reasons for non-migration fall into two opposite categories: respondents eitherindicate that there is no financial need for them to migrate (the largest group), or say that theywould like to migrate, but lack the resources to do so.
There are substantial differences among the countries in reported answers on reasons fornon-migration (Table 8.3). A lack of means to migrate is most often reported in Ghana (23 percent of non-migrants), Senegal (14 per cent), and Turkey (13 per cent). Non-migrants inMorocco (as much as 33 per cent) and Turkey (15 per cent), fairly frequently indicate thatthere is no financial need for them to migrate. In all countries, especially in Egypt (64 per cent),and to a lesser extent in Senegal (40 per cent) and Morocco (30 per cent), family ties are animportant reason for non-migrants to intend to stay at home, in line with the findings by DeJong and Gardner (1981). In the category of other reasons, age is by far the most important: Iam too old to migrate abroad.
With the exception of Morocco, return migrants more often than non-migrants indicate there isno financial need for them to migrate, or that they are too old now, and they say less oftenthat a lack of means prevents them from migrating.
To what extent do those who intend to migrate differ from those who do not? Are, as is thecase among actual migrants, intended migrants mainly young men with relatively moreeducation, and somewhat more often unemployed (cf. Chapter 5)? Does having parentschildren and/or siblings abroad influence people’s plans to migrate? Furthermore, is there adifference between those without any experience in international migration and returnmigrants, who have, perhaps, more realistic ideas about life abroad?

Push and pull factors of international migration: a comparative report
109
Table 8.3 Motives to stay for non-migrants and return migrants, per sending country (%)*Turkey Morocco Egypt Ghana Senegal
non return non return non return non return non Return
No financialneeds
15 22 33 14 9 21 10 30 6 16
Lack of means 13 8 4 0 1 1 23 3 14 11Family reasons 20 7 30 10 64 42 23 23 40 36Other reasons** 52 63 32 75 27 37 45 44 40 37Total 100 100 100 100 100 100 100 100 100 100
N 1,593
228 518 141 2,671 524 960 115 1,911 366
Missing 4 3 18 3 1 - 163 5 6 -
* Non-migrants and return migrants not intending to migrate.** Other reasons: old age, health problems, do not like living abroad, study, problems in obtaining permits or
visa or passport, etc.
In order to study these questions, regression analyses were carried out in which the intentionto migrate was the dependent variable. Base populations were non-migrants and returnmigrants in the sending countries. Independent variables included were age (younger than 30versus 30 years and older), sex, marital status (ever married or not), completed level ofeducation (none, primary, secondary, higher) having close relatives (parents, brothers orsisters, children) abroad or not, and employment status (working or not). Whether thedependent variable was dichotomised (yes, intention to migrate versus no, or do not know) ordivided into three categories (yes, no, with the undecided/don’t know category in the middle)did not alter the results significantly.
As shown in Chapter 5, recent migration is selective of young single men. Furthermore, inseveral countries migrants were also somewhat more likely to be unemployed (Turkey,Ghana) or otherwise not working (Morocco). In Egypt, Turkey and Ghana, migrants werefound to be somewhat better educated than non-migrants.
This picture is generally reflected in the migration intentions. Those who intend to migrate, areagain young, single men compared with those who do not intend to migrate. The role of havingwork and a higher education varies per country, as was the case for actual migrants andnon-migrants. Generally, a higher level of education has a positive influence on the intention tomigrate, except in Morocco and in Turkey. But while in Turkey those with a lower educationintend to migrate, the better educated were the ones who actually migrated.
In all countries the majority of migrants and non-migrants were working, although migrantswere less likely to work than non-migrants (except in Egypt and Senegal). But in Morocco,Ghana and Senegal, it is those with work who are more inclined to migrate in the future.Having previous international migration experience is important only in Egypt, Ghana, andSenegal, in the sense that it has a positive influence on intentions to migrate in the future. Therole of family abroad seems limited in influencing migration intentions. In Egypt and Ghana thevariable is significant in the expected direction, but in Morocco those without family abroadindicate an intention to migrate more often.
The same regression analyses repeated for each of the two groups (non-migrants and returnmigrants) generally indicate that for return migrants, young workers in particular or young menin general and in the case of Turkey the higher-educated, intend to migrate, although thevariance explained is mostly low, and the results show little consistency. The non-migrants,being the larger group, obviously show results that are largely comparable to the total group:young working men, who are either less (Morocco and Turkey) or better educated (the othercountries) intend to migrate. Having family abroad appears to be generally irrelevant, with theexception of a positive influence on non-migrants in Egypt and Ghana and on return migrantsin Senegal.

Push and pull factors of international migration: a comparative report
110
In sum, most people do not intend to migrate abroad. Nevertheless, in some of the sendingcountries, especially in Ghana and Senegal, the intention to migrate is quite pronounced. Menmore than women, and those with migration experience more than those without, express anintention to migrate. Generally, as among actual migrants, those intending to migrate tend to beyoung and single. The intention to migrate is overwhelmingly motivated by economic reasons.In so far as intentions not to migrate are motivated by economic reasons, they fall into twoopposite categories: either there is no economic need to migrate, or the respondent lacks thefinancial resources to go abroad. As expected, non-mobility is also strongly motivated byfamily ties and, for older people, by their advanced age.
8.2.2 Receiving countriesIf we turn our attention to the migrants living in the receiving countries, what can we sayabout their migration intentions? Obviously, they have more choices: they can of courseintend to stay in the host country, but in opting for migration, they have the choice betweenreturning home and migrating to a third country. It is often said that migrants use the southernEuropean countries as transit countries to move further north. To the extent that they travel onimmediately, we cannot judge whether this is the case. But among those who have stayed inSpain or Italy for a while, we can examine whether they intend to move onward.
The data show very little evidence that this is the case (Table 8.4). The majority of themigrants interviewed say they intend to return or intend to stay. The percentage intending tomove elsewhere is small among all four groups.
• Few intend to migrate to a third country: generally well below 4 per cent, except among theWest African men interviewed in Spain and Italy (6-8 per cent).
• Returning to one’s home country is favoured by a larger group: approximately 30 per centfor men and women in all groups, with two exceptions: intentions to return are much loweramong Moroccans in Spain (14 per cent). They are low among Senegalese women inSpain as well, as most answered that they did not yet know what they intended to do.
• Staying in the host country is clearly a popular option as well. It is the choice of half theMoroccans in Spain, and of about one third of the Egyptians and Ghanaians in Italy. Onlyamong Senegalese women in Spain does staying seem to be less of an option, but this isstrongly influenced by the very high percentage of women who say they do not know yet(two in three). In all groups, the uncertainty is significant: generally, about one in three isundecided.
Why do migrants intend to return or, alternatively, intend to stay in the destination country? Asin the sending-country surveys, multiple reasons have been asked for, but in this overallreport, only the main reasons are presented below (Tables 8.5 and 8.6).
One third of the Senegalese intended stayers in Spain and about half of the intended stayersin the three other migrants groups say they want to stay because of the relatively securepositions they have reached there: a satisfactory job or, to a lesser extent, sufficient income.On the other hand, one in ten Senegalese said they intended to stay because they could not(yet) afford to go back. Family ties are another important reason why migrants want to stay.
Only among the Senegalese this reason does not figure prominently, as few have theirfamilies with them. Other important reasons for staying are that the migration goals have not(yet) been met (38 per cent of Senegalese intended stayers), or that they feel that life theresuits them well and/or they have friends there (13 and 10 per cent of the Ghanaians andEgyptians in Italy, respectively).
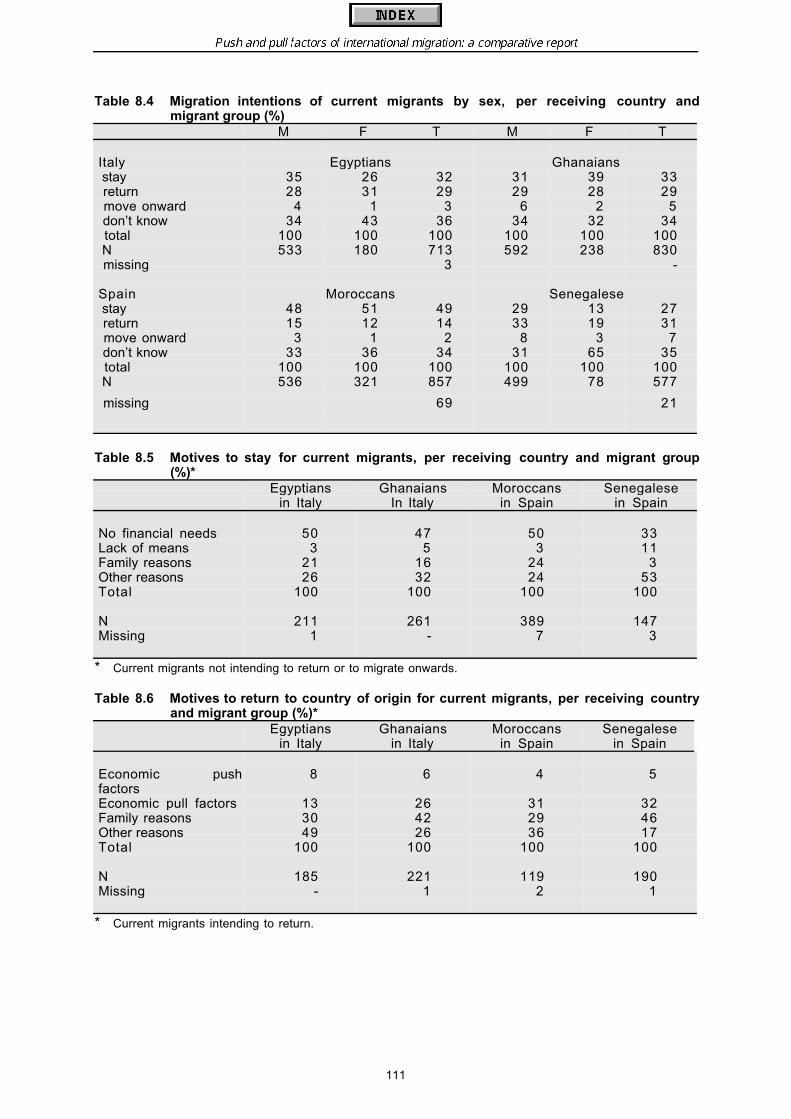
Push and pull factors of international migration: a comparative report
111
Table 8.4 Migration intentions of current migrants by sex, per receiving country andmigrant group (%)
M F T M F T
Italy Egyptians Ghanaians stay 35 26 32 31 39 33 return 28 31 29 29 28 29 move onward 4 1 3 6 2 5 don’t know 34 43 36 34 32 34 total 100 100 100 100 100 100 N 533 180 713 592 238 830 missing 3 -
Spain Moroccans Senegalese stay 48 51 49 29 13 27 return 15 12 14 33 19 31 move onward 3 1 2 8 3 7 don’t know 33 36 34 31 65 35 total 100 100 100 100 100 100 N 536 321 857 499 78 577
missing 69 21
Table 8.5 Motives to stay for current migrants, per receiving country and migrant group(%)*
Egyptiansin Italy
GhanaiansIn Italy
Moroccansin Spain
Senegalesein Spain
No financial needs 50 47 50 33Lack of means 3 5 3 11Family reasons 21 16 24 3Other reasons 26 32 24 53Total 100 100 100 100
N 211 261 389 147Missing 1 - 7 3
* Current migrants not intending to return or to migrate onwards.
Table 8.6 Motives to return to country of origin for current migrants, per receiving countryand migrant group (%)*
Egyptiansin Italy
Ghanaiansin Italy
Moroccansin Spain
Senegalesein Spain
Economic pushfactors
8 6 4 5
Economic pull factors 13 26 31 32Family reasons 30 42 29 46Other reasons 49 26 36 17Total 100 100 100 100
N 185 221 119 190Missing - 1 2 1
* Current migrants intending to return.
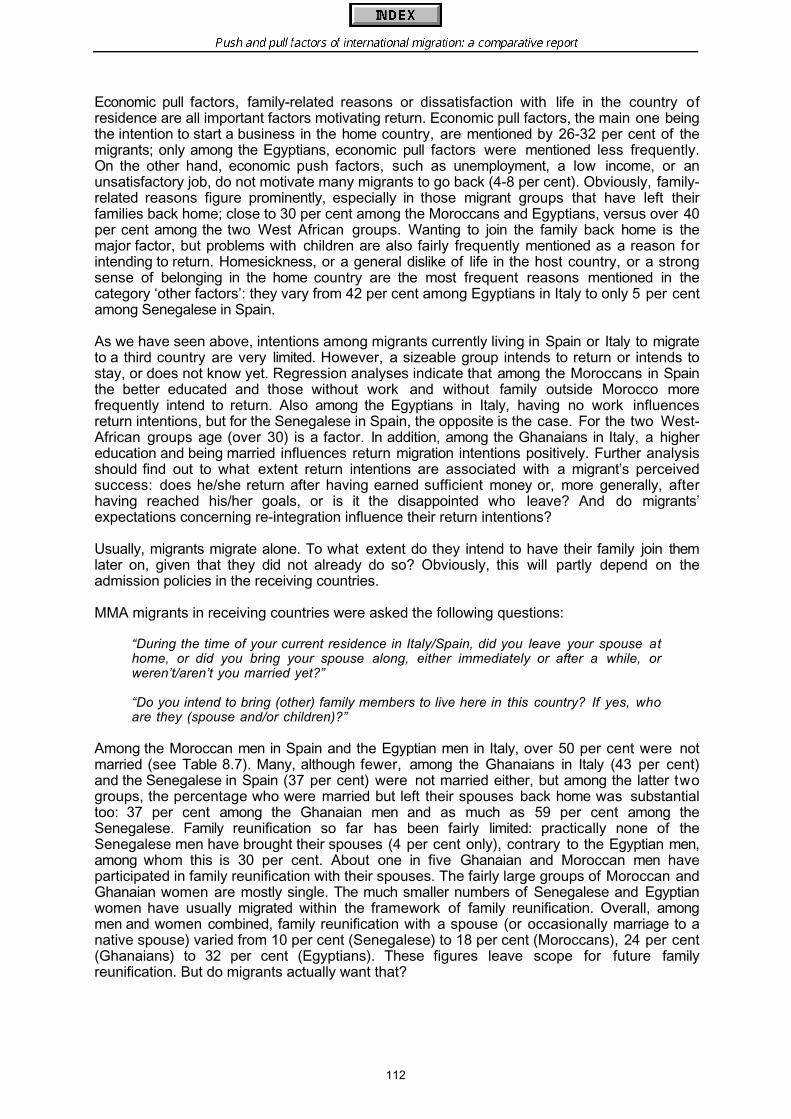
Push and pull factors of international migration: a comparative report
112
Economic pull factors, family-related reasons or dissatisfaction with life in the country ofresidence are all important factors motivating return. Economic pull factors, the main one beingthe intention to start a business in the home country, are mentioned by 26-32 per cent of themigrants; only among the Egyptians, economic pull factors were mentioned less frequently.On the other hand, economic push factors, such as unemployment, a low income, or anunsatisfactory job, do not motivate many migrants to go back (4-8 per cent). Obviously, family-related reasons figure prominently, especially in those migrant groups that have left theirfamilies back home; close to 30 per cent among the Moroccans and Egyptians, versus over 40per cent among the two West African groups. Wanting to join the family back home is themajor factor, but problems with children are also fairly frequently mentioned as a reason forintending to return. Homesickness, or a general dislike of life in the host country, or a strongsense of belonging in the home country are the most frequent reasons mentioned in thecategory ‘other factors’: they vary from 42 per cent among Egyptians in Italy to only 5 per centamong Senegalese in Spain.
As we have seen above, intentions among migrants currently living in Spain or Italy to migrateto a third country are very limited. However, a sizeable group intends to return or intends tostay, or does not know yet. Regression analyses indicate that among the Moroccans in Spainthe better educated and those without work and without family outside Morocco morefrequently intend to return. Also among the Egyptians in Italy, having no work influencesreturn intentions, but for the Senegalese in Spain, the opposite is the case. For the two West-African groups age (over 30) is a factor. In addition, among the Ghanaians in Italy, a highereducation and being married influences return migration intentions positively. Further analysisshould find out to what extent return intentions are associated with a migrant’s perceivedsuccess: does he/she return after having earned sufficient money or, more generally, afterhaving reached his/her goals, or is it the disappointed who leave? And do migrants’expectations concerning re-integration influence their return intentions?
Usually, migrants migrate alone. To what extent do they intend to have their family join themlater on, given that they did not already do so? Obviously, this will partly depend on theadmission policies in the receiving countries.
MMA migrants in receiving countries were asked the following questions:
“During the time of your current residence in Italy/Spain, did you leave your spouse athome, or did you bring your spouse along, either immediately or after a while, orweren’t/aren’t you married yet?”
“Do you intend to bring (other) family members to live here in this country? If yes, whoare they (spouse and/or children)?”
Among the Moroccan men in Spain and the Egyptian men in Italy, over 50 per cent were notmarried (see Table 8.7). Many, although fewer, among the Ghanaians in Italy (43 per cent)and the Senegalese in Spain (37 per cent) were not married either, but among the latter twogroups, the percentage who were married but left their spouses back home was substantialtoo: 37 per cent among the Ghanaian men and as much as 59 per cent among theSenegalese. Family reunification so far has been fairly limited: practically none of theSenegalese men have brought their spouses (4 per cent only), contrary to the Egyptian men,among whom this is 30 per cent. About one in five Ghanaian and Moroccan men haveparticipated in family reunification with their spouses. The fairly large groups of Moroccan andGhanaian women are mostly single. The much smaller numbers of Senegalese and Egyptianwomen have usually migrated within the framework of family reunification. Overall, amongmen and women combined, family reunification with a spouse (or occasionally marriage to anative spouse) varied from 10 per cent (Senegalese) to 18 per cent (Moroccans), 24 per cent(Ghanaians) to 32 per cent (Egyptians). These figures leave scope for future familyreunification. But do migrants actually want that?
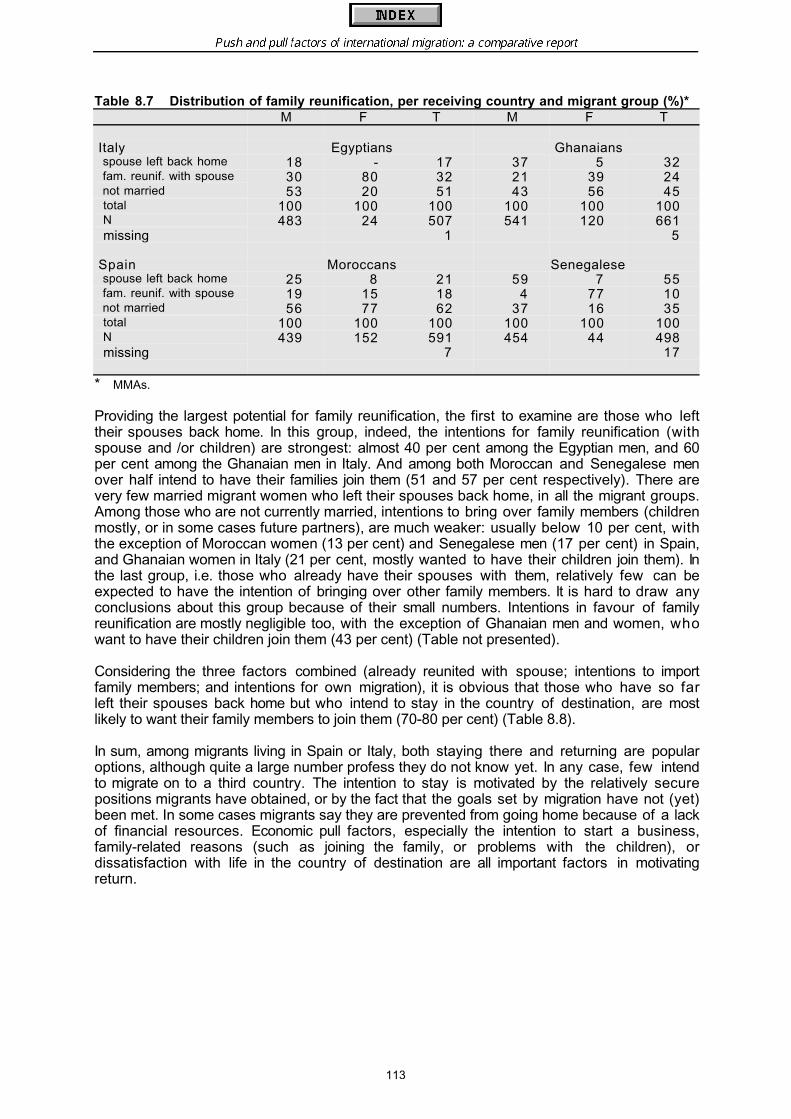
Push and pull factors of international migration: a comparative report
113
Table 8.7 Distribution of family reunification, per receiving country and migrant group (%)*M F T M F T
Italy Egyptians Ghanaians spouse left back home 18 - 17 37 5 32 fam. reunif. with spouse 30 80 32 21 39 24 not married 53 20 51 43 56 45 total 100 100 100 100 100 100 N 483 24 507 541 120 661 missing 1 5
Spain Moroccans Senegalese spouse left back home 25 8 21 59 7 55 fam. reunif. with spouse 19 15 18 4 77 10 not married 56 77 62 37 16 35 total 100 100 100 100 100 100 N 439 152 591 454 44 498 missing 7 17
* MMAs.
Providing the largest potential for family reunification, the first to examine are those who lefttheir spouses back home. In this group, indeed, the intentions for family reunification (withspouse and /or children) are strongest: almost 40 per cent among the Egyptian men, and 60per cent among the Ghanaian men in Italy. And among both Moroccan and Senegalese menover half intend to have their families join them (51 and 57 per cent respectively). There arevery few married migrant women who left their spouses back home, in all the migrant groups.Among those who are not currently married, intentions to bring over family members (childrenmostly, or in some cases future partners), are much weaker: usually below 10 per cent, withthe exception of Moroccan women (13 per cent) and Senegalese men (17 per cent) in Spain,and Ghanaian women in Italy (21 per cent, mostly wanted to have their children join them). Inthe last group, i.e. those who already have their spouses with them, relatively few can beexpected to have the intention of bringing over other family members. It is hard to draw anyconclusions about this group because of their small numbers. Intentions in favour of familyreunification are mostly negligible too, with the exception of Ghanaian men and women, whowant to have their children join them (43 per cent) (Table not presented).
Considering the three factors combined (already reunited with spouse; intentions to importfamily members; and intentions for own migration), it is obvious that those who have so farleft their spouses back home but who intend to stay in the country of destination, are mostlikely to want their family members to join them (70-80 per cent) (Table 8.8).
In sum, among migrants living in Spain or Italy, both staying there and returning are popularoptions, although quite a large number profess they do not know yet. In any case, few intendto migrate on to a third country. The intention to stay is motivated by the relatively securepositions migrants have obtained, or by the fact that the goals set by migration have not (yet)been met. In some cases migrants say they are prevented from going home because of a lackof financial resources. Economic pull factors, especially the intention to start a business,family-related reasons (such as joining the family, or problems with the children), ordissatisfaction with life in the country of destination are all important factors in motivatingreturn.
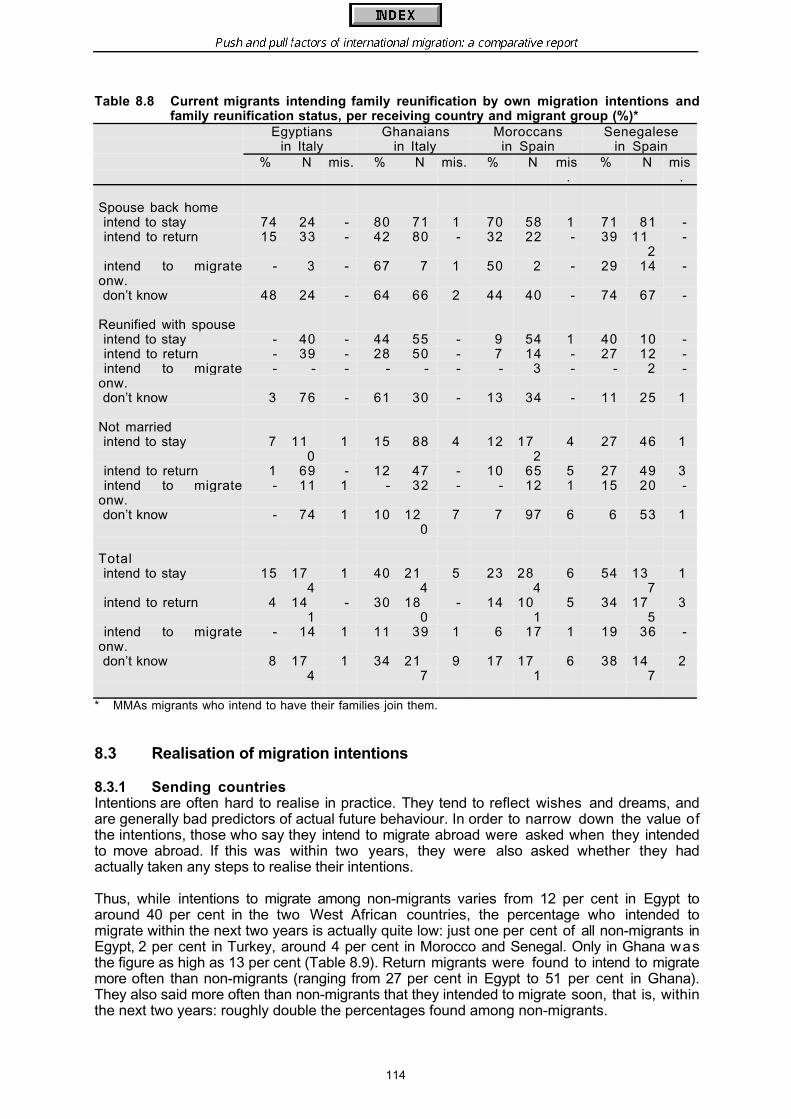
Push and pull factors of international migration: a comparative report
114
Table 8.8 Current migrants intending family reunification by own migration intentions andfamily reunification status, per receiving country and migrant group (%)*
Egyptiansin Italy
Ghanaiansin Italy
Moroccansin Spain
Senegalesein Spain
% N mis. % N mis. % N mis.
% N mis.
Spouse back home intend to stay 74 24 - 80 71 1 70 58 1 71 81 - intend to return 15 33 - 42 80 - 32 22 - 39 11
2-
intend to migrateonw.
- 3 - 67 7 1 50 2 - 29 14 -
don’t know 48 24 - 64 66 2 44 40 - 74 67 -
Reunified with spouse intend to stay - 40 - 44 55 - 9 54 1 40 10 - intend to return - 39 - 28 50 - 7 14 - 27 12 - intend to migrateonw.
- - - - - - - 3 - - 2 -
don’t know 3 76 - 61 30 - 13 34 - 11 25 1
Not married intend to stay 7 11
01 15 88 4 12 17
24 27 46 1
intend to return 1 69 - 12 47 - 10 65 5 27 49 3 intend to migrateonw.
- 11 1 - 32 - - 12 1 15 20 -
don’t know - 74 1 10 120
7 7 97 6 6 53 1
Total intend to stay 15 17
41 40 21
45 23 28
46 54 13
71
intend to return 4 141
- 30 180
- 14 101
5 34 175
3
intend to migrateonw.
- 14 1 11 39 1 6 17 1 19 36 -
don’t know 8 174
1 34 217
9 17 171
6 38 147
2
* MMAs migrants who intend to have their families join them.
8.3 Realisation of migration intentions
8.3.1 Sending countriesIntentions are often hard to realise in practice. They tend to reflect wishes and dreams, andare generally bad predictors of actual future behaviour. In order to narrow down the value ofthe intentions, those who say they intend to migrate abroad were asked when they intendedto move abroad. If this was within two years, they were also asked whether they hadactually taken any steps to realise their intentions.
Thus, while intentions to migrate among non-migrants varies from 12 per cent in Egypt toaround 40 per cent in the two West African countries, the percentage who intended tomigrate within the next two years is actually quite low: just one per cent of all non-migrants inEgypt, 2 per cent in Turkey, around 4 per cent in Morocco and Senegal. Only in Ghana wasthe figure as high as 13 per cent (Table 8.9). Return migrants were found to intend to migratemore often than non-migrants (ranging from 27 per cent in Egypt to 51 per cent in Ghana).They also said more often than non-migrants that they intended to migrate soon, that is, withinthe next two years: roughly double the percentages found among non-migrants.

Push and pull factors of international migration: a comparative report
115
The large differences between general intentions and intentions within two years are due tothe large percentage of people who say they do not really know when they would migrate(rather than to people who say it will happen in the more distant future). It is again indicativeof the vagueness of intentions, which is in turn influenced by the fact that people lack thefinancial means and the certainty of being admitted.
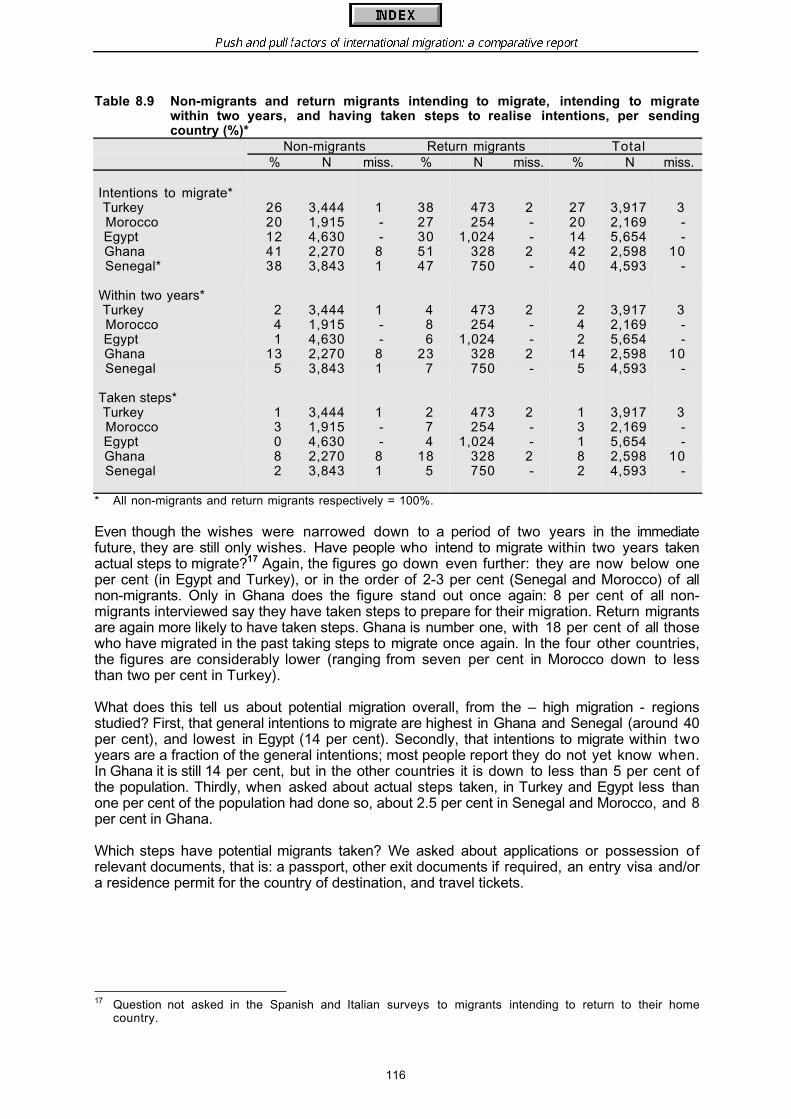
Push and pull factors of international migration: a comparative report
116
Table 8.9 Non-migrants and return migrants intending to migrate, intending to migratewithin two years, and having taken steps to realise intentions, per sendingcountry (%)*
Non-migrants Return migrants Total% N miss. % N miss. % N miss.
Intentions to migrate* Turkey 26 3,444 1 38 473 2 27 3,917 3 Morocco 20 1,915 - 27 254 - 20 2,169 - Egypt 12 4,630 - 30 1,024 - 14 5,654 - Ghana 41 2,270 8 51 328 2 42 2,598 10 Senegal* 38 3,843 1 47 750 - 40 4,593 -
Within two years* Turkey 2 3,444 1 4 473 2 2 3,917 3 Morocco 4 1,915 - 8 254 - 4 2,169 - Egypt 1 4,630 - 6 1,024 - 2 5,654 - Ghana 13 2,270 8 23 328 2 14 2,598 10 Senegal 5 3,843 1 7 750 - 5 4,593 -
Taken steps* Turkey 1 3,444 1 2 473 2 1 3,917 3 Morocco 3 1,915 - 7 254 - 3 2,169 - Egypt 0 4,630 - 4 1,024 - 1 5,654 - Ghana 8 2,270 8 18 328 2 8 2,598 10 Senegal 2 3,843 1 5 750 - 2 4,593 -
* All non-migrants and return migrants respectively = 100%.
Even though the wishes were narrowed down to a period of two years in the immediatefuture, they are still only wishes. Have people who intend to migrate within two years takenactual steps to migrate?17 Again, the figures go down even further: they are now below oneper cent (in Egypt and Turkey), or in the order of 2-3 per cent (Senegal and Morocco) of allnon-migrants. Only in Ghana does the figure stand out once again: 8 per cent of all non-migrants interviewed say they have taken steps to prepare for their migration. Return migrantsare again more likely to have taken steps. Ghana is number one, with 18 per cent of all thosewho have migrated in the past taking steps to migrate once again. In the four other countries,the figures are considerably lower (ranging from seven per cent in Morocco down to lessthan two per cent in Turkey).
What does this tell us about potential migration overall, from the – high migration - regionsstudied? First, that general intentions to migrate are highest in Ghana and Senegal (around 40per cent), and lowest in Egypt (14 per cent). Secondly, that intentions to migrate within twoyears are a fraction of the general intentions; most people report they do not yet know when.In Ghana it is still 14 per cent, but in the other countries it is down to less than 5 per cent ofthe population. Thirdly, when asked about actual steps taken, in Turkey and Egypt less thanone per cent of the population had done so, about 2.5 per cent in Senegal and Morocco, and 8per cent in Ghana.
Which steps have potential migrants taken? We asked about applications or possession ofrelevant documents, that is: a passport, other exit documents if required, an entry visa and/ora residence permit for the country of destination, and travel tickets.
17 Question not asked in the Spanish and Italian surveys to migrants intending to return to their home
country.

Push and pull factors of international migration: a comparative report
117
Let us first look at Ghana, whose residents seem to show most initiative in preparing formigration. What does it consist of? Among the small group of return migrants who took stepsto prepare for another departure, the most common steps taken are applications orpossession of a (Ghanaian) passport (83 per cent of those who said they have taken any ofthese steps). Significant numbers have either obtained or applied for entry visas (7 and 17per cent) or residence permits (5 and 12 per cent). Among the larger group of non-migrantswho say they intend to leave within two years and who have taken some steps, the actualsteps taken are limited though, and consist mostly of having a passport (42 per cent) or ofhaving applied for one (15 per cent). The applications for entry visas ( eight per cent) andresidence permits (four per cent) are very small. Most non-migrants have done nothing yet toacquire such papers, or say they will do this later (Table 8.10). The other countries show asimilar difference between return migrants and non-migrants. The former are more likely tohave a passport.
In Senegal, the small group of return migrants indicate relatively frequently that they do notneed papers; perhaps because they have dual nationality. One in four have already appliedfor an entry visa, but few have one. About half say they have travel tickets or are in theprocess of obtaining them. Non-migrants: one third have a passport, and another 13 per centhave applied for one. Entry visas are applied for by six per cent, but few have obtained one.
Two in three return migrants, and one in two non-migrants in Morocco are in possession of apassport. Again, entry visas have been applied for, but not received. This is a small group, but18 per cent of the returnees say they either have a residence permit or do not need one. Thisis much less so among non-migrants, not many of whom have applied for or have obtaineddestination papers, or do not need to. A negligible minority have travel tickets. A large majorityare postponing all these matters to a later date.
Quite a large number of Turkish return migrants intending to migrate again still have to obtainpassports (two in three). But note that this is a very small group, as very few with migrationintentions have actually taken any steps to prepare for migration. The non-migrant group issmall too, and the number of missing answers here is fairly large. Entry visas have beenapplied for but have hardly been obtained.
Most of the small group of Egyptian return migrants with migration intentions have a passport(two in three). Some already have residence permits (eight per cent). Among non-migrantswho say they have taken steps to migrate within two years, only one in four has a passport,and few if any have any other documents.
Finally, given the fact that they have experience with migration, return migrants intending tomigrate again more often than non-migrants with migration intentions say that they intend tomigrate within the next two years. If so, they are also more likely than non-migrants to havetaken steps to put their plans into action. Nevertheless, such steps normally involve obtainingdocuments from the country of origin (passports, other exit documents) rather thandocuments from the country of destination (visas, residence permits, etc.).
In sum, although the intention to migrate is strong in some countries (keeping in mind that themajority of people have no intention to migrate abroad), intentions are not easy to realise.While general intentions to migrate vary between 14 per cent (Egypt) and 42 per cent(Ghana), far fewer people believe they will realise their intentions within the next two years:the percentage who intend to do so is generally below 5 per cent, with the exception ofGhana (14 per cent). When asked whether they have actually taken any steps to prepare formigration, the percentages drop even further.
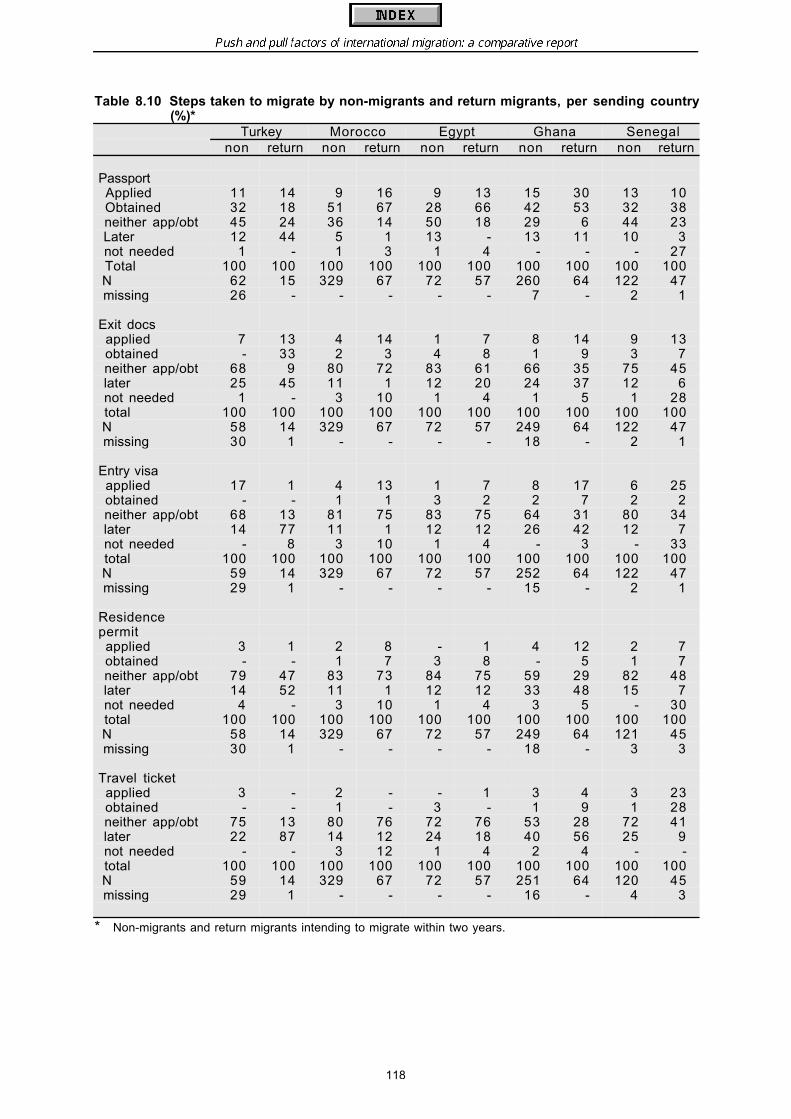
Push and pull factors of international migration: a comparative report
118
Table 8.10 Steps taken to migrate by non-migrants and return migrants, per sending country(%)*
Turkey Morocco Egypt Ghana Senegalnon return non return non return non return non return
Passport Applied 11 14 9 16 9 13 15 30 13 10 Obtained 32 18 51 67 28 66 42 53 32 38 neither app/obt 45 24 36 14 50 18 29 6 44 23 Later 12 44 5 1 13 - 13 11 10 3 not needed 1 - 1 3 1 4 - - - 27 Total 100 100 100 100 100 100 100 100 100 100 N 62 15 329 67 72 57 260 64 122 47 missing 26 - - - - - 7 - 2 1
Exit docs applied 7 13 4 14 1 7 8 14 9 13 obtained - 33 2 3 4 8 1 9 3 7 neither app/obt 68 9 80 72 83 61 66 35 75 45 later 25 45 11 1 12 20 24 37 12 6 not needed 1 - 3 10 1 4 1 5 1 28 total 100 100 100 100 100 100 100 100 100 100 N 58 14 329 67 72 57 249 64 122 47 missing 30 1 - - - - 18 - 2 1
Entry visa applied 17 1 4 13 1 7 8 17 6 25 obtained - - 1 1 3 2 2 7 2 2 neither app/obt 68 13 81 75 83 75 64 31 80 34 later 14 77 11 1 12 12 26 42 12 7 not needed - 8 3 10 1 4 - 3 - 33 total 100 100 100 100 100 100 100 100 100 100 N 59 14 329 67 72 57 252 64 122 47 missing 29 1 - - - - 15 - 2 1
Residencepermit applied 3 1 2 8 - 1 4 12 2 7 obtained - - 1 7 3 8 - 5 1 7 neither app/obt 79 47 83 73 84 75 59 29 82 48 later 14 52 11 1 12 12 33 48 15 7 not needed 4 - 3 10 1 4 3 5 - 30 total 100 100 100 100 100 100 100 100 100 100 N 58 14 329 67 72 57 249 64 121 45 missing 30 1 - - - - 18 - 3 3
Travel ticket applied 3 - 2 - - 1 3 4 3 23 obtained - - 1 - 3 - 1 9 1 28 neither app/obt 75 13 80 76 72 76 53 28 72 41 later 22 87 14 12 24 18 40 56 25 9 not needed - - 3 12 1 4 2 4 - - total 100 100 100 100 100 100 100 100 100 100 N 59 14 329 67 72 57 251 64 120 45 missing 29 1 - - - - 16 - 4 3
* Non-migrants and return migrants intending to migrate within two years.

Push and pull factors of international migration: a comparative report
119
8.3.2 Receiving countriesWe have seen in section 8.2 that few migrants intend to migrate to a third country: only two-three per cent of the Moroccans in Spain or the Egyptians in Italy. Figures for the other twogroups were slightly higher: five per cent for Ghanaians in Italy, and seven per cent forSenegalese in Spain. Return is more popular: about 30 per cent of the Senegalese, Ghanaiansand Egyptians want to return; but only 14 per cent of the Moroccans. It does therefore notfollow that to stay is the most popular option: one in three professes they do not know yetwhat their future migration plans are.
For those who do say that they want to migrate on, or want to return, how soon do theyintend to do so? In Spain, fewer than one per cent of the migrants residing there now want tomove on to a third country within the next two years (Table 8.11). Even among those who dowant to migrate onwards this is a small minority: more than 90 per cent intend to stay in Spainfor at least the next two years. In Italy the figures are marginally higher: 1.5 per cent of allcurrent migrants intend to move onwards within the next two years. As in Spain, fewer havetaken steps, but among those who want to move on, more are likely to intend to do so withintwo years than in Spain. But in both countries, the numbers of potential onward migrants areso small that hardly anything meaningful can be said about them.
About 30 per cent of current migrants (except Moroccans in Spain: 14 per cent) intend toreturn, but they are not in a hurry to do so. One in ten Egyptians intends to return within twoyears (38 per cent of all those with the intention of returning).
Among the other three nationalities, return intentions in the near future are below five percent. However, there is considerable uncertainty about the future, as expressed in the highpercentages who say they do not know yet.
Table 8.11 Current migrants intending to migrate, intending to migrate within two years andhaving taken steps, per receiving country and migrant group (%)*
Egyptiansin Italy
Ghanaiansin Italy
Moroccansin Spain
Senegalesein Spain
% N miss.
% N miss.
% N miss.
% N miss.
Intentions to migrate onw. 3 713 3 5 830 - 2 857 69 7 577 21Within two years 2 713 3 1 830 - - 857 69 1 577 21Taken steps - 713 3 1 830 - - 857 69 1 577 21
Intentions to return 29 713 3 29 830 - 14 857 69 31 577 21Within two years 11 713 3 5 830 - - 857 69 1 577 21
* All migrants = 100%.
8.4 Preferred destinations
This section deals with the ultimate preferred country of destination of people who intend tomigrate: non-migrants and return migrants in the sending countries and current migrants in thereceiving countries. However, as stated earlier, few surveyed current migrants in thereceiving countries intend to migrate to a third country. Return is much more popular.Therefore, drawing conclusions is hardly justified on the basis of the small numbers ofmigrants in the receiving countries intending to move on. The only thing that might be said isthat Moroccans and Senegalese in Spain prefer to ultimately move to another EU countrywhereas the majority of Egyptians and Ghanaians in Italy opt for a non-EU country.
Push and pull factors of international migration: a comparative report
120
On the basis of the numbers of respondents intending to migrate in the sending countriesmuch more can be said about the ultimate preferred destination of non-migrants and returnmigrants in these countries. Table 8.12 shows the main results. First of all, a comparison withthe actual country of destination of recent migrants (i.e. current and return migrants; seeFigure 6.4) will be made. Next, differences in preferences between non-migrants and returnmigrants will be discussed.
For Turkey, it appears that Germany is even more attractive to non-migrants and returnmigrants who intend to migrate than to those who have actually moved to these countries:almost two out of every three prefer Germany as their ultimate destination. Although to alesser degree, the same is true for the Netherlands and the category non-EU countries.Switzerland maintains its position (preferred by eight per cent who intend to migrate and byeight per cent of those who actually migrated) while Austria and France emerge as lessattractive to potential migrants than they were to recent migrants. Remarkable differences inpreference between Turkish non-migrants and Turkish return migrants can be observed inrelation to Switzerland (preferred more by return migrants), other EU countries (preferredmore by non-migrants) and other non-EU countries (preferred more by return migrants).18
Spain, Italy and France remain the main preferred ultimate destination countries for Moroccannon-migrants and return migrants who intend to migrate. Compared with those who actuallymoved, the position of Spain has become more important at the expense of France and Italy.For Spain there is no difference in preference between Moroccan non-migrants andMoroccan return migrants. However, discrepancies in this respect can be found for Italy(preferred by return migrants) and France (preferred by non-migrants).
For Egyptian non-migrants and return migrants who intend to migrate, Saudi Arabia is still thefavourite destination. Due to the recent conflicts in the region, Iraq has disappeared from thelist of preferred destinations. Iraq’s position has been taken over by Kuwait. Furthermore, it isworth mentioning that the United Arab Emirates have entered the list at the expense of Jordan.Although still modest, the share that prefer a country of the EU has increased among non-migrants and return migrants who intend to migrate, compared with the migrants who left foran EU country in the past ten years. Looking at differences concerning the preferred ultimatedestination between Egyptian non-migrants intending to migrate and Egyptian return migrantsintending to migrate again, it appears that non-migrants show a stronger preference for SaudiArabia and are less inclined to move to Kuwait.
The USA is by far the most popular ultimate destination among Ghanaian potential migrants,followed at a distance by Germany and the United Kingdom. More than 40 per cent wish tomove to the USA against only 18 per cent of the actual movements of recent migrants. As aresult, Italy and Nigeria have disappeared from the list of most preferred countries.
The high scores for the USA, Germany and the UK apply especially to Ghanaian non-migrants;for return migrants they are substantially lower.
Surprisingly, the USA is also the most preferred destination for potential Senegalese migrantswhile hardly any Senegalese migrants actually moved to this country. Italy, the number one forrecent migrants, is the second most preferred destination, followed by France, the numberfive for recent migrants. Gambia, Mauritania and Ivory Coast, important destinations for recentmigrants, are not among the favourite countries. Similar to the situation in Ghana, the USA ispreferred in particular by non-migrants. This is also true as regards Italy. Return migrantsshow more variety in their preferred ultimate destination.
18 Note that in particular in Turkey many respondents (about 20 per cent) did not know which country they
would ultimately prefer to migrate to. In the other surveyed countries these numbers were almostnegligible.
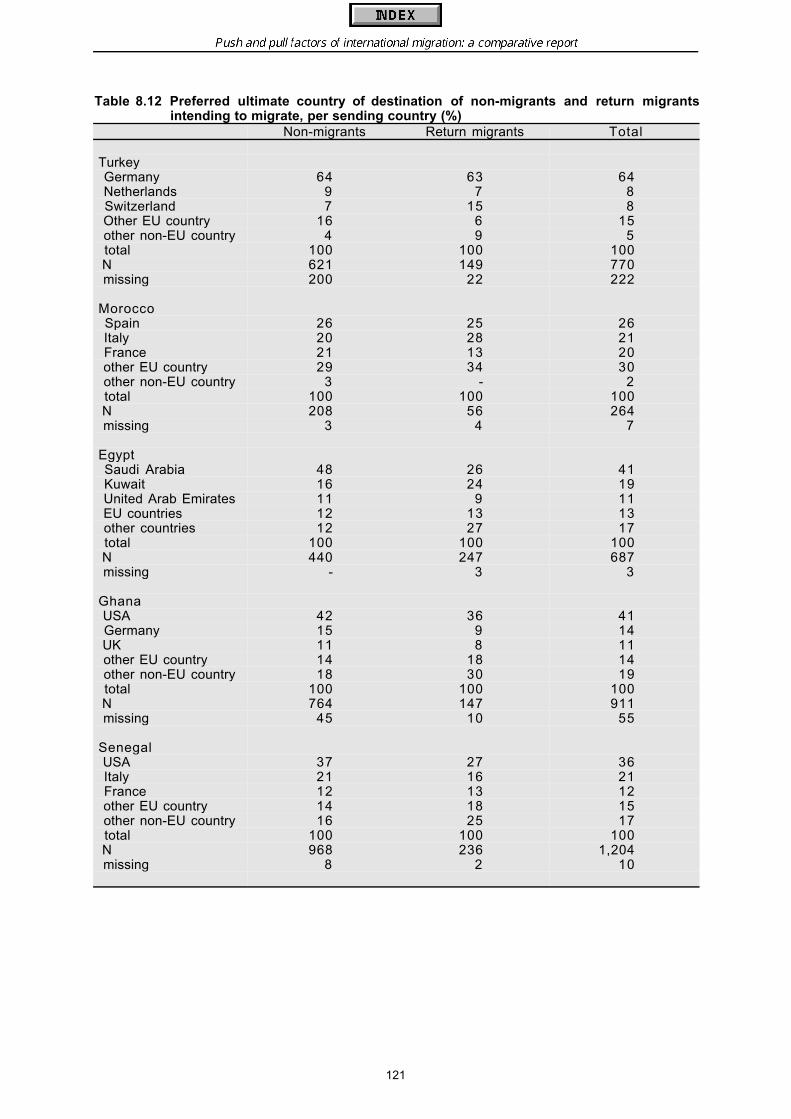
Push and pull factors of international migration: a comparative report
121
Table 8.12 Preferred ultimate country of destination of non-migrants and return migrantsintending to migrate, per sending country (%)
Non-migrants Return migrants Total
Turkey Germany 64 63 64 Netherlands 9 7 8 Switzerland 7 15 8 Other EU country 16 6 15 other non-EU country 4 9 5 total 100 100 100 N 621 149 770 missing 200 22 222
Morocco Spain 26 25 26 Italy 20 28 21 France 21 13 20 other EU country 29 34 30 other non-EU country 3 - 2 total 100 100 100 N 208 56 264 missing 3 4 7
Egypt Saudi Arabia 48 26 41 Kuwait 16 24 19 United Arab Emirates 11 9 11 EU countries 12 13 13 other countries 12 27 17 total 100 100 100 N 440 247 687 missing - 3 3
Ghana USA 42 36 41 Germany 15 9 14 UK 11 8 11 other EU country 14 18 14 other non-EU country 18 30 19 total 100 100 100 N 764 147 911 missing 45 10 55
Senegal USA 37 27 36 Italy 21 16 21 France 12 13 12 other EU country 14 18 15 other non-EU country 16 25 17 total 100 100 100 N 968 236 1,204 missing 8 2 10

Push and pull factors of international migration: a comparative report
122
In general, it can be said that the ultimate preferred country of destination for non-migrantsand return migrants intending to migrate resembles the actual country of destination ofmigrants who recently moved. However, there are some remarkable exceptions to this rule.Especially the wish of many Senegalese and Ghanaians to move to the USA is not reflected inthe actual pattern. For the non-migrants among them in particular, the USA seems to be the‘country of their dreams’. Furthermore, the attractiveness of Germany to Turks is worthmentioning. Despite the relatively strong representation of Germany in the actual distribution ofTurkish emigration, there is room for a considerable increase in the event that the migrationintentions of Turkish non-migrants and return migrants will come true. Finally, there is anotable difference among Egyptians in their preference for Saudi Arabia: while almost half ofthe interviewed Egyptian non-migrants with migration intentions would like to leave for SaudiArabia, only a quarter of the return migrants wish to do so.
The non-migrants and return migrants in the sending countries who intend to migrate wereasked about their motives for choosing a particular ultimate country of destination:
“Why do you consider moving to this particular country to live there?”
Respondents were asked to name their two most important reasons, the first of which isincluded in the present analysis. As in Chapter 6, the motives are grouped into three overallcategories of economic, family-related, and other reasons.
Figure 8.1 summarises the main reasons for preferring a specific ultimate country ofdestination among both men and women. The differences in this respect between non-migrants and return migrants are shown in Table 8.13.
In all surveyed sending countries, the majority of men with migration intentions choose aparticular destination for economic reasons. This picture is most pronounced in Egypt andSenegal. With the exception of Moroccan women, economic reasons are also dominant forwomen who intend to migrate, especially in Senegal and Ghana.
Table 8.13 Main reason for choosing preferred ultimate country of destination of non-migrants and return migrants intending to migrate by sex, per sending country(%)
Turkey Morocco Egypt Ghana Senegalnon return non return non return non return non return
Men economic reasons 64 40 62 33 73 65 56 63 71 81 family reasons 19 12 26 11 8 5 18 17 9 1 other reasons 16 48 12 56 18 30 25 21 20 18 total 100 100 100 100 100 100 100 100 100 100 N 148 102 93 55 221 217 367 105 468 180 missing 3 - 5 2 - - 38 17 1 -
Women economic reasons 49 22 17 - 46 - 63 31 62 76 family reasons 34 44 83 - 18 42 16 50 19 7 other reasons 16 33 - - 36 58 22 19 18 17 Total 100 100 100 - 100 100 100 100 100 100 N 263 22 21 - 97 11 369 34 331 45 Missing 7 - - - - - 28 1 - 1
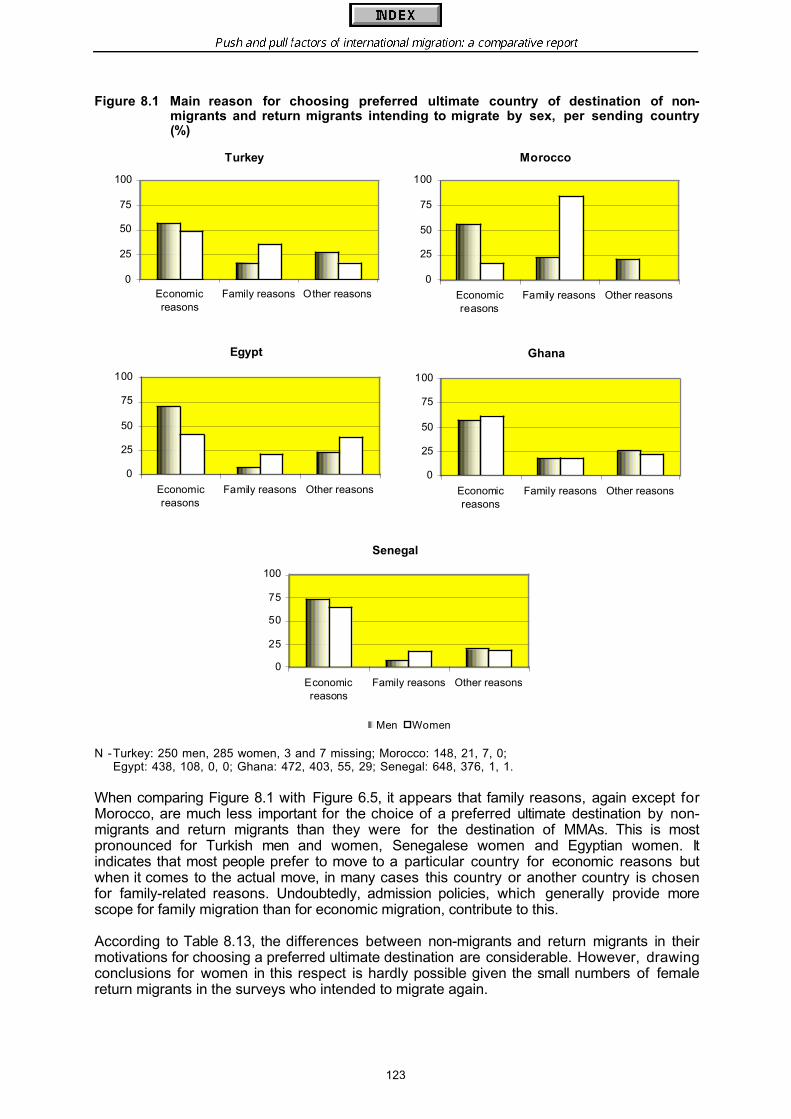
Push and pull factors of international migration: a comparative report
123
Figure 8.1 Main reason for choosing preferred ultimate country of destination of non-migrants and return migrants intending to migrate by sex, per sending country(%)
N -Turkey: 250 men, 285 women, 3 and 7 missing; Morocco: 148, 21, 7, 0;Egypt: 438, 108, 0, 0; Ghana: 472, 403, 55, 29; Senegal: 648, 376, 1, 1.
When comparing Figure 8.1 with Figure 6.5, it appears that family reasons, again except forMorocco, are much less important for the choice of a preferred ultimate destination by non-migrants and return migrants than they were for the destination of MMAs. This is mostpronounced for Turkish men and women, Senegalese women and Egyptian women. Itindicates that most people prefer to move to a particular country for economic reasons butwhen it comes to the actual move, in many cases this country or another country is chosenfor family-related reasons. Undoubtedly, admission policies, which generally provide morescope for family migration than for economic migration, contribute to this.
According to Table 8.13, the differences between non-migrants and return migrants in theirmotivations for choosing a preferred ultimate destination are considerable. However, drawingconclusions for women in this respect is hardly possible given the small numbers of femalereturn migrants in the surveys who intended to migrate again.
Turkey
0
25
50
75
100
Economicreasons
Family reasons Other reasons
Morocco
0
25
50
75
100
Economicreasons
Family reasons Other reasons
Egypt
0
25
50
75
100
Economicreasons
Family reasons Other reasons
Ghana
0
25
50
75
100
Economicreasons
Family reasons Other reasons
Senegal
0
25
50
75
100
Economicreasons
Family reasons Other reasons
Men Women
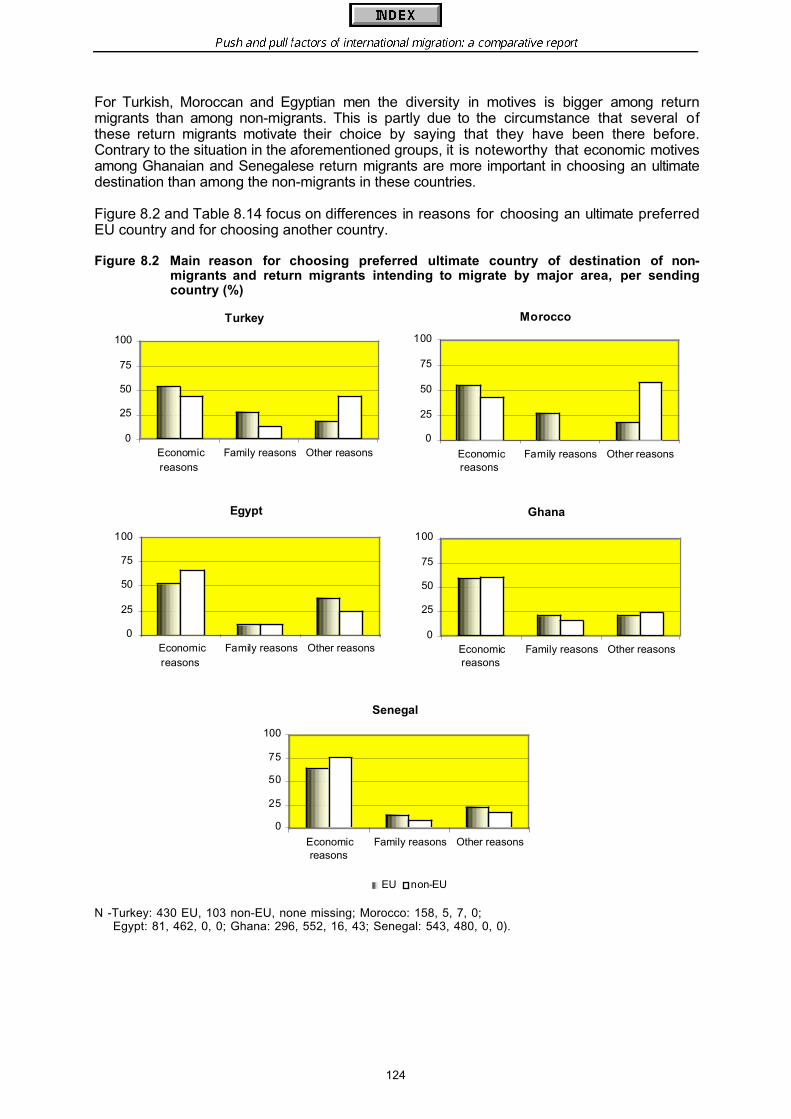
Push and pull factors of international migration: a comparative report
124
For Turkish, Moroccan and Egyptian men the diversity in motives is bigger among returnmigrants than among non-migrants. This is partly due to the circumstance that several ofthese return migrants motivate their choice by saying that they have been there before.Contrary to the situation in the aforementioned groups, it is noteworthy that economic motivesamong Ghanaian and Senegalese return migrants are more important in choosing an ultimatedestination than among the non-migrants in these countries.
Figure 8.2 and Table 8.14 focus on differences in reasons for choosing an ultimate preferredEU country and for choosing another country.
Figure 8.2 Main reason for choosing preferred ultimate country of destination of non-migrants and return migrants intending to migrate by major area, per sendingcountry (%)
N -Turkey: 430 EU, 103 non-EU, none missing; Morocco: 158, 5, 7, 0;Egypt: 81, 462, 0, 0; Ghana: 296, 552, 16, 43; Senegal: 543, 480, 0, 0).
Turkey
0
25
50
75
100
Economicreasons
Family reasons Other reasons
Morocco
0
25
50
75
100
Economicreasons
Family reasons Other reasons
Egypt
0
25
50
75
100
Economicreasons
Family reasons Other reasons
Ghana
0
25
50
75
100
Economicreasons
Family reasons Other reasons
Senegal
0
25
50
75
100
Economicreasons
Family reasons Other reasons
EU non-EU
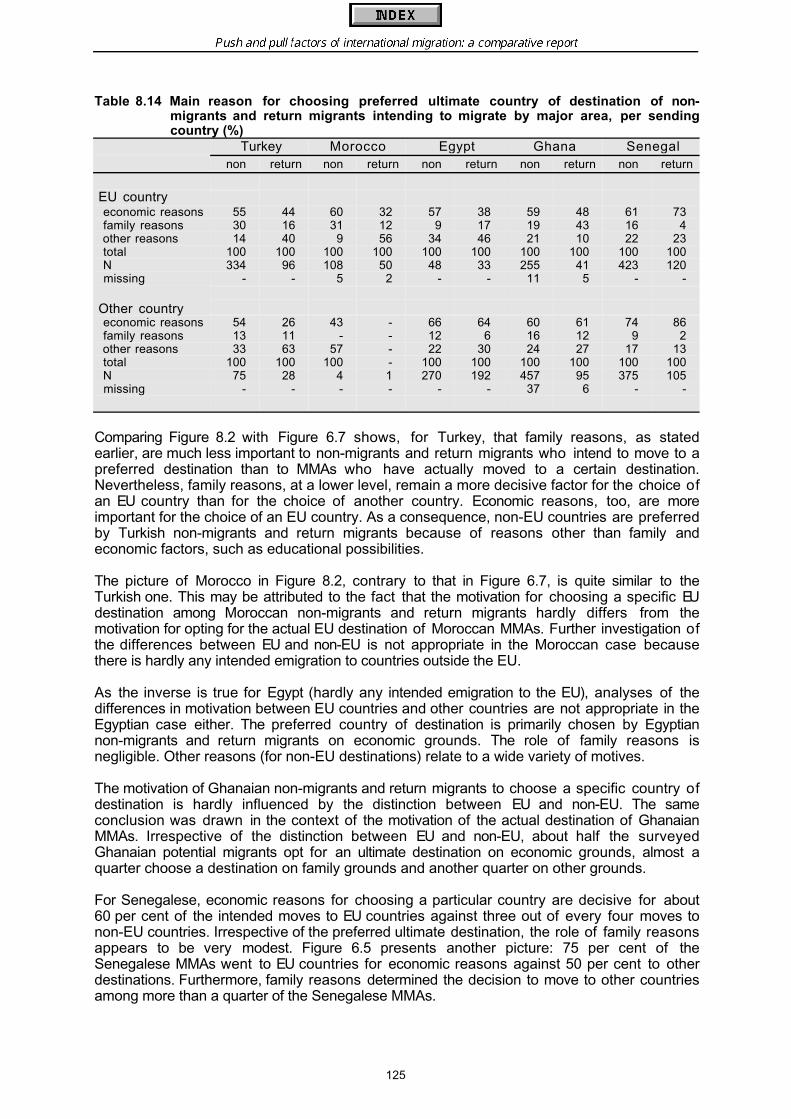
Push and pull factors of international migration: a comparative report
125
Table 8.14 Main reason for choosing preferred ultimate country of destination of non-migrants and return migrants intending to migrate by major area, per sendingcountry (%)
Turkey Morocco Egypt Ghana Senegalnon return non return non return non return non return
EU country economic reasons 55 44 60 32 57 38 59 48 61 73 family reasons 30 16 31 12 9 17 19 43 16 4 other reasons 14 40 9 56 34 46 21 10 22 23 total 100 100 100 100 100 100 100 100 100 100 N 334 96 108 50 48 33 255 41 423 120 missing - - 5 2 - - 11 5 - -
Other country economic reasons 54 26 43 - 66 64 60 61 74 86 family reasons 13 11 - - 12 6 16 12 9 2 other reasons 33 63 57 - 22 30 24 27 17 13 total 100 100 100 - 100 100 100 100 100 100 N 75 28 4 1 270 192 457 95 375 105 missing - - - - - - 37 6 - -
Comparing Figure 8.2 with Figure 6.7 shows, for Turkey, that family reasons, as statedearlier, are much less important to non-migrants and return migrants who intend to move to apreferred destination than to MMAs who have actually moved to a certain destination.Nevertheless, family reasons, at a lower level, remain a more decisive factor for the choice ofan EU country than for the choice of another country. Economic reasons, too, are moreimportant for the choice of an EU country. As a consequence, non-EU countries are preferredby Turkish non-migrants and return migrants because of reasons other than family andeconomic factors, such as educational possibilities.
The picture of Morocco in Figure 8.2, contrary to that in Figure 6.7, is quite similar to theTurkish one. This may be attributed to the fact that the motivation for choosing a specific EUdestination among Moroccan non-migrants and return migrants hardly differs from themotivation for opting for the actual EU destination of Moroccan MMAs. Further investigation ofthe differences between EU and non-EU is not appropriate in the Moroccan case becausethere is hardly any intended emigration to countries outside the EU.
As the inverse is true for Egypt (hardly any intended emigration to the EU), analyses of thedifferences in motivation between EU countries and other countries are not appropriate in theEgyptian case either. The preferred country of destination is primarily chosen by Egyptiannon-migrants and return migrants on economic grounds. The role of family reasons isnegligible. Other reasons (for non-EU destinations) relate to a wide variety of motives.
The motivation of Ghanaian non-migrants and return migrants to choose a specific country ofdestination is hardly influenced by the distinction between EU and non-EU. The sameconclusion was drawn in the context of the motivation of the actual destination of GhanaianMMAs. Irrespective of the distinction between EU and non-EU, about half the surveyedGhanaian potential migrants opt for an ultimate destination on economic grounds, almost aquarter choose a destination on family grounds and another quarter on other grounds.
For Senegalese, economic reasons for choosing a particular country are decisive for about60 per cent of the intended moves to EU countries against three out of every four moves tonon-EU countries. Irrespective of the preferred ultimate destination, the role of family reasonsappears to be very modest. Figure 6.5 presents another picture: 75 per cent of theSenegalese MMAs went to EU countries for economic reasons against 50 per cent to otherdestinations. Furthermore, family reasons determined the decision to move to other countriesamong more than a quarter of the Senegalese MMAs.

Push and pull factors of international migration: a comparative report
126
As was the case in Table 8.13, the differences in Table 8.14 between non-migrants andreturn migrants in motivating their choice of a preferred EU or non-EU destination areconsiderable. However, drawing conclusions for some categories in this respect is hardlypossible given the small numbers of respondents in the surveys (e.g. Moroccan and Turkishreturn migrants choosing a non-EU country and Egyptian return migrants who opt for an EUdestination).
Among Turkish and Moroccan return migrants who prefer an EU destination as well as amongEgyptian return migrants who prefer another destination, there is more diversity in motives(i.e. more other motives) than among the corresponding non-migrants. As stated earlier, this ispartly due to the circumstance that several of these return migrants motivate their choice bythe fact that they have ever been there before. Contrary to the situation in the aforementionedgroups, it is worth noting that economic motives for choosing an ultimate destination are moreimportant to Senegalese return migrants than to the non-migrants in this country.
Section 8.2.2 has paid attention to the current migrants in the receiving countries who intendto return to their country of origin. Their main reasons for their intended return weresummarised in Table 8.6. For the sake of comparison, the reasons for the actual return ofreturn migrants in the sending countries are presented in Table 8.15.
Looking at the reasons why current migrants in the receiving countries want to return, twocategories are important for all groups: the wish to join the family and the wish to start abusiness. Homesickness and the sense of belonging to the country of origin are alsoimportant motives among Egyptians and Ghanaians in Italy.
The actual reasons for returning to the country of origin (Table 8.15) appear to be quitedifferent from the reasons of intended return. Many returned because they were sent awayby the authorities or because their labour contract had ended. Only very few returned to starta business, because of homesickness, or the sense of belonging to the country of origin.However, family reasons remain important among Senegalese and Ghanaian return migrants,although at a lower level than among the recent migrants who intend to return. Noteworthy inthis context is the fear of war or persecution among several Egyptians who returned. Thiswas mainly due to the war in Iraq.
In sum, it might be concluded that migrants intending to return to their country of originunderestimate the risk that they are more or less forced to return and overestimate theirchances of starting a business in the country of origin. Family ties are a relevant factor in thereturn of migrants, but in practice less important than they are in the minds of those whointend to return.
8.5 Conclusions
Most people in the migrant-sending countries do not intend to migrate abroad at any time in thefuture. In so far as their intentions to stay at home are motivated by economic reasons, theyfall into two opposite categories: either they have no economic need to migrate or, for asmaller group, they lack the financial means to go abroad. In that sense, it confirms thegeneral idea that a certain threshold of wealth is required for migration to take place. Inaddition, and not surprisingly, non-mobility is strongly motivated by family ties and, for olderpeople, by their advanced age.
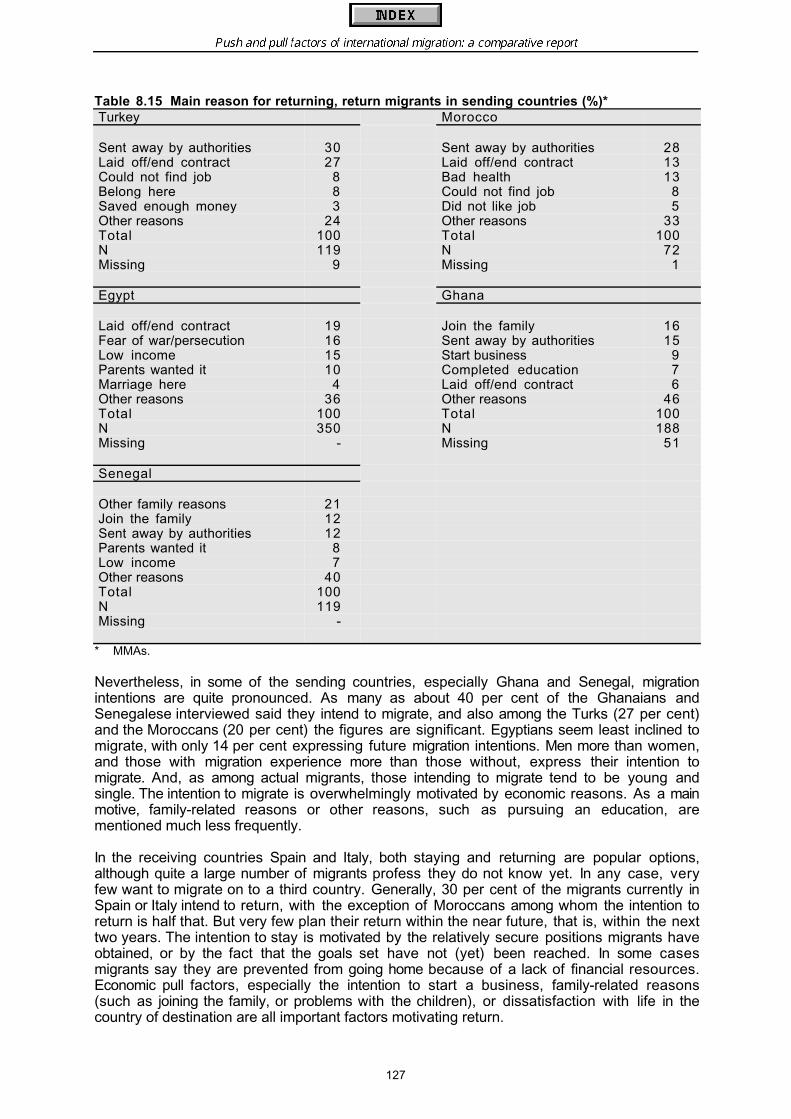
Push and pull factors of international migration: a comparative report
127
Table 8.15 Main reason for returning, return migrants in sending countries (%)*Turkey Morocco
Sent away by authorities 30 Sent away by authorities 28Laid off/end contract 27 Laid off/end contract 13Could not find job 8 Bad health 13Belong here 8 Could not find job 8Saved enough money 3 Did not like job 5Other reasons 24 Other reasons 33Total 100 Total 100N 119 N 72Missing 9 Missing 1
Egypt Ghana
Laid off/end contract 19 Join the family 16Fear of war/persecution 16 Sent away by authorities 15Low income 15 Start business 9Parents wanted it 10 Completed education 7Marriage here 4 Laid off/end contract 6Other reasons 36 Other reasons 46Total 100 Total 100N 350 N 188Missing - Missing 51
Senegal
Other family reasons 21Join the family 12Sent away by authorities 12Parents wanted it 8Low income 7Other reasons 40Total 100N 119Missing -
* MMAs.
Nevertheless, in some of the sending countries, especially Ghana and Senegal, migrationintentions are quite pronounced. As many as about 40 per cent of the Ghanaians andSenegalese interviewed said they intend to migrate, and also among the Turks (27 per cent)and the Moroccans (20 per cent) the figures are significant. Egyptians seem least inclined tomigrate, with only 14 per cent expressing future migration intentions. Men more than women,and those with migration experience more than those without, express their intention tomigrate. And, as among actual migrants, those intending to migrate tend to be young andsingle. The intention to migrate is overwhelmingly motivated by economic reasons. As a mainmotive, family-related reasons or other reasons, such as pursuing an education, arementioned much less frequently.
In the receiving countries Spain and Italy, both staying and returning are popular options,although quite a large number of migrants profess they do not know yet. In any case, veryfew want to migrate on to a third country. Generally, 30 per cent of the migrants currently inSpain or Italy intend to return, with the exception of Moroccans among whom the intention toreturn is half that. But very few plan their return within the near future, that is, within the nexttwo years. The intention to stay is motivated by the relatively secure positions migrants haveobtained, or by the fact that the goals set have not (yet) been reached. In some casesmigrants say they are prevented from going home because of a lack of financial resources.Economic pull factors, especially the intention to start a business, family-related reasons(such as joining the family, or problems with the children), or dissatisfaction with life in thecountry of destination are all important factors motivating return.
Push and pull factors of international migration: a comparative report
128
But, judging from evidence regarding the reasons for returning among those who havealready returned, migrants intending to return to the country of origin may well underestimatethe risk that they are more or less forced to return, and overestimate their chances of beingable to start a business in the country of origin. Family ties are a relevant factor influencingreturn, but in practice seem less important than they are in the minds of those who intend toreturn.
Although the intention to migrate is strong in some countries (always keeping in mind,however, that the majority of people have no intention to migrate abroad), intentions appear tobe difficult to realise. While general migration intentions vary between 14 per cent (Egypt) and42 per cent (Ghana), in fact far fewer people consider that they will actually migrate withinthe next two years. The percentage who intend to do so is generally below 5, with theexception of Ghana (14 per cent). Asked whether they have actually taken any steps toprepare for migration, the percentages go down even further. And rarely do suchpreparations include the application and/or acquisition of visas and or residence/work permits.
In general, it can be said that the ultimate preferred country of destination for non-migrantsand return migrants intending to migrate resembles the actual country of destination of recentmigrants. However, there are some remarkable exceptions to this rule. Especially the wishamong many Senegalese and Ghanaians to move to the USA is not reflected in actualpatterns. For the non-migrants among them in particular, the USA seems to be the ‘country oftheir dreams’. Furthermore, the attractiveness of Germany to Turks is worth mentioning.Despite the relatively strong representation of Germany in the distribution of actual Turkishemigration, there is room for a considerable increase in the event that the migration intentionsof Turkish non-migrants and return migrants would come true. Finally, there is a notabledifference among Egyptians in their preference for Saudi Arabia: while almost half of theinterviewed Egyptian non-migrants with migration intentions would like to leave for SaudiArabia, only a quarter of the return migrants wish to do so.
Most people prefer to move to a certain country for economic reasons but when it comes tothe actual move, family-related reasons determine the choice of country. Undoubtedly,admission policies, which generally provide more scope for family migration than for economicmigration, contribute to this.
Push and pull factors of international migration: a comparative report
9. REFERENCES
Adepoju, A. (1995), The dynamics of emigration: Sub-Saharan Africa. In: R. van der Erf and L.Heering (eds.), Causes of international migration. Luxembourg: Eurostat, pp. 187-200.
Barsotti, O. and L. Lecchini (1994), Social and economic aspects of foreign immigration toItaly. In: H. Fassmann and R. Münz (eds.), European migration in the late 20th Century.Cheltenham: Edward Elgar, pp. 81-92.
Bauer, T. and K. Zimmermann (1995), Modelling international migration: economic andeconometric issues. In: R. van der Erf and L. Heering (eds.), Causes of internationalmigration. Luxembourg: Eurostat, pp. 95-115.
Berrada, A. (1993), Migration, mutation and economic development in Morocco. Paperpresented at the Conference on Migration and International Co-operation: Challenges forOECD countries, Madrid, 29-31 March.
Bilsborrow, R.E., A.S. Oberai and G. Standing (eds.) (1984), Migration surveys in low incomecountries: guidelines for survey and questionnaire design. London/Sydney: Croom Helm.
Bilsborrow, R.E., G. Hugo, A.S. Oberai and H. Zlotnik (1997), International migrationstatistics. Guidelines for improving data collection systems. Geneva: InternationalLabour Office.
Bilsborrow, R. and H. Zlotnik (1995), The systems approach and the measurement of thedeterminants of international migration. In: R. van der Erf and L. Heering (eds.), Causes ofinternational migration. Luxembourg: Eurostat, pp. 61-76.
Blangiardo, G. (1993). Una nuova metodologia di campionamento per le indagini sulla presenzastraniera, In: L. Di Comite and M. De Candia (eds.), I fenomeni migratori nel bacinomediterraneo. Bari: Cacucci.
Bocquier, P. and S. Traoré (1998), Migration and urbanization in West Africa: methodologicalissues in data collection and inference. In: R.E. Bilsborrow (ed.), Migration, urbanization,and development: new directions and issue. New York: UNFPA, pp. 249-273.
Böcker, A. (1994), Turkse migranten en sociale zekerheid: van onderlinge zorg naaroverheidszorg? Amsterdam: Amsterdam University Press.
Böcker, A. (1995), Migration networks: Turkish migration to Western Europe. In: R. van der Erfand L. Heering (eds.), Causes of international migration, Luxembourg: Eurostat,pp. 151-171.
Boyd, M. (1989), Family and personal networks in international migration: recent developmentsand new agendas. In: International Migration Review, vol. 23, no. 3, pp. 638-670.
Burda, M.C. (1993), The determinants of East-West German migration: some first results. In:European Economic Review, vol. 37, no. 2-3, pp. 452-461.
Push and pull factors of international migration: a comparative report
Cariño, B.V., J.T. Fawcett, R.W. Gardner and F. Arnold (1990), The new Filipino immigrantsto the United States: increasing diversity and change. Honolulu, Hawaii: East-WestCenter. Papers of the East-West Population Institute, no. 115.
Centre d’Etudes et de Recherche sur la Population et le Développement (CERPOD) (1995),Migrations et urbanisations en l’Afrique de l’ouest: résultats préliminaires. Bamako,Mali.
Choldin, H.M. (1973), Kinship networks in migration process. In: International MigrationReview, vol. 7, no.2, pp. 163-176.
Condé, J., P.S. Diagne and N. Ouaidou (1986), Les migrations internationales sud-nord. Uneétude de cas: les migrants maliens, mauritaniens et sénégalais de la vallée du fleuveSénégal, en France. Paris: OECD.
Council of Europe (1998), Recent demographic developments in Europe, 1998. Strasbourg.
De Jong, G.F. and R.W. Gardner (1981), Motivations for migration: an assessment and avalue-expectancy research model. In: G.F. De Jong and R.W. Gardner (eds.), Migrationdecision making. Multidisciplinary approaches to microlevel studies in developed anddeveloping countries. New York: Pergamon Press, pp. 13-58.
Direction de la Prévision et de la Statistique (1998), Enquête sur les Migrations etl’Urbanisation au Sénégal (EMUS), 1992-1993. Rapport national descriptif. Dakar.
Eelens, F., T. Schampers and J.D. Speckmann (eds.) (1992), Labour migration to the MiddleEast. From Sri Lanka to the Gulf. London: Kegan Paul International Ltd.
Erf, R. van der and L. Heering (eds.) (1995), Causes of international migration. Luxembourg:Eurostat.
Esveldt, I., I. Kulu-Glasgow, J. Schoorl and H. Van Solinge (1995), Migratiemotieven,migratienetwerken en partnerkeuze van Turken en Marokkanen in Nederland. TheHague: Netherlands Interdisciplinary Demographic Institute (NIDI).
European Commission (1996), Comparative research on international migration andinternational migration policy. Migration from the Maghreb and Turkey to the EuropeanUnion, and from Mexico, Guatemala and El Salvador to the United States. Luxembourg:European Communities.
Fadayomi, T.O. (1996), Brain drain and brain gain in Africa: dimensions and consequences. In:A. Adepoju and T. Hammar (eds.), International migration in and from Africa:dimensions, challenges and prospects. Dakar/Stockholm: Population, Human Resourcesand Development in Africa/Centre for Research in International Migration and EthnicRelations, pp. 143-159.
Farrag, M. (1996), Emigration dynamics in Egypt. Paper presented at the IOM/UNFPA Workshopon Emigration in the Arab Region, Geneva, 7-8 October.
Fassmann, H. and R. Münz (1992), Patterns and trends of international migration in WesternEurope. In: Population and Development Review, vol.18, no. 3, pp. 457-480.
Fawcett, J.T., and F. Arnold (1987a), Explaining Diversity: Asian and Pacific ImmigrationSystems. In: J.T. Fawcett en B.V. Cariño (eds.), Pacific Bridges. The new immigrationfrom Asia and the Pacific Islands. New York: Center for Migration Studies, pp. 453-473.
Push and pull factors of international migration: a comparative report
Fawcett, J.T. and F. Arnold (1987b), The role of surveys in the study of internationalmigration: an appraisal. In: International Migration Review, vol. 21, no. 4, pp. 1523-1540.
Fawcett, J.T. (1989), Networks, linkages and migration systems. In: International MigrationReview, vol. 23, no. 3, pp. 671-680.
Faw cett, J.T. and R.W. Gardner (1994), Asian immigrant entrepreneurs and non-entrepreneurs:a comparative study of recent Korean and Filipino immigrants. In: Population andEnvironment, vol. 15, no. 3, pp. 211-238.
Findley, S., D. Ouedraogo and N. Ouaidou (1988), From seasonal migration to internationalmigration: an analysis of the factors affecting the choices made by families of the Senegalriver valley. In: African Population Conference, Dakar 1988. Liège, IUSSP. vol. 2,pp. 4.3.39-53.
Ghatak, S. and P. Levine (1993), Migration theory and evidence: an assessment. London:Centre for Economic Policy Research. Discussion paper no. 769.
Ghosh, B. (1992), Migration, trade and international economic cooperation. Do the interlinkageswork? In: International Migration, vol. 30, no. 3/4, pp. 377-398.
Gonzalvez-Pérez (1990), El reciente incremento de la población extranjera en España y suincidencia laboral. In: Investigaciones Geográficas, 8, pp. 7-36.
Goodman, J.L. (1981), Information, uncertainty and the microeconomic model of migrationdecision making. In: G.F. De Jong and R.W. Gardner (eds.), Migration Decision Making:multidisciplinary approaches to microlevel studies in developed and developingcountries. New York: Pergamon Press, pp. 130-148.
Gould P.R. and R. White (1974), Mental maps. New York: Penguin.
Gurak, D.T. and M.M. Kritz (1987), Los patrones de migración de los Dominicanos y de losColombianos en la ciudad de New York: el rol de las redes de parentesco. In: J. delCastillo and C. Mitchell (eds.), La inmigración dominicana en los Estados Unidos. SantaDomingo: Universidad APEC, pp. 153-184.
Gurak, D.T. and F. Caces (1992), Migration networks and the shaping of migration systems. In:M.M. Kritz, L.L. Lim and H. Zlotnik (eds.), International migration systems. A globalapproach. New York: Oxford University Press, pp. 150-176.
Hammar, T. (1995), Development and immobility: why have not many more emigrants left theSouth? In: R. van der Erf and L. Heering (eds.), Causes of international migration.Luxembourg: Eurostat, pp. 173-186.
Hammar, T., G. Brochmann, K. Tamas and T. Faist (eds.) (1997), International migration,immobility and development. Multidisciplinary perspectives. Oxford/New York: Berg.
Harbison, S.F. (1981), Family structure and family strategy in migration decision-making. In: G.F.De Jong and R.W. Gardner (eds.), Migration decision-making: multidisciplinaryapproaches to microlevel studies in developed and developing countries. New York:Pergamon Policy Studies, pp. 225-251.
Harris, J.R. and M.P. Todaro (1970), Migration, unemployment, and development: a tw o-sectoranalysis. In: American Economic Review, vol. 60, no. 1, pp. 126-142.

Push and pull factors of international migration: a comparative report
Hoggart, K. and R. Lardiés (1996), Immigration into Spain from the European Union.Contributed paper to the Mediterranean Conference on Population, Migration andDevelopment, Palma de Mallorca, 15-17 October.
Hugo, G.J. (1981), Village-community ties, village norms, and ethnic and social networks: areview of evidence from the Third World. In: G.F. De Jong and R.W. Gardner (eds.),Migration Decision Making: multidisciplinary approaches to microlevel studies indeveloped and developing countries. New York: Pergamon Press, pp. 186-224.
Hugo, G.J. (1987), Demographic and welfare implications of urbanization: direct and indirecteffects on sending and receiving areas. In: R.J. Fuchs, G.W. Jones and E.M. Pernia(eds.), Urbanization and Urban Policies in Pacific Asia. Boulder, Colorado: WestviewPress, pp. 136-165.
Içduygu, A. (1996), Migration from Turkey to Western Europe: recent trends and prospects.Paper presented at the Mediterranean Conference on Population, Migration andDevelopment, Palma de Mallorca, 15-17 October.
International Organization for Migration (IOM) (1996), Transit migration in Turkey. Budapest.Migration Information Programme.
Jazwinska, E. and M. Okolski (eds.) (1996), Causes and consequences of migration inCentral and Eastern Europe. Warsaw: Migration Research Centre, Institute for SocialStudies University of Warsaw.
Jazwinska, E. (1996), Methods, approaches, research techniques. In: E. Jazwinska andM. Okolski (eds.), Causes and consequences of migration in Central and EasternEurope. Warsaw: Migration Research Centre, Institute for Social Studies University ofWarsaw, pp. 51-67.
Katz, E. and O. Stark (1986), Labor migration and risk aversion in less developed countries. In:Journal of Labor Economics, vol. 4, no. 1, pp. 131-149.
Keilman, N.W. (1990), Uncertainty in national population forecasting: issues, backgrounds,analyses, recommendations. Amsterdam/Lisse: Sw ets and Zeitlinger.
Koray, S. (1996), Dynamics of demography and development in Turkey: Implications to thepotential for migration to Europe. Paper presented at the Mediterranean Conference onPopulation, Migration and Development, Palma de Mallorca, 15-17 October.
Kritz, M.M., C.B. Keely and S.M. Tomasi (eds.) (1981), Global trends in migration: theory andresearch on international population movements. New York: Center for Migration Studies.
Kritz, M.M. and F. Caces (1992), Science and technology transfers and migration f lows. In: M.M.Kritz, M.M., L.L. Lim and H. Zlotnik (eds.), International migration systems. A globalapproach. New York: Oxford University Press, pp. 221-242.
Kritz, M.M., L.L. Lim and H. Zlotnik (eds.) (1992), International migration systems. A globalapproach. New York: Oxford University Press.
Kulu-Glasgow , I. (1992), Motives and social networks of international migration within thecontext of the systems approach: a literature review. The Hague: NetherlandsInterdisciplinary Demographic Institute (NIDI), Working paper no. 3.
Kunz, E.F. (1981), Exile and resettlement: refugee theory. In: International Migration Review, vol.15, no.1, pp. 42-51.
Push and pull factors of international migration: a comparative report
Lim, L.L. (1998), The processes generating the migration of women. Paper prepared for theUnited Nations Technical Symposium on International Migration and Development, TheHague, 29 June-3 July.
Lomnitz L. (1976), An ecological model for migration studies. In: D. Guillet (ed.), Newapproaches to the study of migration. Houston: Rice University, pp. 131-146.
Martin, P.L. (1991), The unfinished story: Turkish labour migration to Western Europe. Geneva:International Labour Office.
Massey, D.S. (1987), The ethnosurvey in theory and practice. In: International MigrationReview, vol. 21, no. 4, pp. 1498-1522.
Massey, D., R. Alarcón, J. Durand and H. González (1987), Return to Aztlán: the socialprocess of international migration from Western Mexico. Berkeley: University ofCalifornia Press.
Massey, D.S. (1990), Social structure, household strategies, and the cumulative causation ofmigration. In: Population Index, vol. 56, no.1, pp. 3-26.
Massey, D., J. Arango, G. Hugo, A. Kouaouci, A. Pellegrino and J.E. Taylor (1993), Theories ofinternational migration: a review and appraisal. In: Population and Development Review,vol. 19, no. 3, pp. 431-466.
Ministero dell’Interno (1998), Relazione sulla presenza straniera in Italia e sulle situazioni diirregolarità (Report on foreign immigration in Italy and on the irregular situations). Rome.
Moulier Boutang, Y. and D. Papademetriou (1994), Typology, evolution and performance of mainmigration systems. In: Migration and development. New partnerships for co-operation. Paris:OECD, pp. 19-35.
Mullan, B. and T. Frejka (1995), The UN/ECE international migration surveys in Lithuania,Poland, and Ukraine: methodological issues. In: R. van der Erf and L. Heering (eds.),Causes of international migration. Luxembourg: Eurostat, pp. 223-253.
Organisation for Economic Co-operation and Development (OECD) (1997), Economic Outlook,June 1997. Paris.
Organisation for Economic Co-operation and Development (OECD), 1998, EmploymentOutlook, June 1998. Paris.
Özsoy, A.E., I. Koç and A. Toros (1992), Türkiye’nin etnik yapısının ana dil sorularına göreanalizi (Ethnic structure in Turkey as implied by the analysis of mother tongue data). In:The Turkish Journal of Population Studies, vol. 14, pp. 101-114.
Park, I.H., J.T. Fawcett, F. Arnold and R.W. Gardner (1990), Korean immigrants and U.S.immigration policy: a predeparture perspective. Honolulu, Hawaii: East-West Center.Papers of the East-West Population Institute, no. 114.
Penninx, R., J.J. Schoorl and C.S. van Praag (1993), The impact of international migration on thereceiving countries: the case of the Netherlands. Amsterdam/Lisse: Sw ets and Zeitlinger.

Push and pull factors of international migration: a comparative report
Piore, M.J. (1979), Birds of passage: migrant labor in industrial societies. Cambridge: CambridgeUniversity Press.
Pohjola, A. (1991), Social networks - Help or hindrance to the migrant? In: InternationalMigration, vol. 29, no. 3, pp. 435-444.
Portes, A. and J. Böröcz (1989), Contemporary immigration: theoretical perspectives on itsdeterminants and modes of incorporation. In: International Migration Review, vol. 23, no.3, pp. 606-630.
Ranis, G. and J.C.H. Fei (1961), A theory of economic development. In: American EconomicReview, vol. 51, pp. 533-565.
Reyneri, E. (1998a), Addressing the employment of migrants in an irregular situation: thecase of Italy. Paper presented at the Technical Symposium on International Migration andDevelopment, The Hague, Netherlands, 29 June-3July.
Reyneri, E. (1998b), Unemployment patterns in the European countries: a comparative view.(draft).
Richmond, A.H. (1993), Reactive migration: sociological perspectives on refugee movements. In:Journal of Refugee Studies, vol. 6, no. 1, pp. 7-24.
Ritchey, P.N. (1976), Explanations of migration. In: Annual Review of Sociology, vol.2, pp. 363-404.
Santo Tomas, P. (1998), Enhancing the capabilities of emigration countries to protect menand women destined for low-skilled employment: the case of the Philippines. Paperprepared for the United Nations Technical Symposium on International Migration andDevelopment, The Hague, 29 June-3 July 1998.
Sarrible, G. (1996), Migratory and total population increase: the case of Spain in theMediterranean. Contributed paper to the Mediterranean Conference on Population,Migration and Development, Palma de Mallorca, 15-17 October.
Schoorl, J. (1995), Determinants of international migration: theoretical approaches andimplications for survey research. In: R. van der Erf and L. Heering (eds.), Causes ofinternational migration. Luxembourg: Eurostat, pp. 3-14.
Schoorl, J.J. (1998), A multi-country approach to study the determinants of migration. Paperprepared for the United Nations Technical Symposium on International Migration andDevelopment, The Hague, 29 June-3 July 1998.
Schoorl, J.J., B.J. de Bruijn, E.J. Kuiper and L. Heering (1996), Migration from African andeastern Mediterranean countries to western Europe. Paper presented at theMediterranean Conference on Population, Migration and Development, Palma de Mallorca,15-17 October.
Schoorl, J.J. and M.E. Idema (1997), Migration Networks in Europe. Paper prepared for theConference on International Migration at Century’s End: Trends and Issues. Barcelona,May 7-10.
Schwartz, A. (1973), Interpreting the effect of distance on migration. In: Journal of PoliticalEconomy, vol. 81 pp.1153-1169.
Push and pull factors of international migration: a comparative report
Sjaastad, L.A. (1962), The costs and returns of human migration. In: Journal of PoliticalEconomy, vol. 70, no. 5, part 2, pp. 80-93.
Stark, O. (1984), Migration decision making: a review article. In: Journal of DevelopmentEconomics, vol. 14, pp. 251-259.
Stark, O. (1991), The migration of labor. Cambridge: Basil Blackw ell.
Suhrke, A. (1995), Analysing the causes of contemporary refugee flows. In: R. van der Erfand L. Heering (eds), Causes of international migration. Luxembourg: Eurostat, pp. 201-221.
Sycip, L.M. and J.T. Fawcett (1988), Expectations, family networks, and emigration: a studyof Filipino decision-making. Honolulu: East-West Population Institute. Report no. 238.
Taylor, J.E. (1986), Differential migration, networks, information and risk. In: O. Stark (ed.),Research in human capital and Development. Volume 4. Greenw ich, Conn.: JAI Press, pp.147-171.
Taylor, J.E. (1992), Remittances and economic inequality reconsidered: direct, indirect, andintertemporal effects. In: Journal of Policy Modeling, vol. 14, pp. 187-208.
Todaro, M. (1976), Internal migration in developing countries. Geneva: International LabourOffice.
Todaro, M.P. (1989), Economic development in the Third World. New York: LongmanPublishers.
Turkish Central Bank (1986) Istanbul Chamber of Commerce, Economic Report. Publication no.1991-28. Ankara.
Twum-Baah, K.A., J.S. Nabila and A.F. Aryee (eds.) (1995), Migration research study inGhana. Volume 2: International migration. Accra: Ghana Statistical Service.
United Nations (1993), Standard Recode Files and Standard Country Reports. Geneva.
United Nations (1997), International migration and development. New York.
United Nations (1998), Demographic Yearbook 1996. New York.
United States Department of State (1997), Lebanon Country Report on Human RightsPractices for 1996. Washington DC.
University of Ghana (1999), Population Impact Project (PIP), Legon, Department ofGeography and Resource Development.
Wilpert C. (1992), The use of social networks in Turkish migration to Germany. In:M.M. Kritz, L.L. Lim and H. Zlotnik (eds.), International migration systems. A globalapproach. New York: Oxford University Press, pp. 177-189.
World Bank (1998), World Development Report 1998/99. New York: Oxford University Press.

Push and pull factors of international migration: a comparative report
World Resources Institute, The United Nations Environment Programme, The United NationsDevelopment Programme, and the World Bank (1998), World Resources 1998-99. NewYork: Oxford University Press.
Zlotnik, H. (1992), Empirical identification of international migration systems. In: M.M. Kritz, L.L.Lim and H. Zlotnik (eds.), International migration systems. A global approach. New York:Oxford University Press, pp. 19-40.
Zolberg, A.R., A. Suhrke and S. Aguayo (1989), Escape from violence: conflict and the refugeecrisis in the developing world. New York, Oxford University Press.
Internet sites
Buagbe, I.A. (1999), http://ili2.literacy.upenn.edu/sltp/country/ghana.htm.
CIA Factbook (1999), www.odci.gov/cia/publications/factbook.
Ghana homepage (1999), http://www.ghanaweb.com.
OECD (1999), http://www.oecd.org/std/gdpperca.htm.
Senegal homepage (1999), http://www.republicofsenegal.com/area&pop.htm.
Push and pull factors of international migration: a comparative report
10. APPENDICES
10.1 Country-specific sample designs and their implementation
10.1.1 IntroductionThe main objective of the IMS project is to study the determinants and consequences ofinternational migration in a number of countries. As fully-fledged nationally representativesurveys are too costly, these issues are often studied in particular regions within countries.
To sample elements, such as households and individuals with or without an internationalmigration experience, a sampling frame must be available to sample from. A sampling framemust contain the elements of interest to the study. In the case of studies that investigateprocesses underlying international migration, such sampling frames must contain elements,say households, with one or more members that have an international migration experienceand households without such members. Below, elements that make up a sampling frame arecalled population elements. Population elements that are selected by sampling procedures andmake up the sample are called sample elements.
If an appropriate sampling frame is available, sampling procedures may require the selectionof elements in various steps or stages, which may include: (1) the stratification of elementsinto relatively homogenous groups according to some characteristic, such as geographicallocation or migration status of the household; (2) the sampling of elements in multiple stages,such as the sampling of smaller geographical or administrative areas within larger ones, andthen the sampling of elements within these smaller areas.
Depending on the nature of the study, sampling procedures can be designed that ensure thatall elements that are drawn from the sampling frame into the sample have the same chance ofbeing selected, called a self-weighting sample. Conversely, sampling procedures could begeared to draw a sufficient number of members of a particular interest group into the sampleby giving some members a greater chance of being selected. Often, such ‘disproportionate’sampling is used for the investigation of elements in a population that have a ‘rare’characteristic. Such elements are ‘oversampled’ in order to attain a sufficient number of casesfor statistical analysis.
There are various sampling strategies to sample elements with ‘rare’ characteristics, such ashouseholds with an international migration experience. The ‘model’ approach adopted for theinternational migration surveys was to identify particular regions in a country whereconcentrations of international migrants are expected, using key informants and various datasources (e.g. census data); then to classify spatial units within these regions according to theprevalence of households with an international migration experience, and stratify these unitsaccording to the magnitude of prevalence rates; subsequently, to sample spatial units fromeach stratum, giving higher selection probabilities to units with higher migration prevalencerate; then to screen in the sample of spatial units all households to determine their internationalmigration status, and stratify households according to migration status (e.g. recent migrant,non-recent migrant, non-migrant); and lastly, to oversample households of interest to thestudy by allocating a disproportionately large share of total sample size to the stratum ofrecent migrant households (see Bilsborrow et al., 1997). As we shall see below, thecountries that participated in the study accommodated the model design to deal withconstraints posed by the availability of adequate information for sample design and byfieldwork budgets and logistic management.
Push and pull factors of international migration: a comparative report
When data obtained from oversampled elements are analysed, applying sample-designweights must compensate for their disproportionately high selection probabilities. The weightfor each element is the inverse of its selection probability. Analysis of information fromelements sampled with different selection probabilities must take into account such weights. In‘weighted analysis’ the relative importance of information on elements that are over- andundersampled is scaled to the relative frequency of the elements in the population from whichthese elements were sampled. Weights can be normalised so that the sum of the weightsequals the total number of elements in the sample. The mean value of these normalisedweights is one. Elements that are oversampled will have weights that are less than one, andelements that are undersampled will have weights that are in excess of one. For instance, afinal weight of 0.50 ‘attached’ to a household means that all information from this household iscounted 0.50 times in weighted statistical analyses.
The values of weights are computed from the data collected on the population from which thesamples were drawn. In general, a sample design weight can be defined as the ratiobetween the ‘what-if’ or PPES-selection probability divided by the actual selection probability:
P(x)PPES
P(x)actual
where P(x)actual is the actual selection probability of a household and those of all higherorder sampling units under which the household is subsumed (e.g. census block, district,region). The values that selection probabilities take depend on the manner in which the targetsample size is allocated to strata, the fraction of PSU’s sampled within strata, and the fractionof households sampled within PSU’s. P(x)PPES is the ‘what-if’ selection probability, or PPES-selection probability (Probability Proportional to Estimated Size) of a household and those ofall higher order sampling units under which the household is subsumed. The values of PPES-selection probabilities are computed from estimates of population sizes of regions, districts,census blocks and strata. In a self-weighting multistage stratified PPES sample design, theselection probabilities associated with multiple stages and strata generate overall or finalselection probabilities for households that have identical values.19
10.1.2 Sending countriesIn Turkey, the target sample size was set at 1,800 households, to be equally divided over thefour regions so that in each region 450 households would be selected. Contrary to manycountries, data are available on the international migration experience of households and onthe economic development at the district level. A census question in the 1990 Census asked,in each household, whether any household member was living in another country on thecensus day. Furthermore, a recent nation-wide socio-economic survey facilitated theclassification and ranking of all 850 districts according to their level of economic development.In this way, four regions with distinct economic and migration history characteristics werecomposed by purposively selecting a number of districts, which are spatially non-contiguous,to form a particular region. The regions are situated south, east and south-west of Ankaraand in the south-east of Turkey. The aforementioned prior information appeared to besufficiently detailed to add an urban-rural dimension to the sample design. Each district wassplit into an urban and a rural sub-district. Within each region, all sub-districts were sortedaccording to a measure of migration intensity, the sub-districts ‘P-value’, that is, the proportionof households in the sub-district with at least one international migrant. Two strata wereformed, according to these P-values: a stratum with sub-districts with high P-values and astratum with sub-districts with low P-values.
19 For instance, a multistage stratified sample design may generate sets of region-specific weights, district-
specific weights, census block-specific weights, and household migration-status category weights. Theseweights are computed with the aid of the aforementioned formula. By multiplying a particular combinationof such weights the overall sample design weight for a household is computed. In addition, a non-response weight is added to the multiplication to account for household non-response which differs acrossmigration status categories, census blocks, districts and regions.
Push and pull factors of international migration: a comparative report
The selection of sub-districts from these two strata went as follows. First, based oninformation on interviewer workload from the pilot survey and planned duration of the mainsurvey, the expected workload that a team of interviewers could handle per day wasestimated at 12 households. Thus, 450/12=37.5 (rounded to 37) batches of households had tobe interviewed in each region. Second, these 37 batches of 12 households each were thendistributed over the sub-districts in the two strata in proportion to the magnitude of the sub-district’s P-values, according to the systematic selection method.20 This method ensures thatmore batches of households are allocated to sub-districts with high P-values than to sub-districts with low P-values. In the end, zero batches of households were allocated to certainsub-districts whereas one or more batches were allocated to other sub-districts. Althoughsampling procedures in urban and rural sub-districts differ, the general approach was tosample and interview a maximum of ten ‘recent migrant households’ and at least two ‘othertypes of households’ from each batch of a hundred screened and categorised households.Third, in the selected sub-districts screening, sampling and interviewing was combined. Thescreening took place in batches of a hundred households. The number of batches of ahundred households to be screened in a particular sub-district equals the number of batchesof 12 households that were allocated to a selected sub-district. At the time of the screeningsurvey, every household was asked a number of questions that made it possible to minimallyassign the household the status of ‘recent migrant household’ or ‘other type of household’.
In the end, some 12,838 households were screened and categorised and 1,773 householdswere actually sampled, 1,564 of which were successfully interviewed (656 recent migranthouseholds, 173 non-recent migrant households, and 735 non-migrant households). TheTurkish survey was the first to be held: the fieldwork was carried out from July to September1996. The survey results are representative for the populations in the four regions.
In Egypt, in 1995, CAPMAS projected 1986 Census information to develop a nationallyrepresentative and self-weighting ‘Master Sample’ for the year 1996. This ‘Master Sample’served to create a sampling frame for the screening survey of international migrants. Theresults of the screening survey would subsequently create the sampling frame for theinternational migration survey. With the exception of 5 frontier areas, all governorates inEgypt, including Cairo and Alexandria, were grouped into four regions characterised bydifferent levels of economic development and international migration experience. Thus, amultistage, stratified, self-weighting, Master Sample of ‘areas’ was designed in which 71thousand households were sampled within the 21 governorates (40,520 urban and 30,480rural households). An urban ‘area’ consists of about two thousand households and a rural‘area’ of about one thousand households. An ‘area’ is a spatial unit and comprises ‘segments’.An urban ‘segment’ consists of 200 households and a rural ‘segment’ consists of 100households. Across regions and governorates, all ‘areas’ were grouped into an urban and arural stratum. Independent sampling of ‘areas’ (i.e. Primary Sampling Units, PSU) took place inthe two strata using systematic selection. Within the selected ‘areas’, ‘segments’ (i.e.Secondary Sampling Units, SSU) were randomly sampled and, ultimately, within sampled‘segments’, households were randomly sampled. The sampling procedures ensured that allhouseholds have the same chance of being selected, making the Master Sample design ‘self-weighting’.
20 Sampling of ‘every kth element’.

Push and pull factors of international migration: a comparative report
The next step was to estimate how many households would need to be sampled andscreened from this Master Sample of 71 thousand households to ensure that a predeterminednumber of recent migrant household interviews could be generated. The predetermined totaltarget sample size was 1,600 households, composed of 600 recent current, 400 recent returnmigrant and 600 non-recent/non-migrant households. These numbers were increased tocompensate for an anticipated non-response rate of about 25 per cent.21 Based oninformation from previous migration studies it was estimated that about ten per cent of thehouseholds in the four regions would be recent migrant households. Therefore, it wasdecided to subsample and screen about 30 thousand households from the Master Sample toensure that, after screening, about three thousand recent migrant households would be in thesubsample. This number was considered sufficient for the sampling of the predetermined onethousand recent current and recent return migrant households.
The sampling strategies used for the Master Sample and the screening survey ensured thathalf of all Egyptian governorates, including Cairo and Alexandria, and all four regions wouldbe represented in the sample of ‘areas’ and ‘segments’. After the international migration statusof these 30 thousand households was determined, households were grouped by region intothree international migration status strata (i.e. recent current, recent return and non-migrant/non-recent migrant households). The total sample size was allocated to the fourregions in about equal numbers and to the different international migration status strata in away that ensured that the sample would contain the predetermined number of householdsfrom each migration status group. Systematic selection was used to sample householdswithin the four regions and three migration status strata.
In conclusion, in Egypt, the sampling, screening and stratification of 30 thousand householdsfrom a nation-wide Master Sample of ‘areas’ and ‘segments’ containing 71 thousandhouseholds, facilitated the sampling of a target sample of 2,588 households from four regionsand from three ‘household migration status’ strata. A total of 1,943 households weresuccessfully contacted and interviewed, 604 of which are ‘recent-current’ migrant, 546‘recent-return’ migrant and 793 ‘non-migrant/non-recent migrant’ households. The fieldworktook place in the period April-June 1997.
In Morocco, the traditional emigration areas are the Rif and the Sous, and more recently alsocentral Morocco, the Mid-Atlas and Jebala regions. Suitable sampling frames were absent butwith information from previous migration studies and expert knowledge, the Moroccan teamidentified five out of the 49 provinces for which it is thought that international migration is orhas become important. In addition to differences in levels of economic development, these fiveprovinces differ with respect to the orientation of emigrants to countries of destination. In thenorth, bordering the Mediterranean Sea, the province of Nador was selected because of thehigh and established level of emigration, in particular to the Netherlands and Germany. In thesouth, bordering the Atlantic Ocean and south of Agadir, Tiznit was selected as it is the mainplace for emigration of Moroccans to France. More recently, international migration has alsobecome important in the provinces of Settat (near the Atlantic Coast and Casablanca),Khenifra (in the mountainous and dry Centre South region) and Larach (Atlantic coast in thenorth, south of Tanger). The sample design described below generates data representative atthe level of provinces for these five provinces.
21 For the purpose of a case study, an additional 100 households were selected in a purposive manner in
one particular area to study international migration to Italy.
Push and pull factors of international migration: a comparative report
From secondary data it is estimated that about 3.5 per cent of urban households and 2.5 percent of rural households have one or more members with an international migrationexperience. From this prior knowledge, the target number of households to be sampled inurban and rural areas was estimated at 1,130 households and 1,110 households,respectively, including a compensation of 5-10 per cent for non-response. A stratified,multistage sample design with disproportionate allocation in the last sampling stage wasdeveloped.
All ’villes’ (towns) and ‘communes rurales’ (rural municipalities) in the five provinces weregrouped into an urban or rural stratum. Within strata, the units were grouped according toprovince and a number of socio-economic, environmental and international migration historycriteria. Using 1995 census data, within the urban stratum 11 out of 47 ‘villes’ were sampledwith selection probabilities in proportion to the estimated number of households in the ‘villes’. Inthe same manner, in the rural stratum, 15 out of 117 ‘communes rurales’ were sampled. Thesampling strategies in the two strata were such that in each province two ‘villes’ and two tofour ‘communes rurales’ were sampled. A second sampling stage was introduced by therandom sampling of ‘quartiers’ within the selected ‘villes’ and by the random sampling of‘douars’ within the selected ‘communes rurales’. A total of 23 ‘quartiers’ and 26 ‘douars’ wereeventually selected to carry out the fieldwork and 4,512 households were screened todetermine their international migration status. After screening, all households were classifiedinto five migration status strata in which all recent migrant, non-recent current migrant, non-recent return migrant, mixed22 and non-migrant households were grouped. The urban andrural target sample was distributed over the strata by allocating a disproportionately largeshare of the target sample to the stratum of recent migrant households.
As compared to the other sending countries, additional selection criteria were introduced todetermine who in the household was eligible for interviewing. This was done because of arelatively stronger sensitivity on the part of respondents than elsewhere to particularmigration questions. Part of the sampled households was interviewed exhaustively, that is, alladult household members were interviewed (the same approach as in all other countries),while a larger part of the sampled households was interviewed only partially to reduceinterviewing time. Partial interviewing implied that, in migrant households, only migrants (and inSenegal also the head of household) received an individual questionnaire, while in non-migrant households only the reference person/head of household received an individualquestionnaire. For the other adult members in these households, a limited number of questions(concerning work or economic activity, education, marital status, etc.) were added to thehousehold roster and answers were supplied by the head of household. Eventually, a total of1,953 households were successfully interviewed. Almost 50 per cent of these householdsare so-called recent current migrant households (784) or recent return migrant households(169). The fieldwork was carried out mainly from May to October 1997. The survey resultsare considered representative for the populations in the five provinces.
In Senegal, one third of the Senegalese population of 8.5 million (1996) lived in the regions ofDakar and Diourbel, the study areas for the project. These regions cover only 2.5 per cent ofthe total surface area of Senegal. In the past 25 years rural-rural and rural-urban migrationhas increased, instigated by recurrent droughts and crop failures since the 1970s. Particularlyduring the last decade, international migration to other African countries and to Europe(France, Spain, Italy) increased and the Dakar and Diourbel regions became the mostimportant focal points for international immigrants and emigrants. Of the two regions, theDakar region is economically more highly developed than the Diourbel region. In 1993, about 40per cent of the (negative) migration balance was due to emigration to other African countrieswhereas 60 per cent was accounted for by migration flows to countries outside Africa. Sincethe 1980s, a number of migration studies have been conducted in Senegal and neighbouring
22 A mixed household (ménage mixte) is a household in which more than one type of migrant is present,
such as recent and non-recent current and/or return migrants.
Push and pull factors of international migration: a comparative report
countries that provide new insights into national and regional migration flows.23 However,systematic data collection on international migration flows to Europe has not yet taken place.
To increase the probability of getting enough (recent) migrant households in the sample and toensure proper management of fieldwork, given budgetary constraints, the actual study areawas limited to a set of smaller spatial units within the two regions. Within the Dakar region,and within the ‘departements’ of Dakar and Pikine, five ‘communes’ were selected as theactual study areas. Within the Diourbel region, eight specific spatial units (called villages) inthe Touba city agglomeration were identified as the actual study areas. Thus, in the case ofSenegal, the concept of ‘region’ should be interpreted as an area consisting of a number ofpurposively selected lower level administrative areas within the Dakar region and within theTouba agglomeration. This is the level for which survey results are representative.
Suitable sampling frames for the study of households with a recent international migrationexperience are absent. The 1988 census listing of census blocs (Districts de Recensement(DR)) was chosen as a starting point to develop a suitable sampling frame for the sampling ofhouseholds for the international migration study. At that time, census blocks were relativelysmall geographical areas, created within regular administrative areas, to serve as workingareas for interviewer teams. A census block in 1988 contained about a thousand persons.Since then, much has changed and the number of persons in a large number of censusblocks has increased dramatically. These blocks were identified with the aid of local keyinformants and subdivided to create a new set of census blocks, in which each block is ofmanageable size for interviewing. This revised set of blocks was developed to represent theaforementioned ‘communes’ in Dakar/Pikine and ‘villages’ in the Touba agglomeration.
However, nothing was known about the prevalence of households with a recent internationalmigration experience in these census blocks. This issue was resolved by developing aquestionnaire for key informants working at the administrative level of the ‘quartier’ within‘communes’ and ‘villages’ in the two study areas. With the aid of the responses to thequestions, the prevalence of recent international migrant households could be determined andthe census block labelled as ‘migrant’ and ‘non-migrant’. Subsequently, in each of the tworegions, two strata could be constructed: (1) a stratum with ‘migrant census blocks’, (2) astratum with ‘non-migrant’ census blocks. Eventually, the two strata of the Dakar/Pikine studyarea contained 149 ‘migrant’ and 319 ‘non-migrant’ census blocks, respectively. The twostrata in the Touba region contained 84 ‘migrant’ and 618 ‘non-migrant’ census blocks,respectively.
A stratified, two-stage, sample design was created in which the target sample of 1971households was divided between the two study areas Dakar/Pikine (1.8 million inhabitants)and Touba (266 thousand inhabitants). Within each study area, the allocation between thetwo strata was based on the rule that 80 per cent of the households to be sampled would besampled in the stratum containing ‘migrant’ census blocks and 20 per cent in the stratum of‘non-migrant’ census blocks. The consequence of this sampling strategy is that households inthe much less populated agglomeration of Touba were oversampled, as were the householdsin the strata with ‘migrant’ census blocks. The reason for the relative over-representation ofrespondents from Touba in the survey is that this agglomeration has recently become a majorfocal point for international immigrants and emigrants.
23 Enquete sur les migrations dans la vallee du Fleuve Senegal (OECD/USED), in 1982, on migration flows
to France from Mauritania, Mali and Senegal (see e.g. Condé et al., 1986); and: Enquête Migration etUrbanisation au Senegal (EMUS), 1992, in seven countries in West Africa (Direction de la Prévision et dela Statistique, 1998).
Push and pull factors of international migration: a comparative report
Thus, in each of the four strata in the Dakar and Touba study areas, a number of censusblocks were sampled. Subsequently, each sampled census block was screened to determine,for all households, what the international migration status of the household was. Finally, afixed number of households of a particular type (recent, non-recent and non-migranthouseholds) were sampled within each of the screened census blocks. However, in practice,first an a priori decision had to be taken about the sampling of these fixed numbers ofdifferent types of households, before census blocks could be sampled from the strata. Thesefixed numbers were deduced by using existing information sources and by specifying anumber of special conditions. The 1993 Demographic and Health Survey revealed that censusblocks in Dakar and Touba consist, on average, of about 170 households. Previous migrationstudies indicate that in these blocks one can expect to find at least ten per cent migranthouseholds. To ensure that a sufficient number of (recent) migrant households would besampled in each census block, the following restrictions were introduced into the sampledesign: (1) the number of migrant households to be interviewed from a sampled census blockmust be about twice the number of non-migrant households; (2) the number of recent migranthouseholds to be sampled in a census block must be about equal to the sum of the non-migrant and non-recent migrant households to be sampled; (3) the total number of householdsto be sampled in a census block must be inflated by about ten per cent to compensate fornon-response.
On the basis of the above information and conditions, it was possible to determine the totalnumber of households to be sampled in a census block, as well as the desired composition interms of households of different type. To start with, at least 17 migrant households (10 percent of 170) can be expected in a census block and this number was chosen as the minimumnumber of migrant households to be interviewed in a census block. In fact, this number wasraised to 18 to compensate for non-response. Moreover, 18/2=9 non-migrant householdswould need to be included in the total number of households to be sampled in a census block.Consequently, the total number of households to be sampled within a census block is18+9=27 households. More specifically, it was also stated that about half of the total wouldneed to be allocated to the sampling of recent migrant households. Thus, in each sampledcensus block the target number of households to be sampled was set at 27 households,consisting of 13 recent migrant households (27/2), 5 non-recent migrant households (18-13),and 9 non-migrant households (18/2). After these deliberations the total number of censusblocks to be sampled could now be computed, being 1971/27=73. It was decided that 35census blocks would be sampled in the Dakar/Pikine study area and would be sampled from alisting of 568 census blocks (i.e. 149 ‘migrant’ census blocks and 319 ‘non-migrant’ censusblocks), whereas 38 census blocks would be sampled in the Touba agglomeration from a listconsisting of 154 census blocks (i.e. 69 ‘migrant’ census blocks and 85 ‘non-migrant’ censusblocks). Another decision was that in each study area, about 80 per cent of the blocks to besampled would be sampled from the stratum of ‘migrant’ census blocks. In each of the fourstrata, the aforementioned number of census blocks were eventually sampled and screened,and the aforementioned batch of 27 households was sampled and interviewed in eachselected census block.
A total of 13,290 households were eventually screened in the sample of 73 census blocks.Within these blocks, a total of 1,971 households were sampled and visited. From thesehouseholds, a total of 1,742 households produced completed interviews; of these, 37 percent come from recent migrant households, 30 per cent from non-recent migrant householdsand 33 per cent from non-migrant households. The fieldwork took place in the monthsNovember 1997 to February 1998. The survey results are representative for the populationsin the two regions.
Push and pull factors of international migration: a comparative report
In Ghana, with an estimated population of about 13 million people, the international migrationstudy was carried out in 17 electoral areas in the four administrative regions of Brong Ahafo,Ashanti, Eastern, and Greater Accra. These regions are located in a belt that runs west andsouth of Volta Lake to the coast of the Gulf of Guinea. With some 6.4 million inhabitants, theyare considered to be the main regions from where international migration to Europe has takenplace. Greater Accra and Ashanti are identified as regions with a high prevalence ofestablished and recent national and international migration compared with Brong Ahafo andEastern regions. For instance, it is estimated that more than 40 per cent of the residents in theGreater Accra region were born outside this region.
The 1996 voting register was used as the sample frame. Voters are registered and listed byconstituency (i.e. voting district). Depending on the region, a region consists of 22-33constituencies. Each constituency is further subdivided into electoral areas (EA). An electoralarea consists of 2.5 to 5 thousand persons aged 18 and over. Since the regions cover verylarge areas, it was decided to choose a number of electoral areas within each region as thestudy areas. Thus, in the case of Ghana, the concept of region is defined as a group of non-adjacent and purposively selected electoral areas.
In each region, electoral areas were purposively selected in two steps. Firstly, three stratawithin each region were formed to group all constituencies and electoral areas: (1) regionalcapital constituencies; (2) constituencies in other urban areas in the region; (3) constituenciesin rural areas in the region. From the first two strata, one constituency was chosen byjudgement. From the third stratum, one or two constituencies were chosen based ondiscussions with district assembly members and chiefs. Secondly, within each selectedconstituency, one electoral area was purposively chosen, leading to a sampling frame of 17electoral areas in 4 regions from which to sample households.
A screening census was carried out in each of the selected electoral areas to determine themigration status of households. Then, households were grouped into a stratum of recentcurrent migrant households, a stratum of recent return migrant households or in a stratum ofnon-migrant/non-recent migrant households. Total target sample size was set at 1,980households, including a 10 per cent compensation for anticipated non-response. The samplewas equally subdivided and allocated to the four regions. Within a region the batch of 495households was allocated to electoral areas in a manner that would meet the followingconditions: (1) at the regional level, half of the allocation of 495 households must go to therecent current - and recent return migrant household stratum, the other half to the non-migrant/non-recent migrant household stratum; (2) at the electoral area level, the sampleallocation to the substratum of recent migrant households was made dependent on whetherthe electoral area belonged to a constituency in stratum one, two or three.
Overall, in the 17 electoral areas 21,475 households were screened and classified intohousehold migration status strata. Based on data from the screening surveys in the 17electoral areas it is estimated that the reference population for which the sample results arerepresentative amounts to approximately 75 thousand persons. Subsequently, the totalsample size of 1,980 households was allocated to regions, electoral areas and migration-status strata within electoral areas. Eventually, a total of 1,576 households were successfullyinterviewed, of which 457 were recent current migrant households, 253 recent return migranthouseholds and 866 non-recent/non-migrant households, respectively. The fieldwork wascarried out in the summer of 1997 (August-September). The survey results are representativefor the populations in the four groups of electoral areas, called regions.
Push and pull factors of international migration: a comparative report
10.1.3 Receiving countriesIn Spain, Moroccan and Senegalese immigrants are the observational units for this study, buttheir numbers are small. The 1991 Census, the sampling frame for the Spanish sample design,counted 1,202 Senegalese immigrants and 35,318 Moroccan immigrants among the 40 millionresidents in Spain. At that time, these immigrants were located in 25-30 provinces of the 52provinces in Spain. It is important to note that 32 per cent of all Moroccan immigrants countedwere living in the provinces of Mellila and Ceuta. These provinces are located in North Africa,bordering Morocco and the Strait of Gibraltar. The share of Moroccan immigrants in the totalpopulation in these two provinces is 4 per cent and 25 per cent, respectively, whereas theseprovinces account for less than 0.5 per cent of the Spanish population. A further 42 per centof the Moroccan immigrants live in the provinces of Gerona, Málaga and Barcelona. TheSenegalese immigrant population is more spread out across the country, but 55 per cent wereconcentrated in five provinces only: Las Palmas, Barcelona, Valencia, Gerona and Alicante.
The initial approach was to design a nationally representative two-stage, stratified, probabilitysample design. The target was to sample six hundred households in each of the twoimmigrant groups. This number included a compensation of 20 per cent for non-response. Foreach immigrant group separately, identical sample designs and procedures were applied. Itwas decided to take census blocks as the primary sampling units (PSU). The Spanish territoryis subdivided into 31,881 census blocks, but Moroccan and Senegalese immigrants have beenrecorded in only 5,342 and 359 census blocks, respectively. The sample design aimed tosample Moroccans in 107 census blocks, located in 25 provinces, and to sample Senegaleseimmigrants in 174 census blocks, located in 30 provinces. The same sampling strategy wasadopted for each separate immigrant group. First, all census blocks containing members of theparticular immigrant group were grouped into strata according to the percentage of immigrantsof that particular immigrant group. More specifically, the percentage is defined as ‘the numberof immigrants present of a particular group in the census block as a percentage of the totalnumber of immigrants from that group in Spain’. The most efficient stratification appeared to bethe grouping of census blocks with Moroccan immigrants into five strata and those withSenegalese immigrants into four. Thus, strata differ regarding the number of census blocks,whereby the high prevalence stratum contains fewer census blocks than the lowerprevalence stratum. Second, the total target sample of households was distributed uniformlyover the strata so that, relative to the number of census blocks in the strata, more householdswere to be sampled in the higher prevalence rate strata. Third, the a priori decision was takento sample more households from census blocks in higher prevalence rate strata. For instance,for the Senegalese immigrant group, a total of 3, 6, 9 and 12 households would be sampled incensus blocks in each of the four strata, respectively. Fourth, based on the aforementioneduniform allocation of total target sample size to the strata and based on the fixed number ofhouseholds to be sampled from census blocks in different strata, the number of censusblocks to be sampled was computed and blocks were sampled from each stratum, using thesystematic selection method. Fifth, all households in the selected blocks were screened todetermine whether they were Moroccan (or Senegalese) households. In fact, ‘double’screening took place to identify: (1) dwellings with immigrants; (2) dwellings with householdswith a Main Migration Actor (MMA). After screening, the predetermined number of (MMA)households were sampled from the blocks using the systematic selection method. Thus, thesampling design entailed the disproportionate allocation of total sample size to the higherprevalence rate strata, and the over-sampling of households in blocks sampled from thehigher prevalence rate strata.
After the sample was drawn, the geographical spread of census blocks was found to be toolarge to handle, given budgetary constraints and the time frame set for the completion offieldwork. Two modifications were introduced after the selection of the sample, whichdistorted the probabilistic nature of the sample: (1) reduction of the numbers of households tobe sampled in blocks that belong to the ‘low prevalence’ stratum, whereas the numbers ofhouseholds sampled in the high prevalence rate stratum were increased; (2) the substitution,in a purposive manner, of census blocks that were once sampled with, logistically speaking,more convenient ones. The overall effect of this was that the number of census blocks forvisitation was reduced by some 15 per cent. This ‘geographical concentration’ of the sample
Push and pull factors of international migration: a comparative report
is of particular importance when analysing data of the Moroccan respondents since initiallysampled blocks, located in the provinces of Ceuta and Melilla in North Africa, were replacedby blocks located in the Málaga province. Consequently, some 42 per cent of thequestionnaire information on Moroccan respondents come from Moroccans living in theMálaga province.
But even after these modifications were implemented, the Spanish team was confronted withanother problem. The screening of many sampled census blocks did not appear to contain theexpected number, if any, of Moroccan and/or Senegalese immigrants. This is probably due tochanges in the place of residence of these immigrants between ‘1991 Census day’ and thestart of the survey in 1997. To cope with this problem and to ensure that the fieldwork wouldgenerate a sufficient number of interviews for analysis, interviewers were instructed tocontinue ‘searching’ for additional immigrants. Interviewers asked respondents in sampledhouseholds whether they knew of other immigrant households nearby or in adjacent censusblocks. If the answer was affirmative, such ‘non-sample households’ were traced andinterviewed. This approach is known as ‘snowballing’.
The fieldwork was carried out from July to November 1997. To facilitate management of theactual fieldwork, the census blocks that were selected were grouped into five fieldworkregions: Madrid, Cataluna, Levant, Andalucia and Canarias. A total of 1,113 households weresuccessfully interviewed providing detailed migration information for 596 Moroccan and 507Senegalese respondents. The consequence of the sample implementation is that surveyresults are not representative of the two immigrant groups at the national level. At the sametime it is difficult to make a firm statement about the population for which these results arerepresentative because part of the data were collected from non-sampled households. Morespecifically, three out of four interviews taken from the Moroccan respondents come fromMoroccans who live in just 3 of the 52 provinces in Spain (i.e. Málaga 42 per cent, Gerona 19per cent, Barcelona 13 per cent). Almost half of the information collected from Senegaleserespondents come from Senegalese who were interviewed in the provinces of Barcelona (16per cent), Las Palmas (15 per cent) and Valencia (14 per cent).
In Italy, the objective was to study the Egyptian and Ghanaian immigrants, with the help of asurvey that would target some 800 households per immigrant group. Immigration is a fairlyrecent phenomenon in Italy, in particular from Third World countries. Egyptian and Ghanaianimmigrants constitute the tenth and fourteenth largest immigrant populations (relative to thepopulation of immigrants from developing countries and Eastern Europe). In 1997, there were23.5 thousand Egyptian and 15.6 thousand Ghanaian documented immigrants. As in the caseof Spain, members of the study population are truly ‘rare’ elements in this population of almost60 million, and their registration is said to be poor. Moreover, the Ministry of the Interior, in1998, estimated that undocumented immigrants constitute as much as 18-27 per cent of thetotal number of legal immigrants (Ministero dell’Interno, 1998). In the absence of any propersampling frame, and the set objective to generate nationally representative survey results forthe Egyptian and Ghanaian immigrant populations, traditional sampling strategies wereconsidered inappropriate. Instead, an alternative sampling methodology was adopted(Blangiardo, 1993), known as the ‘Centre Sampling Method’ (CSM). The main features of thismethodology are: (1) the listing of all types of points-of-aggregation, that is, popular meetingplaces of immigrants from a particular country; (2) the ex-post, instead of ex-ante,determination of respondent selection probabilities with the aid of answers to a specialquestionnaire; (3) the inclusion of both legal and illegal immigrants in the sample. Theunderlying assumption of the method is that any immigrant, legal or illegal, visits at least onemajor meeting place known to be frequented by peer members of the immigrant group (seebelow).
CSM essentially entails the following. Firstly, on the basis of local key-informant information,scattered data sources and information from the pilot survey, a number of geographical areasin Italy were identified in which, according to experts, most of the Egyptian and a large part ofthe Ghanaian immigrant populations reside. Egyptians tend to concentrate in the metropolitanareas of Milan and Rome and they do not move around much. Conversely, the Ghanaian
Push and pull factors of international migration: a comparative report
immigrants are more widely dispersed across the country and tend to move around morefrequently. Guided by budget constraints and fieldwork logistics, two regions were defined,each consisting of four ‘local areas’: (1) Centre-South, consisting of the four provinces inwhich Rome, Latina, Naples and Caserta are located; (2) North, consisting of the fourprovinces in which the cities of Milan, Brescia, Bergamo and Modena are located. Theestimation is that about 77 per cent of the documented and undocumented Egyptian immigrantsand 36 per cent of the Ghanaian immigrants live in these two regions. Secondly, within eachof the provinces in the two regions, a screening took place in search of all major meetingplaces/centres that are known to be frequented by Egyptians or Ghanaian immigrants. Thescreening was subcontracted to persons who deal with these immigrants in their regular paidor voluntary jobs (e.g. Caritas). In this way, sampling frames were constructed containing the‘major’ meeting places, also called ‘aggregation points’. Examples are: mosques/places ofworship, entertainment venues, (health) care and aid institutions, telephone calling centres,public squares, informal shelter places, and population registers. Thirdly, in each ‘local area’(e.g. Milan province) a, purposively determined number of aggregation points are randomlysampled, with replacement, from these sampling frames of immigrant-specific ‘aggregationpoints’ and within the selected ones, respondents are sampled among visitors of these‘aggregation points’. Respondents that were interviewed were also visited at home if otherpersons that were eligible for interviewing lived in their households.
It is important to note that, at the time of the interview, the ex-ante selection probability of arandomly selected respondent in a particular ‘aggregation point’ cannot be known, because itis a function of: (1) the frequency of visits to that centre by all the group members (e.g.Egyptians), and of (2) the number of other ‘aggregation points’ that are being visited by therespondent. To be able to compute, ex-post, the selection probabilities of respondents and tocompute weights to compensate for differentials therein, all respondents were posed anumber of additional questions, for instance, the question ‘which of these other aggregationpoints was visited’. With the aid of the response on the additional questions, ‘attendance-to-aggregation point’ profiles were created. They were used to compute the ex-post selectionprobabilities of respondents and local-level sample design weights. In addition to this type ofweight, other weights were computed that essentially re-scale the ratios ofEgyptians/Ghanaians and males/females in the sample population to those found in the mosthighly accredited official statistical sources for Egyptian and Ghanaian immigrants in Italy.These latter weights were applied because it is not valid to assume, a priori, that the existingratios in the population are found in these meeting places. For each respondent, thecomponent weights were combined into an overall sample design weight, which was used inanalyses to ensure that the survey information obtained from a limited number of respondentscan represent the population of Egyptian and Ghanaian immigrants in the two study areas,centre-south and north Italy. By interviewing these respondents, a total of 1,605 householdswere eventually contacted (i.e. 756 Egyptian and 849 Ghanaian households) 1,178 of whichwere successfully interviewed (i.e. 509 Egyptian and 669 Ghanaian households), in theperiod March-June 1997. Thus, the survey results are representative for the population ofEgyptian and Ghanaian immigrants that live in the eight provinces that constitute the two studyareas. According to official statistics 77 per cent of the Egyptian and 36 per cent of theGhanaian immigrants in Italy live in these provinces, respectively.
Push and pull factors of international migration: a comparative report
10.2 Database design for comparative analyses
A two-level hierarchical and modular structure characterises all country-specific IMSdatabases. This is a reflection of the manner in which the specific set of household andindividual-level questionnaires have been designed. In fact, database and questionnairedesign went hand in hand. The first level relates to variables in which all householdquestionnaire information is stored, the second level relates to variables in which all individualquestionnaire information is stored.
The design of data-entry programmes based on a two-level hierarchical database structurehas certain advantages:
• during data entry, household-level information about migration status characteristics ofhousehold members, provided by one reference person in the household can be testedagainst information provided by eligible household members in individual-levelquestionnaires (plausibility and internal consistency);
• during data entry, values entered in household identification variables can be evaluated inorder to avoid duplication. The data-entry programme has been designed to continuouslyverify, during data entry, the validity and consistency of values entered in theseidentification variables, to minimise violation of database integrity. Also, for a complete setof questionnaires pertaining to one household, household identification values need to beentered only once;
• after data entry, household and individual questionnaire data are kept together in thedatabase. This is accomplished by linking logical records that contain household andindividual respondent data of a particular household by means of a unique combination ofvalues entered in the household identification variables;
• after data entry, subset-databases can be created that contain, in one and the same logicalrecord, individual respondent information as well as household-level information. Forinstance, subset-databases can be created in which the unit of observation is thehousehold, a household member or an eligible household member, or a person’s place ofresidence at a specified point in time.
In short, ISSA IMS-country databases are two-level hierarchical files with cases that varyaccording to the number and length of logical records.
To provide more insight into database design, Table 10.1 presents a ‘map’ of the database andTable 10.2 visualises the way raw data from processed questionnaires are actually storedand saved in a country-specific IMS-database.
Table 10.1 shows how database variables are grouped into ‘sections’. Database sectionscorrespond with questionnaire modules. A group of sections constitutes a ‘level’ in thehierarchical database. The variables in database section 00 to section 05 store data that arecollected by questions in the household questionnaire. The variables of sections 10-97 storedata that pertain to questions in all types of individual level questionnaires. In most cases,names of database variables correspond with names of question numbers in questionnairemodules. Thus, P35 refers to question 35 in Module P.
With the help from a complete set of questionnaires it is easy to interpret the sequence ofnumbers (Table 10.2, an excision of a country-specific raw data-file). To facilitateinterpretation, a large number of questionnaire data (i.e. records 6-10, 12-22 and 24-32) havebeen suppressed for presentation purposes.
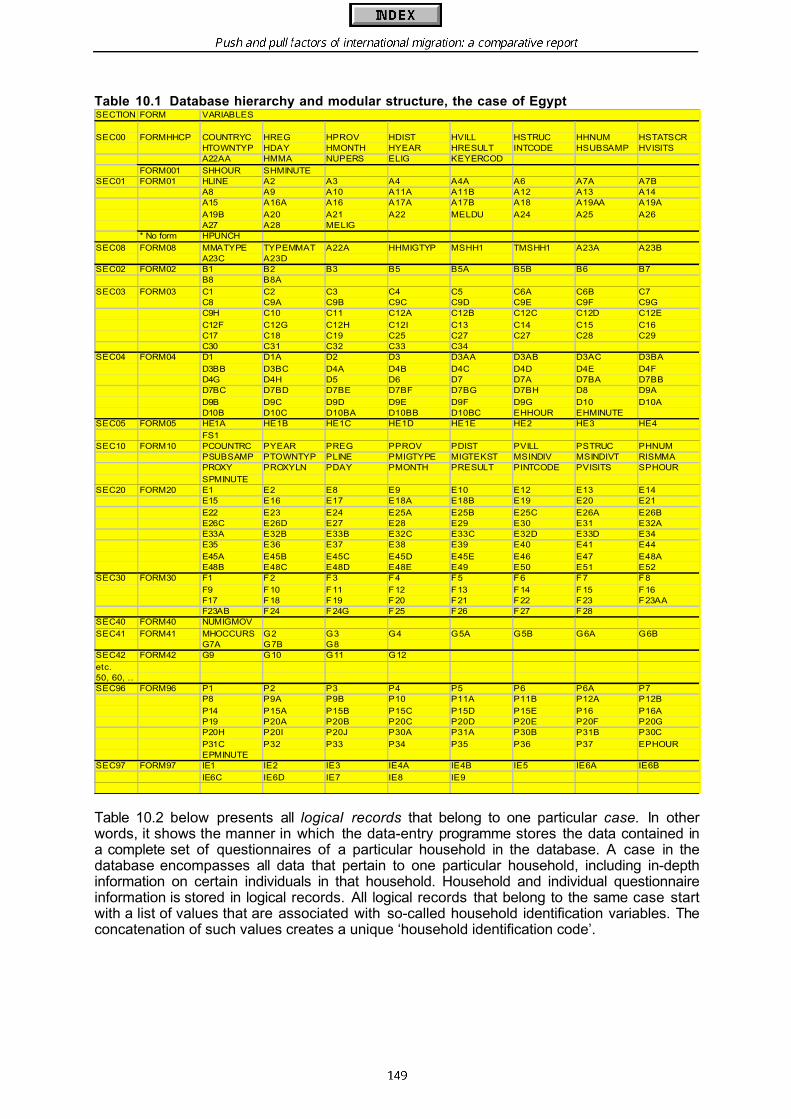
Push and pull factors of international migration: a comparative report
Table 10.1 Database hierarchy and modular structure, the case of Egypt
Table 10.2 below presents all logical records that belong to one particular case. In otherwords, it shows the manner in which the data-entry programme stores the data contained ina complete set of questionnaires of a particular household in the database. A case in thedatabase encompasses all data that pertain to one particular household, including in-depthinformation on certain individuals in that household. Household and individual questionnaireinformation is stored in logical records. All logical records that belong to the same case startwith a list of values that are associated with so-called household identification variables. Theconcatenation of such values creates a unique ‘household identification code’.
SECTION FORM
SEC00 FORMHHCP COUNTRYC HREG HPROV HDIST HVILL HSTRUC HHNUM HSTATSCRHTOWNTYP HDAY HMONTH HYEAR HRESULT INTCODE HSUBSAMP HVISITSA22AA HMMA NUPERS ELIG KEYERCOD
FORM001 SHHOUR SHMINUTESEC01 FORM01 HLINE A2 A3 A4 A4A A6 A7A A7B
A8 A9 A10 A11A A11B A12 A13 A14A15 A16A A16 A17A A17B A18 A19AA A19A
A19B A20 A21 A22 MELDU A24 A25 A26A27 A28 MELIG
* No form HPUNCH
SEC08 FORM08 MMATYPE TYPEMMAT A22A HHMIGTYP MSHH1 TMSHH1 A23A A23BA23C A23D
SEC02 FORM02 B1 B2 B3 B5 B5A B5B B6 B7B8 B8A
SEC03 FORM03 C1 C2 C3 C4 C5 C6A C6B C7C8 C9A C9B C9C C9D C9E C9F C9GC9H C10 C11 C12A C12B C12C C12D C12E
C12F C12G C12H C12I C13 C14 C15 C16C17 C18 C19 C25 C27 C27 C28 C29C30 C31 C32 C33 C34
SEC04 FORM04 D1 D1A D2 D3 D3AA D3AB D3AC D3BA
D3BB D3BC D4A D4B D4C D4D D4E D4FD4G D4H D5 D6 D7 D7A D7BA D7BBD7BC D7BD D7BE D7BF D7BG D7BH D8 D9A
D9B D9C D9D D9E D9F D9G D10 D10AD10B D10C D10BA D10BB D10BC EHHOUR EHMINUTE
SEC05 FORM05 HE1A HE1B HE1C HE1D HE1E HE2 HE3 HE4
FS1SEC10 FORM10 PCOUNTRC PYEAR PREG PPROV PDIST PVILL PSTRUC PHNUM
PSUBSAMP PTOWNTYP PLINE PMIGTYPE MIGTEKST MSINDIV MSINDIVT RISMMAPROXY PROXYLN PDAY PMONTH PRESULT PINTCODE PVISITS SPHOUR
SPMINUTESEC20 FORM20 E1 E2 E8 E9 E10 E12 E13 E14
E15 E16 E17 E18A E18B E19 E20 E21
E22 E23 E24 E25A E25B E25C E26A E26BE26C E26D E27 E28 E29 E30 E31 E32AE33A E32B E33B E32C E33C E32D E33D E34E35 E36 E37 E38 E39 E40 E41 E44
E45A E45B E45C E45D E45E E46 E47 E48AE48B E48C E48D E48E E49 E50 E51 E52
SEC30 FORM30 F1 F2 F3 F4 F5 F6 F7 F8
F9 F10 F11 F12 F13 F14 F15 F16F17 F18 F19 F20 F21 F22 F23 F23AAF23AB F24 F24G F25 F26 F27 F28
SEC40 FORM40 NUMIGMOV
SEC41 FORM41 MHOCCURS G2 G3 G4 G5A G5B G6A G6BG7A G7B G8
SEC42 FORM42 G9 G10 G11 G12
etc.50, 60, ..SEC96 FORM96 P1 P2 P3 P4 P5 P6 P6A P7
P8 P9A P9B P10 P11A P11B P12A P12B
P14 P15A P15B P15C P15D P15E P16 P16AP19 P20A P20B P20C P20D P20E P20F P20GP20H P20I P20J P30A P31A P30B P31B P30C
P31C P32 P33 P34 P35 P36 P37 EPHOUREPMINUTE
SEC97 FORM97 IE1 IE2 IE3 IE4A IE4B IE5 IE6A IE6B
IE6C IE6D IE7 IE8 IE9
VARIABLES
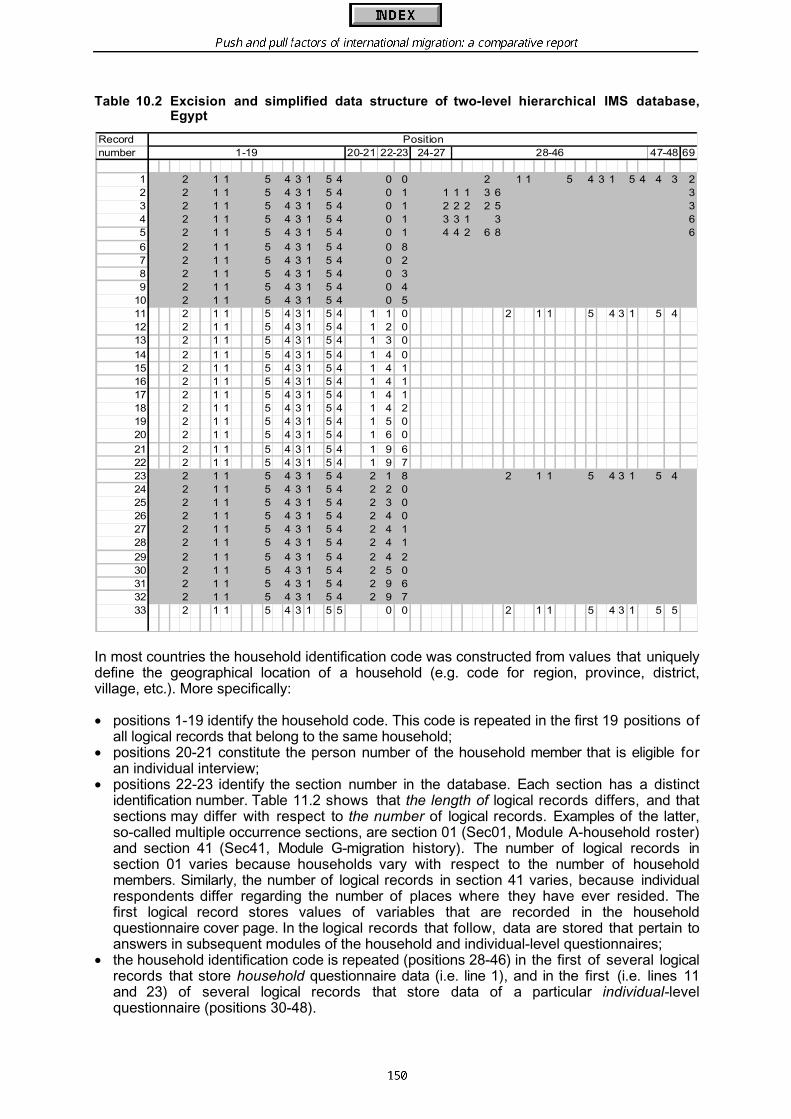
Push and pull factors of international migration: a comparative report
Table 10.2 Excision and simplified data structure of two-level hierarchical IMS database,Egypt
In most countries the household identification code was constructed from values that uniquelydefine the geographical location of a household (e.g. code for region, province, district,village, etc.). More specifically:
• positions 1-19 identify the household code. This code is repeated in the first 19 positions ofall logical records that belong to the same household;
• positions 20-21 constitute the person number of the household member that is eligible foran individual interview;
• positions 22-23 identify the section number in the database. Each section has a distinctidentification number. Table 11.2 shows that the length of logical records differs, and thatsections may differ with respect to the number of logical records. Examples of the latter,so-called multiple occurrence sections, are section 01 (Sec01, Module A-household roster)and section 41 (Sec41, Module G-migration history). The number of logical records insection 01 varies because households vary with respect to the number of householdmembers. Similarly, the number of logical records in section 41 varies, because individualrespondents differ regarding the number of places where they have ever resided. Thefirst logical record stores values of variables that are recorded in the householdquestionnaire cover page. In the logical records that follow, data are stored that pertain toanswers in subsequent modules of the household and individual-level questionnaires;
• the household identification code is repeated (positions 28-46) in the first of several logicalrecords that store household questionnaire data (i.e. line 1), and in the first (i.e. lines 11and 23) of several logical records that store data of a particular individual-levelquestionnaire (positions 30-48).
Recordnumber 69
1 2 1 1 5 4 3 1 5 4 0 0 2 1 1 5 4 3 1 5 4 4 3 22 2 1 1 5 4 3 1 5 4 0 1 1 1 1 3 6 33 2 1 1 5 4 3 1 5 4 0 1 2 2 2 2 5 34 2 1 1 5 4 3 1 5 4 0 1 3 3 1 3 65 2 1 1 5 4 3 1 5 4 0 1 4 4 2 6 8 6
6 2 1 1 5 4 3 1 5 4 0 87 2 1 1 5 4 3 1 5 4 0 28 2 1 1 5 4 3 1 5 4 0 39 2 1 1 5 4 3 1 5 4 0 4
10 2 1 1 5 4 3 1 5 4 0 511 2 1 1 5 4 3 1 5 4 1 1 0 2 1 1 5 4 3 1 5 412 2 1 1 5 4 3 1 5 4 1 2 013 2 1 1 5 4 3 1 5 4 1 3 0
14 2 1 1 5 4 3 1 5 4 1 4 015 2 1 1 5 4 3 1 5 4 1 4 116 2 1 1 5 4 3 1 5 4 1 4 117 2 1 1 5 4 3 1 5 4 1 4 118 2 1 1 5 4 3 1 5 4 1 4 219 2 1 1 5 4 3 1 5 4 1 5 020 2 1 1 5 4 3 1 5 4 1 6 0
21 2 1 1 5 4 3 1 5 4 1 9 622 2 1 1 5 4 3 1 5 4 1 9 723 2 1 1 5 4 3 1 5 4 2 1 8 2 1 1 5 4 3 1 5 424 2 1 1 5 4 3 1 5 4 2 2 025 2 1 1 5 4 3 1 5 4 2 3 026 2 1 1 5 4 3 1 5 4 2 4 027 2 1 1 5 4 3 1 5 4 2 4 128 2 1 1 5 4 3 1 5 4 2 4 1
29 2 1 1 5 4 3 1 5 4 2 4 230 2 1 1 5 4 3 1 5 4 2 5 031 2 1 1 5 4 3 1 5 4 2 9 632 2 1 1 5 4 3 1 5 4 2 9 733 2 1 1 5 4 3 1 5 5 0 0 2 1 1 5 4 3 1 5 5
47-48Position
1-19 20-21 22-23 28-4624-27
Push and pull factors of international migration: a comparative report
The second, third, fourth and fifth records store answer codes to questions A2-A22 for allfour household members. These variables belong to section 01. The data in the example tell usthat this household consists of a male head of household/reference person (A2, stored inpositions 26-27) aged 36 (A6, stored in positions 31-32), his wife aged 25, their male (A3,stored in position 28) child aged 3 and a 68-year-old mother of the reference person. Theinternational migration status of household members is indicated by the one-digit code inposition 69, which is associated with the answer to question A22. The husband and wife arenon-migrants (coded 3), as well as their child and the 68-year-old mother of the referenceperson. The latter two persons are coded 6 because they are not eligible to produce anindividual-level questionnaire due to the IMS age-range eligibility criterion of 18-65 years. Inaddition to the age-range criterion, additional eligibility criteria apply. In the case of theexample, the male reference person and his wife are eligible for a personal interview. Theirresponse to questions in the non-migrant questionnaire is recorded in logical records 11-22and 23-32, respectively. All 32 logical records that belong to this household share the samehousehold identification code printed in the first 19 positions. The last line (33) marks the startof the first logical record of the next case/household.

Push and pull factors of international migration: a comparative report
10.3 Micro and macro questionnaires
For each of the surveyed countries, the micro and macro questionnaires that have been usedare available on request.
Push and pull factors of international migration: a comparative report
10.4 Concepts and definitions
The following glossary presents a list of the main concepts and definitions that have beenused in this publication.
Adopted childOfficially adopted child (not a foster child or a natural child). Adopted children often havethe same legal rights as natural children.
Agricultural landAgricultural land in survey country which is used or has been used for growing crops orraising animals.
BrotherMale who has at least one parent in common with the respondent.
CattleAnimals, including cows, bulls, oxen and calves.
Changed jobSee Job.
ChildSee Own child.
CommunityVillage or neighbourhood (in a town/city) of the respondent.
Country of originCountry where the respondents originally came from, usually the country of birth.
Crude birth rateThe number of live births occurring per thousand population in a year.
Crude death rateThe number of deaths occurring per thousand population in a year.
Current country of destinationCountry in which the (current) migrant is currently living.
Current migrantPerson who migrated from the country of origin (after at least a one-year stay there) andwho is actually living abroad at the time of the interview. He or she may, however,temporarily be in the country of origin, for instance for a holiday or to visit relatives.
Developed countriesAll countries of Europe and North America, and Japan, Australia and New Zealand.
EmployerOwner of a company that has at least three employees. If one or more maids or servantsare working in a household (and no other employees), this household is not considered tobe a company.

Push and pull factors of international migration: a comparative report
FamilyDefined in the narrow sense, as a nuclear family (father and/or mother, and/or children).Thus, a family can be part of a larger household (containing more than one family) or formthe whole household. By definition, the family can never be larger than the household.Relatives other than spouses and their children are not included in a family, but form part ofanother family. If a husband has more than one wife, the husband and his first wife andtheir children will be one family and each of the other spouses with their children form aseparate family (for the purpose of this study).
Financial aidMoney received by the household as financial support from e.g. relatives or a charitableinstitution.
Foster childChild (often but not necessarily of relatives) who is living with the respondent and who istaken care of daily, but who is not a natural child of the respondent nor formally adopted.
Gross Domestic Product (GDP) per capitaThe total output of goods and services for final use produced by residents and non-residents, regardless of the allocation to domestic or foreign claims, in relation to the sizeof the population.
GDP growth rateAnnual percentage change in volume.
HouseholdUsually a household is considered to be a unit of one or more persons living togetherwhose members have made communal arrangements concerning subsistence and othernecessities of life. Such a household may either be:• a one-person household, that is, a person who provides for his/her own food or other
basic needs without joining any other person to form part of a multi-person household.Examples of a one-person household are someone who is living alone and someoneliving in a pension where several students or men live who individually provide for theirown food and basic needs (but may also be part of a household back home);
• a multi-person household, that is, a group of two or more persons - related or unrelated- who make common provisions for food or other basic needs. The persons in the groupmay, to a greater or lesser extent, pool their incomes and have a common budget.Households may occupy the whole, part of, or more than one housing unit. Householdsconsisting of extended families that make common provisions for food, or households ofpotentially separate households with a common head may occupy more than onehousing unit (but still form one household). An example of such a household is ahousehold where the head has different wives (resulting from polygamous unions).
JobRespondents are considered to have a job when they have worked for four hours or moreduring the past seven days. A job refers to a set of tasks performed by one individual. Thiscan also be a job within a family company or a family farm (either paid or unpaid), or workas a street seller. Compulsory national/military service is not considered to be a job.Household tasks performed by the housewife are also not included. But household tasksperformed by someone who is paid for this, are included. If the respondent was promoted,or experienced any other major change of tasks/activities within the same company, he orshe is considered to have changed jobs. ‘The same job’ means that he/she works for thesame employer and does the same type of work/activities.

Push and pull factors of international migration: a comparative report
Judicially separatedLegally separated but not yet officially divorced.
Labour forceThe economically active population, including the armed forces and the unemployed, butexcluding homemakers and other unpaid caregivers.
Last country of destinationLast country in which the return migrant has lived for a continuous period of at least oneyear before returning to his country of origin.
Less developed countries (LDCs)All countries of Africa, Asia (excl. Japan), Latin America, and Oceania.
Life expectancy at birthThe number of years a newborn infant would live if prevailing patterns of mortality at thetime of its birth were to stay the same throughout its life.
Literacy rate (adult)The percentage of population aged 15 and over who can, with understanding, both readand write a short, simple statement on their everyday life.
Live in a countryTo live in a country means to spend or intend to spend a period of at least three months inthat country, other than for purely recreational purposes.
Main migration actor (MMA)Potential main migration actors (PMMAs) are all the members of a household aged 18-65who were born in the country of origin, and:• left the country of origin (after at least a one-year stay there) to live abroad for at least
one year (in one and the same country) at least once in the past ten years, and arecurrently living in the country of origin again, or:
• left the country of origin (after at least a one-year stay there) to live abroad ten yearsago or less, and have currently been living abroad for three months or longer, and:
• were 18 years or older at the time of their last move from the country of origin (after atleast a one-year stay there).
The main migration actor is the PMMA who was the first person in the household whomoved to live abroad in the past ten years. If there are more PMMAs who left on that sameday, other criteria such as economic reasons for migration and age were used to decidewho would be the MMA among these PMMAs.
Migrant householdIn principle, defined as a household in which at least one member - who is still considereda member of that household - has moved from the country of origin (after at least a one-year stay there), and:• has since returned after living in one and the same foreign country for a continuous
period of at least one year, or:• is currently living abroad and left the country of origin at least three months ago.For the purpose of the project, a distinction is made between recent and non-recentmigrant households.
Push and pull factors of international migration: a comparative report
MigrationDefined as a move from one place in order to go and live in another place for a continuousperiod of at least one year (in one and the same country). The line has been drawn at oneyear in order to distinguish migration from short moves. Short-term visits like family visits,holidays, etc. are not considered to be migration.There is one exception to this rule: if a migrant left the country of origin at least threemonths ago and is currently living abroad, he or she is also considered a migrant as it isstill unknown whether he/she will stay there for at least a year.
Natural childSee Own child.
Net incomeIncome after taxes and other deductions.
Non-migrantFor the purpose of this project, two types of non-migrants are distinguished:• persons who were born in the country of origin and never moved from this country to
live abroad;• persons born abroad (i.e. not in the country of origin).According to this definition more members may be considered to be non-migrants; not only,for instance, a man who was born in Ghana and never left Ghana to live abroad, but alsochildren born in e.g. Germany to parents who themselves were born in Ghana, or aGerman woman (born in Germany) married to a Ghanaian man. Also children who wereborn in Nigeria (to Ghanaian parents), but who are now living in Ghana are considered tobe ‘non-migrants’. If these same children would then have moved from Ghana to e.g.Senegal, they would still be considered ‘non-migrants’ as they were not born in Ghana.
Non-migrant householdA household from which no member has ever moved from the country of origin to liveabroad and of which no member is currently living abroad.
Non-recent current migrantPeople who are currently living abroad and whose last move (to live abroad) from thecountry of origin (after at least a one-year stay there) took place more than ten years ago.
Non-recent migrant householdA household in which all moves (to live abroad) of those persons who are still members ofthe household took place more than ten years ago.
Non-recent return migrantPeople currently living in the country of origin, whose last move from that country (after atleast a one-year stay there) to live abroad for a continuous period of at least one year (inone and the same country) took place more than ten years ago.
Own childA person’s natural child who is still alive. Adopted children and foster children are notconsidered to be own children. Children of the partner from a previous marriage are notone’s own (natural) children.
Permanent workThe respondent has a contract for an unlimited period of time.
Potential main migration actor (PMMA)See Main migration actor (MMA).
Push and pull factors of international migration: a comparative report
Proxy personIf someone who had to be interviewed was not available for the interview him/herself, andif it was not possible to make an appointment with this person, another member of thehousehold had to be selected to answer the questions. This person is called a proxyperson. As a general rule, the spouse would be the best choice; otherwise, an adult childor a sibling (brother or sister, preferably of the same sex as the respondent whom he/shereplaces).
Recent current migrantPeople who are currently living abroad and whose last move (to live abroad) from theircountry of origin (after at least a one-year stay) took place ten years ago or less.
Recent migrant householdA migrant household is a recent migrant household if, during the past ten years, at leastone member - who is still considered a member of that household - has moved from thecountry of origin (after at least a one-year stay there), and:• has since returned after living in one and the same foreign country for a continuous
period of at least one year, or:• is currently living abroad and left the country of origin at least three months ago.
Recent return migrantPeople currently living in the country of origin, whose last move (after at least a one-yearstay) to live abroad for a continuous period of at least one year (in one and the samecountry) took place ten years ago or less.
Reference personThe member of the household who answered the questions in the household questionnaire(modules A up to and including D). In principle, the reference person will be the economichead of the household, that is the person who brings in the largest amount of householdincome. Note that the economic head is not necessarily also the legal or titular head of thehousehold.
Return migrantMigrants who have moved from the country of origin to live abroad (after at least a one-year stay) during the past ten years for a continuous period of at least one year (in oneand the same country), but who have returned to the country of origin, where they live atthe time of the interview.
Same jobSee Job.
SisterFemale who has at least one parent in common with the respondent.
Social securityBenefits, including medical health insurance, unemployment benefits, old-age pensions.
Standardised mortality rateNumber of deaths per thousand of the population of the country of citizenship of thedeceased, standardised by age and sex
Survey countryCountry in which the survey took place.
Push and pull factors of international migration: a comparative report
Temporary workThe respondent does not have a contract for an unlimited period of time. He/she could,however, have a contract for a limited period of time (e.g. 3 or 6 months, a year, etc.).
UnemploymentAll persons aged 15 or older who are not in paid employment or self-employed, and whoare available for paid employment or self-employment and have taken steps to seek paidemployment or self-employment.
UrbanisationPercentage of population living in centres defined as ‘urban’ according to the nationalcensus.
WorkRespondents are considered to work if they work for four hours or more per week, eitherpaid or unpaid. See also Job.
Push and pull factors of international migration: a comparative report
10.5 Participating research teams
Co-ordinationNetherlands Interdisciplinary Demographic Institute (NIDI)• Drs. Jeannette Schoorl - Project director• Drs. Liesbeth Heering - Project co-ordinator• Drs. Ingrid Esveldt - Micro survey; report for the Netherlands• Drs. George Groenewold - Sampling; data processing• Drs. Rob van der Erf - Macro survey• Drs. Alinda Bosch - Sampling; data processing• Dr. Kène Henkens - Co-ordinator; report for the Netherlands• Drs. Helga de Valk - Researcher; report for the Netherlands• Dr. Bart de Bruijn - Macro survey• Ir. Hanna van Solinge - Report for the Netherlands
Egypt• Dr. Hesham Makhlouf - Project director (Cairo Demographic Center (CDC))• Mr. Mostapha Salem Gafaar - Project director (Central Agency for Public Mobilization and
Statistics (CAPMAS))• Dr. Ferial Abdel Kader Ahmed - Head of Executive Office (CDC)• Mr. Shawky Hassan Hussein - Consultant (CAPMAS)
Ghana• Prof. John S. Nabila - Project director (University of Ghana)• Dr. John K. Anarfi - First principal investigator (Institute of Statistical, Social and Economic
Research (ISSER))• Dr. Kofi Awusabo-Asare - Co-principal investigator (University of Cape Coast)• Dr. Nicholas N.N. Nsowah-Nuamah - Sampling (ISSER)
Italy• Prof. Giuseppe Gesano - Project director (Institute for Population Research (IRP))• Prof. Anna Maria Birindelli - Macro survey (University of Milan-Bicocca)• Prof. Giancarlo Blangiardo – Researcher (University of Milan-Bicocca)• Dr. Corrado Bonifazi - Researcher (IRP)• Dr. Francesco Carchedi - Field work manager for central and southern Italy (IRP)• Mr. Michele Cardone - Data processing (IRP)• Dr. Maria G. Caruso - Data processing (IRP)• Ms. Letizia Cesarini Sforza - Data processing (IRP)• Prof. Daniela Cocchi - Sampling (University of Bologna)• Dr. Patrizia Farina - Researcher (University of Milan-Bicocca)• Dr. Francesca Grillo - Researcher (IRP)• Dr. Samia Kouider - Field work manager for northern Italy (University of Milan-Bicocca)• Dr. Miria Savioli - Researcher (IRP)• Dr. Laura Terzera - Researcher (University of Milan-Bicocca)
Morocco• Prof. Dr. Abdellatif Fadloullah - Project leader (University med V Rabat)• Prof. Dr. Abdallah Berrada - Project leader (University med V Rabat)

Push and pull factors of international migration: a comparative report
Senegal• Dr. Nelly Robin - Project director (Institute for Development Studies (IRD))• Dr. Richard Lalou - Researcher (IRD)• Dr. Aliou Gaye - Researcher (Directorate of Projections and Statistics (DPS))• Dr. Mamadou Ndiaye - Researcher (DPS)• Mr. Babacar Ndione - Researcher (IRD)
Spain• Prof. Pilar del Castillo - CIS President (Center for Sociological Research (CIS))• Prof. Joaquín Arango - Project director/ scientific co-ordinator (Complutense University/
University Institute Ortega y Gasset)• Ms. Natalia García-Pardo - Project co-ordinator (CIS)• Mr. Jesús Maria Laseca Arellano - Data processing (CIS)• Mr. Valentín Martinez - Sampling (CIS)• Ms. Mercedes Gabarro - Data processing (CIS)
Turkey�� ���������!�0���1���������������������2���������� ����������������� ����������2������� ����!�����34���&������� ����������� �����$��0� ��+ ����������� ����1��&���5 ��� ���1��� ��������������2������ ������ ����5 ����������������2������ ����6/��7�!��� ���% ����� ���#������8����1��� �����+ ����������� ����$� ��!0���9�8�&:4�� ���#������������2������ ����!������2� �9;����������� &��2������ ����3�����<4��������������� &��2������ #����� � �1=�0�9���/��������� &>�������������2������ #���8����<������7��������������2������ #���3����������0������#������������$��0� ��+ ���������

Push and pull factors of international migration: a comparative report
10.6 List of country reports24
Anarfi, J.K., K. Awusabo-Asare and N.N.N. Nsowah-Nuamah, Push and pull factors ofinternational migration: country report for Ghana.
Arango, J., N. García-Pardo, J.M. Laseca and V. Martinez, Push and pull factors ofinternational migration: country report for Spain.
Birindelli, A.M., G. Blangiardo, C. Bonifazi, M.G. Caruso, L. Cesarini Sforza, P. Farina, G.Gesano, F. Grillo, S. Kouider, M. Savioli and L. Terzera, Push and pull factors ofinternational migration: country report for Italy.
Esveldt, I., H. de Valk, C.J.I.M. Henkens, H. van Solinge and M. Idema, Push and pull factors ofinternational migration: country report for the Netherlands.
Fadloullah, A. and A. Berrada, with the cooperation of M. Khachani, Facteurs d’attraction etde répulsion à l’origine des flux migratoires internationaux: rapport Maroc.
Makhlouf, H.H., M.S. Gaafar, F. A. Ahmed, S.H. Hussein, F.M. El-Ashry, A.F. Mohamed, E.M.Mostafa, G.M. Abd Alla, A. Imam, M. A. Soliman, S. El-Dawy and M. Hamdy, Push and pullfactors of international migration: country report for Egypt.
Robin, N., R. Lalou and M. Ndiaye, Facteurs d’attraction et de répulsion à l’origine des fluxmigratoires internationaux: rapport Senegal.
24 Country reports will be published in 2000, by Eurostat, Luxembourg.
�-����� */�� !� �+��"0� (��12����� �� *���0�3" �� �� 42� -� �� 4� ��2�� �� '������ �� $'5�+-0"�� �� '� 6��"���� $� 6���� ���� (� � �� " 7� 8�3���� ����� ���� �� ��� ���� ���� ���� ���������� ��������� ������� �����"��#���