Embed Size (px)
Citation preview

Policy Research Working Paper 4985
Put Your Money Where Your Butt Is
A Commitment Contract for Smoking Cessation
Xavier GinéDean Karlan
Jonathan Zinman
The World BankDevelopment Research GroupFinance and Private Sector TeamJuly 2009
WPS4985P
ublic
Dis
clos
ure
Aut
horiz
edP
ublic
Dis
clos
ure
Aut
horiz
edP
ublic
Dis
clos
ure
Aut
horiz
edP
ublic
Dis
clos
ure
Aut
horiz
ed
Produced by the Research Support Team
Abstract
The Policy Research Working Paper Series disseminates the findings of work in progress to encourage the exchange of ideas about development issues. An objective of the series is to get the findings out quickly, even if the presentations are less than fully polished. The papers carry the names of the authors and should be cited accordingly. The findings, interpretations, and conclusions expressed in this paper are entirely those of the authors. They do not necessarily represent the views of the International Bank for Reconstruction and Development/World Bank and its affiliated organizations, or those of the Executive Directors of the World Bank or the governments they represent.
Policy Research Working Paper 4985
The authors designed and tested a voluntary commitment product to help smokers quit smoking. The product (CARES) offered smokers a savings account in which they deposit funds for six months, after which they take a urine test for nicotine and cotinine. If they pass, their money is returned; otherwise, their money is forfeited
This paper—a product of the Finance and Private Sector Team, Development Research Group—is part of a larger effort in the department to understand the efficacy of a savings commitment product. Policy Research Working Papers are also posted on the Web at http://econ.worldbank.org. The author may be contacted at [email protected].
to charity. Eleven percent of smokers offered CARES tookup, and smokers randomly offered CARES were 3 percentage points more likely to pass the 6-month test than the control group. More importantly, this effect persisted in surprise tests at 12 months, indicating that CARES produced lasting smoking cessation.
Put Your Money Where Your Butt Is: A Commitment Contract for Smoking Cessation*
* Thanks to the management and staff of Green Bank for their cooperation, and to Paulette Cha, Kareem Haggag, Scott Nelson, and especially Tomoko Harigaya for research and project management assistance. Thanks to Satish Chand, Stefano DellaVigna, Esther Duflo, Meredith Rosenthal, and conference and seminar participants at the American Society of Health Economists biennial meeting, Australian National University, Case Western, and NBER Summer Institute for comments. Thanks to the World Bank and Innovations for Poverty Action for funding. Disclosures: Karlan is President of stickK.com, which offers online commitment contracts. Zinman is on the Research Advisory Board of stickK.com.
Xavier Giné World Bank
Dean Karlan
Innovations for Poverty Action
Jonathan Zinman Innovations for Poverty Action
Keywords: commitment contract; commitment device; public health; addictive consumption; intertemporal choice; behavioral economics; field experiments JEL codes: D12, I12
2
I. Introduction
More than five decades after Strotz (1955) modeled dynamic inconsistency, debate
continues over how to represent preferences for consumption over time.1 Introspection,
casual empiricism, and laboratory evidence have motivated theorists to develop several
type of models in which consumers exhibit more impatience for near-term trade-offs than
for future trade-offs.2 The consumption of addictive substances has been a particular
focus of such models.3 These models share the prediction that some (self-aware, or
“sophisticated”) consumers will seek to voluntarily constrain their future consumption
choices: they will demand commitment devices.4
We take some initial steps toward addressing the empirical viability and effectiveness
of commitment devices for smoking cessation, using evidence from a field experiment in
the Philippines. Some smokers were randomly assigned an opportunity to voluntarily sign
a commitment contract (branded Committed Action to Reduce and End Smoking, or
“CARES”) to stop smoking. A smoker signing the contract pledged his own money that
he would pass a cotinine (the primary metabolite of nicotine) urine test six months later.
Yet there is little field evidence on the
demand for or effectiveness of such commitment devices.
5
Eleven percent of smokers offered the CARES contract signed up. This is comparable
to takeup rates for a leading “self-help” treatment: nicotine replacement medications
If the CARES client passed the urine test he got his money back (no interest accrued on
the account). If he failed the test the local bank offering the savings product donated the
money to charity. This is essentially the performance bond contract suggested in Gruber
and Koszegi (2001). A second treatment group received “cue cards,” visually aversive
wallet-sized pictures that are modeled on Canada’s mandated cigarette packaging and
intended to regularly remind smokers of the health risks from smoking.
1 See Phelps and Pollack (1968) for another early, formal model with time-inconsistent preferences. 2 See, e.g., Laibson (1997) , O’Donoghue and Rabin (1999; 2001), Gul and Pesendorfer (2001; 2004), and Fudenberg and Levine (2006). 3 Models of addiction with self-control or temptation problems include Gruber and Koszegi (2001), Laibson (2001), O’Donoghue and Rabin (2002), Bernheim and Rangel (2004), and Gul and Pesendorfer (2007). 4 In contrast, standard neoclassical models of intertemporal choice do not predict a demand for commitment. Becker and Murphy (1988) model the consumption of addictive substances along the lines, and Becker, Grossman and Murphy (1991) test the model’s key empirical predictions. 5 The testing protocol has limitations, detailed below, but has been used by public health campaigns and tests of other treatments (Benowitz et al. 2002), including Volpp et al (2006; 2009) and some of the randomized trials of nicotine replacement medications summarized in Stead et al (2008).
3
(patch, gum, inhaler, or nasal spray).6 The average client made a deposit every two weeks
and ended up committing 550 pesos ($11 USD) by the end of the six-month contract
period. 550 pesos is about 20% of monthly income7
The 12-month results are more interesting for several reasons. The 6-month test date
was scheduled up to 4 weeks in advance, and the test could be passed by abstaining from
smoking for as little as a few days before the test date.
and roughly equal to the average out-
of-pocket expense for about 6 months’ worth of cigarettes incurred by CARES clients at
baseline.
Our results suggest that CARES helps smokers quit. Smokers randomly offered
CARES were an estimated 3.3 to 5.8 percentage points more likely to pass the 6-month
urine test than the control group, and 3.5 to 5.7 percentage points more likely to pass the
12-month urine test than the control group. Using the random assignment of whether
CARES was offered to estimate treatment effects-- specifically, intention-to-treat effects-
- generates results that are free of bias (e.g., from an omitted variable such as the strength
of desire to stop smoking). We then estimate the effects of CARES usage-- treatment-on-
the-treated effects-- by using the randomly assigned offer to instrument for usage. These
estimates indicate increases of 31 to 53 percentage points in the likelihood of 12-month
test passage. The voluntary takeup decision means that one must be careful in thinking
through whether these treatment-on-the-treated estimates will generalize to the full
population of smokers. We discuss this issue in the Conclusion after detailing the design
and results of the present study.
8
6 Seventeen percent of smokers U.S. smokers reported using nicotine replacement medication during the last 12 months in a nationally representative 2001 phone survey (Bansal et al. 2004). In the only study we know of from the Philippines, only six percent of a sample of relatively heavy smokers who had already decided to quit had ever used any form of nicotine replacement therapy in past smoking cessation attempts (Tipones and Fernandez 2006). 7 Income is very roughly estimated from marketer observations of subject appearance and work activity. 8 Possibilities of gaming the 6-month test aside, the public health literature finds that even short-term abstention or failed quit attempts increase the probability of quitting eventually.
The 12-month tests, in contrast,
were “surprise” tests with only a day or two gap between test solicitation and
administration. The 12-month results also lacked any incentives for fraud, since all
commitment contract money had been returned or forfeited at 6 months, and hence there
was no financial consequence tied to the 12-month test result. Lastly, practical reasons
required that subject compensation for taking the 6-month test vary across treatment arms
4
(CARES users did not receive compensation, while all other subjects did). In principle
this could generate sample selection bias. The 12-month test does not suffer from this
problem, since all subjects were offered equal compensation for taking the test.
The finding that a limited-time (6-month) commitment produces longer-term smoking
cessation suggests that commitments can facilitate the formation of good habits. This in
turn suggests that commitment contracts may be worth subsidizing if viable private
markets fail to develop in some settings (due, e.g., to legal obstacles or externalities). In
some cases commitment contracts could serve as a lower-cost substitute for, or low-cost
complement to, conditional cash transfers for healthy behaviors (Volpp et al. 2008a;
Volpp et al. 2008b; Charness and Gneezy forthcoming).
The effect of CARES on smoking quits, although small in nominal number of
individuals who stopped smoking, is large in relative terms. The sample mean pass rate
for the surprise 12-month test was only 10.1% or 18% in the control group, depending on
the assumption used to classify subjects who did not take the test. These low levels of
transition from smoking to non-smoking status are typical, given the addictive nature of
smoking.9
The magnitude of the CARES treatment effects is also large relative to other smoking
cessation treatments. Within-sample we find little evidence that the aversive cue cards
affect smoking quits, and the upper bound of the cue card 12-month treatment-on-the-
treated confidence interval implies an increased likelihood of surprise test passage that is
1/8 of the comparable point estimate on CARES. The results also suggest that CARES
has effects that are comparable to other treatments that have been tested using
randomized trials on other samples. Volpp et al (2006) find that modest financial bonuses
offered through a U.S. Veterans Affairs hospital increase short-term cessation but not
lasting quits. Volpp et al (2009) find that larger financial bonuses ($250 for 6-month test
passage, $400 for 12-month test passage), offered through a workplace program, increase
both short-term cessation and lasting quits (with a treatment-on-the-treated effect of 5.8
Our intention-to-treat effects represent an 34.6% (3.5./10.1) or 32.0%
(5.7/17.8) increase over these baseline likelihoods of smoking cessation.
9 See, e.g., the American Cancer Society’s Guide to Quitting Smoking, which states: “Why is quitting and staying quit hard for so many people? The answer is nicotine.” Mark Twain offers a related perspective: “Quitting smoking is easy. I’ve done it a thousand times.” Song et al (2002) report that 46% of U.S. smokers made a serious attempt to stop in the 1993-94, but only 5.7% successfully abstained for a period of one month or more.
5
percentage points). Non-financial interventions, such as over-the-counter nicotine
replacement medications, have been tested in dozens of randomized trials and generally
produce treatment-on-the-treated effects that are smaller than those found here for
CARES (Stead et al. 2008).
Despite CARES’ large treatment effects, a surprisingly large proportion of smokers
who voluntarily committed with CARES, 66%, ended up failing to quit. This is consistent
with various behavioral biases in preferences and/or expectations (partial naiveté about
dynamic inconsistency, projection bias, over-confidence). Or it may be the case that these
smokers are sophisticated about their self-control problems and use CARES to commit to
an earnest quit attempt that improves the likelihood of eventual cessation (e.g.,
DiClemente et al. 1991; Hymowtiz et al. 1997). Also, the fact that clients who ended up
failing made smaller commitments-- fewer and smaller deposits after opening the
account, but before taking the test-- suggests that any welfare loss is blunted by the
choice of lower commitment intensity. Anecdotally, several clients reported having spent
less on cigarettes, but then failing to stop completely. Thus the lost deposits may have
been (partially) offset from a welfare perspective by a reduction in smoking. Note
however that we lack data on cigarette purchases to assess the empirical magnitude of
this substitution. The implications of such biases or dynamics for optimal contract design
is an important topic for future research.
The results in this study are unusually direct evidence on the takeup and effectiveness
of a commitment device for managing the consumption of an addictive substance. The
only comparable studies we know are Paxton’s (1979; 1980; 1982). These studies have
three key differences from ours. First, they were administered in a highly structured and
clinical setting to smokers who were already participating in a smoking cessation
program. Our study includes smokers of varying smoking intensities and ex-ante
dispositions toward cessation aids. Second, Paxton’s control groups received a rich set of
other smoking cessation aids, including counseling, social pressure, and aversion therapy.
Our study takes a more over-the-counter approach and compares the effects of CARES to
6
a control group that receives nothing other than basic information. Third, Paxton’s
analysis does not exploit random assignment.10
Our study also relates to prior work on commitment devices for other decisions that
may involve self-control problems.
11
Our paper proceeds as follows: the next section describes the voluntary commitment
savings product that we designed for smokers who want to quit smoking. Sections III
describes the cue cards treatment. Section IV details the experimental design and
implementation by Green Bank in the Philippines. Section V reports the results of the
study. Section VI concludes, with particular attention to heterogeneity and its
Ariely and Wertenbroch (2002) find that 37 of 51
MBA students elect to impose binding deadlines on themselves for completing class
assignments. Deadlines improve task performance but students do not necessarily set
them optimally.
Two papers on savings-- Ashraf, Karlan, and Yin (2006) and Thaler and Benartzi
(2004)— find that products with commitment features increase savings rates. But the
decisions and treatments in those papers make it more difficult to interpret the treatment
effects as tests of time inconsistent preferences. In Ashraf et al, individuals were offered
an illiquid savings account (SEED) that did not allow withdrawals until a goal was
reached. SEED might provide benefits other than self-control: spousal control, opt-out of
informal risk sharing arrangements, and mental accounting. SEED also is not a direct
commitment to lower particular consumption (as CARES is), but rather simply a
commitment to not withdraw funds deposited into the SEED account. Thaler and
Benartzi’s Save More Tomorrow™ (SMART) plays more on status quo bias, money
illusion and loss aversion, and is also not a binding commitment: clients can complete a
single form to change their contribution to retirement savings, thus undoing the
commitment.
CARES, in contrast, offers the opportunity to make a more binding and direct
commitment on a specific, tempting consumption behavior. Thus CARES provides a
more direct test of time inconsistency with respect to consumption than the earlier
literature on savings.
10 Paxton randomized subjects into different arms but then estimates treatment effects by comparing those who tookup the commitment product to the control group. 11 T DellaVigna (forthcoming) reviews field evidence on commitment devices.
7
implications for generalizing these results to the full population of smokers (and to other
similar behaviors).
II. CARES Product Design
Committed Action to Reduce and End Smoking (“CARES”) is a voluntary commitment
savings program specifically designed for smokers who want to quit smoking. The basic
design of the product allows a smoker to risk a self-selected amount of his own money
that will be forfeited unless he passes a biochemically verified test of smoking cessation,
administered as a urine test of nicotine and cotinine byproducts, at six months after
signing the commitment contract. The particular product design and study described
below was implemented by the Green Bank of Caraga, on the island of Mindanao in the
Philippines.
Green Bank marketed CARES by sending bank representatives into the street to
target obvious smokers. Details on the marketing are described with the experimental
design below (in Section IV).
Green Bank required a minimum balance of 50 pesos (~= $1USD), collected by the
field marketers, to open a CARES account. Marketers encouraged smokers to deposit the
money they would normally expect to spend on cigarettes into a savings account every
week for six months. The savings account did not yield any interest— this is an
important feature for the bank to prevent non-smokers from opening the account merely
because of the convenience of deposit collection services. The bank offered most
randomly-selected individuals weekly deposit collection; the remaining CARES clients
had to go to a branch to make deposits beyond the opening one.12
12 Clients lose the weekly deposit collection service if they miss three consecutive deposits.
Clients could only make deposits, and not withdrawals, from the CARES account
during the six month commitment period. Hence all deposited funds were at risk. Clients
who passed the six-month urine test got their entire balance back. Clients who failed (or
did not take) the test forfeited their entire balance.

8
Trained Green Bank technicians test CARES clients’ smoking status using the
NicCheckTM urine strip test for nicotine and its primary metabolite, cotinine.13 NicCheck
has been used in previous anti-smoking programs, including the Dutch Cancer Society’s
“Quit and Win” campaign, and the financial bonus incentive testing in Volpp et al (2006;
2009). The test result provides a categorical measure of recent nicotine consumption,
with values ranging from zero (no exposure) to fifteen (high exposure).14
The cue cards are pocket-sized, graphic depictions of the negative health consequences of
smoking. Each individual received one of four pictures: a premature baby (with text
"Smoking harms unborn babies"), bad teeth (with text "Smoking causes mouth and throat
cancer"), black lung (with text "Smoking causes lung cancer"), or a child hooked up to a
respirator (with text "Don't let children breathe your smoke"). By law, such images must
be featured on cigarette packages in Australia, Canada, and New Zealand (Hoek and
Green Bank
counts only a zero result as passing, and both marketers emphasized that clients must stop
smoking completely in order to be sure of passing the test.
Green Bank contacts each client three to four weeks prior to his six-month deadline to
set up a urine testing appointment. If a client can not be reached initially the Bank makes
repeated attempts to set up a test date within one week of the maturity date. If a client is
deemed unable to take the test within the stipulated one-week grace period due to
mitigating circumstances (e.g., working in another location), he is allowed an additional
three weeks to take the test. If the client was reached and refused to schedule a date, the
account balance was forfeited one week after the six-month commitment date.
III. Cue Cards Treatment Design
13 Initially CARES clients were required to take a blood test at a nearby hospital lab. But delays and added costs led Green Bank to switch to urine strips that could be used in the field. NicCheck product specifications indicate that the urine strips sacrifice a bit of test specificity (the ability to detect a true negative result, which is 97% for urine strip versus 99% for lab-based cotinine analysis), but offer equivalent test sensitivity (the ability to detect a true positive result, which is roughly 97% for both urine strips and lab-based cotinine analysis) and the ability to provide results in the field, within 15 minutes. Green Bank found similar specificity (one false positive out of 18 self-reported non-smokers) and much lower sensitivity in its own pilot testing, where marketers randomly approached people on the street in our study area, asked if they were smokers, and then offered 30 pesos to take the urine strip test. 14 Small and portable test strips are dipped into the urine sample, stimulating a chemical reaction that changes the test strip’s color. The color result ranges from white (no nicotine exposure), to light pink (moderate nicotine exposure), to red (high nicotine exposure). The test administrator then compares the test strip’s color to a NicCheck color scale and assigns the test result a number ranging from 0 (no exposure) to 15 (high exposure).
9
Gendall 2005). Smokers assigned to the Cues treatment were offered their choice of the
above cards, and encouraged by the marketers to keep them handy and/or post them in
locations where the subject tended to smoke. More than 99% of subjects offered the cue
cards accepted them.
IV. Experimental Design
Our study sample consists of 2,000 smokers aged 18 or older who reside on the island of
Mindanao in southern Philippines. Green Bank marketers identified smokers by
approaching people and asking them whether they smoke regularly. If they did, the
marketer then asked if they wanted to participate in a short survey on smoking. All
subjects received an informational pamphlet on the dangers of smoking, and a tip sheet
on how to quit. Since the primary objectives of this study were to determine whether first
there was demand for CARES, and second whether CARES increased smoking cessation,
the marketers only collected very quick and basic baseline data on age and smoking
status (see Section V-A for more details).
The experiment was implemented in three distinct waves of marketing (the
econometric specifications will condition for these waves). The first two waves took
place in Butuan City from August to December 2006. After completing the baseline
survey marketers revealed a sticker on the back of the survey that randomly assigned the
subject to one of four groups: (1A) CARES with deposit collection, (1B) CARES without
deposit collection, (2) Cues, or (3) Control.15
15 In the first wave there were 20 situations in which marketers interviewed respondents with either one or two others present; in these cases, marketers were instructed to interview all individuals in the group before disclosing the random assignment. All respondents in the group received the same assignment as the first interviewee. Impact results discussed below correct standard errors for any clustering within groups of individuals that received joint marketing.
The probability of assignment to groups
was initially 45%, 45%, 5%, and 5%. After establishing that there was sufficient takeup
of CARES, Green Bank changed the assignment probabilities to 15%, 15%, 30%, and
40% for the second wave. 418 smokers were surveyed (and hence drawn into the sample
frame) in the first two waves. Of the 266 assigned a CARES offer, 34 took the product.
Two individuals from the Cues group also opened an account (after hearing about the
product and approaching bank staff). In our analysis we code these individuals in the
Cues group, in adherence to the random assignment.
10
The third marketing wave ran from February to May 2007, in the neighboring town of
Ampayon. Here Green Bank implemented new randomization procedures designed to
produce even better compliance with the randomized treatment assignment. Now
marketers used a calculator to solve an equation based on the subject’s birth date (the
residual of dd + mm + yy, divided by three). The individual was then assigned to CARES
group if the residual was zero, to Cues if the residual was one, and to Control if the
residual was two. Given the low takeup in the CARES group without deposit collection
in the first two waves (4.3%), and the fact that the geographic area for the third wave was
more rural, all respondents in the Ampayon CARES group were offered deposit
collection service.16
Given the random assignment, we expect individuals who end up in treatment and
control groups to have statistically indistinguishable baseline characteristics on average,
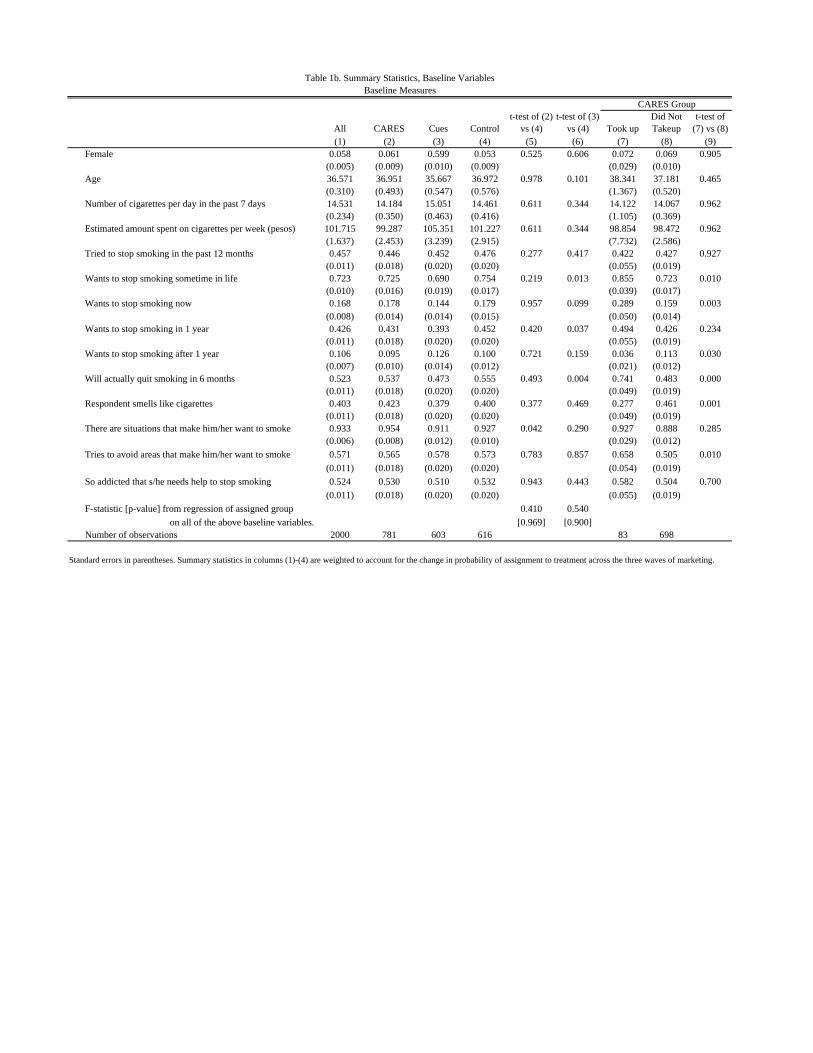
after we control for the likelihood of assignment to each arm. Table 1b presents related
evidence. The F-statistic from a regression of assignment to CARES on all baseline
covariates is 0.41 (p-value of 0.969), and for assignment to Cues is 0.54 (p-value of
0.900). When we examine individual variables across the CARES and Control groups, 12
out of 13 are similar statistically, and only one variable fails at the 10% level: 95.4% in
the CARES group reported experiencing specific situations that make them want to
smoke, whereas only 92.8% of control individuals reported the same. The Cues treatment
individuals are similar statistically to the control in 10 out of 13, with the significant
differences found on “wanting to stop smoking sometime in your life,” “wanting to stop
smoking in 1 year” and “will actually quit smoking in 6 months.” These variables may
49 of the 515 Ampayon subjects offered CARES opened the
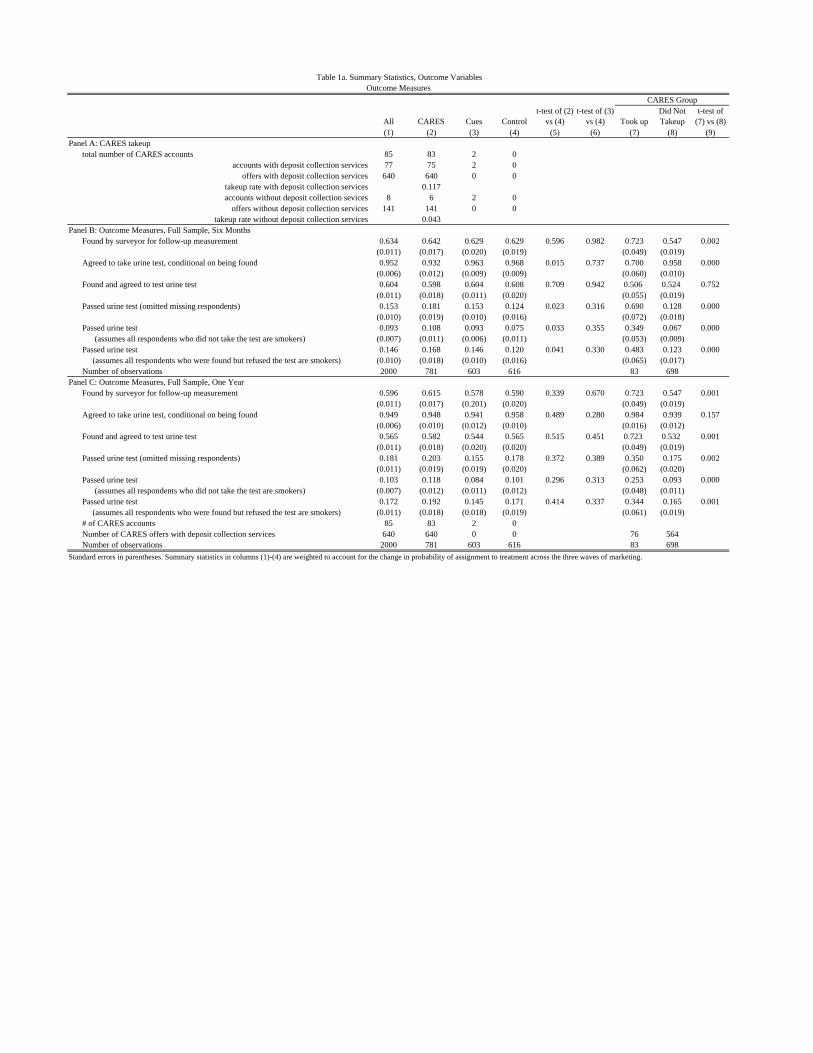
account. Table 1a, Panel A summarizes CARES offers and takeup rates.
In order to validate the quality and accuracy of information provided by the
marketers, field staff from Innovations for Poverty Action conducted spot-checking visits
with randomly selected respondents who had been offered CARES. More than 90% of
the clients accurately described the main features of the product design.
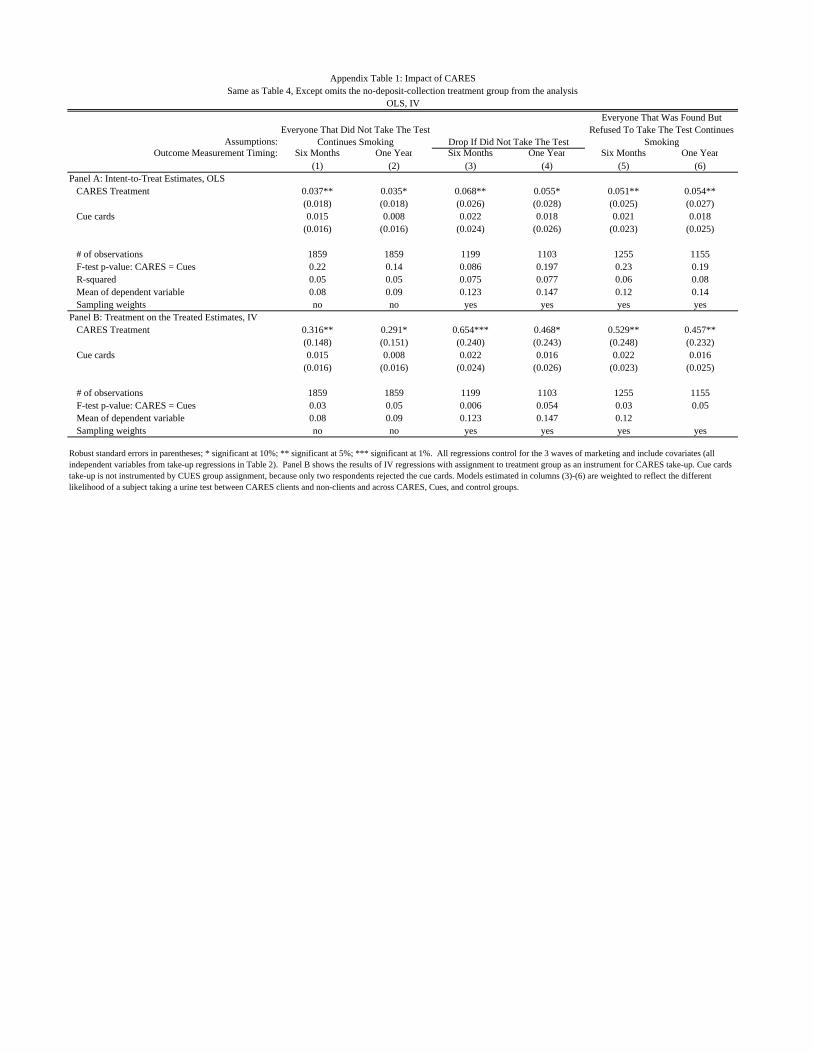
16 As detailed in our equation (1) below, controls for randomization conditions and marketing wave ensure that this low takeup rate does not confound inference on treatment effects. We also confirm that dropping the no-deposit collection CARES treatment arm does not change the results (compare Table 4 to Appendix Table 1).

11
also be correlated with smoking cessation, so we estimate treatment effects with the full
set of baseline covariates as control variables.
Six months and 12 months after the initial marketing, the bank attempted to
administer the urine test to all study subjects (testing procedures are detailed in Section
II). CARES clients had to take the six-month test or automatically forfeit their deposit
balance. Non-clients (including those assigned to the cues and control groups) were paid
30 pesos (60 cents US) for taking the six-month test, and everyone in the sample frame
was paid 30 pesos for taking the 12-month test.
Table 1a Panel B shows that the bank reached 63% of those in the baseline for the
six-month urine test, with no difference in contact rate across the three treatment and
control groups). Of those contacted 95% agreed to take the test. Since we find lower
agreement in the CARES group (93% vs. 97% in the control) we report six-month
treatment effects under alternative assumptions about the smoking status of those who
refused to take the test.
Table 1a Panel C shows that the bank reached 60% of those in the baseline for the 12-
month urine test, with no difference in contact rate across the three treatment and control
groups). Of those contacted 95% agreed to take the test, again with no differences across
groups.
V. Results
A. CARES Takeup
In total, 83 out of 781 (11%) individuals offered CARES signed a contract. Table 1b
Columns 7-9 shows univariate analysis of the takeup decision from data on the limited set
of characteristics marketers collected in the quick baseline survey administered prior to
treatment assignment and marketing.17
17 Only a handful of the 2,000 subjects were existing Green Bank clients. Marketers did not elicit income directly, but their observation of subject appearance and work activity indicated that average subject income was substantially lower than that of typical Green Bank clients.
The following baseline characteristics were
positively correlated with taking up CARES: wanting to quit (at some point in life, or
now), optimism about quitting (as indicated by responding yes to “will you quit smoking
in the next year?”), and pre-existing strategic behavior in managing one’s cravings (as
indicated by responding yes to “do you try to avoid areas or situations that make you
12
want to smoke?”). Negative correlates with CARES takeup were: wanting to quit
smoking more than a year in the future (perhaps an indicator of procrastination) and
smelling like cigarettes (likely an indicator of heavy smoking). Table 2 shows
multivariate estimation of takeup correlates.18
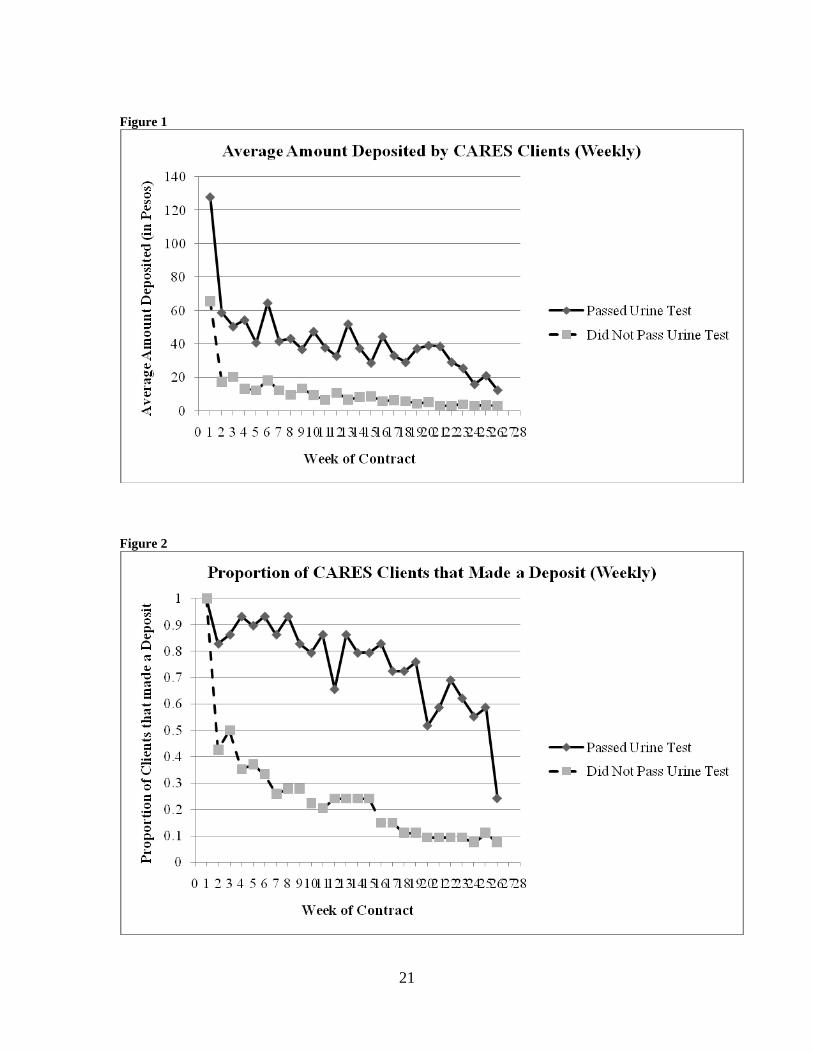
However, the pattern of deposits is intuitive. Figures 1 and 2 show that those who
succeed start off making higher deposits, and continue to make deposits throughout the
entire life of the project. The trend is downward, in that deposits get smaller and less
frequent towards the end. Once enough funds are in the account to be binding and modify
one's behavior, further deposits are unnecessary to change behavior. On the other hand,
The main results here are that the full set
of baseline characteristics are jointly significant but explain only about 10% of the
variation in the takeup decision.
B CARES Usage
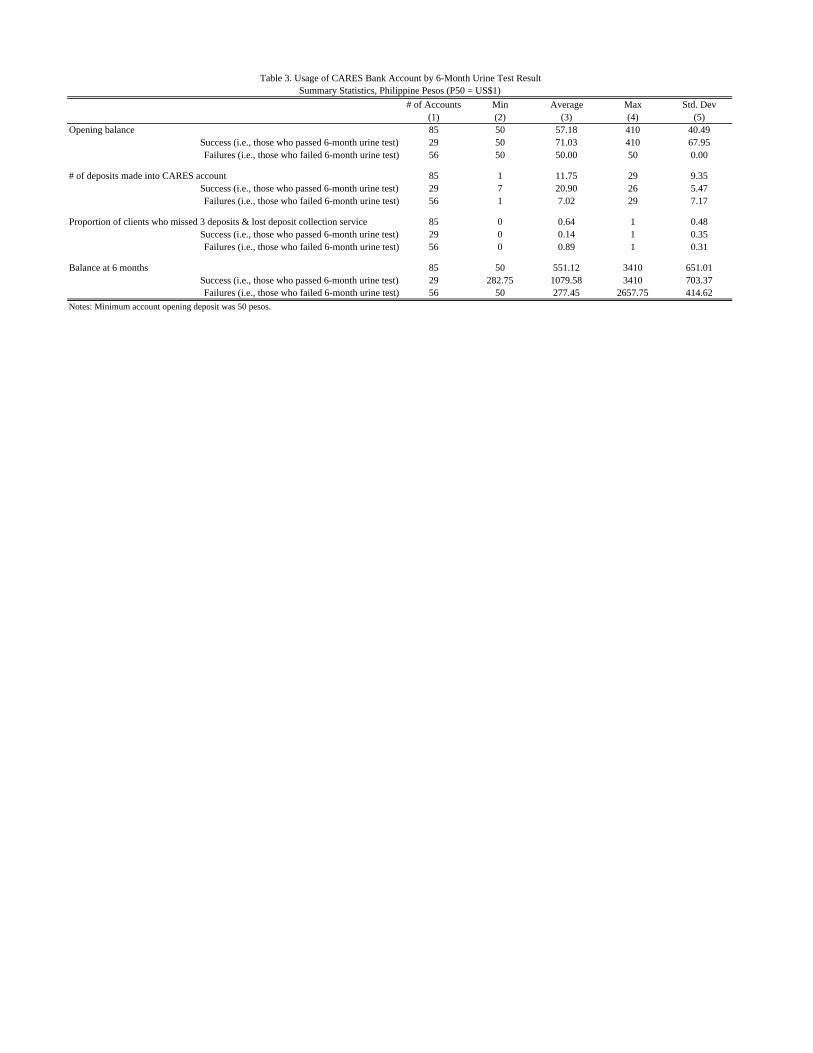
Table 3 shows some summary statistics on CARES deposits.
Opening balances were 57 pesos on average: this is four times the monetary value of
the number of cigarettes the client reported smoking per week. Ninety percent of clients
opened with the minimum amount of 50 pesos. Eighty percent of clients then made
additional contributions. On average CARES clients made a deposit every two weeks,
and by six months the average balance grew to 553 pesos. Given self-reported smoking
intensity and a per-cigarette cost of one peso, the average CARES client committed
roughly six months worth of cigarette spending to the account.
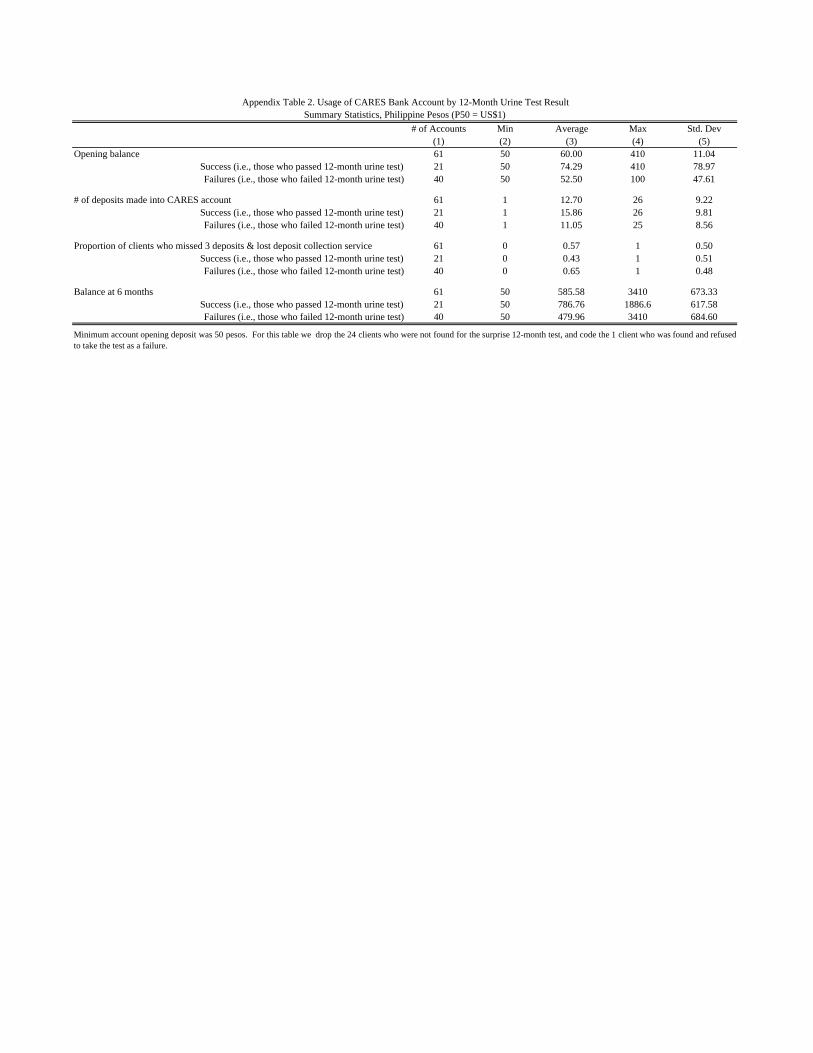
Not surprisingly CARES clients who used the account more intensively were more
likely to pass the urine tests. We show results for the 6-month test in Table 3 and the 12-
month test in Appendix Table 2. Successful clients made more deposits, were more likely
to retain deposit collection services by making regular deposits, and had larger balances
at contract maturity. These differences were more pronounced for 6-month test passage
than for 12-month passage. Of course, since contract terms and deposit requirements
were not randomized, we can not infer a causal relationship between deposit amount,
deposit regularity and success.
18 All takeup and impact regressions include indicator variables for the three marketing waves.
13
those who fail drop much more precipitously than those who succeed, and converge to
only one out of ten individuals making any deposits at the halfway point of the study.
C. Treatment Effects on Smoking Cessation
We estimate intent-to-treat (ITT) effects of CARES and cue cards on test passage using
the OLS specification:
(1): passit = α + βcaresi + χcuesi + δXi + γWi + εi
Where i indexes individuals, t refers to the 6-month or 12-month test, pass, cares and
cues are all binary variables, X is the vector of baseline covariates, and W is a vector of
dummies for the three marketing waves. We report these results in Table 4, Panel A. We
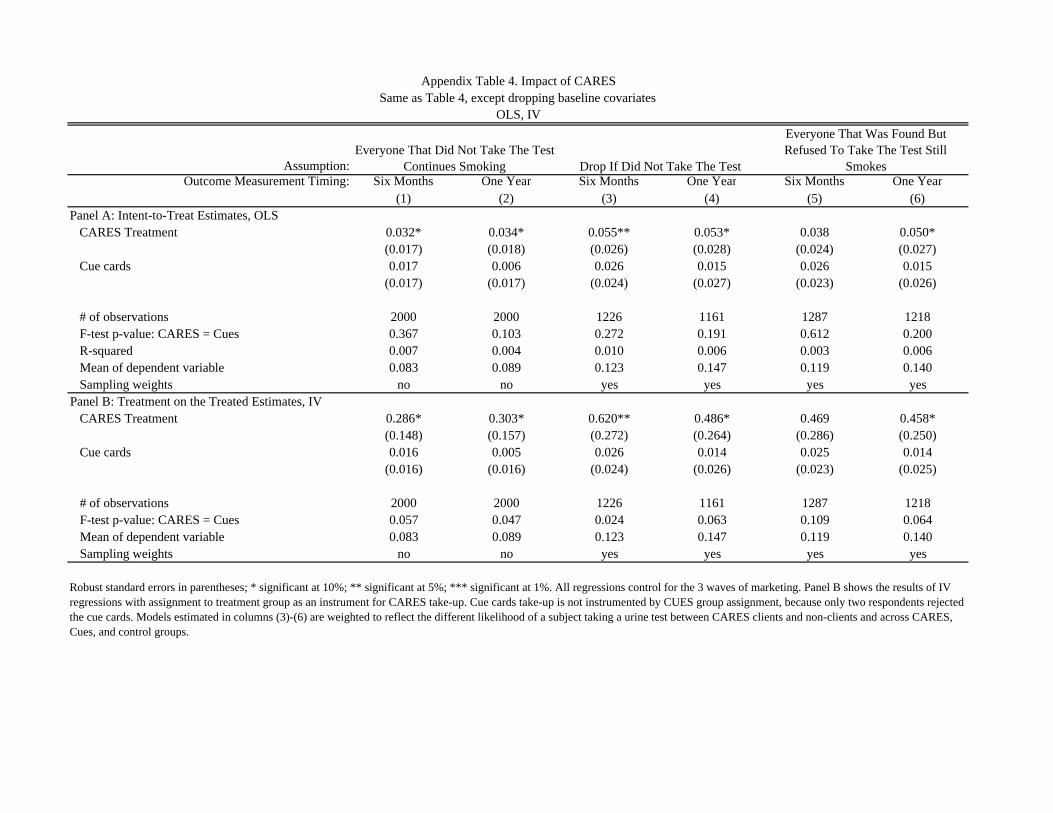
also estimate (1) using probit instead of OLS (Appendix Table 3), and after dropping the
baseline covariates (Appendix Table 4), and find very similar results.
Each table reports results on 6-month test passage in odd columns, and on 12-month
test passage in even columns. We estimate effects under three different assumptions on
clients for whom we do not have a test result: i) these clients would have failed the test
(Columns 1 and 2), ii) these clients have the average pass rate; i.e., we drop these clients
(Columns 3 and 4), iii) these clients have the average pass rate, unless they were found by
the technician and refused to take the test, in which case we assume they would have
failed (Columns 5 and 6).19
We do not find any significant effects from the cue cards. Although the point
estimates on cue cards are not statistically different than those for CARES, it is important
to keep in mind that the takeup rate for cues was nearly 100%. So the maximum feasible
ITT effect for cues is 1.0, while for CARES it is only 0.11/1. In other words, even if one
Table 4 Panel A shows CARES ITT effects on 6-month test passage of 3 to 6
percentage points under these assumptions. These effects are large relative the control
group sample mean passage rates of 0.08 to 0.12. The effects on 12-month test passage,
which as discussed above are probably a better measure of effects on a lasting quit spell,
range from 4 to 6 percentage points. Again these effects are large relative to the control
group sample mean passage rates of 0.10 to 0.18.
19 Six test strips turned blue (off the NicCheck results spectrum) in each of the six- and twelve-month follow-up pools. This is the likely due to the TB medicine Isoniazid. We coded these blue strips as failures, but Green Bank returned the commitment balance to the one CARES client with a blue result.
14
takes the cue card point estimates literally (as different from zero), they imply treatment-
on-the-treated effects that are more than an order of magnitude smaller than those for
CARES. Table 4 Panel B confirms this.
Table 4 Panel B shows treatment-on-the-treated (ToT) results, using random
assignment to CARES as an instrument for takeup. The ToT estimates imply 30 to 65
percentage point increases in test passage. This suggests that CARES usage increases by
several fold the probability of test passage and a lasting quit spell.20
20 The cue card treatment-on-the-treated estimates are insignificant and nearly identical to the intent-to-treat because of nearly 100% takeup of the cue cards.
Appendix Table 5 reports the same specifications for the sub-sample of smokers that
reported wanting to quit smoking at some point in their life in the baseline survey
(Appendix Table 6 reports summary statistics for this sub-sample). The CARES point
estimates suggest somewhat larger treatment effects for this sample. We also find some
significant increases in 6-month test passage from the cue cards, but no significant effects
at 12 months.
VI. Conclusion
We designed a commitment product to help people quit smoking and tested it in
cooperation with Green Bank using a randomized controlled trial in the Philippines.
The results suggest that Committed Action to Reduce and End Smoking (“CARES”)
helps smokers quit. At the end of the commitment contract period (6-months), subjects
offered CARES contract were 3.3 to 5.8 percentage points more likely to pass a urine test
for short-term smoking cessation than the control group, and after 12-months (the
preferred specification), the effects were 3.5 to 5.7 percentage points. From simple
analysis of counts of successes and failures, 29 of the 83 who took-up passed at 6 months
and 54 failed. Of the 29 who passed the 6 month test, 14 then passed (and 15 failed) the
12-month test as well, whereas of the 54 who failed at 6 months, only 7 then passed at 12
months and 47 failed. Treatment-on-the-treated estimates suggest that those who signed a
CARES commitment increased their probability of test passage and a lasting quit spell by
several fold.
15
These results suggest that the CARES product is an effective treatment for smoking
cessation. We do not know of any comparable trials on other treatments in the
Philippines, but the CARES treatment effects compare favorably to those found for
nicotine replacement therapy in randomized controlled trials in other settings (Stead et al.
2008). The CARES takeup rate (11%) also compares well to nicotine replacement
therapy (Bansal et al. 2004; Tipones and Fernandez 2006), which is notable given the
novelty of the CARES product. Presumably commitment contract takeup rates could
increase if familiarity, trust, and information about the product builds. If so commitment
contracts could help public health efforts to address the “under-use” of smoking cessation
treatments (Cokkinides et al. 2005; Orleans 2007).
Rough calculations suggest that CARES passes a social cost-benefit test. We estimate
that CARES’ cost per quit is around $700 in PPP-adjusted terms.21
Nevertheless the majority of CARES clients in our study failed to quit, suggesting
that there is still much to be done in improving the effectiveness of smoking cessation
treatments. In particular it remains to be seen whether and how our results will generalize
to other populations, or to behaviors relevant for models of time-inconsistency (e.g.,
weight loss, exercise, task management, or consumption more generally). Both empirics
and theory provide some guidance in how to think about external validity. The 11% take-
up rate for CARES implies that our average treatment effects mask important
heterogeneity in treatments effects across different consumer “types”. Clearly our
This is much less than
standard estimates of the (social) benefits of smoking cessation. E.,g., the U.S. Center for
Disease Control (2002) reports that employers benefit $3400 per quit-year from increased
productivity and reduced health care costs. Many studies also find large benefits to
former smokers from health improvements and increases in quality-adjusted years of life.
And of course the commitment contract provider may earn benefits as well. In the
implementation studied here Green Bank earned a spread on deposits, and public
relations benefits. In other implementations contract providers might cover costs from
forfeited balances, fees, and/or from advertising.
21 We first estimate per client cost by inflating Green Bank’s per account costs for acquisition (marketing) and administration (deposit collection, urine testing) by the ratio of per capita, purchasing-power-parity-adjusted GDP for U.S. vs. the Philippines. Then we get the per quit cost by inflating per client cost by the inverse of our lowest estimate for the 12-month treatment-on-the-treated effect (i.e., we inflate by 1/0.31).
16
average positive treatment effect is not driven by time-consistent individuals, who should
have no demand for commitment devices. Nor do our results apply directly to time-
inconsistent individuals who plan to quit but are “naïve” about their self-control problems
and hence incorrectly believe that they will quit without a change in incentives. Rather, it
seems likely that our results are driven by a subset of smokers, with time-inconsistent
preferences, who are (partly) sophisticated about their self-control problems. The
evidence that CARES takeup may be higher among smokers who said that they tried to
avoid situations that make them want to smoke (Table 1a; Table 2) is consistent with
(partial) sophisticates driving takeup, since avoiding situations can be viewed as a form
of (nonbinding) commitment device. Identifying more about heterogeneity in preferences
and sophistication is a critical direction for future research.
A closely related line of inquiry for future research is testing whether commitment
contracts complement or substitute for other smoking cessation treatments. Bundling
commitment devices with other treatments that impart awareness or sophistication (e.g.,
information on how difficult it is to quit) might benefit naïve consumers. Sophisticated
consumers might benefit from binding commitments to adhere to nicotine replacement or
other therapies.
Another closely related and open empirical question is the optimal design of an anti-
smoking commitment contract.22
22 For theories of optimal contracting with consumption commitments see, e.g., DellaVigna and Malmendier (2004), and Eliaz and Spiegler (2006).
To highlight just one aspect of product design, note that
in our study CARES was largely bundled with deposit collection services. Hence we
cannot yet unpack how much of the treatment effect was due to the financial
commitment, and how much was due to frequent contact with the deposit collector.
Important sub-questions on the role of deposit collection include whether and how much
in-person contact with contract administrators is necessary for the commitment to be
effective; e.g., it may be the case that deposit collection is important simply for
convenience, and that direct deposit or mobile banking will be efficient substitutes in
some settings. Alternately, contact with the deposit collector may be an integral part of
the commitment per se (e.g., by permitting a commitment to not embarrass oneself by
smelling of smoke), and/or a mechanism for making the commitment to quit salient.
17
Research on what drives takeup decisions offers the potential for addressing many of
the above questions in an integrated framework. If behavioral biases such as loss aversion
partial naiveté, projection bias, and/or over-optimism play a role then there may be
implications for product design (e.g., strong defaults) and marketing (e.g., framing,
information on failure rates). Moreover this would suggest that consumer “type” is
malleable, and hence that our large treatment-on-the-treated effects could apply broadly.
Strong interplay between theory and empirics will be needed to continue developing
markets for commitment.
18
REFERENCES Ariely, Dan and Klaus Wertenbroch (2002). "Procrastination, Deadlines, and
Performance: Self-Control by Pre-Commitment." Psychological Science 13(3): 219-224.
Ashraf, Nava, Dean Karlan and Wesley Yin (2006). "Tying Odysseus to the Mast: Evidence from a Commitment Savings Product in the Philippines." Quarterly Journal of Economics 121(2): 635-672. May.
Bansal, Maansi, Michael Cummings, Andrew Hyland and Gary Giovino (2004). "Stop-smoking medications: Who uses them, who misuses them, and who is misinformed about them?" Nicotine & Tobacco Research 6(Supplement 3): S303-S310. December.
Becker, Gary, Michael Grossman and Kevin M. Murphy (1991). "Rational addiction and the effect of price on consumption." American Economic Review 81(2): 237-241. May.
Becker, Gary and Kevin M. Murphy (1988). "A Theory of Rational Addiction." Journal of Political Economy 96(4): 675-700. August.
Benowitz, NL, P Jacob, K Ahijevch, MJ Jarvis and S Hall (2002). "Biochemical Verification of Tobacco Use and Cessation. SRNT Subcommittee on Biochemical Verification, 2001." Nicotine & Tobacco Research 4(2): 149-59.
Bernheim, B. Douglas and Antonio Rangel (2004). "Addiction and Cue-Triggered Decision Processes." American Economic Review 94(5): 1558-1590. October.
Centers for Disease Control and Prevention (2002). "Annual Smoking-Attributable Mortality, Years of Potential Life Lost, and Economic Costs-- United States, 1995-1999." MMWR Morbidity Mortality Weekly Report 51(14): 300-3.
Charness, Gary and Uri Gneezy (forthcoming). "Incentives to Exercise." Econometrica Cokkinides, Vilma, Elizabeth Ward, Abmedin Jemal and Michael Thun (2005). "Under-
Use of Smoking Cessation Treatments: Results from the National Health Interview Survey, 2000." American Journal of Preventive Medicine 28(1): 119-122.
DellaVigna, Stefano (forthcoming). "Psychology and Economics: Evidence from the Field." Journal of Economic Literature
DellaVigna, Stefano and Ulrike Malmendier (2004). "Contract Design and Self-Control: Theory and Evidence." Quarterly Journal of Economics 119(2): 353-402. May.
DiClemente, CC, JO Prochaska, SK Fairhurst, WF Velicer, MM Velasquez and JS Rossi (1991). "The process of smoking cessation: an analysis of precontemplation, contemplation, and preparation stages of change." Journal of Consulting and Clinical Psychology 59(2): 295-304.
Eliaz, Kfir and Ran Spiegler (2006). "Contracting with Diversely Naive Agents." Review of Economic Studies 73(3): 689-714.
Fudenberg, Drew and David K. Levine (2006). "A Dual-Self Model of Impulse Control." American Economic Review 96(5): 1449-1476.
Gruber, Jonathan and Botond Koszegi (2001). "Is Addiction "Rational"? Theory and Evidence." The Quarterly Journal of Economics 116(4): 1261-1303. November.
Gul, Faruk and Wolfgang Pesendorfer (2001). "Temptation and Self-Control." Econometrica 69(6): 1403-35.

19
Gul, Faruk and Wolfgang Pesendorfer (2004). "Self-Control and the Theory of Consumption." Econometrica 72(1): 119-58.
Gul, Faruk and Wolfgang Pesendorfer (2007). "Harmful Addiction." Review of Economic Studies 74(1): 147-72. January.
Hoek, Janet and Phillip Gendall (2005). "Pictorial Health Warnings: A Review of Research Evidence." Research Report Prepared for Ministry of Health. April.
Hymowtiz, Norman, K. Michael Cummings, Andrew Hyland, William R. Lynn, Terry F. Pechacek and Tyler D. Hartwell (1997). "Predictors of smoking cessation in a cohort of adult smokers followed for five years." Tobacco Control 6(suppl 2): S57-S62.
Laibson, David (1997). "Golden Eggs and Hyperbolic Discounting." Quarterly Journal of Economics 112(2): 443-477. May.
Laibson, David (2001). "A Cue-Theory of Consumption." Quarterly Journal of Economics 116(1): 81-119. February.
O'Donoghue, Ted and Matthew Rabin (1999). "Doing It Now or Later." American Economic Review 89(1): 103-24.
O'Donoghue, Ted and Matthew Rabin (2001). "Choice and Procrastination." Quarterly Journal of Economics 116(1): 121-60.
O'Donoghue, Ted and Matthew Rabin (2002). "Addiction and Present-Biased Preferences." Working Paper. July.
Orleans, C. Tracy (2007). "Increasing the Demand for and use of Effective Smoking Cessation Treatments." American Journal of Preventive Medicine 33(6S): S340-S348.
Paxton, Roger (1979). "The Effects of a Deposit Contract as a Component in a Behavioural Programme for Stopping Smoking." Behaviour Research and Therapy 18 45-50.
Paxton, Roger (1980). "Deposit Contracts with Smokers: Varying Frequency and Amount of Repayments." Behaviour Research and Therapy 19: 117-123.
Paxton, Roger (1982). "Prolonging the Effects of Deposit Contracts with Smokers." Behaviour Research and Therapy 21(4): 425-433.
Phelps, Edmund S. and Robert A. Pollak (1968). "On Second-Best National Savings and Game-Equilibrium Growth." Review of Economic Studies 35: 185-199.
Song, Fujian, James Raftery, Paul Aveyard, Chris Hyde, Pelham Barton and Nerys Woolacott (2002). "Cost-Effectiveness of Pharmacological Interventions for Smoking Cessation: A Literature Review and a Decision Analytic Analysis." Medical Decision Making 22: s26-s37. Sept-Oct Suppl.
Stead, LF, R Perera, C Bullen, D Mant and T Lancaster (2008). "Nicotine Replacement Therapy for Smoking Cessation." Cochrane Database of Systematic Reviews(1)
Strotz, R.H. (1955). "Myopia and inconsistency in dynamic utility maximization." Review of Economic Studies 23(3): 165-80.
Thaler, Richard and Shlomo Benartzi (2004). "Save More Tomorrow: Using Behavioral Economics to Increase Employee Saving." Journal of Political Economy 112(1, Part 2 Supplement): S164-87. February.
Tipones, Rommel and Lenora Fernandez (2006). "Predictors of Smoking Cessation 1 Year After Enrollment in a Smoking Cessation Program in a Tertiary Hospital." Philippine Journal of Internal Medicine 44: 7-12. January-February.
20
Volpp, Kevin G., Leslie K. John, Andrea Troxel, Laurie Norton, Jennifer Fassbender and George Loewenstein (2008a). "Financial incentive-based approaches for weight loss: A randomized trial." Journal of the American Medical Association 300(22): 2631-2637.
Volpp, Kevin G., Andrea Gurmankin Levy, David A. Asch, Jesse A. Berlin, John J. Murphy, Angela Gomez, Harold Sox, Jingsan Zhu and Caryn Lerman (2006). "A Randomized Controlled Trial of Financial Incentives for Smoking Cessation." Cancer Epidemiology, Biomarkers & Prevention 15(1): 12-18. January.
Volpp, Kevin G., George Loewenstein, Andrea Troxel, Jalpa Doshi, Maureen Price, Mitchell Laskin and Stephen E. Kimmel (2008b). "A test of financial incentives to improve warfarin adherence." Working paper.
Volpp, Kevin G., Andrea B. Troxel, Mark V. Pauly, Andrea Puig, Henry A. Glick, David A. Asch, Robert Galvin, Fei Wan, Jill DeGuzman, Elizabeth Corbett, Janet Weiner and Janet Audrain-McGovern (2009). "A Randomized, Controlled Trial of Financial Incentives for Smoking Cessation." New England Journal of Medicine 360(7): 699-709. February 12.
21
Figure 1
Figure 2
All CARES Cues Controlt-test of (2)
vs (4)t-test of (3)
vs (4) Took upDid Not Takeup
t-test of (7) vs (8)
(1) (2) (3) (4) (5) (6) (7) (8) (9)Panel A: CARES takeup
total number of CARES accounts 85 83 2 0accounts with deposit collection services 77 75 2 0
offers with deposit collection services 640 640 0 0takeup rate with deposit collection services 0.117accounts without deposit collection sevices 8 6 2 0
offers without deposit collection services 141 141 0 0takeup rate without deposit collection services 0.043
Panel B: Outcome Measures, Full Sample, Six MonthsFound by surveyor for follow-up measurement 0.634 0.642 0.629 0.629 0.596 0.982 0.723 0.547 0.002
(0.011) (0.017) (0.020) (0.019) (0.049) (0.019)Agreed to take urine test, conditional on being found 0.952 0.932 0.963 0.968 0.015 0.737 0.700 0.958 0.000
(0.006) (0.012) (0.009) (0.009) (0.060) (0.010)Found and agreed to test urine test 0.604 0.598 0.604 0.608 0.709 0.942 0.506 0.524 0.752
(0.011) (0.018) (0.011) (0.020) (0.055) (0.019)Passed urine test (omitted missing respondents) 0.153 0.181 0.153 0.124 0.023 0.316 0.690 0.128 0.000
(0.010) (0.019) (0.010) (0.016) (0.072) (0.018)Passed urine test 0.093 0.108 0.093 0.075 0.033 0.355 0.349 0.067 0.000 (assumes all respondents who did not take the test are smokers) (0.007) (0.011) (0.006) (0.011) (0.053) (0.009)Passed urine test 0.146 0.168 0.146 0.120 0.041 0.330 0.483 0.123 0.000 (assumes all respondents who were found but refused the test are smokers) (0.010) (0.018) (0.010) (0.016) (0.065) (0.017)Number of observations 2000 781 603 616 83 698
Panel C: Outcome Measures, Full Sample, One YearFound by surveyor for follow-up measurement 0.596 0.615 0.578 0.590 0.339 0.670 0.723 0.547 0.001
(0.011) (0.017) (0.201) (0.020) (0.049) (0.019)Agreed to take urine test, conditional on being found 0.949 0.948 0.941 0.958 0.489 0.280 0.984 0.939 0.157
(0.006) (0.010) (0.012) (0.010) (0.016) (0.012)Found and agreed to test urine test 0.565 0.582 0.544 0.565 0.515 0.451 0.723 0.532 0.001
(0.011) (0.018) (0.020) (0.020) (0.049) (0.019)Passed urine test (omitted missing respondents) 0.181 0.203 0.155 0.178 0.372 0.389 0.350 0.175 0.002
(0.011) (0.019) (0.019) (0.020) (0.062) (0.020)Passed urine test 0.103 0.118 0.084 0.101 0.296 0.313 0.253 0.093 0.000 (assumes all respondents who did not take the test are smokers) (0.007) (0.012) (0.011) (0.012) (0.048) (0.011)Passed urine test 0.172 0.192 0.145 0.171 0.414 0.337 0.344 0.165 0.001 (assumes all respondents who were found but refused the test are smokers) (0.011) (0.018) (0.018) (0.019) (0.061) (0.019)# of CARES accounts 85 83 2 0Number of CARES offers with deposit collection services 640 640 0 0 76 564Number of observations 2000 781 603 616 83 698
Standard errors in parentheses. Summary statistics in columns (1)-(4) are weighted to account for the change in probability of assignment to treatment across the three waves of marketing.
Table 1a. Summary Statistics, Outcome VariablesOutcome Measures
CARES Group
All CARES Cues Controlt-test of (2)
vs (4)t-test of (3)
vs (4) Took upDid Not Takeup
t-test of (7) vs (8)
(1) (2) (3) (4) (5) (6) (7) (8) (9)Female 0.058 0.061 0.599 0.053 0.525 0.606 0.072 0.069 0.905
(0.005) (0.009) (0.010) (0.009) (0.029) (0.010)Age 36.571 36.951 35.667 36.972 0.978 0.101 38.341 37.181 0.465
(0.310) (0.493) (0.547) (0.576) (1.367) (0.520)Number of cigarettes per day in the past 7 days 14.531 14.184 15.051 14.461 0.611 0.344 14.122 14.067 0.962
(0.234) (0.350) (0.463) (0.416) (1.105) (0.369)Estimated amount spent on cigarettes per week (pesos) 101.715 99.287 105.351 101.227 0.611 0.344 98.854 98.472 0.962
(1.637) (2.453) (3.239) (2.915) (7.732) (2.586)Tried to stop smoking in the past 12 months 0.457 0.446 0.452 0.476 0.277 0.417 0.422 0.427 0.927
(0.011) (0.018) (0.020) (0.020) (0.055) (0.019)Wants to stop smoking sometime in life 0.723 0.725 0.690 0.754 0.219 0.013 0.855 0.723 0.010
(0.010) (0.016) (0.019) (0.017) (0.039) (0.017)Wants to stop smoking now 0.168 0.178 0.144 0.179 0.957 0.099 0.289 0.159 0.003
(0.008) (0.014) (0.014) (0.015) (0.050) (0.014)Wants to stop smoking in 1 year 0.426 0.431 0.393 0.452 0.420 0.037 0.494 0.426 0.234
(0.011) (0.018) (0.020) (0.020) (0.055) (0.019)Wants to stop smoking after 1 year 0.106 0.095 0.126 0.100 0.721 0.159 0.036 0.113 0.030
(0.007) (0.010) (0.014) (0.012) (0.021) (0.012)Will actually quit smoking in 6 months 0.523 0.537 0.473 0.555 0.493 0.004 0.741 0.483 0.000
(0.011) (0.018) (0.020) (0.020) (0.049) (0.019)Respondent smells like cigarettes 0.403 0.423 0.379 0.400 0.377 0.469 0.277 0.461 0.001
(0.011) (0.018) (0.020) (0.020) (0.049) (0.019)There are situations that make him/her want to smoke 0.933 0.954 0.911 0.927 0.042 0.290 0.927 0.888 0.285
(0.006) (0.008) (0.012) (0.010) (0.029) (0.012)Tries to avoid areas that make him/her want to smoke 0.571 0.565 0.578 0.573 0.783 0.857 0.658 0.505 0.010
(0.011) (0.018) (0.020) (0.020) (0.054) (0.019)So addicted that s/he needs help to stop smoking 0.524 0.530 0.510 0.532 0.943 0.443 0.582 0.504 0.700
(0.011) (0.018) (0.020) (0.020) (0.055) (0.019)F-statistic [p-value] from regression of assigned group 0.410 0.540
on all of the above baseline variables. [0.969] [0.900]Number of observations 2000 781 603 616 83 698
Table 1b. Summary Statistics, Baseline VariablesBaseline Measures
CARES Group
Standard errors in parentheses. Summary statistics in columns (1)-(4) are weighted to account for the change in probability of assignment to treatment across the three waves of marketing.

Estimator: OLS Probit(1) (2)
Female -0.034 -0.024(0.041) (0.028)
Age (/100) 0.894** 0.858**(0.405) (0.398)
Age squared (/100) -.010** -0.010**(0.005) (0.005)
Number of cigarettes per day in the past 7 days (/100) 0.153 0.103(0.321) (0.252)
Number of cigarettes per day squared (/100) -0.002 -0.001(0.007) (0.005)
Having tried to stop smoking in the past 12 months -0.034 -0.025(0.025) (0.019)
Wanting to stop smoking sometime in life 0.085 0.062(0.085) (0.039)
Wanting to stop smoking now 0.034 (0.019)(0.038) (0.028)
Wanting to stop smoking in 1 year 0.076 0.080(0.080) (0.127)
Wanting to stop smoking after 1 year -0.002 -0.003(0.037) (0.050)
Will actually quit smoking in 6 months 0.116*** 0.114***(0.036) (0.041)
Respondent smells like cigarettes -0.073** -0.056***(0.024) (0.019)
There are situations that make him/her want to smoke 0.031 0.037(0.039) (0.033)
Try to avoid areas that make him/her want to smoke 0.043 0.039*(0.027) (0.022)
So addicted that s/he needs help to stop smoking 0.034 0.026(0.027) (0.022)
probability (all variables above = 0) 0.000 0.000Observations 781 775(pseudo-)R-squared 0.101 0.142Number of CARES accounts opened 83 83Mean of dependent variable 0.106 0.107
Table 2. Multivariate Analysis of CARES Take-upOLS, Probit
Robust standard errors in parentheses; * significant at 10%; ** significant at 5%; *** significant at 1%. Standard errors areclustered by the marketing group if the respondents were surveyed in group. All regressions control for 3 phases of randomizationand use marketer fixed effects. Probit specification reports marginal effects.
# of Accounts Min Average Max Std. Dev(1) (2) (3) (4) (5)
Opening balance 85 50 57.18 410 40.49Success (i.e., those who passed 6-month urine test) 29 50 71.03 410 67.95Failures (i.e., those who failed 6-month urine test) 56 50 50.00 50 0.00
# of deposits made into CARES account 85 1 11.75 29 9.35Success (i.e., those who passed 6-month urine test) 29 7 20.90 26 5.47Failures (i.e., those who failed 6-month urine test) 56 1 7.02 29 7.17
Proportion of clients who missed 3 deposits & lost deposit collection service 85 0 0.64 1 0.48Success (i.e., those who passed 6-month urine test) 29 0 0.14 1 0.35Failures (i.e., those who failed 6-month urine test) 56 0 0.89 1 0.31
Balance at 6 months 85 50 551.12 3410 651.01Success (i.e., those who passed 6-month urine test) 29 282.75 1079.58 3410 703.37Failures (i.e., those who failed 6-month urine test) 56 50 277.45 2657.75 414.62
Notes: Minimum account opening deposit was 50 pesos.
Table 3. Usage of CARES Bank Account by 6-Month Urine Test ResultSummary Statistics, Philippine Pesos (P50 = US$1)

Assumption:Outcome Measurement Timing: Six Months One Year Six Months One Year Six Months One Year
(1) (2) (3) (4) (5) (6)Panel A: Intent-to-Treat Estimates, OLS CARES Treatment 0.033* 0.035** 0.058** 0.057** 0.041* 0.054**
(0.017) (0.018) (0.026) (0.028) (0.024) (0.027) Cue cards 0.015 0.009 0.022 0.019 0.021 0.019
(0.016) (0.016) (0.024) (0.026) (0.023) (0.025)
# of observations 2000 2000 1226 1161 1287 1218 F-test p-value: CARES = Cues 0.302 0.142 0.162 0.184 0.408 0.194 R-squared 0.048 0.057 0.068 0.083 0.056 0.081 Mean of dependent variable 0.083 0.089 0.123 0.147 0.119 0.140 Sampling weights no no yes yes yes yesPanel B: Treatment on the Treated Estimates, IV CARES Treatment 0.296** 0.312** 0.646** 0.533** 0.522* 0.509**
(0.151) (0.159) (0.270) (0.266) (0.293) (0.253) Cue cards 0.014 0.008 0.022 0.017 0.021 0.017
(0.016) (0.016) (0.024) (0.026) (0.023) (0.025)
# of observations 2000 2000 1226 1161 1287 1218 F-test p-value: CARES = Cues 0.051 0.053 0.016 0.045 0.077 0.044 Mean of dependent variable 0.083 0.089 0.123 0.147 0.119 0.140 Sampling weights no no yes yes yes yes
Table 4. Impact of CARES on Passing Cotinine Urine Test
Robust standard errors in parentheses; * significant at 10%; ** significant at 5%; *** significant at 1%. All regressions control for the 3 waves of marketing and includecovariates (all independent variables from take-up regressions in Table 3). Panel B shows the results of IV regressions with assignment to treatment group as an instrument forCARES take-up. Cue cards take-up is not instrumented by CUES group assignment, because only two respondents rejected the cue cards. Models estimated in columns (3)-(6)are weighted to reflect the different likelihood of a subject taking a urine test between CARES clients and non-clients and across CARES, Cues, and control groups.
Everyone That Was Found But Refused To Take The Test Still
SmokesDrop If Did Not Take The TestEveryone That Did Not Take The Test
Continues Smoking
OLS, IV
Assumptions:Outcome Measurement Timing: Six Months One Year Six Months One Year Six Months One Year
(1) (2) (3) (4) (5) (6)Panel A: Intent-to-Treat Estimates, OLS CARES Treatment 0.037** 0.035* 0.068** 0.055* 0.051** 0.054**
(0.018) (0.018) (0.026) (0.028) (0.025) (0.027) Cue cards 0.015 0.008 0.022 0.018 0.021 0.018
(0.016) (0.016) (0.024) (0.026) (0.023) (0.025)
# of observations 1859 1859 1199 1103 1255 1155 F-test p-value: CARES = Cues 0.22 0.14 0.086 0.197 0.23 0.19 R-squared 0.05 0.05 0.075 0.077 0.06 0.08 Mean of dependent variable 0.08 0.09 0.123 0.147 0.12 0.14 Sampling weights no no yes yes yes yesPanel B: Treatment on the Treated Estimates, IV CARES Treatment 0.316** 0.291* 0.654*** 0.468* 0.529** 0.457**
(0.148) (0.151) (0.240) (0.243) (0.248) (0.232) Cue cards 0.015 0.008 0.022 0.016 0.022 0.016
(0.016) (0.016) (0.024) (0.026) (0.023) (0.025)
# of observations 1859 1859 1199 1103 1255 1155 F-test p-value: CARES = Cues 0.03 0.05 0.006 0.054 0.03 0.05 Mean of dependent variable 0.08 0.09 0.123 0.147 0.12 Sampling weights no no yes yes yes yes
Robust standard errors in parentheses; * significant at 10%; ** significant at 5%; *** significant at 1%. All regressions control for the 3 waves of marketing and include covariates (all independent variables from take-up regressions in Table 2). Panel B shows the results of IV regressions with assignment to treatment group as an instrument for CARES take-up. Cue cards take-up is not instrumented by CUES group assignment, because only two respondents rejected the cue cards. Models estimated in columns (3)-(6) are weighted to reflect the different likelihood of a subject taking a urine test between CARES clients and non-clients and across CARES, Cues, and control groups.
Appendix Table 1: Impact of CARESSame as Table 4, Except omits the no-deposit-collection treatment group from the analysis
OLS, IV
Everyone That Did Not Take The Test Continues Smoking Drop If Did Not Take The Test
Everyone That Was Found But Refused To Take The Test Continues
Smoking
# of Accounts Min Average Max Std. Dev(1) (2) (3) (4) (5)
Opening balance 61 50 60.00 410 11.04Success (i.e., those who passed 12-month urine test) 21 50 74.29 410 78.97Failures (i.e., those who failed 12-month urine test) 40 50 52.50 100 47.61
# of deposits made into CARES account 61 1 12.70 26 9.22Success (i.e., those who passed 12-month urine test) 21 1 15.86 26 9.81Failures (i.e., those who failed 12-month urine test) 40 1 11.05 25 8.56
Proportion of clients who missed 3 deposits & lost deposit collection service 61 0 0.57 1 0.50Success (i.e., those who passed 12-month urine test) 21 0 0.43 1 0.51Failures (i.e., those who failed 12-month urine test) 40 0 0.65 1 0.48
Balance at 6 months 61 50 585.58 3410 673.33Success (i.e., those who passed 12-month urine test) 21 50 786.76 1886.6 617.58Failures (i.e., those who failed 12-month urine test) 40 50 479.96 3410 684.60
Appendix Table 2. Usage of CARES Bank Account by 12-Month Urine Test ResultSummary Statistics, Philippine Pesos (P50 = US$1)
Minimum account opening deposit was 50 pesos. For this table we drop the 24 clients who were not found for the surprise 12-month test, and code the 1 client who was found and refusedto take the test as a failure.

Assumption:Outcome Measurement Timing Six Months One Year Six Months One Year Six Months One Year
(1) (2) (3) (4) (5) (6)Panel A: Intent-to-Treat Estimates, Probit CARES Treatment 0.033** 0.033* 0.061** 0.059** 0.044* 0.055**
(0.016) (0.017) (0.027) (0.029) (0.025) (0.028) Cue cards 0.015 0.009 0.023 0.020 0.022 0.020
(0.016) (0.017) (0.027) (0.029) (0.025) (0.028)
# of observations 1993 1989 1225 1155 1286 1212 F-test p-value: CARES = Cues 0.232 0.140 0.140 0.178 0.355 0.192 Mean of dependent variable 0.083 0.089 0.123 0.147 0.119 0.140 Sampling weights no no yes yes yes yesPanel B: Treatment on the Treated Estimates, IV Probit CARES Treatment 0.385 0.509 0.736*** 0.702*** 0.690* 0.689***
(0.367) (0.340) (0.286) (0.223) (0.380) (0.242) Cue cards 0.014 0.008 0.0238 0.018 0.023 0.018
(0.015) (0.017) (0.026) (0.028) (0.025) (0.027)
# of observations 1993 1989 1225 1155 1286 1212 F-test p-value: CARES = Cues 0.153 0.053 0.074 0.025 0.134 0.028 Mean of dependent variable 0.083 0.089 0.123 0.147 0.119 0.140 Sampling weights no no yes yes yes yes
Appendix Table 3: Impact of CARES
Marginal effects with robust standard errors in parentheses; * significant at 10%; ** significant at 5%; *** significant at 1%. All probits control for the 3 waves of marketing and include covariates (all independent variables from take-up regressions in Table 2). Panel B shows the results of IV probits with assignment to treatment group as an instrument for CARES take-up. Cue cards take-up is not instrumented by CUES group assignment, because only two respondents rejected the cue cards. Models estimated in columns (3)-(6) are weighted to reflect the different likelihood of a subject taking a urine test between CARES clients and non-clients and across CARES, Cues, and control groups. The sample size decreases here vs. OLS because indicator variables for a small number of missing baseline survey responses predict a perfect failure in test results.
Everyone That Was Found But Refused To Take The Test Still
SmokesEveryone That Did Not Take The Test
Continues Smoking Drop If Did Not Take The Test
Probit, IV-ProbitSame as Table 4, except using a probit model
Assumption:Outcome Measurement Timing: Six Months One Year Six Months One Year Six Months One Year
(1) (2) (3) (4) (5) (6)Panel A: Intent-to-Treat Estimates, OLS CARES Treatment 0.032* 0.034* 0.055** 0.053* 0.038 0.050*
(0.017) (0.018) (0.026) (0.028) (0.024) (0.027) Cue cards 0.017 0.006 0.026 0.015 0.026 0.015
(0.017) (0.017) (0.024) (0.027) (0.023) (0.026)
# of observations 2000 2000 1226 1161 1287 1218 F-test p-value: CARES = Cues 0.367 0.103 0.272 0.191 0.612 0.200 R-squared 0.007 0.004 0.010 0.006 0.003 0.006 Mean of dependent variable 0.083 0.089 0.123 0.147 0.119 0.140 Sampling weights no no yes yes yes yesPanel B: Treatment on the Treated Estimates, IV CARES Treatment 0.286* 0.303* 0.620** 0.486* 0.469 0.458*
(0.148) (0.157) (0.272) (0.264) (0.286) (0.250) Cue cards 0.016 0.005 0.026 0.014 0.025 0.014
(0.016) (0.016) (0.024) (0.026) (0.023) (0.025)
# of observations 2000 2000 1226 1161 1287 1218 F-test p-value: CARES = Cues 0.057 0.047 0.024 0.063 0.109 0.064 Mean of dependent variable 0.083 0.089 0.123 0.147 0.119 0.140 Sampling weights no no yes yes yes yes
Appendix Table 4. Impact of CARES
Robust standard errors in parentheses; * significant at 10%; ** significant at 5%; *** significant at 1%. All regressions control for the 3 waves of marketing. Panel B shows the results of IV regressions with assignment to treatment group as an instrument for CARES take-up. Cue cards take-up is not instrumented by CUES group assignment, because only two respondents rejected the cue cards. Models estimated in columns (3)-(6) are weighted to reflect the different likelihood of a subject taking a urine test between CARES clients and non-clients and across CARES, Cues, and control groups.
Everyone That Was Found But Refused To Take The Test Still
SmokesEveryone That Did Not Take The Test
Continues Smoking Drop If Did Not Take The Test
OLS, IVSame as Table 4, except dropping baseline covariates

Assumption:Outcome Measurement Timing: Six Months One Year Six Months One Year Six Months One Year
(1) (2) (3) (4) (5) (6)Panel A: Intent-to-Treat Estimates, OLS CARES Treatment 0.045** 0.034 0.085*** 0.064* 0.062** 0.058*
(0.020) (0.021) (0.031) (0.035) (0.028) (0.033) Cue cards 0.032* -0.001 0.053* 0.006 0.049* 0.004
(0.019) (0.020) (0.028) (0.032) (0.027) (0.031)
# of observations 1434 1434 853 824 898 865 F-test p-value: CARES = Cues 0.517 0.094 0.332 0.102 0.679 0.111 R-squared 0.063 0.066 0.095 0.100 0.075 0.097 Mean of dependent variable 0.074 0.099 0.108 0.161 0.105 0.155 Sampling weights no no yes yes yes yesPanel B: Treatment on the Treated Estimates, IV CARES Treatment 0.343** 0.259 0.865*** 0.507* 0.716** 0.457*
(0.146) (0.162) (0.298) (0.279) (0.321) (0.265) Cue cards 0.032* -0.001 0.058** 0.006 0.053* 0.004
(0.019) (0.020) (0.029) (0.032) (0.028) (0.031)
# of observations 1434 1434 853 824 898 865 F-test p-value: CARES = Cues 0.026 0.090 0.005 0.061 0.032 0.074 Mean of dependent variable 0.074 0.066 0.108 0.161 0.105 0.155 Sampling weights no no yes yes yes yes
Appendix Table 5. Impact of CARESSame as Table 4, Except on Sub-Sample Reporting in Baseline That Want to Stop Smoking at Some Point in Life
OLS, IV
Robust standard errors in parentheses; * significant at 10%; ** significant at 5%; *** significant at 1%. All regressions control for the 3 waves of marketing and include covariates (all independent variables from take-up regressions in Table 2). Panel B shows the results of IV regressions with assignment to treatment group as an instrument for CARES take-up. Cue cards take-up is not instrumented by CUES group assignment, because only two respondents rejected the cue cards. Models estimated in columns (3)-(6) are weighted to reflect the different likelihood of a subject taking a urine test between CARES clients and non-clients and across CARES, Cues, and control groups.
Everyone That Did Not Take The Test Continues Smoking Drop If Did Not Take The Test
Everyone That Was Found But Refused To Take The Test Continues
Smoking

All CARES Cues Controlt-test of (2)
vs (4)t-test of (3)
vs (4) Took upDid Not Takeup
t-test of (7) vs (8)
(1) (2) (3) (4) (5) (6) (7) (8) (9)Panel A: Outcome Measures, Six Months
Found by surveyor for follow-up measurement 0.608 0.611 0.604 0.609 0.930 0.879 0.718 0.505 0.001(0.013) (0.020) (0.024) (0.023) (0.054) (0.022)
Agreed to take urine test 0.949 0.914 0.966 0.977 0.001 0.416 0.686 0.949 0.000(0.007) (0.016) (0.011) (0.008) (0.066) (0.014)
Found and agreed to test urine test 0.577 0.558 0.583 0.595 0.248 0.727 (0.493) (0.479) 0.828(0.013) (0.021) (0.024) (0.023) (0.060) (0.022)
Passed urine test (omitted missing respondents) 0.159 0.201 0.162 0.109 0.002 0.067 0.743 0.132 0.000(0.013) (0.024) (0.022) (0.018) (0.075) (0.022)
Passed urine test 0.092 0.112 0.095 0.065 0.007 0.108 0.366 0.063 0.000 (assumes all respondents who did not take the test are smokers) (0.008) (0.013) (0.014) (0.012) (0.058) (0.011)Passed urine test 0.151 0.184 0.156 0.106 0.006 0.075 0.510 0.125 0.000 (assumes all respondents who were found but refused the test are smokers) (0.012) (0.023) (0.022) (0.017) (0.071) (0.021)Number of observations 1434 576 412 446 71 505
Panel B: Outcome Measures, One YearFound by surveyor for follow-up measurement 0.584 0.603 0.571 0.573 0.339 0.933 0.771 0.547 0.001
(0.013) (0.020) (0.024) (0.023) (0.051) (0.022)Agreed to take urine test 0.946 0.942 0.928 0.967 0.139 0.047 0.981 0.931 0.157
(0.008) (0.013) (0.016) (0.011) (0.019) (0.015)Found and agreed to test urine test 0.553 0.568 0.530 0.555 0.668 0.466 (0.746) (0.509) 0.000
(0.013) (0.021) (0.012) (0.024) (0.052) (0.022)Passed urine test (omitted missing respondents) 0.199 0.224 0.156 0.203 0.536 0.164 0.340 0.195 0.020
(0.014) (0.024) (0.023) (0.024) (0.066) (0.025)Passed urine test 0.110 0.128 0.083 0.113 0.472 0.138 0.254 0.099 0.000 (assumes all respondents who did not take the test are smokers) (0.008) (0.014) (0.014) (0.015) (0.052) (0.013)Passed urine test 0.188 0.212 0.145 0.197 0.649 0.112 0.333 0.181 0.011 (assumes all respondents who were found but refused the test are smokers) (0.013) (0.023) (0.022) (0.024) (0.065) (0.023)Number of observations 1434 576 412 446 71 505
Appendix Table 6. Summary Statistics, Outcome VariablesOutcome Measures, For Respondents who Reported in Baseline Wanting to Quit Smoking at Some Point in Their Life
CARES Group
Standard errors in parentheses. Summary statistics shows in columns (1)-(4) are weighted to account for the change in probability of assignment to treatment across the three waves of marketing.