Embed Size (px)
Citation preview
Putnam Multi-Asset Model PortfoliosPre-diversified models that can enhance the potential of your practice
Q4
| 21
Financial advisors can use model portfolios and consulting services to make their practices more efficient and increase their value to clients.
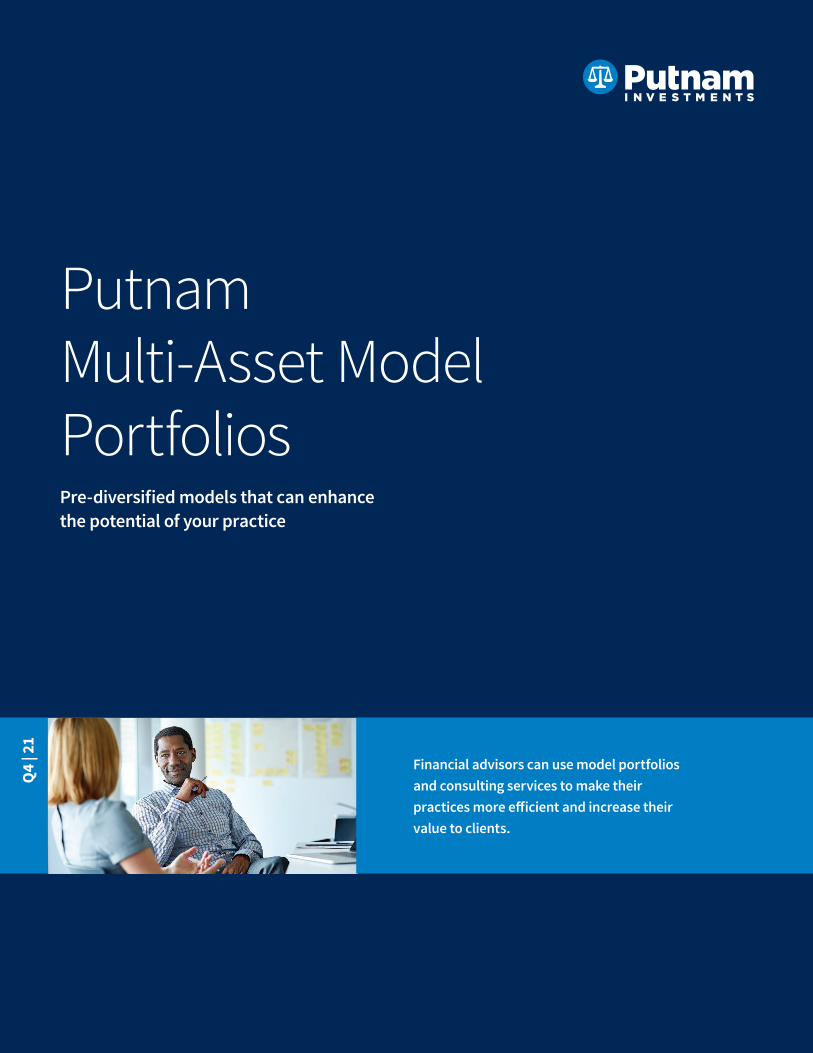
Use model portfolios to make your time with clients more valuableMore and more, advisors can add value to their clients by emphasizing holistic investment management, financial planning, and behavioral support and education. Greater efficiency in selecting investments can free up time for other drivers of investment value.
Drivers of advisor value
Holistic investment management
Financial planning Behavioral support and education
Aligning risk and return Collaboratively determining each client’s willingness and ability to take risk and ensuring that their investments appropriately balance expected risk and return
Balancing growth and income Ensuring that clients are invested to pursue the appropriate mix of growth and income for their specific circumstances
Selecting investment vehicles Helping clients select the best way to access a given investment capa-bility to balance client-specific cost, liquidity, and tax considerations
Locating assets properly Helping clients decide the best account types for their specific circumstances
Budgeting Reviewing expenses with clients to create an appropriate strategy for spending, saving, and investing
Estate planning Ensuring clients are prepared to transfer their assets to their children or other beneficiaries in a tax-smart manner
Offering a support system Providing professional assurance that clients and their loved ones are positioned to meet their financial goals under any circumstances
Teaching financial literacy Ensuring clients (and their children or beneficiaries) are well-versed in the concepts impacting their financial well-being
Understanding and setting client goals Helping each client create and implement a plan to achieve their short-, medium-, and long-term goals
1
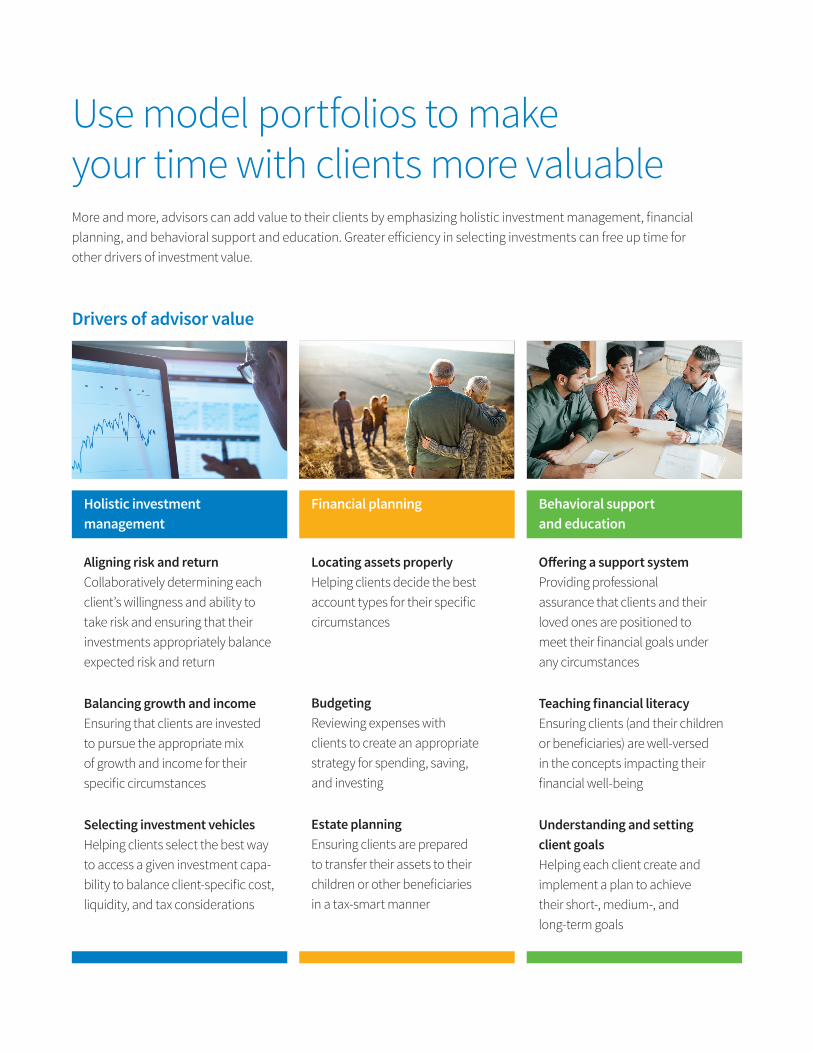
Manage your practice with greater efficiencyEvery practice faces the challenge of addressing complex client needs with limited time and resources. Advisors incorporating model portfolios into their practices can save valuable time to prospect, meet with clients, and otherwise grow their businesses.
Source: SEI, “The value of time,” 2016.Prior to making any investment or financial decisions, any recipients of this material should evaluate the overall fees and charges of the firm as well as the services provided. This information is not meant as tax or legal advice. Investors should consult a professional advisor before making investment and financial decisions and for more information on tax rules and other laws, which are complex and subject to change. Diversification does not assure a profit or protect against loss. It is possible to lose money in a diversified portfolio.
Compared with advisors focused on portfolio management, advisors who leverage model portfolios can pursue multiple advantages.
Spend 2x as much time with clients and prospects
Generate ~$100K in additional revenue each year
Attract 3–4x as many new clients each year
Reinvest in a business generating greater
revenue with a younger client base — 20% more
clients under age 50
2
Work with experienced multi-asset professionals
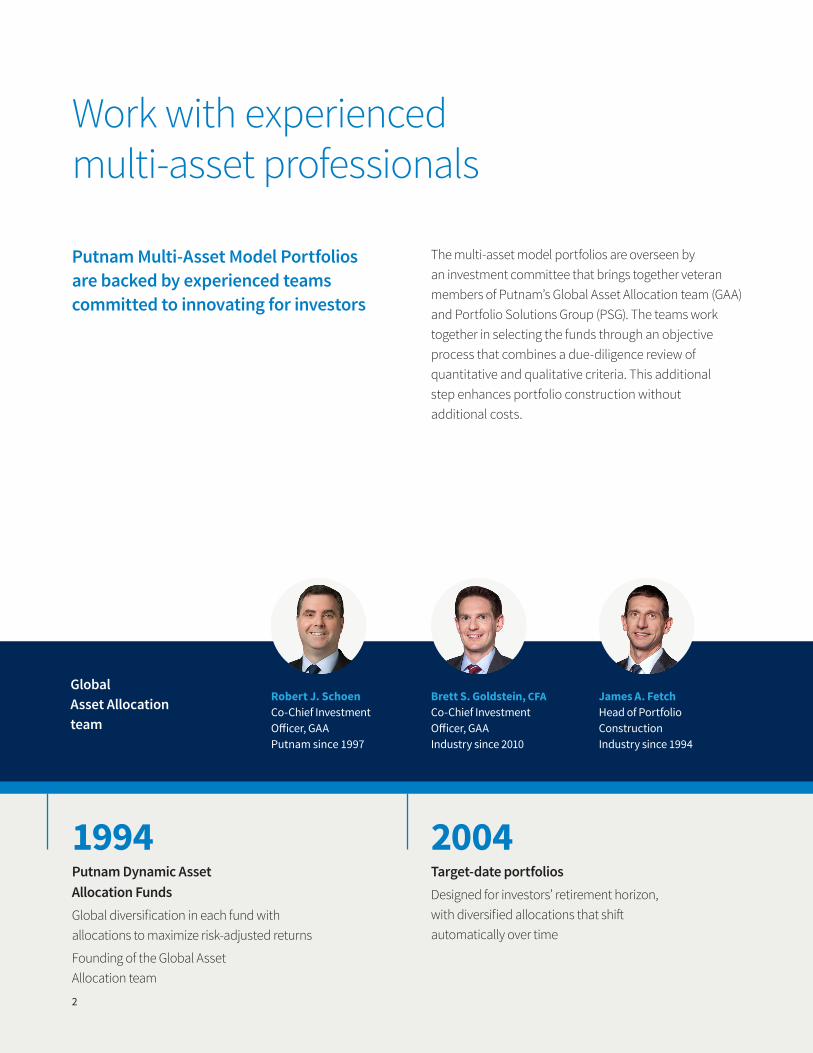
Putnam Multi-Asset Model Portfolios are backed by experienced teams committed to innovating for investors
The multi-asset model portfolios are overseen by an investment committee that brings together veteran members of Putnam’s Global Asset Allocation team (GAA)and Portfolio Solutions Group (PSG). The teams work together in selecting the funds through an objective process that combines a due-diligence review of quantitative and qualitative criteria. This additional step enhances portfolio construction without additional costs.
Robert J. SchoenCo-Chief Investment Officer, GAAPutnam since 1997
Global Asset Allocation team
James A. Fetch Head of Portfolio Construction Industry since 1994
Brett S. Goldstein, CFA Co-Chief Investment Officer, GAAIndustry since 2010
1994 Putnam Dynamic Asset Allocation FundsGlobal diversification in each fund with allocations to maximize risk-adjusted returns
Founding of the Global Asset Allocation team
2004 Target-date portfoliosDesigned for investors’ retirement horizon, with diversified allocations that shift automatically over time
3
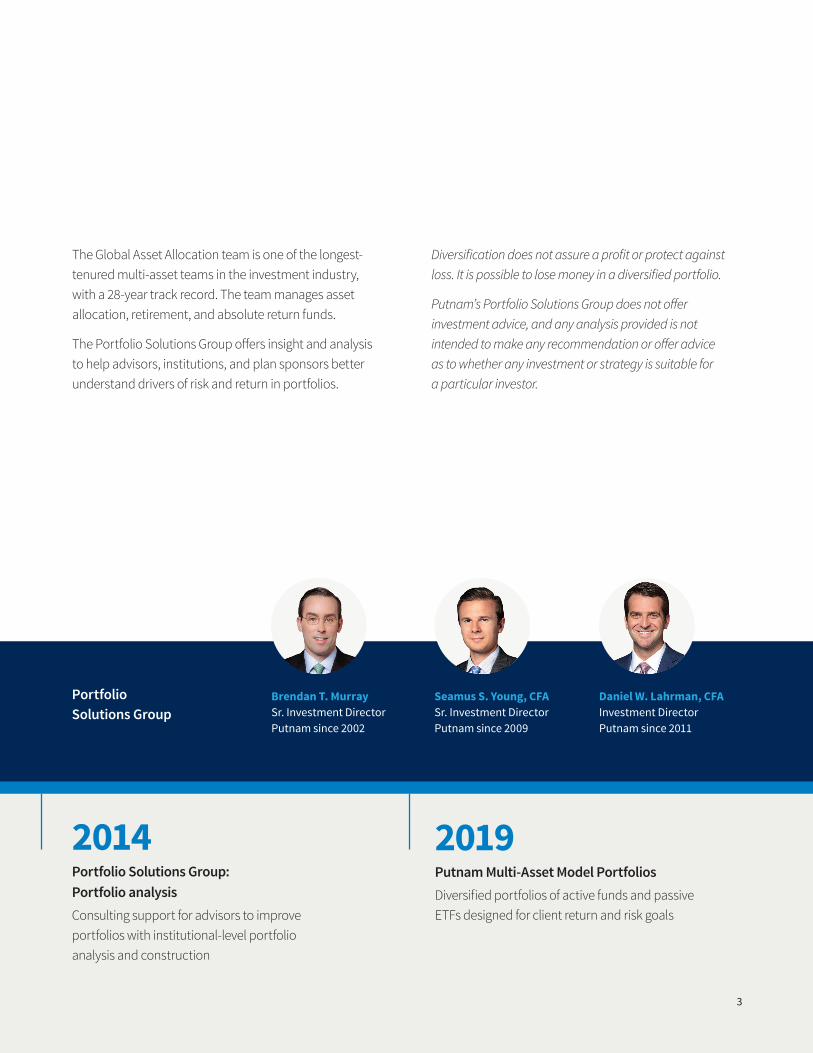
The Global Asset Allocation team is one of the longest-tenured multi-asset teams in the investment industry, with a 28-year track record. The team manages asset allocation, retirement, and absolute return funds.
The Portfolio Solutions Group offers insight and analysis to help advisors, institutions, and plan sponsors better understand drivers of risk and return in portfolios.
Diversification does not assure a profit or protect against loss. It is possible to lose money in a diversified portfolio.
Putnam’s Portfolio Solutions Group does not offer investment advice, and any analysis provided is not intended to make any recommendation or offer advice as to whether any investment or strategy is suitable for a particular investor.
Portfolio Solutions Group
Brendan T. MurraySr. Investment DirectorPutnam since 2002
Daniel W. Lahrman, CFAInvestment Director Putnam since 2011
Seamus S. Young, CFASr. Investment DirectorPutnam since 2009
2014 Portfolio Solutions Group: Portfolio analysisConsulting support for advisors to improve portfolios with institutional-level portfolio analysis and construction
2019 Putnam Multi-Asset Model PortfoliosDiversified portfolios of active funds and passive ETFs designed for client return and risk goals
4
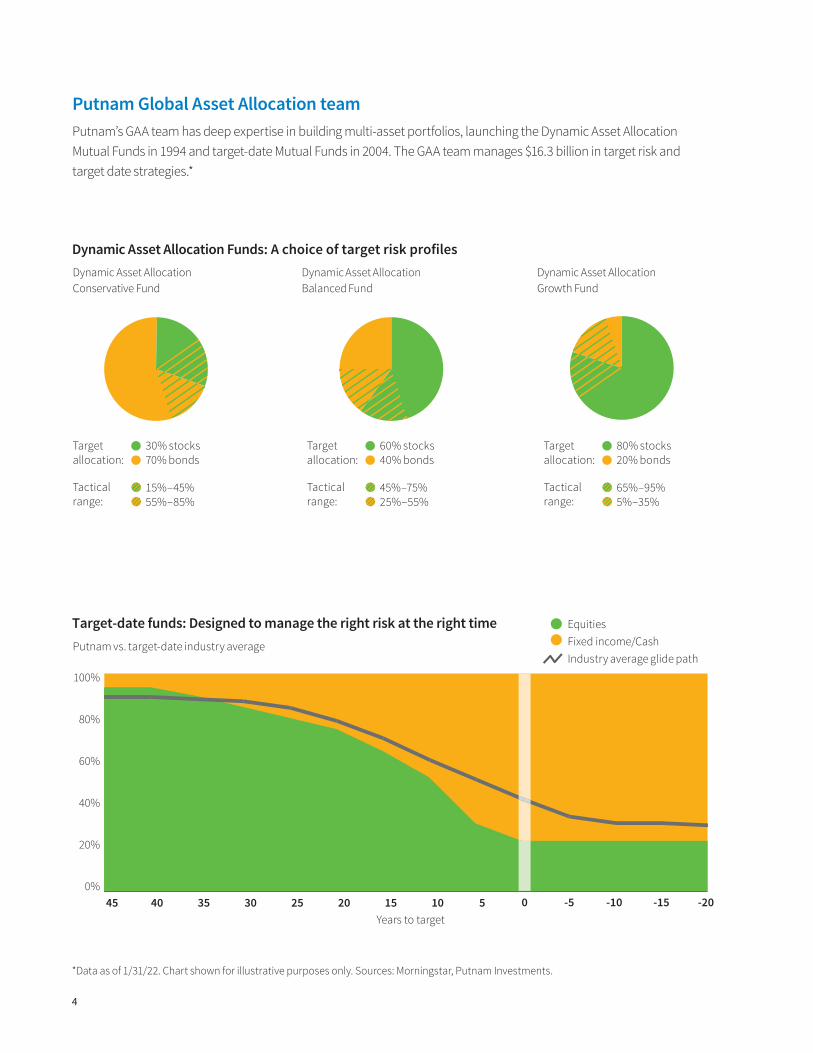
Putnam Global Asset Allocation teamPutnam’s GAA team has deep expertise in building multi-asset portfolios, launching the Dynamic Asset Allocation Mutual Funds in 1994 and target-date Mutual Funds in 2004. The GAA team manages $16.3 billion in target risk and target date strategies.*
<- MAIN mountain chart
<- “MAIN mountain chart -15%” layer to cover yellow lines
Years to target0 -5 -10 -15 -2051015202530354045
0%
20%
40%
60%
80%
100%
How to build “MAIN mountain chart” Pull Equity data from Excel
How to build “MAIN mountain chart -15%” Pull Equity data from Excel and subtract 15% from each row
How to build “MAIN mountain chart +15%” Pull Equity data from Excel and add 15% to each row,if new value exceeds 100%, use 100% as your value
Target allocation:
Tactical range:
Putnam vs. target-date industry average
15%–45%55%–85%
30% stocks 70% bonds
Target allocation:
Tactical range:
45%–75%25%–55%
60% stocks 40% bonds
Target allocation:
Tactical range:
65%–95%5%–35%
80% stocks 20% bonds
Dynamic Asset AllocationConservative Fund
Dynamic Asset AllocationBalanced Fund
Dynamic Asset AllocationGrowth Fund
Dynamic Asset Allocation Funds: A choice of target risk profiles
Target-date funds: Designed to manage the right risk at the right time EquitiesFixed income/CashIndustry average glide path
*Data as of 1/31/22. Chart shown for illustrative purposes only. Sources: Morningstar, Putnam Investments.
5
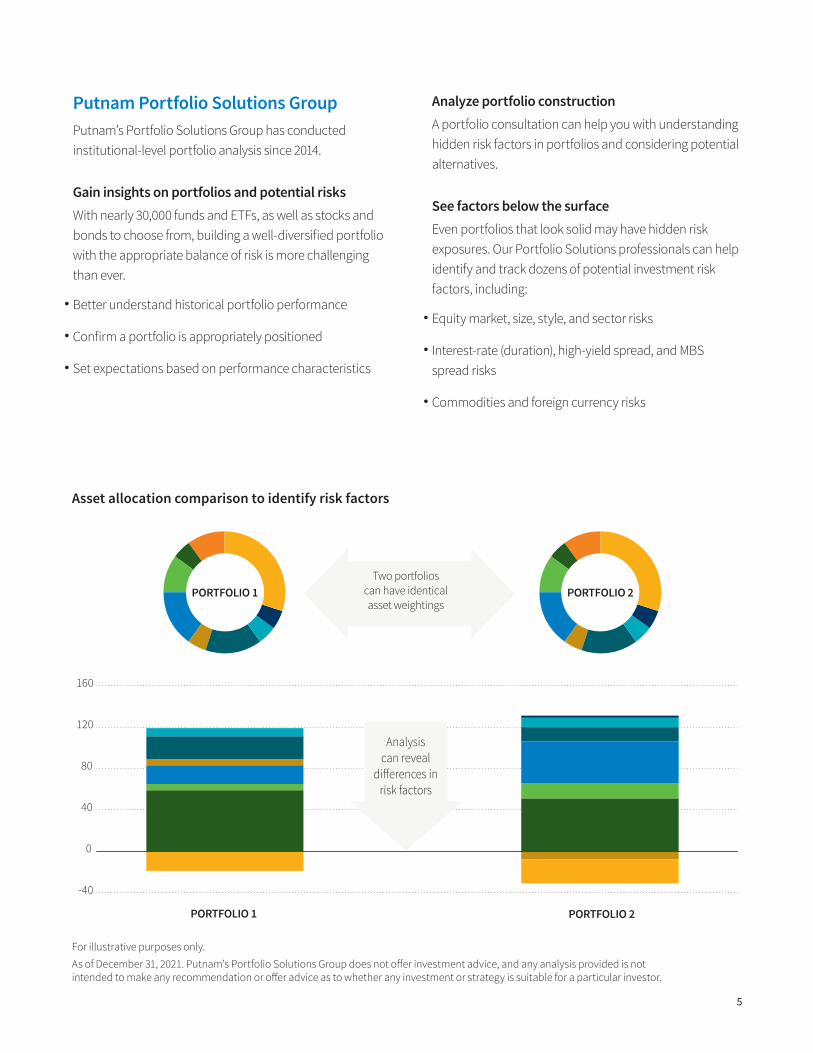
Putnam Portfolio Solutions GroupPutnam’s Portfolio Solutions Group has conducted institutional-level portfolio analysis since 2014.
Gain insights on portfolios and potential risksWith nearly 30,000 funds and ETFs, as well as stocks and bonds to choose from, building a well-diversified portfolio with the appropriate balance of risk is more challenging than ever.
•Better understand historical portfolio performance
•Confirm a portfolio is appropriately positioned
•Set expectations based on performance characteristics
Analyze portfolio constructionA portfolio consultation can help you with understanding hidden risk factors in portfolios and considering potential alternatives.
See factors below the surfaceEven portfolios that look solid may have hidden risk exposures. Our Portfolio Solutions professionals can help identify and track dozens of potential investment risk factors, including:
•Equity market, size, style, and sector risks
•Interest-rate (duration), high-yield spread, and MBS spread risks
•Commodities and foreign currency risks
-40
0
40
80
120
160
Two portfolios can have identical asset weightings
Asset allocation comparison to identify risk factors
Analysis can reveal
differences inrisk factors
PORTFOLIO 1 PORTFOLIO 2
PORTFOLIO 1 PORTFOLIO 2
For illustrative purposes only.As of December 31, 2021. Putnam’s Portfolio Solutions Group does not offer investment advice, and any analysis provided is not intended to make any recommendation or offer advice as to whether any investment or strategy is suitable for a particular investor.
6
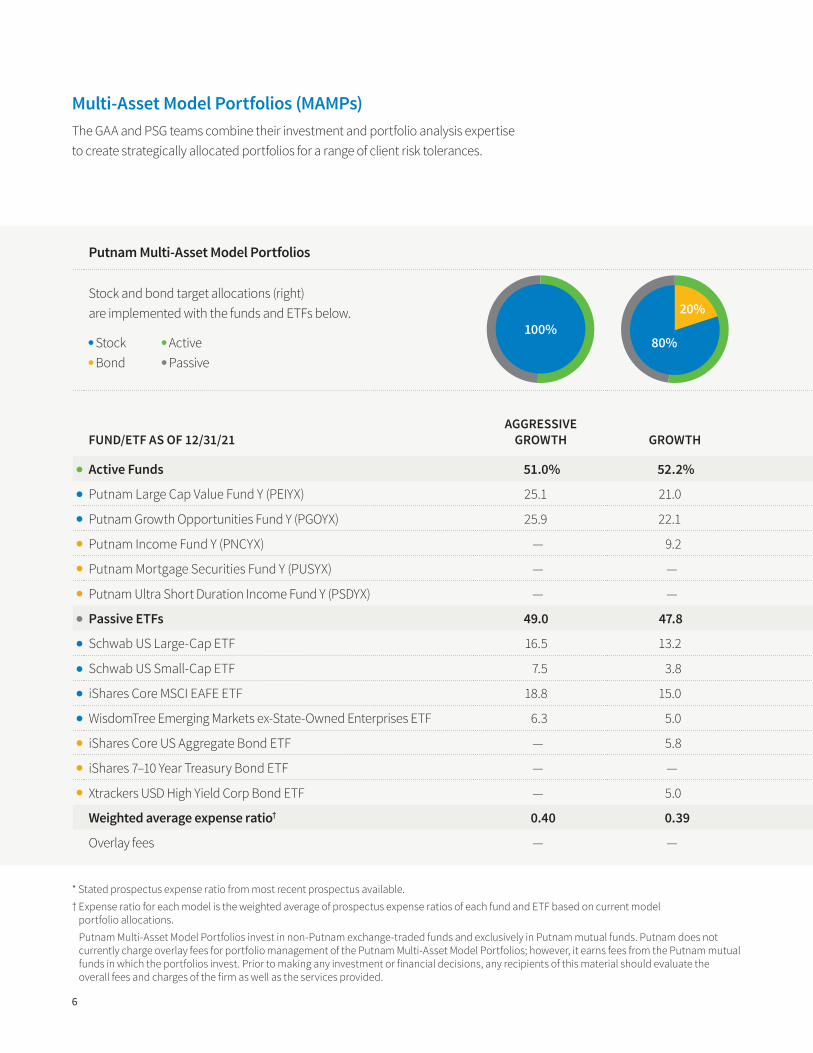
Multi-Asset Model Portfolios (MAMPs)The GAA and PSG teams combine their investment and portfolio analysis expertise to create strategically allocated portfolios for a range of client risk tolerances.
* Stated prospectus expense ratio from most recent prospectus available. † Expense ratio for each model is the weighted average of prospectus expense ratios of each fund and ETF based on current model
portfolio allocations.Putnam Multi-Asset Model Portfolios invest in non-Putnam exchange-traded funds and exclusively in Putnam mutual funds. Putnam does not currently charge overlay fees for portfolio management of the Putnam Multi-Asset Model Portfolios; however, it earns fees from the Putnam mutual funds in which the portfolios invest. Prior to making any investment or financial decisions, any recipients of this material should evaluate the overall fees and charges of the firm as well as the services provided.
Putnam Multi-Asset Model Portfolios
Stock and bond target allocations (right) are implemented with the funds and ETFs below.
Stock Active Bond Passive
FUND/ETF AS OF 12/31/21AGGRESSIVE
GROWTH GROWTHBALANCED GROWTH
CONSERVATIVE GROWTH
BALANCED INCOME INCOME
EXPENSE RATIO*
Active Funds 51.0% 52.2% 56.9% 60.5% 60.8% 59.9%
Putnam Large Cap Value Fund Y (PEIYX) 25.1 21.0 17.1 11.5 5.8 — 0.65%
Putnam Growth Opportunities Fund Y (PGOYX) 25.9 22.1 18.0 12.2 6.1 — 0.74
Putnam Income Fund Y (PNCYX) — 9.2 21.7 36.8 49.0 34.4 0.48
Putnam Mortgage Securities Fund Y (PUSYX) — — — — — 22.5 0.64
Putnam Ultra Short Duration Income Fund Y (PSDYX) — — — — — 3.0 0.30
Passive ETFs 49.0 47.8 43.1 39.5 39.2 40.1
Schwab US Large-Cap ETF 16.5 13.2 10.8 7.3 3.6 — 0.03
Schwab US Small-Cap ETF 7.5 3.8 3.1 2.1 1.0 — 0.04
iShares Core MSCI EAFE ETF 18.8 15.0 10.0 7.0 3.5 — 0.07
WisdomTree Emerging Markets ex-State-Owned Enterprises ETF 6.3 5.0 1.0 — — — 0.32
iShares Core US Aggregate Bond ETF — 5.8 13.3 17.2 18.0 13.6 0.05
iShares 7–10 Year Treasury Bond ETF — — — — — 6.5 0.15
Xtrackers USD High Yield Corp Bond ETF — 5.0 5.0 6.0 13.0 20.0 0.15
Weighted average expense ratio† 0.40 0.39 0.38 0.37 0.35 0.36
Overlay fees — — — — — —
20%
80%100%

7
Putnam Multi-Asset Model Portfolios are designed to provide broad diversification with targeted stock and bond allocations across multiple risk and return profiles. Each model portfolio is managed to contain approximate underlying fund exposures as shown. Target allocations can vary +/-10%. The invested Putnam model portfolio may differ from its target allocation due to market conditions and other factors. Allocations may not match a client’s actual experience from an account managed in accordance with the model portfolio allocation. Actual client accounts may differ from the model allocation and may hold cash. Asset allocation strategies do not assure a profit and do not protect against loss.
Putnam Multi-Asset Model Portfolios
Stock and bond target allocations (right) are implemented with the funds and ETFs below.
Stock Active Bond Passive
FUND/ETF AS OF 12/31/21AGGRESSIVE
GROWTH GROWTHBALANCED GROWTH
CONSERVATIVE GROWTH
BALANCED INCOME INCOME
EXPENSE RATIO*
Active Funds 51.0% 52.2% 56.9% 60.5% 60.8% 59.9%
Putnam Large Cap Value Fund Y (PEIYX) 25.1 21.0 17.1 11.5 5.8 — 0.65%
Putnam Growth Opportunities Fund Y (PGOYX) 25.9 22.1 18.0 12.2 6.1 — 0.74
Putnam Income Fund Y (PNCYX) — 9.2 21.7 36.8 49.0 34.4 0.48
Putnam Mortgage Securities Fund Y (PUSYX) — — — — — 22.5 0.64
Putnam Ultra Short Duration Income Fund Y (PSDYX) — — — — — 3.0 0.30
Passive ETFs 49.0 47.8 43.1 39.5 39.2 40.1
Schwab US Large-Cap ETF 16.5 13.2 10.8 7.3 3.6 — 0.03
Schwab US Small-Cap ETF 7.5 3.8 3.1 2.1 1.0 — 0.04
iShares Core MSCI EAFE ETF 18.8 15.0 10.0 7.0 3.5 — 0.07
WisdomTree Emerging Markets ex-State-Owned Enterprises ETF 6.3 5.0 1.0 — — — 0.32
iShares Core US Aggregate Bond ETF — 5.8 13.3 17.2 18.0 13.6 0.05
iShares 7–10 Year Treasury Bond ETF — — — — — 6.5 0.15
Xtrackers USD High Yield Corp Bond ETF — 5.0 5.0 6.0 13.0 20.0 0.15
Weighted average expense ratio† 0.40 0.39 0.38 0.37 0.35 0.36
Overlay fees — — — — — —
100%40%60% 60%
40%80%
20%
Targeted diversification to help investors pursue
their financial goals
Professional management by experienced
multi-asset team
A competitive cost structure with no
overlay fees
8
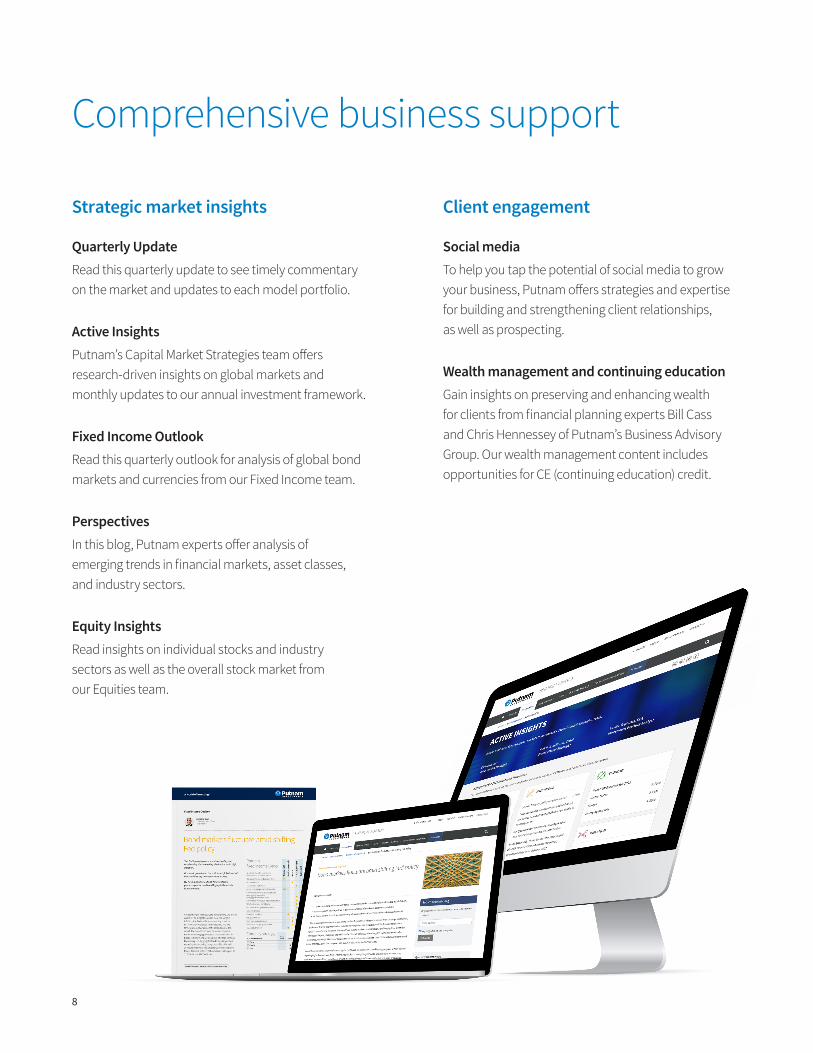
Comprehensive business support
Strategic market insights
Quarterly UpdateRead this quarterly update to see timely commentary on the market and updates to each model portfolio.
Active InsightsPutnam’s Capital Market Strategies team offers research-driven insights on global markets and monthly updates to our annual investment framework.
Fixed Income OutlookRead this quarterly outlook for analysis of global bond markets and currencies from our Fixed Income team.
PerspectivesIn this blog, Putnam experts offer analysis of emerging trends in financial markets, asset classes, and industry sectors.
Equity InsightsRead insights on individual stocks and industry sectors as well as the overall stock market from our Equities team.
Client engagement
Social mediaTo help you tap the potential of social media to grow your business, Putnam offers strategies and expertise for building and strengthening client relationships, as well as prospecting.
Wealth management and continuing educationGain insights on preserving and enhancing wealth for clients from financial planning experts Bill Cass and Chris Hennessey of Putnam’s Business Advisory Group. Our wealth management content includes opportunities for CE (continuing education) credit.

9
Contact Putnam to learn how our practice management specialists can help you take advantage of opportunities to grow your business.

Putnam Investments | 100 Federal Street | Boston, MA 02110 | putnam.com PB001_MP 328436 3/22
This material is for informational and educational purposes only. It is not a recommendation of any specific investment product, strategy, or decision, and is not intended to suggest taking or refraining from any course of action. It is not intended to address the needs, circumstances, and objectives of any specific investor. Putnam, which earns fees when clients select its products and services, is not offering impartial advice in a fiduciary capacity in providing this sales and marketing material.
Putnam’s role is limited to providing your financial profes-sional with non-discretionary investment advice in the form of model portfolios in connection with its management of its clients’ accounts. By receiving and reviewing this material, the recipient acknowledges the following: This material is a general communication being provided for informational and educational purposes only. It is not designed to be a recommendation of any specific investment product, strategy, or decision, and is not intended to suggest taking or refraining from any course of action. This information should not be relied upon as investment advice, research, or a recommendation by Putnam Investments regarding the use or suitability of the Putnam Multi-Asset Model Portfolios. The material was not prepared, and is not intended, to address the needs, circumstances, and objectives of any specific institution, plan, or individual(s). Putnam is not providing advice in a fiduciary capacity under applicable law in providing this material, which should not be viewed as impartial, because it is provided as part of the general marketing and advertising activities of Putnam, which earns fees when clients select its products and services. This information is not customized or individualized based on a client’s particular needs (such as investment objectives, strategies, tax status, or investment horizon), and should not be relied on as a basis for investment decisions. The views and strategies described herein may not be suitable for all investors.
Putnam Multi-Asset Model Portfolios or any other model portfolio included in this material are not personalized investment advice or an investment recommendation from Putnam and are intended for use only by financial professionals, with other information, as a resource to help build a portfolio or as an input in the development of investment advice for its own clients. The implementation of, or reliance on, a model portfolio strategy is left to the discretion of the financial professional. Such financial
professionals are responsible for making their own indepen-dent judgment as to how to use Putnam’s Multi-Asset Model Portfolios. Putnam does not have investment discretion over or place trade orders for any portfolios or accounts derived from the Putnam Multi-Asset Model Portfolios. There is no guarantee that any investment strategy will be successful or achieve any particular level of results.
Investing involves risk, including the loss of principal. Risks apply to those underlying funds in the allocation of the models; there is no guarantee the funds’ investment objec-tives will be achieved. Carefully consider the funds within the model portfolios’ investment objectives, risk factors, and charges and expenses before investing. This and other infor-mation can be found in the funds’ prospectuses, which may be obtained by visiting the respective fund information page or fund family website. Our allocation of investments among the underlying funds may hurt performance. Therefore, the model portfolio’s performance is subject to the risks that may affect the performance of the underlying funds. In addition, investors will bear the fees and expenses of the underlying funds included in the models.
Each Retirement Advantage Fund has a different target date indicating when the fund’s investors expect to retire and begin withdrawing assets from their account, typically at retirement. The dates range from 2025 to 2065 in five-year intervals, with the exception of the Maturity Fund, which is designed for investors at or near retirement. The funds are generally weighted more heavily toward more aggressive, higher-risk investments when the target date of the fund is far off, and more conservative, lower-risk investments when the target date of the fund is near. This means that both the risk of your investment and your potential return are reduced as the target date of the particular fund approaches, although there can be no assurance that any one fund will have less risk or more reward than any other fund. The principal value of the funds is not guaranteed at any time, including the target date.
This material or any portion hereof may not be reprinted, sold, or redistributed in whole or in part without the express written consent of Putnam Investments. The information provided relates to Putnam Investments and its affiliates, which include Putnam Investment Management, LLC and The Putnam Advisory Company, LLC.


![Class 8 The Capital Asset Pricing Model. Efficient Portfolios with Multiple Assets E[r] 0 Asset 1 Asset 2 Portfolios of Asset 1 and Asset 2 Portfolios](https://img.pdfslide.net/doc/110x75/56649e505503460f94b4758c/class-8-the-capital-asset-pricing-model-efficient-portfolios-with-multiple.jpg)