Embed Size (px)
Citation preview
Sustainable Cities and Society 66 (2021) 102634
Available online 11 December 20202210-6707/© 2020 Elsevier Ltd. All rights reserved.
PV sharing in local communities: Peer-to-peer trading under consideration of the prosumers’ willingness-to-pay
Theresia Perger *, Lukas Wachter, Andreas Fleischhacker, Hans Auer Energy Economics Group (EEG), TU Wien, Gusshausstrasse 25-29/E370-3, 1040 Wien, Austria
A R T I C L E I N F O
Keywords: Energy communities Low-carbon society Peer-to-peer trading Optimization model PV sharing Willingness-to-pay
A B S T R A C T
Distributed on-site PV generation enables traditional consumers to become active participants in a decentralized energy system. In this work, a linear program optimizing peer-to-peer trading between prosumers of a local energy community with PV systems and battery energy storage systems (BESSs) is developed. The community members are characterized by their individual willingness-to-pay for purchasing PV electricity generated by the community, which reflects their ambitions to reduce marginal emissions from the grid. By adding the willingness-to-pay, prosumers do not prefer their own PV generation over the community’s generation. The objective function of the optimization model maximizes the social welfare, which means maximizing the self- consumption of the entire community and optimally allocating generation between prosumers. The method is applied to community set-ups including households and small businesses. Results of an arbitrary case-study show improvements in the overall profitability of the PV systems and BESSs. BESSs further decrease imports from the grid by 15% due to flexibilities. The willingness-to-pay is a promising tool to save marginal emissions from the grid, and the case-study shows annual savings of up to 38%. The results show that the community set-up is able to sustain without any subsidies and it can compete in the electricity market.
1. Introduction
Anthropogenic climate change is detrimental to humanity, wildlife, and ecosystems. The Intergovernmental Panel on Climate Change (IPCC) has advised that to combat the impacts of global warming, greenhouse gas (GHG) emissions must be substantially reduced (Masson-Delmotte et al. (2018)). Globally, most of the energy used for electricity, heating and cooling, transport, and in the industry sector is generated by the combustion of fossil fuels. Switching to renewable energy is a major part of the solution toward sustainability. In addition to the generation of hydro power, it is anticipated that a large share will be provided by wind and photovoltaic generation (see International Energy Agency (2018)).
Photovoltaic (PV) electricity generation on a ground-mounted utility scale and via building attached/-integrated PV systems has become increasingly prevalent in recent years. Notably, on-site PV electricity generation in the building environment accelerates the transition from a centralized energy system to a sustainable, decentralized, and local one. The importance of sustainable energy communities is growing, and the European Union’s Clean Energy Package explicitly mentions energy communities, and acknowledges their great potential
(Directorate-General for Energy (European Commission), 2019). Par-ticipants in energy communities are referred to as prosumers. Prosumers are the simultaneous local producers and consumers of renewable en-ergy; they share the renewable energy within the community and are active participants in the energy system. This paper focuses on energy communities that go beyond the meter and are not limited to a closed system boundary, such as a multi-apartment building or microgrid. Instead, the participants are located in different buildings, and they match and trade their PV generation and demand profiles via a local public distribution grid. However, it is necessary for the matching and trading algorithm to be governed by certain specifications and detailed rules. Most European countries currently lack a legal framework for this type of energy community, unlike for tenant electricity sharing models in multi-apartment buildings that are implemented in certain European countries such as Austria and Germany.
In the sense of “energy democratization,” participation in an energy community occurs on a voluntary basis, and different incentives are offered to prosumers to entice them to join. In this respect, such in-centives are reflected in the individual willingness-to-pay of each pro-sumer: the stronger the preference to buy local PV generation, the higher the willingness-to-pay. A model is developed in this study that optimizes
* Corresponding author. E-mail address: [email protected] (T. Perger).
Contents lists available at ScienceDirect
Sustainable Cities and Society
journal homepage: www.elsevier.com/locate/scs
https://doi.org/10.1016/j.scs.2020.102634 Received 14 May 2020; Received in revised form 23 October 2020; Accepted 24 November 2020
Sustainable Cities and Society 66 (2021) 102634
2
peer-to-peer (PtP) trading in an energy community while respecting the willingness-to-pay for local PV generation of individual prosumers. The aim of the energy community is not self-sufficiency, as the members of the community are connected to the public grid and they purchase part of their electricity from the retailer. Instead, the aim of the energy community is to optimally use the resources and thus sustain without requiring any governmental financial support or subsidies.
The paper is structured as follows: Section 2 reviews the state-of-the- art types of PV sharing, energy communities, and PtP trading and the contribution beyond state-of-the-art of the study is outlined. Section 3 describes the methodology and the optimization model developed and applied in this work. Sections 4 and 5 present the results of different use cases and sensitivity analyses, respectively, and Section 6 presents the conclusions and future outlook.
2. State of the art
This section reviews and discusses the current state-of-the-art energy communities and PtP trading reported in scientific literature. Section 2.1 provides an overview of prosumers and sustainable communities/dis-tricts. The differences between energy communities and microgrids are defined in Section 2.2, and the legal framework of energy communities is explained. Section 2.3 presents the current state-of-the-art of PV sharing in buildings and beyond single buildings, and Section 2.4 pro-vides examples of real-life peer-to-peer trading implementations. Finally, Section 2.5 concludes this chapter by presenting the own contribution beyond state-of-the-art.
2.1. Prosumers and sustainable communities
The push for a transition to a renewable-based, decentralized, energy system has mainly been made by the increasing number of prosumers with PV systems, raising new challenges and opportunities at the same time. For example, the study of Marzband, Fouladfar, Akorede,
Lightbody, and Pouresmaeil (2018) shows how prosumers can partici-pate in the electricity market by using home-microgrids. Golmohamadi, Keypour, Bak-Jensen, and Pillai (2019) provide an optimization of the household energy demand of prosumers toward the day-ahead market price, and the challenges of the low voltage network of future smart communities with a high share of prosumers are analyzed in Marszal--Pomianowska, de Cerio Mendaza, Bak-Jensen, and Heiselberg (2019).
Furthermore, the study of Reynolds, Rezgui, and Hippolyte (2017) presents upscaling from the prosumer level to the active participation of buildings within a wider district-level context, and Petersen (2016) analyzes a city in northern Germany to determine how existing districts or communities could become more sustainable and meet climate tar-gets at a local level. Walnum et al. (2019) present a case study of smart communities in Norway, and the study of Leal and Azevedo (2016) is based on districts in Porto, Portugal. Furthermore, a review of the different modeling approaches applied in urban areas (so-called “urban-scale energy modeling (USEM) tools”) can be found in Sola, Corchero, Salom, and Sanmarti (2020).
The concept of local energy communities is essential for meeting climate targets at a community level. The next few sections therefore investigate state-of-the-art concepts in relation to local energy communities.
2.2. Energy communities versus microgrids
The concept of an energy community is fundamentally different to the concept of a microgrid. A microgrid is a physical distribution grid, or a defined part of a distribution grid, and all connected consumers and producers are part of the microgrid. A microgrid is part of the distri-bution grid, and it can still be “disconnected and independently operated” (see Rakos, Stumpf, and Nagy (2012)). Ali et al. (2017) investigate the policies, incentives, and barriers associated with microgrids in the EU, US, and China, and further definitions, state-of-the-art, and case studies are found in Hossain, Kabalci, Bayindir, and Perez (2014), Hirsch, Parag, and Guerrero (2018), and Mohseni and Moghaddas-Tafreshi (2018).
In contrast, an energy community is not necessarily physically con-strained to a certain area, and participation is on a voluntary basis. Literature provides different definitions of energy communities. For example, Gui and MacGill (2018) provide a very broad definition of an energy community as a social structure that has the primary goal of ensuring a cleaner energy supply, and the context may also be extended to water, transportation, and waste management. They also introduce several concepts and typologies relating to energy communities, such as community-scale energy projects, virtual power plants (VPPs), PtP trading, community microgrids, and integrated community energy sys-tems (ICES).
In Europe, a legal framework has recently been set by the European Commission that promotes active consumer and prosumer participation, self-consumption, and energy communities (see Clean Energy Package Directorate-General for Energy (European Commission) (2019)), and the regulatory frameworks of different EU countries are presented in Campos et al. (2020). The European Commission introduced the legal terms Renewable Energy Community (REC) and Citizen Energy Community (CEC) in the 2018 Recast Renewable Energy Directive (REDII, see Euro-pean Commission (2018)) and the 2019 Electricity Directive (ED, see European Commission (2019)), respectively. Both REC and CEC are legal entities, where members are private persons, small businesses, or local institutions, and participation is on an open and voluntary basis. Both RECs and CECs should offer environmental, economic, or social benefits for the community, and they do not primarily promote financial profits. For the main differences between RECs and CECs, please refer to Urbantschitsch (2020) and COMPILE (2019).
2.3. PV sharing and peer-to-peer trading
With a reduction in (or phasing out of) subsidized feed-in tariffs in
Nomenclature
t ∈ 𝒯 = {1,…,T} Time steps i ∈ ℐ = {1,…,N} Index of the prosumers
Input qPV
i,t PV generation of prosumer i kWh qload
i,t Demand of prosumer i kWh SoCmax
i Maximum capacity of prosumer i’s battery kWh qBmax
i Maximum (dis)charging power of prosumer i’s battery kW
ηB Efficiency of the batteries wj Prosumer j’s weighting factor for marginal emissions
EUR/tCO2 wtpi,j,t Willingness-to-pay of prosumer j EUR/kWh pGin
t Average spot market electricity price EUR/kWh pGout
t Retailer’s electricity price EUR/kWh et Marginal emissions from the grid tCO2/kWh
Output qGin
i,t Purchase of prosumer i from the grid kWh
qGouti,t Sales from prosumer i to the grid kWh
qsharei,j,t Purchase of prosumer j from prosumer i kWh
qBini,t Charging of prosumer i’s battery kWh
qBouti,t Discharging of prosumer i’s battery kWh
SoCi,t State of charge of prosumer i’s battery kWh
T. Perger et al.
Sustainable Cities and Society 66 (2021) 102634
3
many countries, it is necessary to increase the self-consumption of PV generated electricity, to ensure that PV systems are profitable. The load aggregation of multiple prosumers could therefore further increase profitability, and tenant electricity models play a key role in this respect. The study of Fina, Fleischhacker, Auer, and Lettner (2018) analyzes sharing generated PV in multi-apartment buildings, and that of Roberts et al., 2019a compares different arrangements, with the aim of maxi-mizing the value of PV in apartment buildings. The subsequent study of Roberts et al., 2019b evaluates the impact of using a shared battery energy storage system (BESS) in apartment buildings. Both a welfare maximization and a game-theoretic model for PV sharing in a multi-apartment building are developed in Fleischhacker, Auer, Lettner, and Botterud (2019), and multi-objective optimization for retrofitting an apartment (building including rooftop PV systems) is modeled in Fan and Xia (2017).
To go beyond a single building (and therefore beyond the meter), energy communities and PtP trading play a major role in managing the assets of distributed energy resources (DERs). Lüth, Zepter, del Granado, and Egging (2018) analyze battery flexibility in communities of pro-sumers and consumers, and Tascikaraoglu (2018) analyzes shared en-ergy storage in neighborhood networks. Furthermore, the study of Zepter, Lüth, del Granado, and Egging (2019) develops an interface to integrate communities of small prosumers into the day-ahead and intraday markets. Multiple home energy hubs in neighborhood grids are analyzed in Gholinejad, Loni, Adabi, and Marzband (2020), and virtual energy hubs within local markets (including thermal energy) are pre-sented in Jadidbonab, Mohammadi-Ivatloo, Marzband, and Siano (2020). Energy communities are very diverse, and their sizes, the number of actors involved, and the rules of sharing electricity are not standardized. The potential of energy communities for different settle-ment patterns is examined in Fina, Auer, and Friedl (2019). In Abada, Ehrenmann, and Lambin (2020), the viability of energy communities is shown to strongly depend on the rules for sharing electricity among the members. Sharing electricity within a community has a higher potential to reduce GHG emissions than prosumers who act individually, as shown in Schram, Louwen, Lampropoulos, and van Sark (2020), and PtP trading concepts with product differentiation are presented in Sorin, Bobo, and Pinson (2019) and Orlandini, Soares, Sousa, and Pinson (2019).
The incentives for German households to participate in PtP trading, as well as PtP pricing schemes, are studied in Hackbarth and Lobbe (2020), and the trading preferences and decision strategies in PtP trading are evaluated in Hahnel, Herberz, Pena-Bello, Parra, and Brosch (2020). To provide maximum profits, the study of An, Lee, Yeom, and Hong (2020) examines the optimal pricing strategies for the prosumer and consumer and their PtP trading partners, and a simulation of a PtP bidding system is conducted in Zhang, Wu, Zhou, Cheng, and Long (2018). Furthermore, Sousa et al. (2019) suggest that PtP trading currently means either: (i) sharing of the excess renewable generation within a community, or (ii) buying electricity directly from a local renewable generator.
2.4. Practical peer-to-peer trading implementations
Park and Yong (2017) introduce PtP trading concepts and provide a comparative review. Zhang, Wu, Long, and Cheng (2017) also review different PtP trading concepts, for example that of Piclo in the UK (see Piclo. (2020)), the Brooklyn Microgrid (Mengelkamp et al. (2018) and Microgrid (2020)), and Vandebron in the Netherlands (see Vandebron. (2020)). Customers using Piclo buy local renewable electricity and generators have full transparency on a half-hourly basis. The Exergy platform of the Brooklyn Microgrid allows the prosumer to conduct autonomous electricity transactions almost in real time. Vandebron al-lows producers of renewables to set their own prices, and consumers then select a supplier. OurPower is a platform for producers and con-sumers of renewable, decentralized electricity that is implemented by an
Austrian energy cooperative (see OurPower. (2020)), and the project P2PQ optimizes PV self-consumption and tests PtP trading concepts via blockchain (see open4innovation. (2018)). The sonnenCommunity (see sonnenGroup (2020)) in Germany, Austria, Switzerland, and Italy allows prosumers to share their electricity with other members of the sonnen-Community, and members of this community do not need to also use a conventional electricity provider. In addition, people who join efriends can invest in PV projects of SMEs and subsequently buy renewable PV generation from there (see eFriends Energy GmbH (2020)). Other recent projects are presented by BestRES (see BestRES (2018)).
2.5. Progress beyond state-of-the-art
This work presents a method for distributing generated PV power within energy communities that involves voluntary participation. The allocation mechanism uses a PtP trading concept that considers each member’s individual willingness-to-pay. The contribution of this paper beyond state-of-the-art is outlined as follows:
• The prosumers not only share their PV surplus with the community, but the total amount of PV electricity generation is PtP traded within the community to optimally allocate resources while respecting each of the member’s willingness-to-pay. In this respect, prosumers can create a greater profit margin by selling their PV electricity genera-tion to community members who have a higher willingness-to-pay. In addition, prosumers who are interested in minimizing their environmental footprint can purchase greater amounts of clean PV electricity generation. Many different nuances between profit maximization and emission minimization are also possible.
• Ultimately, this concept means that prosumers do not prefer their own PV electricity generation over other prosumers’ PV generation and it paves the way for energy communities to attain a sharing economy.
• The individual willingness-to-pay of each community member is a very comprehensible function that is derived directly from GHG emissions having an equivalent CO2 price in EUR/tCO2. It is a price that prosumers are willing to pay on top of the electricity price and is their individual and voluntary contribution to emission reduction targets.
• Prosumers are therefore able to calculate the reduction in direct emissions (in tons of CO2) that is a result of them sharing PV generated electricity. The willingness-to-pay is derived considering marginal emissions which in turn reflect the actual hourly emission savings. With the proposed method, prosumers can individually ac-count for their environmental impact and footprint.
3. Methodology
This section explains the methodology and the optimization model used to obtain the results presented in this paper. The section starts with an introduction and overview of the model in Section 3.1, followed by a detailed mathematical description in Section 3.2. Model implementation parameters and data are presented in Section 3.3, and model validation is shown in Section 3.4.
3.1. Introducing the optimization model FRESH:COM
The linear optimization model developed in this work1 is described in detail in this section. In general, local energy communities with the following properties are considered:
1 Acronym of the model: FRESH:COM (FaiR Energy SHaring in local COM-munities). The model is currently being developed in the Horizon 2020 project openENTRANCE (see https://openentrance.eu).
T. Perger et al.
Sustainable Cities and Society 66 (2021) 102634
4
• Members of the community are either consumers, producers, or both (prosumers). For simplicity, all members are referred to as prosumers throughout the paper.
• The members are regular households, or small-to-medium-sized en-terprises (SMEs).
• The incentives for participants to join the energy community vary between (i) consuming local PV electricity, (ii) contributing to increasing the community’s self-consumption, (iii) improving the PV system’s profitability, (iv) avoiding emissions, and (v) others.
• The community is based on fully democratic participation. Joining or leaving the energy community is on a voluntary basis, and the willingness-to-pay for the community’s generated PV electricity is individually set (the minimum price is equal to the retail electricity price).
• The technology portfolio includes PV and BESS. • Each household is connected to the public distribution grid, which is
used to conduct PtP trading. The case presented in this paper is a set- up in which all the prosumers are located in the same section of the local distribution system.
• The objective function of the model maximizes the community’s social welfare, and this is expressed in monetary terms.
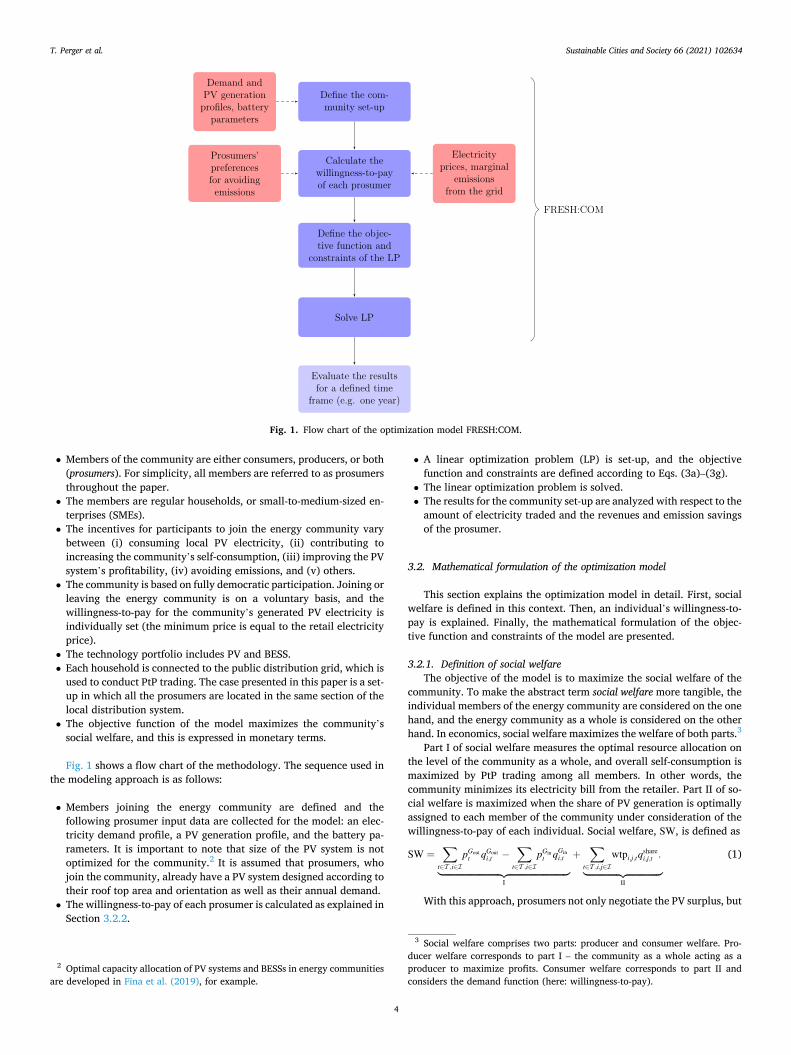
Fig. 1 shows a flow chart of the methodology. The sequence used in the modeling approach is as follows:
• Members joining the energy community are defined and the following prosumer input data are collected for the model: an elec-tricity demand profile, a PV generation profile, and the battery pa-rameters. It is important to note that size of the PV system is not optimized for the community.2 It is assumed that prosumers, who join the community, already have a PV system designed according to their roof top area and orientation as well as their annual demand.
• The willingness-to-pay of each prosumer is calculated as explained in Section 3.2.2.
• A linear optimization problem (LP) is set-up, and the objective function and constraints are defined according to Eqs. (3a)–(3g).
• The linear optimization problem is solved. • The results for the community set-up are analyzed with respect to the
amount of electricity traded and the revenues and emission savings of the prosumer.
3.2. Mathematical formulation of the optimization model
This section explains the optimization model in detail. First, social welfare is defined in this context. Then, an individual’s willingness-to- pay is explained. Finally, the mathematical formulation of the objec-tive function and constraints of the model are presented.
3.2.1. Definition of social welfare The objective of the model is to maximize the social welfare of the
community. To make the abstract term social welfare more tangible, the individual members of the energy community are considered on the one hand, and the energy community as a whole is considered on the other hand. In economics, social welfare maximizes the welfare of both parts.3
Part I of social welfare measures the optimal resource allocation on the level of the community as a whole, and overall self-consumption is maximized by PtP trading among all members. In other words, the community minimizes its electricity bill from the retailer. Part II of so-cial welfare is maximized when the share of PV generation is optimally assigned to each member of the community under consideration of the willingness-to-pay of each individual. Social welfare, SW, is defined as
SW =∑
t∈𝒯 ,i∈ℐ
pGoutt qGout
i,t −∑
t∈𝒯 ,i∈ℐ
pGint qGin
i,t
⏟ ⏞⏞ ⏟I
+∑
t∈𝒯 ,i,j∈ℐ
wtpi,j,tqsharei,j,t .
⏟ ⏞⏞ ⏟II
(1)
With this approach, prosumers not only negotiate the PV surplus, but
Fig. 1. Flow chart of the optimization model FRESH:COM.
2 Optimal capacity allocation of PV systems and BESSs in energy communities are developed in Fina et al. (2019), for example.
3 Social welfare comprises two parts: producer and consumer welfare. Pro-ducer welfare corresponds to part I – the community as a whole acting as a producer to maximize profits. Consumer welfare corresponds to part II and considers the demand function (here: willingness-to-pay).
T. Perger et al.
Sustainable Cities and Society 66 (2021) 102634
5
the entire amount of PV electricity generated is traded within the community, without preference for self-consumption, and solely ac-cording to each individual’s willingness-to-pay. As willingness-to-pay also depends on avoiding GHG emission, social welfare indirectly in-cludes emission preferences.
3.2.2. Defining willingness-to-pay As explained above, the willingness-to-pay of an individual de-
termines how much PV generated electricity is shared between the community members and how it is distributed. The main idea behind the willingness-to-pay above the retail electricity price for purchases from the grid relates to an individual’s preference for reducing marginal emissions from the grid. Similar to marginal costs, marginal emissions are emitted when another unit of electricity (kWh or MWh) is produced in the wider electricity system, and the time variant vector et (in t CO2/ kWh) represents the marginal emissions. This means that the GHG emissions from a marginal power plant are considered instead of the average emission factor. Each prosumer, j, can choose an individual weighting factor, wj, (in EUR/t CO2), which represents the amount they are willing to pay on top of the retailer’s price, because marginal emissions will be avoided by buying the locally produced PV generated electricity.
The willingness-to-pay can thus be determined in relation to the retailer’s electricity price, pGin
t , plus the premium for avoiding emissions as a product of the individual weighting factor, wj, and the marginal emissions, et, as
wtpi,j,t = pGint + wj⋅et (2)
qsharei,j,t is therefore distributed according to the emission factor wj of each
prosumer. Ultimately, this means that prosumers do not prefer their own PV generation over other prosumers’ PV generation.
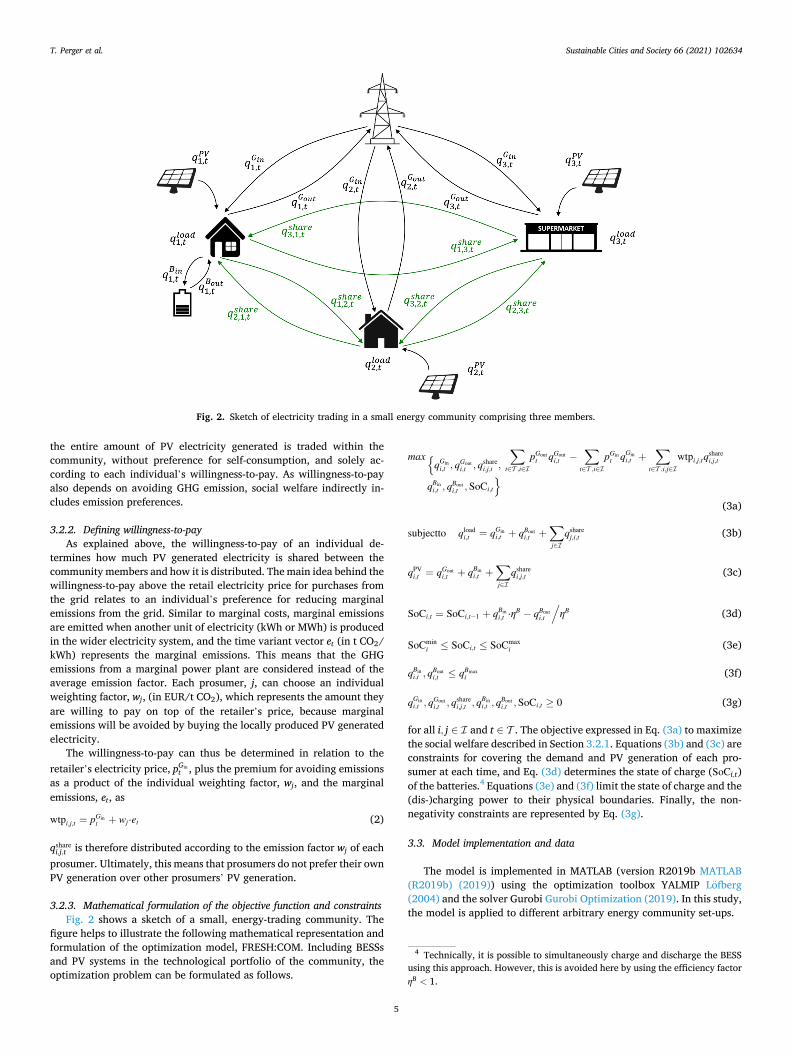
3.2.3. Mathematical formulation of the objective function and constraints Fig. 2 shows a sketch of a small, energy-trading community. The
figure helps to illustrate the following mathematical representation and formulation of the optimization model, FRESH:COM. Including BESSs and PV systems in the technological portfolio of the community, the optimization problem can be formulated as follows.
max{qGin
i,t , qGouti,t , qshare
i,j,t ,
qBini,t , qBout
i,t , SoCi,t
}
∑
t∈𝒯 ,i∈ℐ
pGoutt qGout
i,t −∑
t∈𝒯 ,i∈ℐ
pGint qGin
i,t +∑
t∈𝒯 ,i,j∈ℐ
wtpi,j,tqsharei,j,t
(3a)
subjectto qloadi,t = qGin
i,t + qBouti,t +
∑
j∈ℐqshare
j,i,t (3b)
qPVi,t = qGout
i,t + qBini,t +
∑
j∈ℐqshare
i,j,t (3c)
SoCi,t = SoCi,t− 1 + qBini,t ⋅ηB − qBout
i,t
/ηB (3d)
SoCmini ≤ SoCi,t ≤ SoCmax
i (3e)
qBini,t , q
Bouti,t ≤ qBmax
i (3f)
qGini,t , qGout
i,t , qsharei,j,t , qBin
i,t , qBouti,t ,SoCi,t ≥ 0 (3g)
for all i, j ∈ ℐ and t ∈ 𝒯 . The objective expressed in Eq. (3a) to maximize the social welfare described in Section 3.2.1. Equations (3b) and (3c) are constraints for covering the demand and PV generation of each pro-sumer at each time, and Eq. (3d) determines the state of charge (SoCi,t) of the batteries.4 Equations (3e) and (3f) limit the state of charge and the (dis-)charging power to their physical boundaries. Finally, the non- negativity constraints are represented by Eq. (3g).
3.3. Model implementation and data
The model is implemented in MATLAB (version R2019b MATLAB (R2019b) (2019)) using the optimization toolbox YALMIP Lofberg (2004) and the solver Gurobi Gurobi Optimization (2019). In this study, the model is applied to different arbitrary energy community set-ups.
Fig. 2. Sketch of electricity trading in a small energy community comprising three members.
4 Technically, it is possible to simultaneously charge and discharge the BESS using this approach. However, this is avoided here by using the efficiency factor ηB < 1.
T. Perger et al.
Sustainable Cities and Society 66 (2021) 102634
6
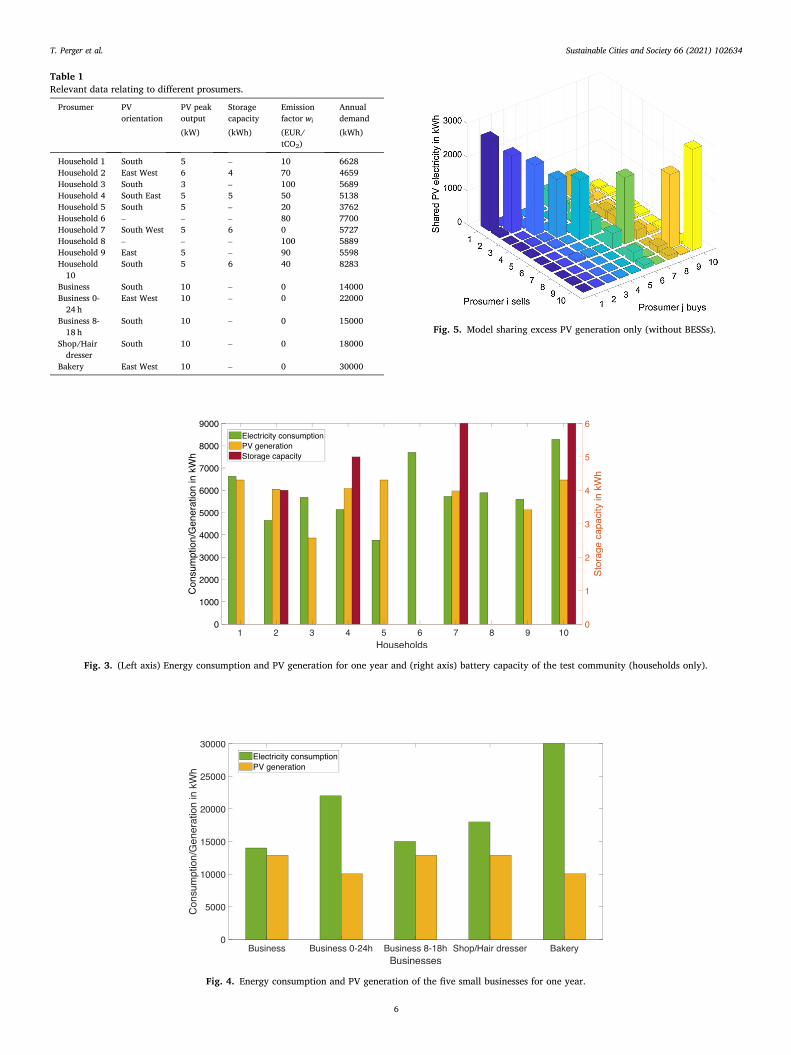
Fig. 3. (Left axis) Energy consumption and PV generation for one year and (right axis) battery capacity of the test community (households only).
Fig. 4. Energy consumption and PV generation of the five small businesses for one year.
Table 1 Relevant data relating to different prosumers.
Prosumer PV orientation
PV peak output
Storage capacity
Emission factor wi
Annual demand
(kW) (kWh) (EUR/ tCO2)
(kWh)
Household 1 South 5 – 10 6628 Household 2 East West 6 4 70 4659 Household 3 South 3 – 100 5689 Household 4 South East 5 5 50 5138 Household 5 South 5 – 20 3762 Household 6 – – – 80 7700 Household 7 South West 5 6 0 5727 Household 8 – – – 100 5889 Household 9 East 5 – 90 5598 Household
10 South 5 6 40 8283
Business South 10 – 0 14000 Business 0-
24 h East West 10 – 0 22000
Business 8- 18 h
South 10 – 0 15000
Shop/Hair dresser
South 10 – 0 18000
Bakery East West 10 – 0 30000
Fig. 5. Model sharing excess PV generation only (without BESSs).
T. Perger et al.
Sustainable Cities and Society 66 (2021) 102634
7
3.3.1. PV generation data The PV generation data were obtained from the open source tool
Renewables.ninja Renewables.ninja (2019), see also Pfenninger Pfen-ninger and Staffell (2016) and Staffell and Pfenninger (2016), where relevant data can be obtained for any location and for different PV system parameters, such as peak production, azimuth, and tilt. The community set-up used to obtain the results in this paper is situated in the city of Vienna, Austria (latitude 48.2084◦N and longitude 16.3725◦E). The reference year employed was 2019, and a tilt of 35◦ was set equally for all PV systems used in these analyses.
3.3.2. Prosumer data and willingness-to-pay The sample community used to test the proposed optimization
model, FRESH:COM, comprises a set of (arbitrary) prosumers consisting of ten private households and five small businesses. The electricity de-mands of the households are generated by using real measured anony-mized demand profiles EEG (2020), while the electricity demands of the different types of businesses are derived from so-called Synthetic Load Profiles APCS-Austrian Power Clearing and Settlement (2019), which are also used as a reference in daily electricity market operations, scheduling, clearing, and financial settlements. Table 1 shows the pa-rameters of PV orientation and peak output, the BESS capacity, the in-dividual emissions’ preference, wi, and the annual electricity demand of each prosumer, and Figs. 3 and 4 are graphical displays of prosumer household data and those of the five small businesses, respectively. Further information about the demand and generation profiles is pro-vided in A and B.
The charging and discharging efficiencies of the batteries is assumed to be ηB = 0.9, and the maximum (dis)charging power is qBmax
i = 1 kW.
The state of charge should not fall below SoCmini = 0 kWh.
3.3.3. Marginal emissions and prices The study of Schram et al. presents a time series of marginal emis-
sions from certain European countries in 2017 Schram, Louwen, Lampropoulos, and van Sark (2019). The hourly values of the German-Austrian price zone are used in this study to remain geographically consistent. Further information about marginal emis-sions can be found in C.
The optimization model also requires the retail electricity price, pGint ,
that prosumers pay when buying electricity from the grid, and the remuneration, pGout
t , for feeding PV generation to the grid. In addition, the average value of the 2019 Austrian retail electricity price (0.20 EUR/ kWh5) is assumed for pGin (see European Commission – Eurostat (2019)).
In this work, all the settings are designed for PV generated electricity without consideration of any subsidies and/or feed-in tariffs. It is assumed that excess PV generation is sold at a spot market price. To retain consistency with data available for marginal emissions6, the reference used here is the average value of the base product of the (then) German-Austrian spot market in 2017 EXAA Energy Exchange Austria (2020). Therefore, pGout is set to 0.0345 EUR/kWh.
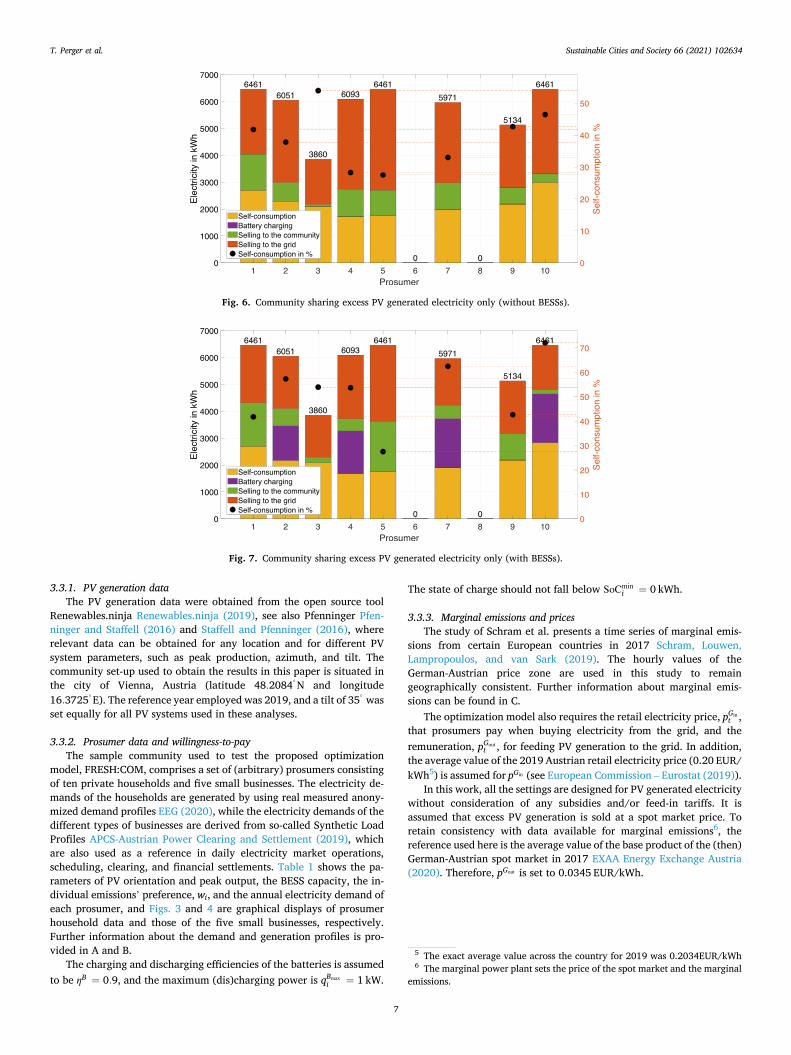
Fig. 6. Community sharing excess PV generated electricity only (without BESSs).
Fig. 7. Community sharing excess PV generated electricity only (with BESSs).
5 The exact average value across the country for 2019 was 0.2034EUR/kWh 6 The marginal power plant sets the price of the spot market and the marginal
emissions.
T. Perger et al.
Sustainable Cities and Society 66 (2021) 102634
8
3.4. Model validation
In this section, the model is validated by testing its basic function-alities. Section 3.4.1 presents the model validation with respect to sharing excess PV electricity generation only, but not considering the willingness-to-pay. The functionality of the willingness-to-pay is then verified in Section 3.4.2.
3.4.1. Model validation by sharing excess PV electricity generation only The first model validation verifies the model when considering that
only the prosumers’ excess PV electricity generation is shared with the other community members, and that the willingness-to-pay for PV generation by the community is equal to the retailer’s electricity price. To model this case, the willingness-to-pay, wtpi,j,t , is adapted compared to Eq. (2):
wtpi,j,t = pGint , (4a)
wtpi,i,t = pGint + εi. (4b)
By adding a small term, εi, to pGint for self-consumption, it can be noticed
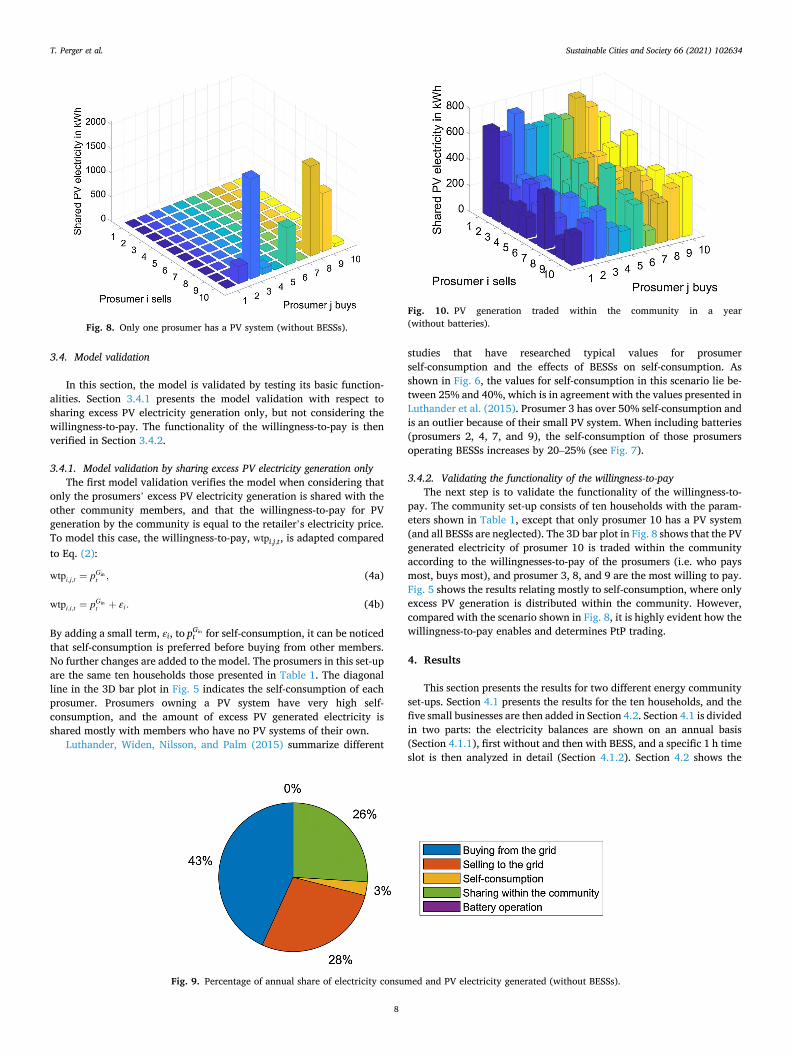
that self-consumption is preferred before buying from other members. No further changes are added to the model. The prosumers in this set-up are the same ten households those presented in Table 1. The diagonal line in the 3D bar plot in Fig. 5 indicates the self-consumption of each prosumer. Prosumers owning a PV system have very high self- consumption, and the amount of excess PV generated electricity is shared mostly with members who have no PV systems of their own.
Luthander, Widen, Nilsson, and Palm (2015) summarize different
studies that have researched typical values for prosumer self-consumption and the effects of BESSs on self-consumption. As shown in Fig. 6, the values for self-consumption in this scenario lie be-tween 25% and 40%, which is in agreement with the values presented in Luthander et al. (2015). Prosumer 3 has over 50% self-consumption and is an outlier because of their small PV system. When including batteries (prosumers 2, 4, 7, and 9), the self-consumption of those prosumers operating BESSs increases by 20–25% (see Fig. 7).
3.4.2. Validating the functionality of the willingness-to-pay The next step is to validate the functionality of the willingness-to-
pay. The community set-up consists of ten households with the param-eters shown in Table 1, except that only prosumer 10 has a PV system (and all BESSs are neglected). The 3D bar plot in Fig. 8 shows that the PV generated electricity of prosumer 10 is traded within the community according to the willingnesses-to-pay of the prosumers (i.e. who pays most, buys most), and prosumer 3, 8, and 9 are the most willing to pay. Fig. 5 shows the results relating mostly to self-consumption, where only excess PV generation is distributed within the community. However, compared with the scenario shown in Fig. 8, it is highly evident how the willingness-to-pay enables and determines PtP trading.
4. Results
This section presents the results for two different energy community set-ups. Section 4.1 presents the results for the ten households, and the five small businesses are then added in Section 4.2. Section 4.1 is divided in two parts: the electricity balances are shown on an annual basis (Section 4.1.1), first without and then with BESS, and a specific 1 h time slot is then analyzed in detail (Section 4.1.2). Section 4.2 shows the
Fig. 9. Percentage of annual share of electricity consumed and PV electricity generated (without BESSs).
Fig. 8. Only one prosumer has a PV system (without BESSs).
Fig. 10. PV generation traded within the community in a year (without batteries).
T. Perger et al.
Sustainable Cities and Society 66 (2021) 102634
9
results including businesses on an annual basis.
4.1. Energy community of ten households
4.1.1. Electricity balance on annual level Energy community without BESS In the set-up of prosumers selected (10 households without BESSs),
26% of the electricity is traded within the community, while the share of
self-consumption is only 3%, see the pie chart in Fig. 9. Furthermore, 43% of the electricity is purchased from the retailer and the surplus fed into the grid equals 28%. The objective function of the linear optimi-zation model ensures that the electricity purchased from the retailer is minimized. Furthermore, sharing within the community and self- consumption are preferred compared to selling to the grid.
PtP trading is then discussed in detail. The 3D bar plot in Fig. 10
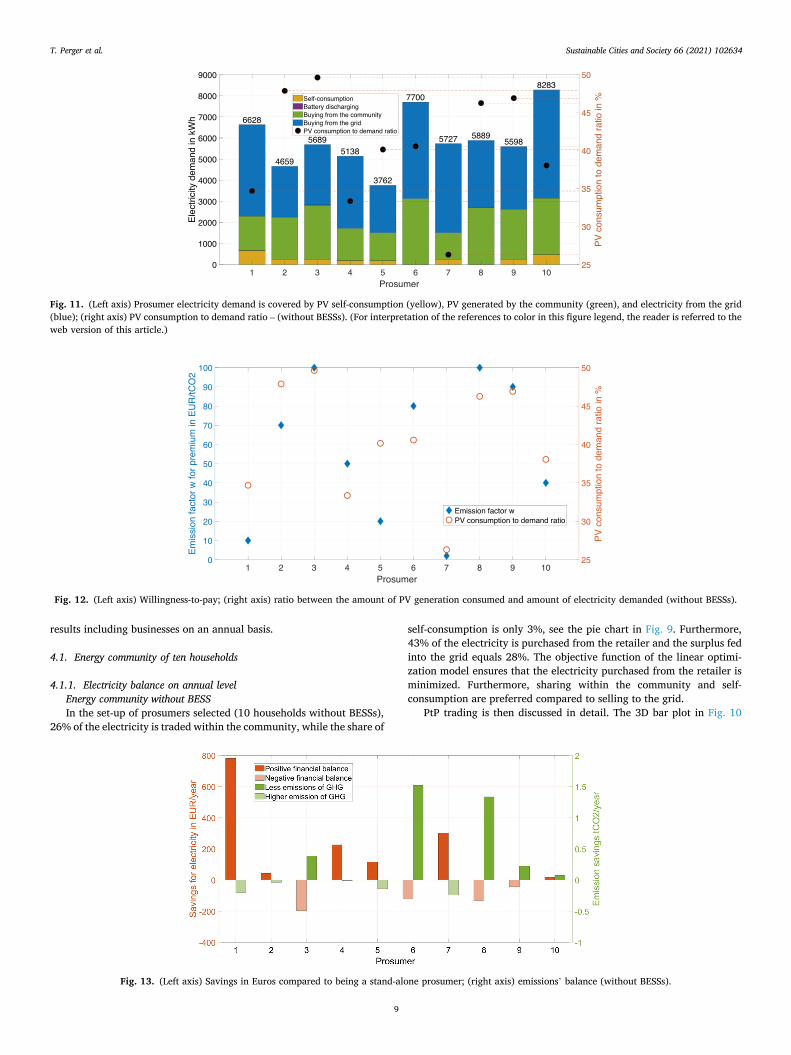
Fig. 11. (Left axis) Prosumer electricity demand is covered by PV self-consumption (yellow), PV generated by the community (green), and electricity from the grid (blue); (right axis) PV consumption to demand ratio – (without BESSs). (For interpretation of the references to color in this figure legend, the reader is referred to the web version of this article.)
Fig. 12. (Left axis) Willingness-to-pay; (right axis) ratio between the amount of PV generation consumed and amount of electricity demanded (without BESSs).
Fig. 13. (Left axis) Savings in Euros compared to being a stand-alone prosumer; (right axis) emissions’ balance (without BESSs).
T. Perger et al.
Sustainable Cities and Society 66 (2021) 102634
10
shows the results of the optimization variable qsharej,i,t over one year
(∑
t∈𝒯 qsharei,j,t , 𝒯 = 1,…,8760), and the amount of PV generated electricity
that each prosumer trades with other prosumers is evident. Following the matrix logic of qshare
j,i,t , the diagonal line indicates the self-consumption of each prosumer and their willingness-to-pay decides how the genera-tion is shared.
As each member of the energy community has their own character-istic electricity demand and the dimensions of the PV system vary, the distribution of qshare
j,i,t not only depends on the willingness-to-pay, but also strongly on the size of each prosumer’s PV system. A different perspective is shown in Fig. 11, where the focus is on the relation be-tween the self-consumption of each prosumer (yellow) and the elec-tricity purchased from the community (green) and from the grid (blue). The PV consumption to demand ratio (the percentage of the annual demand that is covered by PV generation from self-consumption and buying from other community members) is presented on the right axis (in %).
Fig. 12 shows the correlation between the willingness-to-pay (left axis, blue) and the ratio between the amount of PV electricity consumed and the demand for electricity (right axis, red). The figure indicates that a high willingness-to-pay generally leads to a higher share of PV elec-tricity from the community and vice versa. Therefore, the introduction of a willingness-to-pay is a promising tool for allocating the PV elec-tricity generated, especially within an energy community where all of the PV generation is shared, and not just each prosumer’s surplus.
The revenues and emissions’ savings of each prosumer change when they join the energy community and engage in PtP trading. To analyze
this effect, the revenues and CO2-emissions are calculated and compared to the revenues and the emissions that the members would generate if they were stand-alone prosumers only, who do not share their PV electricity generation. Participants with a high willingness-to-pay pay more for electricity in the PtP trading scenario and end up with a negative financial balance compared to being a stand-alone prosumer. On the other hand, participants with a relatively low willingness-to-pay generate profits because they sell most of their renewable energy to members who are willing to pay more. The red bars in Fig. 13 show the financial savings generated by engaging in PtP trading. The four pro-sumers with the highest willingness-to-pay (prosumers 3, 6, 8, and 9) have a negative balance. Prosumers 1 and 7 have the lowest willingness- to-pay and the highest savings, with savings of approximately 38% for prosumer 1.
A similar but opposite tendency can be seen with emissions’ savings. The green bars in Fig. 13 indicate whether a member can save marginal emissions by purchasing from their peers. A high willingness-to-pay leads to emissions’ savings because of the implicit preference to pur-chase emission-free PV generated electricity over that from the retailer. It should be noted that most prosumers in Fig. 13 follow the same pattern: a positive financial balance but no emissions’ savings, or emissions’ savings but a negative financial balance.
Energy community with BESSs This section describes the effects of including BESSs to the technol-
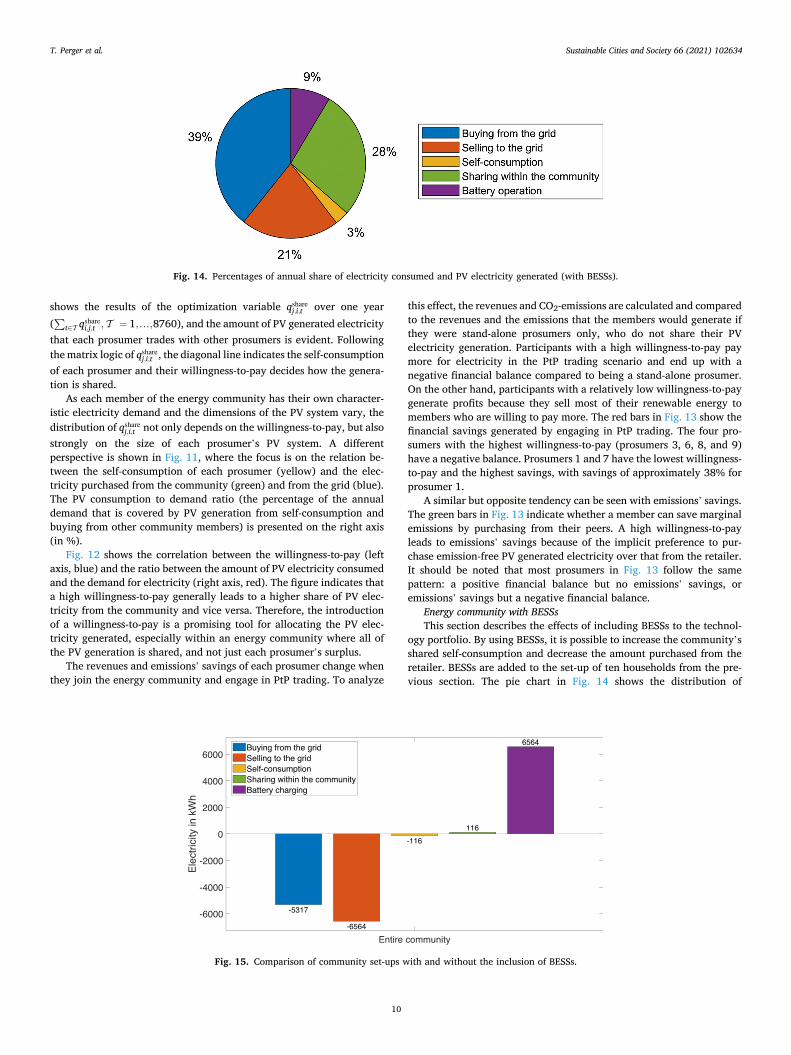
ogy portfolio. By using BESSs, it is possible to increase the community’s shared self-consumption and decrease the amount purchased from the retailer. BESSs are added to the set-up of ten households from the pre-vious section. The pie chart in Fig. 14 shows the distribution of
Fig. 15. Comparison of community set-ups with and without the inclusion of BESSs.
Fig. 14. Percentages of annual share of electricity consumed and PV electricity generated (with BESSs).
T. Perger et al.
Sustainable Cities and Society 66 (2021) 102634
11
electricity on an annual level with BESSs operating: 28% of the elec-tricity is shared within the community, 9% is provided by BESSs within the community, and 3% is self-consumption. Purchases from the grid have decreased to 39% due to BESSs, and the amount sold to the grid has reduced to 21%.
Fig. 15 compares the results of community set-ups with and without BESSs showing the differences between the two scenarios, and the
following conclusions can be drawn:
• Batteries are charged only when the amount of PV electricity generated exceeds the demand of the whole community; therefore, the amount of electricity used for charging is equal to the difference in the amount sold to the grid.
• Prosumers are not buying from the retailer to charge their batteries; therefore, the difference in the amount bought from the grid equals the amount discharged by batteries.
• When excess PV electricity is generated, prosumers with BESSs can charge their batteries with the PV electricity they generate, and they can then buy from the community, if required. When there is not enough available PV generation, they can use their batteries to cover their demand, instead of buying from the retailer. With BESSs, the whole community buys approximately 15% less electricity from the retailer than without BESSs.
• BESSs do no compete with the community’s generated PV electricity because only excess electricity generated is stored, and the batteries are discharged only when the amount of PV generation is insufficient for covering the demand. There is only a slight shift between self- consumption and trading with other members.
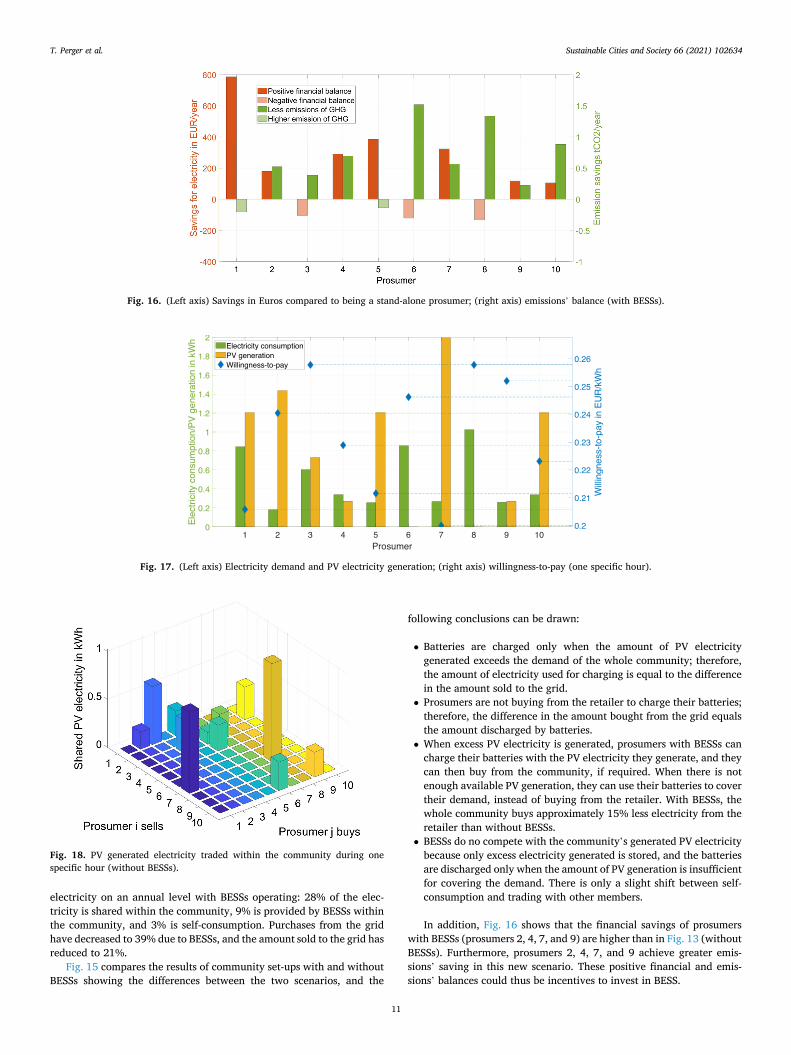
In addition, Fig. 16 shows that the financial savings of prosumers with BESSs (prosumers 2, 4, 7, and 9) are higher than in Fig. 13 (without BESSs). Furthermore, prosumers 2, 4, 7, and 9 achieve greater emis-sions’ saving in this new scenario. These positive financial and emis-sions’ balances could thus be incentives to invest in BESS.
Fig. 17. (Left axis) Electricity demand and PV electricity generation; (right axis) willingness-to-pay (one specific hour).
Fig. 16. (Left axis) Savings in Euros compared to being a stand-alone prosumer; (right axis) emissions’ balance (with BESSs).
Fig. 18. PV generated electricity traded within the community during one specific hour (without BESSs).
T. Perger et al.
Sustainable Cities and Society 66 (2021) 102634
12
4.1.2. Focusing on a detailed 1 h time slot Following the results obtained on an annual level, one specific hour
is analyzed in detail in this section to gain a better insight into the PtP trading mechanism. The set-up is the same as that in Section 4.1.1.1 without BESSs. April 1st between 16:00 and 17:00 is chosen as the timeframe.7 Production from the PV systems is relatively high within this hour, and the total amount of PV electricity produced exceeds the total demand of the prosumers (see Fig. 17). The marginal emissions in this hour are 578gCO2/kWh and the willingness-to-pay (wtpi,j,t) is be-tween 0.20 and 0.26 EUR/kWh (see right axis Fig. 17).
Fig. 18 shows the PtP trading results, again as a 3D bar plot. Pro-sumers 6 and 8 have no PV systems of their own, and they cover their demand by purchasing PV electricity from the community. Prosumer 7 generates high amounts of PV electricity compared to their demand, and is thus selling to prosumer 1 and 8. Other prosumers are also selling proportions of their generated PV electricity to the community. As there is a PV generation surplus, the community does not need to purchase electricity from the retailer during this specific hour.
4.2. Energy community including businesses
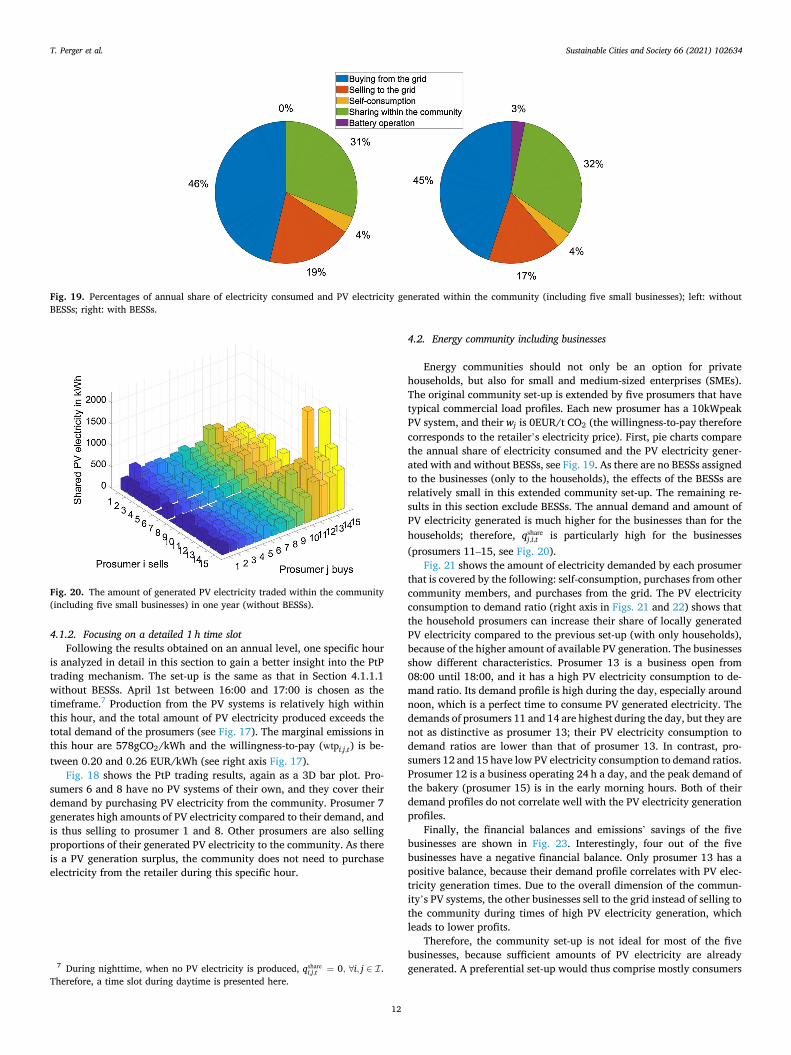
Energy communities should not only be an option for private households, but also for small and medium-sized enterprises (SMEs). The original community set-up is extended by five prosumers that have typical commercial load profiles. Each new prosumer has a 10kWpeak PV system, and their wj is 0EUR/t CO2 (the willingness-to-pay therefore corresponds to the retailer’s electricity price). First, pie charts compare the annual share of electricity consumed and the PV electricity gener-ated with and without BESSs, see Fig. 19. As there are no BESSs assigned to the businesses (only to the households), the effects of the BESSs are relatively small in this extended community set-up. The remaining re-sults in this section exclude BESSs. The annual demand and amount of PV electricity generated is much higher for the businesses than for the households; therefore, qshare
j,i,t is particularly high for the businesses (prosumers 11–15, see Fig. 20).
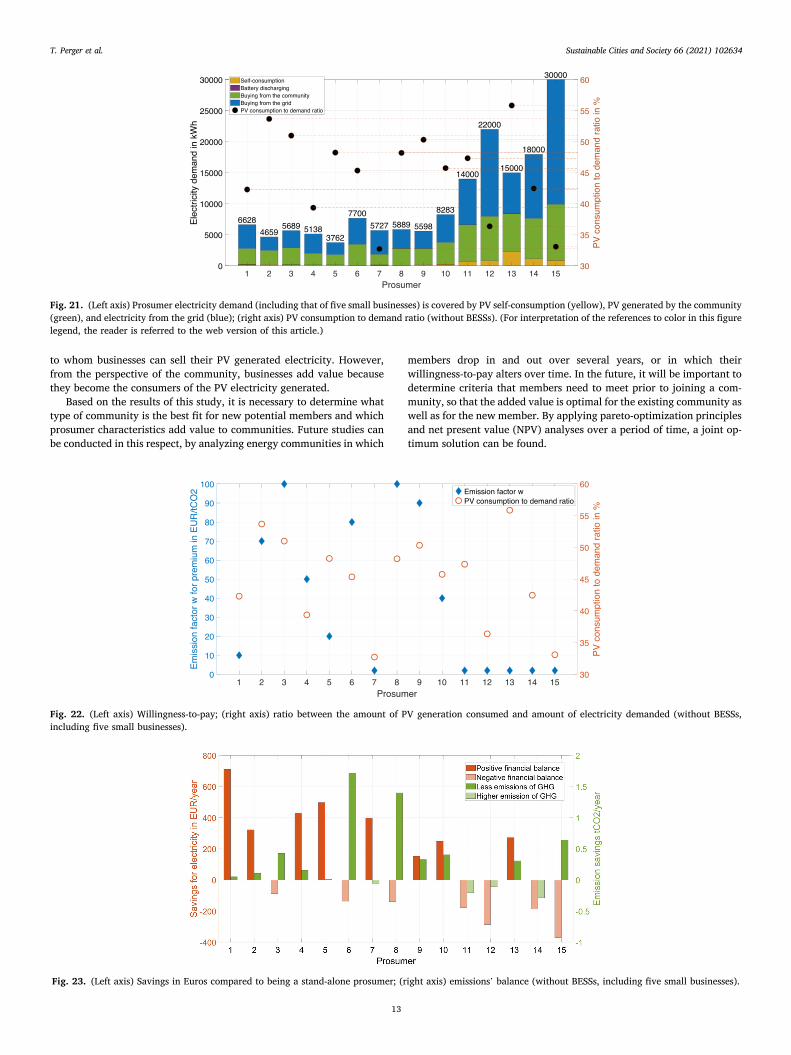
Fig. 21 shows the amount of electricity demanded by each prosumer that is covered by the following: self-consumption, purchases from other community members, and purchases from the grid. The PV electricity consumption to demand ratio (right axis in Figs. 21 and 22) shows that the household prosumers can increase their share of locally generated PV electricity compared to the previous set-up (with only households), because of the higher amount of available PV generation. The businesses show different characteristics. Prosumer 13 is a business open from 08:00 until 18:00, and it has a high PV electricity consumption to de-mand ratio. Its demand profile is high during the day, especially around noon, which is a perfect time to consume PV generated electricity. The demands of prosumers 11 and 14 are highest during the day, but they are not as distinctive as prosumer 13; their PV electricity consumption to demand ratios are lower than that of prosumer 13. In contrast, pro-sumers 12 and 15 have low PV electricity consumption to demand ratios. Prosumer 12 is a business operating 24 h a day, and the peak demand of the bakery (prosumer 15) is in the early morning hours. Both of their demand profiles do not correlate well with the PV electricity generation profiles.
Finally, the financial balances and emissions’ savings of the five businesses are shown in Fig. 23. Interestingly, four out of the five businesses have a negative financial balance. Only prosumer 13 has a positive balance, because their demand profile correlates with PV elec-tricity generation times. Due to the overall dimension of the commun-ity’s PV systems, the other businesses sell to the grid instead of selling to the community during times of high PV electricity generation, which leads to lower profits.
Therefore, the community set-up is not ideal for most of the five businesses, because sufficient amounts of PV electricity are already generated. A preferential set-up would thus comprise mostly consumers
Fig. 19. Percentages of annual share of electricity consumed and PV electricity generated within the community (including five small businesses); left: without BESSs; right: with BESSs.
Fig. 20. The amount of generated PV electricity traded within the community (including five small businesses) in one year (without BESSs).
7 During nighttime, when no PV electricity is produced, qsharei,j,t = 0, ∀i, j ∈ ℐ .
Therefore, a time slot during daytime is presented here.
T. Perger et al.
Sustainable Cities and Society 66 (2021) 102634
13
to whom businesses can sell their PV generated electricity. However, from the perspective of the community, businesses add value because they become the consumers of the PV electricity generated.
Based on the results of this study, it is necessary to determine what type of community is the best fit for new potential members and which prosumer characteristics add value to communities. Future studies can be conducted in this respect, by analyzing energy communities in which
members drop in and out over several years, or in which their willingness-to-pay alters over time. In the future, it will be important to determine criteria that members need to meet prior to joining a com-munity, so that the added value is optimal for the existing community as well as for the new member. By applying pareto-optimization principles and net present value (NPV) analyses over a period of time, a joint op-timum solution can be found.
Fig. 22. (Left axis) Willingness-to-pay; (right axis) ratio between the amount of PV generation consumed and amount of electricity demanded (without BESSs, including five small businesses).
Fig. 23. (Left axis) Savings in Euros compared to being a stand-alone prosumer; (right axis) emissions’ balance (without BESSs, including five small businesses).
Fig. 21. (Left axis) Prosumer electricity demand (including that of five small businesses) is covered by PV self-consumption (yellow), PV generated by the community (green), and electricity from the grid (blue); (right axis) PV consumption to demand ratio (without BESSs). (For interpretation of the references to color in this figure legend, the reader is referred to the web version of this article.)
T. Perger et al.
Sustainable Cities and Society 66 (2021) 102634
14
5. Sensitivity analysis
In this section, the input parameters and the default set-up of ten households without BESSs (Section 4.1.1.1) are modified in different sensitivity analyses. The default set-up is located in Vienna, Austria, and
some of the parameters (for example the retail electricity price, the average spot market price, and the marginal emissions) are specific to the region. The model presented in this paper is designed to be applied in different regions and countries, and only the location specific input data thus need to be adapted accordingly.
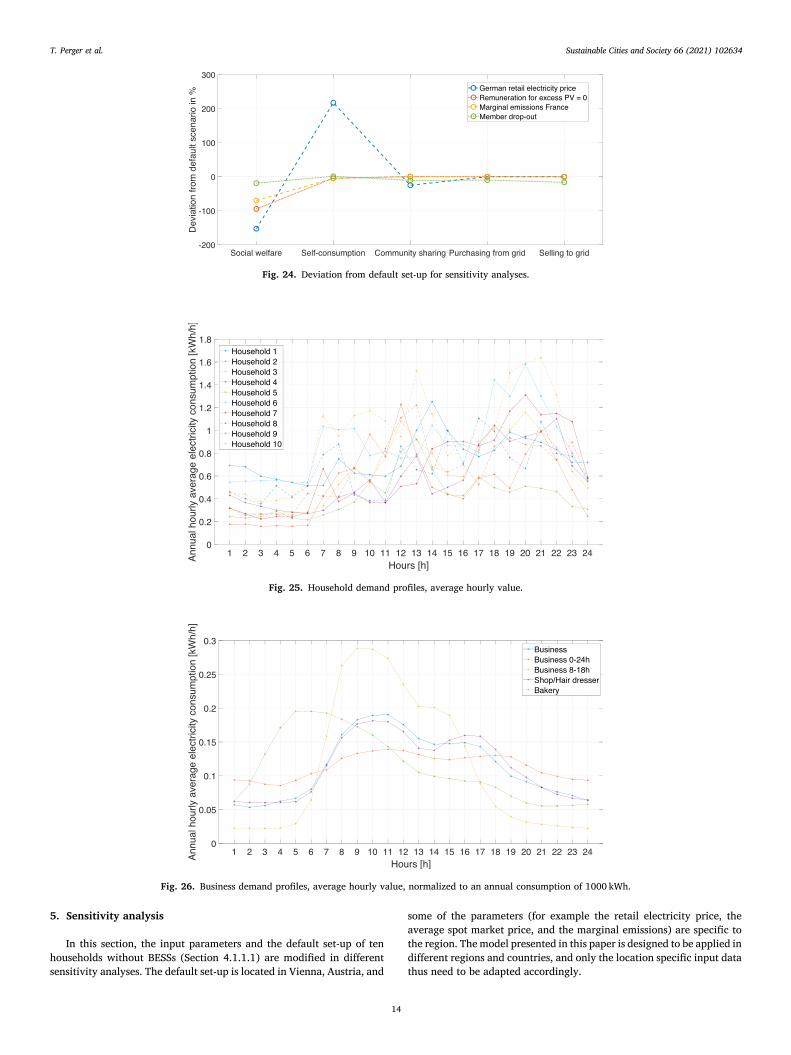
Fig. 24. Deviation from default set-up for sensitivity analyses.
Fig. 25. Household demand profiles, average hourly value.
Fig. 26. Business demand profiles, average hourly value, normalized to an annual consumption of 1000 kWh.
T. Perger et al.
Sustainable Cities and Society 66 (2021) 102634
15
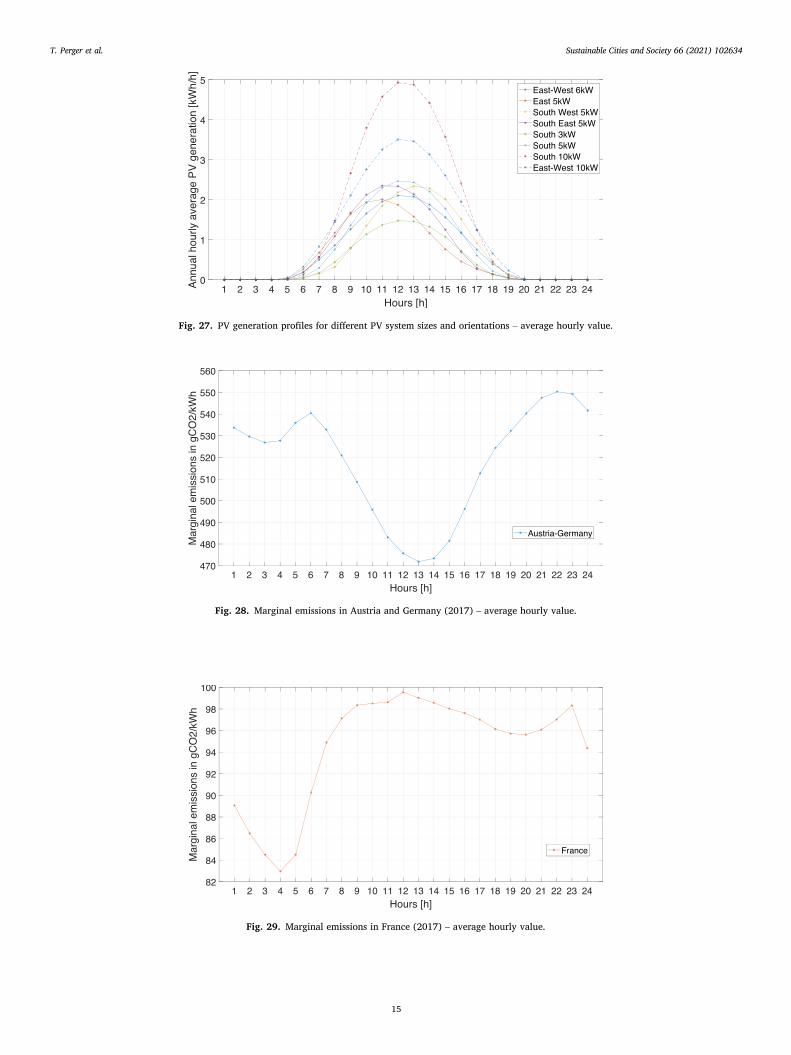
Fig. 27. PV generation profiles for different PV system sizes and orientations – average hourly value.
Fig. 28. Marginal emissions in Austria and Germany (2017) – average hourly value.
Fig. 29. Marginal emissions in France (2017) – average hourly value.
T. Perger et al.

Sustainable Cities and Society 66 (2021) 102634
16
In the following sensitivity analyses, some of the input parameters are varied and the prosumer set-up is modified. In this section, the following four scenarios are modeled and evaluated:
1. Varying the Retail Electricity Price The average Austrian retail elec-tricity price is just slightly below that of the 2019 EU-28 average value (see European Commission–Eurostat (2019)). As it would be interesting to determine whether adapting the retail electricity price in the model to that of another European country would change the results of the energy community, the retail electricity price, pGin
t , is adapted here to the average German value of 0.3088EUR/kWh. This is a retail electricity price at the upper end of Europe (due to the high renewable levy share, surcharges, and taxes).
2. Varying the Remuneration for Excess PV Generation In the default scenario, it is assumed that excess PV generation is sold to the grid at an average spot market price. In this scenario, the results are eval-uated when the renumeration is neglectable, i.e. when pGout
t is set to 0. This could occur if excess renewable generation in the current elec-tricity market design is treated rather as a burden than a benefit.
3. Varying the Marginal Emissions of the External Reference Electricity Market Compared to the Austrian/German electricity system, other electricity systems have different power plant portfolios (for example, they have a high share of nuclear power plants, which are classified as low-emission or emission free in terms of GHG). As an example, the marginal emissions in the French electricity system are a fraction of the marginal emissions in the Austrian/German elec-tricity market (see Schram et al. (2019)). In this sensitivity analysis, the vector of the marginal emissions, et, represents the French elec-tricity system instead of the Austrian/German system.
4. Structural Diversification of the Community In this final sensitivity analysis, one member drops out of the community. To best demon-strate the possible impacts of changes in the community set-up, it is considered that a prosumer with a relatively high PV electricity generation and electricity demand leaves (prosumer 7 with a 5kWpeak South West PV system).
The following Fig. 24 shows the percentage deviation of the different sensitivity analyses from the default scenario. The output values of so-cial welfare, self-consumption, sharing within the community, and the purchases and sales from/to the grid are compared and the results are as follows:
• Social welfare (in EUR) decreases in all four sensitivity analyses. As per Eq. (1), the retail price, pGin
t , and remuneration, pGoutt , influence
social welfare. Varying marginal emissions does not alter the weights of the willingness-to-pay, but the prosumers pay proportionally less (or more if marginal emissions increase), and therefore the social welfare result changes. The drop-out of the member decreases wel-fare because there are only 9 prosumers left to buy and sell the PV electricity generated.
• The amount of electricity (in kWh) available for self-consumption and sharing within the community shifts slightly in scenario 2–4. The only distinctive deviation is noticeable in sensitivity 1, where self-consumption increases and sharing with the community de-creases. It is important to note that self-consumption in the default scenario is only a few percent, and thus the relative shift seems high.
• The purchases and sales from/to the grid (in kWh) in sensitivity analyses 1–3 are not different from those in the default scenario, because the prosumer set-up is the same and the social welfare maximization minimizes the purchases/sales from the grid. Howev-er, these change in sensitivity analysis 4, when one member leaves the community. The total amount of electricity decreases, because there is a lower electricity demand as well as lower PV electricity generation.
6. Conclusion and outlook
By using the linear optimization model developed in this work, sustainable energy communities can share PV electricity generation under the consideration of each prosumer’s willingness-to-pay. The conclusions of this study are summarized below:
• The results show that the implementation of the willingness-to-pay, as proposed in this work, promotes the desired outcomes for the prosumers. Individual added values are created from participating in the energy community, depending on the needs of the prosumer: financial savings (equivalent to higher profits) for profit-orientated prosumers with a low willingness-to-pay, and high emissions’ sav-ings for environmentally concerned prosumers with a high willing-ness-to-pay.
• The algorithm ensures that generated PV electricity is perfectly allocated, not only to prosumers according to their willingness-to- pay, but it is also optimized for the entire community by mini-mizing purchases and sales from/to the retailer.
• Battery energy storage systems (BESSs) increase the flexibility and are therefore able to reduce the community’s purchases from the grid. In addition, profitability increases for prosumers with BESSs.
• The set-up of the community (with respect to the installed PV ca-pacities, the number of prosumers vs. consumers, and the demand profiles) has a strong impact on the performance of the entire com-munity and of each prosumer. As shown in the sensitivity analysis, members leaving the community may decrease the social welfare and amount of PV electricity generation that is shared in the community. While this may not be significant when only one prosumer leaves, the effects are likely to increase when there is greater variation in the community set-up.
• The findings of the sensitivity analyses show that the retail electricity price has a great influence of the overall results. A higher retail price, for example in Germany, decreases social welfare because the com-munity members generally have to pay more for electricity; however, local self-consumption becomes more valuable and therefore the profitability of sharing PV increases.
• The concept presented here endorses the concept of energy com-munities contributing to a sharing economy. Interested participants without their own PV systems can consume locally generated PV electricity, while other prosumers can sell their PV generation to others, who see the value in consuming locally generated PV elec-tricity. There is a potential for new business models to be created and the promotion of investments in PV systems.
The prosumers of energy communities thus become active partici-pants within the energy system and contribute to achieving climate targets. This concept agrees completely with the policy goals of decen-tralization, decarbonization, and democratization of the energy system. It is therefore possible for individual members of the community to make tailor-made and measurable contributions to ameliorating global climate change. If technological resources and preferences are optimally allocated, the concept presented in this paper can sustain requirements without the need for any government subsidies or financial support. Moreover, this type of energy community concept can be competitive within the current electricity market.
However, this study has a few limitations that require further consideration and investigation. Future studies should therefore address the following aspects:
There is a decrease in the revenue of the distribution system operator (DSO) due to local PV self-consumption. Naturally, DSOs are in favor of increasing the fixed component of the grid tariff in case of an increase in the variable/volumetric self-consumption of PV electricity generation by prosumers and communities. A reduction in the variable grid tariff component also negatively influences the profitability of the energy community balances, as this fraction of the grid tariff directly relates to
T. Perger et al.
Sustainable Cities and Society 66 (2021) 102634
17
the retail electricity price. Therefore, future studies should focus on different compositions of fixed versus variable charges of grid tariffs and their corresponding influences on energy community results.
It is also necessary to consider dynamic participation in energy communities, where prosumers can join or leave the community on a yearly basis. However, it will be necessary to define the criteria based on a common optimum for old and new community members, which will determine if a potential new prosumer is allowed to join the community.
Furthermore, when considering a community with members who are more dispersely located than those in a small geographic area or dis-tribution grid branch, the addition of a distance-related factor is pro-posed (in addition to the willingness-to-pay.) This distance-related factor considers that the matching of widely dispersed PV generation and load is disadvantageous compared to a closer matching, which is preferred.
And finally, different settlement patterns (urban, suburban, small town, and rural areas) and their potentials should be analyzed in detail,
as they usually differ considerably with respect to rooftop area avail-ability for PV systems, the diversification of demand profiles, and demographics.
Declaration of interests
None.
Declaration of Competing Interest
The authors report no declarations of interest.
Acknowledgments
This project has received funding from the European Union’s Hori-zon 2020 Research and Innovation Programme under Grant Agreement No. 835896.
Appendix A. Load profile data
The hourly average values of the household demand electricity profiles are shown in Fig. 25; the corresponding total annual demand of each household is shown in Table 1; and the hourly average value of small and medium-sized enterprises (SMEs) are shown in Fig. 26.
From information obtained in APCS-Austrian Power Clearing and Settlement (2019), the following synthetic load profiles were derived:
• G0 – Business • G1 – Business 0-24 h • G3 – Business 8–18 h • G4 – Shop/Hairdresser • G5 – Bakery
The year of reference is 2019. The demand profiles are normalized to an annual consumption of 1000kWh for graphical purposes. To obtain the results in Section 4, the synthetic load profiles are upscaled to the pro-sumers’ annual demand (see Table 1).
Appendix B. PV generation data
The PV generation data were obtained from Renewables.ninja (Pfenninger and Staffell (2016) and Staffell and Pfenninger (2016) with the following parameters (refer to Fig. 27 for the annual hourly average values):
• Location coordinates: 48.2084◦N, 16.3725◦E (Vienna, Austria) • Dataset: MERRA-2 (global) • Year: 2019 • System loss: 0.1 • Tilt: 35◦
• Azimuth: –South: 180◦ . –East: 90◦ . –West: 270◦ . –South-East: 135◦ . –South West: 225◦ .
Appendix C. Marginal emissions
The marginal emissions for Austria and Germany used to conduct the results in Section 4 are obtained from Schram et al. (2019). The data contain hourly values in kg CO_2/MWh for 2017. Data for other countries are also available: Belgium, Spain, France, Italy, Netherlands, and Portugal. The marginal emissions of France are used in the sensitivity analysis in Section 5. Figs. 28 and 29 show the average hourly values for Austria/Germany and France, respectively.
References
Abada, I., Ehrenmann, A., & Lambin, X. On the viability of energy communities, Energy Journal 41. doi: 10.5547/01956574.41.1.iaba.
Ali, A., Li, W., Hussain, R., He, X., Williams, B. W., & Memon, A. H. (2017). Overview of current microgrid policies, incentives and barriers in the European Union, United States and China. Sustainability, 9, 1146. https://doi.org/10.3390/su9071146
An, J., Lee, M., Yeom, S., & Hong, T. (2020). Determining the Peer-to-Peer electricity trading price and strategy for energy prosumers and consumers within a microgrid. Applied Energy, 261, 114335. https://doi.org/10.1016/j.apenergy.2019.114335
T. Perger et al.
Sustainable Cities and Society 66 (2021) 102634
18
APCS-Austrian Power Clearing and Settlement (2019). Synthetic load profiles. http s://www.apcs.at/en/clearing/physical-clearing/synthetic-load-profiles.
BestRES (2018). Best practices and implementation of innovative business models for renewable energy aggregators. bestres.eu.
Campos, I., Pontes Luz, G., Marin-Gonzalez, E., Gahrs, S., Hall, S., & Holstenkamp, L. (2020). Regulatory challenges and opportunities for collective renewable energy prosumers in the EU. Energy Policy, 138, 111212. https://doi.org/10.1016/j. enpol.2019.111212
COMPILE (2019). Collective self-consumption and energy communities: Overview of emerging regulatory approaches in Europe. https://www.compile-project.eu/.
Directorate-General for Energy (European Commission) (2019). Clean energy for all Europeans. doi: 10.2833/9937.
EEG (2020). Energy economics group, TU Wien, Internal Data Base. eFriends Energy GmbH (2020). efriends. http://www.efriends.at. European Commission, Directive (EU). (2018). 2018/2001 of the European Parliament
and of the Council of 11 December 2018 on the promotion of the use of energy from renewable sources. http://data.europa.eu/eli/dir/2018/2001/oj.
European Commission, Directive (EU). (2019). 2019/944 of the European Parliament and of the Council of 5 June 2019 on common rules for the internal market for electricity and amending Directive 2012/27/EU (recast). http://data.europa.eu/eli/ dir/2019/944/oj.
European Commission – Eurostat (2019). Electricity price statistics. https://ec.europa. eu/eurostat/statistics-explained/index.php/Electricity_price_statistics.
EXAA Energy Exchange Austria (2020). [link]. https://www.exaa.at/de/marktdaten/hist orische-daten.
Fan, Y., & Xia, X. (2017). A multi-objective optimization model for energy-efficiency building envelope retrofitting plan with rooftop PV system installation and maintenance. Applied Energy, 189, 327–335. https://doi.org/10.1016/j. apenergy.2016.12.077
Fina, B., Fleischhacker, A., Auer, H., & Lettner, G. (2018). Economic assessment and business models of rooftop photovoltaic systems in multiapartment buildings: Case studies for Austria and Germany. Journal of Renewable Energy. https://doi.org/ 10.1155/2018/9759680
Fina, B., Auer, H., & Friedl, W. (2019). Profitability of PV sharing in energy communities: Use cases for different settlement patterns. Energy, 189, 116148. https://doi.org/ 10.1016/j.energy.2019.116148
Fleischhacker, A., Auer, H., Lettner, G., & Botterud, A. (2019). Sharing solar PV and energy storage in apartment buildings: resource allocation and pricing. IEEE Transactions on Smart Grid, 10(4), 3963–3973. https://doi.org/10.1109/ TSG.2018.2844877
Gholinejad, H. R., Loni, A., Adabi, J., & Marzband, M. (2020). A hierarchical energy management system for multiple home energy hubs in neighborhood grids. Journal of Building Engineering, 28, 101028. https://doi.org/10.1016/j.jobe.2019.101028
Golmohamadi, H., Keypour, R., Bak-Jensen, B., & Pillai, J. R. (2019). Optimization of household energy consumption towards day-ahead retail electricity price in home energy management systems. Sustainable Cities and Society, 47, 101468. https://doi. org/10.1016/j.scs.2019.101468
Gui, E. M., & MacGill, I. (2018). Typology of future clean energy communities: An exploratory structure, opportunities, and challenges. Energy Research & Social Science, 35, 94–107. https://doi.org/10.1016/j.erss.2017.10.019. Energy and the Future.
Gurobi Optimization (2019). LLC, Gurobi Optimizer Reference Manual. http://www. gurobi.com.
Hackbarth, A., & Lobbe, S. (2020). Attitudes, preferences, and intentions of German households concerning participation in peer-to-peer electricity trading. Energy Policy, 138, 111238. https://doi.org/10.1016/j.enpol.2020.111238
Hahnel, U. J., Herberz, M., Pena-Bello, A., Parra, D., & Brosch, T. (2020). Becoming prosumer: Revealing trading preferences and decision-making strategies in peer-to- peer energy communities. Energy Policy, 137, 111098. https://doi.org/10.1016/j. enpol.2019.111098
Hirsch, A., Parag, Y., & Guerrero, J. (2018). Microgrids: A review of technologies, key drivers, and outstanding issues. Renewable and Sustainable Energy Reviews, 90, 402–411. https://doi.org/10.1016/j.rser.2018.03.040
Hossain, E., Kabalci, E., Bayindir, R., & Perez, R. (2014). Microgrid testbeds around the world: State of art. Energy Conversion and Management, 86, 132–153. https://doi.org/ 10.1016/j.enconman.2014.05.012
International Energy Agency (2018). World energy outlook 2018. doi: 10.1787/weo- 2018-en. https://www.oecd-ilibrary.org/content/publication/weo-2018-en.
Jadidbonab, M., Mohammadi-Ivatloo, B., Marzband, M., & Siano, P. (2020). Short-term self-scheduling of virtual energy hub plant within thermal energy market. IEEE Transactions on Industrial Electronics, 1.
Lofberg, J. (2004). YALMIP: A Toolbox for modeling and optimization in MATLAB. In In Proceedings of the CACSD Conference.
Lüth, A., Zepter, J. M., del Granado, P. C., & Egging, R. (2018). Local electricity market designs for peer-to-peer trading: The role of battery flexibility. Applied Energy, 229, 1233–1243. https://doi.org/10.1016/j.apenergy.2018.08.004
Leal, V. M., & Azevedo, I. (2016). Setting targets for local energy planning: Critical assessment and a new approach. Sustainable Cities and Society, 26, 421–428. https:// doi.org/10.1016/j.scs.2016.04.010
Luthander, R., Widen, J., Nilsson, D., & Palm, J. (2015). Photovoltaic self-consumption in buildings: A review. Applied Energy, 142, 80–94. https://doi.org/10.1016/j. apenergy.2014.12.028
Marszal-Pomianowska, A., de Cerio Mendaza, I. D., Bak-Jensen, B., & Heiselberg, P. (2019). A performance evaluation of future low voltage grids in presence of prosumers modelled in high temporal resolution. Sustainable Cities and Society, 44, 702–714. https://doi.org/10.1016/j.scs.2018.11.001
Marzband, M., Fouladfar, M. H., Akorede, M. F., Lightbody, G., & Pouresmaeil, E. (2018). Framework for smart transactive energy in home-microgrids considering coalition formation and demand side management. Sustainable Cities and Society, 40, 136–154. https://doi.org/10.1016/j.scs.2018.04.010
Masson-Delmotte, V., Zhai, P., Portner, H.O., Roberts, D., Skea, J., & Shukla, P.R., et al. (Eds.). IPCC, 2018: Global warming of 1.5◦ C. An IPCC Special Report on the impacts of global warming of 1.5◦ C above pre-industrial levels and related global greenhouse gas emission pathways, in the context of strengthening the global response to the threat of climate change, sustainable development, and efforts to eradicate poverty. https://www.ipcc.ch/sr15/download/.
MATLAB (R2019b) (2019). The MathWorks Inc., Natick, Massachusetts. Mengelkamp, E., Garttner, J., Rock, K., Kessler, S., Orsini, L., & Weinhardt, C. (2018).
Designing microgrid energy markets: A case study: The Brooklyn Microgrid. Applied Energy, 210, 870–880. https://doi.org/10.1016/j.apenergy.2017.06.054
Microgrid, B. Brooklyn microgrid – Community powered energy. https://www.brooklyn. energy/.
Mohseni, S., & Moghaddas-Tafreshi, S. M. (2018). A multi-agent system for optimal sizing of a cooperative self-sustainable multi-carrier microgrid. Sustainable Cities and Society, 38, 452–465. https://doi.org/10.1016/j.scs.2018.01.016
open4innovation. P2PQ – Peer2Peer im Quartier (2018). https://nachhaltigwirtschaften. at/de/sdz/projekte/peer2peer-im-quartier.php.
Orlandini, T., Soares, T., Sousa, T., & Pinson, P. (2019). Coordinating consumer-centric market and grid operation on distribution grid. 2019 16th International conference on the European Energy Market (EEM), 1–6. https://doi.org/10.1109/ EEM.2019.8916247
OurPower. OurPower – die Energiecooperative. https://www.ourpower.coop/. Park, C., & Yong, T. (2017). Comparative review and discussion on P2P electricity
trading. Energy Procedia 128 (2017) 3–9, International scientific conference “Environmental and Climate Technologies”, CONECT 2017, 10–12 May, Riga, Latvia. https://doi.org/10.1016/j.egypro.2017.09.003
Petersen, J.-P. (2016). Energy concepts for self-supplying communities based on local and renewable energy sources: A case study from northern Germany. Sustainable Cities and Society, 26, 1–8. https://doi.org/10.1016/j.scs.2016.04.014
Pfenninger, S., & Staffell, I. (2016). Long-term patterns of European PV output using 30 years of validated hourly reanalysis and satellite data. Energy, 114, 1251–1265. https://doi.org/10.1016/j.energy.2016.08.060
Piclo. Piclo – Building a smarter energy future. https://piclo.energy/. Rakos, B., Stumpf, P., & Nagy, I. (2012). Investigation of the effects of nonlinear model of
super-capacitors in local DC microgrids supplied by renewables. 2012 15th International power electronics and motion control conference (EPE/PEMC). https://doi. org/10.1109/EPEPEMC.2012.6397331. pp. DS3b.11-1-DS3b.11-8.
Renewables.ninja (2019). Renewables.ninja. https://renewables.ninja. Reynolds, J., Rezgui, Y., & Hippolyte, J.-L. (2017). Upscaling energy control from
building to districts: Current limitations and future perspectives. Sustainable Cities and Society, 35, 816–829. https://doi.org/10.1016/j.scs.2017.05.012
Roberts, M. B., Bruce, A., & MacGill, I. (2019a). A comparison of arrangements for increasing self-consumption and maximising the value of distributed photovoltaics on apartment buildings. Solar Energy, 193, 372–386. https://doi.org/10.1016/j. solener.2019.09.067
Roberts, M. B., Bruce, A., & MacGill, I. (2019b). Impact of shared battery energy storage systems on photovoltaic self-consumption and electricity bills in apartment buildings. Applied Energy, 245, 78–95. https://doi.org/10.1016/j. apenergy.2019.04.001
Schram, W., Louwen, A., Lampropoulos, I., & van Sark, W. (2019). The hourly emission factor profiles of Belgium, Spain, France, Italy, The Netherlands, Portugal, Germany and Austria for 2017. http://www.mdpi.com/1996-1073/12/23/4440/s1.
Schram, W., Louwen, A., Lampropoulos, I., & van Sark, W. Comparison of the greenhouse gas emission reduction potential of energy communities. Energies 12. doi: 10.3390/ en12234440.
Sola, A., Corchero, C., Salom, J., & Sanmarti, M. (2020). Multi-domain urban-scale energy modelling tools: A review. Sustainable Cities and Society, 54, 101872. https:// doi.org/10.1016/j.scs.2019.101872
sonnenGroup (2020). sonnenCommunity. https://sonnengroup.com/sonnencommun ity/.
Sorin, E., Bobo, L., & Pinson, P. (2019). Consensus-based approach to peer-to-peer electricity markets with product differentiation. IEEE Transactions on Power Systems, 34(2), 994–1004. https://doi.org/10.1109/TPWRS.2018.2872880
Sousa, T., Soares, T., Pinson, P., Moret, F., Baroche, T., & Sorin, E. (2019). Peer-to-peer and community-based markets: A comprehensive review. Renewable and Sustainable Energy Reviews, 104, 367–378. https://doi.org/10.1016/j.rser.2019.01.036
Staffell, I., & Pfenninger, S. (2016). Using bias-corrected reanalysis to simulate current and future wind power output. Energy, 114, 1224–1239. https://doi.org/10.1016/j. energy.2016.08.068
T. Perger et al.

Sustainable Cities and Society 66 (2021) 102634
19
Tascikaraoglu, A. (2018). Economic and operational benefits of energy storage sharing for a neighborhood of prosumers in a dynamic pricing environment. Sustainable Cities and Society, 38, 219–229. https://doi.org/10.1016/j.scs.2018.01.002
Urbantschitsch, W. (2020). Die Transformation der Energiewirtschaft aus regulatorischer Sicht. https://www.tugraz.at/events/eninnov2020/nach lese/download-beitraege/plena/#c279208.
Vandebron. Vandebron: Duurzame energie van Nederlandse bodem. https://www.van debron.nl.
Walnum, H. T., Hauge, Å. L., Lindberg, K. B., Mysen, M., Nielsen, B. F., & Sørnes, K. (2019). Developing a scenario calculator for smart energy communities in Norway: Identifying gaps between vision and practice. Sustainable Cities and Society, 46, 101418. https://doi.org/10.1016/j.scs.2019.01.003
Zepter, J. M., Lüth, A., del Granado, P. C., & Egging, R. (2019). Prosumer integration in wholesale electricity markets: Synergies of peer-to-peer trade and residential storage. Energy and Buildings, 184, 163–176. https://doi.org/10.1016/j. enbuild.2018.12.003
Zhang, C., Wu, J., Long, C., & Cheng, M. (2017). Review of existing peer-to-peer energy trading projects. Energy Procedia, 105, 2563–2568. https://doi.org/10.1016/j. egypro.2017.03.737, 8th International conference on applied energy, ICAE2016, 8–11 October 2016, Beijing, China.
Zhang, C., Wu, J., Zhou, Y., Cheng, M., & Long, C. (2018). Peer-to-Peer energy trading in a Microgrid. Applied Energy, 220, 1–12. https://doi.org/10.1016/j. apenergy.2018.03.010
T. Perger et al.


![Peer-to-Peer Trading in Electricity Networks: An Overview · 2020. 1. 22. · arXiv:2001.06882v1 [cs.MA] 19 Jan 2020 1 Peer-to-Peer Trading in Electricity Networks: An Overview Wayes](https://img.pdfslide.net/doc/110x75/60a6aff4659b5a4ff801d352/peer-to-peer-trading-in-electricity-networks-an-overview-2020-1-22-arxiv200106882v1.jpg)


![Blockchain for Future Smart Grid: A Comprehensive …and overview of related projects are given in [28]. Surveys in blockchain-based peer-to-peer (P2P) energy trading and decentralized](https://img.pdfslide.net/doc/110x75/5e99edce9f219f34f230e0e4/blockchain-for-future-smart-grid-a-comprehensive-and-overview-of-related-projects.jpg)