Embed Size (px)
Citation preview

Arnulf Jäger-Waldau
October 2016
PV Status Report 2016
EUR 28159 EN
This publication is a Science for Policy report by the Joint Research Centre (JRC), the European Commission’s
science and knowledge service. It aims to provide evidence-based scientific support to the European policy-
making process. The scientific output expressed does not imply a policy position of the European Commission.
Neither the European Commission nor any person acting on behalf of the Commission is responsible for the use
which might be made of this publication.
Contact information
Name: Arnulf Jäger-Waldau
Address: European Commission, Joint Research Centre (JRC), Directorate C – Energy, Transport and Climate,
Via E. Fermi 2749, I-21027 Ispra (VA), Italy
E-mail: [email protected]
JRC Science Hub
https://ec.europa.eu/jrc
JRC 103426
EUR 28159 EN
Print ISBN 978-92-79-63054-5 ISSN 1018-5593 doi:10.2790/749737
PDF ISBN 978-92-79-63055-2 ISSN 1831-9424 doi:10.2790/682995
Luxembourg: Publications Office of the European Union, 2016
© European Union, 2016
Reproduction is authorised provided the source is acknowledged.
How to cite: Arnulf Jäger-Waldau; PV Status Report 2016; EUR 28159 EN; doi:10.2790/682995
All images except cover photo © European Union 2016
Cover photo ©kalafoto – Fotolia.com
Title PV Status Report 2016
Abstract
Photovoltaics is a solar-power technology for generating electricity using semiconductor devices known as solar
cells. A number of solar cells form a solar ‘module’ or ‘panel’, which can then be combined to form solar power
systems, ranging from a few watts of electricity output to multi-megawatt power stations.
Growth in the solar photovoltaic sector has been robust. The Compound Annual Growth Rate over the last 15
years was over 40 %, thus making photovoltaics one of the fastest growing industries at present. The PV Status
Report provides comprehensive and relevant information on this dynamic sector for the interested public, as well
as decision-makers in policy and industry.

PV Status Report 2016
October 2016
Arnulf Jäger-Waldau
European Commission, Joint Research Centre,
Directorate C, Energy Efficiency and Renewables Unit
Via Enrico Fermi 2749, TP 450 I — 21027, Ispra (VA), Italy
EUR 28159 EN

1
PREFACE
In December 2015, the 21st session of the Conference of the Parties (COP21) to the UNFCCC in Paris, France ended with a landmark agreement to keep the maxi-mum global average temperature rise as close as possible to 1.5 °C. With the sig-nature of the European Union (EU) on 5 October 2016, the necessary number of at least 55 Parties to the Convention ac-counting in total for at least an estimated 55 % of the total global greenhouse gas
emissions have deposited their instru-ments of ratification, acceptance, approv-al or accession with the Depositar [UNFC 2016]. Therefore, the Paris Agreement
will enter into force on 4 November 2016 just 3 days before COP22 (7- 18 November 2016) will start in Marra-kesh, Morocco.
The contribution of the EU was defined during the European Council meeting on 23-24 October 2014, when the following
Conclusions on 2030 Climate and Energy Policy Framework were adopted:
The European Council endorsed a bind-ing EU target of at least 40 % domes-tic reduction in greenhouse gas emis-sions by 2030 compared to 1990.
An EU target of at least 27 % is set for the share of renewable energy con-sumed in the EU in 2030. This target will be binding at EU level.
An indicative target at the EU level of
at least 27 % is set for improving en-ergy efficiency in 2030 compared to projections of future energy consump-tion.
On 8 October 2016, at the Climate Minis-terial during the Annual Meetings of the World Bank Group — International Mone-tary Fund the President of the World Bank Group Mr Jim Yong Kim stressed the point that there is no prospect of achieving the
goals set out under the historic Paris Cli-mate Change Agreement if current plans for coal-fired stations, especially those planned for Asia, are built. He called on Ministers to accelerate the transition to low carbon as a matter of urgency and said:
‘Many countries want to move in the right direction. We can and should all help to find renewable energy and energy effi-
ciency solutions that allow them to phase-out of coal. Key to this is creating the right policy environment, building the business environment, implementing good practices like solar auctions, and de-
risking investments in clean energy tech-nology. Private sector interest in renewa-bles is picking up but accelerating that interest will need a big increase in con-cessional finance that is:
Well targeted and ‘follows the carbon’;
Leveraged and blended to crowd in the
private sector; and
Available quickly, at scale and easily
deployed.’
Photovoltaics (PV) is a key technology op-
tion for implementing the shift to a de-carbonised energy supply and can be de-ployed in a modular way almost every-where on this planet. Solar resources in Europe and across the world are abun-dant and cannot be monopolised by one country. Regardless of how fast energy
prices increase in the future, and the rea-sons behind these increases, PV and other renewable energies are the only ones of-fering the stabilisation of, or even a re-duction in future prices.
From 2008 to the second quarter of 2016, residential PV electricity system prices fell by over 80 % in most competi-tive markets, and in an increasing number of markets the cost of PV-generated elec-

2
tricity is already cheaper than residential
electricity retail prices. It is interesting to note that module prices decreased even more, by over 80 %, during the same pe-riod and now represent less than half of the costs of an installed PV system. Due to falling PV system prices and increasing electricity prices, the number of such markets is steadily increasing. Moreover, the nuclear accident which took place in Fukushima in March 2011 has brought about a shift in energy investments to-ward more renewables and PV systems.
In 2015, solar energy attracted 56 % of all new renewable energy investments or USD 161 billion (EUR 142.5 billion). Asset financing for PV energy systems amount-ed to USD 148 billion (EUR 131 billion) out of which about USD 67 billion (EUR 59.3 billion) went to small distributed PV systems.
In 2016, PV industry production rose again although more modestly than in previous years, increasing by about 20 %
and reaching a worldwide production vol-ume of about 60 GW of PV modules. The
compound annual growth rate (CAGR)
over the last 15 years was above 40 %, which makes PV one of the fastest grow-ing industries at present.
The 14th edition of the PV Status Report gives an overview of current trends. Over the last 15 years, the PV industry has grown from a small group of companies and key players into a global business where information gathering is becoming increasingly complex. Any additional in-formation would be most welcome and will be used to update the report.
Ispra, October 2016
Piotr Szymanski Director, JRC Directorate C: Energy, Transport and Climate

3

4
ACRONYMS AND ABBREVIATIONS
ADB Asian Development Bank
ASP average selling price
BNEF Bloomberg New Energy Finance
BOS balance of system
CAGR compound annual growth rate
CAPEX capital expenditure
CEL Clean Energy Certificates
COP Conference of the Parties
CPV concentrating photovoltaics
CWaPE Wallonian Energy Commission
°C degree Celsius
DC direct current
DoE Department of Energy
EEG Energie Einspeisegesetz (energy feed in law)
EU European Union
FiT feed-in tariff
FY financial year
GW Giga Watt
H1 1st half year
IEA International Energy Agency
IMF International Monetary Fund

5
IPP independent power producers
IRENA International Renewable Energy Agency
ITC investment tax credit
JJNSM Jawaharlal Nehru National Solar Mission
JRC Joint Research Centre
KfW Kreditanstalt für Wiederaufbau
kW kilo Watt
LCOE levelised cost of electricity
MASEN Moroccan Agency for Solar Energy
MNRE Ministry of New and Renewable Energy
METI Ministry of Economy, Trade and Industry
MW Mega Watt
NREAP National Renewable Energy Action Plan
OEM original equipment manufacturing
OPEX operational expenditure
O&M operation and maintenance
PPA power purchase agreement
PV photovoltaic
Q1 1st quarter year
RES renewable energy sources
ROC renewable obligation certificate
ROI return on investment
RPS renewable portfolio standard
RTE réseau de transport d’électricité
R & D research and development
SHS solar home system

6
SNEC Shanghai New International Expo Centre
TSO transmission system operator
TW Terra Watt
VAT value added tax
WACC weighted cost of capital
WEO World Energy Outlook
Wh Watt hour
Wp Watt peak

7
CONTENTS
Preface ....................................................................................................................................... 1
Executive Summary .................................................................................................................... 9
1. Introduction ...................................................................................................................... 11
2. The PV market .................................................................................................................. 16
2.1. Europe and Turkey ................................................................................................................... 18 2.1.1. Austria ....................................................................................................................................... 20 2.1.2. Belgium ..................................................................................................................................... 20 2.1.3. Denmark ................................................................................................................................... 21 2.1.4. France ....................................................................................................................................... 21 2.1.5. Germany ................................................................................................................................... 22 2.1.6. Greece ....................................................................................................................................... 23 2.1.7. Italy ........................................................................................................................................... 23 2.1.8. The Netherlands ........................................................................................................................ 23 2.1.9. Spain ......................................................................................................................................... 23 2.1.10. Switzerland ............................................................................................................................... 24 2.1.11. UK............................................................................................................................................. 25 2.1.12. Other European countries and Turkey ...................................................................................... 25
2.2. Asia and the Pacific region ....................................................................................................... 27 2.2.1. Australia .................................................................................................................................... 27 2.2.2. India .......................................................................................................................................... 27 2.2.3. Israel ......................................................................................................................................... 28 2.2.4. Japan ......................................................................................................................................... 28 2.2.5. Malaysia .................................................................................................................................... 29 2.2.6. People’s Republic of China ...................................................................................................... 29 2.2.7. South Korea .............................................................................................................................. 30 2.2.8. Taiwan ...................................................................................................................................... 30 2.2.9. Thailand .................................................................................................................................... 30 2.2.10. Emerging markets ..................................................................................................................... 31
2.3. Americas................................................................................................................................... 35 2.3.1. Canada ...................................................................................................................................... 35 2.3.2. Chile .......................................................................................................................................... 35 2.3.3. Honduras ................................................................................................................................... 35 2.3.4. Mexico ...................................................................................................................................... 35 2.3.5. Peru ........................................................................................................................................... 36 2.3.6. United States of America .......................................................................................................... 36 2.3.7. Emerging markets ..................................................................................................................... 37
2.4. Africa ........................................................................................................................................ 39 2.4.1. Algeria ...................................................................................................................................... 39 2.4.2. Cape Verde ............................................................................................................................... 39 2.4.3. Egypt ......................................................................................................................................... 40 2.4.4. Morocco .................................................................................................................................... 40 2.4.5. South Africa .............................................................................................................................. 40 2.4.6. Emerging markets ..................................................................................................................... 41
3. Electricity costs and the economics of PV systems .......................................................... 44
3.1. LCOE ....................................................................................................................................... 46
3.2. Influence of financing costs on LCOE ..................................................................................... 48

8
3.3. LCOE of residential grid-connected PV systems ..................................................................... 50
3.4. Residential and commercial electricity storage models ........................................................... 54
3.5. LCOE of utility-scale PV systems............................................................................................ 55
4. The PV industry ................................................................................................................ 57
4.1. Technology mix ........................................................................................................................ 58
4.2. Polysilicon supply .................................................................................................................... 59 4.2.1. Silicon production processes ..................................................................................................... 59
4.3. Polysilicon manufacturers ........................................................................................................ 61 4.3.1. GCL-Poly Energy Holdings Ltd. (China) ................................................................................. 61 4.3.2. Wacker Polysilicon AG (Germany, USA) ................................................................................ 61 4.3.3. OCI Company Ltd. (South Korea) ............................................................................................ 61 4.3.4. Hemlock Semiconductor Corporation (USA) ........................................................................... 62 4.3.5. TBEA Silicon Co. Ltd. (China) ................................................................................................ 62 4.3.6. REC Silicon ASA (Norway/USA) ............................................................................................ 62 4.3.7. Tokuyama Corporation (Japan) ................................................................................................ 62 4.3.8. China Silicon Corporation Ltd. (China) .................................................................................... 63 4.3.9. SunEdison Inc. (USA) .............................................................................................................. 63 4.3.10. Daqo New Energy Co. Ltd. (China) ........................................................................................ 63
4.4. Solar-cell production39
companies ........................................................................................ 64 4.4.1. Trina Solar Ltd. (China) ............................................................................................................ 64 4.4.2. JA Solar Holding Co. Ltd. (China) ........................................................................................... 64 4.4.3. Hanwha (China/Germany/ Malaysia/South Korea) ................................................................. 64 4.4.4. Canadian Solar Inc. (China/Canada) ........................................................................................ 65 4.4.5. First Solar LLC (USA/Germany/Malaysia) .............................................................................. 65 4.4.6. JinkoSolar Holding Co. Ltd. (China) ....................................................................................... 65 4.4.7. Yingli Green Energy Holding Co. Ltd. (China) ........................................................................ 66 4.4.8. Motech Solar (Taiwan/China) ................................................................................................... 66 4.4.9. Neo Solar Power Corporation (Taiwan) ................................................................................... 66 4.4.10. Tongwei Solar (Hefei) Co., Ltd. (PRC) .................................................................................... 66 4.4.11. Shunfeng International Clean Energy Ltd. (China) .................................................................. 66 4.4.12. Gintech Energy Corporation (Taiwan)...................................................................................... 67 4.4.13. Zhongli Talesun Solar Co. Ltd. (China).................................................................................... 67 4.4.14. Risen Energy Co., Ltd. (China)................................................................................................. 67 4.4.15. SunPower Corporation (USA/Philippines/Malaysia) ................................................................ 67 4.4.16. Kyocera Corporation (Japan, Czech Republic, Mexico) ........................................................... 68 4.4.17. Changzhou EGing Photovoltaic Technology Co. Ltd. (China) ................................................. 68 4.4.18. Hareon Solar Technology Co. Ltd. (China) .............................................................................. 68 4.4.19. Solartech Energy Corp. (Taiwan) ............................................................................................. 68 4.4.20. Solar Frontier (Japan) ............................................................................................................... 69
5. Conclusions and outlook ................................................................................................. 70
6. Acknowledgements .......................................................................................................... 76
7. References ........................................................................................................................ 77

9
EXECUTIVE SUMMARY
For the 6th year in a row, solar power with
56 % of total investment representing USD
161 billion (EUR 146 billion) took the largest
share of new investments in renewable ener-
gies. These investments were almost evenly
shared between large scale solar power and
distributed solar energy systems.
Over the last 15 years, the production vol-
ume of solar PV has increased with a CAGR of
over 40 %, which makes the industry one of
the fastest growing ones in the world. Until
2006, the solar cell production was dominat-
ed by Japan and Europe. After the rapid in-
crease of the annual production in China and
Taiwan since 2006, a new trend emerged in
2014 to rapidly increase production capaci-
ties in other Asian countries like India, Malay-
sia, Thailand, the Philippines or Vietnam.
Market development for solar PV systems
did not follow the production at the same
pace, which led to overcapacities and massive
price pressure along the production value
chain. This development triggered a consoli-
dation of the manufacturing industry, which is
still ongoing.
In 2015, for the first time, investments in
developing economies for renewable energies
were larger than the investments in devel-
oped ones. In contrast to Europe, where new
investments in renewable energy declined,
new investments increased in almost any
other world region. According to the current
market trends, this development will continue
if no new policies are introduced in Europe.
According to market forecasts, the in-
stalled PV power capacity of 235 GW at the
end of 2015 could double until 2018. At the
end of 2016, worldwide solar PV power is
expected to exceed 310 GW capable to pro-
duce roughly 1.5 % of the worldwide electrici-
ty demand. The EU’s share is about one third
of the installed capacity, which can provide
about 4 % of its electricity demand.
2016 already saw a number of record
breaking power purchase agreements (PPA)
contracts and bids below USD 30/MWh and a
new low was observed with a USD 24.2/MWh
bid for an Abu Dhabi Electricity and Water
Authority’s tender in September 2016. These
very low bids and PPAs, especially in the Unit-
ed Arab Emirates and Chile are only possible
through a combination of excellent solar re-
source, high debt shares and very low debt
costs as well as the fact that some tariffs are
indexed to inflation.
PV is a key technology option for imple-
menting the shift to a decarbonised energy
supply and can be deployed in a modular way
almost everywhere on this planet. Over the
last decades the growth of PV energy use
was mainly driven by public incentives, but
the shift to an economic driven use of solar
PV electricity as one of the lowest cost elec-
tricity supplies is obvious.

10

11
1. INTRODUCTION
Reported production data for the global solar
cell production1 in 2015 vary between
56 GW2 and 61 GW and estimates for 2016
are in the 65 to 75 GW range. The significant
uncertainty in these data is due to the highly
competitive market environment, as well as
the fact that some companies report produc-
tion figures, while others report sales and
again others report shipment figures.
The data presented, collected from stock
market reports of listed companies, market _______________________________________________________
1 Solar cell production mean: - In the case of wafer silicon based solar cells, only the
cells
- In the case of thin-films, the complete integrated module - Only those companies which actually produce the active
circuit (solar cell) are counted
- Companies which purchase these circuits and make solar modules are not counted.
2 Please note that all number are based on the current availa-
ble data (September 2016) and can change, when final an-nual reports of public companies or country statistics are
published during the year.
reports and colleagues, were compared to
various data sources and thus led to an esti-
mate of 60 GW (Fig. 1), representing an in-
crease of about 20 % compared to 2014 and
a similar increase is expected for 2016.
The production volume in 2015 was about
200 times that of 2000, with a CAGR of over
40 %. After the rapid increase of the annual
production in China and Taiwan since 2006 a
new trend emerged in 2014 to increase pro-
duction capacities in other Asian countries like
India, Malaysia, Thailand, the Philippines or
Vietnam. It is interesting to note that a large
portion of these investments is done by Chi-
nese companies. Another trend in the PV in-
dustry was the rapid increase in original
equipment manufacturing (OEM) volumes
since 2011, which allowed larger companies
to significantly increase their shipment vol-
umes without adding new capacity of their
own.
Figure 1: World PV cell/module production from 2005 to 2016 (data source: Photon Magazine [Pho 2012], PV Activities in Japan [Ikk 2016], PV News [Pvn 2015] and own analysis)
0
10
20
30
40
50
60
70
2005 2006 2007 2008 2009 2010 2011 2012 2013 2014 2015 2016e
An
nu
al
Pro
du
cti
on
[G
W]
Year
Rest of World
United States
Malaysia
Japan
Europe
Taiwan
PR China

12
In 2015, worldwide new investments in re-
newable energy reached a new record high. 12
Investments in renewable energy projects
excluding large hydro-electric power plants
reached USD 286 billion (EUR 260 billion3),
which was 5 % higher than in 2014 and even
exceeded the previous record of USD 278
(EUR 214 billion4) in 2011 [FSU 2016]. This
new record was achieved despite significant
strengthening of the dollar and exchange rate
changes, which lowered the dollar value of
investments in other currencies. Also it is
worthwhile to mention, that the previous rec-
ord in 2011 coincided with the peak spending
of various ‘green stimulus’ programmes as
well as the German and Italian solar rooftop
boom. Another interesting development is the
fact that corporate and government research
and development (R & D) spending.
The largest share of these new investments
went into large asset finance (USD
199 billion) and small and distributed capaci-
ty investments (USD 67 billion). This invest-
ment resulted in a new commissioned renew-
able power capacity, excluding large hydro, of
134 GW or 53.5 % of all new power genera-
tion capacity in 2015.
For the 6th year in a row, solar power attract-
ed the largest number of new investments in
renewable energies. The USD 161 billion
(EUR 146 billion) investments in solar energy,
accounted for 56 % of all new renewable en-
1
2
3 Exchange rate 2015: EUR 1.00 = USD 1.10
4 Exchange rate 2011: EUR 1.00 = USD 1.30
ergy investments. After a 23 % decline of
total global investment in solar energy from
USD 154.8 billion in 2011 to 119.1 billion in
2013 investments increased again in 2014
(+ 21 %) and 2015 (+ 12 %) to
USD 143.8 billion and USD 161 billion respec-
tively [FSU 2016]. At the same time, annual
new solar PV system installations increased
from 26.9 GW in 2011 to 51.7 GW in 2015,
driven by a shift to more large scale utility
systems on the one hand and a worldwide
reduction of PV system prices on the other
hand.
The most remarkable change from 2014 to
2015 is that for the first time more invest-
ment in renewable energy was done in devel-
oping economies (+ 19 % and
USD 156 billion) than in developed ones (-
8 % with USD 130 billion).
The leading country in new renewable energy
investment was China with 17 % growth at
USD 102.9 billion (EUR 93.5 billion), followed
by the USA with 19 % growth at
USD 44.1 billion (EUR 40.1 billion) and Japan
at USD 36.2 billion (EUR 32.9 billion), which
was about the same as 2014.
Contrary to the development in other world
regions, renewable energy investments in Eu-
rope fell by 21 % to USD 48.8 billion (EUR
44.4 billion) in 2015. Compared to 2011 the
decline has even been even larger with 60 %
mainly due to a mix of drastic reduction of
support policies and even retroactive cuts for
existing projects in a number of Member
States, the economic downturn — mainly in
Southern Europe — and the significant cost
reductions of solar PV system prices. A nota-
Uncertainties in production statistics
Only a limited number of companies report production figures for solar cells or thin film modules.
Shipment figures can include products from stock, already produced in the previous year.
Some companies report shipments of ’solar products‘ without a differentia-tion between wafers, cells or modules.
The increasing trend towards OEM increases the potential of double counts.

13
ble exception from this trend was the United
Kingdom (UK), which recorded an increase in
renewable energy investments of 25 % to
USD 22.2 billion (EUR 20.1 billion) in 2015.
Overcapacities along the PV value chain were
a result of the very ambitious investments
starting in 2005 and peaking with equipment
spending, excluding polysilicon manufacturing
plants, of about USD 14 billion (EUR
10.8 billion) in 2011 after the PV market
grew by more than 150 % in 2010. Then
equipment spending declined dramatically
and hit the bottom with around USD 2 to
2.5 billion (EUR 1.54 to 1.92 billion) in 2013.
As a result, these overcapacities led to con-
tinuous price pressure along the value chain
and resulted in a reduction of market prices
for polysilicon materials, solar wafers and
cells, as well as solar modules. Between 2008
and 2014, PV module prices have decreased
rapidly by more than 80 %, before they
started to level out and only decreased mod-
erately over the last two years due to indus-
try consolidation and increasing markets,
mainly in China and Japan [Blo 2013, 2016].
These rapid price declines put all solar com-
panies under enormous pressure and access
to fresh capital was and still is key to surviv-
al. Consolidation in the PV manufacturing in-
dustry has led to the closure or takeover of a
significant number of companies since 2009
[Wes 2015]. Despite those bankruptcies and
companies with idling production lines or even
permanent closures of their production facili-
ties, the number of new entrants to the field,
notably large semiconductor, construction or
energy-related companies, is remarkable and
makes a reasonable forecast for future ca-
pacity developments very speculative.
Since the beginning of 2014, the announce-
ments of new capacity expansions have sig-
nificantly increased totalling about 6.6 GW of
thin film and 34 GW of c-Si solar cell capacity
to be realised within the next 18 to 24
months.
However, a closer look reveals that a large
proportion of the thin film expansion an-
nouncements are already cancelled again and
a moderate capacity addition of 1 to 2 GW
will be realised until the end of 2016. The
uncertainty about new capacities additions
for crystalline silicon solar cells is twofold.
First, a number of projects are from industry
players with no solar cell manufacturing rec-
ord and in countries with a limited or no in-
frastructure. Therefore, it is very difficult to
predict if and when these capacities will
eventually be realised. Second, with the ongo-
ing cost pressure and the drive to modules
with higher efficiencies, it is obvious, that
older production lines will be upgraded or
substituted with manufacturing capacities
capable to produce these higher efficient so-
lar cells. Therefore, the overall net capacity
increase of solar cells will be much lower
than the announcements imply
Nevertheless, the general trend still is point-
ing in the direction of more capacity an-
nouncements despite a growing fear of over-
supply. For 2016, capital expenditure (CAPEX)
of new investments in manufacturing is ex-
pected to be more than USD 4.5 billion.
CAPEX for a 1 GW solar silicon solar cell and
module plant has been reduced from about
USD 680 million in the USA and
USD 510 million in China [Goo 2011] in 2011
to USD 430 million (USA) in 2H2014 [Pow
2015] to USD 190 million in China in 2015
[Blo 2016a]. According to the information
gathered at the 10th SNEC International Pho-
tovoltaic Power Generation Conference and
Exhibition (SNEC 2016) in May 2016, CAPEX
for silicon solar cell and module manufactur-
ing equipment (made in China), without infra-
structure and building, can be as low as about
USD 60 million for 1 GW capacity.
It should be noted that the level of oversup-
ply and excess capacity will be different in
the four main parts of the silicon module val-
ue chain, i.e. (1) polysilicon production, (2)
wafer production, (3) solar cell manufactur-
ing, (4) module manufacturing. The current
trend is a lowering of the oversupply in the
first two sectors, whereas the excess capacity

14
gap is growing in the latter two. As a conse-
quence, this development will continue to add
pressure to the margins of most manufactur-
ers. The overall average selling price (ASP) of
modules are decreasing further, due to three
main factors: (1) the already mentioned over-
supply, (2) contracting high price markets like
Japan and (3) a shift of supply to lower price
markets like China or countries with extreme
competitive price bids for PPAs.
Despite the continuing problems of individual
companies, the fundamental industry as a
whole remains strong and the overall PV sec-
tor will continue to experience significant
long-term growth. In August 2016, the IEA
published its fifth Medium-Term Renewable
Energy Market Report, and raised the predict-
ed increased capacity to over 600 GW of cu-
mulative PV installations in 2022 [IEA 2016].
Market predictions for the 2016 PV market
vary from 56 GW according to Bloomberg’s
New Energy Outlook, 66 GW in Greentech
Media’s Global demand Monitor, 66.7 GW by
Mercom Capital’s Solar Market update and
76.7 GW in Solar Power Europe’s high scenar-
io [Blo 2016b, Gtm 2016, Mer 2016, Sol
2016].
For 2017, analysts draw a mixed picture
varying between a 10 % market de- or in-
crease, depending on the market assumptions
for 2016. The biggest uncertainty currently is
the future market development in China. The
ongoing technology development and height-
ened cell and module efficiencies require an
upgrade of older facilities in order to stay
competitive.
The current solar cell technologies are well
established and provide a reliable product,
with a guaranteed energy output for at least
25 to 30 years.
This reliability, the increasing demand for
electricity in emerging economies and possi-
ble interruptions due to grid overloads there,
as well as the rise in electricity prices from
conventional energy sources, all add to the
attractiveness of PV systems.
Over 90 % of current production uses wafer-
based crystalline silicon technology. Projected
silicon production capacities for 2016 vary
between 415 000 tonnes [Blo 2016c] and
426 000 tonnes [Ikk 2016]. It is estimated
that about 28 000 tonnes will be used by the
electronics industry. Potential solar cell pro-
duction will, in addition, depend on the mate-
rial used per Wp (grams per Watt-peak). The
current blended global average is about
4.9 g/Wp.
In general, global CAPEX for PV solar systems
have converged, even if significant differ-
ences still exist due to differences in market
size and local competition and factors like
import taxes, local content rules or existing
tax credits. In the 1st half year (H1) 2016, the
BNEF global benchmark for levelised cost of
electricity (LCOE) in the solar sector was giv-
en with USD 99 per MWh [Blo 2016d], and
the cost share of solar modules in the
benchmark PV system has dropped to about
40 %.
2016 saw new PPAs and bids for PV solar
electricity well below the benchmark and a
record bid as low as USD 24.2 per MWh [Nat
2016]. The tender was for a nominal 350 MW
tender of the Abu Dhabi Electricity and Water
Authority’s (ADWEA) Sweihan solar power
project, but it is expected that the actual size
of the project will be much larger. At the time
of writing, no PPA had been signed yet.
The influence of CAPEX on LCOE of solar PV
electricity has decreased significantly and is
nowhere higher that 40 %. Other costs like
O&M (operations and maintenance) costs,
permits and administration, fees and levies
as well as financing costs make up the rest.
Therefore, these variable and soft costs must
be targeted for further significant cost reduc-
tions.
In countries with a developed electricity grid
infrastructure, the increasing shares of PV
electricity in the grid lead to a growing im-
portance of the economics of integration.
Therefore, more and more attention is fo-
cused on issues such as:

15
development of new business models
for the collection, sale and distribu-
tion of PV electricity, e.g. development
of bidding pools at electricity ex-
changes, virtual power plants with
other renewable power producers,
and storage capacities;
adaptation of the regulatory and legal
procedures to ensure fair and guaran-
teed access to the electricity grid and
market.
The cost of direct current (DC) electricity gen-
erated by a PV module has dropped to below
EUR 0.03/kWh, although a significant addi-
tional cost component relates to transporting
the electricity from the module to where and
when it is needed. Therefore, new innovative
and cost-effective electricity system solutions
overall for the integration of PV electricity are
needed to establish PV electricity as an inte-
gral part of sustainable energy solutions. The
optimisation of solar PV electricity plant de-
sign and operation has direct effect on the
O&M costs, which play an important role for
the economics of the PV installation. With the
continuous decrease of hardware CAPEX, the
non-technical costs, linked to permit applica-
tions and regulations are representing an in-
creasing share of the total costs and need to
be reduced as well. Here, further public sup-
port, especially for regulatory measures, is
needed.

16
2. THE PV MARKET
Annual new solar PV system installations in-
creased from 29.5 GW in 2012 to 53.7 GW in
2015, driven by a shift to more large scale
utility systems on the one hand and a world-
wide reduction of PV system prices on the
other side (Fig. 2).
This represents mostly the grid connected PV
market. To what extent the off-grid and con-
sumer product markets are included is not
clear, but it is believed that a substantial part
of these markets are not accounted for as it
is very difficult to track them. However, with
further increasing market size these seg-
ments become smaller and smaller in relative
terms.
In 2015, China overtook Germany in terms of
cumulative installed nominal PV power and it
is almost certain that Japan will follow in
2016. With a cumulative installed PV power
of almost 95 GW, the EU still accounted for
40 % of the 235 GW solar PV electric power
capacity installed worldwide at the end of
2015. However, this is down from the 66 % in
2012, when the cumulative installed solar PV
electric power had just reached 100 GW
worldwide.
Uncertainties in market statistics
The installation figures of this report are about the physical installation of the system hardware, not the connection to the grid. The grid connection can be delayed due to administrative reasons or in some cases missing grid capacity.
This report uses nominal DC peak power (Wp) under standard test conditions (1 000 W irradiance and standard nominal 25 ºC) for reasons of consistence.
Not all countries report DC peak power (Wp) for solar PV systems, but espe-cially for larger scale system the utility peak AC power, which is relevant for the transmission operator. Even in the Eurostat statistics the two capacities are mixed.
Some statistics only count the capacity which is actually connected or com-missioned in the respective year for the annual statistics, irrespectively when it was actually installed. This can lead to short term differences in which year the installations are counted. This can lead to differences in the annual statis-tics, but levels out in the long-run, if no double counting occurs. E.g.: (1) in Italy about 3.5 GW of solar PV systems were reported under the second conto energia and installed in 2010, but only connected in 2011; (2) the construction period of some large solar farms spread over two or more years. Depending on the regulations – whether or not the installation can be connected to the grid in phases and whether or not it can be commis-sioned in phases, the capacity count is different;
some countries do not have official statistics on the capacity of solar PV sys-tem installations or sales statistics of the relevant components.

17
Figure 2: Annual PV system installations from 2005 to 2016 (data source: [IEA 2016a, Sol 2016, Sys 2016] and own analysis)
Figure 3: Cumulative PV installations from 2005 to 2016 (data source: [IEA 2016a, Sol 2016, Sys 2016] and own analysis)
0
10
20
30
40
50
60
70
80
2005 2006 2007 2008 2009 2010 2011 2012 2013 2014 2015 2016e
An
nu
al In
stal
led
PV
Po
we
r [G
Wp
]
Year
Rest of EU
France
United Kingdom
Italy
Germany
Rest of World
China
United States
Japan
Bracket represents the EU share
0
50
100
150
200
250
300
350
2005 2006 2007 2008 2009 2010 2011 2012 2013 2014 2015 2016e
Cu
mu
lati
ve In
stal
led
PV
Po
we
r [G
Wp
]
Year
Rest of EU
France
United Kingdom
Italy
Germany
Rest of World
China
United States
Japan
Bracket represents the EU share

18
2.1. Europe and Turkey
Market conditions for PV differ substantially
from country to country. This is due to differ-
ent energy policies and public support pro-
grammes for renewable energies, especially
PV, as well as the varying grades of liberali-
sation of domestic electricity markets.
Looking at the electricity system as a whole,
a total of about 27.3 GW of new power gen-
eration capacity were installed in the EU last
year and 18.2 GW were decommissioned, re-
sulting in 9.1 GW of new net capacity (Fig. 4)
[Ewe 2016, Sol 2016, Sys 2016, own analy-
sis]. Renewable energy sources (RES) ac-
counted for 20.6 GW or 75.6 % of all new
power generation capacity. PV electricity gen-
eration capacity accounted for 6.86 GW, or
25.1 % of the new installed capacity.
In terms of new net capacity, wind power was
first with 12.52 GW, followed by solar PV
6.86 GW, solar thermal power plants
370 MW, hydro 239 MW and other sources
127 MW. The net installation capacity for
coal-, oil- and gas-fired power plants as well
as nuclear and biomass was negative, with a
decrease of 3.3 GW, 3.3 GW, 2.4 GW, 1.7 GW
and 0.3 GW, respectively.
Figure 4: New connected or decommissioned electricity generation capacity in the EU in 2015 (data source: [Ewe 2015, Sol 2016, Sys 2016] and own analysis)
Since 2005, solar PV electricity generation
capacity has increased from 1.9 GW to
95.4 GW at the end of 2015 (Fig. 5). Already
in 2014, the 2020 National Renewable Ener-
gy Action Plan (NREAP) target of 83.7 GW
was exceeded, reaching about 88.4 GW.
With a cumulative installed capacity of
95.4 GW, the EU is still leading in PV installa-
tions with 40.6 % of the global total of
235 GW of solar PV electricity generation ca-
pacity at the end of 2015, although this is
down from the 66 % recorded at the end of
2012. The installed PV power capacity in the
EU at the end of 2015 can generate more
than 100 TWh of electricity or almost 4 % of
the final electricity demand in the Union.
At first glance, this development appears to
be a success. However, by looking at the an-
nual installations, it becomes obvious that
Europe’s share is not only declining in relation
to a growing market worldwide, but also in
-10 -8 -6 -4 -2 0 2 4 6 8 10 12 14
Wind
PV
Gas
Coal
Biomass
Hydro
CSP
Oil
others
Nuclear
New Installed or Decomissioned Capacity in 2015 [GW]
Installed Capacity
Decommissioned Capacity

19
actual installation figures (Fig. 6). According
to the IEA Medium-Term Renewable Energy
Market Report 2016, this share will drop be-
low 30 % by 2020 due to a stagnant market
of 7 to 8 GW between 2016 and 2020 [IEA
2016].
Figure 5: Cumulative installed grid-connected PV capacity in EU + candidate countries compared with the NREAP target for 2020 (data source: [Sol 2016, Sys 2016] and own analysis)
Figure 6: Annual installations in EU and candidate countries (data source: [Sol 2016, Sys 2016] and own analysis)
0
20
40
60
80
100
2005 2006 2007 2008 2009 2010 2011 2012 2013 2014 2015 2016e 2018p 2020p
Cu
mu
lati
ve P
ho
tovo
ltaic
Po
wer
[GW
p]
Rest of EU
Greece
United Kingdom
Czech Republic
Belgium
France
Spain
Italy
Germany
NREAP
0
2
4
6
8
10
12
14
16
18
20
2005 2006 2007 2008 2009 2010 2011 2012 2013 2014 2015 2016e
An
nu
al
Ph
oto
vo
ltaic
In
sta
llati
on
s [
GW
p] Rest of EU
GreeceUnited KingdomCzech RepublicBelgiumFranceSpainItalyGermany
20
What are the reasons and main consequences
of this development?
Some Member States had introduced support
schemes which were not designed to react
fast enough to the very rapidly growing mar-
ket and this led to unsustainable local market
growth rates. To counteract this, unpredicta-
ble and frequent changes in the support
schemes, as well as legal requirements, led to
installation peaks before the announced
deadlines and high uncertainty for potential
investors. A number of retroactive changes
have further decreased investment confi-
dence.
One of the consequences is the effect on lo-
cal jobs and the local economy: The growth of
the PV industry in Europe resulted in the gen-
eration of over 260 000 jobs or 38 % of
global employment in the PV sector in 2011
[Jäg 2014]. Over 75 % of these 260 000 jobs
were in operating and installing solar PV elec-
tricity systems. Almost all of them were local
European jobs contributing to the European
gross domestic product (GDP). The steep drop
in new installations from 2011 to 2015 al-
most halved these local jobs and with them
the positive effect on the local European
economy [Ire 2016].
The following sections describe market devel-
opment in some EU Member States, as well
as in Switzerland and Turkey. Official and
more detailed information about the progress
of renewable energy implementation in the
EU can be found on the Renewable Energy
Mapping and Monitoring in Europe and Africa
website of the Joint Research Centre (JRC)
and publications listed there
(http://iet.jrc.ec.europa.eu/remea) [Ban 2015].
2.1.1. Austria
In 2015, Austria installed about 170 MW of
new PV systems and increased the cumula-
tive capacity to 940 MW. The Ökostrom-
Einspeisetarifverordnung 2012 (Eco-
Electricity Act) is the regulation which sets the
prices for the purchase of electricity generat-
ed by green power plants. In addition, there is
a federal investment subsidy programme for
PV systems with a maximum system size of
5 kW and a budget of EUR 8.5 million and an
additional programme for farmers and forest
enterprises for systems between 5 and
30 kWp with a budget of EUR 6.6 million for
2016. The investment is supported with EUR
275/kWp for add-on and ground-mounted
systems and EUR 375/kWp for building-
integrated systems. In addition to these fed-
eral programmes, five federal States have
their own PV programmes and six States have
programmes to support the installation of
electricity storage.
2.1.2. Belgium
The three Belgian regions (Brussels, Flanders
and Wallonia) have individual support
schemes for PV, but one electricity market.
Therefore, some regulations are regional and
others are national. A common denominator
is the fact that all three regions selected an
RPS system with quotas for RES. A net-
metering scheme exists for systems up to
5 kWp Brussels or 10 kWp (Flanders and Wal-
lonia) as long as the electricity generated
does not exceed the consumer’s own electrici-
ty demand.
Since March 2015, a mechanism called
Qualiwatt is used to support residential PV
systems up to 10 kWp in Wallonia. For the
first 5 years after installation, a fixed sum for
the first 3 kWp is paid. The Wallonian Energy
Commission (CWaPE) updates this sum for
each semester to reflect the decrease of PV
system prices. The amount of support is cal-
culated depending on the electricity prices in
the different distribution areas, and varied
between EUR 473 and 586 for 3 kWp in the
second semester of 2016 [CWa 2016].
In the Brussels Capital Region still exists a
green certificate scheme for residential PV
power. For each MWh the producer is entitled
to 2.4 green certificates, which can be sold to
energy suppliers or intermediate companies
[Bru 2015]. The current price is EUR 81.7 per
certificate.

21
In Wallonia, it was planned to introduce a grid
utilization fee in July 2015, but the fee was
annulled by the Court of Appeal of Liège be-
fore its entry into force on the basis of an
appeal of the association ‘Touche pas à mes
certificats verts’.
In 2011, Belgian installations peaked with
over 1 GW of new installations, before start-
ing to decline in 2012. At the end of 2015,
cumulative installed capacity was over
3.25 GW [IEA 2016]. Almost 8 % of Belgian
households are already generating their own
PV electricity, and PV power covered about
3.6 % of the country’s total electricity needs
in 2015 [Sol 2016a].
2.1.3. Denmark
The introduction of a net-metering system
and high electricity prices of EUR 0.295/kWh
resulted in 378 MW of PV systems being in-
stalled in Denmark in 2012. Due to this rapid
development, the regime was already
changed in November 2012 [GoD 2012].
The so called 60/40 programme, which went
into effect on 11 June 2013 was suspended
with immediate effect on 3 May 2016. Under
the scheme PV power systems were eligible
for a maximum reimbursement (bonus plus
market price) of DKK 0.60/kWh (EUR5)
0.080/kWh) during the first 10 years of oper-
ation, and DKK 0.40/kWh (EUR 0.054/kWh)
being applicable for a further 10 years.
The reason for this decision by the Danish
Parliament was the fact that the transmission
system operator (TSO) Energinet.dk in March
and April 2016 received application for
4.5 GW. All applications, which had not been
processed and approved before 3 May 2016
are not eligible for the scheme.
It is not clear yet how many PV systems are
still eligible for the scheme. At the end of
2015, the installed PV power capacity was
about 790 MW [IEA 2016a].
5 Exchange rate: EUR 1.00 = DKK 7.46
2.1.4. France
In 2015, about 850 MW of new PV systems
were installed in France. Total cumulative in-
stalled capacity increased to almost 6.6 GW,
including about 400 MW in the French Over-
seas Departments. Electricity production (con-
tinental France and Corsica) from PV systems
was 7.4 TWh or 1.36 % of the national elec-
tricity generation and 1.56 % of the gross
consumption [Rte 2016].
In 2015, 895 MW of new solar power capaci-
ty was connected in mainland France accord-
ing to Transmission grid operator RTE. About
a quarter of this increase came with the
commissioning of the 230 MW Constantin
plant in Cestas, in the Gironde department, in
September 2015. This facility is connected to
the RTE grid and currently the largest solar PV
farm in Europe. 565 MW of solar capacity are
connected to the RTE grid and another
5 626 MW are connected to the distribution
networks of ERDF, LDCs and EDF-SEI in Corsi-
ca.
On 22 July 2015, France’s National Assembly
adopted the Energy Transition for Green
Growth Act. The legislation aims to reduce
France’s reliance on nuclear to 50 % of power
generation by 2025 and increase the share of
renewable energies in the final gross energy
consumption to 23 % in 2020 and 32 % in
2030 [MEE 2016].
The targets for PV to achieve the 2023 goal
are 10.2 GW installed PV power by 2018 and
between 18.2 and 20.2 GW by 2023. The ma-
jority of these capacity increases will come
from various auctions. In Q3 2016, an auction
is foreseen for systems between 100 and
250 kW (150 MW) and one for systems larger
than 250 kW (500 MW).
The French tariffs for the purchase of elec-
tricity from small solar PV systems for the
third quarter 2016 were set as:
Building integrated systems with capacities
up to 9 kWp: EUR 0.2429 per kWh

22
Rooftop systems:
Capacities [kWp] EUR per kWh
up to 36 0.1272
>36 to 100 0.1213
Ground mounted systems with capacities up
to 12 MW: EUR 0.0565 per kWh
The tariffs are adjusted regularly depending
on the number and capacity of grid connec-
tion requests approved in the previous quar-
ter.
2.1.5. Germany
Since 2013, annual new PV system installa-
tions are on the decline. The annual market
shrank from 7.5 GW and 7.6 GW in 2011 and
2012 to about 3.3 GW in 2013, 1.8 GW in
2014 and 1.4 GW in 2015 [Bun 2016]. A fur-
ther decrease is expected for 2016 to about
1 GW, because in the first half of the year PV
systems with a capacity of just 450 MW were
installed.
The German market growth is directly corre-
lated to the introduction of the Renewable
Energy Sources Act (Erneuerbare Energien
Gesetz EEG) in 2000 [EEG 2000]. This law
introduced a guaranteed feed-in tariff (FiT)
for electricity generated from solar PV sys-
tems for 20 years and already had a fixed
built-in annual reduction which was adjusted
over time to reflect the rapid growth of the
market and corresponding price cuts. Howev-
er, the rapid market growth required addi-
tional adjustments. Until 2008, only esti-
mates of installed capacity existed, so a plant
registrar was introduced on 1 January 2009.
Since May 2012, the FiT has been adjusted on
a monthly basis depending on the actual in-
stallation of the previous quarter. The revision
of the EEG in 2014 changed the system size
for new systems eligible for a feed in tariff
and introduced levels of levies on self-
consumption [EEG 2014]. So far systems with
a capacity of less than 10 kWp are excepted
form the levy. For all other systems, the levy
on each self-consumed kWh is 35 % of the
EEG levy and will increase to 40 % on
1 January 2017.
Since 1 September 2015, owners of new
ground mounted systems have to participate
and win an auction of the Federal Network
Agency.
Since the beginning of 2016 only systems
smaller than 100 kWp are eligible for a feed
in tariff. Larger systems have to market their
electricity directly or take part in auctions. The
feed in tariffs valid from 1 July to
30 September 2016 are:
Systems on residential buildings or sound
barriers:
Capacities [kWp] EUR per kWh
up to 10 0.1231
10 to 40 0.1197
> 40 to 1000 0.1071
Systems on commercial buildings and prem-
ises:
Capacities [kWp] EUR per kWh
up to 100 0.0853
The fact that the tariff for residential PV sys-
tems smaller than 10 kWp (September 2016:
EUR 0.1231/kWh) is now well below the aver-
age variable electricity rate consumers are
paying (EUR 0.224- 0.265/kWh) and the fact
that they are still exempt from the EEG levy
makes self-consumption attractive and is
opening up new possibilities for the introduc-
tion of local storage. Since 1 May 2013, the
Kreditanstalt für Wiederaufbau (KfW) has
been offering low interest loans with a single
repayment bonus of up to 30 % and a maxi-
mum of EUR 600/kW of storage for PV sys-
tems up to 30 kWp [KfW 2013]. The maxi-
mum repayment bonus was limited to EUR
3 000 per system. A new programme stared
on 1 March 2016 [KfW 2016]. Since then the
loan is only available if the maximum injected
power is 50% or less of the nominal power
rating of the PV system. The maximum eligi-
ble amount was set as 25% of EUR 2.000 per
kWp if the PV system and the battery storage
are installed at the same time and EUR 2.200

23
per kWp of the PV system if the system was
installed after 31 December 2012 and more
than 6 months have passed before the bat-
tery storage is added. However, the maximum
eligible amount is reduced by 3% each 6
months starting 1 July 2016. The available
funds for 2016 were already allocated at the
beginning of October 2016 and new applica-
tions are now only accepted from 1 January
2017 on. The programme will be terminated
at the end of 2018.
2.1.6. Greece
In 2009, Greece introduced a FiT scheme
which started slowly until the market acceler-
ated from 2011 until 2013, when
425 MW, 930 MW and more than 1 GW of
new PV system capacity was installed respec-
tively. This boom ended on 10 May 2013,
when the Greek Ministry of Environment, En-
ergy and Climate Change (YPEKA) announced
retroactive changes in the FiT for systems
larger than 100 kWp and new tariffs for all
systems from 1 June 2013. During the first
five months of 2013 almost 900 MW were
installed and increased the total cumulative
capacity to over 2.5 GW. About 2.4 GW were
installed in the Greek mainland and the rest
on the islands. However, most of this increase
took place. Since the only a few tens of MW
have been installed.
The Hellenic Transmission System Operator
SA (HTSO) reported about 2 092 MW of in-
stalled grid-connected PV systems over
10 kW and 351 MW of rooftop PV systems up
to 10 kW at the end of May 2016 [Hts 2016].
These figures do not include the installed ca-
pacity of non-interconnected Greek islands,
which — according to the Hellenic Electricity
Distribution Network Operator SA — reached
about 136 MW at the end of May 2016 [Hed
2016].
2.1.7. Italy
In 2015, Italy connected 298 MW, increasing
cumulative installed capacity to almost
18.9 GW by the end of 2015 according to the
annual report of the Gestore dei Servizi Ener-
getici (GSE) [Gse 2016]. After the Quinto Con-
to Energia (Fifth Energy Bill) ended in July
2013, the only support mechanism is now via
the Scambio sul Posto (self-consumption)
scheme.
According to the Italian national grid operator
TERNA, electricity from PV systems provided
24.68 TWh or 7.8 % of the total electricity
sold in 2015 [Ter 2016]. 16.89 TWh or 8.3 %
of the total generated during the first eight
months of 2016. The highest monthly cover-
age was in August, when PV electricity pro-
vided 11.6 % of the Italian energy supply.
2.1.8. The Netherlands
According to the Dutch Statistical Office, PV
systems with a capacity of 437 MW have
been installed in 2015 bringing the total in-
stalled PV power to 1 485 MW at the end of
the year [Cbs 2016]. The total generated solar
electricity was 1.1 TWh or 0.9 % of the annu-
al demand.
Since 2011, the main incentive has been a
net-metering scheme for small residential
systems up to 15 kW and a maximum of
5 000 kWh/year. Systems larger than 15 kW
can apply for the SED+ scheme, for a maxi-
mum of 1 000 full load hours per year, which
is open for all renewable energy technologies
[RVO 2016].
2.1.9. Spain
Spain declined to fifth place in Europe with
regard to the total cumulative installed ca-
pacity, at 5.4 GW6. Most of this capacity was
installed in 2008 when the country was the
largest market, with over 3.3 GW [IEA 2014].
This was more than twice the expected ca-
pacity and was due to an exceptional race to
install systems before the autumn of 2008,
6 This report gives installed DC capacities, whereas the
Spanish installations were quoted as AC capacity in the past. Therefore, there is a difference between these and the
numbers in the PV status reports before 2014.

24
when the Spanish Government introduced a
cap of 500 MW on annual installations. A re-
vised decree (Royal Decree 1578/2008) set
considerably lower FiTs for new systems and
limited the annual market to 500 MW, with
the provision that two-thirds are rooftop-
mounted and there are no longer any free-
field systems [Bol 2008]. These changes re-
sulted in a sharp fall in new installations.
In January 2012, the Spanish Government
passed the Royal Decree 1/12 [Bol 2012],
which suspended the remuneration pre-
assignment procedures for new renewable
energy power capacity, affecting about
550 MW of planned solar PV installations.
The justification given for this move was that,
until then, Spain’s energy system had
amassed a EUR 24-billion power-tariff deficit;
it is also argued that the special regime for
renewable energy was the main reason. How-
ever, for over a decade, the Spanish Govern-
ment has prevented utilities from charging
consumers the true cost of electricity. Instead
of allowing utilities to increase rates every
time electricity generation costs increased
(due to rising coal or natural gas costs, infla-
tion or to changes in energy or environmental
policy, for example), the government allowed
them to create a scheme similar to a deferral
account, whereby they could recover short-
falls in any individual year from revenues
generated in subsequent years.
By January 2007, the European Commission
had already opened an in-depth investigation
to examine the potential aid to large and me-
dium-sized companies and to electricity dis-
tributors in Spain in the form of artificially
low regulated industrial tariffs for electricity
[EC 2007]. In 2005, these regulated tariffs led
to a deficit of EUR 3.8 billion in the Spanish
electricity system, and amounted to almost
EUR 9 billion in 2007, a time when payments
under the special regime for renewable ener-
gy were still limited.
Despite the Royal Decree 1/12 and other
measures taken in 2012 and 2013, including
the increase in electricity prices and introduc-
tion of new taxes on electricity generation
from the beginning of 2013, the tariff deficit
increased further in 2012 and 2013.
Further attempts to end the tariff deficit led
to the Electricity Act 24/2013 and the Minis-
terial Order IET/1045/2014 of 16 June 2014,
which implemented and supplemented Royal
Decree 413/2014 of 6 June 2014, regulating
the production of electricity from RES, cogen-
eration and waste [Bol 2013, 2014, 2014a].
Together with Royal Decree Act 9/2013 of
12 July 2013 [Bol 2013a], adopting urgent
measures to ensure the financial stability of
the electricity system, these measures form a
complex set of regulations for the remunera-
tion of electricity produced from RES.
Amongst other measures, the Electricity Act
introduced a levy on the self-consumption of
electricity produced by the consumer. After
peaking in 2013 with EUR 28.8 billion the
deficit has now decreased to EUR 25 billion at
the end of 2015 [CNM 2016, Moo 2016].
In 2015, new PV systems were installed with
a capacity of 56 MW. In the same year, elec-
tricity generated from grid connected PV sys-
tems contributed 8.3 TWh or 3.2 % of the
Spanish demand.
2.1.10. Switzerland
In 2015, about 300 MW of PV systems were
installed in Switzerland, increasing the total
capacity to 1.36 GW. After a 40 % price de-
crease in 2012, prices for turnkey systems
fell by a further 12 % in 2013 and a further
5 % until 2015 [Ene 2016]. In 2015, the av-
erage kWp price for installed and connected
systems was CHF 2459 incl. value added tax
(VAT).
A revised energy law came into force on
1 January 2014. The necessary implementa-
tion rules came into force on 1 April 2014,
giving electricity producers the right to self-
consume the electricity they produce, regard-
less of the technology [GoS 2014]. New in-
stalled PV systems with a capacity of be-
tween 2 and 30 kW can receive an invest-
ment subsidy instead of the FiT. The current

25
amount is CHF 1 400 per system and an ad-
dition CHF 500 per kWp. In addition, the in-
vestment for a PV system is tax deductible in
almost all cantons. Surplus electricity from
systems with an investment subsidy can be
sold to the grid operator at market prices be-
tween CHF 0.05 and 0.09/kWh (EUR7 0.046
and 0.082/kWh).
2.1.11. UK
In 2015, PV systems with a power capacity of
about 3.5 GW were connected to the grid in-
creasing the cumulative PV power to 8.9 GW.
PV systems generated about 7.6 TWh or
2.25 % of total electricity generation in 2015.
The old FiT scheme for systems up to 5 MW
closed on 14 January 2016 and a new
scheme opened on 8 February 2016, with
different tariff rates and rules — including a
limit on the number of installations supported
in various capacity bands [GUK 2016]. The
new scheme offers a ‘Generation Tariff’ for
each generated kWh and in addition an ‘Ex-
port Tariff’ for up to 50 % of the generated
electricity, which is not consumed on-site at
the time of generation (self-consumption).
Both tariffs are adjusted each quarter and
depend in addition whether or not the respec-
tive band caps are reached.
Larger systems can participate in Contracts
for Difference Allocation Rounds, but so far
only one was held in 2015 where five pro-
jects with a total capacity of 72 MW won con-
tracts with a strike price of GBP 50 (two pro-
jects with 33 MW) and 79.23 per MWh (three
projects with 39 MW). However, two of the
five projects were withdrawn and one con-
tract was cancelled. So far only one project
was connected to the grid on 30 June 2016
and one project applied for an extension of
the connection date.
7 Exchange rate: EUR 1 = CHF 1.10
The second round planned for October 2015
was cancelled and should now take place at
the end of 2016.
The Renewable Obligation Certificate (ROC)
scheme introduced in 2012 will end on
31 March 2017. Already in 2014, the maxi-
mum size of systems was limited to 5 MW
for this scheme, starting from 1 April 2015,
but larger systems could apply for a grace
period if one of the following criteria were
met [Ofg 2015]:
‘significant investment’: for gener-
ating stations where significant in-
vestments have been made on or be-
fore 13 May 2014;
‘grid delay’: for generating stations
that have been subject to grid connec-
tion delays that are not due to a breach
by a developer;
‘preliminary accreditation’: for gen-
erating stations that were granted pre-
liminary accreditation under the ROC
scheme on or before 13 May 2014.
In the first quarter of 2016, about 1.5 GW of
new solar systems were connected to the grid
and the remaining project pipeline for the
ROC scheme is estimated at around 3.75 GW.
However, industry representatives estimate
that only a third of this capacity can actually
be realised by the 31 March 2017 deadline.
2.1.12. Other European countries and
Turkey
In Croatia, PV systems with a capacity up to
5 MW are eligible for a FiT. According to the
Croatian Energy Market Operator (HROTE),
44.98 MW of PV systems were installed at
the end of June 2016. 12 projects with an
additional 9.39 MW already have signed con-
tracts but are not yet installed [Hro 2016].
Despite high solar radiation, solar PV system
installation in Portugal has grown very slow-
ly, reaching a cumulative capacity of 460 MW
by the end of 2015.
After two years of rapid growth (2010/2011),
the Slovakian market fell by almost 90 %

26
with only 35 MW and 45 MW new installa-
tions in 2012 and 2013 and then again to 1
to 2 MW in 2014 and 2015. The total capaci-
ty of 591 MW is more than three and a half
times the original 160 MW capacity target for
2020, published in the NREAP in 2010.
In March 2010, Turkey’s Energy Ministry un-
veiled the 2010-2014 Strategic Energy Plan.
One of the government’s priorities is to in-
crease the ratio of renewable energy re-
sources to 30 % of total energy generation by
2023. At the beginning of 2011, the Turkish
Parliament passed renewable energy legisla-
tion which defines new guidelines for FiTs.
The FiT was USD 0.133/kWh (EUR 0.10/kWh)
for owners commissioning a PV system be-
fore the end of 2015. If ‘made in Turkey’
components are used, the tariff was in-
creased by up to USD 0.067 (EUR 0.052), de-
pending on the material mix. To take ad-
vantage of these local procurement rules,
factories have been set up by Anel Enerji,
Atsco Solar and China Sunergy to produce PV
modules. The first licensing round for a vol-
ume of 600 MW, which closed in June 2013,
was oversubscribed by about 15 times with
close to 9 GW of projects submitted to the
Turkish Energy Regulatory Authority. However,
no licence for PV installations above 1 MW
had been approved by the end of 2013. The
market started to take off in 2014 with
40 MW installed and a fivefold increase to
208 MW in 2015 [IEA 2015, 2016a]. Market
expectations for 2016 aim at 1 GW of cumu-
lative installed solar PV power at the end of
2016.

27
2.2. Asia and the Pacific region
Asia and the Pacific region continued its up-
ward trend in annual installations of PV elec-
tricity system. The reasons for this develop-
ment range from falling system prices,
heightened awareness, favourable policies
and the sustained use of solar power for rural
electrification projects. Countries such as Aus-
tralia, China, India, Indonesia, Japan, Malay-
sia, the Philippines, South Korea, Taiwan,
Thailand and Vietnam continue a very positive
upward trend, thanks to governmental com-
mitment to the promotion of solar energy and
the creation of sustainable cities.
In 2015, more than 34 GW of new PV elec-
tricity generation systems were installed in
the region, which corresponds to roughly two
thirds of the world wide new PV power in-
stalled in 2015. The largest market was China
with 16 to 18 GW, followed by Japan with
about 11 GW and India with over 2 GW. In
2016, a market increase to over 45 GW is
possible.
2.2.1. Australia
In 2015, more than 900 MW of new solar PV
electricity systems were installed in Australia,
bringing the cumulative installed capacity of
grid-connected PV systems to over 5 GW. As
in the previous years the market was domi-
nated by grid-connected residential systems.
In the meantime, more than 1.5 million
homes have been equipped with PV systems
bringing the national penetration to an aver-
age of 16.5 %, and in some areas it even ex-
ceeds 30 %. The average PV system price
paid by the customer for a grid-connected
system fell from AUD 6/Wp (EUR 4.29/Wp8) in
2010 to AUD 3.9/Wp (EUR 2.89/Wp9) in 2011,
AUD 3.0/Wp (EUR 2.4/Wp10) in 2012,
AUD 2.5/Wp (EUR 1.85/Wp9) in 2013, below
8 Average exchange rate for 2010: EUR 1 = AUD 1.40
9 Average exchange rate for 2011 and 2013: EUR 1 = AUD 1.35
10 Average exchange rate for 2012: EUR 1 = AUD 1.25
AUD 2.0/Wp (EUR 1.38/Wp11) in the middle of
2014 and AUD 1.62/Wp12 (EUR 1.08/Wp) at
the beginning of August 2016 [Sol 2016b]. As
a result, the cost of PV-generated electricity
has fallen to, or is even below, the average
residential electricity rate of AUD 0.27/kWh
(EUR 0.18/kWh).
In 2015, PV electricity systems generated
about 5.6 TWh or 2.3 % of Australia’s total
electricity. The total renewable electricity
share was 14.6 % and this should increase to
20 % by 2020. For 2016, the market forecast
is about 700 MW.
2.2.2. India
For 2015, market estimates for solar PV sys-
tems vary between 2.0 and 2.2 GW, due to
the fact that some statistics cite the financial
year (FY) and others the calendar year. Ac-
cording to the country’s Ministry of New and
Renewable Energy (MNRE), at the end of July
2016, the total solar power capacity was
7.8 GW [GoI 2016].
In January 2010, the Indian Jawaharlal Nehru
National Solar Mission (JJNSM) was launched,
in the hope that it would give impetus to the
grid-connected market. The JJNSM aimed to
make India a global leader in solar energy
and envisages an installed solar generation
capacity of 20 GW by 2022, 100 GW by
2030, and 200 GW by 2050. In 2015, the
target was updated by the National Solar
Mission Group of MNRE to 100 GW by 2022
[GoI 2015].
Following the installation of just a few MW in
2010, in 2011 and 2012 installations began
to pick up in 2013 (1 GW), 2014 (0.5 GW) and
2015 with market expectations for 2016 and
2017 in the order of 4 to 5 GW and 8 GW
respectively.
11 Average exchange rate for 2014: EUR 1 = AUD 1.45
12 Average exchange rate for first 7 months 2016: EUR 1 =
AUD 1.50

28
2.2.3. Israel
A FiT was introduced in Israel in 2008 and 4
years later the grid-connected PV market saw
about 60 MW of newly connected capacity. In
addition, in 2009, a renewable portfolio
standard (RPS) was defined, although it took
until 2011 to be completed. One of the main
drivers behind the development of solar en-
ergy is energy security, and in November
2015 at COP21 in Paris, the government de-
clared a new goal of 17 % alternative energy
use by 2030 a significant increase from the
then 2 %. On 3 August 2016, the Knesset
passed a bill to eliminate taxes on residential
solar and wind installations. At the end of
2015, almost 900 MW of cumulative solar PV
power were installed and market expectations
for 2016 range from 250 to 350 MW.
2.2.4. Japan
In 2015, the Japanese PV market grew by
about 11 % to 10.8 GW. Cumulative installed
capacity reached 34.2 GW at the end of 2015
[Ikk 2016]. In 2015, solar PV systems gener-
ated 34.1 TWh and provided about 3.5 % of
the total electricity consumption.
Under the FiT scheme, introduced in July
2012 and amended in the following years
[METI 2013], 79.9 GWAC13 had received ap-
proval until the end of FY 2015 (end of March
2016). However, this is down from the
82.6 GWAC approved by the end of FY 2014.
Until the end of FY 2015, projects with a total
capacity of 27.3 GWAC had been commis-
sioned and are in operation.
Already in 2013 a significant discrepancy be-
tween actual installations and permits given
emerged and as a consequence, the Ministry
of Economy, Trade and Industry (METI) start-
ed to revise the list of projects according to
their actual status in October 2013. Then it
began to revoke permits for projects that had
13 Please note that the METI capacity statistics is AC-based
and is converted by the New Energy Development Organi-
sation in DC-figures.
failed to secure land and equipment by given
deadlines.
Until 2010, residential rooftop PV systems
represented about 95 % of the Japanese
market. Since 2011, due to changes in the
permit system, large ground-mounted sys-
tems as well as large commercial and indus-
trial rooftop systems started to increased
their market share and reached more than
90 % in 2015. Of the 79.9 GWAC approved by
the end of March 2016, only 4.6 GWAC or
5.8 % comprised systems smaller than
10 kWp. However, almost 87 % of these sys-
tems were actually connected to the grid. PV
systems with capacities over 1 MW repre-
sented 50 % of the approved capacity, but
only 22 % of them had started operation.
For new projects approved after 1 April 2016,
the following tariffs apply: for commercial
installations (total generated power) larger
than 10 kWp, the tariff is now JPY 24/kWh
(EUR14 0.209/kWh) for 20 years. For residen-
tial installations (surplus power) smaller than
10 kWp the FiT is JPY 33/kWh (EUR
0.287/kWh), if the system is equipped with an
output control device or JPY 31/kWh (EUR
0.270/kWh) without such a device for 10
years [METI 2016].
As a consequence of the accident at the Fu-
kushima Daiichi Nuclear Power Plant in March
2011 the country’s energy strategy was re-
shaped. An official target of 28 GWAC was set
for PV power in 2020, which was already sur-
passed in FY 2015. In July 2012, a METI pan-
el proposed the long-awaited plan to reform
the country’s power market, and Japan’s 4th
Strategic Energy Plan was published in April
2014 [METI 2014]. During the COP21, Japan
proposed to reduce its greenhouse gas emis-
sions by 26 % by 2030.
On 25 May 2016, the bill for the revision of
the Act on Special Measures Concerning Pro-
curement of Electricity from RES by Electricity
14 Exchange rate: EUR 1 = JPY 115

29
Utilities was enacted and will officially be ap-
plied from 1 April 2017 onward. The bill itself
is not very specific about the new rules to be
put in place, but a METI committee released
documents in April which could indicate the
possible policies to be adopted in the Ministry
ordinances when implementing the law. It can
be expected that reverse auctions with capac-
ity quotas will be implemented for larger PV
plants.
2.2.5. Malaysia
The Malaysia Building Integrated Photovoltaic
Technology Application Project was initiated
in 2000, and by the end of 2009 a cumula-
tive capacity of about 1 MW of grid-
connected PV systems had been installed.
The Malaysian Government officially
launched its Green Technology Policy in July
2009 to encourage and promote the use of
renewable energy for Malaysia’s future sus-
tainable development. By 2015, about 1 GW
must come from RES, according to the Minis-
try of Energy, Green Technology and Water.
In April 2011, renewable energy FiTs were
passed by the Malaysian Parliament with the
target of 1.25 GW being installed by 2020.
For the period from December 2011 to June
2014, PV had been allocated a total quota of
125 MW. The tariffs are set by the Sustaina-
ble Energy Development Authority (SEDA) for
each year. For 2016 the tariffs are between
MRY 0.416 and 0.829/kWh (EUR 0.091 to
0.181/kWh15), depending on the type and sys-
tem size. In addition, there are small bonuses
if the systems are used in buildings or build-
ing material as well as for local module or
inverter use. According to SEDA, PV systems
with more than 264 MW of capacity received
the FiT and were operational by the end of
August 2016, while another 100.7 MW had
already been approved but not yet started
operation [Sed 2016].
15 Exchange rate: EUR 1.0 = MRY 4.5677
First Solar (USA), Hanwha Q CELLS (Ko-
rea/China/Germany), AOU/SunPower (Tai-
wan/USA) Jinko Solar (PRC), and TS Solartech
have set up silicon solar cell or CdTe-thin film
manufacturing plants in Malaysia, amounting
to more than 5.6 GW of production capacities.
In addition, there are another seven smaller
silicon module manufacturing companies.
2.2.6. People’s Republic of China
In 2015, the Chinese PV market was not only
the largest worldwide, but also took the first
place in terms of total cumulative capacity.
According to the National Survey Report of
IEA PVPS 15.1 GW of solar PV power was
connected to the grid in 2015 increasing the
total grid connected capacity to slightly over
43 GW [IEA 2016b]. The actual installed ca-
pacity could have been 20 to 25 % higher as
reported by some consultancy companies, but
not all was connected to the grid [Blo 2016c,
Hil 2016]. Taking these figures into account,
the total cumulative installed capacity could
have increased to about 46 to 47 GW at the
end of 2015. This assumption is supported by
recent reports about the grid connection of
20 to 22 GW in the first half year of 2016
well above NEA’s 2016 target of 18.1 GW
published in June 2016.
The 2016 International Energy Agency (IEA)
Renewable Energy Medium-Term Market Out-
look expects an increase of total cumulative
installed capacity to over 150 GW in 2021
[IEA 2016].
According to the 13th Five Year Plan (2016-
2020) adopted on 16 March 2016, China in-
tends to continue cut its carbon footprint and
become more energy efficient. The share of
non-fossil energy should increase from 12 %
in 2015 to at least 15 % by 2020. Further
targets are 18 % fewer carbon dioxide emis-
sions and 15 % less energy consumption per
unit of GDP in 2020 compared to 2015. Un-
der this Plan, investment in non-fossil power

30
should be RMB 2.3 trillion (EUR16 309 billion)
and about RMB 2.6 trillion (EUR 349 billion)
are foreseen for the upgrade of the grid in-
frastructure of which RMB 1.7 trillion are in-
tended for the distribution network [Cai 2015,
Wan 2016].
2.2.7. South Korea
In 2015, about 1 GW of new PV systems were
connected to the grid in South Korea, bringing
the cumulative capacity to a total of almost
3.5 GW [IEA 2016a]. Since January 2012, Ko-
rea’s RPS has officially replaced the FiTs. Be-
sides the RPS, Korea supports PV installations
by the ‘One Million Green Homes Programme’,
a building subsidy programme, a regional de-
velopment subsidy programme, and the New
and Renewable Energy (NRE) Mandatory Use
Programme for public buildings.
The RPS mandates utilities with more than
5 000 MW generation capacity to supply 4 %
of their electricity from NRE in 2016, increas-
ing by 1 % per year to 10 % by 2022. The
renewable energy mix in the Korean RPS is
defined as the proportion of renewable elec-
tricity generation to the total non-renewable
electricity generation. PV had its own RPS set-
aside quota of for the period between 2012
and 2015.
Under the RPS, income for power generated
by RES is a combination of the wholesale sys-
tem’s marginal electricity price plus the sale
of renewable energy certificates (RECs). De-
pending on the type of solar installation, the
RECs are then multiplied by a REC multiplier,
varying between 0.7 for ground-mounted
free-field systems to 1.5 for building-adapted
or floating PV systems.
2.2.8. Taiwan
In June 2009, the Taiwan Legislative Yuan
gave its final approval on the Renewable En-
ergy Development Act to bolster the devel-
16 Exchange rate September 2016: EUR 1.0 = CNY 7.45
opment of Taiwan’s green energy industry.
The goal was to increase Taiwan’s renewable
energy generation capacity by 6.5 GW to a
total of 10 GW within 20 years. The targets
for installed PV capacity were 750 MW by
2015 and 3.1 GW by 2030. The 2030 figures
were gradually increased and stood at
8.7 GW at the end of 2015. Between 2009
and 2015, a total capacity of about 1 GW
was connected to the grid [IEA 2016a].
In June 2016, just a month after the new
president Tsai Inn-Weng took office, the Min-
ister of Economic Affairs announced the new
target of 20 GW PV power by 20205. The
new planning foresees the installation of over
1.4 GW between July 2016 and July 2018.
At the end of August 2016, the Bureau of
Energy under Taiwan’s Ministry of Economic
Affairs (MOEA) has set tentative FiT rates for
PV electricity to be generated in 2017 [Hwa
2016]. The tariffs for the three categories
are:
Type of system TWD (EUR17) per kWh
ground-mounted 4.35 (0.123)
mounted on sur-
face of water
4.87
(0.137)
rooftop 6.02 (0.170)
2.2.9. Thailand
Thailand enacted a 15-year Renewable Ener-
gy Development Plan in early 2009, with a
target to increase the renewable energy
share to 20 % of the country’s final energy
consumption in 2022. Besides a range of tax
incentives, solar PV electricity systems were
eligible for a feed-in premium or ‘Adder’ for a
period of 10 years. The original THB 8/kWh
(EUR18 0.190/kWh) Adder (facilities in the
three southern provinces and those replacing
diesel systems are eligible for an additional
THB 1.5/kWh (EUR 0.036/kWh)) was reduced
to THB 6.5/kWh (EUR 0.155/kWh) for those
17 Exchange rate: EUR 1 = TWD 35.5
18 Exchange rate: EUR 1 = THB 42

31
projects not approved before 28 June 2010.
The original cap of 500 MW was increased to
2 GW at the beginning of 2012, as the origi-
nal target had been highly oversubscribed. In
addition to the Adder programme, projects
were being developed with PPAs.
In July 2013, Thailand’s National Energy Poli-
cy Commission (NEPC) increased the solar
generation target to 3 GW and approved FiTs
for rooftop ( 100 MW for systems smaller
than 10 kW and 100 MW for systems be-
tween 10 kW and 1 MW) as well as communi-
ty-owned ground-mounted solar plants, in
addition to the Adder scheme. The FiTs were
set at THB 6.96/kWh (EUR 0.166/kWh) for res-
idential size systems, THB 6.55/kWh (EUR
0.156/kWh) for medium-sized building sys-
tems and industrial plants (< 250 kW) and
6.16 THB/kWh (0.147 EUR/kWh) for large
building and industrial plants.
At the end of 2015, grid-connected PV had a
capacity of about 1.42 GW, of which 121 MW
were connected in that year [IEA 2016a].
The 2015-2036 Alternative Energy Develop-
ment Plan (AEDP 2015) was approved by the
NEPC on 17 September 2015 [MoE 2015].
The plan aims to increase the use of solar
energy with installation capacity of 6 GW by
2036.
2.2.10. Emerging markets
Bangladesh: In 1997, the Government of
Bangladesh established the Infrastructure
Development Company Limited (IDCOL) to
promote economic development in Bangla-
desh. In 2003, IDCOL started its Solar Energy
Programme to promote the dissemination of
solar home systems (SHS) in the remote rural
areas of Bangladesh, with financial support
from the World Bank, the Global Environment
Facility, the German KfW, the German Tech-
nical Cooperation, the Asian Development
Bank (ADB) and the Islamic Development
Bank. At the end of 2015, more than
4.5 million SHSs (50-60 W) had been in-
stalled in Bangladesh [Ire 2016a]. According
to the International Renewable Energy Agency
(IRENA), over 127 000 people now work in the
PV sector in Bangladesh.
The Renewable Energy Development Targets
call for an additional 3 100 MW of renewable
energy capacity to be installed by 2021. Most
of the new capacity will be provided by solar
(1 676 MW, 54 %) and wind (1 370 MW,
44 %). There are also targets for waste-to-
energy (40 MW), biomass (7 MW), biogas
(7 MW) and hydro (4 MW).
Indonesia: In February 2014, the Indonesian
Parliament adopted a revised National Energy
Plan (NEP14), which replaces the 2006 Na-
tional Energy Plan and it went into force as
Government Regulation No 79/2014 on
17 October 2014 [RoI 2014]. The plan aims
23 % share of NRE of the primary energy
supply in 2025. In June 2016, Indonesia’s
Ministry of Energy and Mineral Resources
(ESDM) issued Decree ESDM 19/2016, which
aims for 5 GW of new solar power to be in-
stalled within the next 2 to 3 years [MEM
2016]. The regulation sets quotas for the dif-
ferent parts of the country as well as FiTs,
which range between USD 0.145 and 0.25 per
kWh. The first nationwide total quota is
250 MW, with the largest share of 150 MW
for Java, and the smallest quota for Papua
and West Papua with 2.5 MW each. Total in-
stalled PV power in Indonesia is estimated
around 50 MW at the end of the first half of
2016.
Jordan: In 2007, when renewable energy
accounted for only 1 % of the energy con-
sumption, the Government of Jordan devel-
oped an ambitious Energy Master Plan to in-
crease the share of renewables to 7 % in
2015 and 10 % in 2020. In April 2012, Jor-
dan implemented the Renewable Energy and
Energy Efficiency Law No 13, which estab-
lished a fund to support up to 500 MW of
renewable power [GoJ 2012]. According to the
Middle East Solar Industry Association, PV
capacity in Jordan was about 30 MW at the
end of 2015 [Mes 2016]. A further 320 MW
are under execution, and a further 120 MW

32
are tendered in 2016. Three out of the four
winners (50 MW each) of the second solar
tender (200 MW) offered power prices of
around USD 60 per MWh.
There is one module manufacturer with a
nominal capacity of 120 MW located in Am-
man.
Kazakhstan: The development of renewable
energy was one of the priorities of the State
Programme of Accelerated Industrial and In-
novative Development for 2010-2014. The
main goal is to develop a new and viable
economy sector for growth, innovation and
job creation. In addition, it drives the devel-
opment of RES for the electricity sector in
Kazakhstan and is regulated by the Law on
Supporting the Use of Renewable Energy
Sources, adopted in 2009 [RoK 2009]. In Feb-
ruary 2013, the Kazakh Government decided
to install at least 77 MW of PV by 2020 [GoK
2013]. In September 2014, during a confer-
ence organised by Astana Solar, plans were
discussed to build 28 PV plants with over
700 MW capacity up until 2020 [Kaz 2014].
In 2011, JSC NAC Kazatomprom and a French
consortium headed by Commissariat à
l’énergie atomique et aux énergies alterna-
tives (CEA) jointly began the Kaz PV project
which aims to produce PV modules based on
Kazakhstan silicon [Kaz 2011]. The first stage
of the project was concluded in January
2013, when a new 60 W PV module produc-
tion plant was opened in Kazakhstan’s capital
city Astana.
In January 2014, a 2 MW ground-mounted
solar power plant was completed in the city
of Kapchagay in the Almaty Province [Bis
2014]. At the end of 2015, the total PV ca-
pacity was estimated at about 55 MW, and
should increase to about 200 MW for the
opening of EXPO 2017.
Myanmar: In 2015/16, the country has a ru-
ral electrification rate of about 34 %, with
vast regions beyond the reach of the main
grid. In February 2014, the government pub-
lished its Draft Electricity Law which includes
the possibility of setting up small power pro-
ducers in Myanmar. The World Bank commis-
sioned a study — ‘Myanmar National Electrifi-
cation Program (NEP) Roadmap and Invest-
ment Prospectus’ — which should develop a
plan to realise 100 % rural electrification by
2030.
The Asia Development Bank published a re-
port in March 2014 which revealed that about
11 % of the population in the Mandalay Re-
gion was already using PV SHS with 80 to
200 W [ADB 2014]. About 4.5 % of all villag-
es were electrifies with solar systems at the
end of 2015. In the first phase (2016-2021)
of the national energy plan 2016-2021, it is
foreseen that 461 000 households in Saga-
ing, Ayeyarwady and Thanintharyi regions as
well as Kayin, Chin, Rakhine and Shan states
will be electrified by solar systems. The first
grid connected systems are expected to be-
come operational in the 1st quarter
(Q1) 2017.
Pakistan: In December 2006, the Govern-
ment of Pakistan introduced the ‘Policy for
Development of Renewable Energy for Power
Generation’, which set a target of 9.7 GW of
electricity generation capacity from RES by
2030 [GoP 2006]. In 2015, a FiT was intro-
duced ranging between USD 0.142 and 0.151
per kWh depending on the size and location
of the system. It was estimated that about
1 GW of solar power was installed in Pakistan
at the end of 2015 [IEA 2016a].
Market expectations range between 0.5 and
1 GW for 2016. In June 2016, Pakistan’s Na-
tional Electric Power Regulatory Authority
(NEPRA) has published its proposal for the
revised FiTs for solar energy projects with
capacities between 1 and 100 MW. The tariff
is paid for 25 years with a higher tariff for
the first 13 years and a decreased tariff for
the remaining 12 years. According to Mercom,
the levelised tariff for the full 25 years dura-
33
tion is PKR 9.923 (EUR19 0.086) per kWh for
the southern region while PKR 10.507
(EUR 0.091) per kWh for the north [Mer
2016a].
The Philippines: The Renewable Energy Law
was passed in December 2008 [RoP 2008].
Under the law, the Philippines must double
the energy derived from RES within 10 years.
On 14 June 2011, Energy Secretary Rene Al-
mendras unveiled the new Renewable Energy
Roadmap which aims to increase the share of
renewables to 50 % by 2030. The pro-
gramme will endeavour to boost renewable
energy capacity from the current 5.4 GW to
15.4 GW by 2030.
In early 2011, the country’s Energy Regulator
National Renewable Energy Board (NREB)
recommended a target of 100 MW of solar
installations to be implemented in the country
over the next 3 years. It was suggested that a
FiT of PHP 17.95/kWh (EUR 0.299/kWh20) was
to be paid from January 2012 onwards. For
2013 and 2014, an annual digression of 6 %
was foreseen. The initial period of the pro-
gramme is scheduled to end on 31 December
2014.
On 27 July 2012, the Energy Regulatory
Commission decided to lower the tariff in
view of lower system prices to PHP 9.68/kWh
(EUR 0.183/kWh21) and confirmed the digres-
sion rate. The new FiT for systems installed
after 15 March 2016 is expected to be be-
tween PHP 7- 8 per kWh (EUR22 0.-0.150 per
kWh).
The Department of Energy (DoE) reported
that, by the end of June 2016, more than
4.4 GW of PV projects had been approved
under the Renewable Energy Law and another
2.9 GW were pending [RoP 2016]. Out of the
543 MW of operational PV power only
19 Exchange rate: EUR 1 = PKR 116
20 Exchange rate for 2011: EUR 1 = PHP 60
21 Exchange rate for 2012: EUR 1 = PHP 53
22 Exchange rate for 2016: EUR 1 = PHP 53.5
3.2 MW were for commercial self-
consumption.
Singapore: In June 2012, the Energy Conser-
vation Law was published which aims to re-
duce Singapore’s energy intensity by 35 %
from its 2005 levels by 2030 [GoS 2012]. In
January 2014, the Sustainable Energy Asso-
ciation of Singapore (SEAS) published a White
Paper sketching the pathway to installing
2 GW of PV by 2025 [Sea 2014]. According to
the Energy Market Authority of Singapore,
99.4 MW of grid connected systems were in-
stalled at the end of June 2016 [EMA 2016].
United Arab Emirates (UAE): At the mo-
ment the UAE has no federal energy policy,
because the constitution gives autonomy in
management and regulation of energy and
resources to the individual emirates. Never-
theless, there is growing recognition of the
need for coordination, consistency, and co-
investment among emirates and the Ministry
of Energy is now leading the country’s first
effort to develop a national strategy. IRENA
has developed a Renewable Energy Roadmap
for 2030, which calls for 21 GW of solar PV
power to be installed by 2030 [Ire 2015]. Ac-
cording to a press report by ‘The National’,
the UAE is aims to generate 25 % of its elec-
tricity with clean energy (nuclear and solar)
by 2030 [Nat 2016a]. At the end of 2015
about 28 MW of PV power was operational.
In January 2015, a consortium led by ACWA
Power (Saudi Arabia), won the bid of the
260 MW Phase II (200 MWAC) of the Moham-
med bin Rashid Al Maktoum Solar Park (Du-
bai) with a bid of USD 5.84/kWh for a 25-year
PPA starting in 2017 [Acw 2015]. The third
phase of 800 MWAC was won by a consortium
led by Masdar with a bid of USD 29.9 per
MWh [Mub 2016]. The project will be commis-
sioned in three steps:
200 MWAC by April 2018,
300 MWAC by April 2019 and
300 MWAC by April 2020.

34
In September 2016, a consortium led by Jink-
oSolar (China) and Marubeni (Japan) Abu en-
tered a bid of USD 24.2 per MWh for the Abu
Dhabi Electricity and Water Authority’s
(ADWEA) Sweihan solar power tender [Nat
2016].
Vietnam: In December 2007, Vietnam’s Na-
tional Energy Development Strategy was ap-
proved. It prioritises the development of re-
newable energy and includes the following
targets: to increase the share of renewable
energies from negligible to about 3 %
(58.6 GJ) of total commercial primary energy
in 2010, to 5 % in 2020, 8 % (376.8 GJ) in
2025, and 11 % (1.5 TJ) in 2050. The updat-
ed Power Development Plan 2011-2020,
which was approved by the Prime Minister in
March 2016 set new targets for PV power:
850 MW by 2020 and 12 GW by 2030 [PMV
2016].
At the end of 2015, about 7 MW of PV sys-
tems had been installed, mainly in off-grid
applications. According to the Electricity Regu-
latory Authority, two solar farms with about
50 MW were under construction in June 2016.
After three projects in solar-cell manufactur-
ing stalled in Vietnam, the first solar cell and
module manufacturing plant, operated by
Boviet Solar Technology Co. Ltd. and located
in Bắc Giang, started production in June
2014. According to the company, it has a pro-
duction capacity of 200 MW in the first
phase. The company is a subsidiary holding
company of Powerway Group (PRC).

35
2.3. Americas
2.3.1. Canada
In 2015, about 600 MW of new PV power
were connected to the grid and increased the
total cumulative installed PV capacity to
2.5 GW [IEA 2016a]. Most of the systems are
installed in Ontario, which has three pro-
grammes to support PV installations:
Micro-FiT: Homeowners and other eli-
gible participants can install a small or
‘micro’ renewable electricity generation
project (10 kW or less in size) on their
property. Under this programme, own-
ers will be paid a FiT over a 20-year
term for all the electricity produced and
delivered to the province’s electricity
grid.
FiT: This programme is for systems be-
tween 10 and 500 kW and approved
projects receive a FiT for the electricity
produced over a 20-year contract peri-
od.
Net-Metering: Electricity consumers in
Ontario who produce some of their own
power from a renewable resource (sys-
tems up to 500 kW) can participate in
the ‘net-metering’ initiative.
Most other provinces have a net-metering
scheme. Ontario’s Long-term Energy Plan sets
a target of 10.7 GW of non-hydro RES by
2021.
2.3.2. Chile
On 30 December 2015, the President of Chile
Michelle Bachelet, signed the Supreme Decree
approving Chile’s new long-term energy
strategy ‘Energy 2050’ [GoC 2015]. The new
policy sets a goal of generating 70 % of na-
tional electricity generation from renewable
sources by 2050.
In the first quarter of 2012, the first MW-size
PV system was installed in the northern Ata-
cama Desert. More than 440 MW of PV power
was connected to the grid in 2015, increasing
the total PV capacity to about 850 MW at the
end of 2015 [IEA 2016a].
On 17 August 2016, Comisión National de
Energía announced the results of electricity
auction ‘2015/01’. The lowest bid for a PPA,
fixed in USD for 20 years, came from a solar
project to deliver 255 GWh/year at USD 29.1
per MWh. The average price of all winners for
12.4 TWh/year was USD 47.6/MWh.
According to a press report, Chile hat 1.27 GW
operating PV power and 1.68 GW under con-
struction at the end of June 2016 [Tai 2016].
In addition, 12 GW have already received en-
vironmental qualification resolution status
and a further 5.4 GW were under evaluation.
2.3.3. Honduras
In 2007, Honduras enacted a law to promote
renewable energy generation, with 20-year
income tax breaks and a waiving of import
tariffs on renewables components. In 2013,
the government introduced a premium tariff
for the first 300 MW to be installed until
30 June 2015. The General Electricity Indus-
try Act, which adds a USD 0.03 premium for
solar projects not eligible for the premium
tariff was enacted in May 2014 [GoH 2014].
So far the Congress has approved 620 MW of
solar PV power to be installed until the end of
2016. In November 2015, the National Elec-
tric Energy Company reported that 389 MW
of solar PV power was connected to the grid
in 2015 increasing the total capacity to
455 MW.
2.3.4. Mexico
In 2008, Mexico enacted the Law for Renew-
able Energy Use and Financing Energy Transi-
tion to promote the use of renewable energy
[GoM 2008]. In 2012, the country passed its
Climate Change Law, which anticipates a re-
duction in greenhouse gas emissions of 30 %
below the business-as-usual case by 2020
and 50 % by 2050 [GoM 2012]. It further
stipulates a share of renewable electricity of
35 % by 2024. A new National Energy Strat-
egy 2012-2026 was approved in 2013, which

36
moved the 35 % renewable electricity goal to
2026.
In 2015, about 100 MW of new PV systems
were connected increasing the total cumula-
tive PV system capacity to 280 MW [IEA
2016a]. The IEA Medium-Term Renewable
Energy Market Report 2016 forecasts a cu-
mulative PV capacity of over 7 GW by 2020
[IEA 2016].
The results of the country’s first power auc-
tion were published on 30 March 2016. Solar
power with almost 1.6 GW and 4 TWh won
contracts for PPAs between MXN
614.14/MWh (EUR23 29.24/MWh) and MXN
1 169.78/MWh (EUR 55.70/MWh) [CNC 2016].
The second auction in September 2016 re-
sulted in contracts for 184 MW of additional
solar PV power, but in addition more than
4.9 million CELs were given to solar PV pro-
jects for a total energy production of
4.84 TWh [CNC 2016a]. All systems have to
be operational on 1 January 2019.
2.3.5. Peru
In 2008, Peru passed the Legislative Decree
1002 which made the development of re-
newable energy resources a national priority.
The decree states that by 2013 at least 5 %
of electricity should be supplied from renew-
able sources, such as wind, solar, biomass
and hydro. In February 2010, the energy
regulatory commission Osinergmin (Organis-
mo Supervisor de la Inversión en Energía y
Minería) held the first round of bidding and
awarded four solar projects with a total ca-
pacity of 80 MW. A second round was held in
2011, with a quota of 24 MW for PV. About
85 MW of PV systems had been installed by
the end of 2012. No significant additions
were reported during 2013. The National Pho-
tovoltaic Household Electrification Program,
launched in 2013, aims to supply PV electrici-
ty to 500 000 households by means of
12 500 solar systems by 2016.
23 Exchange rate: 1 EUR = 21 MXN
On 16 February, Osinergmin announced that
they had awarded two PV projects with a to-
tal capacity of 184.5 MW to deliver
523.4 GWh of electricity/year at prices of USD
47.98/MWh (144.5 MW with 415 GWh) and
48.50/MWh (40 MW with 108.4 GWh) [Osi
2016]. Start of electricity delivery is Decem-
ber 2018 at the latest.
2.3.6. United States of America
With almost 7.3 GW of newly connected PV
power, the United States had reached a cu-
mulative PV capacity of 25.6 GW by the end
of 2015 [Gtm 2016a]. In terms of nominal
capacity, solar accounted for 29.4 % of new
power capacity in 2015, exceeding the one
for natural gas for the first time. With
4.15 GW utility PV installations again were
the largest segment within 2015. The top ten
States — California, North Carolina, Nevada,
Massachusetts, New York, Arizona, Utah,
Georgia, Texas and New Jersey — accounted
for more than 86 % of the US PV market, and
California alone had a market share of 45 %.
For 2016, more than a doubling of the mar-
ket is expected, and a set-back in 2017, be-
fore it will return to a more stable growth in
2018 to 2021. One of the reasons for this
development was the surprising extension of
the solar investment tax credit (ITC) of 20 %
until 2019, 26 % in 2020, 22 % in 2021 and
10 % from 2022 onwards, at the end of
2015.
PV projects based on PPAs, with a total ca-
pacity of 21.5 GW, were under contract in Q3
2016 [Gtm 2016b]. In Q3, 10.1 GW of these
projects are under construction and it is esti-
mated that close to 8 GW will be connected
to the grid before the end of 2016. If those
projects at an earlier development stage are
included, the pipeline stands at more than
52 GW.
Many state and federal policies and pro-
grammes have been adopted to encourage
the development of markets for PV and other
renewable technologies. These comprise di-
rect legislative mandates (such as renewable

37
content requirements) and financial incen-
tives (such as tax credits). One of the most
comprehensive databases on the different
support schemes in the USA is maintained by
the North Carolina State University Solar Cen-
tre. The Database of State Incentives for Re-
newables and Efficiency (DSIRE) is a compre-
hensive source of information on state, local,
utility and selected federal incentives that
promote renewable energy. It also includes
descriptions of all the different support
schemes. The DSIRE website
http://www.dsireusa.org/ and the correspond-
ing interactive tables and maps (giving de-
tails) are highly recommended.
2.3.7. Emerging markets
In 2006, Argentina passed its Electric Energy
Law which established that 8 % of electricity
demand should be generated by renewable
sources by 2016 [GoA 2006]. The law also
introduced FiTs for wind, biomass, small-scale
hydro, tidal, geothermal and solar for a period
of 15 years. In July 2010, amongst other RES,
the government awarded PPAs to six solar PV
projects totalling 20 MW. By the end of 2015,
about 50 MW (15 MW off-grid) of PV systems
had been installed. The first renewable ener-
gy auction received bids for more than six
times the assigned 1 GW of power of which
300 MW are assigned to PV projects. The auc-
tion received 58 bids for solar projects with
more than 2.8 GW capacity. The results
should be published by mid-October 2016.
At the end of 2015, it is estimated that Bra-
zil had about 60 MW of cumulative installed
capacity of PV systems. About half of this
capacity is in off-grid systems.
In April 2012, the board of the National Agen-
cy of Electric Energy approved new rules to
reduce barriers to installing small distributed
generation capacity. The rules apply to gener-
ators that use subsidised sources of energy
(hydro, solar, biomass, co-generation and
wind). So far three energy auctions where
solar power projects could bid were held.
The auctions secured approximately BRL
12 billion (EUR24 3.34 billion) in investments
for the next 3 years and attracted a number
of domestic and international players into the
market, with the following results:
October 2014 auction (solar-only): over
1 GW was awarded to 31 projects at an
average price of BRL 220/MWh
(EUR252014 70.97/MWh,
EUR2016 61.11/MWh). Start to deliver ener-
gy: 1 October 2017
August 2015 auction (solar-only): over
830 MW were awarded to 30 projects at
an average price of BRL 301/MWh
(EUR262015 70.82/MWh,
EUR2016 83.61/MWh). Start to deliver ener-
gy on 1 August 2017.
November 2015 auction (solar and wind):
over 920 GW awarded to 33 solar power
projects at an average price of BRL
297/MWh (EUR2015 69.88/MWh, EUR2016
82.50/MWh). Start to deliver energy on
1 November 2018.
As it can be seen, the devaluation of the Bra-
zilian real against the USD and EUR has
changed the economics of the solar PPA pro-
jects considerably. So far six companies
(670 MW), which have won contracts in the
first auction applied to alter the delivery start
or cancel the contracts. A final decision is still
pending.
In December 2015, the 2024 target of the
official 10-year energy plan (PDE) was set to
7 GW of utility-scale solar and 1.32 GW of
distributed PV installations [MME 2015].
For the next energy auction planned in Octo-
ber 2016, over 390 solar projects with a
combined capacity of 12.5 GW have been
registered.
As early as 2007, the Dominican Republic
passed a law promoting the use of renewable
energy and set a target of 25 % renewable
24 Exchange rate September 2016: EUR 1 = BRL 3.60
25 Exchange rate 2014: EUR 1 = BRL 3.10
26 Exchange rate 2H 2015: EUR 1 = BRL 4.25

38
energy share by 2025 [GoD 2007]. At that
time, about 1 to 2 MW of solar PV systems
were installed in rural areas, which increased
to over 5 MW in 2011. Despite the fact that
Corporación Dominicana de Empresas Eléctri-
cas Estatales signed various PPAs totalling
170 MW in 2011 and 2012, no information
about the operation of significant capacities
could be found. It was estimated that by mid-
2014 about 10 MW of PV installations were
in operation, including a 500 kW system at
the Union Médica hospital in Santiago. In
March 2016, Phase I (30 MW) of a 60 MW
solar plant was inaugurated in the Monte Pla-
ta province.
In March 2016, the Government of Panama
approved the National Energy Plan (NEP),
2015-2050 [GoP 2016]. The plan includes a
roadmap to use at least 70 % of RES in the
energy mix by 2050. In April 2016, the Na-
tional Authority of Public Services (ASEP) an-
nounced, that they will remove the cap of
500 kW for self-consumption, if the customer
does not inject more than 25 % of his own
consumption into the grid [Ase 2016]. Accord-
ing to ASEP, grid connected PV power had a
capacity of 42.7 MW in May 2016 [Ase
2016a]. In January 2015, Panama’s Electricity
Transmission Company (La Empresa de
Transmisión Eléctrica S.A.(ETESA)) awarded in
the first solar energy auction five PPAs to so-
lar projects providing 660.2 GWh/year for
prices between USD 80.2/MWh and
104.8/MWh starting from 1 January 2017
[Ete 2015].

39
2.4. Africa
Despite Africa’s vast solar resources and the
fact that in large areas the same PV panel
can produce on average twice as much elec-
tricity in Africa than in Central Europe, there
has been only limited use of solar PV electric-
ity generation up until now. According to the
latest update of the JRC resource study in
Africa27, solar PV electricity is the most com-
petitive technology for almost 40 % of the
total population in Africa. Until the end of the
last decade, the main application of PV sys-
tems in Africa was in small SHS and the mar-
ket statistics for these are extremely impre-
cise or even non-existent. However, since
2012, major policy changes have occurred
and a large number of utility-scale PV pro-
jects are now in the planning stage. In 2015,
IRENA published ‘Africa 2030: A Roadmap for
a Renewable Energy Future’. The roadmap
identified modern renewable technology op-
tions across the sectors and across countries,
which could collectively supply 22 % of Afri-
ca’s total final energy consumption (TFEC) by
2030. This is more than a fourfold increase
compared to the 5 % share in 2013. Accord-
ing to the roadmap, PV solar power should
contribute 70 TWh or 4 % of TFEC produced
by 31 GW of PV systems.
Overall, the (documented) capacity of in-
stalled PV systems has risen to more than
2.6 GW by the end of 2015, more than forty
times the capacity installed in 2008. In 2016,
the installed capacity is expected to increase
by another 50 %. Current African PV targets
for 2020 are in excess of 10 GW.
2.4.1. Algeria
In 2011, Algeria’s Ministry of Energy and
Mines published its Renewable Energy and
Energy Efficiency Programme which aims to
increase the share of renewable energy used
for electricity generation to 40 % of domestic
27 RE2nAF tool for off-grid options for rural Africa Web site:
http://re.jrc.ec.europa.eu/re2naf.htm
demand by 2030. The plan anticipates
800 MW of installations until 2020 and a to-
tal of 1.8 GW by 2030. In February 2014, the
ministry introduced two FiT regimes, one for
systems between 1 and 5 MW and one for
systems larger than 5 MW. It was estimated
that about 5 MW of small decentralised sys-
tems and a few larger systems in the multi-
kW range were installed at the end of 2013.
According to the Renewable Energy Develop-
ment Centre (CDER), the National Renewable
Energy programme for Algeria (2015- 2030)
now has a target of 22 GW of renewable
power with a share of 13.5 GW of PV power
by 2030. About 300 MW of PV solar power
was operational at the end of 2015.
2.4.2. Cape Verde
Cape Verde’s Renewable Energy Plan (2010-
2020) aims to increase the use of renewable
energy to 50 % by 2020 through the use of
PPAs. Law No 1/2011 establishes the regula-
tions for independent energy production. In
particular, it lays down the framework condi-
tions for the set-up of independent power
producers using renewable energy (15-year
PPAs), and for self-production at user level. It
creates a micro-generation regime, regulates
rural electrification projects, and states the
tax exemption on all imported renewable en-
ergy equipment. About 340 MW of PV sys-
tems are required to achieve the 2020 50 %
renewable energy target.
By the end of 2012, two centralised grid-
connected PV plants with 7.5 MW had been
installed. In addition, there are a number of
smaller off-grid and grid-connected systems.
At the end of 2015, about 10 MW of PV pow-
er was operational [Ire 2016c]. A 2 MW so-
lar/wind hybrid project to provide electricity
and fresh water on the Island of Brava has
been approved by the IRENA/ADFD Project
Facility [Ire 2016c].

40
2.4.3. Egypt
In September 2014, the Ministry of Electricity
and Energy and the Regulatory Agency
launched a FiT support system for solar PV
and wind projects with capacity less than
50 MW. The target of the programme is to
install 300 MW from small PV installations
below 500 kW, and 2 GW PV plants be-
tween 500 kW up to 50 MW. The tariffs vary
between EGP 84.8 to 102.5/kWh (EUR280.085
to 0.103/kWh) depending on the size of sys-
tems. The tariffs will be adjusted if either the
target is achieved or the 2year regulatory
period is elapsed, which happens first.
The first solar tender (2014) was heavily
oversubscribed with more than 80 qualified
applications exceeding the target by more
than 50 %. The selected consortia have to
close their financing by the end of September
2016. On 11 August 2015, the New and Re-
newable Energy Authority announced Tender
No (14/2015/2016) for 200 MW in the West
Nile region.
It is estimated that 70 MW of PV power was
operational at the end of 2015 [Mes 2016].
According to MESIA, about 1.8 GW of solar
power are under ‘execution’, i.e. PPA signing,
awarded, construction.
2.4.4. Morocco
The Kingdom of Morocco’s solar plan was in-
troduced in November 2009, with the aim of
establishing 2 000 MW of solar power by
2020. To implement this plan, the Moroccan
Agency for Solar Energy (MASEN) was found-
ed in 2010. Solar electricity technologies, so-
lar thermal electricity generation29 and PV
will all compete openly. Earlier in 2007, the
National Office of Electricity (ONEE) had al-
ready announced a smaller programme for
grid-connected distributed solar PV electricity,
with a target of 150 MW of solar PV power.
28 Exchange rate: 1 EUR = 9.95 EGP
29 Also used term: concentrated solar power (CSP)
Various rural electrification programmes us-
ing PV systems have been running for a long
time. At the end of 2012, Morocco had in-
stalled about 20 MW of PV systems, mainly
under the framework of the Global Rural Elec-
trification Program, and about 1 to 2 MW of
grid-connected systems.
In February 2015, ONEE announced their plan
to tender various PV power projects of 20 to
30 MW each with a total capacity of 400 MW
[One 2015]. The first plants should be opera-
tional at the end of 2017. In April 2015, the
World Bank announced its decision to support
the first phase of 75 MW. The pre-
qualification process for PV Noor I, three
plants with a combined capacity of approxi-
mately 170 MW solar power was launched by
MASEN in summer 2015. 20 consortia were
pre-qualified by MASEN in December 2015 to
submit bids for the three plants Noor Ouar-
zazate, NOOR Laayoune and Boujdour Noor.
According to press reports, three consortia
from Saudi Arabia won the bids with prices in
the range of USD 60/MWh.
Two companies in Casablanca are producing
PV modules — Droben Energy, a subsidiary of
the Spanish Droben company, with 5 MW, and
Cleantech with 15 MW capacity. In May 2016,
Jet Contractors, a Moroccan construction
company, announced a Joint Venture with
Haereon Solar (PRC) and Société
d’Investissements Energétiques (SIE) to build
a 160 MW solar cell and module manufactur-
ing plant in Morocco [Jet 2016]. The company
already operates a 30 MW cell and module
plant, which as phase I of the project will be
converted to manufacture cells and modules
according to Haeron’s quality standards.
2.4.5. South Africa
South Africa has a rapidly increasing electrici-
ty demand and vast solar resources. In 2008,
the country enacted its National Energy Act,
which calls for a diversification of energy
sources, including renewables, as well as fuel
switching to improve energy efficiency [GoS
2008]. In 2011, the Renewable Energy Inde-

41
pendent Power Producer Procurement Pro-
gramme (IPP) was set up with rolling bidding
rounds. Three rounds have already taken
place: in 2011 (630 MW), 2012 (420 MW),
2013 (450 MW) and 2014 (415 MW). The
overall target is 3.725 GW and that for solar
PV is 1.45 GW. Between the first round (clos-
ing date: 4 November 2011) and the fourth
round (closing date: 18 August 2014) the av-
erage bid price fell from ZAR 2.65/kWh
(EUR30 0.265/kWh) to ZAR 0.79/kWh
(EUR31 0.056/kWh). In 2015, about 200 MW
of solar PV capacity was connected to the
grid, increasing total PV power capacity to
1.12 GW [IEA 2016a].
Due to the country’s local content rules, more
and more manufacturers along the solar val-
ue chain are setting up plants in South Africa.
The following is a non-exhaustive list of in-
dustry activities.
Setsolar was set up in Cape Town in 2007.
The company manufactures and distributes
solar modules and other system components.
Its manufacturing capacity is estimated at
20 MW.
In 2011, Solaire Direct Technologies (Pty) Ltd
started module manufacturing in Cape Town.
With a production capacity of about 36 MW, it
manufactures OEM modules for different
companies as well as its own brand. It signed
an OEM contract (120 MW) with ReneSola in
2013 [Sol 2013].
In 2013, ARTSolar opened a module factory in
Durban with a capacity of 75 MW. The com-
pany manufactures OEM modules for differ-
ent companies as well as its own brand [Art
2013]. According to a press report, the com-
pany started to expand its production capaci-
ty, but no details are available.
Early in 2014, JA Solar (PRC) announced the
establishment of a joint venture with Power-
way PV SA (Pty) Ltd. to build a solar-module
manufacturing facility in Port Elizabeth [Jas
30 Exchange rate 2012: EUR 1 = ZAR 10
31 Exchange rate 2015: EUR 1 = ZAR 14
2014]. Production was scheduled to begin in
the second quarter of 2014, with the plant
targeting an initial annual capacity of
150 MW; it has the option for an expansion to
600 MW. No further details are known.
In February 2014, Photovoltaic Technology
Intellectual Property (Pty) Ltd. (PTiP) officially
launched its pilot production line for the
manufacturing of CIGS thin-film solar mod-
ules. Equipment supplied by German company
Singulus [Sin 2014].
In March 2014, Powerway PV SA, part of
Powerway Renewable Energy Co. Ltd (PRC), a
global solar-farm builder/system integrator,
and Sungrow (PRC), the third largest inverter
company in 2012, announced the setting up
of a manufacturing facility in the Coega De-
velopment Corporation in Port Elizabeth [Pow
2014].
At the end of June 2014, SMA Solar Tech-
nology AG (SMS) commissioned an inverter
factory for local production in Cape Town
[Sma 2014]. It consists of a production line,
storage facilities and a test centre for cen-
tral inverters. In September 2016 however,
the company announced to relocate its activi-
ties to China and Germany.
In August 2014, JinkoSolar Holding Co. Ltd.
announced the opening of a 120 MW module
factory in Cape Town [Jin 2014].
2.4.6. Emerging markets
In February 2013, a 20 MW module manufac-
turing plant was opened in Addis Ababa,
Ethiopia. The factory is a joint project be-
tween SKY Energy International and Ethiopia’s
Metals and Engineering Corporation (METEC).
According to press reports, the factory was
upgraded to 100 MW manufacturing capacity
in 2015 [Eth 2015]. Press reports confirmed
the Ethiopian Electric Power Corporation (EEP)
approved three solar plants with a capacity of
300 MW in the eastern region of the country
[Ven 2013]. In August 2016, EEP announced
to tender the tree projects, which will be lo-
cated in Metahara, Umera and Mekelle [Ena

42
2016]. The plants are scheduled to be built in
2017.
In 2011, the Parliament of Ghana passed the
Renewable Energy Bill which aims to increase
the proportion of renewable energy, particu-
larly solar, wind, mini-hydro and waste-to-
energy in the national energy supply mix and
to contribute to mitigating climate change
[RoG 2011]. The bill sets a goal of renewable
energy constituting 10 % of national energy
generation by 2020. At the end of 2012,
there were a few thousand SHS and a few
off-grid systems providing an estimated
5 MW installed in the country. In 2012, a
number of companies announced the signa-
ture of PPAs in Ghana. However, none of
these projects have been realized so far. In
May 2013, the Volta River Authority (VRA)
inaugurated its first solar power plant at Nav-
rongo, with a capacity of 2.5 MW. VRA
planned to install a total of 14 MW by 2015,
but the completion has been postponed to 1Q
2017. In April 2016, Beijing Xiaocheng Com-
pany (BXC) connected the first 20 MW of their
40 MW PV solar power plant at Onyandze to
the grid [Ecr 2016].
In 2008, Kenya introduced FiTs for electricity
from RES, but solar power was only included
in 2010, when the tariffs were revised [GoK
2010]. However, only a little over 560 kW of
PV capacity was connected to the grid in
2011; the majority of the 14 MW of PV sys-
tems were off-grid installations. In 2011, Ub-
bink East Africa Ltd., a subsidiary of Ubbink
B.V. (Doesburg, the Netherlands) opened a
solar PV manufacturing facility in Naivasha
with an annual output of 30 000 modules.
The plant produces modules for smaller PV
systems, such as SHS. Current estimates for
Kenya’s PV market put average annual sales
of home systems at 20 000 to 30 000 and
solar lanterns at 80 000. It is estimated that
the total capacity of SHS, telecommunication
applications, diesel-PV hybrids and the few
grid-connected systems will be about 25 to
30 MW at the end of 2016. In March 2016,
the Rural Electrification Authority (REA) board
approved the construction of a 55 MW Solar
Power plant in Garissa [Rea 2016]. It is inter-
esting to note that the solar plant will be fi-
nanced through concessional funding from
the Government of China.
In 2005, Nigeria passed the Power Reforms
Act as well as the National Renewable Energy
Master Plan for Nigeria which set targets for
solar to contribute 5.0 MW, 75 MW, and
500 MW in 2010, 2015 and 2025, respective-
ly. In November 2015, the government of Ni-
geria approved the FiT regulation, which went
into force in February 2016. The tariffs apply
to PV systems between 1 and 5 MW and
caped at a capacity of 380 MW by 2018.
However, the tariff scheme was declared ille-
gal by the Federal High Court in Lagos on
13 July 2016 [NER 2016].
In February 2014, it was reported that Nige-
ria’s first module manufacturing plant had
been completed and is now operational with a
nameplate capacity of 10 MW [Pvt 2014]. The
plant was built in Sokoto by German firm JVG
Thoma.
According to various press reports, the gov-
ernment-owned energy purchasing company
Nigerian Bulk Electricity Trading (NBET) has
already signed solar PPAs with 14 developers.
The MWh price of these PPAs was set at USD
115 and could add about 1.4 GW to the grid
starting from next year if financing can be
secured.
It is estimated that about 20 MW of solar PV
power were operational at the end of 2015.
At the end of 2012, Tanzania’s Ministry of
Energy and Minerals (MEM) published its Stra-
tegic Plan 2011/12-2015/16, in which the
strategic objective to enhance the sustainable
development and management of energy re-
sources for national development was formu-
lated [MEM 2012]. As a follow-up, the Scal-
ing-up Renewable Energy Program (SREP)
was published in April 2013 [MEM 2013]. The
SREP calls for a cumulative installed PV ca-

43
pacity of 60 MW by 2017 and 120 MW by
2020. Cumulative PV capacity is reported
with 14 MW at the end of 2015 [Ire 2016b].
In 2009, Tunisia launched its Solar Plan. It is
a Public-Private Partnership spanning 2010 to
2016. The plan aims to increase the share of
RES in the total Tunisian energy mix from
0.8 % to 4.3 % by 2014. The PROSOL ELEC
programme to promote the installation of
grid-connected systems was set up to handle
investment subsidies and guaranteed loans
as well as power purchase for 1 to 2 kWp
solar PV systems [Ste 2013]. PV capacity is
estimated at 15 MW at the end of 2015.
A 30 MW module factory run by Green Panel
Technology Jurawatt Tunisie came into opera-
tion in 2014 [Jvg 2014]. The company is a
joint venture between Tunisia Green Panel
Tech and JVG Thoma, Germany.

44
3. ELECTRICITY COSTS AND THE ECONOMICS OF PV
SYSTEMS
Over the last four decades, solar module pric-
es have fallen following a price-experience or
‘learning’ curve with an average learning rate
of about 80 %, i.e. the ASP of solar modules
fell by 20 % for each doubling of production
volume (Fig. 7). This development was driven
not only by technological developments but
also by market conditions. It is interesting to
note that between 2004 and the second half
of 2008 the price of PV modules remained
fairly constant at roughly USD2016 4 to 4.5/Wp.
This occurred despite the fact that manufac-
turing technology continued to improve and
companies significantly scaled up their pro-
duction. The reason for this was the expand-
ing markets in Germany and Spain, where the
only slowly changing FiTs enabled project de-
velopers to be profitable at that price. This
was coupled with the temporary shortage of
polysilicon between 2004 and 2009, which
limited silicon solar cell production and pre-
vented effective pricing competition, thus
providing an opening for thin-film technolo-
gies to enter the market. The temporary sili-
con feedstock shortage and the market entry
of companies offering turnkey production
lines for thin-film solar cells led to a massive
expansion of investments in thin-film capaci-
ties between 2005 and 2009. The market
share for thin-film modules increased until
2009, when it reached almost 20 %, although
it has declined steadily since then.
Figure 7: Price-experience curve for solar modules (ASP)
(data source: Bloomberg New Energy Finance (BNEF) and PV News)
Between 2008 and the end of 2012, there
was a massive 80 % drop in the price of
modules, with 20 % in 2012 alone, creating
serious financing problems for all companies
and leading to the closure of a significant
number of them [Blo 2013]. This drastic price
drop was a consequence of the huge overca-
pacities as a result of the very ambitious in-
vestments spending between 2005 and 2011.
PV system prices have followed the lowering
of module prices but at a slower pace. This
becomes obvious by looking at the PV module
0.1
1
10
100
1 10 100 1,000 10,000 100,000 1,000,000
PV
Mo
du
le P
rice
[U
SD
20
16/W
p]
Cumulative Module Production [MW]
Crystalline Silion
FS CdTe Thin Film
2008
2008
2008
New technologies must enter here
to be competitive
2008
2016
2008
1975
2008
1986
2014

45
share in the system price, which shifted from
almost 70 % in 2008 to less than 50 % in
2016.
Despite the fact that there is a global market
for the hardware components of a PV system,
e.g. modules, inverters, cables, etc., and that
these prices are very similar worldwide, the
prices for installed PV systems still vary sig-
nificantly [IEA 2016c]. The reasons for those
differences are manifold, ranging from the
different legal requirements for permits, li-
censing and connection to the grid to the dif-
ferent maturity of local PV markets, with im-
pacts on competition between system devel-
opers and installers. PV system prices are
changing rapidly, not only in Europe, which
opens up new opportunities for PV in a rapid
growing number of countries to become one
of the major electricity providers in the near
future.

46
3.1. LCOE
A common measure for the comparison of
power-generation technologies is the concept
of the LCOE32. LCOE is the price at which elec-
tricity must be generated from a specific
source to break even over the project’s life-
time. It is an economic assessment of the
cost of the energy-generating system, includ-
ing all the costs over its lifetime: initial in-
vestment, operations and maintenance, cost
of fuel, and cost of capital. It can be calculat-
ed using a single formula, such as:
where:
LCOE = average lifetime levelised electricity gen-eration cost
It = investment expenditures in the year t Mt = operational and maintenance expendi-
tures in the year t Ft = fuel expenditures in the year t, which is
zero for PV electricity Et = electricity generation in the year t r = discount rate n = financial lifetime of the calculation
This calculation delivers the LCOE of the gen-
erator, but falls short of describing the full
LCOE for the total system, which covers pro-
file cost (including flexibility and utilisation
effects), balancing costs and grid costs. These
cost categories have to be added to all elec-
tricity-generating technologies LCOEs, wheth-
er they are conventional or RES (Fig. 8). There
are a number of reasons why the LCOEs of
different power-generation technologies dif-
fer in different regions and at different times,
and this has an influence on the merit-order
effect. For example: (1) Full-load hours: dif-
ferent power-generation technologies have
32 LCOE formula used by the National Renewable Energy
Laboratory (NREL): http://www.nrel.gov/analysis/tech_lcoe_documentation.html
different full-load hours depending on the
type of resource, such as hydro, solar, wind,
etc., or the type of power plant, for instance
base-load, medium- or peak-load plants; (2)
All combustion technologies incur fuel costs,
which have different degrees of volatility and
associated risk, and depend on the type of
delivery contract and/or geographic region; (3)
Demand variations; (4) Central or decentral-
ised power generation; (5) Weather forecast-
ing accuracy for wind and solar; and (6) Mar-
ket regulations and trading opportunities, etc.
The benchmark against which the different
generator and system LCOEs must be com-
pared are the market prices in the respective
segments of a given market.
Although a considerable number of studies
have calculated, estimated or modelled the
value of renewable electricity from variable
resources, most of them have investigated
the market penetration of a single renewable
energy source, like wind or solar, rather than
a portfolio of different RES and optimised
integration technology options [Hir 2013 and
references, Uec 2013].
For solar PV electricity, the market value de-
pends on the kind of application. In the case
of residential or commercial systems, the
benchmarks are the residential or commercial
electricity retail rates. For large utility-scale
solar farms, the market value is more difficult
to determine and PPAs are a good indicator
of how utility companies evaluate them.
The following sections show the LCOE of dif-
ferent PV systems and the economic and
technical possibilities for PV to contribute to
profile, balancing and grid costs.

47
Figure 8: System LCOE

48
3.2. Influence of financing costs on LCOE
Over the last 40 years, hardware costs of PV
systems have decreased drastically due to a
combination of research activities and market
development. Technical installation costs
have decreased as well, driven by best prac-
tices and increasing competition levels in the
installers market. Given the fact that the
largest share of investments into a solar PV
electricity generation system has to be done
at the beginning of the project and no fuel
costs are inexistent, the weighted cost of cap-
ital (WACC), often also referred as the dis-
count rate, has a critical impact on LCOE.
The WACC can be calculated as follows:
𝑊𝐴𝐶𝐶 =𝐸
𝑉∗ 𝑅𝑒 +
𝐷
𝑉∗ 𝑅𝑑 (1 − 𝑇𝑐)
Where: Re = cost of equity Rd = cost of debt E = market value of the firm’s equity D = market value of the firm’s debt V = E + D E/V = percentage of financing that is equity D/V = percentage of financing that is debt Tc = corporate tax rate
As shown above, not only the equity to debt
ratio but the corporate tax rate has a signifi-
cant influence on the WACC. Cost of debt is
very much dependent on the economic situa-
tion in a given country and the financial sta-
bility of the company looking for debt. There-
fore, WACC for a given project can vary not
only where it is realised, but also by whom.
In this context, it is noteworthy to mention
that the latest bids and PPAs in the United
Arab Emirates, Chile as well as in Africa have
only been able by a combination of excellent
solar resource, high debt shares and low debt
costs.
To show the impact of financing on the LCOE,
the following benchmark assumptions for a
large scale system to be operational at the
beginning of 2018 were taken:
CAPEX EUR2016 1 000 per kWp, operational
expenditure (OPEX) EUR 18 per kW/year,
1 500 kWh/kW per year, financial lifetime of
20 years. Local taxes were not considered.
Figure 9: Influence of WACC on LCOE
0
2
4
6
8
10
12
14
0% 3% 5% 7% 10% 12% 15% 20%
LCO
E [E
UR
20
16ce
nt/
kWh
]
WACC
CapitalO&MOther (fees, permitting, insurances, etc.)Engineering Procurement & ConstructionBalance of SystemsInverterPV Module

49
As can be seen in Figure 9, with a WACC of
7 %, the financing costs exceed the hardware
and technical installation costs, and at a
WACC of 12 %, the financing costs are more
than 50 % of the total LCOE. It becomes ob-
vious that PV electricity generation costs are
more and more depending on a low financial
risk environment with low financing costs
than on high solar irradiation. It also high-
lights that the government risk mitigating
policies can be more efficient to support PV
development than introducing financial sup-
port when none of the energy forms are sub-
sidised, or supported in the same way.
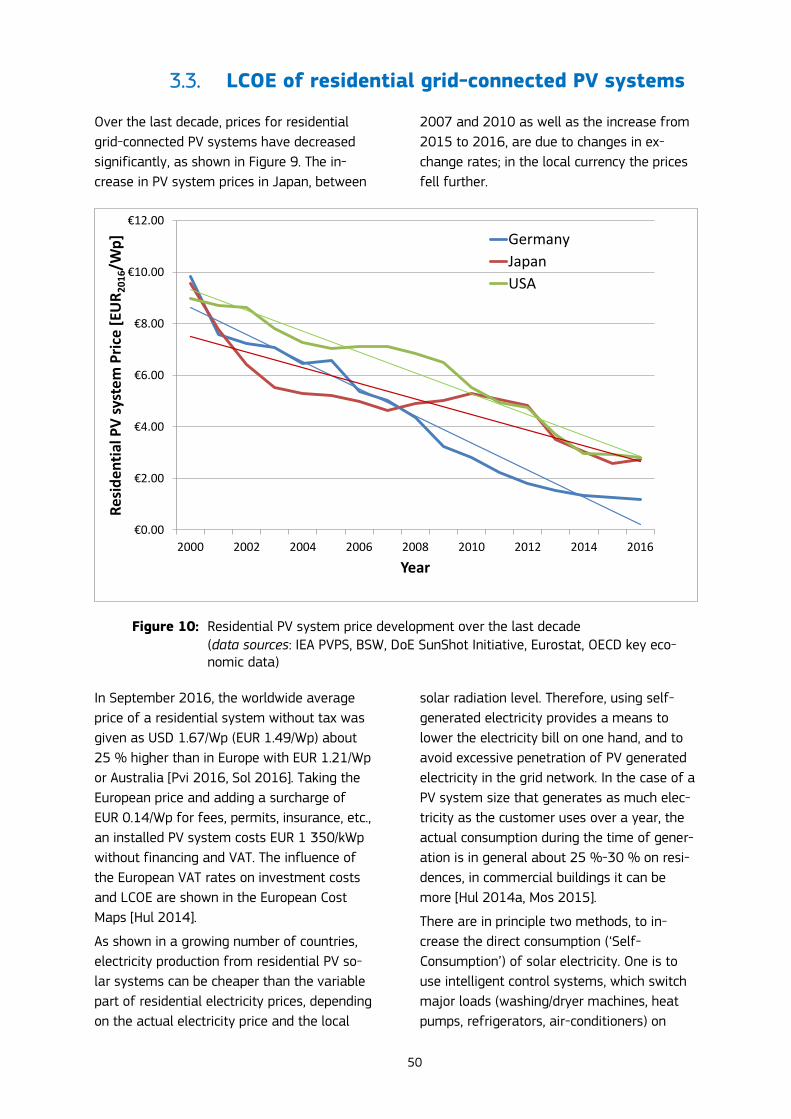
50
3.3. LCOE of residential grid-connected PV systems
Over the last decade, prices for residential
grid-connected PV systems have decreased
significantly, as shown in Figure 9. The in-
crease in PV system prices in Japan, between
2007 and 2010 as well as the increase from
2015 to 2016, are due to changes in ex-
change rates; in the local currency the prices
fell further.
Figure 10: Residential PV system price development over the last decade
(data sources: IEA PVPS, BSW, DoE SunShot Initiative, Eurostat, OECD key eco-nomic data)
In September 2016, the worldwide average
price of a residential system without tax was
given as USD 1.67/Wp (EUR 1.49/Wp) about
25 % higher than in Europe with EUR 1.21/Wp
or Australia [Pvi 2016, Sol 2016]. Taking the
European price and adding a surcharge of
EUR 0.14/Wp for fees, permits, insurance, etc.,
an installed PV system costs EUR 1 350/kWp
without financing and VAT. The influence of
the European VAT rates on investment costs
and LCOE are shown in the European Cost
Maps [Hul 2014].
As shown in a growing number of countries,
electricity production from residential PV so-
lar systems can be cheaper than the variable
part of residential electricity prices, depending
on the actual electricity price and the local
solar radiation level. Therefore, using self-
generated electricity provides a means to
lower the electricity bill on one hand, and to
avoid excessive penetration of PV generated
electricity in the grid network. In the case of a
PV system size that generates as much elec-
tricity as the customer uses over a year, the
actual consumption during the time of gener-
ation is in general about 25 %-30 % on resi-
dences, in commercial buildings it can be
more [Hul 2014a, Mos 2015].
There are in principle two methods, to in-
crease the direct consumption (‘Self-
Consumption’) of solar electricity. One is to
use intelligent control systems, which switch
major loads (washing/dryer machines, heat
pumps, refrigerators, air-conditioners) on
€0.00
€2.00
€4.00
€6.00
€8.00
€10.00
€12.00
2000 2002 2004 2006 2008 2010 2012 2014 2016
Re
sid
en
tial
PV
sys
tem
Pri
ce [
EUR
20
16/W
p]
Year
Germany
Japan
USA
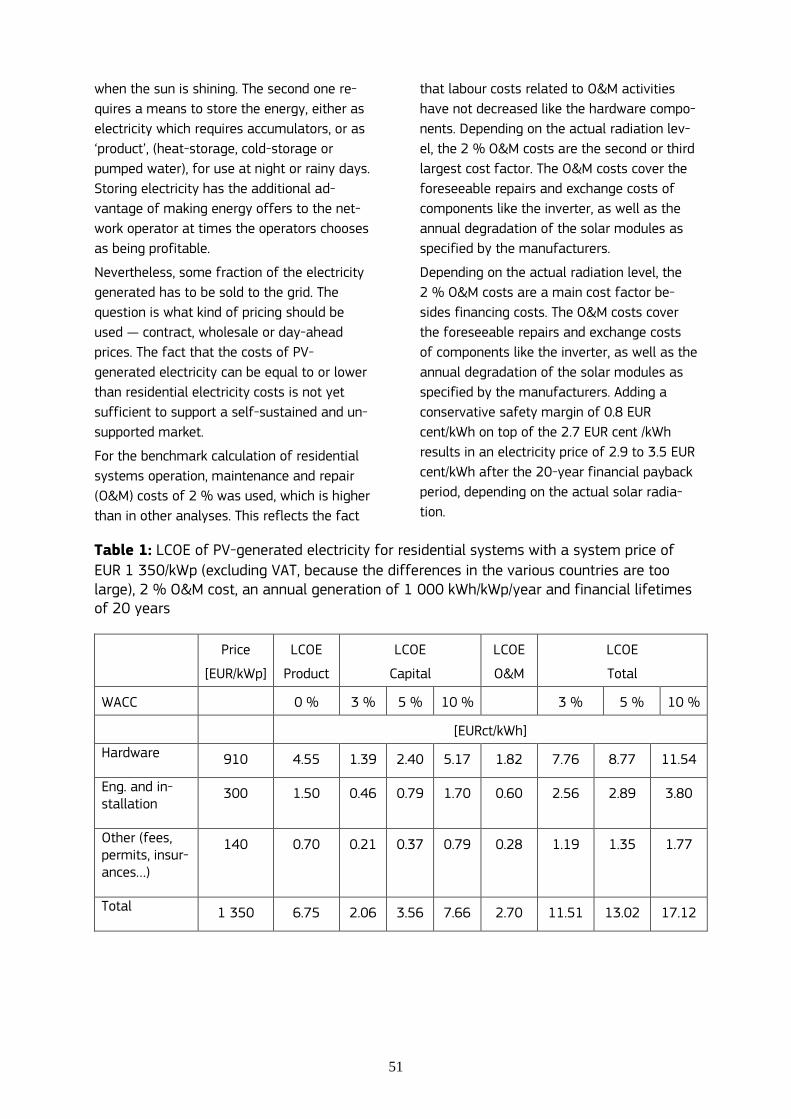
51
when the sun is shining. The second one re-
quires a means to store the energy, either as
electricity which requires accumulators, or as
‘product’, (heat-storage, cold-storage or
pumped water), for use at night or rainy days.
Storing electricity has the additional ad-
vantage of making energy offers to the net-
work operator at times the operators chooses
as being profitable.
Nevertheless, some fraction of the electricity
generated has to be sold to the grid. The
question is what kind of pricing should be
used — contract, wholesale or day-ahead
prices. The fact that the costs of PV-
generated electricity can be equal to or lower
than residential electricity costs is not yet
sufficient to support a self-sustained and un-
supported market.
For the benchmark calculation of residential
systems operation, maintenance and repair
(O&M) costs of 2 % was used, which is higher
than in other analyses. This reflects the fact
that labour costs related to O&M activities
have not decreased like the hardware compo-
nents. Depending on the actual radiation lev-
el, the 2 % O&M costs are the second or third
largest cost factor. The O&M costs cover the
foreseeable repairs and exchange costs of
components like the inverter, as well as the
annual degradation of the solar modules as
specified by the manufacturers.
Depending on the actual radiation level, the
2 % O&M costs are a main cost factor be-
sides financing costs. The O&M costs cover
the foreseeable repairs and exchange costs
of components like the inverter, as well as the
annual degradation of the solar modules as
specified by the manufacturers. Adding a
conservative safety margin of 0.8 EUR
cent/kWh on top of the 2.7 EUR cent /kWh
results in an electricity price of 2.9 to 3.5 EUR
cent/kWh after the 20-year financial payback
period, depending on the actual solar radia-
tion.
Table 1: LCOE of PV-generated electricity for residential systems with a system price of
EUR 1 350/kWp (excluding VAT, because the differences in the various countries are too large), 2 % O&M cost, an annual generation of 1 000 kWh/kWp/year and financial lifetimes of 20 years
Price
[EUR/kWp]
LCOE
Product
LCOE
Capital
LCOE
O&M
LCOE
Total
WACC 0 % 3 % 5 % 10 % 3 % 5 % 10 %
[EURct/kWh]
Hardware 910 4.55 1.39 2.40 5.17 1.82 7.76 8.77 11.54
Eng. and in-stallation
300 1.50 0.46 0.79 1.70 0.60 2.56 2.89 3.80
Other (fees, permits, insur-ances…)
140 0.70 0.21 0.37 0.79 0.28 1.19 1.35 1.77
Total 1 350 6.75 2.06 3.56 7.66 2.70 11.51 13.02 17.12

52
Table 2: LCOE of PV-generated electricity for residential systems with a system price of
EUR 1 350 kWp (excluding VAT, because the differences in the various countries are too large), 2 % O&M costs, an annual generation of 1 300 kWh/kWp/year and a financial life-time of 20 years
Price
[EUR/kWp]
LCOE
Product
LCOE
Capital
LCOE
O&M
LCOE
Total
WACC 0 % 3 % 5 % 10 % 3 % 5 % 10 %
[EURct/kWh]
Hardware 910 3.50 1.07 1.85 3.97 1.40 5.97 6.75 8.87
Eng. and in-stallation
300 1.15 0.36 0.61 1.31 0.47 1.97 2.23 2.93
Other (fees, permits, insur-ances…)
140 0.54 0.16 0.28 0.61 0.22 0.92 1.04 1.37
Total 1 350 5.19 1.59 2.75 5.90 2.08 8.85 10.01 13.17
In 2016, the average residential electricity
rate, excluding the daily connection charge, in
Australia is about AUD 0.25/kWh (EUR33)
0.171/kWh), but for customers with peak tar-
iffs this can increase to AUD 0.39/kWh (EUR
0.267/kWh) between 14.00 and 20.00, which
is a good match with PV electricity genera-
tion. The average European residential elec-
tricity price given by Eurostat for the second
semester of 2015 was EUR 0.211/kWh, in-
cluding fixed charges [Est 2016]. Fixed charg-
es vary widely between EUR 20 and 170, de-
pending on the respective Member State and
electricity provider. The same holds true for
the variable part of the electricity price, which
can vary between EUR 0.075 and 0.26 per
kWh. Nevertheless, PV-generated electricity
for the lower ROI financing options, which are
more realistic for private consumers, is al-
ready cheaper for a large number of Europe-
an Union citizens. Cyprus, Denmark and Ger-
many had the highest prices with EUR
0.294/kWh, EUR 0.292/kWh and EUR
33 Exchange rate: EUR 1 = AUD 1.46
0.248/kWh, respectively. In September 2016,
the kWh based prices of Japan’s largest utility
Tokyo Electric Power Company (TEPCO) were
JPY 19.52/kWh (EUR34 0.170/kWh) for the
first 120 kWh per month, JPY 26.00/kWh
(EUR 0.226/kWh) for everything above
120 kWh and below 300 kWh per month, and
JPY 30.02/kWh (EUR 0.261/kWh) for every
kWh above 300 kWh per month [Tep 2016]. In
addition, customers pay a demand charge
between JPY 280.80 (EUR 2.04) per month
for 1 kW and up to JPY 1 684.80 (EUR 12.21)
for a 6 kW connection. The Renewable Energy
Power Promotion Surcharge in FY 2016 is JPY
2.25/kWh [METI 2016a].
Without support, the profitability of a solar PV
system depends primarily on the owner’s
self-consumption, as less energy has to be
purchased from the utility. In the case of a PV
system size that generates as much electrici-
ty as the customer uses over a year, the ac-
tual consumption during the time of genera-
tion is in general only around 30 % if no de-
34 Exchange rate: EUR 1 = JPY 115

53
mand shifting or local storage is applied.
Therefore, 70 % of the generated electricity
has to be sold to the grid. The question is
what kind of pricing should be used — con-
tract, wholesale or day-ahead prices.
The first option for improving profitability is
to increase self-consumption by demand
shifting and using electrical appliances like
the washing machine, dishwasher, electric hot
water heaters or heat pumps during the day
when the sun shines. Another option is to use
the difference between the PV electricity gen-
eration costs and the household retail price to
invest in local storage options, be they resi-
dential or community-owned. The current in-
vestment costs for a residential battery stor-
age system are roughly equally divided be-
tween the batteries and the electronic control
components. In the future, it is very likely that
the solar inverter will include large parts of
the necessary electronics, thereby lowering
the costs significantly.
As an indication of storage costs, according to
BNEF prices for battery packs for electric ve-
hicles have declined from about USD
1 000/kWh in 2010 to USD 350/kWh in H2
2015 and could reach USD 200/kWh by 2020
[Blo 2015]. Lithium-ion batteries have an av-
erage of 5 000 cycles, and with the above
cost estimates, this would correspond to net
kWh costs component for the full used bat-
tery pack of USD 0.07/kWh (EUR 0.063/kWh)
and should fall to USD 0.04/kWh (EUR
0.036/kWh) by 2020. However, these costs do
not yet include the investment for the power
and control electronics needed to combine it
with a PV system.
However, LCOE of residential battery storage
systems do not only depend on the CAPEX
(battery pack, power and control electronics
and installation) and total storage cycles, but
are strongly influenced by the sizing of the PV
and battery systems and the actual use of
the battery system, i.e. depth of discharge,
overall battery system efficiency, usable an-
nual storage cycles and actual kWh stored
and used [Bau 2012, 2016]. Therefore, there
is a wide range of prices of electricity from
storage at EUR 0.18 to 0.36/kWh, which has
to be added to the PV LCOE.
According to various consultancy reports, the
electricity battery storage market is expected
to grow 10-fold over the next five years and
exceed EUR 6 billion by 2022. This market
development, together with a further retail
price increase and a PV system price reduc-
tion, could lower the LCOE of a PV system,
including storage, below average European
electricity retail prices and make PV electricity
the lowest cost option for more than
230 million Europeans within the next 5
years.

54
3.4. Residential and commercial electricity storage
models
Some electricity providers in Europe are of-
fering PV systems and local storage to their
customers, often including maintenance ser-
vices. The packages also include apps to
monitor the performance of the system, use
of electricity and often functionality to control
the match between demand and supply. The
motivation for this model is described by
those companies as follows: ‘This gives cus-
tomers a complete and compatible package
consisting of a PV system, storage device,
app, and green electricity tariff.’ However, no
information is given at which rate the compa-
ny would buy self-generated electricity.
Battery producers and storage system devel-
opers have started to offer their customers
the organisation of their decentralised elec-
tricity generation and storage facilities as
virtual power plants and acting as electricity
providers and traders. Examples are Sonnen
Gmbh or E3/DC.
In Germany, KfW is offering loans with a non-
repayable component for PV systems includ-
ing storage with a maximum system power of
30 kWp [KfW 2016]. The loan is only availa-
ble if the maximum injected power is 50 % or
less of the nominal power rating of the PV
system. The maximum eligible amount is
25 % of EUR 2 000 per kWp if the PV system
and the battery storage are installed at the
same time and EUR 2 200 per kWp of the PV
system if the system was installed after
31 December 2012 and more than 6 months
have passed before the battery storage is
added. However, the maximum eligible
amount is reduced by 3 % each 6 months
starting 1 July 2016. The programme will be
terminated at the end of 2018.
Another concept is ‘virtual storage’ for elec-
tricity generated by PV systems either for a
monthly fee or a down payment for a number
of years. To take advantage of this offer, the
PV system owner has to be a customer of the
respective service provider. The advantage of
the virtual storage is that the customer has
no installation and maintenance costs for the
storage system and virtually infinite lifetime.
In addition, there are a number of companies,
which offer the management of swarm or
cluster storage facilities in cooperation with
distribution network operators. However, de-
tailed business information are very limited
at the moment.

55
3.5. LCOE of utility-scale PV systems
Utility-scale PV systems can be defined as a
PV system larger than 10 MW. The first such
system was installed in 2006 after the 2004
revision of the German EEG, which for the
first time made such systems eligible for a
FiT. The first boom occurred in 2008, trig-
gered by the Spanish FiT, when almost 1 GW
was installed. When the Spanish bubble burst,
the volume dropped to less than 500 MW in
2009, before activities picked up again in
2010. At the end of 2015, about 65 GW of
utility-scale PV power plants were operational
worldwide and it is possible that this mark
will be at 100 GW at the end of 2016.
Due to the plant size, which is currently up to
850 MW35, the cost structure and LCOE is
quite different from that of residential PV
systems. Figure 11 shows an average cost
breakdown in competitive markets. The actual
cost breakdown differs from project to pro-
ject.
____________________________________________
35 Longyangxia Dam Solar Park, PRC
Figure 11: Price breakdown of utility-scale PV system
Already in 2010, Ken Zweibel published an
analysis of how discount rates influence the
competitiveness of solar PV electricity gener-
ation [Zwe 2010]. He calculated that with a
market size of 40 GW per year system costs
of USD2010 2.00/Wp (EUR2010 1.54/Wp) should
be possible. The 2014 market was already
above this, with utility system prices around
EUR35 1 1002014/kWp (USD 1 5542010/kWp36).
In 2016, a number of record breaking PPA
contracts and bids below USD 30/MWh have
been reported reaching a new low with the
USD 24.2/MWh bid by JinkoSolar (China) and
35
36 United States inflation — see:
http://www.usinflationcalculator.com/inflation/historical-
inflation-rates/
0
200
400
600
800
1000
1200
Syst
em
Pri
ce o
f P
V E
UR
20
16/k
Wp
Other (fees, permits,insurances, etc.)
Engineering,procurement &construction
Balance of plant
Inverter
PV module

56
Marubeni (Japan) for an Abu Dhabi Electricity
and Water Authority’s (ADWEA) tender in Sep-
tember 2016 [Nat 2016a]. As already men-
tioned, these very low bids and PPAs in the
UAE and Chile are only possible through a
combination of excellent solar resource (with
load factors up to 25 %), high debt shares
and very low debt costs as well as the fact
that some tariffs are indexed to inflation.
Besides these extremes, it is noteworthy to
mention, that the latest solar auction in Ger-
many in August ended with contracts award-
ed to projects for prices between EUR
68.90/MWh and EUR 77.70/MWh [BNA 2016].
Other examples are:
Auction results in Zambia: 45 MW (USD
60.02/MWh (EUR 53.12) and 34 MW
(28 MWAC) for USD 78.40/MWh (EUR
69.38) where the World Bank’s ‘Scaling
Solar’ programme provide risk manage-
ment and credit enhancement products to
lower financing costs for the projects. Du-
ration of the PPAs are 25 years, paid in
USD.
In Nigeria, NBET signed solar PPAs with 14
developers. The MWh price of these PPAs
was set at USD 115 and could add about
1.4 GW to the grid starting from next year
if financing can be secured. Duration of
the PPAs are 20 years, paid in USD.
The first two clean energy auctions were
held in Mexico in 2016. The scheme is
more complicated as the energy contracts
were for 15 years, whereas the additional
Clean Energy Certificates (CEL) are for 20
years. After the 15th year, the projects
have to sell their electricity at the whole-
sale market.
After the first auction in March 2016, the
winning solar projects with a capacity of
1 595 MW signed energy contracts be-
tween MXN 614.14/MWh
(EUR37 29.24/MWh) and MXN
1 169.78/MWh (EUR 55.70/MWh). The av-
erage CELs were priced at MXN 444/MWh
(EUR 21.14/MWh).
The second auction in September 2016 re-
sulted in contracts for 184 MW of addi-
tional solar PV power, but in addition more
than 4.9 million CELs were given to solar
PV projects for a total energy production
of 4.84 TWh [CNC 2016]. The average
CELs were priced at MXN 375/MWh (EUR
17.86/MWh).
However, PPAs do only reflect partly the ac-
tual economic competitiveness of a solar pro-
ject. When comparing it to other projects, it is
also important to know what the tax regime
for such a project or competing power pro-
jects have, e.g. in the USA PV projects qualify
for the federal energy ITC programme (30 %)
and the Modified Accelerated Cost Recovery
System depreciation (five-year MACRS). The
ITC is 30 % until 2019 then it is reduced to
26 % in 2020 and 22 % 2021. After 2023,
the residential credit will drop to zero while
the commercial and utility credit will drop to a
permanent 10 %.
37 Exchange rate: 1 EUR = 21 MXN

57
4. THE PV INDUSTRY
The PV industry consists of a long value chain
from raw materials to PV system installation
and maintenance. So far, the main focus has
been on the solar-cell and module manufac-
turers, but there is also the so-called up-
stream industry (e.g. materials, polysilicon
production, wafer production and equipment
manufacturing) as well as the downstream
industry (e.g. inverters, balance of system
(BOS) components, system development, pro-
ject development, financing, installations and
integration into existing or future electricity
infrastructure, plant operators, operation and
maintenance, etc.). In the near future, it will
be necessary to add (super)-capacitor and
battery manufacturers as well as power elec-
tronics and IT providers to manage supply
and demand and meteorological forecasts.
The main focus in this report, however, is still
on solar-cell, module and polysilicon manu-
facturers.
In 2015, the PV world market grew by roughly
20 % in terms of solar cell production to
about 57 GW. The market for installed sys-
tems also grew about 20 %, and values be-
tween 50 and 56 GW were reported by vari-
ous consultancies and institutions. This main-
ly represents the grid-connected PV market
since, to what extent the off-grid and con-
sumer-product markets are included remains
unclear.
In addition, the fact that some companies
report shipment figures, some sales figures
and others production figures adds to the un-
certainty. An additional source of error stems
from the fact that some companies produce
fewer solar cells than solar modules, but the
reporting does not always differentiate be-
tween the two and there is a risk that cell
production is counted twice — first at the cell
manufacturer and then again at the ‘integrat-
ed’ cell/module manufacturer. The difficult
economic conditions contributed to the lower-
ing in willingness to report confidential com-
pany data. Nevertheless, the figures show a
significant increase in production, as well as a
growing installation market.
The fact that a significant number of compa-
nies filed for insolvency, scaled back or even
cancelled their expansion projects, as well as
the introduction of minimum prices for solar
modules in Europe and import taxes on solar
cells and modules from China in the USA led
to a modest temporary ease of the price
pressure. However, the slight increase in prof-
it margins as well as the rapid expansion of
some markets immediately led to an increase
of new entrants in the field, notably large
semiconductor or energy-related companies.
In 2013, no significant capacity increase was
reported, but since the beginning of 2014 the
announcements of new capacity expansions
have significantly increased totalling about
6.6 GW of thin film and 34 GW of c-Si solar
cell capacity to be realised within the next 18
to 24 months. Not all of these announce-
ments were realised, but the capacity in-
creases along the value chain were large
enough to increase the overcapacity to levels
accelerating the price pressure. Overall it can
be stated that the rapid changes in the sector
and the still difficult financing situation make
any reasonable forecast for future capacity
developments very speculative.
58
4.1. Technology mix
After the temporary silicon shortage between
2004 and 2008, silicon prices fell dramatical-
ly, as did the cost of wafer-based silicon solar
cells. In 2015, their market share was over
90 % and they continue to be the main tech-
nology. Commercial module efficiencies range
widely from 12 % to 22 %, with monocrystal-
line modules from 16 % to 22 %, and poly-
crystalline modules from 12 % to 18 %. The
massive increases in manufacturing capacity
for both technologies were followed by the
capacity expansions needed for polysilicon
raw materials.
In 2005, for the first time, the production of
thin-film solar modules reached more than
100 MW per annum. Between 2005 and
2009, the CAGR of thin-film solar module
production exceeded that of the overall indus-
try, increasing the market share of thin-film
products from 6 % in 2005 to 10 % in 2007
and from 16 % to 20 % in 2009. Since then,
the thin-film share has declined slowly as the
ramp-up of new production lines has not fol-
lowed that of wafer-based silicon.
The number of thin-film manufacturers which
are silicon-based and use either amorphous
silicon or an amorphous/microcrystalline sili-
con structure has declined steeply in the last
5 years due to the efficiencies still at the low
end of the scale. Only a few companies use
Cu(In,Ga)(Se,S)2, or CdTe (cadmium telluride)
as absorber material for their thin-film solar
modules.
Concentrating photovoltaics (CPV) is strug-
gling to follow the cost reduction of the other
technologies and the number of companies
active in the field has declined sharply of the
last 5 years. Within CPV, there is a differenti-
ation according to concentration factors38 and
whether the system uses a dish (Dish CPV) or
lenses (Lens CPV). The main parts of a CPV
system are the cells, the optical elements and
the tracking devices.
The existing PV technology mix is a solid
foundation for the future growth of the sector
as a whole. No single technology can satisfy
all the different consumer requirements,
ranging from mobile and consumer applica-
tions, and the need for a few watts up to
multi-MW utility-scale power plants. If mate-
rial limitations or technical obstacles restrict
the further growth or development of a single
technology pathway, then the variety of tech-
nologies will be an insurance against any
stumbling blocks in the implementation of
solar PV electricity.
38 High concentration > 300 suns (HCPV), medium concen-
tration 5 < x < 300 suns (MCPV), low concentration < 5
suns (LCPV).

59
4.2. Polysilicon supply
Since 2000, the rapid growth of the PV indus-
try led to a situation where, between 2004
and early 2008, the demand for polysilicon
outstripped the supply from the semiconduc-
tor industry. Prices for purified silicon peaked
in 2008 at around USD 500/kg, resulting in
higher prices for PV modules. This extreme
price hike triggered a massive capacity ex-
pansion, not only among established compa-
nies, but many new entrants as well.
The massive production expansions, as well
as the difficult economic situation, led to a
fall in prices throughout 2009, reaching about
USD 50 to 55/kg at the end of 2009. There
was a slight upwards trend throughout 2010
and early 2011 before prices started to drop
again. In 2013, they started to stabilise and a
slight upward trend was observed in 2014
before the price pressure started to move
prices down again. In August 2014, prices
were in the USD 14 to 16/kg (EUR 12 to
14/kg) range.
Projected silicon production capacities for
2016 vary between 415 000 tonnes [Blo
2016c] and 470 000 tonnes [Ikk 2016]. It is
estimated that about 27 000 to 30 000
tonnes will be used by the electronics indus-
try. In addition, possible solar cell production
will depend on the material used per Wp. The
current average worldwide is about 4.5 g/Wp
for mono- and 5.0 g/Wp for multicrystalline
silicon solar cells.
4.2.1. Silicon production processes
The high growth rates of the PV industry and
market dynamics forced the high-purity sili-
con companies to explore process improve-
ments, mainly for two chemical vapour depo-
sition approaches — an established produc-
tion approach known as the Siemens process
and a manufacturing system based on fluid-
ised bed reactors. It is very probable that im-
proved versions of these two types of pro-
cesses become the workhorses of the polysil-
icon production industry in the near future.
Siemens process: The Siemens reactor was
developed in the late 1950s and has re-
mained the dominant production route ever
since. In 2009, about 80 % of total polysilicon
manufactured worldwide was made using a
Siemens-type process. It involves deposition
of silicon from a mixture of purified silane or
trichlorosilane gas, with an excess of hydro-
gen, on to high-purity polysilicon filaments.
The silicon growth then takes place inside an
insulated reaction chamber or ‘bell jar’ which
contains the gases. The filaments are assem-
bled as electric circuits in series and are
heated to the vapour deposition temperature
by an external direct current. The silicon fila-
ments are heated to very high temperatures
between 1 100 and 1 175 °C at which tri-
chlorosilane, with the help of the hydrogen,
decomposes to elemental silicon and deposits
as a thin-layer film on to the filaments. Hy-
drogen chloride is formed as a by-product.
Temperature control is the most critical pro-
cess parameter. The temperature of the gas
and filaments must be high enough for the
silicon from the gas to deposit on to the solid
surface of the filament, but well below the
melting point of 1 414 °C, so that the fila-
ments do not start to melt. Secondly, the
deposition rate must be well controlled and
not too fast, otherwise the silicon will not de-
posit in a uniform, polycrystalline manner,
making the material unsuitable for semicon-
ductor and solar applications.
Fluidised-bed (FB) process: A number of
companies develop polysilicon production
processes based on FB reactors. The motiva-
tion for using the FB approach is the poten-
tially lower energy consumption and continu-
ous production, compared to the Siemens
batch process. In this process, tetrahy-
drosilane or trichlorosilane and hydrogen
gases are continuously introduced into the
bottom of the FB reactor at moderately ele-
vated temperatures and pressures. At a con-
tinuous rate, high-purity silicon seeds are in-
serted from the top and suspended by the

60
upward flow of gases. At the operating tem-
perature of 750 °C, the silane gas is reduced
to elemental silicon and deposits on the sur-
face of the silicon seeds. The growing seed
crystals fall to the bottom of the reactor
where they are removed continuously.
Upgraded metallurgical grade (UMG) sili-
con was seen as one option for producing
cheaper solar-grade silicon with 5- or 6-nines
purity, but support for this technology is wan-
ing in an environment where higher-purity
methods are cost-competitive. A number of
companies have delayed or suspended their
UMG-silicon operations as a result of low
prices and lack of demand for UMG materials
for solar cells.

61
4.3. Polysilicon manufacturers
The following list gives a short description of
the 10 largest companies in terms of produc-
tion in 2015. More information about other
polysilicon companies can be found in various
market studies.
4.3.1. GCL-Poly Energy Holdings Ltd.
(China)
GCL-Poly (http://www.gcl-poly.com.hk) was
founded in March 2006 and started the con-
struction of its Xuzhou polysilicon plant
(Jiangsu Zhongneng Polysilicon Technology
Development Co. Ltd.) in July 2006. Phase I
had a designated annual production capacity
of 1 500 tonnes and the first shipments were
made in October 2007. Full capacity was
reached in March 2008. At the end of 2015,
polysilicon production capacity had reached
70 000 tonnes and 14 GW of wafers. The
wafer capacity was further increased to
17 GW at the end of 1H 2016. The company
reported production of 74 358 tonnes of pol-
ysilicon with sales of 18 023 tonnes of pol-
ysilicon and 15.2 GW of wafers for 2015.
The company also invested in the down-
stream solar business. GCL Solar System Ltd.
(SSL) is a wholly owned subsidiary of GCL-
Poly Energy Holdings Ltd. and provides solar-
system turnkey solutions for residential, gov-
ernmental, commercial and solar farm pro-
jects, including design, equipment supply, in-
stallation and financial services. Another sub-
sidiary is GCL Solar Power Co. Ltd. which is
developing, operating and managing solar
farms with a total capacity of 2.3 GW at the
end of 2015.
4.3.2. Wacker Polysilicon AG (Germany,
USA)
Wacker (http://www.wacker.com) is one of the
world’s leading manufacturers of hyper-pure
polysilicon for the semiconductor and PV in-
dustry, chlorosilanes and fumed silica. The
company has two production sites in Germa-
ny, Burghausen with a production capacity of
about 40 000 tonnes Nünchritz with 20 000
tonnes. In April 2016, the company officially
opened their factory in factory in Charleston
(TN), USA with a nameplate capacity of
20 000 tonnes [Wac 2016]. The factory is
ramped up in 2016 and once operational, the
company plans to have a capacity of 80 000
tonnes by the end of 2016. For 2015, a pro-
duction of 51 051 tonnes was estimated [Ros
2016].
4.3.3. OCI Company Ltd. (South Korea)
OCI (http://www.oci.co.kr/) (formerly DC Chem-
ical) is a global chemical company with a
product portfolio spanning inorganic chemi-
cals, petro and coal chemicals, fine chemicals,
and renewable energy materials. In 2006, the
company started its polysilicon business and
successfully completed its 6 500 tonnes P1
plant in December 2007. The 10 500 tonne
P2 expansion was completed in July 2009,
and with another 10 000 tonnes P3 brought
the total capacity to 27 000 tonnes at the
end of 2010. The de-bottlenecking of P3 took
place in 2011, and increased the capacity to
42 000 tonnes at the end of that year. Fur-
ther capacity expansions, P4 (20 000 tonnes)
and P5 (24 000 tonnes), had been put on
hold due to the rapid decline in the price of
polysilicon. Instead, the company finished an
additional de-bottlenecking of the existing
plants and increased the capacity by 10 000
tonnes in 2015. For 2015, a production of
44 209 tonnes was estimated [Ros 2016].
OCI invested in downstream business and
holds 89.1 % of OCI Solar Power, which de-
velops, owns and operates solar power plants
in North America. On 23 July 2012, the com-
pany signed a PPA with CSP Energy (Austin,
TX), USA for a 400 MW solar project (Alamo
1-7). The solar farms should be fully opera-
tional by 2016. In 2015, the company
launched its first projects in China and Mexi-
co.

62
4.3.4. Hemlock Semiconductor Corpo-
ration (USA)
Hemlock Semiconductor Corporation
(http://www.hscpoly.com) is based in Hemlock,
Michigan. The corporation was set up as a
joint venture between Dow Corning Corpora-
tion (63.25 %) and two Japanese firms, Shin-
Etsu Handotai Co. Ltd. (24.5 %) and
Mitsubishi Materials Corporation (12.25 %). In
2013, Dow Corning Corporation bought the
Mitsubishi Materials Corporation share, in-
creasing its own share to 75.5 %.
In 2007, the company had an annual produc-
tion capacity of 10 000 tonnes of polycrystal-
line silicon, and production at the expanded
Hemlock site (19 000 tonnes) started in June
2008. A further expansion at the Hemlock
site, as well as a new factory in Clarksville
(Tennessee) United States, began in 2009.
Total production capacity was expanded to
56 000 tonnes in 2012, but the Clarksville
factory was closed due to overcapacities in
the market in 2014. For 2015, a production
capacity of 36 000 tonnes and actual produc-
tion of 26 000 tonnes was estimated [Ros
2016].
4.3.5. TBEA Silicon Co. Ltd. (China)
TBEA Silicon Co. Ltd. (http://www.tbea.com.cn/)
was established at the State Hi-Tech Devel-
opment Zone in Urumqi, Xinjiang, China by
Tebian Electric Apparatus Stock Co. Ltd.
(TBEA) and East Electric EMei Semiconductor
Institute. TBEA is a major manufacturer of
power transmission and transformation
equipment including inverters for renewable
energy applications. TBEA Silicon is active in
the field of polysilicon manufacturing as well
as gird-connected and mini-grid power plants.
For 2015, a production capacity of 23 000
tonnes and actual production of 19 205
tonnes was estimated [Ros 2016].
4.3.6. REC Silicon ASA (Norway/USA)
REC Silicon (http://www.recsilicon.com) is
headquartered in Moses Lake, Washington,
USA, and has production facilities in Moses
Lake and Butte, Montana. The company re-
sulted from the 2013 split of Renewable En-
ergy Corporation into two companies: REC
Solar ASA and REC Silicon ASA. In 2005, the
Renewable Energy Corporation took over Ko-
matsu’s US subsidiary Advanced Silicon Mate-
rials LLC (ASiMI), and announced the for-
mation of its silicon division business area,
REC Silicon Division, comprising the opera-
tions of REC ASiMI and REC Solar Grade Sili-
con LLC. At the beginning of 2014, the com-
pany announced the formation of a joint ven-
ture with Shaanxi Non-Ferrous Tian Hong New
Energy Co. Ltd. in China. This joint venture
includes the development of an 18 000-tonne
fluidised bed reactor (FBR-B) production fa-
cility.
Production capacity at the end of 2015 was
about 2 000 tonnes and, according to the
company, a total of 16 882 tonnes of polysil-
icon, of which 14 098 tonnes were FBR and,
2 784 tonnes of Siemens solar grade, were
produced in 2015.
4.3.7. Tokuyama Corporation (Japan)
Tokuyama (http://www.tokuyama.co.jp/) is a
chemical firm involved in the manufacturing
of solar-grade silicon, the base material for
solar cells. According to the company, it had
an annual production capacity of 5 200
tonnes in 2008 and expanded this to 9 200
tonnes in 2010. In February 2011, the com-
pany began building a new 20 000-tonne fa-
cility in Malaysia. The first phase for 6 200
tonnes started a trial production in March
2013 and the second phase for 13 800
tonnes started production in October 2014. In
September 2016, OCI announced its decision
to acquire new shares of Tokuyama’s Malay-
sian subsidiary for polysilicon production [Oci
2016]. A final decision for the acquisition of
the full stake in the Tokuyama Malaysia will
be decided by the end of March 2017.
A production capacity of 23 000 tonnes was
reported for FY 2016 [Ikk 2016]. For 2015, an
actual production of 16 344 tonnes was es-
timated [Ros 2016].

63
4.3.8. China Silicon Corporation Ltd.
(China)
China Silicon Corporation Ltd. (Sinosico:
http://www.sino-si.com/eng/home.aspx) was
established in March 2003, with headquarters
in the High-tech Development Zone, Luoyang
City, Henan province. In June 2003, the com-
pany began with the construction of Phase I
of a polysilicon production project with 300
tonnes per year. Since then the production
capacity has been increased stepwise and
was more than 10 000 tonnes at the end of
2015. For 2015, a production of 10 091
tonnes was estimated [Ros 2016].
In January 2009, the National Development
and Reform Commission officially approved
the establishment of a National Engineering
Laboratory for polysilicon by Sinosico. On
22 January 2010, the National Key Engineer-
ing Laboratory for polysilicon production was
officially opened.
4.3.9. SunEdison Inc. (USA)
SunEdison (http://sunedisonsilicon.com), for-
merly MEMC Electronic Materials Inc., has its
headquarters in St Peters (Missouri), USA. It
started operations in 1959 producing semi-
conductor-grade wafers, granular polysilicon,
ultra-high-purity silane, trichlorosilane, silicon
tetraflouride and sodium aluminium tetra-
flouride. In February 2011, the company and
Samsung entered into a 50/50 equity joint
venture to build a polysilicon plant in Korea
with an initial capacity of 10 000 tonnes in
2013. At the end of 2011, the company
closed its 6 000-tonne factory in Merano, Ita-
ly, and in 2012 it reduced its capacity in Port-
land (Oregon), USA. For 2015, a production
capacity of 21 100 tonnes and actual produc-
tion of 10 055 tonnes was estimated [Ros
2016].
In February 2016, SunEdison announced that
it will shut its FBR polysilicon facility in Pasa-
dena, Texas and the filed for insolvency in
April 2016. According to a financial disclosure
note by GCL-Poly, GCL is buying the SBR as-
sets of Sun Edison for USD 150 million [Gcl
2016].
4.3.10. Daqo New Energy Co. Ltd.
(China)
Daqo New Energy (http://www.dqsolar.com/) is
a subsidiary of the Daqo Group and was
founded by Mega Stand International Ltd. in
January 2008. Initially, the company built a
high-purity polysilicon factory in Wanzhou,
China, with an annual output of 3 300 tonnes
in the first phase. The first polysilicon produc-
tion line, with an annual output of 1 500
tonnes, started operating in July 2008. Pro-
duction capacity in 2009 was 3 300 tonnes
and had reached more than 4 300 tonnes by
the end of 2011. According to the company,
production capacity at the end of 2013 was
6 150 tonnes and an expansion of the capaci-
ty to 12 150 was achieved at the end of Sep-
tember 2015. A further expansion of the ca-
pacity to 18 000 tonnes should be finished at
the end of 2016 and start production in 1Q
2017. In addition, the company manufactures
wafers and had a capacity of 87 million at
the end of 2015. The company reported sales
of 8 234 tonnes of polysilicon and
61.1 million of own wafers and 15.3 million
OEM wafers for 2015.

64
4.4. Solar-cell production companies
In 2016, more than 100 companies still pro-
duce solar cells39 down from the 350 active in
2013. The solar-cell industry has been very
dynamic over the last decade, and each sta-
tus report is only a snapshot of the current
situation, which can change in just a few
weeks. The nameplate capacity of solar cell
manufacturing capacity was given with
90 GW for Q1 2016 and could increase to
109 GW at the end of 2016 [Blo 2016c].
The following section gives a short description
of the 20 largest companies, in terms of ac-
tual production/shipments in 2015. More in-
formation about other solar cell companies
can be found in various commercial market
studies. The capacity, production or shipment
data are from the annual reports or financial
statements either of the respective compa-
nies or the references cited.
4.4.1. Trina Solar Ltd. (China)
Trina Solar (http://www.trinasolar.com/) was
founded in 1997 and went public in Decem-
ber 2006. The company has integrated prod-
uct lines, from ingots to wafers and modules.
In December 2005, a 30 MW monocrystalline
silicon wafer product line went into operation.
In February 2016, Trina completed the acqui-
sition of all the assets from Solland Solar,
with approximately 200 MW solar cell manu-
facturing capacity located in Heerlen, the
Netherlands [Tri 2016].
According to the company’s annual report, the
production capacity at the end of 2015 was
1.8 GW for wafers, 2.3 GW for ingots and
3.5 GW for cells, and 5 GW for modules, with
a planned increase to 5 GW for cells and
6 GW for modules in 2016. Module and sys-
39 Solar-cell production capacities mean:
- In the case of wafer silicon-based solar cells, only the
cells, - In the case of thin films, the complete integrated module,
- Only those companies which actually produce the active
circuit (solar cell) are counted, - Companies which purchase these circuits and make cells
are not counted.
tem deliveries of 5.7 GW were reported for
2015. A solar cell production of 3.5 to 3.6 GW
was estimated for 2015.
In January 2010, the company was selected
by the Chinese Ministry of Science and Tech-
nology to establish a State Key Laboratory
(SKL) to develop PV technologies within the
Changzhou Trina PV Industrial Park. The la-
boratory is being established as a national
platform for driving PV technologies in China.
Its mandate includes research into PV-related
materials, cell and module technologies and
system-level performance. It will also serve
as a platform for bringing together technical
capabilities from the company’s strategic
partners, including customers and key PV
component suppliers, as well as universities
and research institutions.
4.4.2. JA Solar Holding Co. Ltd. (China)
JingAo Solar Co. Ltd. (http://www.jasolar.com)
was established in May 2005 by the Hebei
Jinglong Industry and Commerce Group Co.
Ltd., the Australia Solar Energy Development
Pty Ltd. and the Australia PV Science and En-
gineering Company. Commercial operations
started in April 2006 and the company went
public on 7 February 2007. According to the
annual report of the company, the production
capacity was 4.4 GW for cells, 3.9 GW for
modules and 1.5 GW for wafers at the end of
2015. For 2016, an increase of the cell and
module manufacturing capacity to 5 GW each
is foreseen. Total shipments for 2015 were
reported with 3.9 GW (about 3.5 GW modules
and 400 MW cells). It is estimated, that about
3.5 to 3.6 GW of solar cells were produced in
2015.
4.4.3. Hanwha (China/Germany/
Malaysia/South Korea)
The Hanwha Group (http://www.hanwha.com)
acquired a 49.99 % share in Solarfun Power
Holdings in 2010 and the name was changed
to Hanwha SolarOne in January 2011. It pro-

65
duces silicon ingots, wafers, solar cells and
solar modules. The first production line was
completed at the end of 2004 and commer-
cial production started in November 2005.
The company went public in December 2006
and reported the completion of its production
capacity expansion to 360 MW in the second
quarter of 2008.
In August 2012, it acquired Q CELLS (Germa-
ny/Malaysia), which had filed for insolvency in
April 2012. Hanwha, with its two brands
Hanwha Q CELLS and Hanwha SolarOne, had
a combined production capacity of 3.7 GW of
solar cells (2.1 GW in China, 1.6 GW in Malay-
sia) and 4.3 GW for solar modules (2.3 GW in
China, 0.5 GW in Korea and 1.5 GW in Malay-
sia) at the end of 2015. In the first half of
2016, the module manufacturing capacity in
Korea was expanded to 1.4 GW. In addition,
Hanwha SolarOne has 1.4 GW of ingot and
900 MW of wafer production capacity. After
the closure of the manufacturing facilities in
Germany in March 2015, a 60 MW cell pro-
duction line remained as a R & D facility. For
2015, Hanwha a solar cell production of 3.5
to 3.6 GW and 3.3 GW solar modules is esti-
mated from the annual report. The company
reported a PV power project pipeline of
946 MW in March 2016.
4.4.4. Canadian Solar Inc. (CSI)
(China/Canada)
CSI (http://www.canadiansolar.com/) was
founded in Canada in 2001 and listed on
NASDAQ in November 2006. CSI has estab-
lished six wholly owned manufacturing sub-
sidiaries in China, manufacturing ingot/wafer,
solar cells and solar modules. According to
the company, at the end of 2015 it had
400 MW of wafer capacity, 2.7 GW cell ca-
pacity and 4.3 GW module manufacturing
capacity (3.8 GW in China and 500 MW in On-
tario, Canada). In 2016, the solar cell manu-
facturing capacity should be increased to
3 GW and the module manufacturing capacity
to 5.8 GW. For 2015, the company reported
shipments of 4.7 GW of modules. In terms of
sales, the company reported 4.1 GW of mod-
ules and 298 MW of systems. The solar cell
production was estimated at 2.5 GW. In Sep-
tember 2016, the company reported opera-
tion and ownership of PV power plants with
470 MW and a contracted project with
2.4 GW.
4.4.5. First Solar LLC
(USA/Germany/Malaysia)
First Solar LLC (http://www.firstsolar.com) is
one of the few companies worldwide to pro-
duce CdTe thin-film modules. It currently has
two manufacturing sites — in Perrysburg
(United States) and Kulim (Malaysia) — which,
at the end of 2015, had a combined capacity
of 2.8 GW. In Q2 2016, the company reported
an average module efficiency of 16.2 %. In
March 2016, the company reported that it
had PV power plants with more than 5 GW
under O&M contracts [Fir 2016].
For 2015, the company reported a production
of 2.52 GW and shipments of 2.9 GW.
4.4.6. JinkoSolar Holding Co. Ltd.
(China)
JinkoSolar (http://www.jinkosolar.com/) was
founded by Hongkong Paker Technology Ltd. in
2006. Starting from the upstream business, in
2009, the company expanded its operations
across the solar value chain, including recov-
erable silicon materials, silicon ingots and
wafers, solar cells and modules. In May 2010,
it went public and was listed on the New York
Stock Exchange. According to the company, it had
manufacturing capacities of 3 GW for wafers and
3.5 GW for solar cells (3.1 GW in China, 400 MW
in Malaysia) and 4.3 GW for solar modules at the
end of 2015. A capacity increase to 3.5 GW for
wafers and cells and 6.3 GW for modules is
planned in 2016. For 2015, the company reported
module shipments of 4.5 GW. It is estimated
that 2.4 to 2.5 GW of solar cells were manu-
factured in 2015.

66
4.4.7. Yingli Green Energy Holding Co.
Ltd. (China)
Yingli (http://www.yinglisolar.com/) went pub-
lic on 8 June 2007. The main operating sub-
sidiary, Baoding Tianwei Yingli New Energy
Resources Co. Ltd, is located in the Baoding
National High-tech Industrial Development
Zone. The company’s operations include solar
wafers, cell manufacturing and module pro-
duction. According to the firm, production ca-
pacity was 1.85 GW at the end of 2011. In its
2013 annual report, it reported that, by the
end of 2015, it had a production capacity of
3 GW for ingots and wafers, 3.2 GW for solar
cells and 4 GW for solar modules. Total re-
ported shipments of solar modules for 2015
were 2.4 GW. Solar-cell production is esti-
mated at 2.3- 2.4 GW for 2015.
In January 2010, China’s Ministry of Science
and Technology approved an application to
establish a national-level key laboratory in
the field of PV technology development, the
SKL of PV Technology, at Yingli Green Ener-
gy’s manufacturing base in Baoding.
4.4.8. Motech Solar (Taiwan/China)
Motech Solar (http://www.motech.com.tw) is a
wholly owned subsidiary of Motech Industries
Inc., located in the Tainan Science Industrial
Park. The company started its mass produc-
tion of polycrystalline solar cells at the end of
2000, with an annual production capacity of
3.5 MW. Production increased from 3.5 MW in
2001 to 1 GW in 2011. In 2009, Motech
started the construction of a factory in China,
which reached its nameplate capacity of
500 MW in 2011. In December 2014, Motech
and Topcell Solar International Co., Ltd.
agreed to merge [Mot 2014]. The merger was
completed by June 2015. In September 2015,
the company announced that its subsidiary,
Motech (Suzhou) Renewable Energy Co., Ltd
agreed to a strategic partnership with Jiansu
Aide Solar Energy Technology Co. [Mot 2015].
Total production capacity at the end of 2015
was reported as 3.2 GW (1.06 GW China and
2.14 GW Taiwan), and total shipment of
2.45 GW was reported.
4.4.9. Neo Solar Power Corporation
(Taiwan)
Neo (http://www.neosolarpower.com/) Solar
Power was founded in 2005 by Powerchip
Semiconductor, Taiwan’s largest DRAM com-
pany, and went public in October 2007. The
company manufactures mono- and multicrys-
talline silicon solar cells. In 2013, it merged
with DelSolar to become the largest Taiwan-
ese cell producer. Since the end of 2014, total
installed manufacturing capacity was 2.2 GW
for silicon solar cells (400 MW in China,
1.8 GW in Taiwan) and 480 MW for modules.
In 2016, the company plans to expand its ca-
pacities to 2.5 GW of solar cells and 0.8 to
1 GW of modules. According to the company,
shipments in 2015 exceeded 2 GW.
4.4.10. Tongwei Solar (Hefei) Co., Ltd.
(PRC)
Tongwei Solar (http://www.tw-solar.com/en/)
is part of the Tongwei Group, a private com-
pany with core business in agriculture and
new energy and was set up in 2013. In 2011,
Tongwei Group signed an integrated PV stra-
tegic cooperation agreement with Xinjiang
Government, which included 50 000 tonnes
solar-grade polysilicon project, 3 GW solar
wafer and solar cell project, as well as 5 solar
plants of 350 MW.
Tongwei Solar, has an annual production ca-
pacity of 2 GW afor solar cells and 500 MW
for solar modules. Furthermore, the group’s
subsidiary Sichuan Yongxiang Polysilicon has
now a polysilicon production capacity of
15 000 tonnes. It is estimated that the com-
pany had a solar cell production of 1.6 GW in
2015.
4.4.11. Shunfeng International Clean
Energy Ltd. (China)
Shunfeng Int. (http://sfcegroup.com/en/) is a
Holding Company registered in Hong Kong.
According to the company, its mission is to

67
create a low-carbon environment. The Group
is a fully integrated PV service provider en-
gaging in solar power stations constructions
and operations, solar products manufacturing
as well as solar energy storage.
The group has a number of subsidiaries,
which are fully or partially owned:
100 % ownership: Jiangsu Shunfeng Photo-
voltaic Technology Co., Ltd. (PRC), Wuxi Sun-
tech Power Co., Ltd. (PRC), S.A.G. Solarstrom
Group (Germany), Sunways AG (Germany)
Partly ownership: 63 % in Suniva (USA), 30 %
in Powin Energy Corporation (USA), 28 % in
Shanghai Everpower Power Technology Co.,
Ltd. (PRC).
According to the annual Report 2015, the an-
nual production capacity of solar modules
and solar cells, was approximately 2.4 GW
and 2.51 GW respectively. The solar power
generation business had a grid-connected
annual designed installed capacity, of
1 780 MW. For 2015, a total shipment of
2.28 GW solar modules was announced with
1.30 GW being shipped to external customers.
Solar cell production was estimated at
1.4 GW.
4.4.12. Gintech Energy Corporation
(Taiwan)
Gintech (http://www.gintech.com.tw/) was es-
tablished in August 2005 and went public in
December 2006. Solar cell production at
Factory Site A, Hsinchu Science Park,
began in 2007 with an initial production
capacity of 260 MW and increased to
1 450 MW and 350 MW in Thailand at
the end of 2015. The capacity is planned
to be increased to 750 MW in Thailand
during 2016. In July 2015, the company
announced a strategic partnership with
Tongwei Solar to work together and increase
the capacity to 1 GW of solar cell capacity
and 450 MW of solar module capacity at
Gintech (Thailand) [Gin 2015]. In 2015, solar
cell production of about 1.3 to 1.4 GW was
estimated.
4.4.13. Zhongli Talesun Solar Co. Ltd.
(China)
Talesun Solar (http://www.talesun-eu.com/)
was established in 2010 as a wholly owned
subsidiary of Zhongli Sci-tech Group. Accord-
ing to the company, it currently has an annual
capacity of 2 GW of solar cells and 3 GW of
modules. On 2 December 2015, the company
started its commercial production of solar
cells and modules with a capacity of 300 MW
in Rayong, Thailand [Tal 2015]. According to
the company, the factory is designed for a
capacity of 800 MW each to be reached in
2017. Total shipments were reported with
1.5 GW for 2015. In house solar cell produc-
tion is estimated at 1.2 to 1.3 GW.
4.4.14. Risen Energy Co., Ltd. (China)
Risen Energy (http://www.risenenergy.com/en/)
was founded in 1986, and is located in Ning-
hai, Zhejiang. The company went public on the
Shenzhen Stock Exchange on 2 September
2010. According to the company, it had a
manufacturing capacity of solar cells and
modules of 2.6 GW each at the end of 2015.
A further expansion of 500 W each is fore-
seen in 2016. It is estimated that about 1.2
to 1.3 GW of solar cells and modules were
produced in 2015.
4.4.15. SunPower Corporation
(USA/Philippines/Malaysia)
SunPower (http://us.sunpowercorp.com/) was
founded in 1988 to commercialise proprietary
high-efficiency silicon solar-cell technology. It
went public in November 2005. The company
designs and manufactures high-performance
silicon solar cells based on an interdigitated
rear-contact design for commercial use. The
initial products, introduced in 1992, were
high-concentration solar cells with an effi-
ciency of 26 %. SunPower also manufactures
solar cells with an efficiency of 22 %, called
Pegasus, which is designed for non-
concentrating applications.
The company’s main R & D activity is con-
ducted in Sunnyvale (California), United

68
States, and has its cell-manufacturing plants
in the Philippines and Malaysia. Since2013,
SunPower had two cell-manufacturing plants,
one in the Philippines with 700 MW capacity
and a joint venture (AUOSP) with AU Optron-
ics Corporation in Malaysia with over
800 MW. The 350 MW capacity expansion in
the Philippines started commercial operation
in 2016. The company has three solar module
factories in the Philippines, Mexico and
France. Modules are also assembled for Sun-
Power by third-party contract manufacturers
in China and California. Total cell production
in 2015 was estimated at about 1.2 GW.
4.4.16. Kyocera Corporation (Japan,
Czech Republic, Mexico)
Kyocera (http://global.kyocera.com) started
with research into solar cells in 1975, The
Shiga Yohkaichi factory was established in
1980, and R & D and manufacturing of solar
cells and products started with the mass pro-
duction of multicrystalline silicon solar cells in
1982. In 1993, it became the first Japanese
company to sell home PV generation systems.
Besides solar-cell manufacturing plants in
Japan, Kyocera has module manufacturing
plants in China (joint venture with the Tianjin
Yiqing Group [10 % share] in Tianjin since
2003), Tijuana in Mexico (since 2004) and in
Kadaň in the Czech Republic (since 2005).
The company is also marketing systems that
both generate electricity through solar cells
and exploit heat from the sun for other pur-
poses, such as heating water. The Sakura fac-
tory, Chiba Prefecture, is involved in every-
thing from R & D and system planning to
construction and servicing, and the Shiga fac-
tory in the Shiga Prefecture, is active in R & D
as well as the manufacturing of solar cells,
modules, equipment parts, and devices which
exploit heat. In 2015, solar cell production is
estimated at 1 to 1.1 GW.
4.4.17. Changzhou EGing Photovoltaic
Technology Co. Ltd. (China)
EGing PV (http://www.egingpv.com/) was
founded in 2003 and operates along the
complete PV industry value chain, from the
production of monocrystalline furnaces,
quartz crucibles, 5-8 inch monocrystalline
silicon ingots, supporting equipment for
squaring and wire sawing, monocrystalline
silicon wafers, solar cells and solar modules.
According to the annual report, at the end of
2011, the company had a production capacity
of 1 GW across the complete value chain of
ingots, wafers, cells and modules. Solar cell
production capacity was about 1.2 GW at the
end of 2015. A solar cell production of
980 MW was estimated for 2015
4.4.18. Hareon Solar Technology Co. Ltd.
(China)
Hareon Solar (http://www.hareonsolar.com)
was set up as the Jiangyin Hareon Technolo-
gy Co. Ltd in 2004 and changed its name to
the Hareon Solar Technology Co. Ltd. in 2008.
It has five manufacturing facilities in both
Jiangsu and Anhui province, including Jiangyin
Hareon Power Co. Ltd., Altusvia Energy (Tai-
cang) Co. Ltd., Hefei Hareon Solar Technology
Co. Ltd., Jiangyin Xinhui Solar Energy Co. Ltd.
and Schott Solar Hareon Co. Ltd. Solar-cell
production started in 2009, with an initial ca-
pacity of 70 MW. According to the company,
the current production capacity is 2 GW an-
nually for ingot casting, wafers, cells, and
modules. For 2015, a solar cell production of
950 MW was estimated.
4.4.19. Solartech Energy Corp. (Taiwan)
Solartech Energy Corp. (http://en.solartech-
energy.com/) was established in Taiwan in
2005. The first solar cells production line was
inaugurated in April 2006. In June 2016, the
company reached a solar cell production ca-
pacity of 1.04 GW. The company has expan-
sion plans to 1.6 GW without a date specified.
For 2015, a solar cell production of 950 MW
is estimated.

69
4.4.20. Solar Frontier (Japan)
Solar Frontier (http://www.solar-frontier.com)
is a 100 % subsidiary of Showa Shell Sekiyu
KK. In 1986, Showa Shell Sekiyu started to
import small modules for traffic signals, and
began module production in Japan, coopera-
tively with Siemens (now Solar World). The
company developed CIS solar cells and, in
October 2006, completed the construction of
its first factory with 20 MW capacity in the
Miyazaki Prefecture. Commercial production
started in the 2007 financial year. The second
Miyazaki factory (MP2), with a production ca-
pacity of 60 MW, began manufacturing in
2009. In July 2008, the company announced
it would open a research centre ‘to strengthen
research on CIS solar-powered cell technolo-
gy, and to start collaborative research on
mass production technology of the solar
modules with Ulvac Inc.’ The aim of this pro-
ject was to start a new plant in 2011 with a
capacity of 900 MW. The ramp-up started in
February 2011 and at the end of that year
overall capacity was 980 MW. In 2011, the
company changed its name to Solar Frontier.
In early 2013, the company reported that the
Kunitomi plant (MP3) was operating at full
capacity. Production at MP2 was halted at the
end of 2012 to make adjustments for the
production of new differentiated products.
The plant resumed production in July 2013,
and in January 2014 the company announced
it would build a new factory with a capacity
of 150 MW in Ohiramura, Miyagi prefecture.
The new plant started commercial operation
in June 2016. A production of about 900 MW
is estimated for 2015.

70
5. CONCLUSIONS AND OUTLOOK
After a worldwide 2-year decrease (2012 and
2013) in new investments in clean energy,
the investment volume started to increase
again in 2014 and reached a new high of
USD 286 billion in 2015 [FSU 2016]. Even
more impressive is the fact that almost 54 %
of all new power generating capacity con-
nected came from renewable energy exclud-
ing large hydro. This record installation of
135 GW of new renewable power capacity
was made possible by the significant reduc-
tions in renewable energy system prices, es-
pecially solar PV. The total of renewable pow-
er capacity (excluding large hydro) at the end
of 2015 stood at 785 GW (1 849 GW includ-
ing large hydro) and generated 1 700 TWh of
electricity (5 680 TWh including large hydro)
worldwide.
For the 6th year in a row, solar power attract-
ed the largest amount of new investments in
renewable energies in 2015. It attracted
56 % of all new renewable energy invest-
ments or USD 161 billion (EUR 142.5 billion)
a 12 % increase compared to 2014 [FSU
2016]. Over 90 % of this investment went
into asset financing USD 148 billion (EUR
131 billion) out of which small distributed PV
capacity investments accounted for USD
67 billion (EUR 59.3 billion).
In 2015, for the first time, investments in de-
veloping economies for renewable energies
were larger than the investments in devel-
oped ones. Investments in developing econo-
mies grew by 18 % to USD 156 billion (EUR
138 billion), whereas the decreased in devel-
oped countries by 8 % to USD 130 billion
(EUR 115 billion).
In contrast to Europe, where new investments
in renewable energy declined by 27 %, new
investments increased almost everywhere
else [FSU 2016]. According to the current
market trends, as well as the IEA’s Medium-
Term Renewable Energy Market Report 2016,
this development will continue if no new poli-
cies are introduced in Europe [IEA 2016]. The
top country for new renewable energy in-
vestment was China with USD 102.9 billion
(EUR 91.1 billion), followed by the USA at USD
44.1 billion (EUR 39.0 billion) and Japan with
USD 36.2 billion (EUR 32.0 billion).
Europe as a whole saw investments of USD
48.8 billion (EUR 43.2 billion), mainly in the
UK (EUR 19.6 billion), and Germany (EUR
7.5 billion). South Africa recorded the biggest
change in 2015 with a 329 % increase com-
pared to 2014.
The PV industry has changed dramatically
over the last few years. China has become
the major manufacturing country for solar
cells and modules, followed by Taiwan and
Malaysia. Amongst the 20 biggest cell/thin-
film PV manufacturers in 2015, only one had
solar cell production facilities in Europe,
namely Trina due to the takeover of Solland
Solar (China, Thailand, The Netherlands). If
Europe wants to regain a double digit market
share of the solar cell manufacturing indus-
try, a major industry policy effort is needed to
revitalise the European PV manufacturing
industry. Europe still has an excellent PV
R & D infrastructure along the value chain,
but it will only be possible to maintain this in
the long run if industry players along this val-
ue chain, including PV manufacturing, are op-
erating in Europe.
The focus of this report is on solar cells and
modules, with some additional information
about the supply of polysilicon. Therefore, it is
important to remember that the PV industry
consists of more than that, and simply look-
ing at cell production does not give the whole
picture of the complete PV value chain. Be-
sides the information here about the manu-
facturing of solar cells, the whole upstream
industry (e.g. materials, polysilicon production,
equipment manufacturing) and downstream
industry (e.g. inverters, BOS components, sys-
tem development, installations) must also be
examined.

71
In 1990, implementation of the 100 000
roofs programme in Germany, and the Japa-
nese long-term strategy set in 1994, with a
2010 horizon, marked the beginning of ex-
traordinary growth in the PV market. Before
the start of the Japanese market implemen-
tation programme in 1997, annual growth
rates were about 10 % in PV markets, driven
mainly by communication, industrial and
stand-alone systems. Since 1990, PV produc-
tion has increased by three orders of magni-
tudes, from 46 MW to over 60 GW in 2015.
This corresponds to a CAGR of a little more
than 33 % over the last 25 years. In 2015,
statistically documented cumulative installa-
tions worldwide accounted for 235 GW.
The temporary shortage in silicon feedstock
between 2004 and 2008, resulted in the
market entrance of new companies and tech-
nologies. New production plants for polysili-
con, advanced silicon-wafer production tech-
nologies, thin-film solar modules and tech-
nologies, such as concentrator concepts, were
introduced into the market much faster than
was expected a few years ago. However, the
dramatic price decline for polysilicon and so-
lar modules, triggered by the overcapacity of
solar modules and polysilicon, has put enor-
mous economic pressure on a large number
of companies and is forcing the consolidation
of the industry. The benchmark was set by
the Chinese Ministry of Industry and Infor-
mation Technology when in February 2012 it
announced that it was aiming for an industri-
al consolidation of those companies with a
polysilicon production capacity of at least
50 000 tonnes, and solar-cell manufacturers
with at least a 5 GW production capacity by
2015 [MII 2012].
Companies with limited financial resources
and restricted access to capital are particular-
ly struggling in the current market environ-
ment. In 2013/2014, it was expected that the
then existing overcapacity in the polysilicon,
solar-cell and module manufacturing industry
could ease by 2015, when the global PV mar-
ket should exceed 50 GW per annum. Howev-
er, the slight increase in profit margins, which
could be observed in 2014/2015 immediately
let to the market entry of new players, which
contributed to the new overcapacity in the
sector. The current anticipated growth of an-
nual installations is based on the growth of
new markets outside Europe, especially in
China, South East Asia, the USA and South
America.
Despite the ongoing economic difficulties and
political uncertainties, the number and vol-
ume of new PV markets worldwide is increas-
ing. In addition, there are a growing number
of large investors who are steadily increasing
their investments in renewable energy and
solar PV, like Warren Buffet, or even de-
investing in fossil energy companies and
shifting this investment to renewable energy,
as announced by the Rockefeller Brother Fund
before the UN Climate Summit 2014 [BBC
2014]. Alongside the overall rising energy
prices and the need to stabilise the climate,
this will continue to keep the demand for so-
lar-power systems high. In the long term,
growth rates for PV will continue to be high,
even if economic conditions vary locally and
lead to a short-term downturn in some of the
markets.
This view is shared by an increasing number
of financial institutions, which are turning to
renewables as a sustainable and stable long-
term investment. Increasing demand for en-
ergy is pushing the prices of fossil energy
resources higher. Already in 2007, a number
of analysts were predicting that oil prices
could hit USD 100/bbl by the end of that year
or early in 2008 [IHT 2007]. After the spike in
oil prices in July 2008, when they were close
to USD 150/bbl, prices fell due to the global
financial crisis, reaching a low around USD
37/bbl in December 2008. Since then, the oil
price has been on a rollercoaster ride reflect-
ing the economic and political uncertainties
with a new low of USD 26.21/bbl in February
2016. Since then the price has rebound to
about USD 45 to 50/bbl driven by political

72
uncertainties in the Middle East and a deci-
sion by OPEC to curb production.
Already in 2010, the Energy Watch Group es-
timated that worldwide spending on combus-
tibles, fuels and electricity was between USD
5 500 billion (EUR 4 231 billion) to USD
7 500 billion (EUR 5 769 billion) in 2008 [Ewg
2010]. In 2015, the International Monetary
Fund (IMF) published a working paper outlin-
ing the political importance of energy subsidy
reforms reflecting the need for countries to
pledge carbon reductions ahead of the Paris
2015 United Nations Climate Change Confer-
ence in December 2015 [IMF 2015]. Accord-
ing to the findings of this study, post-tax en-
ergy subsidies are dramatically higher than
previously estimated — USD 4.9 trillion (EUR
3.8 trillion) or 6.5 percent of global GDP in
2013, and it was projected that it would
reach USD 5.3 trillion (EUR 4.7 trillion) or
6.5 % of global GDP in 2015. These figures
are much higher than the 2.5 % of global
GDP published in a 2013 study by the same
institution [IMF 2013] and about 10 times the
amount the IEA presents in the World Energy
Outlook 2015 as direct subsidies for fossil
fuels (USD 493 billion in 2014) [IEA 2015a].
As early as 2010, the Financial Times cited
Fatih Birol, then Chief Economist at the IEA in
Paris, saying that removing subsidies was a
policy that could change the energy game
‘quickly and substantially’. ‘I see fossil fuel
subsidies as the appendicitis of the global
energy system which needs to be removed
for a healthy, sustainable development fu-
ture,’ he told the newspaper [FiT 2010].
This was in line with the findings of a 2008
UNEP report Reforming Energy Subsidies
[UNEP 2008], which concluded: ‘Energy subsi-
dies have important implications for climate
change and sustainable development more
generally through their effects on the level
and composition of energy produced and
used. For example, a subsidy that ultimately
lowers the price of a given fuel to end-users
would normally boost demand for that fuel
and the overall use of energy. This can bring
social benefits where access to affordable
energy or employment in a domestic industry
is an issue, but may also carry economic and
environmental costs. Subsidies that encour-
age the use of fossil fuels often harm the
environment through higher emissions of
noxious and greenhouse gases. Subsidies that
promote the use of renewable energy and
energy-efficient technologies may, on the
other hand, help to reduce emissions.’
The 2013 energy subsidies of USD 4.9 trillion,
would have been sufficient to install
1 270 GW of PV systems at 2013 PV system
prices able to generate 1 500 TWh of elec-
tricity or 6.6 % of the global electricity de-
mand. For 2015, the figures are even more
breath-taking as system prices have de-
creased significantly. With the assumption of
a 60:40 % split between utility scale and res-
idential PV plants the energy subsidies of
USD 5.3 trillion could have been used to in-
stall 2 120 GW of utility PV plants and
900 GW of residential PV systems in 2015.
Together these PV systems would be able to
generate about 3 300 TWh of electricity or
about 15 % of global electricity demand.
Compared to this, actual PV installations
stood at 235 GW at the end of 2015.
Following the massive cost reductions for the
technical components of PV systems, like
modules, inverters, BOS, etc., the next chal-
lenge is to lower the soft costs of PV system
installations, such as the permits and financ-
ing costs. Despite the fact that PV system
components are global commodity products,
the actual prices for installed PV systems
vary significantly. In the third quarter of
2016, the average system price for residen-
tial systems was about EUR 1.50/Wp (USD
1.70/Wp) in Germany, but between USD 2.90
and 3.60/Wp (EUR 2.57 and 3.18/Wp) in Cali-
fornia and Japan [Blo 2016c]. Competition
and an increasing number of experienced in-
stallers are bringing costs further down.
In some countries, like Germany or Italy, the
installed PV capacity already exceeds 30 %
and 20 % of the installed thermal power

73
plant capacities, respectively. Together with
the respective wind capacities, wind and solar
together will exceed 60 % and 30 %, respec-
tively. Already on 9 June 2014, there was
about 23 GW of solar power on the German
grid, covering more than 50 % of the total
electricity demand at noon. To handle these
high shares of renewable electricity effective-
ly, new technical and regulatory solutions
have to be implemented to avoid running into
the problem of curtailing large parts of this
electricity. Besides conventional pumped stor-
age options, electrical batteries are becoming
increasingly interesting, especially for small-
scale storage solutions in the low-voltage
distribution grid. According to BNEF, prices for
battery packs for electric vehicles have de-
clined from about USD 1 000/kWh in 2010 to
USD 350/kWh in H2 2015 and could reach
USD 200/kWh by 2020 [Blo 2015]. Lithium-
ion batteries have an average of 5 000 cy-
cles, and with the above cost estimates, this
would correspond to net kWh costs compo-
nent for the full used battery pack of USD
0.07/kWh (EUR 0.063/kWh) and should fall to
USD 0.04/kWh (EUR 0.036/kWh) by 2020.
However, batteries are only a part of the
storage solution. Another important cost fac-
tor is the control electronics needed to com-
bine the storage with a PV system and the
grid. Currently, this part remains the domi-
nant factor, but can be integrated into the
inverter and will come down in price when the
production volume increases. At the moment,
residential PV systems with storage are still
more than twice as expensive as PV systems
without storage. On the other hand, in terms
of size, electricity storage systems for PV sys-
tems can be compared with the PV market
situation of about 10 to 12 years ago.
With LCOE from PV systems reaching USD
0.05 to 0.15/kWh (EUR 0.044 to 0.133/kWh)
in the second quarter of 2016 [Blo 2016d],
the additional storage costs already make
sense in markets with high peak costs in the
evening, where a shift of only a few hours is
required. As early as February 2012, BYD
(Build your Dreams) and the State Grid Corpo-
ration of China (SGCC) finished the construc-
tion of a large-scale utility project located in
Zhangbei, Hebei Province, which combines
100 MW of wind power, 40 MW of solar PV
electricity system, and 36 MWh of lithium-ion
energy storage. It is interesting to note that
the batteries used in this system are lithium-
ion car batteries, which were used before in
the BYD 36 taxi for about 4 000 cycles [Che
2014].
According to investment analysts and indus-
try prognoses, solar energy will continue to
grow at a high rate in the coming years. The
different PV industry associations, as well as
Greenpeace and the IEA, have developed new
scenarios for the future growth of PV sys-
tems. Table 6 shows the different scenarios
in the Greenpeace study, BNEF New Energy
Outlook 2016, the 2014 IEA PV Technology
Roadmap and the 2015 and 2016 IEA World
Energy Outlook (WEO) scenarios [Blo 2016b,
Gre 2015, IEA 2014, 2015a, 2016d]. Older
scenarios can be found in the previous PV
Status Reports [Jäg 2013, 2014].
It is of interest to note that within a year the
IEA scenarios in the 2016 WEO have in-
creased the cumulative installed capacity by
17 to 23 % for 2020 and 24 to 36 % by
2030 compared to the figures given in the
WEO 2015. With forecasts for new PV system
installations between 223 and 241 GW from
2016 to 2018, even the high value scenarios
are not unlikely to be reached [Blo 2016c].
These projections show that there are huge
opportunities for PV in the future if the right
policy measures are taken, but we have to
bear in mind that such a development will not
happen by itself. It will require the sustained
effort and support of all stakeholders to im-
plement the envisaged change to a sustaina-
ble energy supply with PV delivering a major
part. The main barriers to such developments
are perception, regulatory frameworks and
the limitations of the existing electricity
transmission and distribution structures.

74
Table 6: Evolution of the cumulative solar electrical capacities until 2050 [Blo 2016b, Gre 2015, IEA 2014, 2015a, 2016d]
Year 2015 [GW]
2020 [GW]
2025 [GW]
2030 [GW]
2040 [GW]
Actual installations 235
Greenpeace (reference scenario)
332 413 494 635
Greenpeace ([r]evolution scenario) 732 1 603 2 839 4 988
BNEF New Energy Outlook 2016 251 578 1 046 1 831 3 917
IEA PV Technology Roadmap (1) (hi-Ren Scenario)
450 790 1 721 4 130
IEA 2015 Current Policy Scenario 361 420 569 773
IEA 2015 New Policy Scenario 397 560 728 1 066
IEA 2015 450 ppm Scenario 420 605 938 1 519
IEA 2016 Current Policy Scenario 424 592 708 991
IEA 2016 New Policy Scenario 481 715 949 1 405
IEA 2016 450 ppm Scenario 517 833 1 278 2 108
(1) 2020, 2025 and 2040 values are extrapolated, as only 2013, 2030 and 2050 values are given
The IEA’s 2014 Energy Technology Perspec-
tives (ETP) state that the total investment
costs between 2011 and 2050 for achieving
a low-carbon energy sector (2 °C scenario,
2DS) would be an additional UDS2012
44 trillion (EUR 33.8 trillion) compared to the
business-as-usual scenario (6DS) with in-
vestment needs of UDS2012 118.4 trillion (EUR
91.1 trillion) [IEA 2014a].
However, the estimated fuel savings in the
low-carbon scenario are between USD2012
115 trillion (EUR 88.5 trillion) and USD2012
162 trillion (EUR 125 trillion) or 2.9 to 4.1
times the additional investment needed. This
clearly indicates the huge societal benefit of
a more aggressive climate change approach.
The power sector would require USD2012
39.6 trillion (EUR 30.5 trillion) for the 2DS
and USD2012 30.5 trillion (EUR 23.5 trillion) for
the 6DS scenario. The additional investments
for the 2DS scenario compared to the busi-
ness as usual would be USD 200 million (EUR
154 million) per year, which is less than the
current investment in the renewable energy
sector.
Due to the long lifetime of power plants (30
to 50 years), the decisions taken now will in-
fluence key socioeconomic and ecological
factors in our energy system in 2020 and be-
yond. As mentioned above, the ETP 2014
shows that fuel savings are on average more
than three times higher than the additional
investment in a low-carbon power supply.
The solar PV scenarios given above will only
be possible if solar cell and module manufac-
turing are continuously improved and novel
design concepts are realised, since the current
technology’s demand for certain materials,
like silver, would dramatically increase the
economic costs of this resource within the
next 30 years. Research to avoid such prob-
lems is under way and it is expected that
such bottlenecks will be avoided.
The PV industry is transforming into a mass-
producing industry with its sights on multi-
GW production sites. This development is
linked to increasing industry consolidation,
which presents both a risk and an opportunity
at the same time. If the new large solar-cell
companies use their cost advantages to offer
products with a power output guaranteed for

75
over 30 years, and at reasonable prices, then
PV markets will continue their accelerated
growth. This development will influence the
competitiveness of small and medium-sized
companies as well. To survive the price pres-
sure of the very competitive commodity mass
market, and to compensate for the ad-
vantages enjoyed by big companies through
the economies of scale that come with large
production volumes, smaller businesses will
have to specialise in niche markets offering
products with high value added or special so-
lutions tailor-made for customers. The other
possibility is to offer technologically more
advanced and cheaper solar-cell concepts.
The global world market, dominated by Eu-
rope in the last decade, has rapidly changed
into an Asia dominated market. The interna-
tionalisation of the production industry is
mainly due to the rapidly growing PV manu-
facturers from China and Taiwan, as well as
new market entrants from companies located
in India, Malaysia, the Philippines, Singapore,
South Korea, UAE, etc. At the moment, it is
hard to predict how the market entrance of
new players worldwide will influence future
developments in the manufacturing industry
and markets.
Over the last 10 years, not only have we ob-
served a continuous rise in energy prices, but
also a greater volatility. This highlights the
vulnerability created by our current depend-
ence on fossil energy sources, and increases
the burden developing countries are facing in
their struggle for future development. On the
other hand, we are seeing a continuous fall in
production costs for renewable energy tech-
nologies and the resulting LCOE, as a result
of industry learning curves.
It is important to remember that only about
40 % of the LCOE of PV electricity comes
from the overnight investment costs. Since
external energy costs, subsidies in conven-
tional energies and price volatility risks are
not generally taken into account, renewable
energies and PV are still perceived as being
less mature in the market than conventional
energy sources and have to pay extra risk
premiums for their financing. In the mean-
time, financing, permits and administrative
costs are much more relevant for the final
costs of PV electricity. If access to financing
was on the same level, LCOE costs could de-
crease considerably. Nevertheless, electricity
production from PV solar systems has already
proved that it can be cheaper than residential
consumer prices in a wide range of countries.
In addition, in contrast to conventional energy
sources, renewable energies are still the only
ones to offer the prospect of a reduction ra-
ther than an increase in prices in the future.

76
6. ACKNOWLEDGEMENTS
Over the last few years, in addition to the
numerous discussions I have had with inter-
national colleagues, as well as literature and
internet research, I have visited various gov-
ernment entities, research centres and lead-
ing industry companies in China, India, Japan,
the United States and Europe. I would like to
thank all my hosts for their kindness and the
time taken to welcome me, to share their
knowledge and to discuss the status and pro-
spects of PV.

77
7. REFERENCES
[Acw 2015] ACWA Power, Press Release, 15 July 2015, ACWA Power led consortium achieves financial close for the landmark Shuaa Energy 1-260 MWp Solar PV IPP transaction (Phase II of Dubai Electricity and Water Authori-ty’s Mohammed bin Rashid Solar Park in Dubai).
[ADB 2014] Asia Development Bank, Scoping off-grid renewable energy opportu-nities in Myanmar, March 2014.
[Art 2013] Art Solar, Press Release, 23 May 2013, http://artsolar.net/content/dr-wosley-barnard-officially-opens-artsolars-productionline-thursday-23-may-2013
[Ase 2016] Autoridad Nacional de los Servicios Públicos (ASEP), Press Release, 15 April 2016, ASEP considera am-pliar capacidad de instalación de energía solar en hogares y comer-cios del país.
[Ase 2016a] Autoridad Nacional de los Servicios Públicos (ASEP), datos relevantes del mercado eléctrico panameño mayo de 2016.
[Ban 2015] Banja, M., Monforti-Ferrario, F., Scar-lat, N., Dallemand, J.-F., Ossenbrink, H., Motola, V., Snapshot of renewable energy development in the EU-28, Vol. 2, Publications Office of the Eu-ropean Union, 2015, ISBN 978-92-79-47234-3.
[Bau 2012] Baumgartner, F., presentation at University Erlangen i-MEE, Germany, 11 May 2012, www.ahaw.ch/~bauf/
[Bau 2016] Baumgartner, F., presentation EUPVSEC 32, Munich, Germany, 22 June 2016, www.ahaw.ch/~bauf/
[BBC 2014] BBC, Rockefellers to switch invest-ments to ‘clean energy’, 23 September 2014, http://www.bbc.com/news/world-us-canada-29310475
[Bis 2014] BISOL, Press Release, 29 January 2014.
[Blo 2013] BNEF, Scaling up financing to ex-pand the renewables portfolio, Presentation given by Michael Lie-breich (CEO) at the IEA Renewable Energy Working Party, Paris 9 April 2013.
[Blo 2015] BNEF, 1 December 2015, H2 2015 Electric Vehicle Battery Price Survey.
[Blo 2016] BNEF, February 2016 PV spot price and shipment index, 29 February 2016.
[Blo 2016a] BNEF, Analyst reaction, Suntech is up for sale again, 8 June 2016.
[Blo 2016b] BNEF, New energy outlook, solar, June 2016.
[Blo 2016c] BNEF, Q3 2016 Global PV market outlook, 1 September 2016.
[Blo 2016d] BNEF, H1 2016 PV LCOE outlook, 12 April 2016.
[BNA 2016] Bundesnetzagentur, Öffentliche Be-kanntgabe der Zuschläge des Ver-fahrens nach § 12 Absätze 1 und 2 FFAV für den Gebotstermin 1. August 2016, 29 August 2016.
[Bol 2008] Real Decreto 1578/2008, de 26 de septiembre, Boletín Oficial del Estado: sábado 27 de septiembre de 2008, Núm. 234, http://www.boe.es/boe/dias/2008/09/27/pdfs/A39117-39125.pdf
[Bol 2012] Real Decreto-ley 1/2012, de 27 de enero, Boletín Oficial del Estado: sábado 28 de enero de 2012, Núm. 24, http://www.boe.es/boe/dias/2012/01/28/pdfs/BOE-A-2012-1310.pdf
[Bol 2013] Ley 24/2013, de 26 de diciembre, Boletín Oficial del Estado: viernes 27 de diciembre de 2013, Núm. 310, http://www.boe.es/boe/dias/2013/12/27/pdfs/BOE-A-2013-13645.pdf
[Bol 2013a] Real Decreto-ley 9/2013, de 12 de julio, Boletín Oficial del Estado: sábado 13 de julio de 2013, Núm. 167, http://www.boe.es/boe/dias/2013/07/13/pdfs/BOE-A-2013-7705.pdf
[Bol 2014] Real Decreto 413/2014, de 6 de junio, Boletín Oficial del Estado: martes 10 de junio de 2014, Núm. 140, http://www.boe.es/boe/dias/2014/06/10/pdfs/BOE-A-2014-6123.pdf
[Bol 2014a] Ministerio de Industria, Energía y Turismo, IET/1045/2014, Boletín Ofi-cial del Estado: viernes 20 de junio de 2014, Núm. 150, http://www.boe.es/boe/dias/2014/06/20/pdfs/BOE-A-2014-6495.pdf
[Bru 2015] Commission de régulation de l’énergie en région de Bruxelles-capitale, proposition, (Brugel-Proposition 20151030-16), Relative
78
au coefficient multiplicateur appli-qué au photovoltaïque — Analyse des paramètres économiques, 30 octobre 2015.
[Bun 2016] German Federal Network Agency (Bundesnetzagentur), Installierte EE-Leistung 2015 (vorläufig — Stand 27.07.2016).
[Bxc 2016] BXC Ghana Limited (BXC), http://bxcghana.com/
[Cai 2015] Caixin, 1 September 2015, 5年再造
个国家电网,2万亿配网投资你真
看懂了吗?
,http://www.wusuobuneng.com/archives/23118
[Cbs 2016] Centraal Bureau voor de Statistiek, Hernieuwbare elektriciteit; productie en vermogen, 30 June 2016, http://statline.cbs.nl
[Che 2014] Robert Chen, BYD Motors, PRC, priva-te communication.
[CNC 2016] Centro Nacional de Control de Energía, Comunicado conclusión 1ª Subasta Eléctrica de Largo Plazo, 30 March 2016.
[CNC 2016a] Centro Nacional de Control de Ener-gía, Inversión de 4 mil millones de dólares al concluir el proceso de la Segunda Subasta Eléctrica, 28 September 2016.
[CNM 2016] Comisión Nacional de los Mercados y la Competencia, Notas de Prensa, 7 de marzo de 2016, La deuda del sistema eléctrico se ha reducido en 1.890 millones en 2015.
[CWa 2016] Commission wallonne pour l’énergie, communication, CD‐16c23‐CWaPE‐0002 sur le ‘montant des primes Qualiwatt pour les installations pho-tovoltaïques d’une puissance infé-rieure ou égale à 10 kW mises en service entre le 1er juillet et le 31 décembre 2016’, 23 March 2016.
[EC 2007] European Commission, C 3/2007 — Tarifs réglementés de l’électricité en Espagne, Official Journal of the Eu-ropean Communities, C 43/50, 27 February 2007.
[Ecr 2016] ECREE, ECOWAS observatory for renewable energy and energy effi-ciency, Project: Oyandze.
[EEG 2000] Gesetz über den Vorrang erneuerba-ren Energien (Erneuerbare-Energien-Gesetz — EEG), Bundesgesetzblatt Jahrgang 2000, Teil I, No 13, p. 305, 29 March 2000.
[EEG 2014] Gesetz für den Ausbau erneuerbarer Energien (Erneuerbare-Energien-Gesetz — EEG 2014) Bundesgesetz-blatt Jahrgang 2014, Teil I, No 33, 24 July 2014, p. 1066.
[EMA 2016] Government of Singapore, Energy Market Authority, Installed capacity of grid-connected solar photovoltaic (PV) systems, 11 August 2016.
[Ena 2016] Ethiopian News Agency, 28 August 2016, EEP to transfer solar energy projects to private developers.
[Ene 2016] Energie Zukunft Schweiz, Juni 2016, PV-Preisumfrage 2015.
[Est 2016] EUROSTAT, Electricity price statistics, May 2016 http://ec.europa.eu/eurostat/statistics-explained/images/f/f2/Half-year-ly_electricity_prices_%28EUR%29_V2.png
[Ete 2015] ETESA, Resolución No GC-01-2015, 28 January 2015.
[Eth 2015] The Ethiopian Herald, 24 September 2015, Ethiopia: solar panel factory due to begin production.
[Ewe 2016] European Wind Association, Wind in power — 2015 European statistics, February 2016.
[Ewg 2010] Energy Watch Group, March 2010, Abschätzung der jährlichen weltwei-ten Ausgaben für Energieversorgung, http://www.energywatchgroup.org
[FiT 2010] Financial Times, IEA counts $ 550 billion energy support bill, 6 June 2010.
[Fir 2016] First Solar, Press Release, 10 March 2016, First Solar reaches 5 GW of O&M assets.
[FSU 2016] Frankfurt School — UNEP Cen-tre/BNEF 2016, Global trends in re-newable energy investment 2016, http://www.fs-unep-centre.org
[Gcl 2016] GCL-Poly energy holdings limited, discloseable transaction, 28 August 2016, http://gcl-poly.todayir.com/attachment/2016082818170200002600333_en.pdf
[Gin 2015] Gintech Energy, Press Release, 20 July 2015, Gintech Energy and Tongwei Group reach a strategic partnership and private placement agreement.
[GoA 2006] Ley 26.190 — Ley de Energía Eléc-trica (2006), Boletín Oficial de la Re-pública de Argentina, Núm. 31.064,

79
http://www.diputados-catamarca.gov.ar/ley/BO020107.PDF
[GoC 2015] Government of Chile, Ministry of Energy, Energy 2050 — Chile’s ener-gy policy, http://www.energia2050.cl/uploads/libros/energy2050.pdf
[GoD 2007] Ley No 57-07 sobre Incentivo al Desarrollo de Fuentes Renovables de Energía y de sus Regímenes Especia-les (Dominican Republic).
[GoD 2012] Klima-, Energi- og Bygningsministe-riet, Bekendtgørelse om nettoafreg-ning for egenproducenter af elektri-citet, Lovtidende A, BEK nr 1068 af 16/11/2012, https://www.lovtidende.dk/Forms/L0700.aspx?s31=10&s19=1068+&s20=2012
[GoH 2014] Decreta No 404-2013: Ley general de la industria eléctrica, La Gazeta, Martes 20 de mayo del 2014, Num. 33 431.
[GoI 2015] Gazette of India, Extraordinary, Part I, Section 1, No 222, 25 August 2015, MNRE (NSM Coord. Group), Resolution, Scaling up of grid con-nected solar power projects from 20 000 MW by the year 2021-2022, to 100 000 MW by the year 2021-2022 under national solar mission.
[GoI 2016] Government of India, Press Infor-mation Bureau, Press Release, 4 August 2016, More than 44 235 MW accumulative capacity of renewable energy installed in the country.
[GoJ 2012] Government of Jordan, Law No 13 of 2012, Renewable Energy and En-ergy Efficiency Law, 16 April 2012, http://www.memr.gov.jo/EchoBusV3.0/SystemAssets/PDFs/EN/Laws/CleanVersionFinalRenewableEnergyEner-gyEfficiencyLaw.pdf
[GoK 2010] Ministry of Energy, Kenya, Feed-in-tariffs policy for wind, biomass, small hydros, geothermal, biogas and solar, 1st revision, January 2010, http://www.erc.go.ke/erc/fitpolicy.pdf
[GoK 2013] Government of Kazakhstan, Press Release, 5 February 2013.
[GoM 2008] Decreto por el que se expide la Ley para el Aprovechamiento de Ener-gías Renovables y el Financiamiento de la Transición Energética, Diario Oficial (Primera Sección) 88 (Mexi-co), 28 November 2008,
http://www.diputados.gob.mx/LeyesBiblio/ref/laerfte/LAERFTE_orig_28nov08.pdf
[GoM 2012] Se Expide la Ley General de Cham-bio Climático, Diario Oficial (Segunda Sección) 1 (Mexico), 6 June 2012, http://www.diputados.gob.mx/LeyesBiblio/ref/lgcc/LGCC_orig_06jun12.pdf
[Goo 2011] Goodrich, A., James, T. and Wood-house, M., Solar PV manufacturing cost analysis: U.S. competitiveness in a global industry, 2011, NREL/PR-6A20-53938.
[GoP 2006] Government of Pakistan, Policy for development of renewable energy for power generation, December 2006.
[GoP 2016] Government of Panama, Press Re-lease, 29 March 2016, Government approves NEP, 2015-2050, to guar-antee energy security.
[GoS 2008] Act No 34 of 2008: National Energy Act, Government Gazette, Republic of South Africa, Vol. 521, No 31638, 24 November 2008, http://www.info.gov.za/view/DownloadFileAction?id=92826
[GoS 2012] Government of Singapore, Energy Conservation Act 2012, Government Gazette, Acts Supplement, 2012, No 12, Friday 1 June 2012.
[GoS 2014] Schweizer Eidgenossenschaft, 2014. Revision der Energieverordnung per 1. April 2014, https://www.news.admin.ch/message/index.html?lang=de&msg-id=52243
[Gre 2015] Greenpeace International, Global
wind energy Council, solarPow-ereurope, Energy [r]evolution, 5th edition 2015 world energy scenario, September 2015.
[GUK 2016] https://www.gov.uk/feed-in-tariffs/overview
[Gse 2016] Gestore dei Servizi Energetici, Pub-blicato il rapporto statistico 2015 sul solare fotovoltaico, 10 August 2016.
[Gtm 2016] gtm research, April 2016, Q2 Global Solar demand monitor.
[Gtm 2016a] gtm research and Solar Industry Association, U.S. solar market in-sight, Executive summary, 2015 Year in Review, March 2016.
[Gtm 2016b] gtm research and Solar Industry Association, U.S. solar market in-sight, Executive summary, Q3 2016.

80
[Hed 2016] Issuance of power generation in-formative report for the non-interconnected islands, May 2016 http://www.deddie.gr
[Hil 2016] Hill, J., Clean Technica, 7 July 2016, China installed 18.6 GW of solar PV in 2015, but was all of it connected?
[Hir 2013] Hirth, L., ‘The market value of varia-ble renewables’, Energy Economics, Vol. 38, 2013, pp. 218-236.
[Hro 2016] HROTE, Data on RES and HE-CHP feed-in support system, June 2016, http://files.hrote.hr/files/PDFen/OIEIK/Monthly_Report_06_2016.pdf
[Hts 2016] HTSO SA, RES & CHP monthly statis-tics, May 2016, http://www.lagie.gr/fileadmin/groups/EDRETH/RES/2016_05_RES.pdf
[Hul 2014] Huld, T., Jäger Waldau, A., Ossen-brink, H., Szabo, S., Dunlop, E. and Taylor, N., Cost maps for unsubsi-dised photovoltaic electricity, JRC 91937.
[Hul 2014a] Huld, T., Ruf, H., Heilscher, G., Self-consumption of electricty by house-holds, Effects of PV system size and battery storage, Proceedings of the 29th EUPVSC, Amsterdam, 2014.
[Hwa 2016] Hwang, A., Digitimes, 31 August 2016, MOEA sets tentative 2017 feed-in tariffs for renewable energy.
[IEA 2014] IEA, PVPS, Trends 2014 in photovol-taic applications, Report IEA-PVPS T1-25:2014.
[IEA 2014a] IEA, Energy Technology Perspectives, 2014, 376 p., ISBN: 978-92-64-20800-1
[IEA 2014b] IEA, Technology Roadmap – Solar Photovoltaic Energy, 2014 edition, 55 pages
[IEA 2015] IEA, PVPS, 2014 snapshots of global PV markets, Report IEA PVPS T1-29:2016, ISBN 978-3-906042-32-9
[IEA 2015a] IEA, November 2015, World Energy Outlook 2015, ISBN 978-92-64-243668
[IEA 2016] International Energy Agency, Medi-um-Term Renewable Energy Market Report 2016 - Market Trends and Projections to 2021, 278 pages, ISBN 978-92-64-26497-7
[IEA 2016a] IEA PVPS, 2015 Snapshots of global PV markets, Report IEA PVPS T1-29:2016, ISBN 978-3-906042-42-8.
[IEA 2016b] IEA PVPS, National survey report of PV power applications in China 2015.
[IEA 2016c] IEA PVPS, 2016, Trends in photovol-taic applications — survey report of selected IEA countries between 1992 and 2015.
[IEA 2016d] IEA, November 2016, World Energy Outlook 2015, ISBN 978-92-64-26495-3
[IHT 2007] International Herald Tribune, 24 July 2007.
[Ikk 2016] Osamu I., PV Activities in Japan, Vol. 22, 2016.
[IMF 2013] International Monetary Fund, Energy subsidy reform: lessons and implica-tions, 28 January 2013.
[IMF 2015] International Monetary Fund, Coady, D., Parry, I., Sears, L. and Shang, B., ‘How large are global energy subsi-dies?’, IMF Working Paper, WP/15/105, May 2015.
[Ire 2015] IRENA, ‘Renewable energy prospects: United Arab Emirates’, REmap 2030 analysis, March 2015.
[Ire 2016] IRENA, ‘Renewable energy and jobs’, Annual Review, 2016.
[Ire 2016a] IRENA, IRENA Quarterly, Q3 2016, Letting in the Light.
[Ire 2016b] IRENA, Renewable capacity statistics, 2016.
[Ire 2016c] IRENA/ADFE, 17 January 2016, http://adfd.irena.org/contentimages/Cape %20Verde %20summary.pdf
[Jäg 2013] Jäger-Waldau, A., PV status report 2013, Publications Office of the Eu-ropean Union, 2013, ISBN 978-92-79-32718-6 (pdf)
[Jäg 2014] Jäger-Waldau, A., ‘European photo-voltaic market contracts in a rapid expanding global market’, European energy innovation, Autumn 2014, pp. 52- 56.
[Jäg 2014a] Jäger-Waldau, A., PV status report 2014, Publications Office of the Eu-ropean Union, 2014, ISBN 978-92-79-44621-4 (pdf)
[Jas 2014] JA Solar, Press Release, 22 January 2014 http://investors.jasolar.com/phoenix.zhtml?c=208005&p=irol-newsAr-ticle&ID=1892516&highlight=
[Jet 2016] Jet Contractors, Press Release, 23 May 2016, Partenariat tripartite Jet Contractors — Haeron Solar — SIE.
[Jin 2014] Jinko Solar, Press Release, 11 August 2014

81
http://www.jinkosolar.com/press_detail_969.html
[JvG 2014] JvG Thoma, Press Release, 18 February 2014, http://www.jvg-thoma.de/en/start/news/!/page/2/
[Kaz 2011] Kaz Silicon, Project file, http://www.kazsilicon.kz/en/node/16
[Kaz 2014] Kazatomprom, News: Astana Solar will discuss the construction of solar power stations, 12 September 2014, http://kazatomprom.kz/en/#!/article/3091
[KfW 2013] Kreditanstalt für Wiederaufbau, KfW-Programm Erneuerbare Ener-gien ‘Speicher’, Programmnummer 275 (Version 1)
[KfW 2016] Kreditanstalt für Wiederaufbau, KfW-Programm Erneuerbare Ener-gien ‘Speicher’, Programmnummer 275 (Version 2) https://www.kfw.de/inlandsfoerderung/Unternehmen/Energie-Um-welt/F%C3%B6rderprodukte/Erneuerbare-Energien-%E2%80%93-Speicher-%28275%29/#2
[MEE 2016] Ministre de l’Environnement, de l’Énergie et de la Mer, Les objectifs pour le développement des énergies renouvelables, 25 April 2016, http://www.developpement-durable.gouv.fr/IMG/pdf/2016-04-25_Obj-_Dvp-_Energies_Renouvelables.pdf
[MEM 2012] Ministry of Energy and Minerals Tan-zania, Strategic plan 2011/12-2015/16, November 2012.
[MEM 2013] Ministry of Energy and Minerals Tan-zania, Scaling-up renewable energy programme, April 2013, http://www.mem.go.tz/Portals/0/EasyDNNNewsDocu-ments/1033/0039_08052013-SREP_Tanzania %20IP_Final_Draft.pdf
[MEM 2016] Ministry of Energy and Mineral Re-sources, Indonesia, Regulation No 19 of 2016 on Purchase of power by PLN from solar photovoltaic.
[Mer 2016] Mercom Capital Group, Solar market update, April 2016.
[Mer 2016a] Mercom Capital Group, Market intel-ligence report solar, 20 June 2016.
[Mes 2016] Middle East Solar Industry Associa-tion, Middle East solar outlook for 2016.
[METI 2013] Japanese Ministry of Trade and In-dustry, Agency for Natural Resources and Energy; Announcement regard-ing the present status of introduc-tion of facilities generating renewa-ble energy as of 31 May 2013, http://www.meti.go.jp/english/press/2013/0820_01.html
[METI 2014] Japanese Ministry of Trade and In-dustry, 4th Strategic energy plan, April 2014.
[METI 2016] Japanese Ministry of Trade and In-dustry, Agency for Natural Resources and Energy; Settlement of FY2016 purchase prices and FY2016 sur-charge rates under the feed-in tariff scheme for renewable energy, March 2016.
[METI 2016a] Japanese METI, General Energy and Natural Resources Investigation Committee and Renewable Energy Support System Reform Committee, 1 April 2016 meeting material: http://www.meti.go.jp/committee/sougouener-gy/kihonseisaku/saisei_kanou/008_haifu.html.
[MII 2012] Ministry of Industry and Information Technology,
太阳能光伏产业“十二五”发展规划 (issuance of the solar photovoltaic industry, ‘second five’ development plan), 24 February 2012, http://www.miit.gov.cn/n11293472/n11293832/n12771663/14473764.html
[MME 2015] Ministério de Minas e Energia, Secre-taria de Planejamento e Desenvol-vimento Energético, Plano decenal de expansão de energia 2024, De-zembro 2015.
[MoE 2015] Ministry of Energy Thailand, Alterna-tive energy development plan: AEDP 2015.
[Moo 2016] Moody’s, 14 March 2016, Spanish electricity system heads toward sus-tainability, as electricity tariff deficit debt falls.
[Mos 2015] Moshövel, J., Kairies, K.-P., Magnor, D., Leuthold, M., Bost, M., Gährs, S., Szczechowicz, E., Cramer, M. and Sauer, D. U., ’Analysis of the maxi-mal possible grid relief from PV-peak-power impacts by using stora-ge systems for increased self-consumption’, Applied Energy, Vol. 137, 1 January 2015, pp. 567-575

82
[Mot 2014] Motech, Press Release, 26 December 2014, Motech and Topcell an-nounced the signing of merger agreement.
[Mot 2015] Motech, Press Release, 25 September 2015, Motech (Su-zhou) Renewable Energy Co., Ltd and Jiansu Aide Solar Energy Technology Co., Ltd reach a strategic coopera-tion and capital increase agreement.
[Mub 2016] Mubadala, Press Release, 27 June 2016, DEWA announces the selected bidder for the 800 MW third phase of the Mohammed bin Rashid Al Maktoum Solar Park.
[Nat 2016] The National, Marubeni-Jinko submit world-record low bid for 350 MW Sweihan solar project in Abu Dhabi, 20 September 2016.
[Nat 2016a] The National, UAE eyes new clean energy generation target by 2030, 20 January 2016.
[NER 2016] Nigerian Energy Regulatory Commis-sion, Press Briefing on Reversal of Existing Electricity Tariff Regime, 14 July 2016.
[Oci 2016] OCI, Press Release, 28 September 2016, OCI will acquire new shares of Tokuyama’s Malaysian subsidiary for polysilicon production.
[Ofg 2015] Ofgem, Guidance, 13 April 2015, Renewables Obligation: closure of the scheme to large-scale solar PV.
[One 2015] Office National de l’Electricité et de l’Eau Potable (ONEE), Branche Elec-tricité, 18 February 2015, Pro-gramme solaire photovoltaïque de 400 MWc de l’Office national de l’électricité et de l’eau potable — Branche Electricité.
[Osi 2016] Osinergmin, Press Release, 16 February 2016, Otorgan buena pro a 13 proyectos de energía reno-vable.
[Pho 2012] Photon International, March 2012.
[PMV 2016] Prime Minister of Viet Nam, Decision No 428/QĐ-TTG dated 18 March 2016, The approval of revisions to the national power development plan from 2011 to 2020 with visions extended to 2030.
[Pow 2014] Powerway, Press Release, 13 March 2014 http://www.pvpowerway.com/news/1075.html
[Pow 2015] Powell, D. M., Fu, R., Horowitz, K., Basore, P. A., Woodhouse, M. and
Buonassisi, T., ‘The capital intensity of photovoltaics manufacturing: bar-rier to scale and opportunity for in-novation’, Energy and Environmental Science, Vol. 8, 2015, p. 3395.
[Pvi 2016] PVinsights, September 2016, http://pvinsights.com/SolarSystem/SolarSystemPrice.php
[Pvn 2015] PV News, published by The Prome-theus Institute, ISSN 0739-4829 (until 2015).
[Pvt 2014] pv-tech, 24 February 2014 http://www.pv-tech.org/news/nigerias_first_module_plant_operational
[Rea 2016] REA, 31 March 2016, Construction of a 55 MW solar power plant in Garis-sa, http://www.rea.co.ke/index.php?option=com_content&view=category&layout=blog&id=89&Itemid=511
[RoG 2011] Parliament of Ghana, Renewable energy bill, http://www.parliament.gh/assets/file/Bills/Renewable %20Energy %20Bill %202011.pdf
[RoI 2014] Regulation of the Government of the Republic of Indonesia, No 79/2014 concerning The National Energy Poli-cy.
[RoK 2009] Law of the Republic of Kazakhstan, from 4 July 2009 of No 165-IV ZRK, about support of usage of renewa-ble energy sources, http://cis-legisla-tion.com/document.fwx?rgn=28433
[RoP 2016] Republic of the Philippines, DoE, Awarded solar projects as of June 30, 2016.
[Ros 2016] Roselund, C., pv magazine 04/2016, 2015 Poly and wafer rankings.
[Rte 2016] RTE Réseau de transport d’électricité, 2016, Annual Electricity Report 2015 edition, http://www.rte-france.com/sites/default/files/2015_annual_electricity_report.pdf
[RVO 2016] Rijksdienst voor Ondernemend Ne-derland, Stimulering duurzame energieproductie (SDE+), (http://www.rvo.nl/)
[Sea 2014] Sustainable Energy Association of Singapore, A case for sustainability: Accelerating the case for renewable energy in Singapore, 20 January 2014.

83
[Sed 2016] Sustainable Energy Development Authority, SEDA Portal accessed on 2 September 2016.
[Sin 2014] Singulus, Press Release, 3 February 2014 http://www.singulus.com/en/press-news/press-releases/press-release/article/a-long-standing-cooperation-partner-of-singulus-technologies-ptip-officially-launces-its-cigs-phot/7.html
[Sma 2014] SMA Solar Technology AG, Press Release, 5 August 2014, http://www.sma.de/en/newsroom/current-news/news-details/news/5288-suedafrika-lokale-produktion-von-sma-zentral-wechselrichtern-gestartet-und-zweites-megawatt-ph.html
[Sol 2013] Solarbuzz, Marketbuzz 2013, Press Release, 11 March 2013.
[Sol 2016] Solar Power Europe, Global market outlook for solar power 2016-2020, June 2016.
[Sol 2016a] Solar Power Europe, Solar market report, 2016 Edition.
[Sol 2016b] Solar Choice, PV price index http://www.solarchoice.net.au
[Ste 2013] Société Tunisienne de l’Electricité et du Gaz, Prosol Elec, 2013.
[Sys 2016] Systèmes Solaires, le journal du photovoltaique, Photovoltaic energy barometer, ISSN 0295-5873.
[Tai 2016] Taiyang News, 18 July 2016, PV additions Chile June 2016, South America’s largest PV market reaches 1 267 MW total solar power by end of H1/2016 http://taiyangnews.info/markets/pv-additions-chile-june-2016/
[Tal 2015] Talesun Energy, Press Release, 2 December 2015, Talesun begins production in Thailand.
[Tep 2016] Tokyo Electric Power Company (TEPCO), Customer communication, rate calculation, http://www.tepco.co.jp/en/customer/guide/ratecalc-e.html
[Ter 2016] TERNA, Rapporto mensile sul siste-ma elettrico, Consuntivo Giulio 2016.
[Tri 2016] Trina Solar, Press Release, 23 February 2016, Trina Solar ac-quires a solar cell factory in the Netherlands.
[Uec 2013] Ueckerdt, F., Hirth, L., Luderer, G. and Edenhofer, O., System LCOE: What are the costs of variable renewa-bles? Social Science Research Net-work, SSRN-id2200572, 14 January 2013, http://papers.ssrn.com/sol3/papers.cfm?abstract_id=2200572
[UNEP 2008] Reforming energy subsidies — op-portunities to contribute to the cli-mate change agenda United Nations, United Nations Environment Pro-gramme, 2008.
[UNFC 2016] United Nations Framework Conven-tion on Climate Change, 5 October 2016, Paris Agreement — status of ratification, http://unfccc.int/paris_agreement/items/9444.php
[Ven 2013] Ventures Africa, Ethiopia Awards 300 MW solar contract to US firms, 25 November 2013, http://www.ventures-africa.com/2013/11/ethiopia-awards-300mw-solar-contract-to-us-firms/
[Wac 2016] Wacker AG, Press release, 18 April 2016, Wacker officially opens new production site in the USA.
[Wan 2016] Wang, L., Economic Information Dai-
ly, 29 January 2016, ‘十三五”可再
生能源五年新投2.3万亿
[Wes 2015] Wesoff, E., Greentech Media, 1 December 2015, The mercifully short list of fallen solar companies — 2015 edition http://www.greentechmedia.com/articles/read/The-Mercifully-Short-List-of-Fallen-Solar-Companies-2015-Edition

84
European Commission
EUR 28159 EN – Joint Research Centre – Directorate C: Energy Transport and Climate
Title: PV Status Report 2016
Author(s): Arnulf Jäger-Waldau
Luxembourg: Office for Official Publications of the European Communities
2016 – 84 pp. – 21 x 29.7 cm
EUR – Scientific analysis or review
ISSN 1018-5593 (print) ISSN 1831-9424 (online)
ISBN 978-92-79-63054-5 (print) ISBN 978-92-79-63055-2 (PDF)
Abstract
PV is a solar-power technology for generating electricity using semiconductor devices known as so-
lar cells. A number of solar cells form a solar ‘module’ or ‘panel’, which can then be combined to
form solar power systems, ranging from a few watts of electricity output to multi-megawatt power
stations.
The unique format of the PV Status Report combines up-to-date international information on PV.
These data are collected on a regular basis from public and commercial studies and cross-checked
with personal communications. Regular fact-finding missions involving company visits, as well as
meetings with officials from funding organisations and policymakers, complete the picture.
Growth in the solar PV sector has been robust. The CAGR over the last 15 years was over 40 %,
thus making PV one of the fastest growing industries at present. The PV Status Report provides
comprehensive and relevant information on this dynamic sector for the interested public, as well as
decision-makers in policy and industry.

Europe Direct is a service to help you find answers to your questions about the European Union
Free phone number (*): 00 800 6 7 8 9 10 11
(*) Certain mobile telephone operators do not allow access to 00 800 numbers or these calls may be billed.
A great deal of additional information on the European Union is available on the Internet.
It can be accessed through the Europa server http://europa.eu
How to obtain EU publications
Our publications are available from EU Bookshop (http://bookshop.europa.eu),
where you can place an order with the sales agent of your choice.
The Publications Office has a worldwide network of sales agents.
You can obtain their contact details by sending a fax to (352) 29 29-42758.

XX-N
A-x
xxxx-E
N-N
doi:10.2790/682995
ISBN 978-92-79-63055-2
LD
-NA-2
8159-E
N-N