Embed Size (px)
Citation preview
PV Tracking System Dual-Axis
B.SC Graduation Project 2014
PV Tracking System I
Essam
Refaat
Abdellah
Sherkawy
Basma
Ahmed
Aia
Khalil
Mustafa
Mahmoud
Ahmed
Mohammed
Marwa
Abd-ElHay
Omar
Mohammed
Amr
Ali
Mohammed
Abd-ElRady
Team Work

II
Acknowledgment
We would like to express our deepest appreciation
and gratitude to all those who provided us the
possibility to complete this project. A special
gratitude we give to our final year project managers,
Dr. Abd Elmo’men Mohamed
Dr. Shazly Abdu
whose contribution in stimulating suggestions and
encouragement helped us to coordinate our project
at this nice shape.
Furthermore we would also like to acknowledge with
much appreciation the crucial role of all the staff of
our college, qena Faculty of Engineering, who gave
the permission to use all required equipment and the
necessary materials to complete our project
Subscripted by Project Team Work

PV Tracking System III
to our DEAR
homeLAND EGYPT, our
dear parents,
specially our
precious mothers
and our families.
IV
Abstract
Chapter 1 The original idea for writing this project came after a number
of review papers were published in conference and the journals. The
purpose of this project is to give explanations the photovoltaic tracking
system mechanism and application of solar system processes.
This project can be used to design PV tracking system and inverter to
operate alone with battery banks in order to supply ac load in remote
area which the utility grid cannot reach for this load.The material
presented in this project covers a large variety of technologies for
conversion of solar energy to provide electricity.
In the introductory chapter, the project provides a review of energy-
related environmental problems and the state of climate. It also gives a
short historical introduction to solar energy, giving some details of the
early applications.
Chapter 2 gives overview of solar energy and photovoltaics.The
photovoltaic effect refers to photons of light exciting electrons in to a
higher state of energy. Allowing them to acts as charge carriers for an
electric current. Solar cells produce direct current electricity from
sunlight which can be used to power equipment or to recharge a battery
Chapter 3 present development of an automatic solar tracking system
whereby the system will caused solar panels will keep aligned with the
sunlight it order to maximize in harvesting solar power. The system
focuses on the controller design whereby it will caused the system is able
to tracks the maximum intensity of sunlight is hit.
Chapter 4 gives general review to the inverter and its types, how the
inverter works, the components of the inverter circuit, practical power
and control circuit for inverter, and how can we use for our project (PV
tracking system and inverter).
Chapter 5 gives the fundamental of batteries technology and charger
control strategies commonly used in stand-alone photovoltaic (PV)
system. Details are provided about the common types of flooded lead
acid, valve regulated lead acid (VRLA), including their design and
constructions. Daily operational profiles are presented for different
types of battery charger controllers, providing an in-depth look at how
these controllers regulate and limit battery overcharging in PV system.
Chapter 6 the results of our project
PV Tracking System V
TABLE OF CONTENTS
CHAPTER 1
INTRODUCTION
1.1 General introduction to nonrenewable & renewable energy technologies ............ 2
1.1.1 A non-renewable resource ....................................................................................... 2
1.1.2 Renewable energy .................................................................................................... 2
1.2 Power generation. ............................................................................................................ 3
1.3 Types of renewable energy ............................................................................................. 3
1.3.1 Solar photovoltaic cells (PV) ..................................................................................... 5
1.3.2 Thermal or solar renewable energy ......................................................................... 7
1.3.3 Hydropower ................................................................................................................ 8
1.3.4 Wind power ............................................................................................................... 10
1.3.5 Biomass ...................................................................................................................... 12
1.3.6 Geothermal energy ................................................................................................. 14
1.3.7 Ocean energy .......................................................................................................... 17
1.2 The Advantages and Disadvantages of Renewable Energy .................................... 19
CHAPTER 2
SOLAR ENERGY 2.1 Introduction ...................................................................................................................... 22
2.2 Solar Photovoltaic ........................................................................................................... 25
2.3 Photovoltaic Modeling ................................................................................................... 26
2.3.1 Series Resistance ................................................................................................... 27
2.3.2 Shunt Resistance ........................................................................................................ 27
2.3.3 Ideality Factor ............................................................................................................ 28
2.3.4 Characteristic equation ................................................................................................. 28
2.3.5 What is Maximum Power Point Tracking? ..................................................................... 29
2.3.6 Efficiency...................................................................................................................... 30
2.4 Effect of Solar Irradiance, Temperature on PV: ........................................................... 31
2.4.1 Effect of Solar Irradiance on PV .................................................................................... 31
VI
2.4.2 Effect of Temperature on PV ....................................................................................... 31
2.5 Components of PV system ............................................................................................. 32
2.6 Photovoltaic system types.............................................................................................. 35
2.6.1 Stand-alone systems ..................................................................................................... 35
2.6.2 Grid-connected systems ............................................................................................... 36
2.6.3 Hybrid systems ............................................................................................................ 36
2.7 Advantages and Disadvantages of Solar Energy ....................................................... 38
2.7.1Advantages of Solar Energy:- ......................................................................................... 38
2.7.2 Disadvantages of Solar Energy:- .................................................................................... 39
2.8 Applications of solar Energy .......................................................................................... 40
CHAPTER 3
TRACKING SYSTEM
3.1 Introduction ........................................................................................................................ 48
3.2 Basic Concept ................................................................................................................. 49
3.3 Tracking system and PV panel efficiency .................................................................... 51
3.4 Types of trackers .............................................................................................................. 52
3.4.1 Single axis trackers ................................................................................................... 52
3.4.1.1Horizontal single axis tracker (HSAT) ................................................................. 52
3.4.1.2 Vertical single axis tracker (VSAT) .................................................................... 54
3.4.1.3 Tilted single axis tracker (TSAT) ......................................................................... 54
3.4.1.4 Polar aligned single axis trackers (PASAT) ...................................................... 55
3.4.2 Dual axis trackers ...................................................................................................... 55
3.4.2.1 Tip–tilt dual axis tracker (TTDAT) ........................................................................... 55
3.4.2.2 Azimuth-altitude dual axis tracker (AADAT) ................................................... 57
3.5 Tracker type selection .................................................................................................... 57
3.6 Solar Tracking ................................................................................................................... 58
3.6.1 Tracking Mechanical System .................................................................................. 59
3.6.2 Tracking Control System .......................................................................................... 60
3.6.3 Controller ................................................................................................................... 62
3.6.4 Linear Actuator ......................................................................................................... 62
3.6.5 Methodology ............................................................................................................ 63
3.6.6 Arduino programe ................................................................................................... 65
3.7 Disadvantages................................................................................................................. 66
PV Tracking System VII
CHAPTER 4
SINGLE PHASE PULSE WIDTH
MODULATED INVERTERS
4.1 Introduction ...................................................................................................................... 68
4.2 Types of inverters ............................................................................................................. 69
4.2.1 Types of inverters according to input: ................................................................... 69
4.2.2 Types of inverter according to wave shape of ac output: ................................. 71
4.3 Principle of operation of single-phase inverter (VSI): .................................................. 73
4.4 Overview of Power Semiconductor switches used: .................................................... 75
4.5 Control strategy ............................................................................................................... 79
4.5.1 Analog Method: ....................................................................................................... 79
4.5.2 Digital Methods ........................................................................................................ 81
4.6 Simulation results of Digital Methods ............................................................................. 84
4.7 Inverter using lm555: ........................................................................................................ 86
4.8 Applications ..................................................................................................................... 86
CHAPTER 5
BATTERY AND CHARGER
CONTROLLER
5.1 Introduction ...................................................................................................................... 90
5.2 Storage in PV Systems ..................................................................................................... 90
5.3 Battery Design and Construction: ................................................................................. 91
5.4 Battery Types and Classifications .................................................................................. 93
5.4.1 Primary Batteries ....................................................................................................... 94
5.4.2 Secondary Batteries ................................................................................................. 94
5.5 Battery Charger ............................................................................................................... 97
5.5.1 Overcharge Protection ........................................................................................... 98
5.5.2 Over discharge Protection ...................................................................................... 99
5.6 Charge Controller Terminology and Definitions ........................................................ 100
5.7 Buck converter .............................................................................................................. 103
VIII
5.8 Boost Converter ............................................................................................................. 104
5.9 Buck-Boost converter .................................................................................................... 106
5.11 System Design .............................................................................................................. 107
CHAPTER 6
SIMULATION AND PRACTICAL
RESULTS
6.1 control circuit for tracking system ............................................................................... 110
6.1.1 Simulation ................................................................................................................ 110
6.1.2 Practical circuit (control circuit using DC drive L298) ........................................ 110
6.1.3 Control circuit using transistor and relays ............................................................ 111
Comment ............................................................................................................................. 111
6.1.4 PCB circuit ................................................................................................................... 111
6.2 Tracking system (practical) .......................................................................................... 112
6.2.1 Single axis PV TRACKING ....................................................................................... 112
6.2.2 Dual axis PV tracking ............................................................................................. 112
6.3 comparison between fixed and tracking solar panel .............................................. 113
6.3.1 Fixed solar panel..................................................................................................... 113
6.3.2 Single axis tracking solar panel ............................................................................. 116
6.3.3 Dual axis tracking solar panel ............................................................................... 119
6.3.4 Dual axis with cooling system ............................................................................... 122
6.4 power VS time for fixed and tracking system ............................................................ 125
Comments ........................................................................................................................ 126
6.5 inverter using LM555 .................................................................................................. 126
6.5.1 Simulation result ...................................................................................................... 126
6.5.2 PCB circuit ................................................................................................................... 127
6.5.3 Practical circuit and result ........................................................................................ 127
Conclusion………...………………………………………………………………………………..130
Appendix………...………………………………………………………………………………….132
References…..……………………………………………………………………………………...136
PV Tracking System IX
List of figures
Chapter 1
Fig (1.1) Total world energy consumption by source…………………………..……..…4
Fig (1.2) Photovoltaic sunshade 'SUDI' is an autonomous and mobile station that
replenishes energy for electric vehicles using solar energy………………….……...…7
Fig (1.3) the solar energy……………………...…………………………………….…….8
Fig (1.4) wind energy………………………………………………………………………12
Fig(1.5) Cogeneration station in Metz (France), using waste wood biomass from the
surrounding forests as renewable energy source………………………………….…...14
Fig (1.6) the Nesjavellir Geothermal Power Plan……………………………………….15
Fig.1.7Worldwide production of geothermal electricity…………………………………16
Fig (1.8) wave energy…………………………………………………………………...…18
Fig (1.9) Tidal energy…………………………………………………..……….………….18
Fig (1.10) ocean thermal energy……………………………………………………….…19
Chapter 2
Fig (2.1) nuclear fusion in sun……………………………………….……………………22
Fig (2.2) solar energy of the sun…………………………………….……………………23
Fig (2.3) Irradiated daily energy values over a 12 month period.……………………..24
Fig (2.4) Egypt has excellent Solar Resources…………………………………………25
Fig (2.5) Photovoltaic cell operation………………….................................................26
Fig (2.6) solar cell representation……………………….……………..…………………27
Fig. (2.7) the max power point tracking………………………………………….……….30
Fig (2.8a-2.8b) effect radiation of solar…………………………………………………..32
Fig (2.9a) effect of temperature on current & voltage of PV…………………………...32
X
Fig (2.9b) effect of temperature on power &voltage of PV…………………................33
Fig(2.10)Photovoltaic cells, modules, panels and arrays………………………………34
Fig (2.11) Components of PV system……………………………………………………35
Fig (2.12) Schematic representation of (a) a simple DC PV system to power a water
pump with no energy storage, (b) a complex PV system including batteries, power
conditioners, and both DC and AC
loads…………………………………………………………….…………………………..36
Fig (2.13) A grid-connected PV system…………………….…………………..……….37
Fig (2.14) a hybrid system. …………………………………………………………..…..37
Fig(2.15) PV Solar Cell………………………………………………………………..…..40
Fig(2.16) Solar Thermal………………………………………………………………...…41
Fig (2.17) Black metal absorber plate……………….……………………………..…….42
Fig (2.18) Solar …………………………………………………………….……..………..43
Fig (2.19) Solar Crop Dryers Stills……………….……………………………..………...44
Fig (2.20) Electrical generation………….………………………………….…………….45
Chapter 3
Fig (3.1) the effective collection area of a flat-panel solar collector varies with the
cosine of the misalignment of the panel with the Sun.………………………………...50
Fig (3.2) power vs Day Time curve …………………..………………………………….51
Fig (3.3) Horizontal single axis tracker in California …………………………………...53
Fig (3.4) linear horizontal axis tracker in South Korea …………………………………53
Fig (3.5) single axis trackers with roughly 20 degree tilted ……………………………54
Fig (3.6) Azimuth-altitude dual axis tracker – 2 axis solar tracker, Toledo, Spain ….56
Fig (3.7) Tracking system …………………………………………………………………58
Fig (3.8) Tracker …………………………………………………………………………...59
Fig (3.9) Tracking Control System………………………………………………………..60
Fig (3.10) LDR sensor …………………………………………………………………….61
Fig (3.11) Arduino unit …………………………………………………………………….62
Fig (3.12) DC geared motor……………………………………………………………….63
Fig (3.13) two light sensor are separated by divider……………………………………64
PV Tracking System XI
Fig (3.14) controlling circuit…………………………………………………...…………..64
Chapter 4
Fig (4.1) dc-ac converter ….………………………………………………………………68
Fig (4.2) sin and modified sin waves…………………………………………………….70
Fig (4.3) square wave of single-phase inverter…………………………………………72
Fig (4.4) single phase half bridge inverter……………………………………………....72
Fig (4.5) Output voltage of half wave bridge inverter…………………………………..73
Fig (4.6) single-phase full bridge inverter………………………………………………..74
Fig (4.7) thyristor and its VI characteristic……………………………………………….76
Fig (4.8) the characteristic and symbol of transistor……………….…………………...77
Fig (4.9) mosfet symbol……………………………………………………………………77
Fig (4.10) IGBT symbol…………………………………………………………………….78
Fig (4.11) Sine-Triangle Comparison…………………………………………………….80
Fig (4.12) Switching Pulses after comparison…………………………………………..81
Fig (4.13) multi-vibrator IC…………………………………………………………………82
Fig (4.14) LM555 IC………………………………………………………………………..83
Fig (4.15) states of multi-vibrator…………………………………………………………83
Fig (4.16) multi-vibrator simulation……………………………………………………….84
Fig (4.17) multi-vibrator simulation output………………………………….……………84
Fig (4.18) timer circuit……………………………………………………………….……..85
Fig (4.19) output of timer…………………………………………………………………..85
Chapter 5
Fig (5.1) battery design and construction………………………………………………..93
Fig (5.2) buck converter………………………………………………………………….103
Fig (5.3) Modes of operation of buck converter………………………………............104
Fig (5.4) Boost converter…………………………………………………………………105
Fig (5.5) modes of operation of boost converter………………………………...........105
Fig (5.6) Buck-Boost converter………………………………………………………….106
XII
Fig (5.7) Modes of operation of buck-boost converter………………………………..107
Fig (5.8) charge controller design……………………………………………………….108
Chapter 6
Fig (6.1) control circuit for tracking system…………………………………………….110
Fig (6.2) practical circuit (control circuit using DC drive L298) …………………..….110
Fig (6.3) control circuit using transistors and relays ……………………..…………...111
Fig (6.4) pcpcircuit ………………………………………………………………….……111
Fig (6.5) single axis pv tracking …………………………………………………………112
Fig. (6.6) Dual axis pvtracking ……………………………………………...................112
Fixed solar panel
Fig (6.7a) V-I curve at 11 am ……………………………………………………………113
Fig (6.7.b) V-P curve at 11 am………………………………………………….............113
Fig (6.8.a) V-I curve at 12 pm …………………………………...................................114
Fig (6.8.b) V-P curve at 12 pm ………………………………………………………….114
Fig (6.9.a) V-I curve at 1 pm ……………………………………………………………114
Fig (6.9.b) V-P curve at 1 pm …………………………………………………………...114
Fig (6.10.a) V-I curve at 2 pm………………………………………………..……….…115
Fig (6.10.b) V-P curve at 2 pm…………………………………...……………….……..115
Fig (6.11.a) V-I curve at 3 pm …………………………………………………………..115
Fig (6.11.b) V-P curve at 3 pm………………………………………………….……….115
Fig (6.12) T-P curve ……………………………………………….……………………..116
Single axis tracking solar panel
Fig (6.13.a) V-I curve at 11 am ………………………………………………………...116
Fig (6.13.b) V-P curve at 11 am…………………………………………………….…...116
PV Tracking System XIII
Fig (6.14.a) V-I curve at 12 pm …………………………………………………………117
Fig (6.14.b) V-P curve at 12 pm ………………………………………………………...117
Fig (6.15.a) V-I curve at 1 pm …………………………………………………………..117
Fig (6.15.b) V-P curve at 1 pm ………………………………………………………....117
Fig (6.16.a) V-I curve at 2 pm……………………………………………….………..…118
Fig (6.16.b) V-P curve at 2 pm………………………………..……………..…………..118
Fig (6.17.a) V-I curve at 3 pm ………………………………………………….……….118
Fig (6.17.b) V-P curve at 3 pm………………………………………….……………….118
Fig (6.18) T-P curve …………………………………………….………………………..119
Dual axis tracking solar panel
Fig (6.19.a) V-I curve at 11 am …………………………………………………………119
Fig (6.19.b) V-P curve at 11 am…………………………………………………………119
Fig (6.20.a) V-I curve at 12 pm …………………………………………………………120
Fig (6.20.b) V-P curve at 12 pm ………………………………………………………...120
Fig (6.21.a) V-I curve at 1 pm …………………………………………………………..120
Fig (6.21.b) V-P curve at 1 pm ………………………………………………………….120
Fig (6.22.a) V-I curve at 2 pm……………………………………………………………121
Fig (6.22.b) V-P curve at 2 pm………………………………………………........…….121
Fig (6.23.a) V-I curve at 3 pm …………………………………………………………..121
Fig (6.23.b) V-P curve at 3 pm…………………………………………………………..121
Fig (6.24) T-P curve ……………………………………………………………………...122
Dual axis with cooling system
Fig (6.25.a) V-I curve at 11 am …………………..……………………………………..122
Fig (6.25.b) V-P curve at 11 am…………………………………………………………122
XIV
Fig (6.26.a) V-I curve at 12 pm …………………………………………………………123
Fig (6.26.b) V-P curve at 12 pm ………………………………………………………..123
Fig (6.27.a) V-I curve at 1 pm …………………………………………………………..123
Fig (6.27.b) V-P curve at 1 pm ………………………………………………………….123
Fig (6.28.a) V-I curve at 2 pm…………………………………….…………………......124
Fig (6.28.b) V-P curve at 2 pm…………………………………………………………..124
Fig (6.29.a) V-I curve at 3 pm …………………………………………………………..124
Fig (6.29.b) V-P curve at 3 pm…………………………………………………………..124
Fig (6.30) T-P curve ……………………………………………………………………...125
Fig (6.31) T-P curve for fixed and tracking……………………………………………..126
Fig (6.32) simulation result for lm555 …………………………………………………..126
Fig (6.33) output of lm555 timer ………………………………………………………...127
Fig (6.34) pcb for inverter………………………………………………………………...127
Fig (6.35a-35b) practical circuit and result ……………………………………….……128

PV Tracking System XV


Chapter 1
Introduction
2
CHAPTER 1
INTRODUCTION 1.1 GENERAL INTRODUCTION TO NONRENEWABLE & RENEWABLE
ENERGY TECHNOLOGIES
1.1.1 A NON-RENEWABLE RESOURCE
A non – renewable resource (also known as a finite resource) is a resource that does not
renew itself at a sufficient rate for sustainable economic extraction in meaningful human time-
frames. An example is carbon-based, organically-derived fuel. The original organic material,
with the aid of heat and pressure, becomes a fuel such as oil or gas. Fossil fuels (such
as coal, petroleum, and natural gas), and certain aquifers are all non-renewable resources.
Metal ores are other examples of non-renewable resources. The metals themselves are
present in vast amounts in the earth's crust, and are continually concentrated and replenished
over millions of years. However their extraction by humans only occurs where they are
concentrated by natural processes (such as heat, pressure, organic activity, weathering and
other processes) enough to become economically viable to extract. These processes
generally take from tens of thousands to millions of years. As such, localized deposits of
metal ores near the surface which can be extracted economically by humans are non-
renewable in human timeframes, but on a world scale, metal ores as a whole are
inexhaustible, because the amount vastly exceeds human demand, on all timeframes.
Though they are technically non-renewable, just like with rocks and sand, humans could
never deplete the world's supply. In this respect, metal ores are considered vastly greater in
supply to fossil fuels because metal ores are formed by crustal scale processes which make
up a much larger portion of the earth's near-surface environment than those that form fossil
fuels, which are limited to areas where carbon-based life forms flourish, die, and are quickly
buried. These fossil fuel-forming environments occurred extensively in the Carboniferous
Period.
1.1.2 RENEWABLE ENERGY
Renewable energy is generally defined as energy that comes from resources which are
naturally replenished on a human timescale such
as sunlight, wind, rain, tides, waves and geothermal heat. Renewable energy replaces
conventional fuels in four distinct areas: electricity generation, hot water/space heating, motor
fuels, and rural (off-grid) energy services.
PV Tracking System 3
About 16% of global final energy consumption presently comes from renewable resources,
with 10% of all energy from traditional biomass, mainly used for heating, and 3.4%
from hydroelectricity. New renewables (small hydro, modern biomass, wind, solar,
geothermal, and biofuels) account for another 3% and are growing rapidly. At the national
level, at least 30 nations around the world already have renewable energy contributing more
than 20% of energy supply. National renewable energy markets are projected to continue to
grow strongly in the coming decade and beyond. Wind power, for example, is growing at the
rate of 30% annually, with a worldwide installed capacity of 282,482 megawatts (MW) at the
end of 2012.
Renewable energy resources exist over wide geographical areas, in contrast to other energy
sources, which are concentrated in a limited number of countries. Rapid deployment of
renewable energy and energy efficiency is resulting in significant energy security, climate
change mitigation, and economic benefits. In international public opinion surveys there is
strong support for promoting renewable sources such as solar power and wind power.
While many renewable energy projects are large-scale, renewable technologies are also
suited to rural and remote areas and developing countries, where energy is often crucial
in human development. United Nations' Secretary-General Ban Ki-moon has said that
renewable energy has the ability to lift the poorest nations to new levels of prosperity.
1.2 POWER GENERATION .
Renewable energy provides 19% of electricity generation worldwide. As electricity demands
are increasing day by day causing unbalance in the present grid system which results in
various causes like load shedding, unbalance voltage and power quality etc. which ultimately
affects the consumers. Now to avoid all such situations the only option is to meet the demand
by increasing generation but, we are also lagging with the conventional sources so generating
more power is also not convenient by conventional ways. Therefore, recent researches are
interested in renewable energy system integrated with smart grid through advanced power
electronic converters.
Smart gird with renewable energy sources have been regarded as the most promising means
to solve the power quality, energy and environmental issues we face nowadays.
1.3 TYPES OF RENEWABLE ENERGY
Renewable energy is energy which comes from natural resources such as sunlight, wind,
rain, tides, and geothermal heat, which are renewable naturally replenished.
Chapter 1
Introduction
4
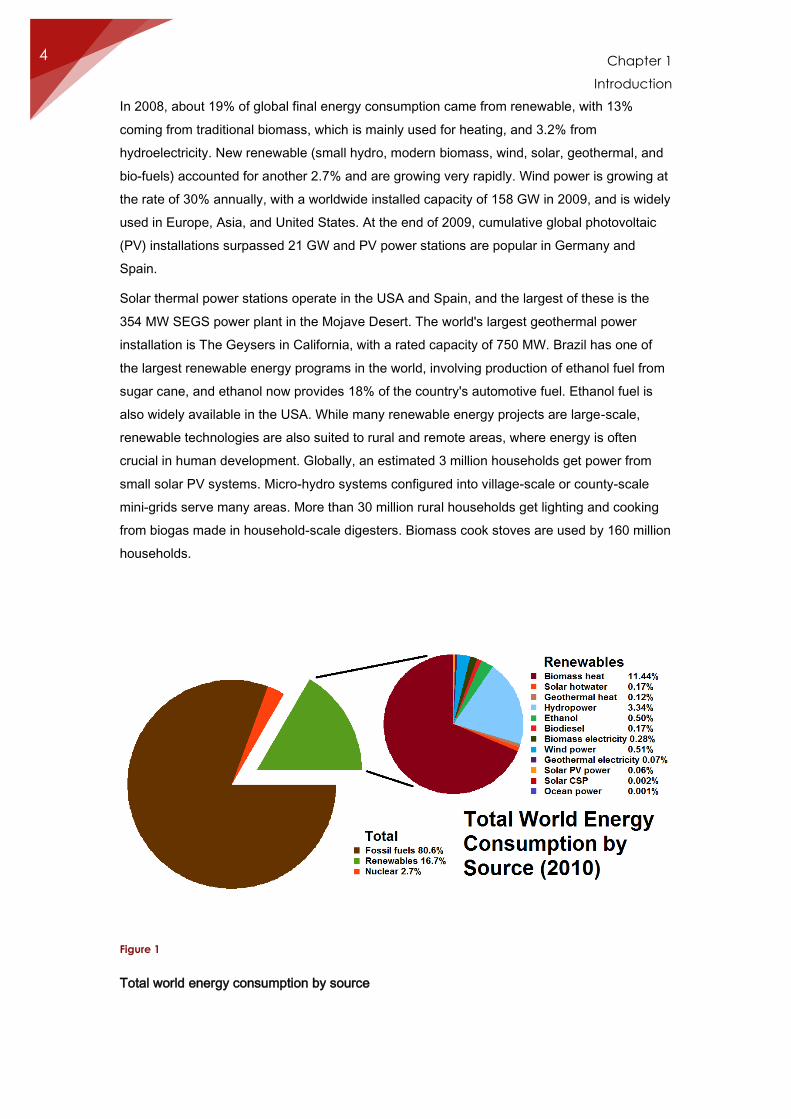
In 2008, about 19% of global final energy consumption came from renewable, with 13%
coming from traditional biomass, which is mainly used for heating, and 3.2% from
hydroelectricity. New renewable (small hydro, modern biomass, wind, solar, geothermal, and
bio-fuels) accounted for another 2.7% and are growing very rapidly. Wind power is growing at
the rate of 30% annually, with a worldwide installed capacity of 158 GW in 2009, and is widely
used in Europe, Asia, and United States. At the end of 2009, cumulative global photovoltaic
(PV) installations surpassed 21 GW and PV power stations are popular in Germany and
Spain.
Solar thermal power stations operate in the USA and Spain, and the largest of these is the
354 MW SEGS power plant in the Mojave Desert. The world's largest geothermal power
installation is The Geysers in California, with a rated capacity of 750 MW. Brazil has one of
the largest renewable energy programs in the world, involving production of ethanol fuel from
sugar cane, and ethanol now provides 18% of the country's automotive fuel. Ethanol fuel is
also widely available in the USA. While many renewable energy projects are large-scale,
renewable technologies are also suited to rural and remote areas, where energy is often
crucial in human development. Globally, an estimated 3 million households get power from
small solar PV systems. Micro-hydro systems configured into village-scale or county-scale
mini-grids serve many areas. More than 30 million rural households get lighting and cooking
from biogas made in household-scale digesters. Biomass cook stoves are used by 160 million
households.
Figure 1
Total world energy consumption by source
PV Tracking System 5
Renewable energy can be classified into
. Photovoltaic
.Thermal energy
.Hydro power generation energy
.Wind energy
.Biomass
.Geothermal energy
.Ocean and wave energy
1.3.1 SOLAR PHOTOVOLTAIC CELLS (PV)
convert sunlight into electricity and photovoltaic production has been increasing by an
average of more than 20% each year since 2002, making it a fast-growing energy
technology. While wind is often cited as the fastest growing energy source, photovoltaic since
2007 has been increasing at twice the rate of wind — an average of 63.6%/year, due to the
reduction in cost. At the end of 2011 the photovoltaic (PV) capacity world-wide was 67.4 GW,
a 69.8% annual increase.
Many solar photovoltaic power stations have been built, mainly in Europe. As of May 2012,
the largest photovoltaic (PV) power plants in the world are the Agua Caliente Solar
Project (USA, 247 MW), Charanka Solar Park (India, 214 MW), Golmud Solar Park (China,
200 MW), Perovo Solar Park (Ukraine, 100 MW), Sarnia Photovoltaic Power Plant (Canada,
97 MW), Brandenburg-Briest Solarpark (Germany, 91 MW), Solar park Finow
Tower (Germany, 84.7 MW), Montalto di Castro Photovoltaic Power Station (Italy, 84.2 MW),
and the Eggebek Solar Park (Germany, 83.6 MW).
There are also many large plants under construction. The Desert Sunlight Solar Farm is a 550
MW solar power plant under construction in Riverside County, California, that will use thin-film
solar photovoltaic modules made by First Solar. The Topaz Solar Farm is a 550 MW
photovoltaic power plant, being built in San Luis Obispo County, California. The Blythe Solar
Power Project is a 500 MW photovoltaic station under construction in Riverside County,
California. The California Valley Solar Ranch (CVSR) is a 250 MW solar photovoltaic power
plant, which is being built by Sun Power in the Carrizo Plain, northeast of California
Valley. The 230 MW Antelope Valley Solar Ranch is a First Solar photovoltaic project which is
under construction in the Antelope Valley area of the Western Mojave Desert, and due to be
completed in 2013.
Chapter 1
Introduction
6
Many of these plants are integrated with agriculture and some use tracking systems that
follow the sun's daily path across the sky to generate more electricity than fixed-mounted
systems. There are no fuel costs or emissions during operation of the power stations.
However, when it comes to renewable energy systems and PV, it is not just large systems
that matter. Building-integrated photovoltaic or "onsite" PV systems use existing land and
structures and generate power close to where it is consumed.
Benefits of a PV system to the householder
1- Solar PV systems generate electricity once the system has been purchased electricity is
generated from a free resource (the sun).
2- PV electricity is generated without emitting greenhouse gases.
3- PV panels or modules are silent, without any moving parts.
4- PV modules are generally unobtrusively mounted on an existing roof.
5- PV modules can be integrated into the building in the form of windows, walls, roof tiles or
pergolas.
6- PV electricity can supplement or provide all your electrical consumption.
7- PV electricity can be fed into the grid.
The drawbacks of photovoltaic systems
As a developing technology, PV systems have high initial costs and consequently their
economic value is evaluated over many years. Due to the diffuse nature of sunlight and the
current sunlight to electrical energy conversion efficiencies of photovoltaic devices, surface
area requirements for PV array installations are on the order of 8 to12 m2 per kilowatt of
installed peak DC-rated PV array capacity.
PV Tracking System 7
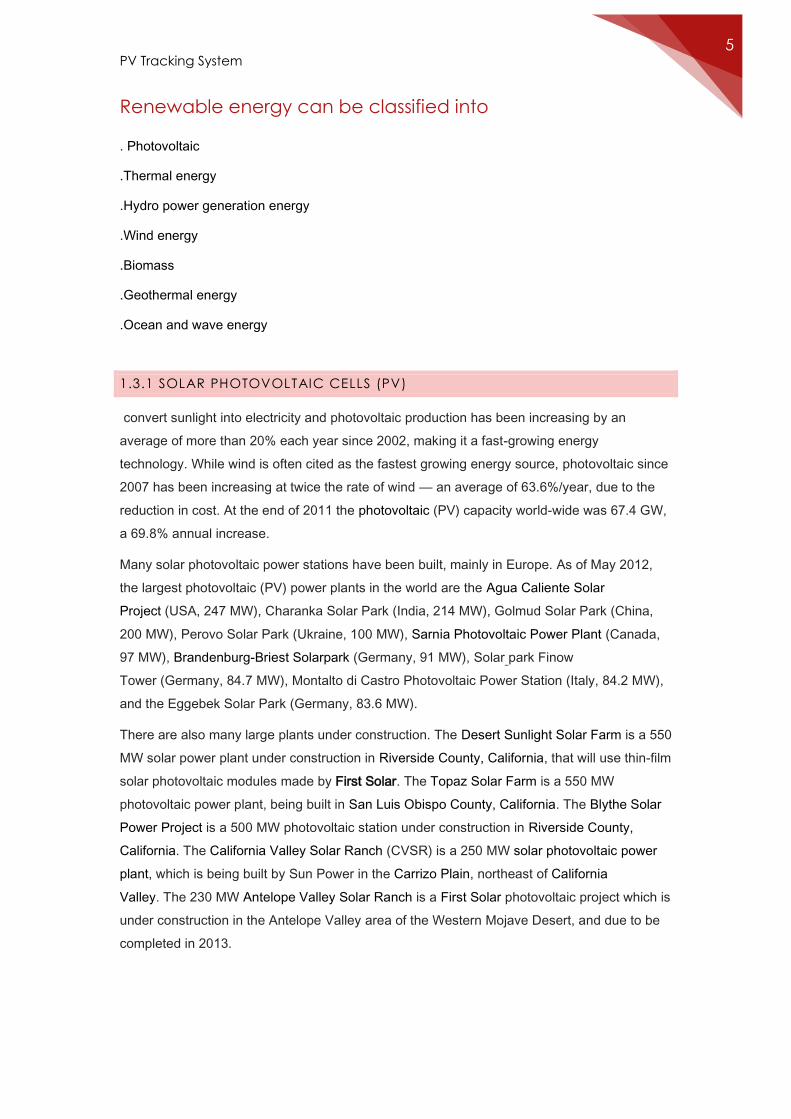
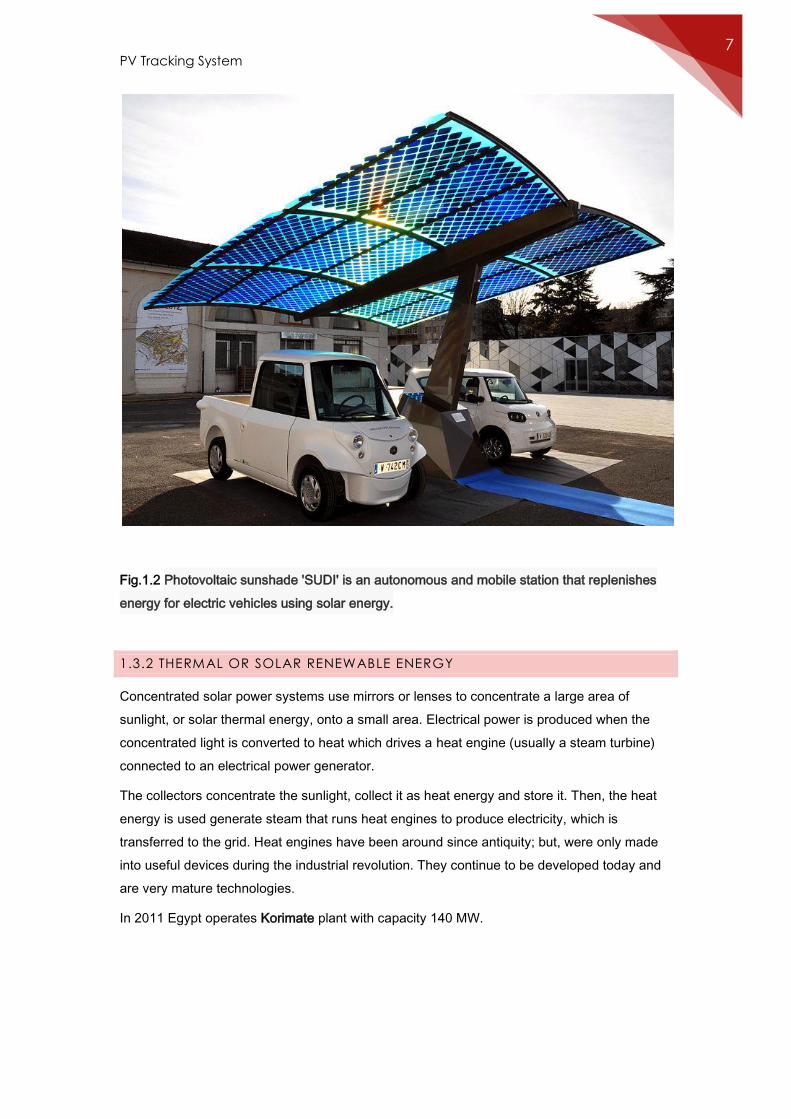
Fig.1.2 Photovoltaic sunshade 'SUDI' is an autonomous and mobile station that replenishes
energy for electric vehicles using solar energy.
1.3.2 THERMAL OR SOLAR RENEWABLE ENERGY
Concentrated solar power systems use mirrors or lenses to concentrate a large area of
sunlight, or solar thermal energy, onto a small area. Electrical power is produced when the
concentrated light is converted to heat which drives a heat engine (usually a steam turbine)
connected to an electrical power generator.
The collectors concentrate the sunlight, collect it as heat energy and store it. Then, the heat
energy is used generate steam that runs heat engines to produce electricity, which is
transferred to the grid. Heat engines have been around since antiquity; but, were only made
into useful devices during the industrial revolution. They continue to be developed today and
are very mature technologies.
In 2011 Egypt operates Korimate plant with capacity 140 MW.
Chapter 1
Introduction
8
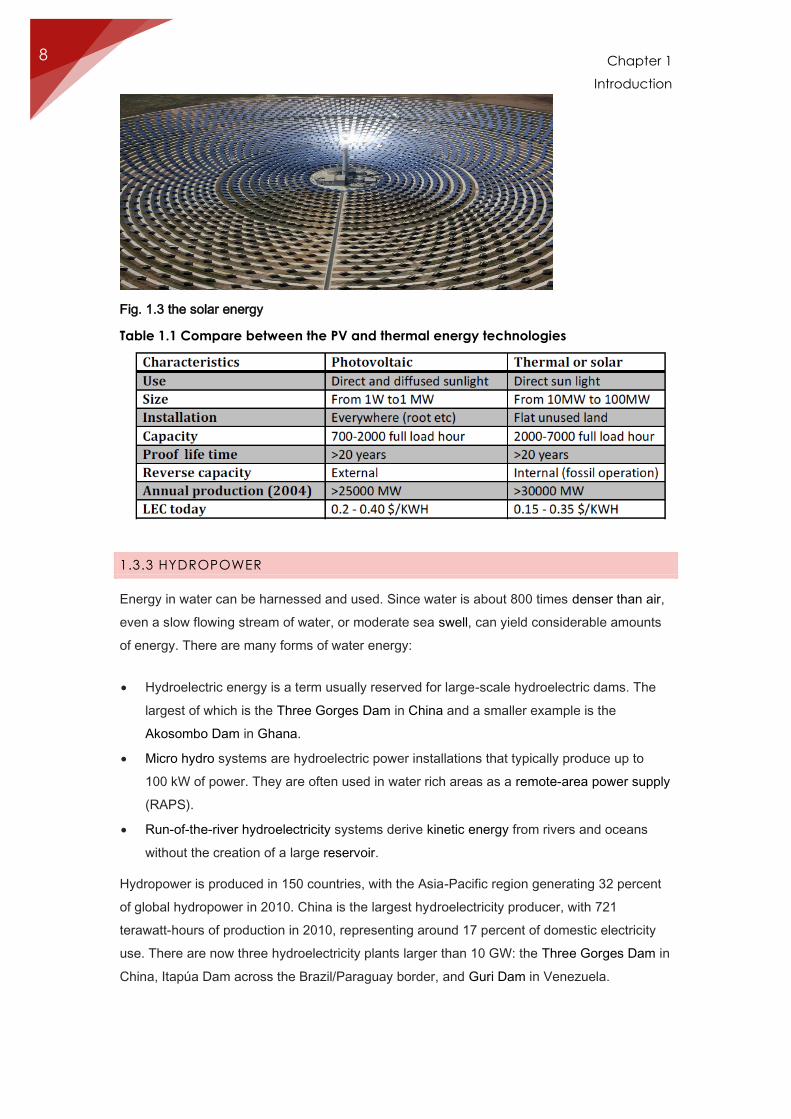
Fig. 1.3 the solar energy
Table 1.1 Compare between the PV and thermal energy technologies
1.3.3 HYDROPOWER
Energy in water can be harnessed and used. Since water is about 800 times denser than air,
even a slow flowing stream of water, or moderate sea swell, can yield considerable amounts
of energy. There are many forms of water energy:
Hydroelectric energy is a term usually reserved for large-scale hydroelectric dams. The
largest of which is the Three Gorges Dam in China and a smaller example is the
Akosombo Dam in Ghana.
Micro hydro systems are hydroelectric power installations that typically produce up to
100 kW of power. They are often used in water rich areas as a remote-area power supply
(RAPS).
Run-of-the-river hydroelectricity systems derive kinetic energy from rivers and oceans
without the creation of a large reservoir.
Hydropower is produced in 150 countries, with the Asia-Pacific region generating 32 percent
of global hydropower in 2010. China is the largest hydroelectricity producer, with 721
terawatt-hours of production in 2010, representing around 17 percent of domestic electricity
use. There are now three hydroelectricity plants larger than 10 GW: the Three Gorges Dam in
China, Itapúa Dam across the Brazil/Paraguay border, and Guri Dam in Venezuela.
PV Tracking System 9
The basic principle of hydropower is that if water can be piped from a certain level to lower
level, then the resulting water pressure can be used to do work. If the water pressure is
allowed to move a mechanical component then that movement involves the conversion of the
potential energy of the water into mechanical energy. Hydro turbines convert water pressure
into mechanical shaft power, which can be used to drive an electricity generator, a grinding
mill or some other useful device.
The advantages of the hydroelectric power stations are evident:
It doesn’t need fuel because it uses a renewable energy, constantly replaced by the
nature for free.
It’s clean, because it contaminates neither the air nor the water.
The maintenance and operation costs are low.
The hydraulic turbine is simple, efficient and safe. It can be started up and stopped
quickly and requires very few attention.
Also it is necessary to indicate some disadvantages:
1. The costs per installed kilowatt are frequently very high.
2. It alters the normal course in the biological life (animal and vegetable) of the river.
3. The dam power stations have the problem of the water evaporation:
the zone where it is constructed, the relative humidity of the atmosphere increases as
a result of the evaporation of the water contained in the dam.
4. The location of the hydroelectric power station, determined by natural causes, can be
far from the center of consumption and this can demand the construction of an
electricity transmission system. Thus, it would increase the cost of the investment,
maintenance and loss of energy.
The hydro power generation in Egypt
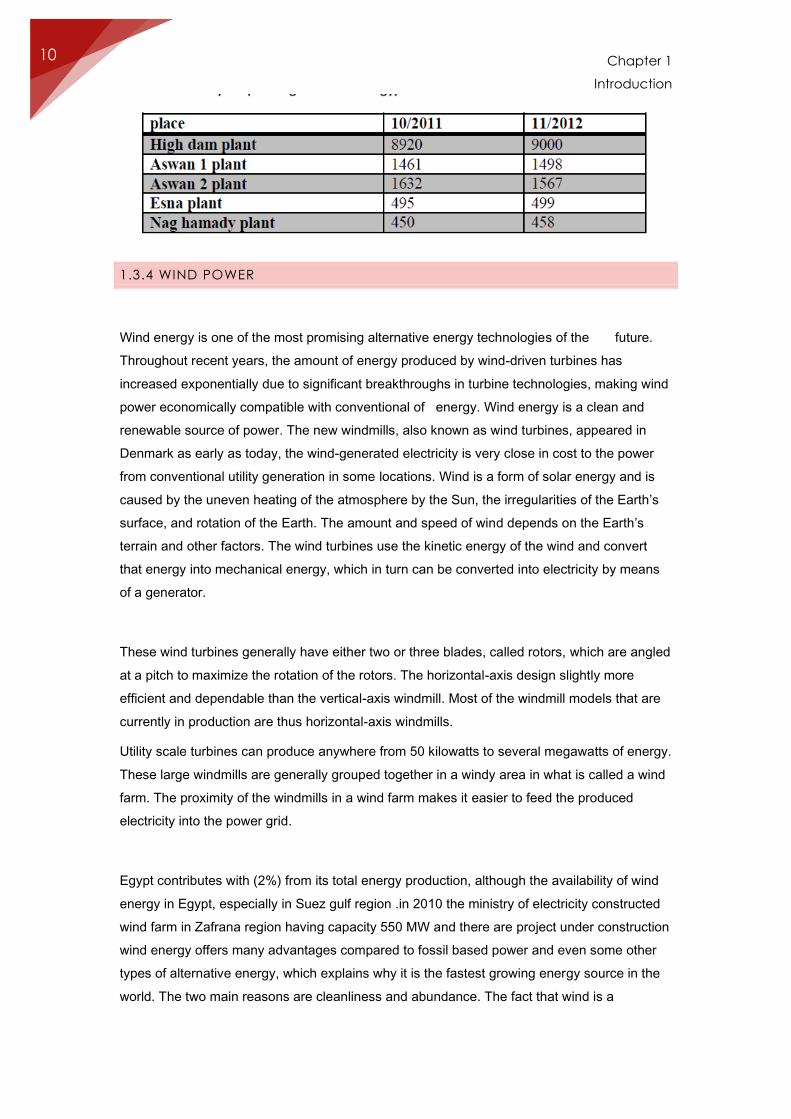
Hydroelectric power plant in Egypt contribute with (11.2%) of total generation energy in Egypt,
and the following table showing the hydroelectric power plant in Egypt and its capacity.
Table.1.2 hydro power generation in Egypt
Chapter 1
Introduction
10
1.3.4 WIND POWER
Wind energy is one of the most promising alternative energy technologies of the future.
Throughout recent years, the amount of energy produced by wind-driven turbines has
increased exponentially due to significant breakthroughs in turbine technologies, making wind
power economically compatible with conventional of energy. Wind energy is a clean and
renewable source of power. The new windmills, also known as wind turbines, appeared in
Denmark as early as today, the wind-generated electricity is very close in cost to the power
from conventional utility generation in some locations. Wind is a form of solar energy and is
caused by the uneven heating of the atmosphere by the Sun, the irregularities of the Earth’s
surface, and rotation of the Earth. The amount and speed of wind depends on the Earth’s
terrain and other factors. The wind turbines use the kinetic energy of the wind and convert
that energy into mechanical energy, which in turn can be converted into electricity by means
of a generator.
These wind turbines generally have either two or three blades, called rotors, which are angled
at a pitch to maximize the rotation of the rotors. The horizontal-axis design slightly more
efficient and dependable than the vertical-axis windmill. Most of the windmill models that are
currently in production are thus horizontal-axis windmills.
Utility scale turbines can produce anywhere from 50 kilowatts to several megawatts of energy.
These large windmills are generally grouped together in a windy area in what is called a wind
farm. The proximity of the windmills in a wind farm makes it easier to feed the produced
electricity into the power grid.
Egypt contributes with (2%) from its total energy production, although the availability of wind
energy in Egypt, especially in Suez gulf region .in 2010 the ministry of electricity constructed
wind farm in Zafrana region having capacity 550 MW and there are project under construction
wind energy offers many advantages compared to fossil based power and even some other
types of alternative energy, which explains why it is the fastest growing energy source in the
world. The two main reasons are cleanliness and abundance. The fact that wind is a
PV Tracking System 11
renewable resource gives it a major advantage over oil and other non-renewable resources.
Considering that environmental pollution is being linked to several global problems that might
eventually threaten the existence or at the very least worsen human living conditions, the fact
that windmills do not produce any emissions whatsoever is another reason to increase the
use of wind turbines.
Increasing the percentage of wind power used by the United States would not be
unreasonable, seeing that the price of wind power is between 4 and 6 cents.
Even though wind energy has many environmental and supply advantages there are several
disadvantages that limit the usability of wind power. The main disadvantage to wind power is
that it is unreliable. Wind does not blow at a constant rate, and it does not always blow when
energy is needed. Furthermore, the windiest locations are often in remote locations, far away
from big cities where the electricity is needed. Just like with any other energy plant, people
oppose it because of aesthetic reasons. The rotor noise produced by the rotor blades is
another reason for opposition.
Airflows can be used to run wind turbines. Modern utility-scale wind turbines range from
around 600 kW to 5 MW of rated power, although turbines with rated output of 1.5–3 MW
have become the most common for commercial use; the power available from the wind is a
function of the cube of the wind speed, so as wind speed increases, power output increases
dramatically up to the maximum output for the particular turbine. Areas where winds are
stronger and more constant, such as offshore and high altitude sites, are preferred locations
for wind farms. Typical capacity factors are 20-40%, with values at the upper end of the range
in particularly favorable sites.
Globally, the long-term technical potential of wind energy is believed to be five times total
current global energy production, or 40 times current electricity demand, assuming all
practical barriers needed were overcome. This would require wind turbines to be installed
over large areas, particularly in areas of higher wind resources, such as offshore. As offshore
wind speeds average ~90% greater than that of land, so offshore resources can contribute
substantially more energy than land stationed turbines.
Chapter 1
Introduction
12
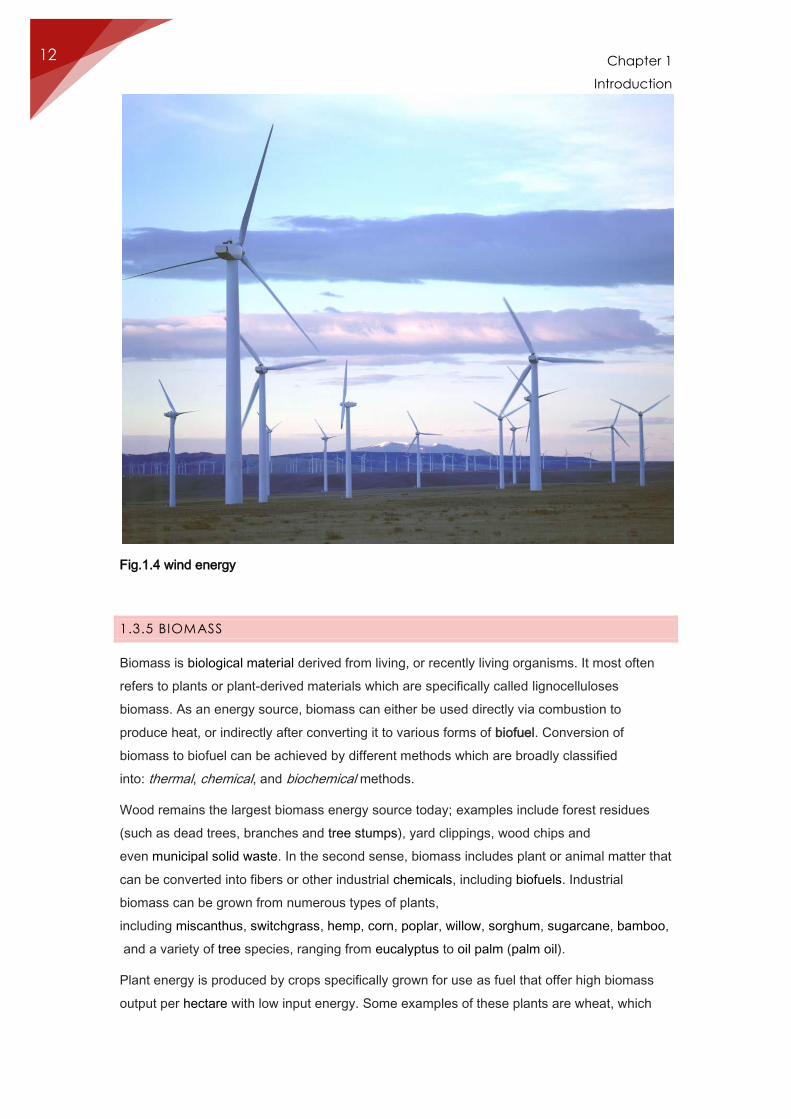
Fig.1.4 wind energy
1.3.5 BIOMASS
Biomass is biological material derived from living, or recently living organisms. It most often
refers to plants or plant-derived materials which are specifically called lignocelluloses
biomass. As an energy source, biomass can either be used directly via combustion to
produce heat, or indirectly after converting it to various forms of biofuel. Conversion of
biomass to biofuel can be achieved by different methods which are broadly classified
into: thermal, chemical, and biochemical methods.
Wood remains the largest biomass energy source today; examples include forest residues
(such as dead trees, branches and tree stumps), yard clippings, wood chips and
even municipal solid waste. In the second sense, biomass includes plant or animal matter that
can be converted into fibers or other industrial chemicals, including biofuels. Industrial
biomass can be grown from numerous types of plants,
including miscanthus, switchgrass, hemp, corn, poplar, willow, sorghum, sugarcane, bamboo,
and a variety of tree species, ranging from eucalyptus to oil palm (palm oil).
Plant energy is produced by crops specifically grown for use as fuel that offer high biomass
output per hectare with low input energy. Some examples of these plants are wheat, which
PV Tracking System 13
typically yield 7.5–8 tons of grain per hectare, and straw, which typically yield 3.5–5 tons per
hectare in the UK. The grain can be used for liquid transportation fuels while the straw can be
burned to produce heat or electricity. Plant biomass can also be degraded
from cellulose to glucose through a series of chemical treatments, and the resulting sugar can
then be used as a first generation biofuel.
Biomass can be converted to other usable forms of energy like methane gas or transportation
fuels like ethanol and biodiesel. Rotting garbage, and agricultural and human waste, all
release methane gas—also called "landfill gas" or "biogas." Crops, such as corn and sugar
cane, can be fermented to produce the transportation fuel, ethanol. Biodiesel, another
transportation fuel, can be produced from left-over food products like vegetable oils and
animal fats. Also, biomass to liquids (BTLs) and cellulosic ethanol are still under research.
There is a great deal of research involving algal, or algae-derived, biomass due to the fact
that it’s a non-food resource and can be produced at rates 5 to 10 times those of other types
of land-based agriculture, such as corn and soy. Once harvested, it can be fermented to
produce biofuels such as ethanol, butanol, and methane, as well as biodiesel and hydrogen.
The biomass used for electricity generation varies by region. Forest by-products, such as
wood residues, are common in the United States. Agricultural waste is common
in Mauritius (sugar cane residue) and Southeast Asia (rice husks). Animal husbandry
residues, such as poultry litter, are common in the UK.
Chapter 1
Introduction
14
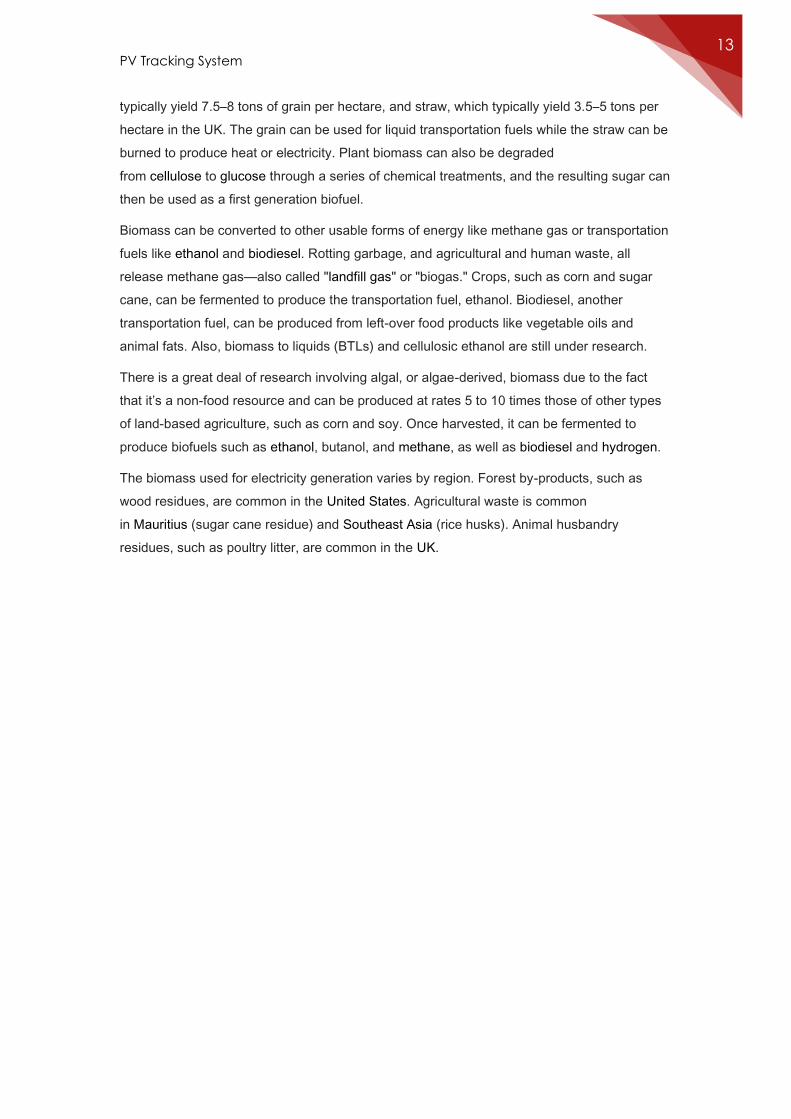
Fig.1.5 Cogeneration station in Metz (France), using waste wood biomass from the
surrounding forests as renewable energy source.
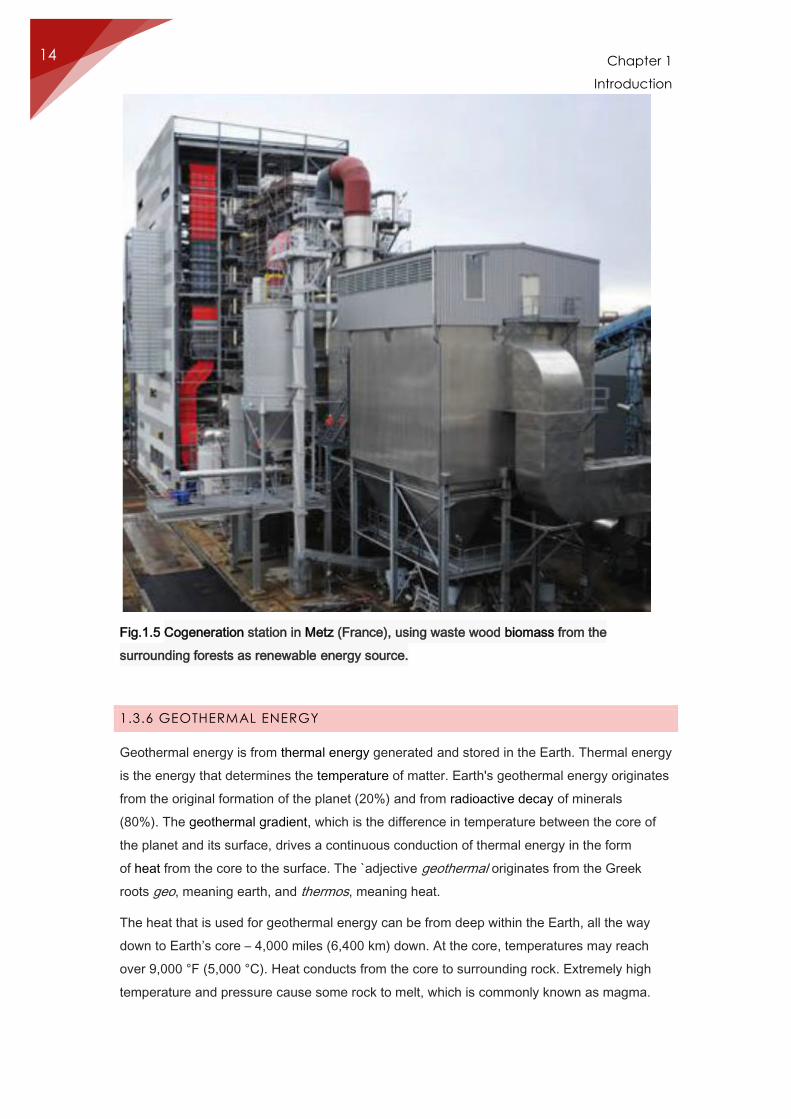
1.3.6 GEOTHERMAL ENERGY
Geothermal energy is from thermal energy generated and stored in the Earth. Thermal energy
is the energy that determines the temperature of matter. Earth's geothermal energy originates
from the original formation of the planet (20%) and from radioactive decay of minerals
(80%). The geothermal gradient, which is the difference in temperature between the core of
the planet and its surface, drives a continuous conduction of thermal energy in the form
of heat from the core to the surface. The `adjective geothermal originates from the Greek
roots geo, meaning earth, and thermos, meaning heat.
The heat that is used for geothermal energy can be from deep within the Earth, all the way
down to Earth’s core – 4,000 miles (6,400 km) down. At the core, temperatures may reach
over 9,000 °F (5,000 °C). Heat conducts from the core to surrounding rock. Extremely high
temperature and pressure cause some rock to melt, which is commonly known as magma.

PV Tracking System 15
Magma convicts upward since it is lighter than the solid rock. This magma then heats rock
and water in the crust, sometimes up to 700 °F (371 °C).
From hot springs, geothermal energy has been used for bathing since Paleolithic times and
for space heating since ancient Roman times, but it is now better known for electricity
generation.
Fig.1.6 the Nesjavellir Geothermal Power Plan
The different ways in which geothermal energy can be used:
Geothermal energy can be used for electricity production, for commercial, industrial, and
residential direct heating purposes, and for efficient home heating and cooling through
geothermal heat pumps.
Heating Uses
Geothermal heat is used directly, without involving a power plant or a heat pump, for a variety
of applications such as space heating and cooling, food preparation, hot spring bathing and
spas (balneology), agriculture, aquaculture, greenhouses, and industrial processes. Uses for
heating and bathing are traced back to ancient Roman times. Currently, geothermal is used
for direct heating purposes at sites across the
United States. U.S. installed capacity of direct use systems totals 470 MW or enough to heat
40,000 average-sized houses.
Chapter 1
Introduction
16
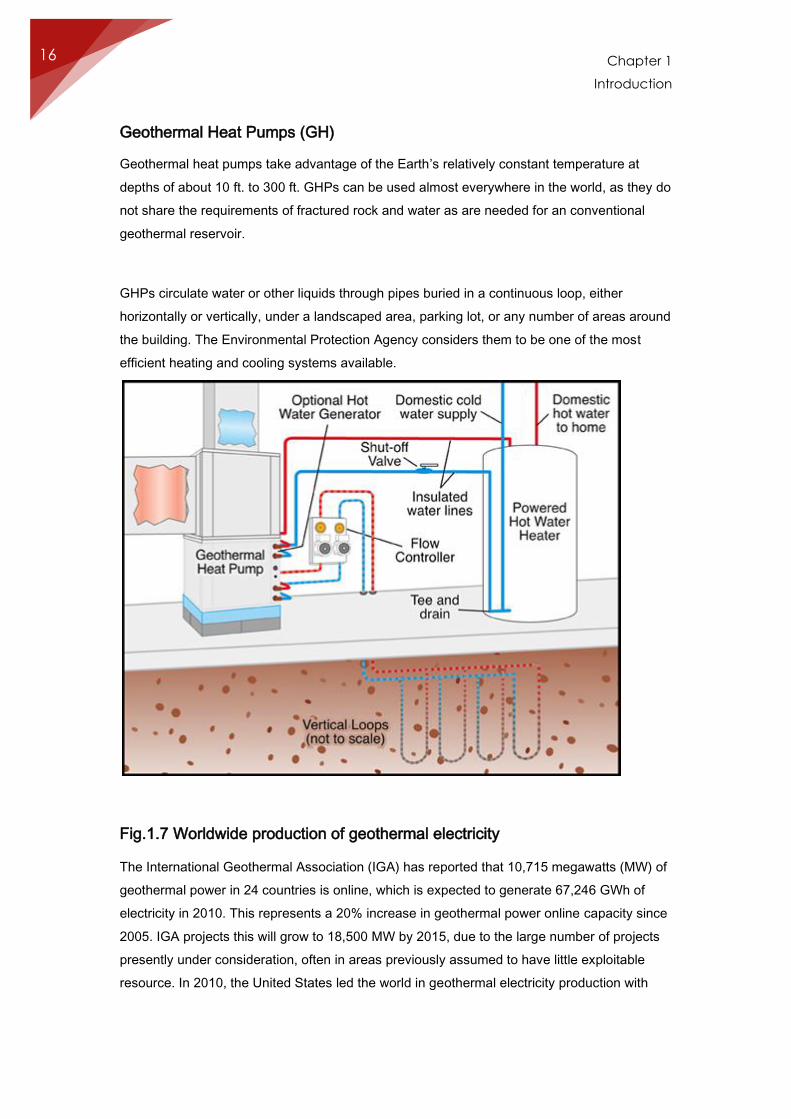
Geothermal Heat Pumps (GH)
Geothermal heat pumps take advantage of the Earth’s relatively constant temperature at
depths of about 10 ft. to 300 ft. GHPs can be used almost everywhere in the world, as they do
not share the requirements of fractured rock and water as are needed for an conventional
geothermal reservoir.
GHPs circulate water or other liquids through pipes buried in a continuous loop, either
horizontally or vertically, under a landscaped area, parking lot, or any number of areas around
the building. The Environmental Protection Agency considers them to be one of the most
efficient heating and cooling systems available.
Fig.1.7 Worldwide production of geothermal electricity
The International Geothermal Association (IGA) has reported that 10,715 megawatts (MW) of
geothermal power in 24 countries is online, which is expected to generate 67,246 GWh of
electricity in 2010. This represents a 20% increase in geothermal power online capacity since
2005. IGA projects this will grow to 18,500 MW by 2015, due to the large number of projects
presently under consideration, often in areas previously assumed to have little exploitable
resource. In 2010, the United States led the world in geothermal electricity production with
PV Tracking System 17
3,086 MW of installed capacity from 77 power plants; the largest group of geothermal power
plants in the world is located at The Geysers, a geothermal field in California
1.3.7 OCEAN ENERGY
Generating technologies for deriving electrical power from the ocean include wave energy,
tidal energy, and ocean thermal energy conversion.
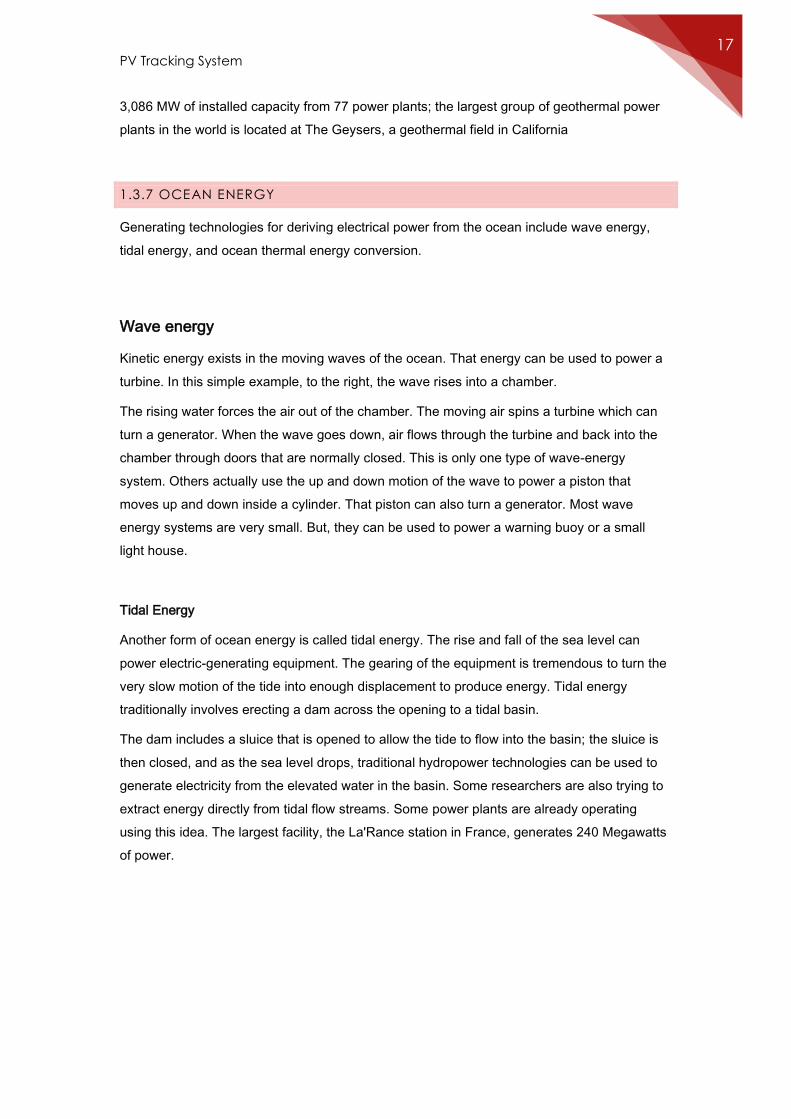
Wave energy
Kinetic energy exists in the moving waves of the ocean. That energy can be used to power a
turbine. In this simple example, to the right, the wave rises into a chamber.
The rising water forces the air out of the chamber. The moving air spins a turbine which can
turn a generator. When the wave goes down, air flows through the turbine and back into the
chamber through doors that are normally closed. This is only one type of wave-energy
system. Others actually use the up and down motion of the wave to power a piston that
moves up and down inside a cylinder. That piston can also turn a generator. Most wave
energy systems are very small. But, they can be used to power a warning buoy or a small
light house.
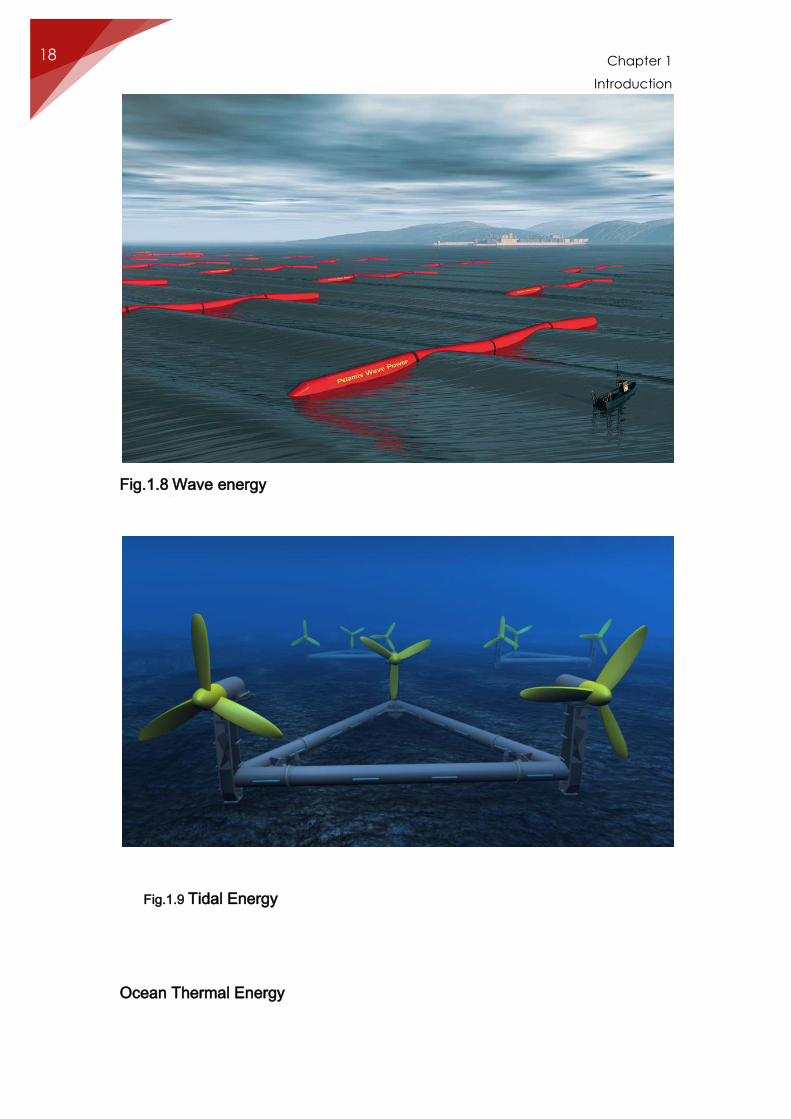
Tidal Energy
Another form of ocean energy is called tidal energy. The rise and fall of the sea level can
power electric-generating equipment. The gearing of the equipment is tremendous to turn the
very slow motion of the tide into enough displacement to produce energy. Tidal energy
traditionally involves erecting a dam across the opening to a tidal basin.
The dam includes a sluice that is opened to allow the tide to flow into the basin; the sluice is
then closed, and as the sea level drops, traditional hydropower technologies can be used to
generate electricity from the elevated water in the basin. Some researchers are also trying to
extract energy directly from tidal flow streams. Some power plants are already operating
using this idea. The largest facility, the La'Rance station in France, generates 240 Megawatts
of power.
Chapter 1
Introduction
18
Fig.1.8 Wave energy
Fig.1.9 Tidal Energy
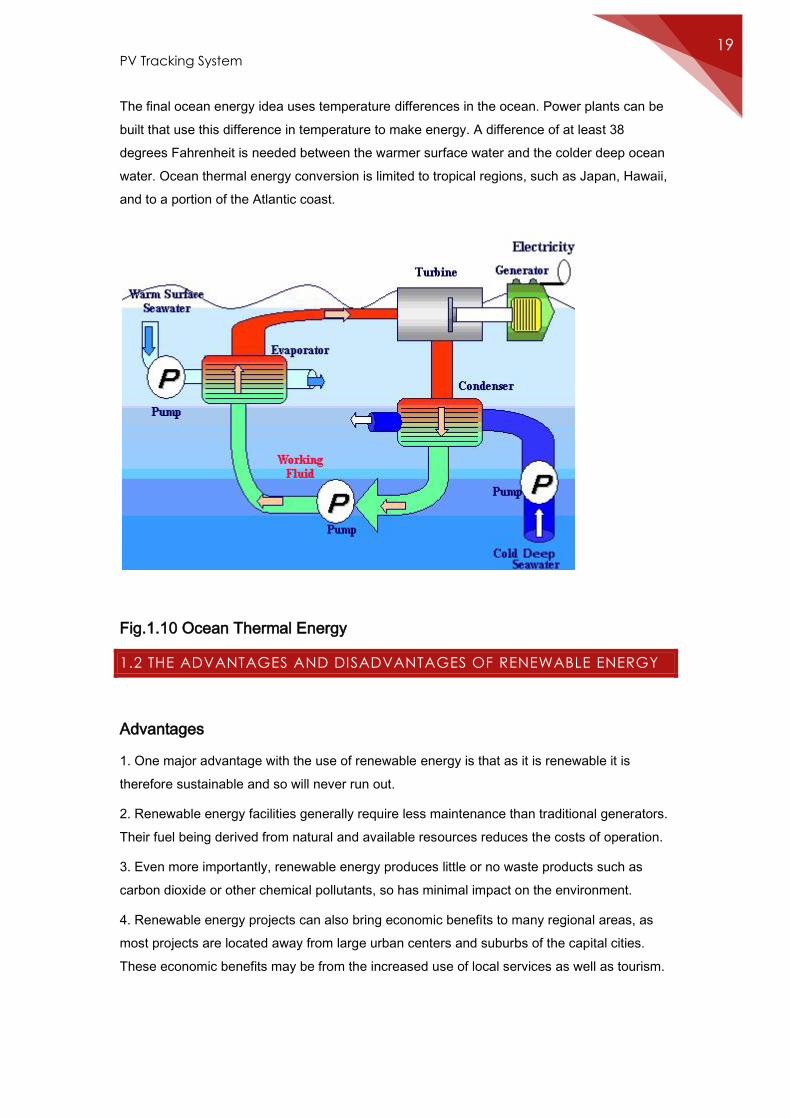
Ocean Thermal Energy
PV Tracking System 19
The final ocean energy idea uses temperature differences in the ocean. Power plants can be
built that use this difference in temperature to make energy. A difference of at least 38
degrees Fahrenheit is needed between the warmer surface water and the colder deep ocean
water. Ocean thermal energy conversion is limited to tropical regions, such as Japan, Hawaii,
and to a portion of the Atlantic coast.
Fig.1.10 Ocean Thermal Energy
1.2 THE ADVANTAGES AND DISADVANTAGES OF RENEWABLE ENERGY
Advantages
1. One major advantage with the use of renewable energy is that as it is renewable it is
therefore sustainable and so will never run out.
2. Renewable energy facilities generally require less maintenance than traditional generators.
Their fuel being derived from natural and available resources reduces the costs of operation.
3. Even more importantly, renewable energy produces little or no waste products such as
carbon dioxide or other chemical pollutants, so has minimal impact on the environment.
4. Renewable energy projects can also bring economic benefits to many regional areas, as
most projects are located away from large urban centers and suburbs of the capital cities.
These economic benefits may be from the increased use of local services as well as tourism.
Chapter 1
Introduction
20
Disadvantages
1. One disadvantage with renewable energy is that it is difficult to generate the quantities of
electricity that are as large as those produced by traditional fossil fuel generators. This may
mean that we need to reduce the amount of energy we use or simply build more energy
facilities. It also indicates that the best solution to our energy problems may be to have a
balance of many different power sources.
2. Another disadvantage of renewable energy sources is the reliability of supply.
Renewable energy often relies on the weather for its source of power. Hydro generators need
rain to fill dams to supply flowing water. Wind turbines need wind to turn the blades, and solar
collectors need clear skies and sunshine to collect heat and make electricity. When these
resources are unavailable so is the capacity to make energy from them. This can be
unpredictable and inconsistent.
3. The current cost of renewable energy technology is also far in excess of traditional fossil
fuel generation. This is because it is a new technology and as such has extremely large
capital cost.
Chapter 2
Solar Energy
22
CHAPTER 2
SOLAR ENERGY 2.1 INTRODUCTION
Solar energy comes from the sun. Every day the sun radiates
an enormous amount of energy. The sun radiates more energy
in one second than people have used since the beginning of
time. All this energy comes from within the sun itself. Like
other stars, the sun is a big gas ball made up mostly of
hydrogen and helium. The sun generates energy in its
core in a process called nuclear fusion. During nuclear
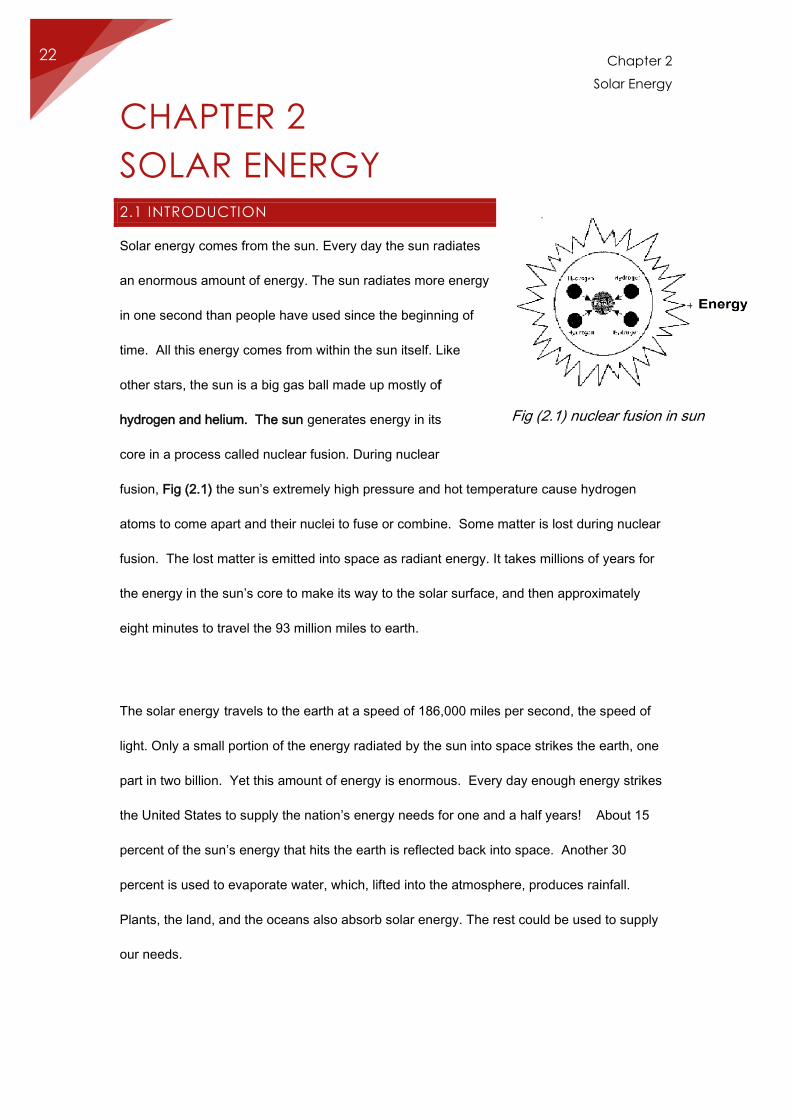
fusion, Fig (2.1) the sun’s extremely high pressure and hot temperature cause hydrogen
atoms to come apart and their nuclei to fuse or combine. Some matter is lost during nuclear
fusion. The lost matter is emitted into space as radiant energy. It takes millions of years for
the energy in the sun’s core to make its way to the solar surface, and then approximately
eight minutes to travel the 93 million miles to earth.
The solar energy travels to the earth at a speed of 186,000 miles per second, the speed of
light. Only a small portion of the energy radiated by the sun into space strikes the earth, one
part in two billion. Yet this amount of energy is enormous. Every day enough energy strikes
the United States to supply the nation’s energy needs for one and a half years! About 15
percent of the sun’s energy that hits the earth is reflected back into space. Another 30
percent is used to evaporate water, which, lifted into the atmosphere, produces rainfall.
Plants, the land, and the oceans also absorb solar energy. The rest could be used to supply
our needs.
Fig (2.1) nuclear fusion in sun
PV Tracking System 23
The Sun –An Overview
The Sun is the centre of our solar system and its energy drives nearly all systems on earth.
They include climate systems, ecosystems (plant & animal processes), hydrological systems,
wind systems, etc.). Solar energy is created at the core of the sun when hydrogen atoms are
fused to form helium by nuclear fusion. It is estimated that 700 million tons of hydrogen are
converted into 695 million tons of helium every second.
H++ H+ = He+++Energy.
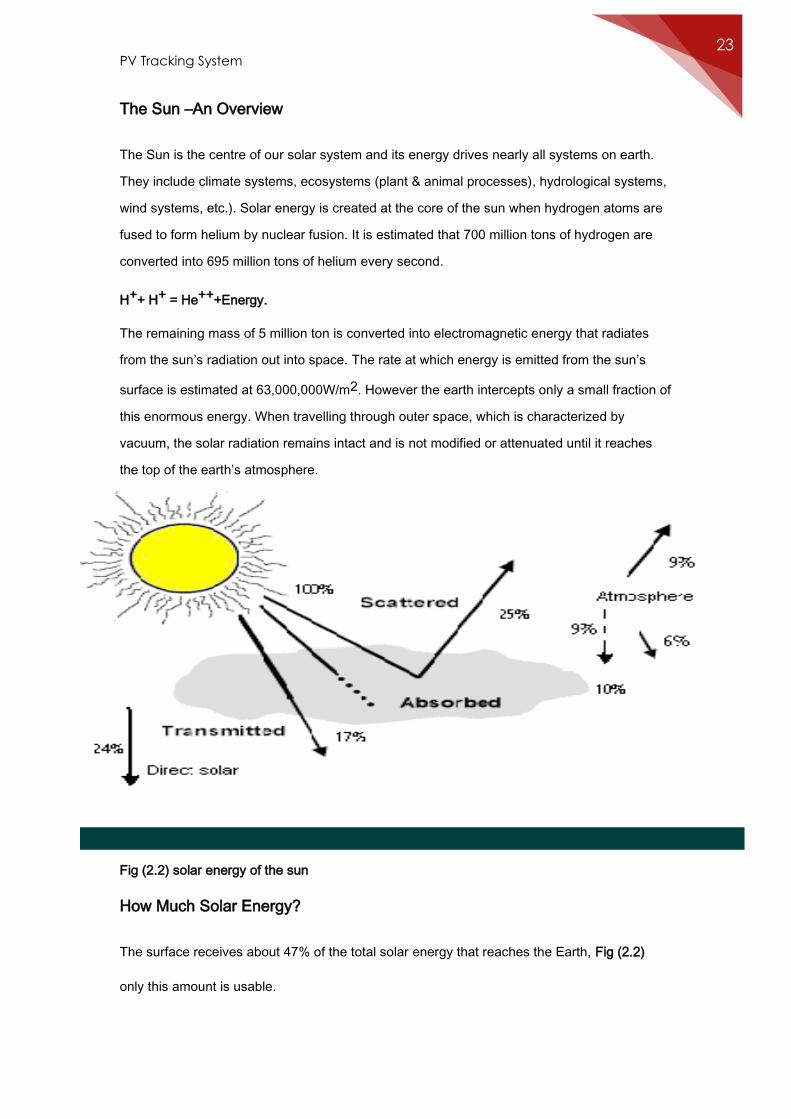
The remaining mass of 5 million ton is converted into electromagnetic energy that radiates
from the sun’s radiation out into space. The rate at which energy is emitted from the sun’s
surface is estimated at 63,000,000W/m2. However the earth intercepts only a small fraction of
this enormous energy. When travelling through outer space, which is characterized by
vacuum, the solar radiation remains intact and is not modified or attenuated until it reaches
the top of the earth’s atmosphere.
Fig (2.2) solar energy of the sun
How Much Solar Energy?
The surface receives about 47% of the total solar energy that reaches the Earth, Fig (2.2)
only this amount is usable.
Chapter 2
Solar Energy
24
Irradiated energy
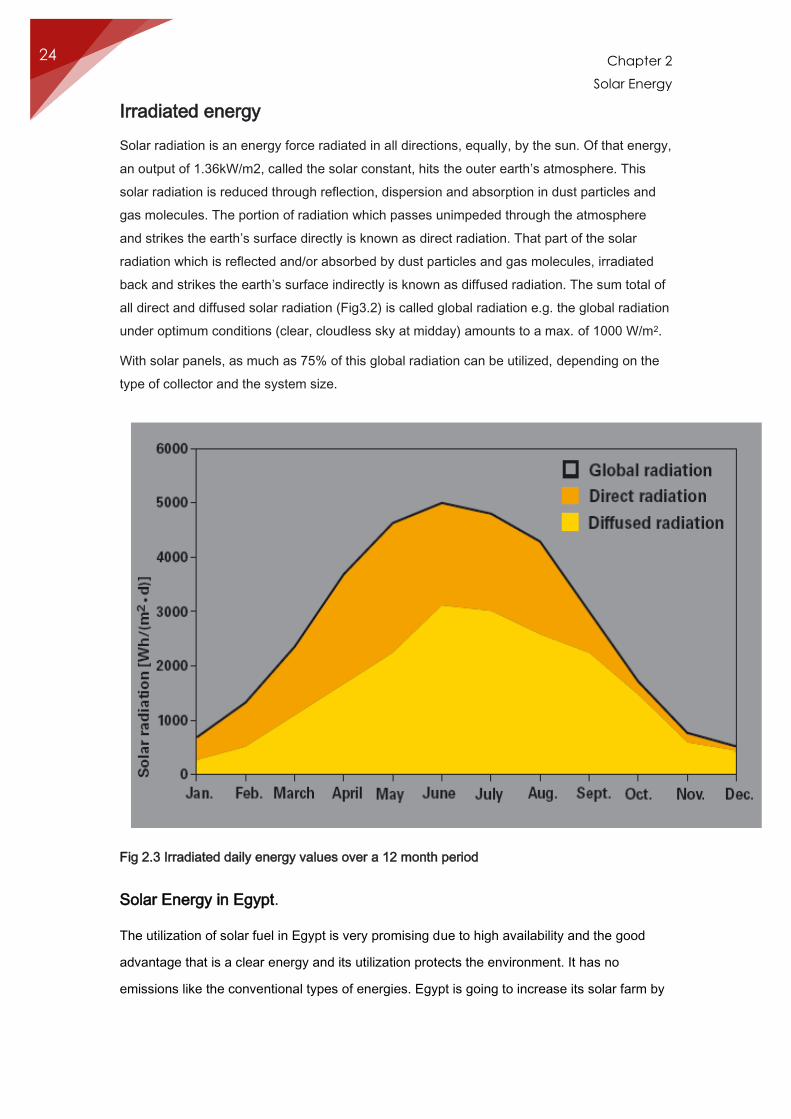
Solar radiation is an energy force radiated in all directions, equally, by the sun. Of that energy,
an output of 1.36kW/m2, called the solar constant, hits the outer earth’s atmosphere. This
solar radiation is reduced through reflection, dispersion and absorption in dust particles and
gas molecules. The portion of radiation which passes unimpeded through the atmosphere
and strikes the earth’s surface directly is known as direct radiation. That part of the solar
radiation which is reflected and/or absorbed by dust particles and gas molecules, irradiated
back and strikes the earth’s surface indirectly is known as diffused radiation. The sum total of
all direct and diffused solar radiation (Fig3.2) is called global radiation e.g. the global radiation
under optimum conditions (clear, cloudless sky at midday) amounts to a max. of 1000 W/m2.
With solar panels, as much as 75% of this global radiation can be utilized, depending on the
type of collector and the system size.
Fig 2.3 Irradiated daily energy values over a 12 month period
Solar Energy in Egypt.
The utilization of solar fuel in Egypt is very promising due to high availability and the good
advantage that is a clear energy and its utilization protects the environment. It has no
emissions like the conventional types of energies. Egypt is going to increase its solar farm by
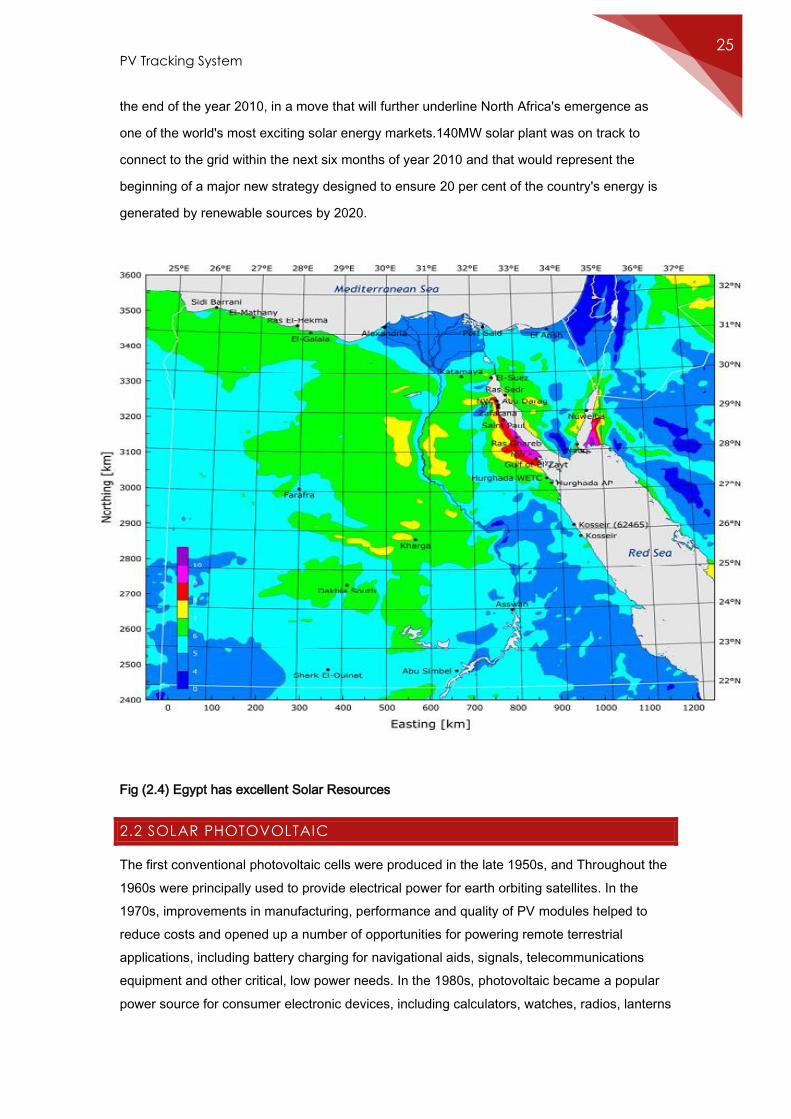
PV Tracking System 25
the end of the year 2010, in a move that will further underline North Africa's emergence as
one of the world's most exciting solar energy markets.140MW solar plant was on track to
connect to the grid within the next six months of year 2010 and that would represent the
beginning of a major new strategy designed to ensure 20 per cent of the country's energy is
generated by renewable sources by 2020.
Fig (2.4) Egypt has excellent Solar Resources
2.2 SOLAR PHOTOVOLTAIC
The first conventional photovoltaic cells were produced in the late 1950s, and Throughout the
1960s were principally used to provide electrical power for earth orbiting satellites. In the
1970s, improvements in manufacturing, performance and quality of PV modules helped to
reduce costs and opened up a number of opportunities for powering remote terrestrial
applications, including battery charging for navigational aids, signals, telecommunications
equipment and other critical, low power needs. In the 1980s, photovoltaic became a popular
power source for consumer electronic devices, including calculators, watches, radios, lanterns
Chapter 2
Solar Energy
26
and other small battery charging applications. Following the energy crises of the 1970s,
significant efforts also began to develop PV power systems for residential and commercial
uses, both for stand-alone, remote power as well as for utility-connected applications.
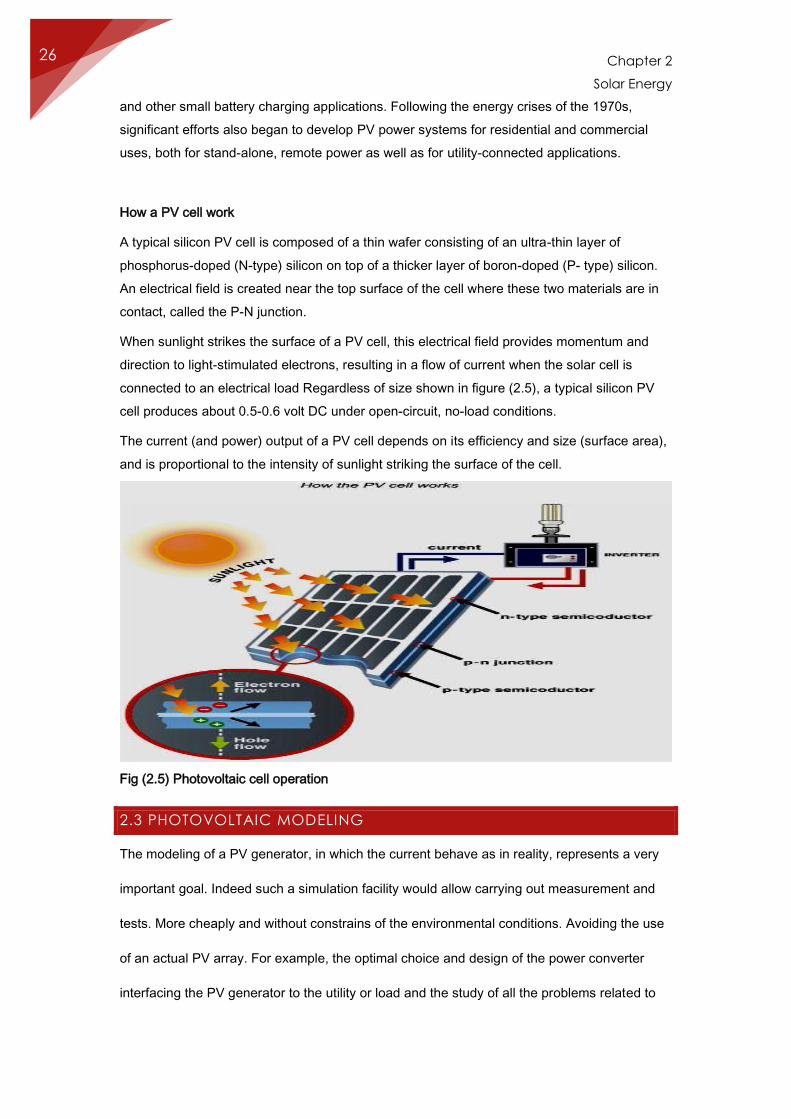
How a PV cell work
A typical silicon PV cell is composed of a thin wafer consisting of an ultra-thin layer of
phosphorus-doped (N-type) silicon on top of a thicker layer of boron-doped (P- type) silicon.
An electrical field is created near the top surface of the cell where these two materials are in
contact, called the P-N junction.
When sunlight strikes the surface of a PV cell, this electrical field provides momentum and
direction to light-stimulated electrons, resulting in a flow of current when the solar cell is
connected to an electrical load Regardless of size shown in figure (2.5), a typical silicon PV
cell produces about 0.5-0.6 volt DC under open-circuit, no-load conditions.
The current (and power) output of a PV cell depends on its efficiency and size (surface area),
and is proportional to the intensity of sunlight striking the surface of the cell.
Fig (2.5) Photovoltaic cell operation
2.3 PHOTOVOLTAIC MODELING
The modeling of a PV generator, in which the current behave as in reality, represents a very
important goal. Indeed such a simulation facility would allow carrying out measurement and
tests. More cheaply and without constrains of the environmental conditions. Avoiding the use
of an actual PV array. For example, the optimal choice and design of the power converter
interfacing the PV generator to the utility or load and the study of all the problems related to
PV Tracking System 27
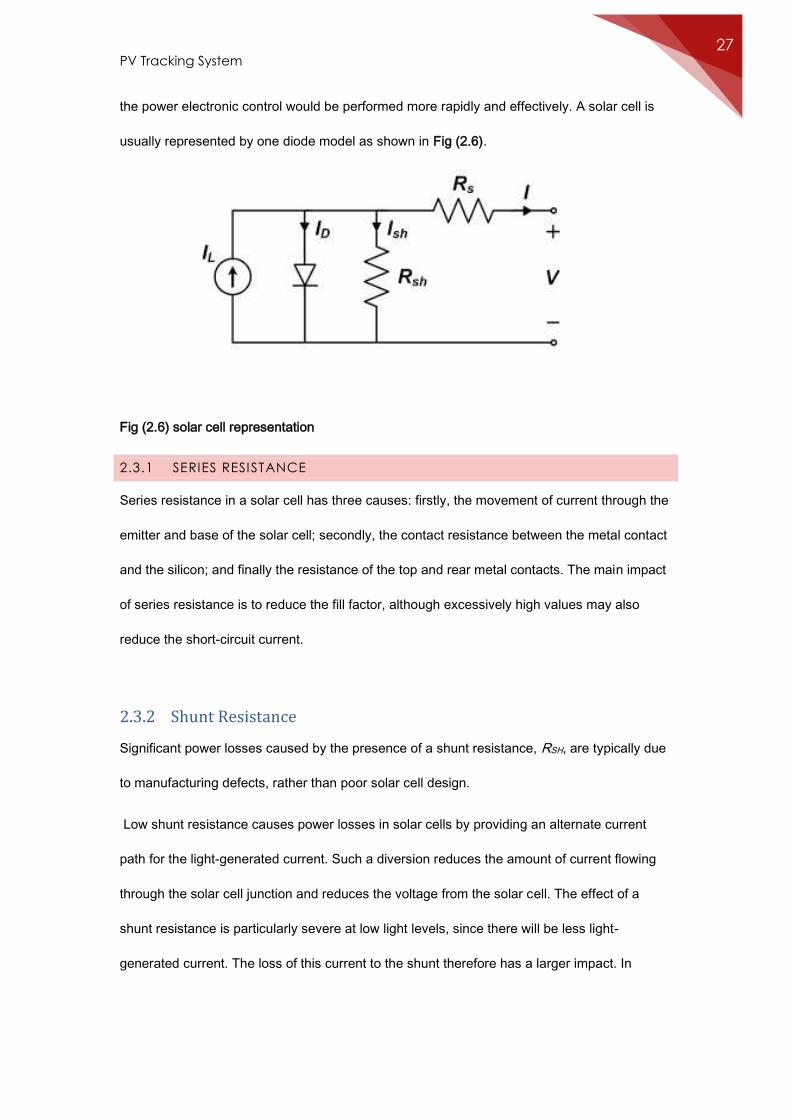
the power electronic control would be performed more rapidly and effectively. A solar cell is
usually represented by one diode model as shown in Fig (2.6).
Fig (2.6) solar cell representation
2.3.1 SERIES RESISTANCE
Series resistance in a solar cell has three causes: firstly, the movement of current through the
emitter and base of the solar cell; secondly, the contact resistance between the metal contact
and the silicon; and finally the resistance of the top and rear metal contacts. The main impact
of series resistance is to reduce the fill factor, although excessively high values may also
reduce the short-circuit current.
2.3.2 Shunt Resistance
Significant power losses caused by the presence of a shunt resistance, RSH, are typically due
to manufacturing defects, rather than poor solar cell design.
Low shunt resistance causes power losses in solar cells by providing an alternate current
path for the light-generated current. Such a diversion reduces the amount of current flowing
through the solar cell junction and reduces the voltage from the solar cell. The effect of a
shunt resistance is particularly severe at low light levels, since there will be less light-
generated current. The loss of this current to the shunt therefore has a larger impact. In
Chapter 2
Solar Energy
28
addition, at lower voltages where the effective resistance of the solar cell is high, the impact of
a resistance in parallel is large.
2.3.3 Ideality Factor
The ideality factor of a diode is a measure of how closely the diode follows the ideal diode
equation. The derivation of the simple diode equation uses certain assumption about the cell.
In practice, there are second order effects so that the diode does not follow the simple diode
equation and the ideality factor provides a way of describing them.
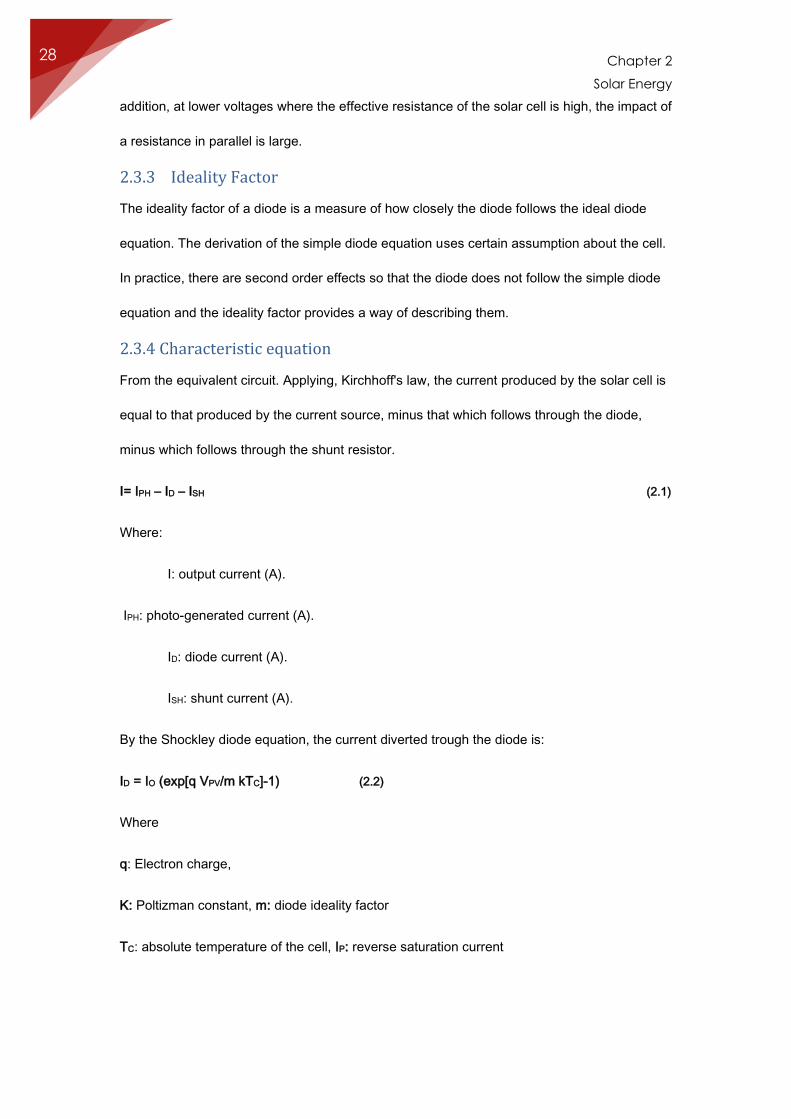
2.3.4 Characteristic equation
From the equivalent circuit. Applying, Kirchhoff's law, the current produced by the solar cell is
equal to that produced by the current source, minus that which follows through the diode,
minus which follows through the shunt resistor.
I= IPH – ID – ISH (2.1)
Where:
I: output current (A).
IPH: photo-generated current (A).
ID: diode current (A).
ISH: shunt current (A).
By the Shockley diode equation, the current diverted trough the diode is:
ID = IO (exp[q VPV/m kTC]-1) (2.2)
Where
q: Electron charge,
K: Poltizman constant, m: diode ideality factor
TC: absolute temperature of the cell, IP: reverse saturation current
PV Tracking System 29
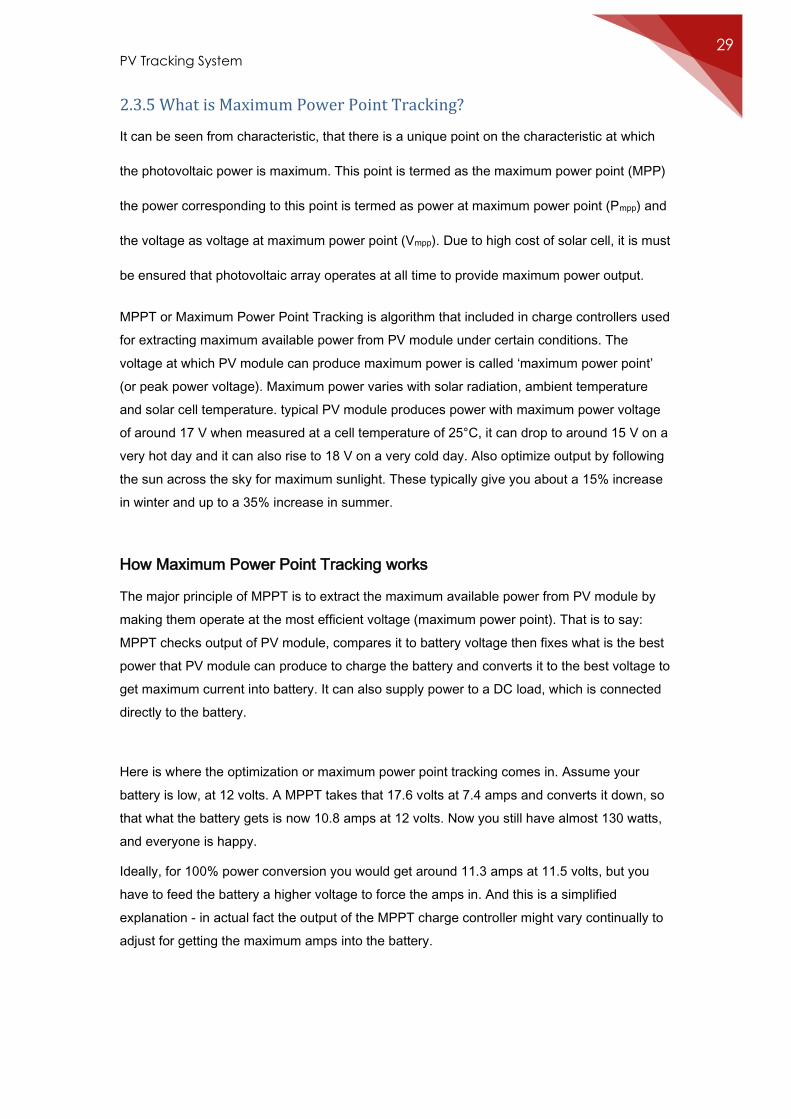
2.3.5 What is Maximum Power Point Tracking?
It can be seen from characteristic, that there is a unique point on the characteristic at which
the photovoltaic power is maximum. This point is termed as the maximum power point (MPP)
the power corresponding to this point is termed as power at maximum power point (Pmpp) and
the voltage as voltage at maximum power point (Vmpp). Due to high cost of solar cell, it is must
be ensured that photovoltaic array operates at all time to provide maximum power output.
MPPT or Maximum Power Point Tracking is algorithm that included in charge controllers used
for extracting maximum available power from PV module under certain conditions. The
voltage at which PV module can produce maximum power is called ‘maximum power point’
(or peak power voltage). Maximum power varies with solar radiation, ambient temperature
and solar cell temperature. typical PV module produces power with maximum power voltage
of around 17 V when measured at a cell temperature of 25°C, it can drop to around 15 V on a
very hot day and it can also rise to 18 V on a very cold day. Also optimize output by following
the sun across the sky for maximum sunlight. These typically give you about a 15% increase
in winter and up to a 35% increase in summer.
How Maximum Power Point Tracking works
The major principle of MPPT is to extract the maximum available power from PV module by
making them operate at the most efficient voltage (maximum power point). That is to say:
MPPT checks output of PV module, compares it to battery voltage then fixes what is the best
power that PV module can produce to charge the battery and converts it to the best voltage to
get maximum current into battery. It can also supply power to a DC load, which is connected
directly to the battery.
Here is where the optimization or maximum power point tracking comes in. Assume your
battery is low, at 12 volts. A MPPT takes that 17.6 volts at 7.4 amps and converts it down, so
that what the battery gets is now 10.8 amps at 12 volts. Now you still have almost 130 watts,
and everyone is happy.
Ideally, for 100% power conversion you would get around 11.3 amps at 11.5 volts, but you
have to feed the battery a higher voltage to force the amps in. And this is a simplified
explanation - in actual fact the output of the MPPT charge controller might vary continually to
adjust for getting the maximum amps into the battery.
Chapter 2
Solar Energy
30
Fig. (2.7) the max power point tracking.
If you look, you will see that it has a sharp peak at the upper right - that represents the
maximum power point. What an MPPT controller does is "look" for that exact point, and then
does the voltage/current conversion to change it to exactly what the battery needs. In real life,
that peak moves around continuously with changes in light conditions and weather. A MPPT
tracks the maximum power point, which is going to be different from the STC (Standard Test
Conditions) rating under almost all situations. Under very cold conditions a 120 watt panel is
actually capable of putting over 130+ watts because the power output goes up as panel
temperature goes down - but if you don't have some way of tracking that power point, you are
going to lose it.
On the other hand under very hot conditions, the power drops - you lose power as the
temperature goes up. That is why you get less gain in summer.
2.3.6 Efficiency
The efficiency is the most commonly used parameter to compare the performance of one
solar cell to another. Efficiency is defined as the ratio of energy output from the solar cell to
input energy from the sun.
PV Tracking System 31
In addition to reflecting the performance of the solar cell itself, the efficiency depends on the
spectrum and intensity of the incident sunlight and the temperature of the solar cell.
Therefore, conditions under which efficiency is measured must be carefully controlled in order
to compare the performance of one device to another.
Efficiency can be computed from equations:-
2.3
2.4
2.4 EFFECT OF SOLAR IRRADIANCE, TEMPERATURE ON PV:
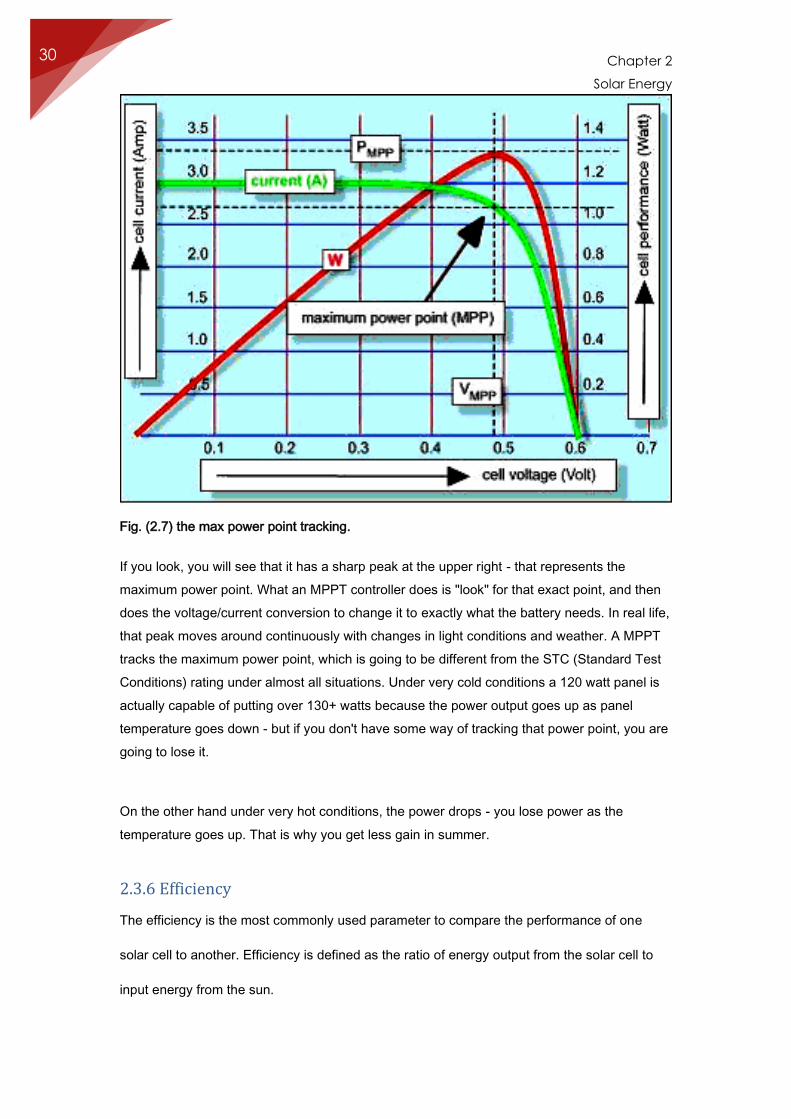
2.4.1 Effect of Solar Irradiance on PV
From Fig(2.8a-2.8b) change in irradiance (solar power) significantly affect the current and
power output of PV device but have a much small effect on voltage.
The fact that the voltage varies little with changing sunlight levels makes PV device well-
suited for battery charging applications.
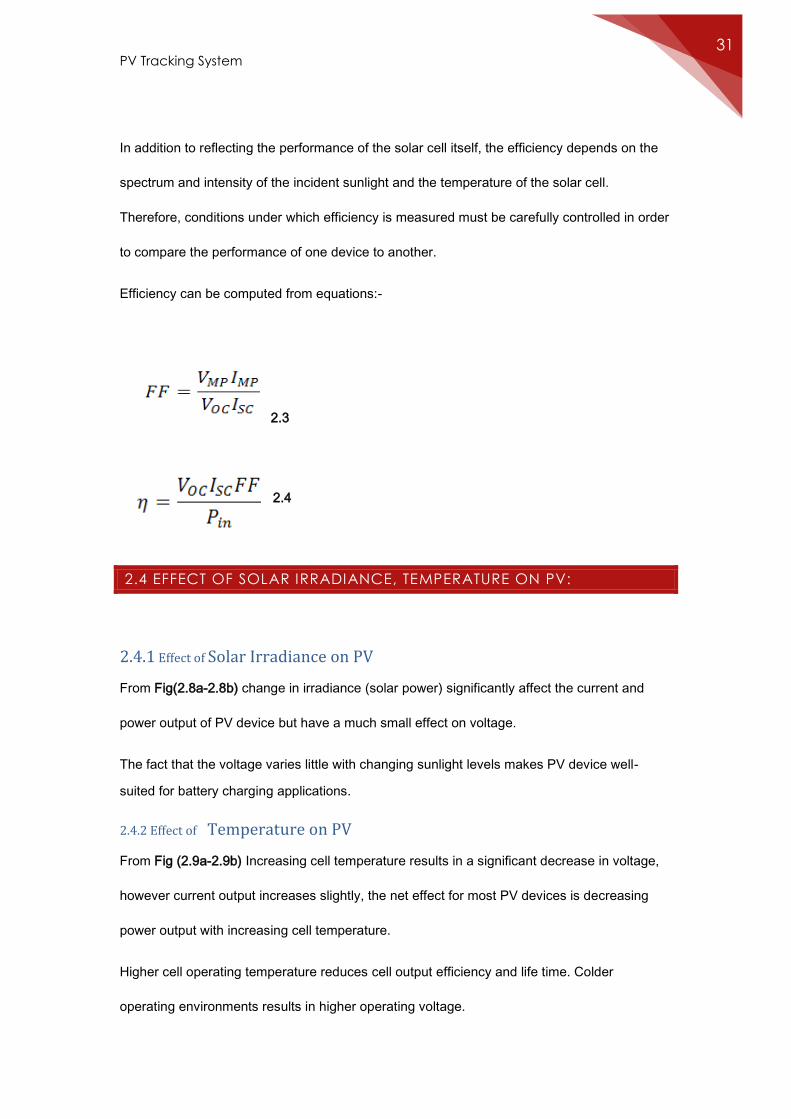
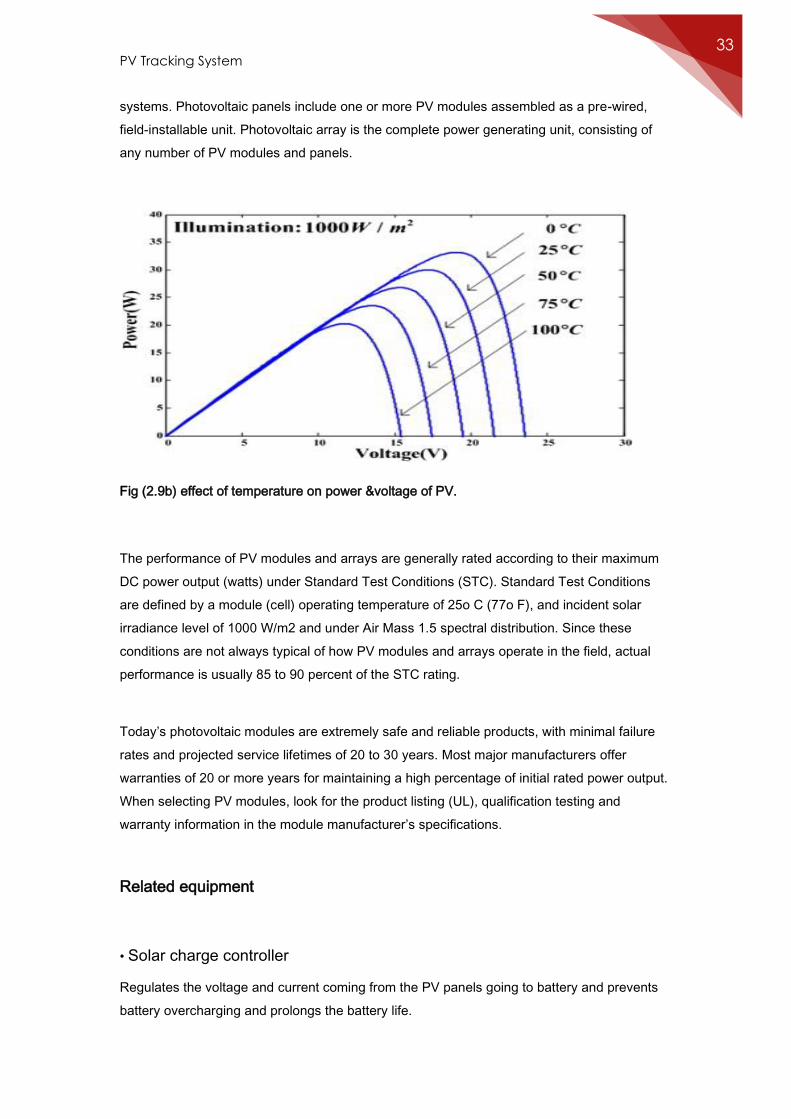
2.4.2 Effect of Temperature on PV
From Fig (2.9a-2.9b) Increasing cell temperature results in a significant decrease in voltage,
however current output increases slightly, the net effect for most PV devices is decreasing
power output with increasing cell temperature.
Higher cell operating temperature reduces cell output efficiency and life time. Colder
operating environments results in higher operating voltage.
Chapter 2
Solar Energy
32
Fig (2.8a-2.8b) effect of solar radiation.
Fig (2.9a) effect of temperature on current & voltage of PV.
2.5 COMPONENTS OF PV SYSTEM
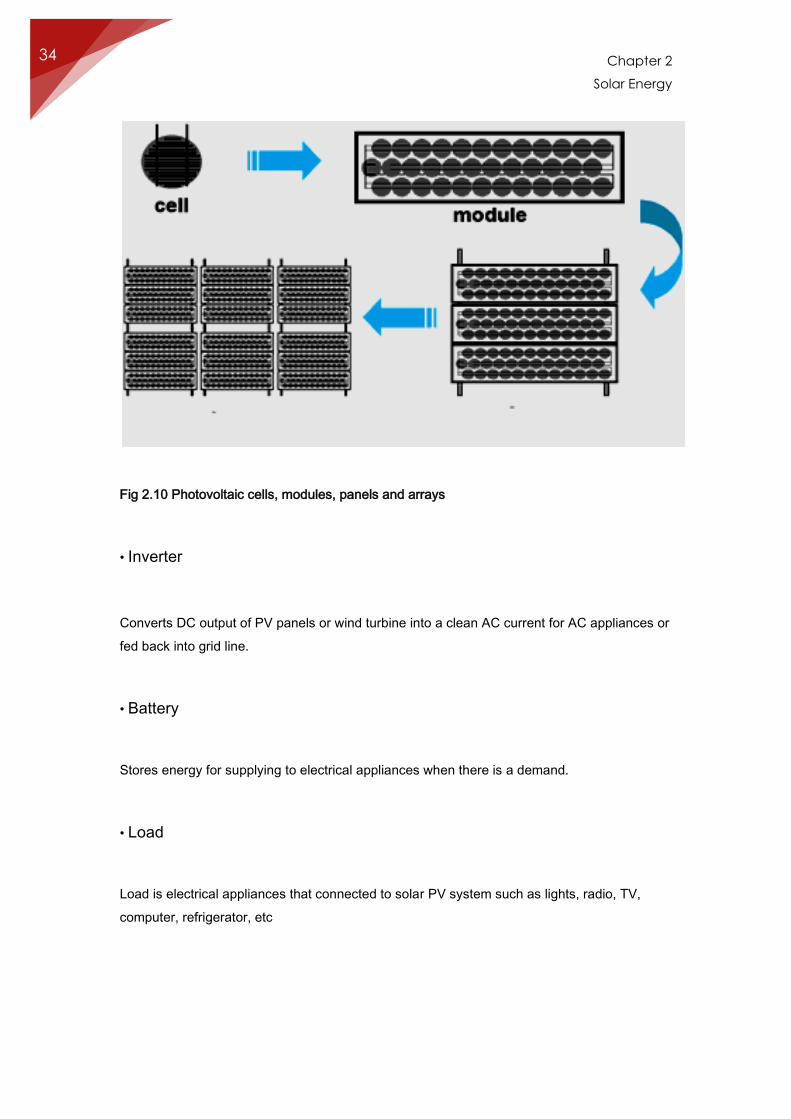
Cells, modules, arrays
Photovoltaic cells are connected electrically in series and/or parallel circuits to produce higher
voltages, currents and power levels. Photovoltaic modules consist of PV cell circuits sealed in
an environmentally protective laminate, and are the fundamental building blocks of PV
PV Tracking System 33
systems. Photovoltaic panels include one or more PV modules assembled as a pre-wired,
field-installable unit. Photovoltaic array is the complete power generating unit, consisting of
any number of PV modules and panels.
Fig (2.9b) effect of temperature on power &voltage of PV.
The performance of PV modules and arrays are generally rated according to their maximum
DC power output (watts) under Standard Test Conditions (STC). Standard Test Conditions
are defined by a module (cell) operating temperature of 25o C (77o F), and incident solar
irradiance level of 1000 W/m2 and under Air Mass 1.5 spectral distribution. Since these
conditions are not always typical of how PV modules and arrays operate in the field, actual
performance is usually 85 to 90 percent of the STC rating.
Today’s photovoltaic modules are extremely safe and reliable products, with minimal failure
rates and projected service lifetimes of 20 to 30 years. Most major manufacturers offer
warranties of 20 or more years for maintaining a high percentage of initial rated power output.
When selecting PV modules, look for the product listing (UL), qualification testing and
warranty information in the module manufacturer’s specifications.
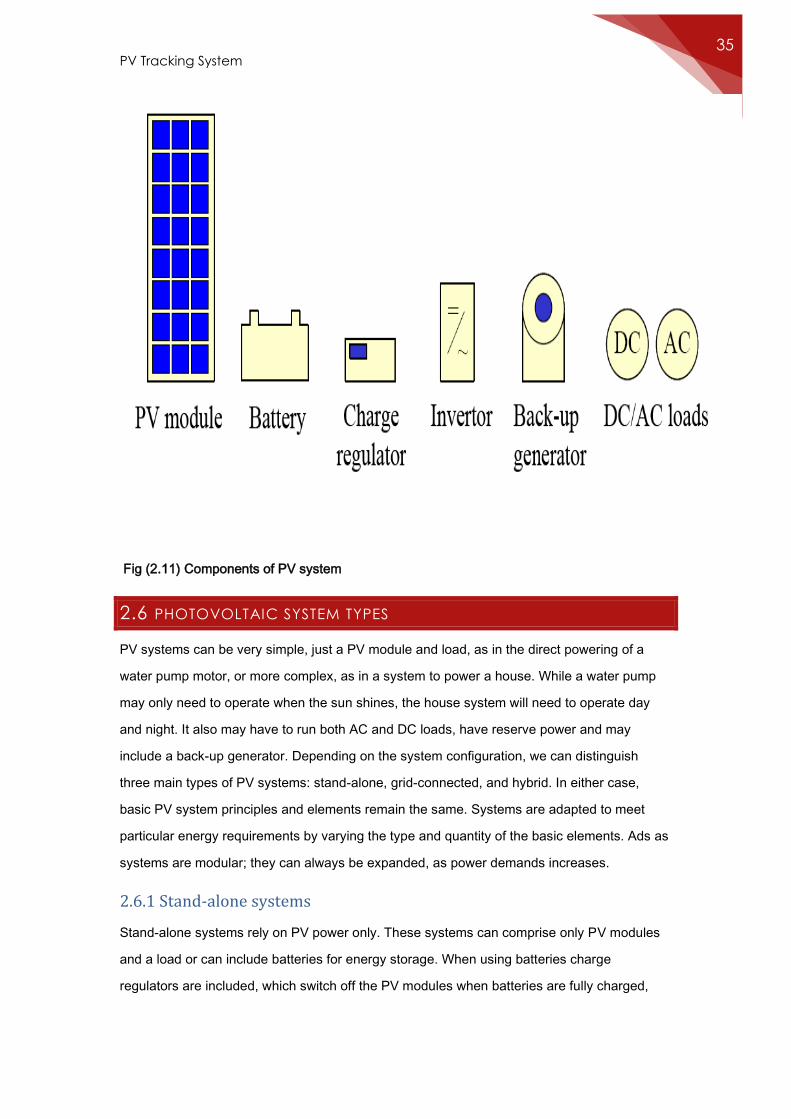
Related equipment
• Solar charge controller
Regulates the voltage and current coming from the PV panels going to battery and prevents
battery overcharging and prolongs the battery life.
Chapter 2
Solar Energy
34
Fig 2.10 Photovoltaic cells, modules, panels and arrays
• Inverter
Converts DC output of PV panels or wind turbine into a clean AC current for AC appliances or
fed back into grid line.
• Battery
Stores energy for supplying to electrical appliances when there is a demand.
• Load
Load is electrical appliances that connected to solar PV system such as lights, radio, TV,
computer, refrigerator, etc
PV Tracking System 35
Fig (2.11) Components of PV system
2.6 PHOTOVOLTAIC SYSTEM TYPES
PV systems can be very simple, just a PV module and load, as in the direct powering of a
water pump motor, or more complex, as in a system to power a house. While a water pump
may only need to operate when the sun shines, the house system will need to operate day
and night. It also may have to run both AC and DC loads, have reserve power and may
include a back-up generator. Depending on the system configuration, we can distinguish
three main types of PV systems: stand-alone, grid-connected, and hybrid. In either case,
basic PV system principles and elements remain the same. Systems are adapted to meet
particular energy requirements by varying the type and quantity of the basic elements. Ads as
systems are modular; they can always be expanded, as power demands increases.
2.6.1 Stand-alone systems
Stand-alone systems rely on PV power only. These systems can comprise only PV modules
and a load or can include batteries for energy storage. When using batteries charge
regulators are included, which switch off the PV modules when batteries are fully charged,
Chapter 2
Solar Energy
36
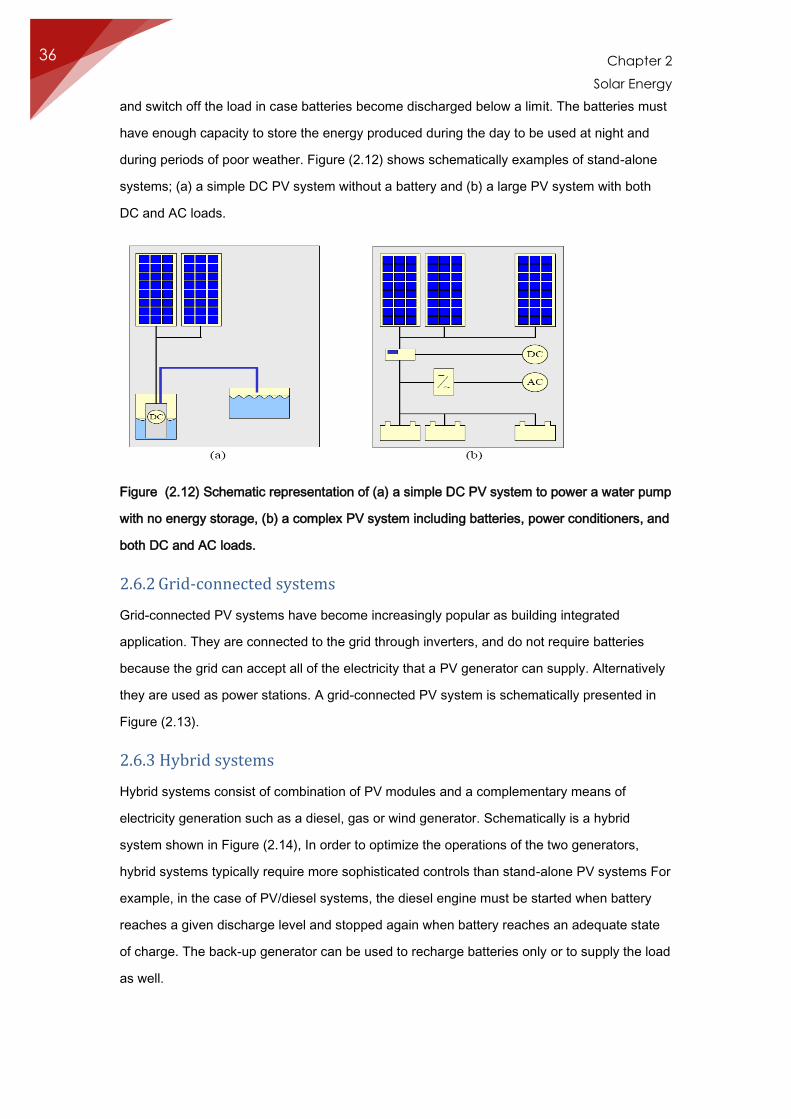
and switch off the load in case batteries become discharged below a limit. The batteries must
have enough capacity to store the energy produced during the day to be used at night and
during periods of poor weather. Figure (2.12) shows schematically examples of stand-alone
systems; (a) a simple DC PV system without a battery and (b) a large PV system with both
DC and AC loads.
Figure (2.12) Schematic representation of (a) a simple DC PV system to power a water pump
with no energy storage, (b) a complex PV system including batteries, power conditioners, and
both DC and AC loads.
2.6.2 Grid-connected systems
Grid-connected PV systems have become increasingly popular as building integrated
application. They are connected to the grid through inverters, and do not require batteries
because the grid can accept all of the electricity that a PV generator can supply. Alternatively
they are used as power stations. A grid-connected PV system is schematically presented in
Figure (2.13).
2.6.3 Hybrid systems
Hybrid systems consist of combination of PV modules and a complementary means of
electricity generation such as a diesel, gas or wind generator. Schematically is a hybrid
system shown in Figure (2.14), In order to optimize the operations of the two generators,
hybrid systems typically require more sophisticated controls than stand-alone PV systems For
example, in the case of PV/diesel systems, the diesel engine must be started when battery
reaches a given discharge level and stopped again when battery reaches an adequate state
of charge. The back-up generator can be used to recharge batteries only or to supply the load
as well.
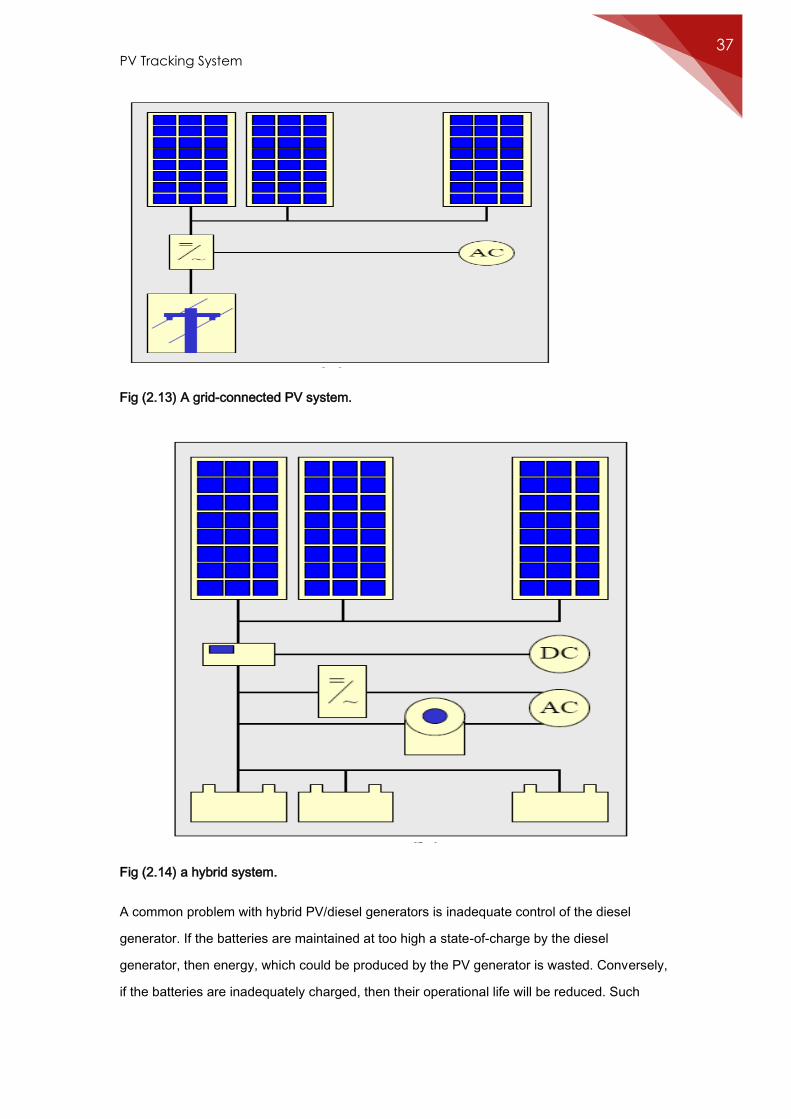
PV Tracking System 37
Fig (2.13) A grid-connected PV system.
Fig (2.14) a hybrid system.
A common problem with hybrid PV/diesel generators is inadequate control of the diesel
generator. If the batteries are maintained at too high a state-of-charge by the diesel
generator, then energy, which could be produced by the PV generator is wasted. Conversely,
if the batteries are inadequately charged, then their operational life will be reduced. Such
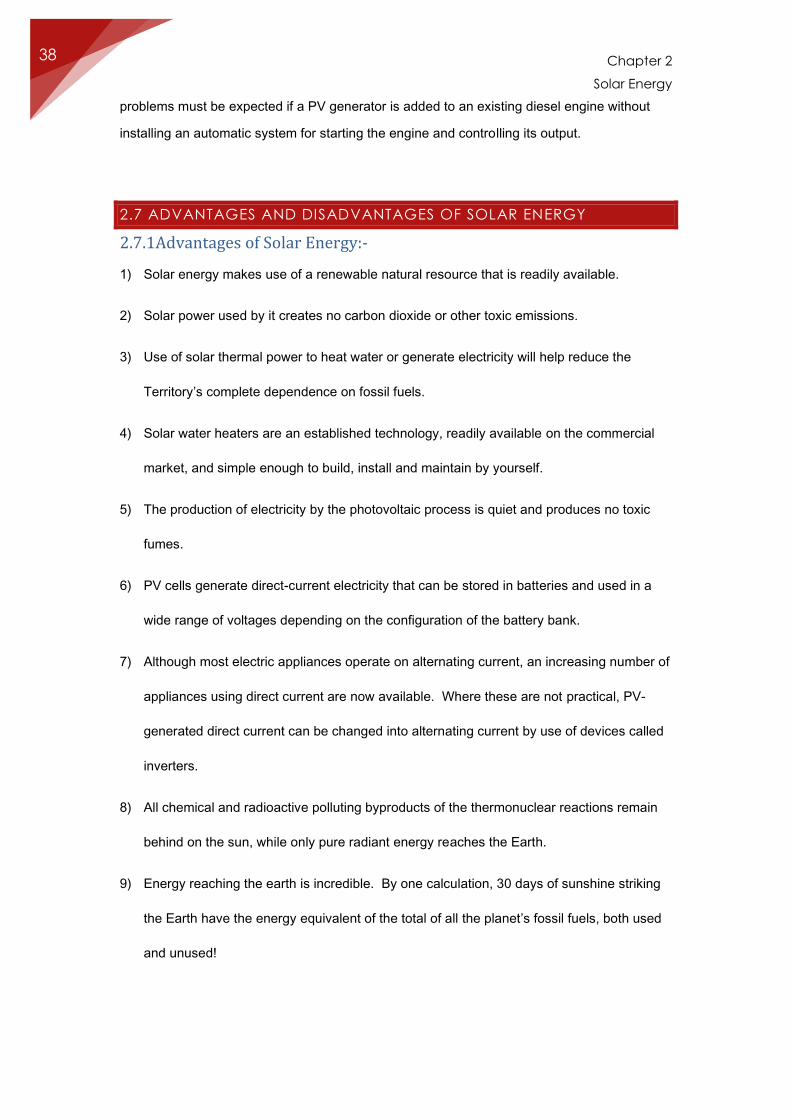
Chapter 2
Solar Energy
38
problems must be expected if a PV generator is added to an existing diesel engine without
installing an automatic system for starting the engine and controlling its output.
2.7 ADVANTAGES AND DISADVANTAGES OF SOLAR ENERGY
2.7.1Advantages of Solar Energy:-
1) Solar energy makes use of a renewable natural resource that is readily available.
2) Solar power used by it creates no carbon dioxide or other toxic emissions.
3) Use of solar thermal power to heat water or generate electricity will help reduce the
Territory’s complete dependence on fossil fuels.
4) Solar water heaters are an established technology, readily available on the commercial
market, and simple enough to build, install and maintain by yourself.
5) The production of electricity by the photovoltaic process is quiet and produces no toxic
fumes.
6) PV cells generate direct-current electricity that can be stored in batteries and used in a
wide range of voltages depending on the configuration of the battery bank.
7) Although most electric appliances operate on alternating current, an increasing number of
appliances using direct current are now available. Where these are not practical, PV-
generated direct current can be changed into alternating current by use of devices called
inverters.
8) All chemical and radioactive polluting byproducts of the thermonuclear reactions remain
behind on the sun, while only pure radiant energy reaches the Earth.
9) Energy reaching the earth is incredible. By one calculation, 30 days of sunshine striking
the Earth have the energy equivalent of the total of all the planet’s fossil fuels, both used
and unused!
PV Tracking System 39
2.7.2 Disadvantages of Solar Energy:-
1) Solar thermal systems are not cost-effective in areas that have long periods of cloudy
weather or short daylight hours.
2) The arrays of collecting devices for large systems cover extensive land areas.
3) Photovoltaic-produced electricity is presently more expensive than power supplied by
utilities.
4) Batteries need periodic maintenance and replacement.
5) High voltage direct-current electricity can pose safety hazards to inadequately trained
home operators or utility personnel.
6) Sun does not shine consistently.
7) Solar energy is a diffuse source. To harness it, we must concentrate it into an
amount and form that we can use, such as heat and electricity.
8) Addressed by approaching the problem through:
9) Collection, 2) conversion, 3) storage
10) Efficiency is far less than the 77% of solar spectrum with usable wavelengths.
11) 43% of photon energy is used to warm the crystal.
12) Efficiency drops as temperature increases (from 24% at 0°C to 14% at 100°C.)
13) Light is reflected off the front face and internal electrical resistances are other factors.
14) Overall, the efficiency is about 10-14%.
15) Cost of electricity from coal-burning plants is anywhere b/w 8-20 cents/kWh, while
photovoltaic power generation is anywhere b/w $0.50-1/kWh.
16) Does not reflect the true costs of burning coal and its emissions to the nonpolluting
method of the latter.
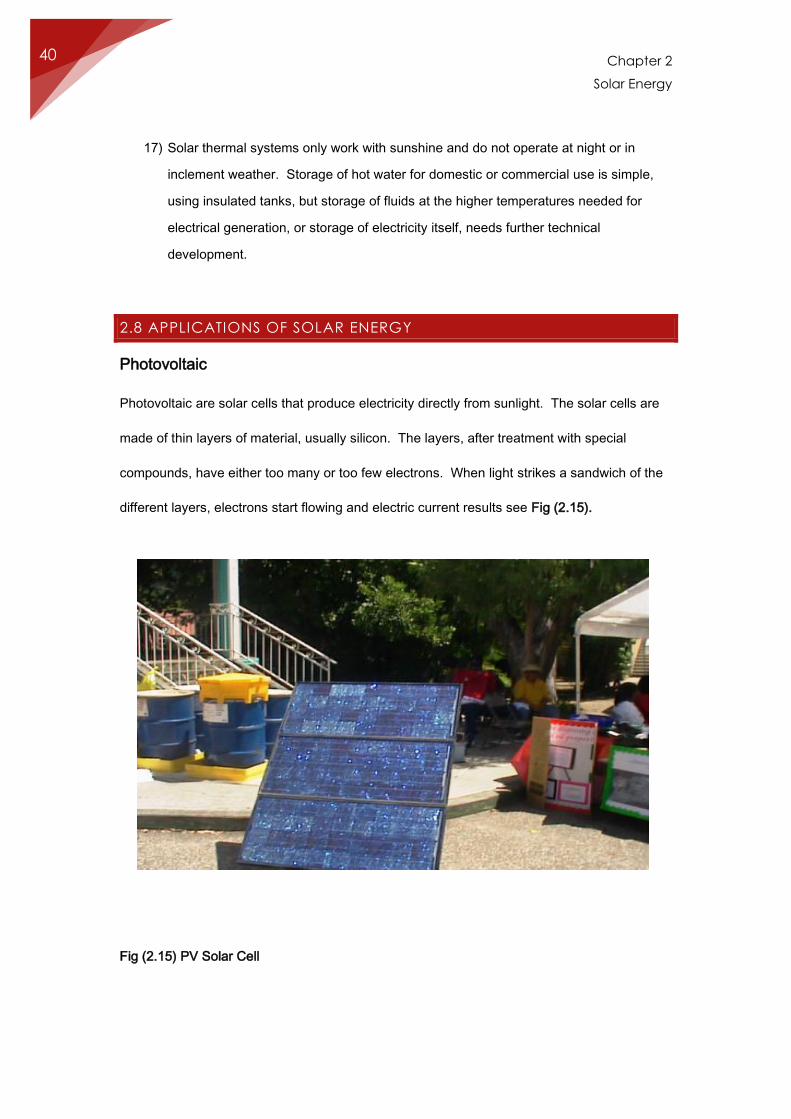
Chapter 2
Solar Energy
40
17) Solar thermal systems only work with sunshine and do not operate at night or in
inclement weather. Storage of hot water for domestic or commercial use is simple,
using insulated tanks, but storage of fluids at the higher temperatures needed for
electrical generation, or storage of electricity itself, needs further technical
development.
2.8 APPLICATIONS OF SOLAR ENERGY
Photovoltaic
Photovoltaic are solar cells that produce electricity directly from sunlight. The solar cells are
made of thin layers of material, usually silicon. The layers, after treatment with special
compounds, have either too many or too few electrons. When light strikes a sandwich of the
different layers, electrons start flowing and electric current results see Fig (2.15).
Fig (2.15) PV Solar Cell
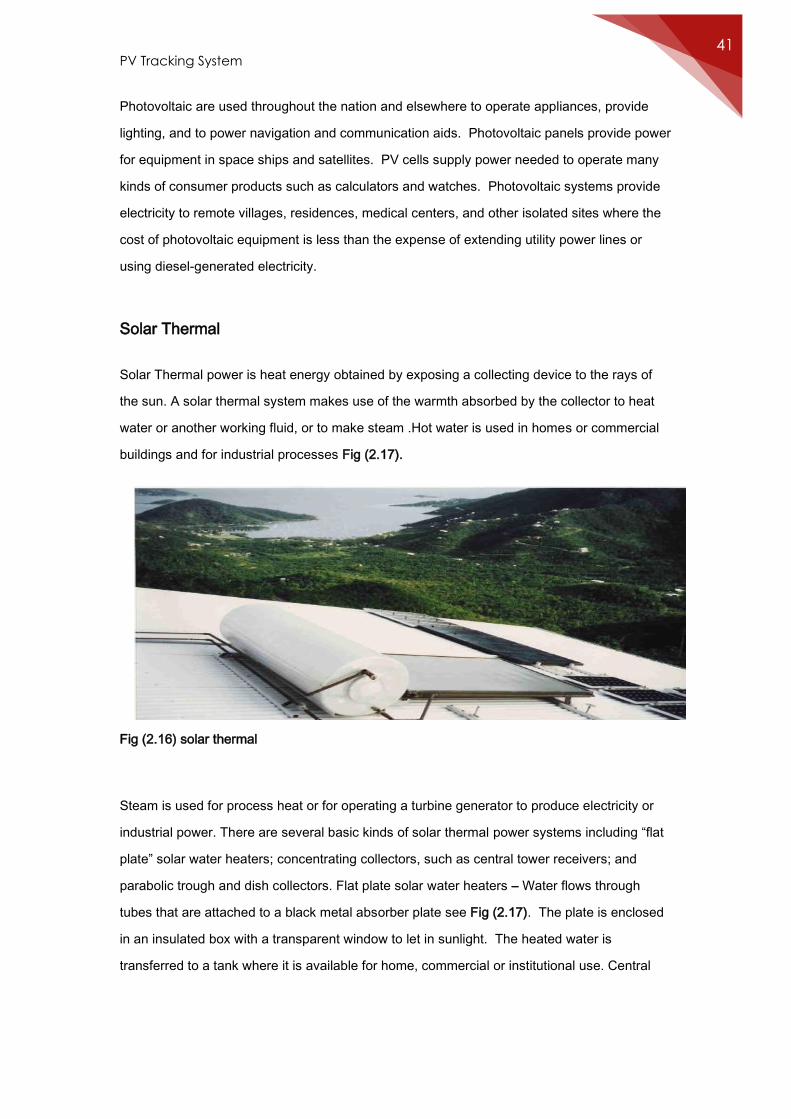
PV Tracking System 41
Photovoltaic are used throughout the nation and elsewhere to operate appliances, provide
lighting, and to power navigation and communication aids. Photovoltaic panels provide power
for equipment in space ships and satellites. PV cells supply power needed to operate many
kinds of consumer products such as calculators and watches. Photovoltaic systems provide
electricity to remote villages, residences, medical centers, and other isolated sites where the
cost of photovoltaic equipment is less than the expense of extending utility power lines or
using diesel-generated electricity.
Solar Thermal
Solar Thermal power is heat energy obtained by exposing a collecting device to the rays of
the sun. A solar thermal system makes use of the warmth absorbed by the collector to heat
water or another working fluid, or to make steam .Hot water is used in homes or commercial
buildings and for industrial processes Fig (2.17).
Fig (2.16) solar thermal
Steam is used for process heat or for operating a turbine generator to produce electricity or
industrial power. There are several basic kinds of solar thermal power systems including “flat
plate” solar water heaters; concentrating collectors, such as central tower receivers; and
parabolic trough and dish collectors. Flat plate solar water heaters – Water flows through
tubes that are attached to a black metal absorber plate see Fig (2.17). The plate is enclosed
in an insulated box with a transparent window to let in sunlight. The heated water is
transferred to a tank where it is available for home, commercial or institutional use. Central
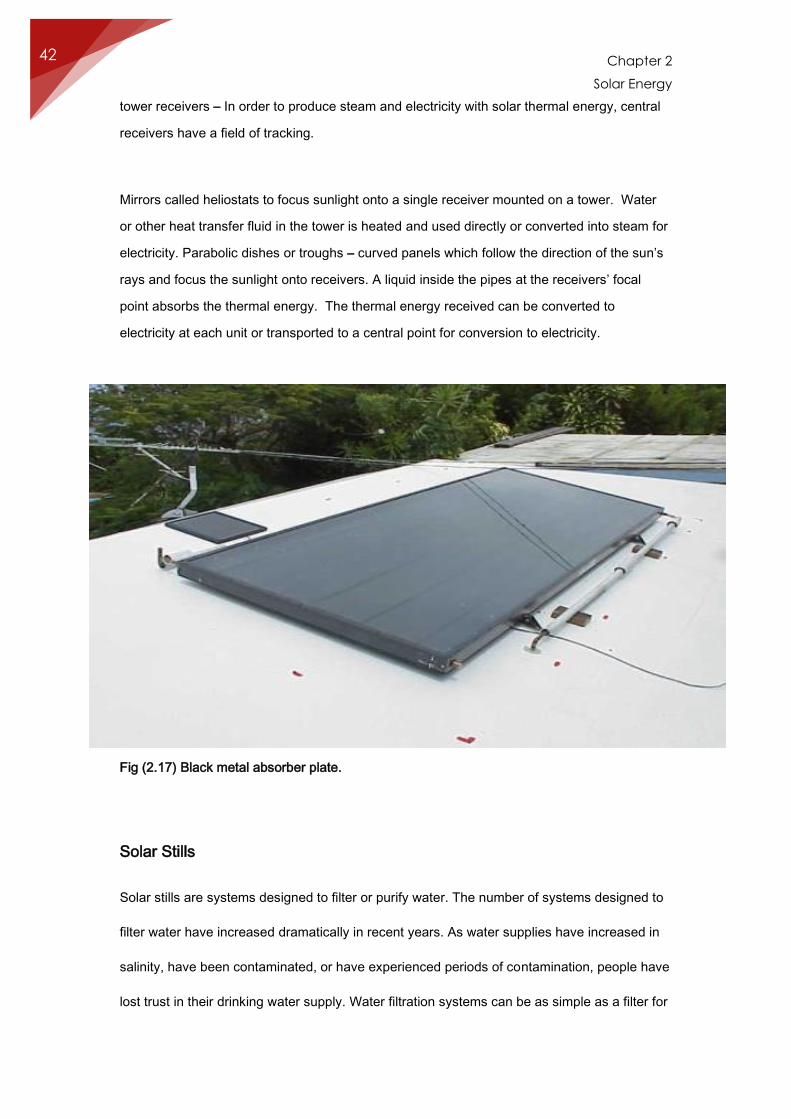
Chapter 2
Solar Energy
42
tower receivers – In order to produce steam and electricity with solar thermal energy, central
receivers have a field of tracking.
Mirrors called heliostats to focus sunlight onto a single receiver mounted on a tower. Water
or other heat transfer fluid in the tower is heated and used directly or converted into steam for
electricity. Parabolic dishes or troughs – curved panels which follow the direction of the sun’s
rays and focus the sunlight onto receivers. A liquid inside the pipes at the receivers’ focal
point absorbs the thermal energy. The thermal energy received can be converted to
electricity at each unit or transported to a central point for conversion to electricity.
Fig (2.17) Black metal absorber plate.
Solar Stills
Solar stills are systems designed to filter or purify water. The number of systems designed to
filter water have increased dramatically in recent years. As water supplies have increased in
salinity, have been contaminated, or have experienced periods of contamination, people have
lost trust in their drinking water supply. Water filtration systems can be as simple as a filter for
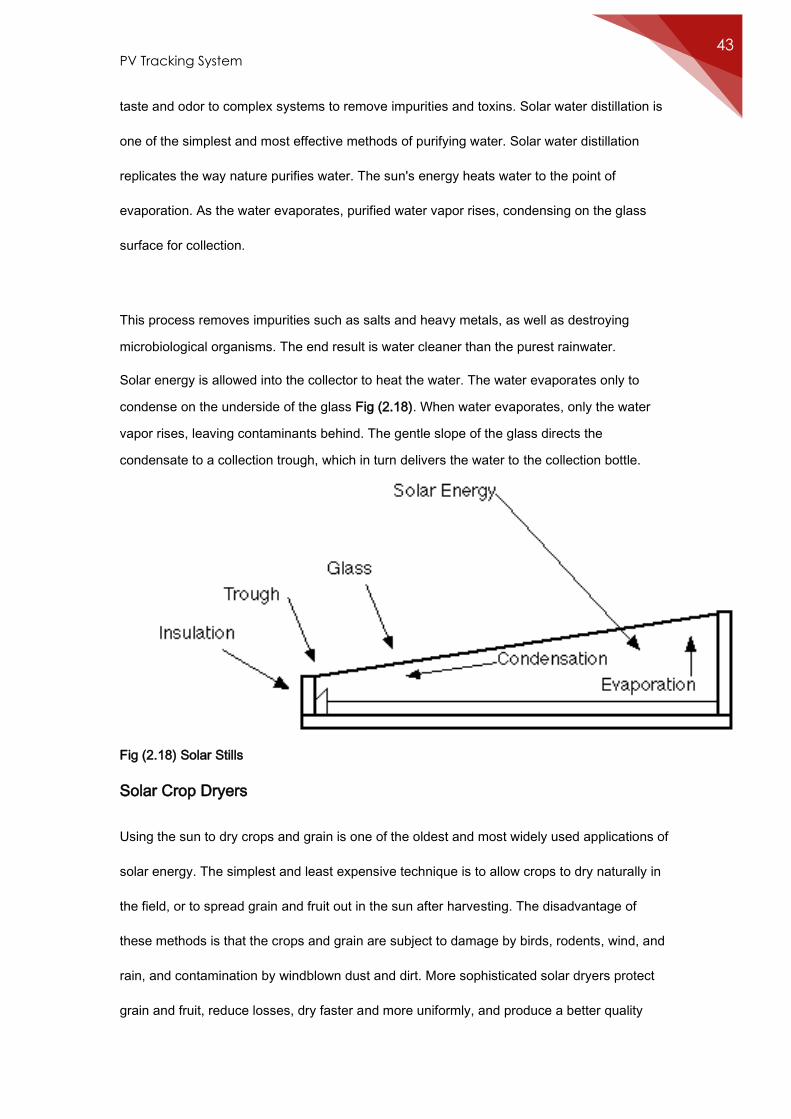
PV Tracking System 43
taste and odor to complex systems to remove impurities and toxins. Solar water distillation is
one of the simplest and most effective methods of purifying water. Solar water distillation
replicates the way nature purifies water. The sun's energy heats water to the point of
evaporation. As the water evaporates, purified water vapor rises, condensing on the glass
surface for collection.
This process removes impurities such as salts and heavy metals, as well as destroying
microbiological organisms. The end result is water cleaner than the purest rainwater.
Solar energy is allowed into the collector to heat the water. The water evaporates only to
condense on the underside of the glass Fig (2.18). When water evaporates, only the water
vapor rises, leaving contaminants behind. The gentle slope of the glass directs the
condensate to a collection trough, which in turn delivers the water to the collection bottle.
Fig (2.18) Solar Stills
Solar Crop Dryers
Using the sun to dry crops and grain is one of the oldest and most widely used applications of
solar energy. The simplest and least expensive technique is to allow crops to dry naturally in
the field, or to spread grain and fruit out in the sun after harvesting. The disadvantage of
these methods is that the crops and grain are subject to damage by birds, rodents, wind, and
rain, and contamination by windblown dust and dirt. More sophisticated solar dryers protect
grain and fruit, reduce losses, dry faster and more uniformly, and produce a better quality
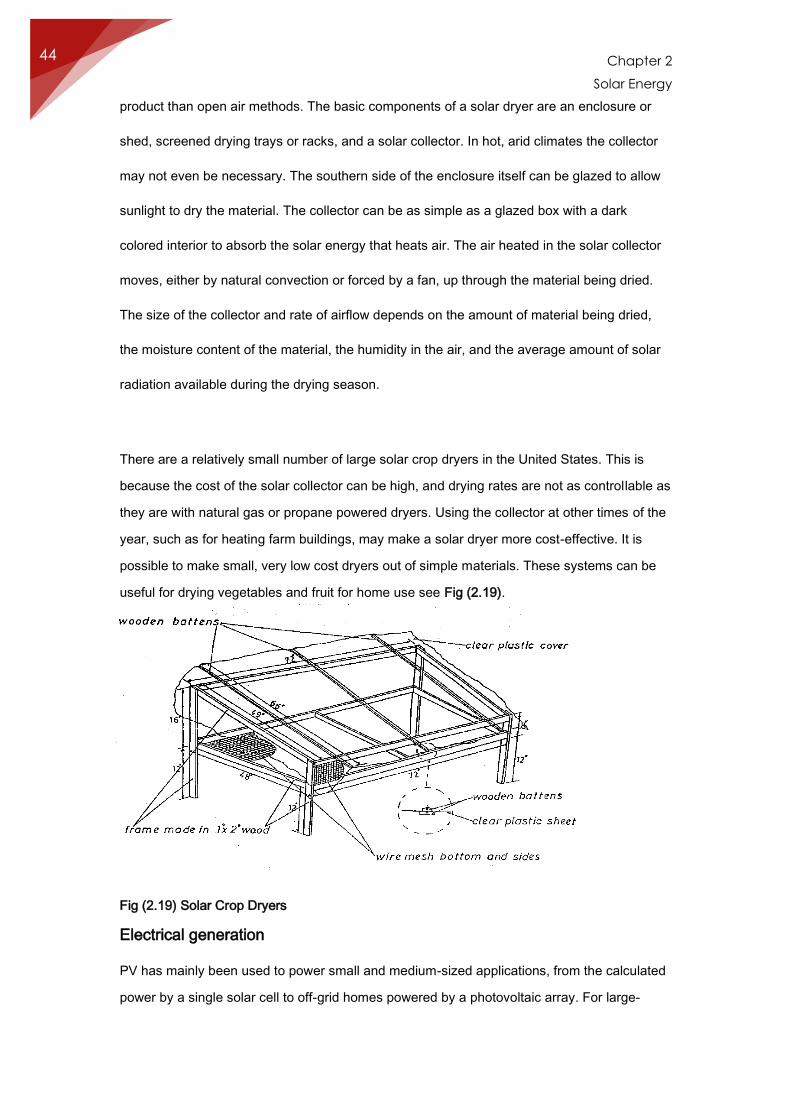
Chapter 2
Solar Energy
44
product than open air methods. The basic components of a solar dryer are an enclosure or
shed, screened drying trays or racks, and a solar collector. In hot, arid climates the collector
may not even be necessary. The southern side of the enclosure itself can be glazed to allow
sunlight to dry the material. The collector can be as simple as a glazed box with a dark
colored interior to absorb the solar energy that heats air. The air heated in the solar collector
moves, either by natural convection or forced by a fan, up through the material being dried.
The size of the collector and rate of airflow depends on the amount of material being dried,
the moisture content of the material, the humidity in the air, and the average amount of solar
radiation available during the drying season.
There are a relatively small number of large solar crop dryers in the United States. This is
because the cost of the solar collector can be high, and drying rates are not as controllable as
they are with natural gas or propane powered dryers. Using the collector at other times of the
year, such as for heating farm buildings, may make a solar dryer more cost-effective. It is
possible to make small, very low cost dryers out of simple materials. These systems can be
useful for drying vegetables and fruit for home use see Fig (2.19).
Fig (2.19) Solar Crop Dryers
Electrical generation
PV has mainly been used to power small and medium-sized applications, from the calculated
power by a single solar cell to off-grid homes powered by a photovoltaic array. For large-
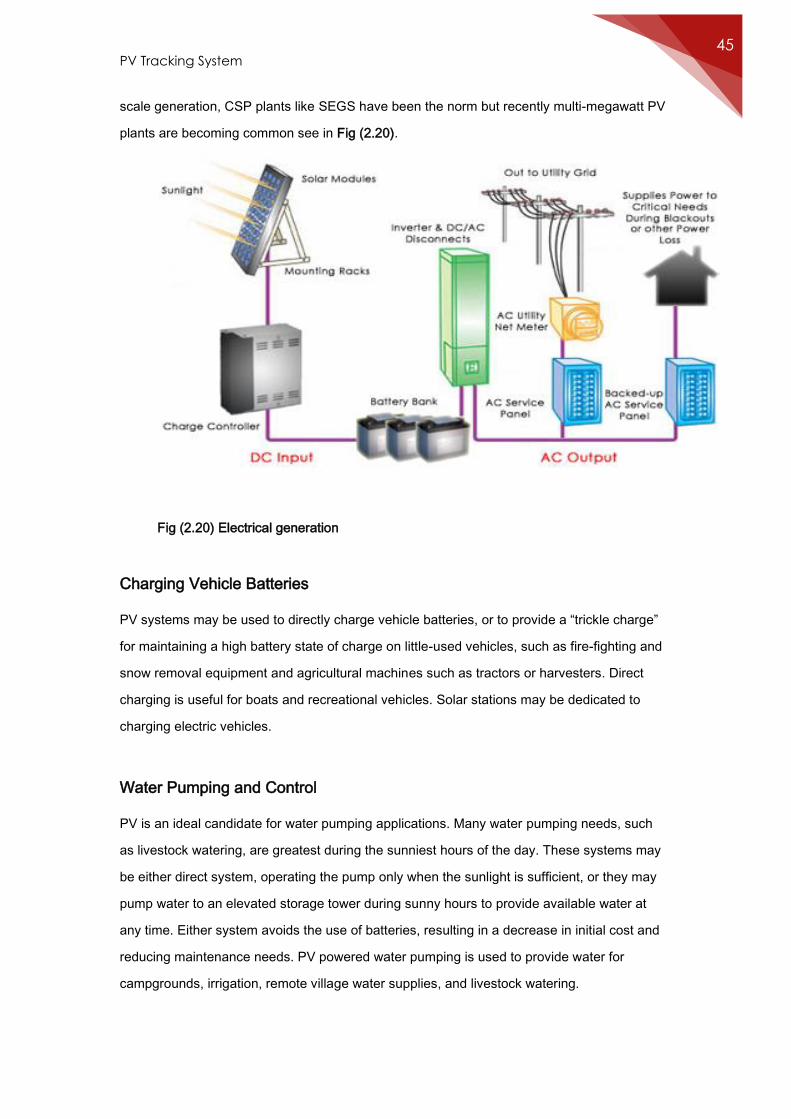
PV Tracking System 45
scale generation, CSP plants like SEGS have been the norm but recently multi-megawatt PV
plants are becoming common see in Fig (2.20).
Fig (2.20) Electrical generation
Charging Vehicle Batteries
PV systems may be used to directly charge vehicle batteries, or to provide a “trickle charge”
for maintaining a high battery state of charge on little-used vehicles, such as fire-fighting and
snow removal equipment and agricultural machines such as tractors or harvesters. Direct
charging is useful for boats and recreational vehicles. Solar stations may be dedicated to
charging electric vehicles.
Water Pumping and Control
PV is an ideal candidate for water pumping applications. Many water pumping needs, such
as livestock watering, are greatest during the sunniest hours of the day. These systems may
be either direct system, operating the pump only when the sunlight is sufficient, or they may
pump water to an elevated storage tower during sunny hours to provide available water at
any time. Either system avoids the use of batteries, resulting in a decrease in initial cost and
reducing maintenance needs. PV powered water pumping is used to provide water for
campgrounds, irrigation, remote village water supplies, and livestock watering.
Chapter 2
Solar Energy
46
Communications
Radio, television, and phone signals over long distances need to be amplified. Relay towers,
often called repeater stations, perform this function. The best sites for repeater stations are
usually at the highest possible elevation, where power lines are not commonly found and
transport of conventional generator fuels would be difficult and costly. In addition, as the use
of fiber optic cable spreads, photovoltaic repeater stations will be required. Coaxial cable can
carry power to amplify the signal carried, but fiber optic cable does not have this capability.
PV also is used on travelers’ information transmitters, portable computer systems, cellular
telephones, mobile radio systems, and emergency call boxes.
Solar Water Heater
There are two categories for solar water heaters: an electric or propane-powered backup
heater and a total solar hot water system that operates strictly on solar energy.
The backup heater kicks in when there is not enough solar energy to heat water to a pre-set
temperature, but it burns propane or expends grid electricity. In a solar hot water system, a
solar controller activates a solar-powered pump that brings water to a roof-mounted collector
that holds the water in sunlight until it heats; the heated water circulates to an insulated
holding tank for household use. If there is not sufficient sunlight to heat the water in the
collector, the solar controller sends it via gravity to a drain-back tank to ensure the water will
not freeze in the collector and damage it.
By using solar energy to heat your household water, you save money on your energy bill and
emit no greenhouse gasses.
Chapter 3
Tracking System
48
CHAPTER 3
TRACKING SYSTEM
3.1 INTRODUCTION
The increasing demand for energy, the continuous reduction in existing sources of fossil fuels
and the growing concern regarding environment pollution, have pushed mankind to explore
new technologies for the production of electrical energy using clean, renewable sources, such
as solar energy, wind energy, etc.
Among the non-conventional, renewable energy sources, solar energy affords great potential
for conversion into electric power, able to ensure an important part of the electrical energy
needs of the planet.
The conversion of solar light into electrical energy represents one of the most promising and
challenging energetic technologies, in continuous development, being clean, silent and
reliable, with very low maintenance costs and minimal ecological impact. Solar energy is free,
practically inexhaustible, and involves no polluting residues or greenhouse gases emissions.
The conversion principle of solar light into electricity, called Photo-Voltaic or PV conversion, is
not very new, but the efficiency improvement of the PV conversion equipment is still one of
top priorities for many academic and/or industrial research groups all over the world.
Among the proposed solutions for improving the efficiency of PV conversion, we can mention
solar tracking, the optimization of solar cell configuration and geometry, new materials and
technologies, etc.
The global market for PV conversion equipment has shown an exponential increase over the
last years, showing a good tendency for the years to come.
Physically, a PV panel consists of a flat surface on which numerous p-n junctions are placed,
connected together through electrically conducting strips. The PV panel ensures the
conversion of light radiation into electricity and it is characterized by a strong dependence of
the output power on the incident light radiation.
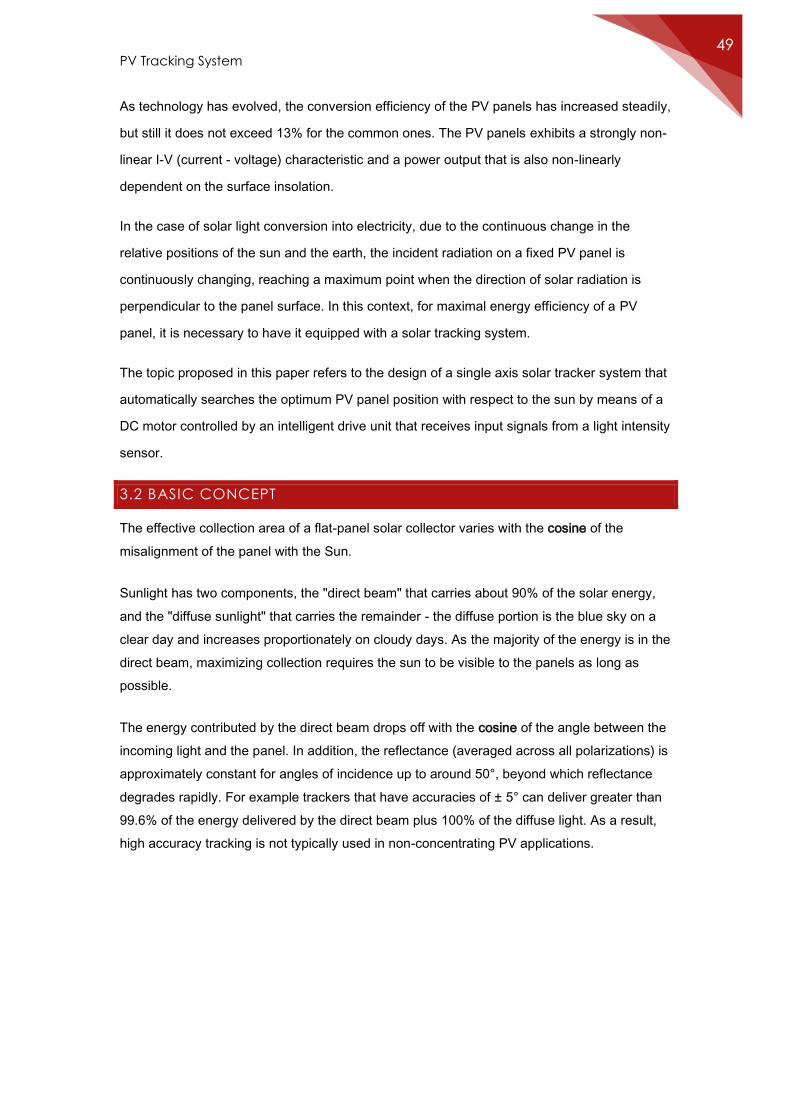
PV Tracking System 49
As technology has evolved, the conversion efficiency of the PV panels has increased steadily,
but still it does not exceed 13% for the common ones. The PV panels exhibits a strongly non-
linear I-V (current - voltage) characteristic and a power output that is also non-linearly
dependent on the surface insolation.
In the case of solar light conversion into electricity, due to the continuous change in the
relative positions of the sun and the earth, the incident radiation on a fixed PV panel is
continuously changing, reaching a maximum point when the direction of solar radiation is
perpendicular to the panel surface. In this context, for maximal energy efficiency of a PV
panel, it is necessary to have it equipped with a solar tracking system.
The topic proposed in this paper refers to the design of a single axis solar tracker system that
automatically searches the optimum PV panel position with respect to the sun by means of a
DC motor controlled by an intelligent drive unit that receives input signals from a light intensity
sensor.
3.2 BASIC CONCEPT
The effective collection area of a flat-panel solar collector varies with the cosine of the
misalignment of the panel with the Sun.
Sunlight has two components, the "direct beam" that carries about 90% of the solar energy,
and the "diffuse sunlight" that carries the remainder - the diffuse portion is the blue sky on a
clear day and increases proportionately on cloudy days. As the majority of the energy is in the
direct beam, maximizing collection requires the sun to be visible to the panels as long as
possible.
The energy contributed by the direct beam drops off with the cosine of the angle between the
incoming light and the panel. In addition, the reflectance (averaged across all polarizations) is
approximately constant for angles of incidence up to around 50°, beyond which reflectance
degrades rapidly. For example trackers that have accuracies of ± 5° can deliver greater than
99.6% of the energy delivered by the direct beam plus 100% of the diffuse light. As a result,
high accuracy tracking is not typically used in non-concentrating PV applications.
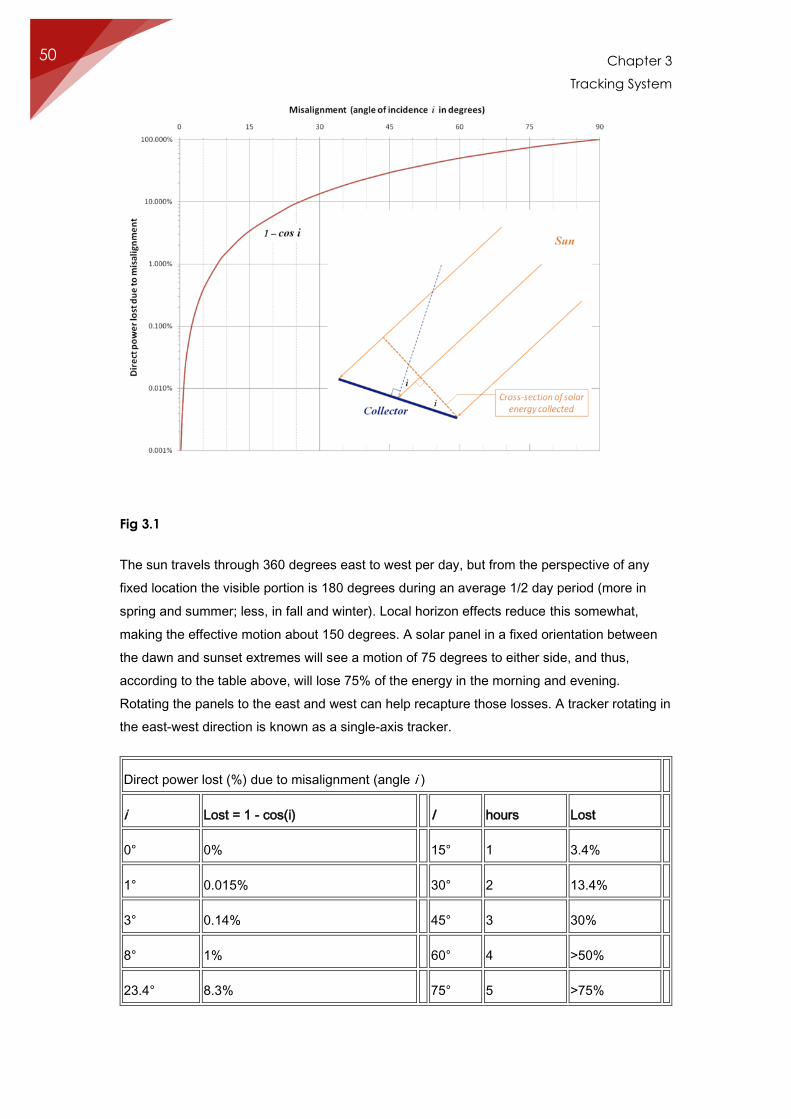
Chapter 3
Tracking System
50
Fig 3.1
The sun travels through 360 degrees east to west per day, but from the perspective of any
fixed location the visible portion is 180 degrees during an average 1/2 day period (more in
spring and summer; less, in fall and winter). Local horizon effects reduce this somewhat,
making the effective motion about 150 degrees. A solar panel in a fixed orientation between
the dawn and sunset extremes will see a motion of 75 degrees to either side, and thus,
according to the table above, will lose 75% of the energy in the morning and evening.
Rotating the panels to the east and west can help recapture those losses. A tracker rotating in
the east-west direction is known as a single-axis tracker.
Direct power lost (%) due to misalignment (angle i )
i Lost = 1 - cos(i) I hours Lost
0° 0% 15° 1 3.4%
1° 0.015% 30° 2 13.4%
3° 0.14% 45° 3 30%
8° 1% 60° 4 >50%
23.4° 8.3% 75° 5 >75%
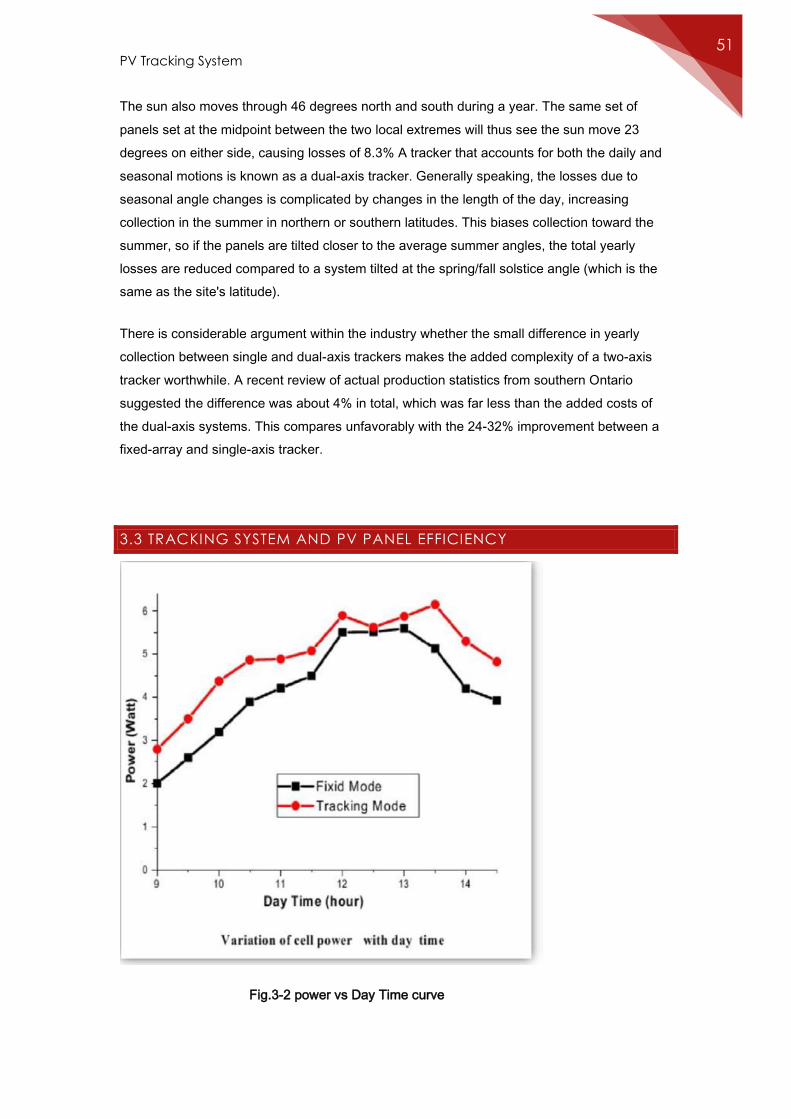
PV Tracking System 51
The sun also moves through 46 degrees north and south during a year. The same set of
panels set at the midpoint between the two local extremes will thus see the sun move 23
degrees on either side, causing losses of 8.3% A tracker that accounts for both the daily and
seasonal motions is known as a dual-axis tracker. Generally speaking, the losses due to
seasonal angle changes is complicated by changes in the length of the day, increasing
collection in the summer in northern or southern latitudes. This biases collection toward the
summer, so if the panels are tilted closer to the average summer angles, the total yearly
losses are reduced compared to a system tilted at the spring/fall solstice angle (which is the
same as the site's latitude).
There is considerable argument within the industry whether the small difference in yearly
collection between single and dual-axis trackers makes the added complexity of a two-axis
tracker worthwhile. A recent review of actual production statistics from southern Ontario
suggested the difference was about 4% in total, which was far less than the added costs of
the dual-axis systems. This compares unfavorably with the 24-32% improvement between a
fixed-array and single-axis tracker.
3.3 TRACKING SYSTEM AND PV PANEL EFFICIENCY
Fig.3-2 power vs Day Time curve
Chapter 3
Tracking System
52
Compared to a fixed panel, a mobile PV panel driven by a solar tracker is kept under the best
possible insolation for all positions of the Sun, as the light falls close to the geometric normal
incidence angle. Automatic solar tracking systems (using light intensity sensing) may boost
consistently the conversion efficiency of a PV panel, thus in this way deriving more energy
from the sun. Technical reports in the USA have shown solar tracking to be particularly
effective in summer, when the increases in output energy may reach over 50%, while in
autumn they may be higher than 20%, depending on the technology used Fig.3-2 . Solar
tracking systems are of several types and can be classified according to several criteria. A
first classification can be made depending on the number of rotation axes. Thus we can
distinguish solar tracking systems with a rotation axis, respectively with two rotation axes.
Since solar tracking implies moving parts and control systems that tend to be expensive,
single-axis tracking systems seem to be the best solution for small PV power plants. Single
axis trackers will usually have a manual elevation (axis tilt) adjustment on the second axis
which is adjusted at regular intervals throughout the year.
3.4 TYPES OF TRACKERS
3.4.1 SINGLE AXIS TRACKERS
Single axis trackers have one degree of freedom that acts as an axis of rotation. The axis of
rotation of single axis trackers is typically aligned along a true North meridian. It is possible to
align them in any cardinal direction with advanced tracking algorithms.
There are several common implementations of single axis trackers. These include horizontal
single axis trackers (HSAT), vertical single axis trackers (VSAT), tilted single axis trackers
(TSAT) and polar aligned single axis trackers (PSAT). The orientation of the module with
respect to the tracker axis is important when modeling performance.
3.4.1.1HORIZONTAL SINGLE AXIS TRACKER (HSAT)
The axis of rotation for horizontal single axis tracker is horizontal with respect to the ground.
The posts at either end of the axis of rotation of a horizontal single axis tracker can be shared
between trackers to lower the installation cost.
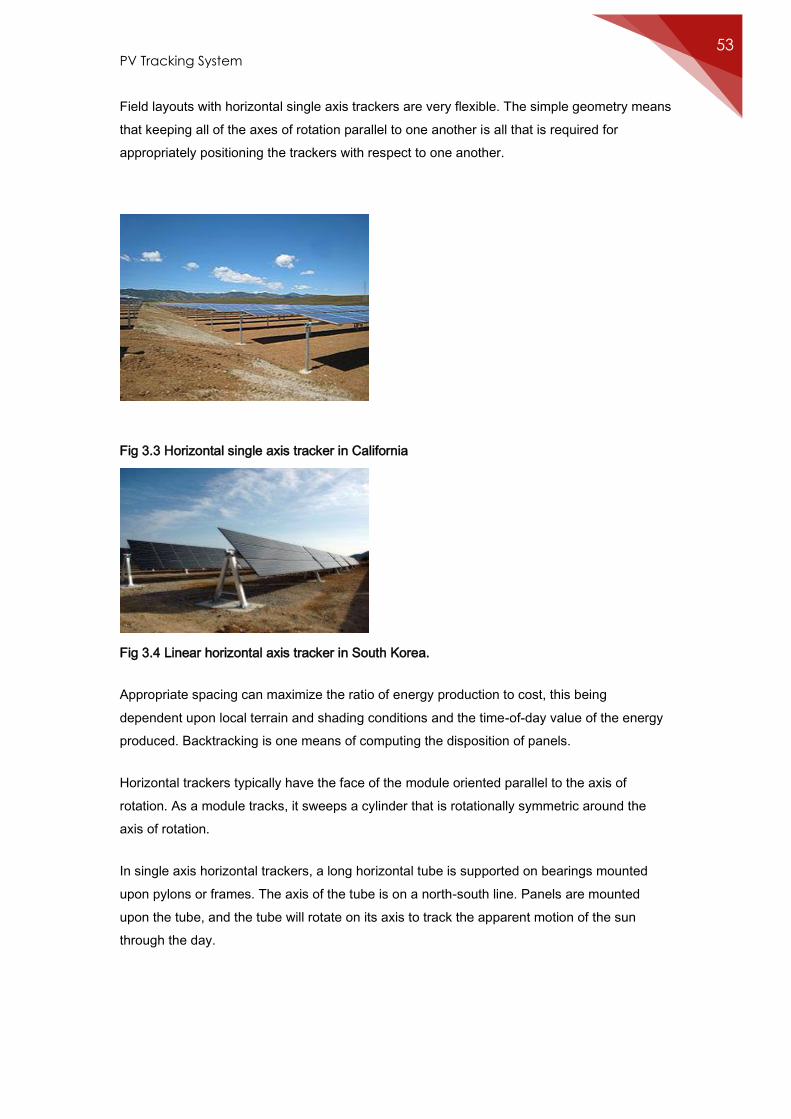
PV Tracking System 53
Field layouts with horizontal single axis trackers are very flexible. The simple geometry means
that keeping all of the axes of rotation parallel to one another is all that is required for
appropriately positioning the trackers with respect to one another.
Fig 3.3 Horizontal single axis tracker in California
Fig 3.4 Linear horizontal axis tracker in South Korea.
Appropriate spacing can maximize the ratio of energy production to cost, this being
dependent upon local terrain and shading conditions and the time-of-day value of the energy
produced. Backtracking is one means of computing the disposition of panels.
Horizontal trackers typically have the face of the module oriented parallel to the axis of
rotation. As a module tracks, it sweeps a cylinder that is rotationally symmetric around the
axis of rotation.
In single axis horizontal trackers, a long horizontal tube is supported on bearings mounted
upon pylons or frames. The axis of the tube is on a north-south line. Panels are mounted
upon the tube, and the tube will rotate on its axis to track the apparent motion of the sun
through the day.
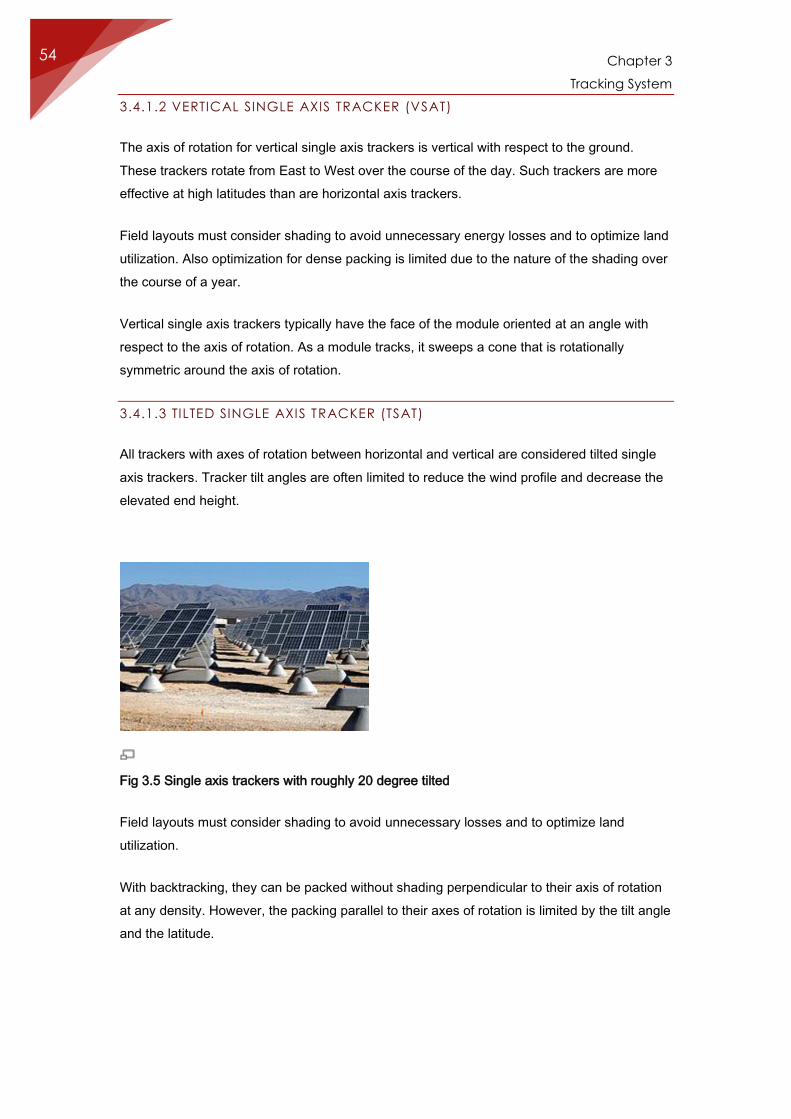
Chapter 3
Tracking System
54
3.4.1.2 VERTICAL SINGLE AXIS TRACKER (VSAT)
The axis of rotation for vertical single axis trackers is vertical with respect to the ground.
These trackers rotate from East to West over the course of the day. Such trackers are more
effective at high latitudes than are horizontal axis trackers.
Field layouts must consider shading to avoid unnecessary energy losses and to optimize land
utilization. Also optimization for dense packing is limited due to the nature of the shading over
the course of a year.
Vertical single axis trackers typically have the face of the module oriented at an angle with
respect to the axis of rotation. As a module tracks, it sweeps a cone that is rotationally
symmetric around the axis of rotation.
3.4.1.3 TILTED SINGLE AXIS TRACKER (TSAT)
All trackers with axes of rotation between horizontal and vertical are considered tilted single
axis trackers. Tracker tilt angles are often limited to reduce the wind profile and decrease the
elevated end height.
Fig 3.5 Single axis trackers with roughly 20 degree tilted
Field layouts must consider shading to avoid unnecessary losses and to optimize land
utilization.
With backtracking, they can be packed without shading perpendicular to their axis of rotation
at any density. However, the packing parallel to their axes of rotation is limited by the tilt angle
and the latitude.
PV Tracking System 55
Tilted single axis trackers typically have the face of the module oriented parallel to the axis of
rotation. As a module tracks, it sweeps a cylinder that is rotationally symmetric around the
axis of rotation.
3.4.1.4 POLAR ALIGNED SINGLE AXIS TRACKERS (PASAT)
This method is scientifically well known as the standard method of mounting a telescope
support structure. The tilted single axis is aligned to the polar star. It is therefore called a polar
aligned single axis tracker (PASAT). In this particular implementation of a tilted single axis
tracker, the tilt angle is equal to the site latitude. This aligns the tracker axis of rotation with
the earth’s axis of rotation.
3.4.2 DUAL AXIS TRACKERS
Dual axis trackers have two degrees of freedom that act as axes of rotation. These axes are
typically normal to one another. The axis that is fixed with respect to the ground can be
considered a primary axis. The axis that is referenced to the primary axis can be considered a
secondary axis.
There are several common implementations of dual axis trackers. They are classified by the
orientation of their primary axes with respect to the ground. Two common implementations
are tip-tilt dual axis trackers (TTDAT) and azimuth-altitude dual axis trackers (AADAT).
The orientation of the module with respect to the tracker axis is important when modeling
performance. Dual axis trackers typically have modules oriented parallel to the secondary
axis of rotation.
Dual axis trackers allow for optimum solar energy levels due to their ability to follow the sun
vertically and horizontally. No matter where the sun is in the sky, dual axis trackers are able to
angle themselves to be in direct contact with the sun.
3.4.2.1 TIP–TILT DUAL AXIS TRACKER (TTDAT)
A tip–tilt dual axis tracker is so-named because the panel array is mounted on the top of a
pole. Normally the east-west movement is driven by rotating the array around the top of the
pole. On top of the rotating bearing is a T- or H-shaped mechanism that provides vertical
rotation of the panels and provides the main mounting points for the array. The posts at either
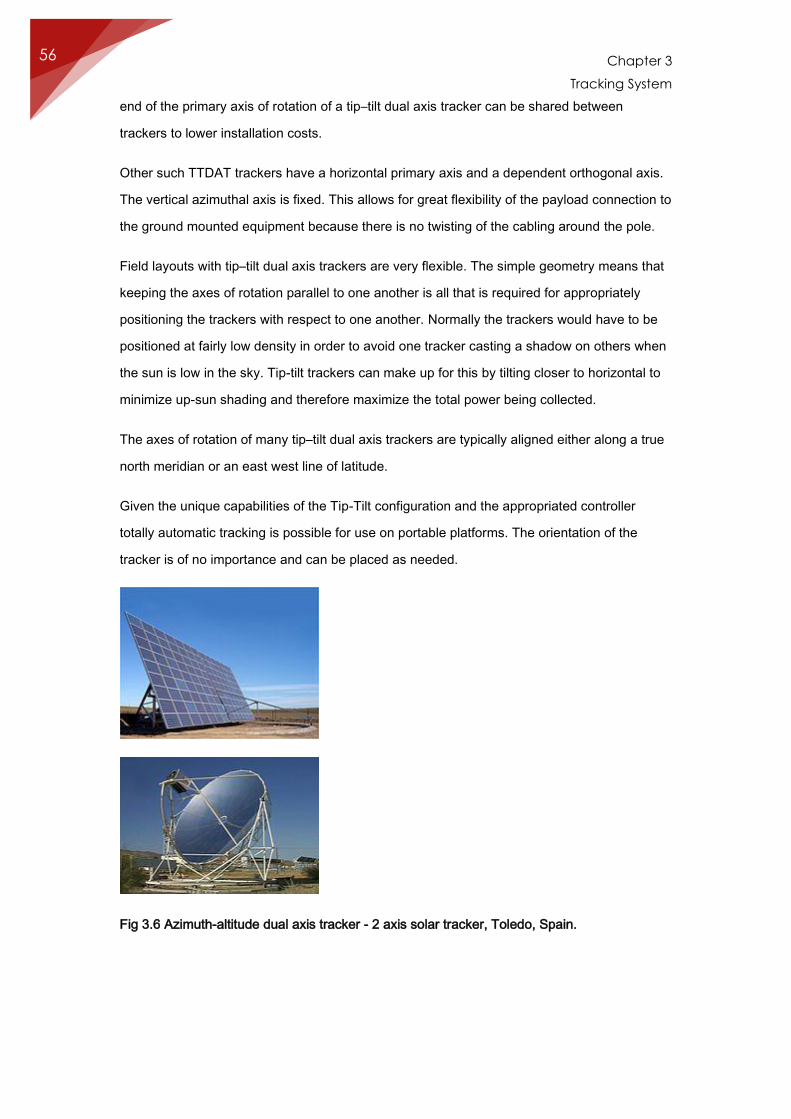
Chapter 3
Tracking System
56
end of the primary axis of rotation of a tip–tilt dual axis tracker can be shared between
trackers to lower installation costs.
Other such TTDAT trackers have a horizontal primary axis and a dependent orthogonal axis.
The vertical azimuthal axis is fixed. This allows for great flexibility of the payload connection to
the ground mounted equipment because there is no twisting of the cabling around the pole.
Field layouts with tip–tilt dual axis trackers are very flexible. The simple geometry means that
keeping the axes of rotation parallel to one another is all that is required for appropriately
positioning the trackers with respect to one another. Normally the trackers would have to be
positioned at fairly low density in order to avoid one tracker casting a shadow on others when
the sun is low in the sky. Tip-tilt trackers can make up for this by tilting closer to horizontal to
minimize up-sun shading and therefore maximize the total power being collected.
The axes of rotation of many tip–tilt dual axis trackers are typically aligned either along a true
north meridian or an east west line of latitude.
Given the unique capabilities of the Tip-Tilt configuration and the appropriated controller
totally automatic tracking is possible for use on portable platforms. The orientation of the
tracker is of no importance and can be placed as needed.
Fig 3.6 Azimuth-altitude dual axis tracker - 2 axis solar tracker, Toledo, Spain.
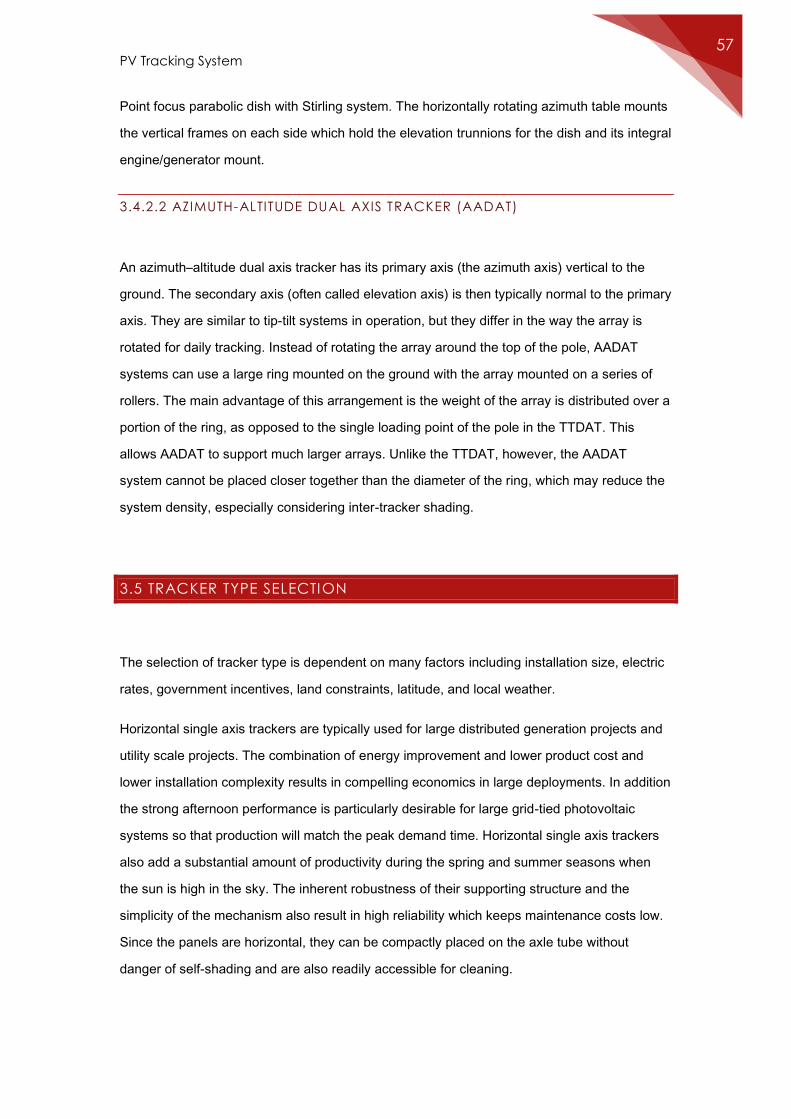
PV Tracking System 57
Point focus parabolic dish with Stirling system. The horizontally rotating azimuth table mounts
the vertical frames on each side which hold the elevation trunnions for the dish and its integral
engine/generator mount.
3.4.2.2 AZIMUTH-ALTITUDE DUAL AXIS TRACKER (AADAT)
An azimuth–altitude dual axis tracker has its primary axis (the azimuth axis) vertical to the
ground. The secondary axis (often called elevation axis) is then typically normal to the primary
axis. They are similar to tip-tilt systems in operation, but they differ in the way the array is
rotated for daily tracking. Instead of rotating the array around the top of the pole, AADAT
systems can use a large ring mounted on the ground with the array mounted on a series of
rollers. The main advantage of this arrangement is the weight of the array is distributed over a
portion of the ring, as opposed to the single loading point of the pole in the TTDAT. This
allows AADAT to support much larger arrays. Unlike the TTDAT, however, the AADAT
system cannot be placed closer together than the diameter of the ring, which may reduce the
system density, especially considering inter-tracker shading.
3.5 TRACKER TYPE SELECTION
The selection of tracker type is dependent on many factors including installation size, electric
rates, government incentives, land constraints, latitude, and local weather.
Horizontal single axis trackers are typically used for large distributed generation projects and
utility scale projects. The combination of energy improvement and lower product cost and
lower installation complexity results in compelling economics in large deployments. In addition
the strong afternoon performance is particularly desirable for large grid-tied photovoltaic
systems so that production will match the peak demand time. Horizontal single axis trackers
also add a substantial amount of productivity during the spring and summer seasons when
the sun is high in the sky. The inherent robustness of their supporting structure and the
simplicity of the mechanism also result in high reliability which keeps maintenance costs low.
Since the panels are horizontal, they can be compactly placed on the axle tube without
danger of self-shading and are also readily accessible for cleaning.
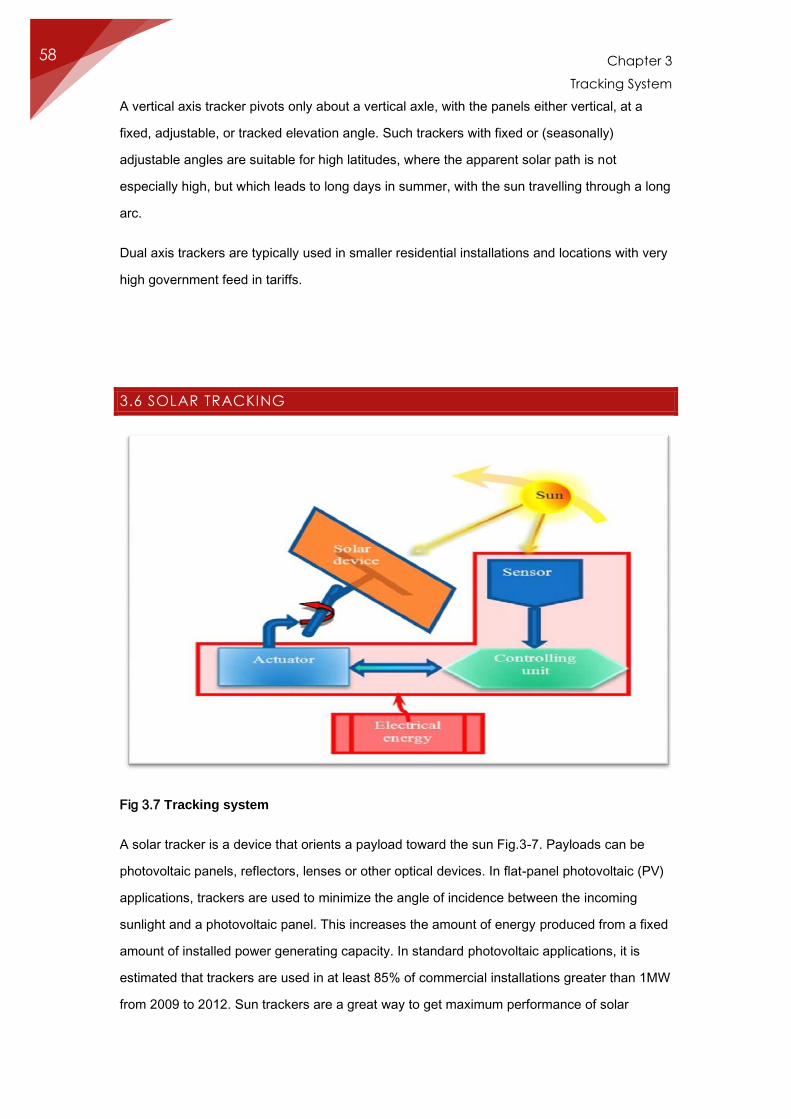
Chapter 3
Tracking System
58
A vertical axis tracker pivots only about a vertical axle, with the panels either vertical, at a
fixed, adjustable, or tracked elevation angle. Such trackers with fixed or (seasonally)
adjustable angles are suitable for high latitudes, where the apparent solar path is not
especially high, but which leads to long days in summer, with the sun travelling through a long
arc.
Dual axis trackers are typically used in smaller residential installations and locations with very
high government feed in tariffs.
3.6 SOLAR TRACKING
Fig 3.7 Tracking system
A solar tracker is a device that orients a payload toward the sun Fig.3-7. Payloads can be
photovoltaic panels, reflectors, lenses or other optical devices. In flat-panel photovoltaic (PV)
applications, trackers are used to minimize the angle of incidence between the incoming
sunlight and a photovoltaic panel. This increases the amount of energy produced from a fixed
amount of installed power generating capacity. In standard photovoltaic applications, it is
estimated that trackers are used in at least 85% of commercial installations greater than 1MW
from 2009 to 2012. Sun trackers are a great way to get maximum performance of solar
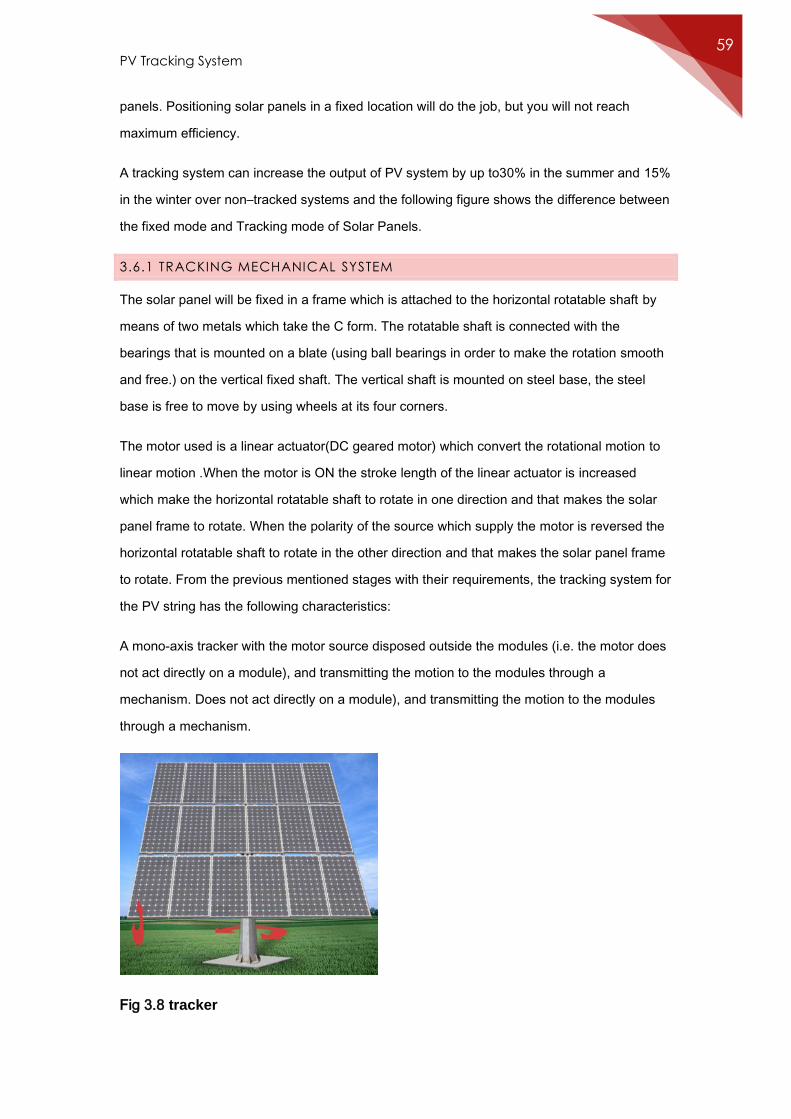
PV Tracking System 59
panels. Positioning solar panels in a fixed location will do the job, but you will not reach
maximum efficiency.
A tracking system can increase the output of PV system by up to30% in the summer and 15%
in the winter over non–tracked systems and the following figure shows the difference between
the fixed mode and Tracking mode of Solar Panels.
3.6.1 TRACKING MECHANICAL SYSTEM
The solar panel will be fixed in a frame which is attached to the horizontal rotatable shaft by
means of two metals which take the C form. The rotatable shaft is connected with the
bearings that is mounted on a blate (using ball bearings in order to make the rotation smooth
and free.) on the vertical fixed shaft. The vertical shaft is mounted on steel base, the steel
base is free to move by using wheels at its four corners.
The motor used is a linear actuator(DC geared motor) which convert the rotational motion to
linear motion .When the motor is ON the stroke length of the linear actuator is increased
which make the horizontal rotatable shaft to rotate in one direction and that makes the solar
panel frame to rotate. When the polarity of the source which supply the motor is reversed the
horizontal rotatable shaft to rotate in the other direction and that makes the solar panel frame
to rotate. From the previous mentioned stages with their requirements, the tracking system for
the PV string has the following characteristics:
A mono-axis tracker with the motor source disposed outside the modules (i.e. the motor does
not act directly on a module), and transmitting the motion to the modules through a
mechanism. Does not act directly on a module), and transmitting the motion to the modules
through a mechanism.
Fig 3.8 tracker

Chapter 3
Tracking System
60
The Photoconductive Cell
A Photoconductive light sensor does not produce electricity but simply changes its physical
properties when subjected to light energy. The most common type of photoconductive device
is the Photo resistor which changes its electrical resistance in response to changes in the light
intensity. Photo resistors are Semiconductor devices that use light energy to control the flow
of electrons, and hence the current flowing through them. The commonly used
Photoconductive Cell is called the Light Dependent Resistor or LDR.
3.6.2 TRACKING CONTROL SYSTEM
Fig 3.9 Block diagram
The Light Dependent Resistor
As its name implies, the Light Dependent Resistor (LDR) Fig. 3-6 is made from a piece of
exposed semiconductor material such as cadmium sulphide that changes its electrical
resistance from several thousand Ohms in the dark to only a few hundred Ohms when light
falls upon it by creating hole-electron pairs in the material.
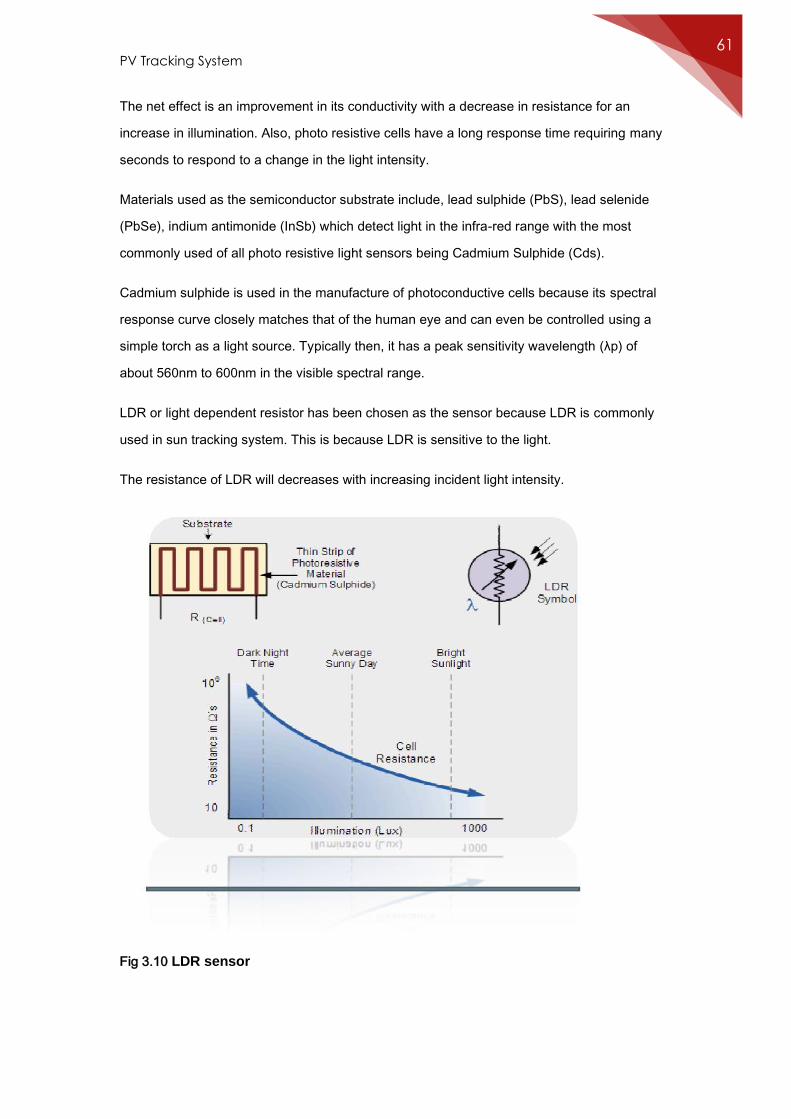
PV Tracking System 61
The net effect is an improvement in its conductivity with a decrease in resistance for an
increase in illumination. Also, photo resistive cells have a long response time requiring many
seconds to respond to a change in the light intensity.
Materials used as the semiconductor substrate include, lead sulphide (PbS), lead selenide
(PbSe), indium antimonide (InSb) which detect light in the infra-red range with the most
commonly used of all photo resistive light sensors being Cadmium Sulphide (Cds).
Cadmium sulphide is used in the manufacture of photoconductive cells because its spectral
response curve closely matches that of the human eye and can even be controlled using a
simple torch as a light source. Typically then, it has a peak sensitivity wavelength (λp) of
about 560nm to 600nm in the visible spectral range.
LDR or light dependent resistor has been chosen as the sensor because LDR is commonly
used in sun tracking system. This is because LDR is sensitive to the light.
The resistance of LDR will decreases with increasing incident light intensity.
Fig 3.10 LDR sensor
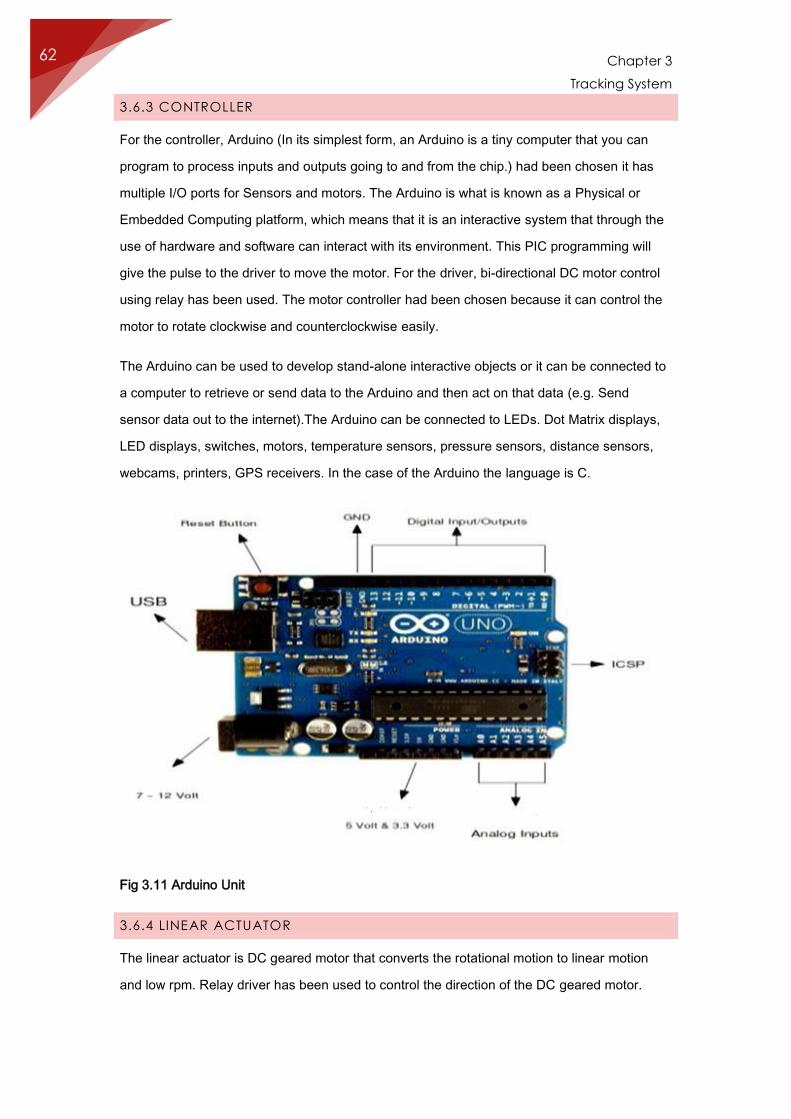
Chapter 3
Tracking System
62
3.6.3 CONTROLLER
For the controller, Arduino (In its simplest form, an Arduino is a tiny computer that you can
program to process inputs and outputs going to and from the chip.) had been chosen it has
multiple I/O ports for Sensors and motors. The Arduino is what is known as a Physical or
Embedded Computing platform, which means that it is an interactive system that through the
use of hardware and software can interact with its environment. This PIC programming will
give the pulse to the driver to move the motor. For the driver, bi-directional DC motor control
using relay has been used. The motor controller had been chosen because it can control the
motor to rotate clockwise and counterclockwise easily.
The Arduino can be used to develop stand-alone interactive objects or it can be connected to
a computer to retrieve or send data to the Arduino and then act on that data (e.g. Send
sensor data out to the internet).The Arduino can be connected to LEDs. Dot Matrix displays,
LED displays, switches, motors, temperature sensors, pressure sensors, distance sensors,
webcams, printers, GPS receivers. In the case of the Arduino the language is C.
Fig 3.11 Arduino Unit
3.6.4 LINEAR ACTUATOR
The linear actuator is DC geared motor that converts the rotational motion to linear motion
and low rpm. Relay driver has been used to control the direction of the DC geared motor.
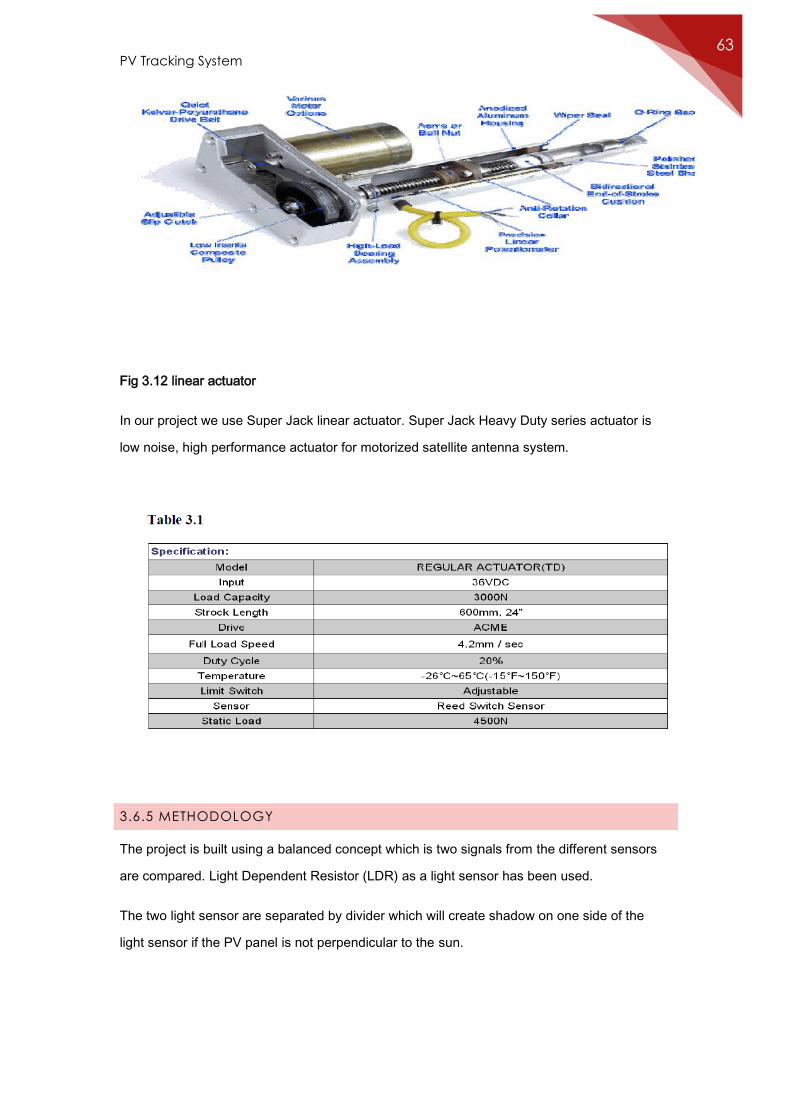
PV Tracking System 63
Fig 3.12 linear actuator
In our project we use Super Jack linear actuator. Super Jack Heavy Duty series actuator is
low noise, high performance actuator for motorized satellite antenna system.
3.6.5 METHODOLOGY
The project is built using a balanced concept which is two signals from the different sensors
are compared. Light Dependent Resistor (LDR) as a light sensor has been used.
The two light sensor are separated by divider which will create shadow on one side of the
light sensor if the PV panel is not perpendicular to the sun.
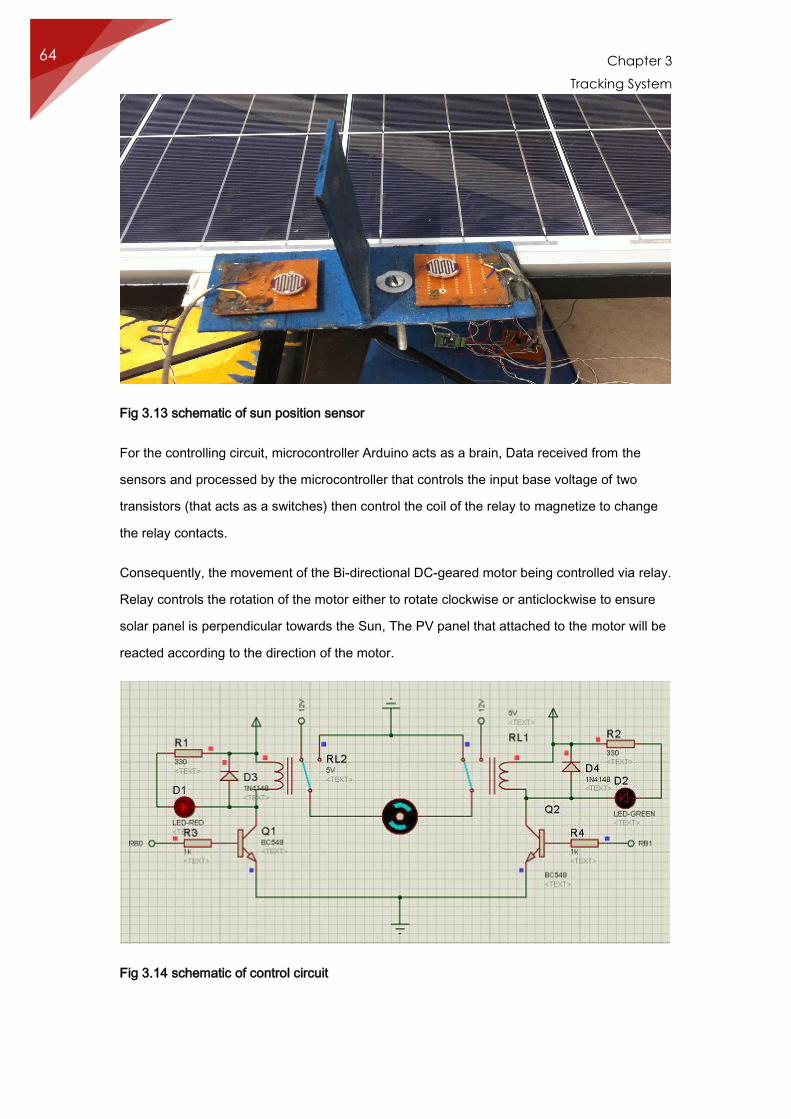
Chapter 3
Tracking System
64
Fig 3.13 schematic of sun position sensor
For the controlling circuit, microcontroller Arduino acts as a brain, Data received from the
sensors and processed by the microcontroller that controls the input base voltage of two
transistors (that acts as a switches) then control the coil of the relay to magnetize to change
the relay contacts.
Consequently, the movement of the Bi-directional DC-geared motor being controlled via relay.
Relay controls the rotation of the motor either to rotate clockwise or anticlockwise to ensure
solar panel is perpendicular towards the Sun, The PV panel that attached to the motor will be
reacted according to the direction of the motor.
Fig 3.14 schematic of control circuit
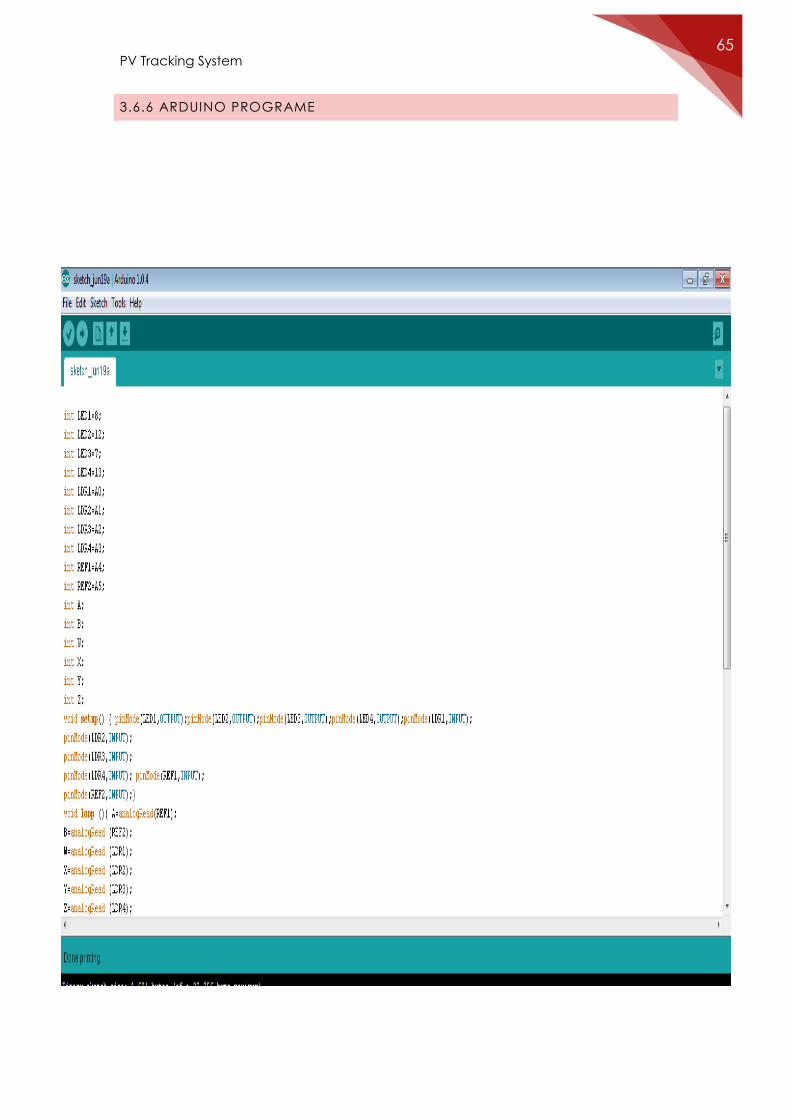
PV Tracking System 65
3.6.6 ARDUINO PROGRAME
Chapter 3
Tracking System
66
3.7 DISADVANTAGES
Trackers add cost and maintenance to the system - if they add 25% to the cost, and improve
the output by 25%, the same performance can be obtained by making the system 25% larger,
eliminating the additional maintenance.

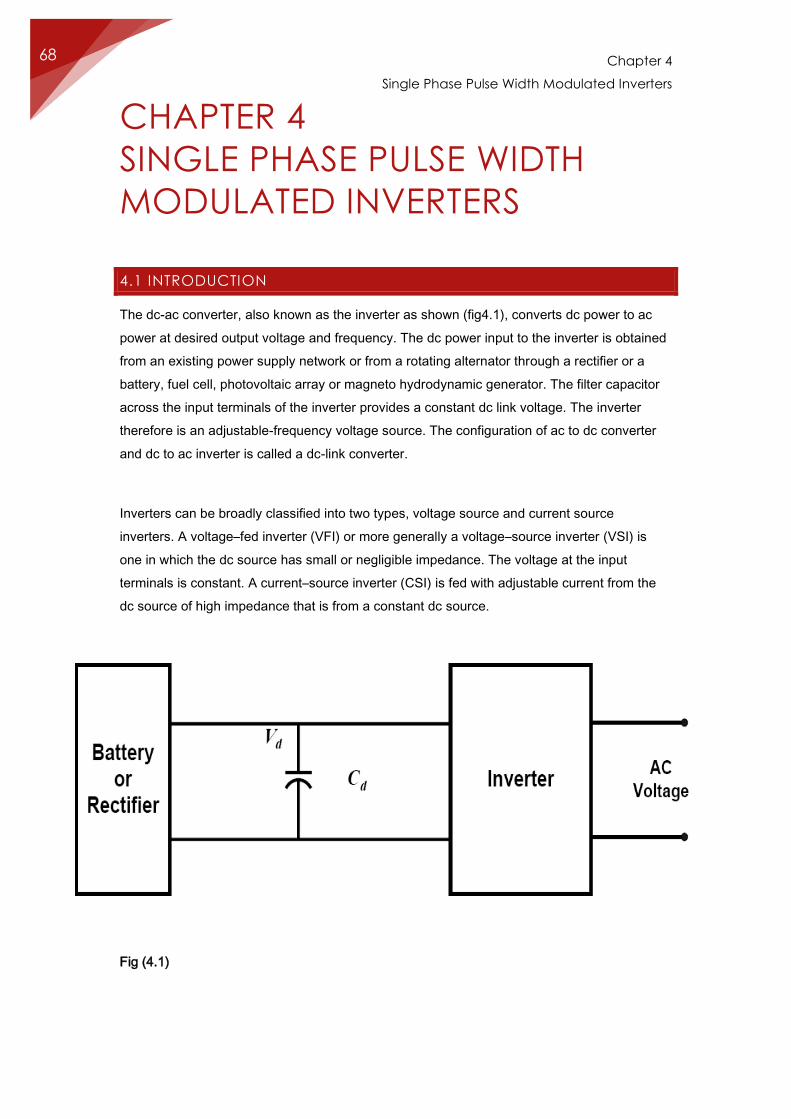
Chapter 4
Single Phase Pulse Width Modulated Inverters
68
CHAPTER 4
SINGLE PHASE PULSE WIDTH
MODULATED INVERTERS
4.1 INTRODUCTION
The dc-ac converter, also known as the inverter as shown (fig4.1), converts dc power to ac
power at desired output voltage and frequency. The dc power input to the inverter is obtained
from an existing power supply network or from a rotating alternator through a rectifier or a
battery, fuel cell, photovoltaic array or magneto hydrodynamic generator. The filter capacitor
across the input terminals of the inverter provides a constant dc link voltage. The inverter
therefore is an adjustable-frequency voltage source. The configuration of ac to dc converter
and dc to ac inverter is called a dc-link converter.
Inverters can be broadly classified into two types, voltage source and current source
inverters. A voltage–fed inverter (VFI) or more generally a voltage–source inverter (VSI) is
one in which the dc source has small or negligible impedance. The voltage at the input
terminals is constant. A current–source inverter (CSI) is fed with adjustable current from the
dc source of high impedance that is from a constant dc source.
Fig (4.1)
PV Tracking System 69
A voltage source inverter employing thyristors as switches, some type of forced commutation
is required, while the VSIs made up of using GTOs, power transistors, power MOSFETs or
IGBTs, self-commutation with base or gate drive signals for their controlled turn-on and turn-
off. A standard single-phase voltage or current source inverter can be in the half-bridge or full-
bridge configuration. The single-phase units can be joined to have three-phase or multiphase
topologies. Some industrial applications of inverters are for adjustable-speed ac drives,
induction heating, standby aircraft power supplies, UPS (uninterruptible power supplies) for
computers, HVDC transmission lines, etc.
4.2 TYPES OF INVERTERS
a) The type of inverter according to Input:
1. Voltage source inverters.
2. Current source inverters.
b) The type of inverter according to the AC load:
1. Single-phase inverters.
2. Three -phase inverters.
c) The wave shape of inverter according to the AC output:
1. Sine wave.
2. Modified sine wave.
3. Square wave.
4.2.1 TYPES OF INVERTERS ACCORDING TO INPUT:
a) Voltage Source inverter
The inverter is called voltage source inverter (VSI), if the input dc is a voltage source.
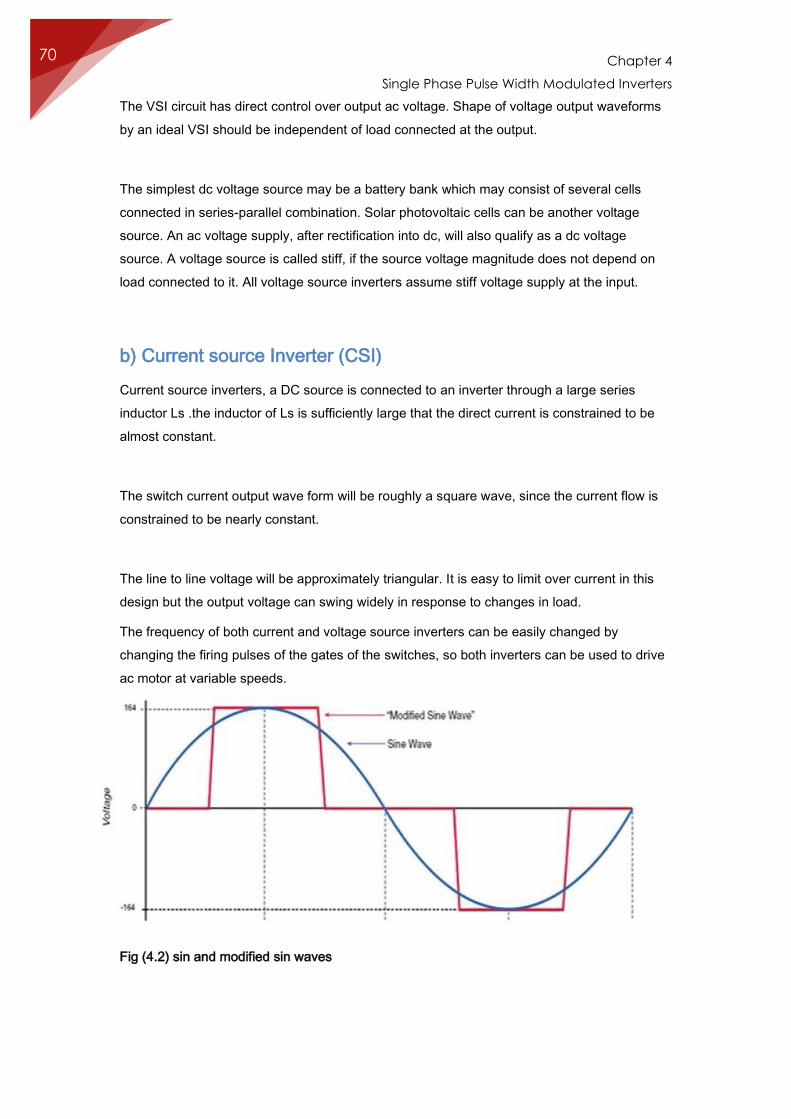
Chapter 4
Single Phase Pulse Width Modulated Inverters
70
The VSI circuit has direct control over output ac voltage. Shape of voltage output waveforms
by an ideal VSI should be independent of load connected at the output.
The simplest dc voltage source may be a battery bank which may consist of several cells
connected in series-parallel combination. Solar photovoltaic cells can be another voltage
source. An ac voltage supply, after rectification into dc, will also qualify as a dc voltage
source. A voltage source is called stiff, if the source voltage magnitude does not depend on
load connected to it. All voltage source inverters assume stiff voltage supply at the input.
b) Current source Inverter (CSI)
Current source inverters, a DC source is connected to an inverter through a large series
inductor Ls .the inductor of Ls is sufficiently large that the direct current is constrained to be
almost constant.
The switch current output wave form will be roughly a square wave, since the current flow is
constrained to be nearly constant.
The line to line voltage will be approximately triangular. It is easy to limit over current in this
design but the output voltage can swing widely in response to changes in load.
The frequency of both current and voltage source inverters can be easily changed by
changing the firing pulses of the gates of the switches, so both inverters can be used to drive
ac motor at variable speeds.
Fig (4.2) sin and modified sin waves
PV Tracking System 71
4.2.2 TYPES OF INVERTER ACCORDING TO WAVE SHAPE OF AC OUTPUT:
Applications
a) Pure sine wave
Pure sine wave inverters produces a nearly perfect sine wave output (less than 3% total
harmonic distortion) that is essentially the same as utility-supplied grid power and are used to
operate sensitive electronic devices that require high quality waveform with little harmonic
distortion.
In addition, they have high surge capacity which means they are able to exceed their rated
wattage for a limited time. This enables power motors to start easily which can draw up to
seven times their rated wattage during startup. Virtually any electronic device will operate with
the output from a pure sine wave inverter.
Its design is more complex, and costs more per unit power, and thus it is compatible with all
AC electronic devices. This is the type used in grid-tie inverters.
b) Modified sine wave
Modified sine wave inverters (modified square wave or step wave) approximate a pure sine
waveform. Modified sine wave inverters are designed to satisfy the efficiency requirements of
the photovoltaic system while being less expensive than pure sine waveform inverters. These
inverters are capable of operating a wide variety of loads; electronic and household items
including but not limited to TV, VCR, and satellite receiver, computers, and printers.
The big advantage of the modified sine wave is that it has the same peak-to-RMS voltage
ratio as a true sine wave (RMS (2) = 1.414) while being as easy to generate as a square
wave. This has made MSW inverters very popular. They are compatible with most loads
except those unusually sensitive to the harmonic content. Costs are much cheaper than true
sine wave inverters.
Most AC motors will run on MSW inverters with an efficiency reduction of about
20% due to the harmonic content.
It's safe to say any electronic device that requires sensitive calibration can only be used with
pure sine wave inverters. For many electronic devices that don't require sensitive calibration,
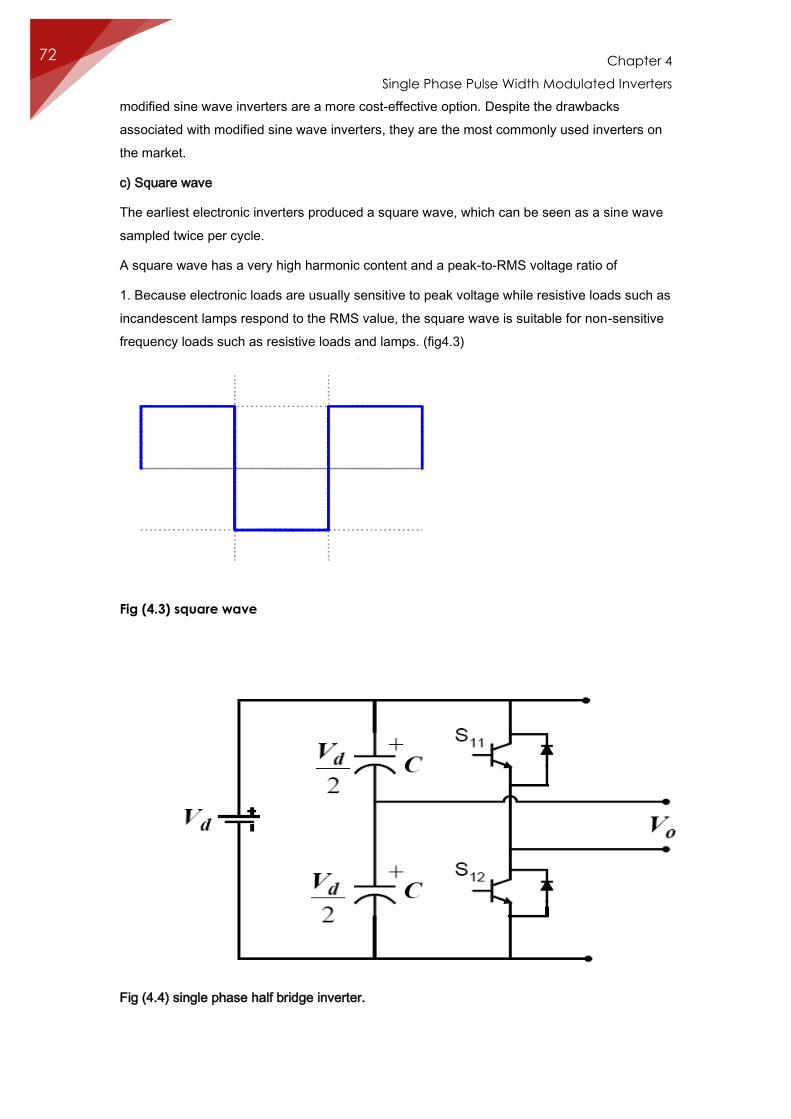
Chapter 4
Single Phase Pulse Width Modulated Inverters
72
modified sine wave inverters are a more cost-effective option. Despite the drawbacks
associated with modified sine wave inverters, they are the most commonly used inverters on
the market.
c) Square wave
The earliest electronic inverters produced a square wave, which can be seen as a sine wave
sampled twice per cycle.
A square wave has a very high harmonic content and a peak-to-RMS voltage ratio of
1. Because electronic loads are usually sensitive to peak voltage while resistive loads such as
incandescent lamps respond to the RMS value, the square wave is suitable for non-sensitive
frequency loads such as resistive loads and lamps. (fig4.3)
Fig (4.3) square wave
Fig (4.4) single phase half bridge inverter.
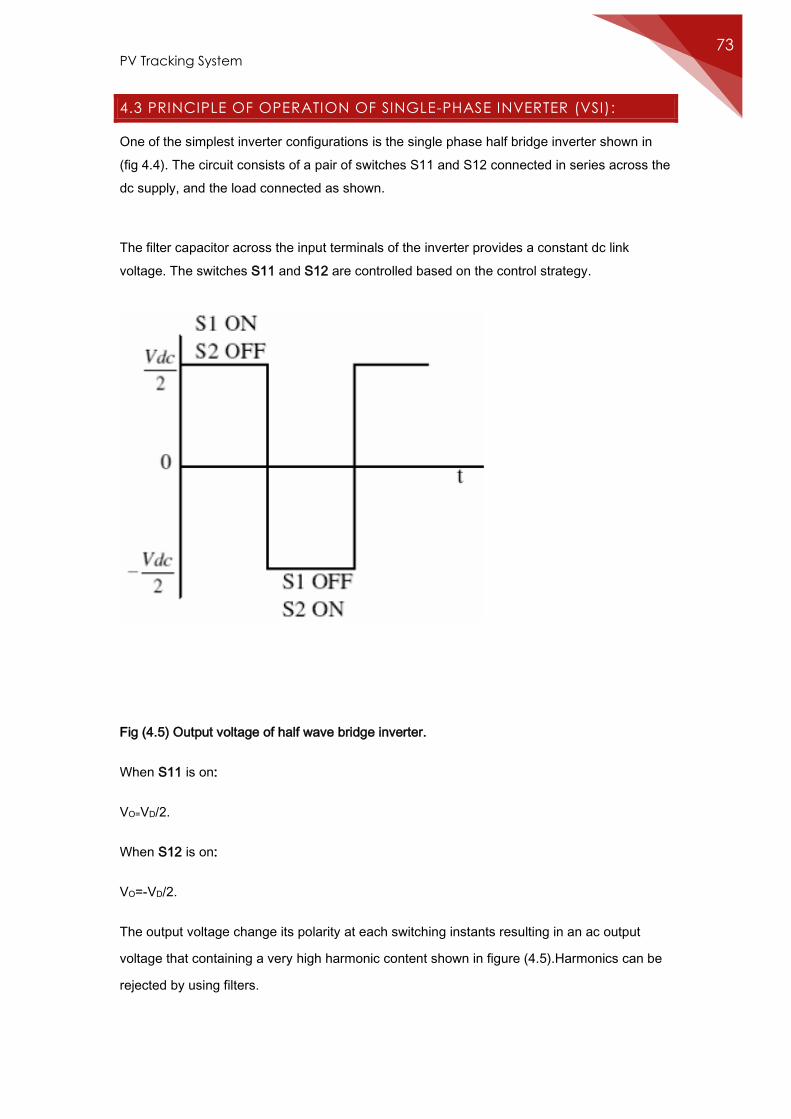
PV Tracking System 73
4.3 PRINCIPLE OF OPERATION OF SINGLE-PHASE INVERTER (VSI):
One of the simplest inverter configurations is the single phase half bridge inverter shown in
(fig 4.4). The circuit consists of a pair of switches S11 and S12 connected in series across the
dc supply, and the load connected as shown.
The filter capacitor across the input terminals of the inverter provides a constant dc link
voltage. The switches S11 and S12 are controlled based on the control strategy.
Fig (4.5) Output voltage of half wave bridge inverter.
When S11 is on:
VO=VD/2.
When S12 is on:
VO=-VD/2.
The output voltage change its polarity at each switching instants resulting in an ac output
voltage that containing a very high harmonic content shown in figure (4.5).Harmonics can be
rejected by using filters.
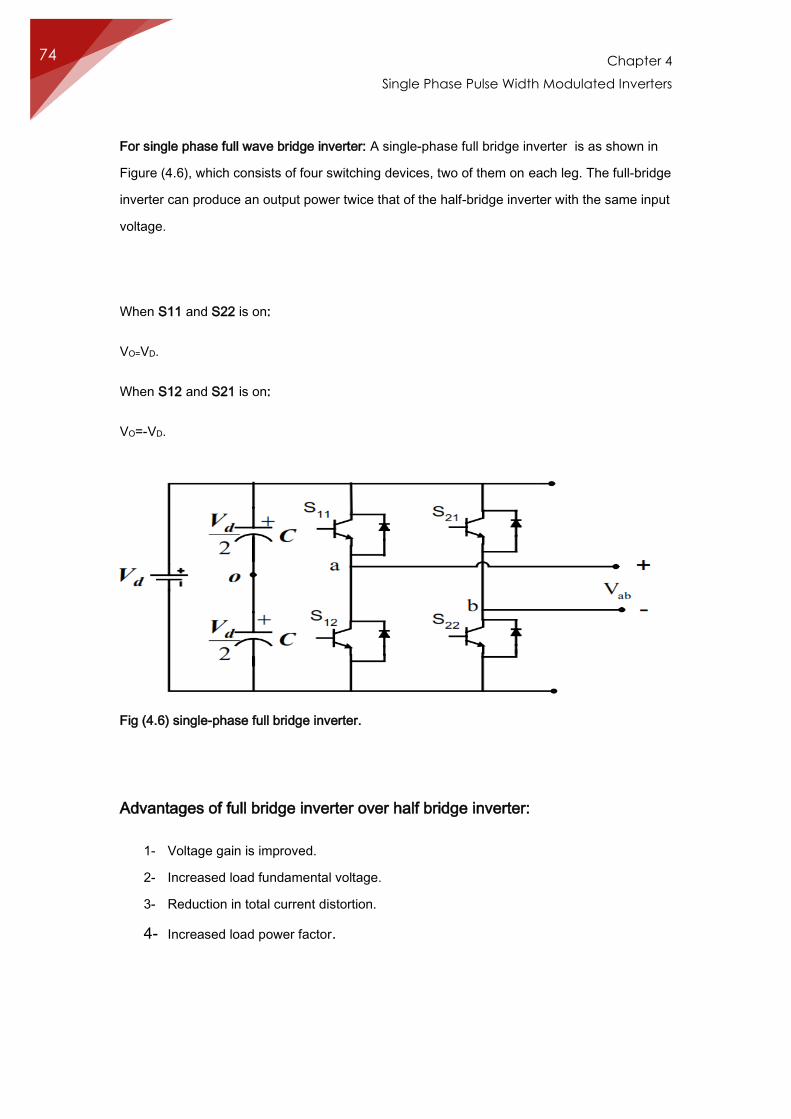
Chapter 4
Single Phase Pulse Width Modulated Inverters
74
For single phase full wave bridge inverter: A single-phase full bridge inverter is as shown in
Figure (4.6), which consists of four switching devices, two of them on each leg. The full-bridge
inverter can produce an output power twice that of the half-bridge inverter with the same input
voltage.
When S11 and S22 is on:
VO=VD.
When S12 and S21 is on:
VO=-VD.
Fig (4.6) single-phase full bridge inverter.
Advantages of full bridge inverter over half bridge inverter:
1- Voltage gain is improved.
2- Increased load fundamental voltage.
3- Reduction in total current distortion.
4- Increased load power factor.
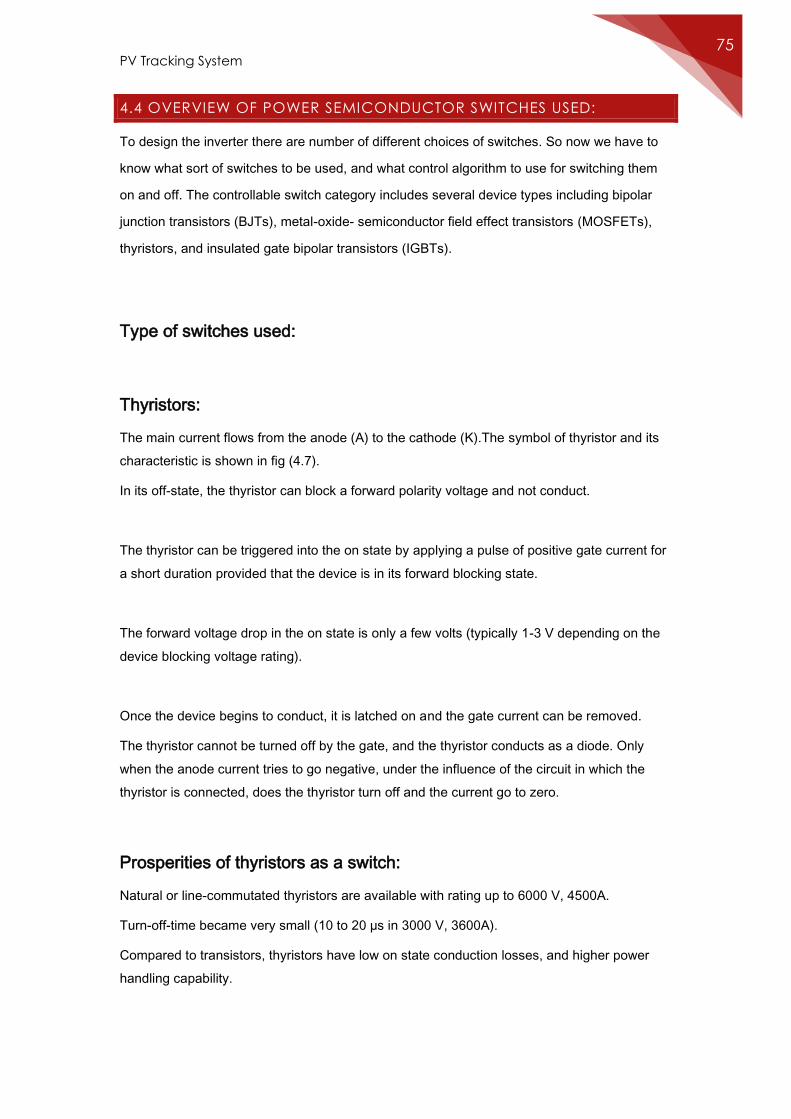
PV Tracking System 75
4.4 OVERVIEW OF POWER SEMICONDUCTOR SWITCHES USED:
To design the inverter there are number of different choices of switches. So now we have to
know what sort of switches to be used, and what control algorithm to use for switching them
on and off. The controllable switch category includes several device types including bipolar
junction transistors (BJTs), metal-oxide- semiconductor field effect transistors (MOSFETs),
thyristors, and insulated gate bipolar transistors (IGBTs).
Type of switches used:
Thyristors:
The main current flows from the anode (A) to the cathode (K).The symbol of thyristor and its
characteristic is shown in fig (4.7).
In its off-state, the thyristor can block a forward polarity voltage and not conduct.
The thyristor can be triggered into the on state by applying a pulse of positive gate current for
a short duration provided that the device is in its forward blocking state.
The forward voltage drop in the on state is only a few volts (typically 1-3 V depending on the
device blocking voltage rating).
Once the device begins to conduct, it is latched on and the gate current can be removed.
The thyristor cannot be turned off by the gate, and the thyristor conducts as a diode. Only
when the anode current tries to go negative, under the influence of the circuit in which the
thyristor is connected, does the thyristor turn off and the current go to zero.
Prosperities of thyristors as a switch:
Natural or line-commutated thyristors are available with rating up to 6000 V, 4500A.
Turn-off-time became very small (10 to 20 µs in 3000 V, 3600A).
Compared to transistors, thyristors have low on state conduction losses, and higher power
handling capability.
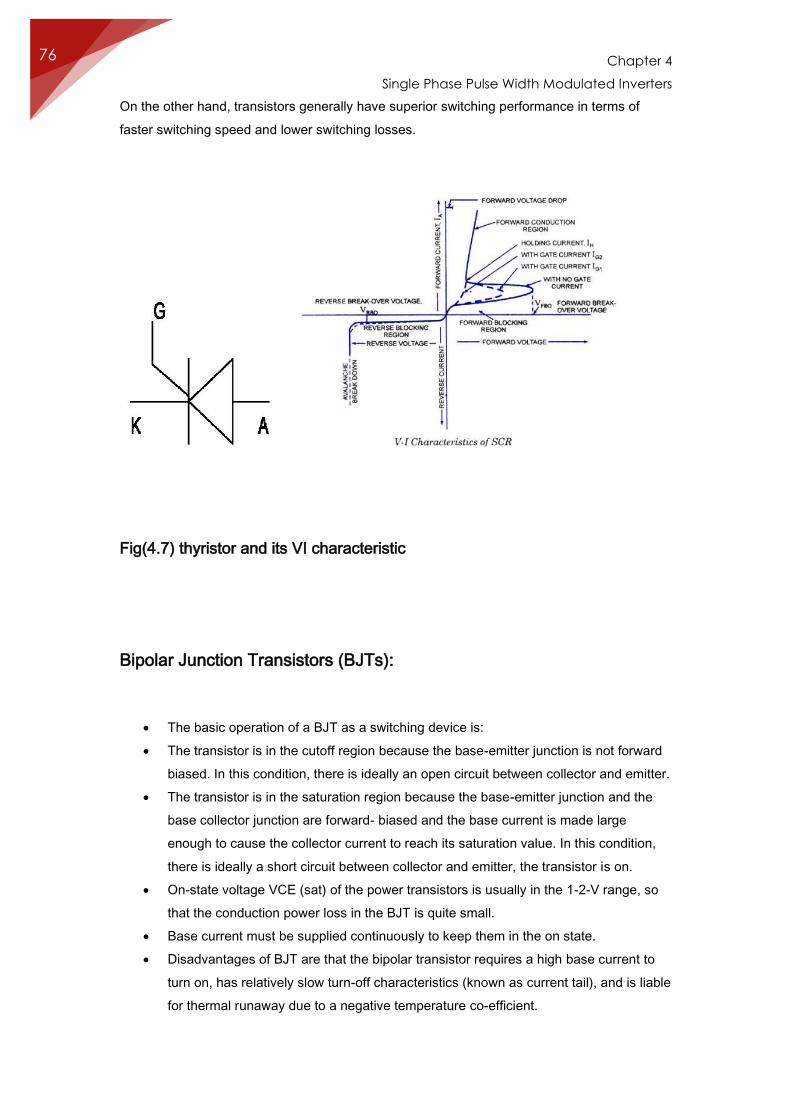
Chapter 4
Single Phase Pulse Width Modulated Inverters
76
On the other hand, transistors generally have superior switching performance in terms of
faster switching speed and lower switching losses.
Fig(4.7) thyristor and its VI characteristic
Bipolar Junction Transistors (BJTs):
The basic operation of a BJT as a switching device is:
The transistor is in the cutoff region because the base-emitter junction is not forward
biased. In this condition, there is ideally an open circuit between collector and emitter.
The transistor is in the saturation region because the base-emitter junction and the
base collector junction are forward- biased and the base current is made large
enough to cause the collector current to reach its saturation value. In this condition,
there is ideally a short circuit between collector and emitter, the transistor is on.
On-state voltage VCE (sat) of the power transistors is usually in the 1-2-V range, so
that the conduction power loss in the BJT is quite small.
Base current must be supplied continuously to keep them in the on state.
Disadvantages of BJT are that the bipolar transistor requires a high base current to
turn on, has relatively slow turn-off characteristics (known as current tail), and is liable
for thermal runaway due to a negative temperature co-efficient.
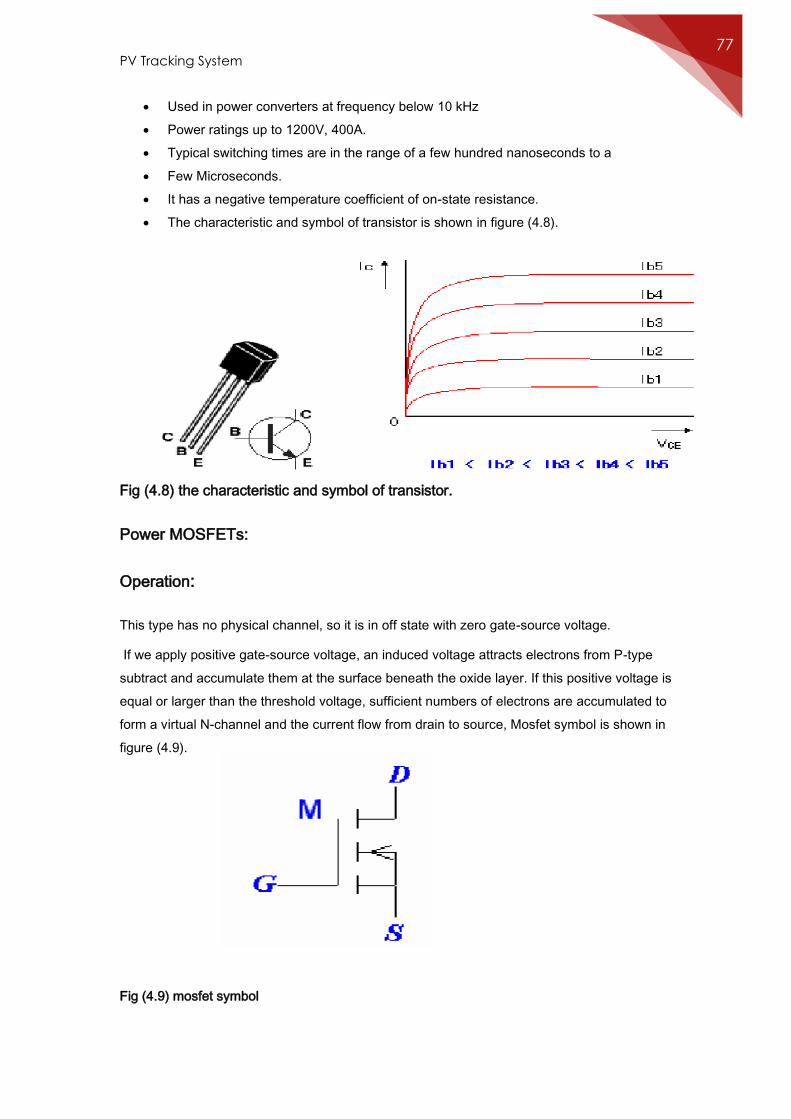
PV Tracking System 77
Used in power converters at frequency below 10 kHz
Power ratings up to 1200V, 400A.
Typical switching times are in the range of a few hundred nanoseconds to a
Few Microseconds.
It has a negative temperature coefficient of on-state resistance.
The characteristic and symbol of transistor is shown in figure (4.8).
Fig (4.8) the characteristic and symbol of transistor.
Power MOSFETs:
Operation:
This type has no physical channel, so it is in off state with zero gate-source voltage.
If we apply positive gate-source voltage, an induced voltage attracts electrons from P-type
subtract and accumulate them at the surface beneath the oxide layer. If this positive voltage is
equal or larger than the threshold voltage, sufficient numbers of electrons are accumulated to
form a virtual N-channel and the current flow from drain to source, Mosfet symbol is shown in
figure (4.9).
Fig (4.9) mosfet symbol
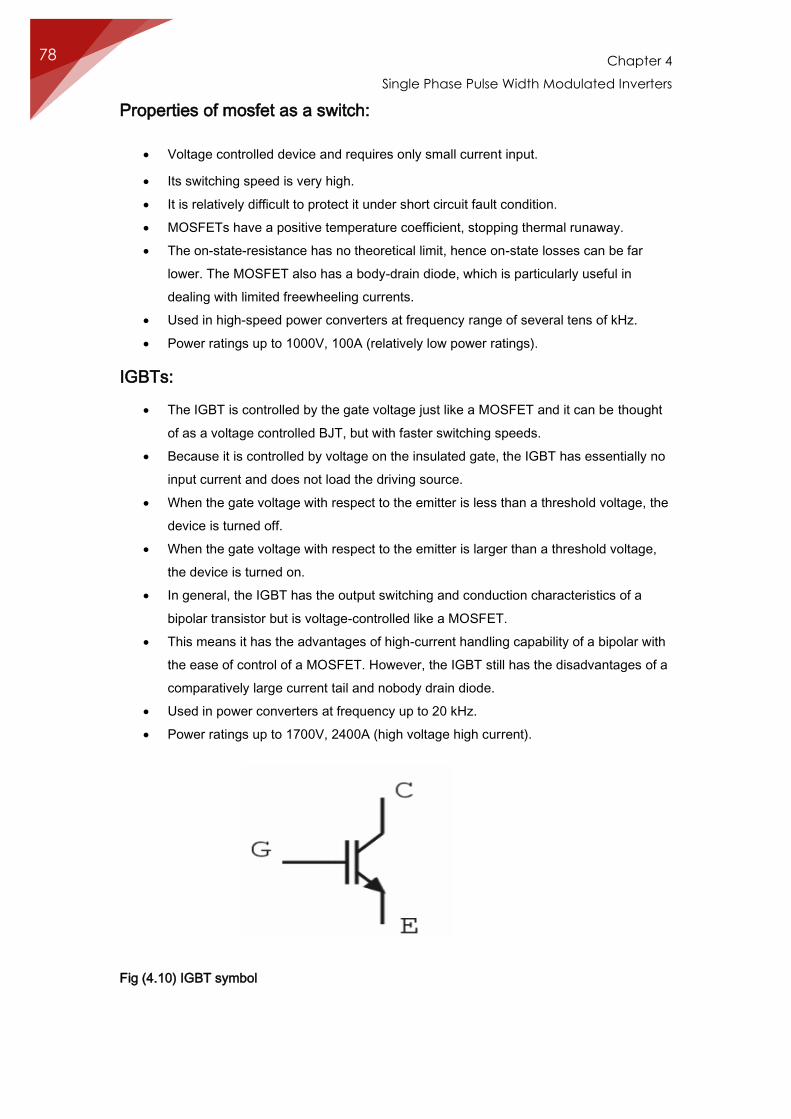
Chapter 4
Single Phase Pulse Width Modulated Inverters
78
Properties of mosfet as a switch:
Voltage controlled device and requires only small current input.
Its switching speed is very high.
It is relatively difficult to protect it under short circuit fault condition.
MOSFETs have a positive temperature coefficient, stopping thermal runaway.
The on-state-resistance has no theoretical limit, hence on-state losses can be far
lower. The MOSFET also has a body-drain diode, which is particularly useful in
dealing with limited freewheeling currents.
Used in high-speed power converters at frequency range of several tens of kHz.
Power ratings up to 1000V, 100A (relatively low power ratings).
IGBTs:
The IGBT is controlled by the gate voltage just like a MOSFET and it can be thought
of as a voltage controlled BJT, but with faster switching speeds.
Because it is controlled by voltage on the insulated gate, the IGBT has essentially no
input current and does not load the driving source.
When the gate voltage with respect to the emitter is less than a threshold voltage, the
device is turned off.
When the gate voltage with respect to the emitter is larger than a threshold voltage,
the device is turned on.
In general, the IGBT has the output switching and conduction characteristics of a
bipolar transistor but is voltage-controlled like a MOSFET.
This means it has the advantages of high-current handling capability of a bipolar with
the ease of control of a MOSFET. However, the IGBT still has the disadvantages of a
comparatively large current tail and nobody drain diode.
Used in power converters at frequency up to 20 kHz.
Power ratings up to 1700V, 2400A (high voltage high current).
Fig (4.10) IGBT symbol
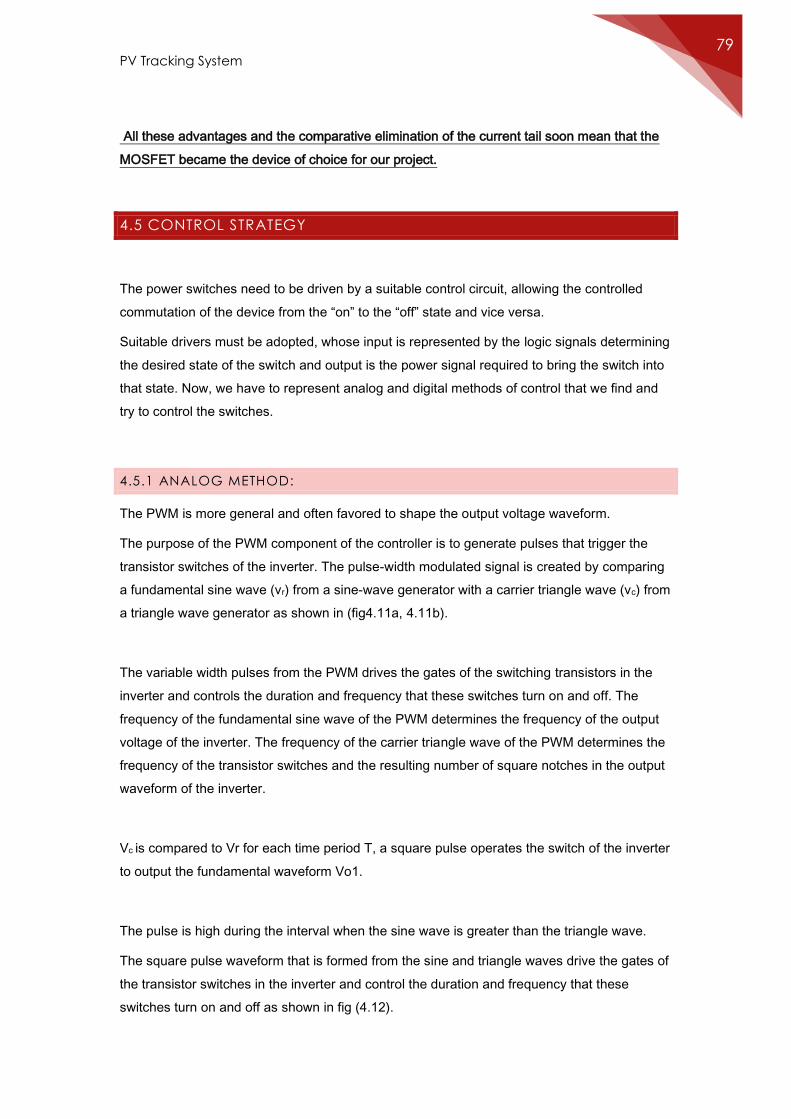
PV Tracking System 79
All these advantages and the comparative elimination of the current tail soon mean that the
MOSFET became the device of choice for our project.
4.5 CONTROL STRATEGY
The power switches need to be driven by a suitable control circuit, allowing the controlled
commutation of the device from the “on” to the “off” state and vice versa.
Suitable drivers must be adopted, whose input is represented by the logic signals determining
the desired state of the switch and output is the power signal required to bring the switch into
that state. Now, we have to represent analog and digital methods of control that we find and
try to control the switches.
4.5.1 ANALOG METHOD:
The PWM is more general and often favored to shape the output voltage waveform.
The purpose of the PWM component of the controller is to generate pulses that trigger the
transistor switches of the inverter. The pulse-width modulated signal is created by comparing
a fundamental sine wave (vr) from a sine-wave generator with a carrier triangle wave (vc) from
a triangle wave generator as shown in (fig4.11a, 4.11b).
The variable width pulses from the PWM drives the gates of the switching transistors in the
inverter and controls the duration and frequency that these switches turn on and off. The
frequency of the fundamental sine wave of the PWM determines the frequency of the output
voltage of the inverter. The frequency of the carrier triangle wave of the PWM determines the
frequency of the transistor switches and the resulting number of square notches in the output
waveform of the inverter.
Vc is compared to Vr for each time period T, a square pulse operates the switch of the inverter
to output the fundamental waveform Vo1.
The pulse is high during the interval when the sine wave is greater than the triangle wave.
The square pulse waveform that is formed from the sine and triangle waves drive the gates of
the transistor switches in the inverter and control the duration and frequency that these
switches turn on and off as shown in fig (4.12).
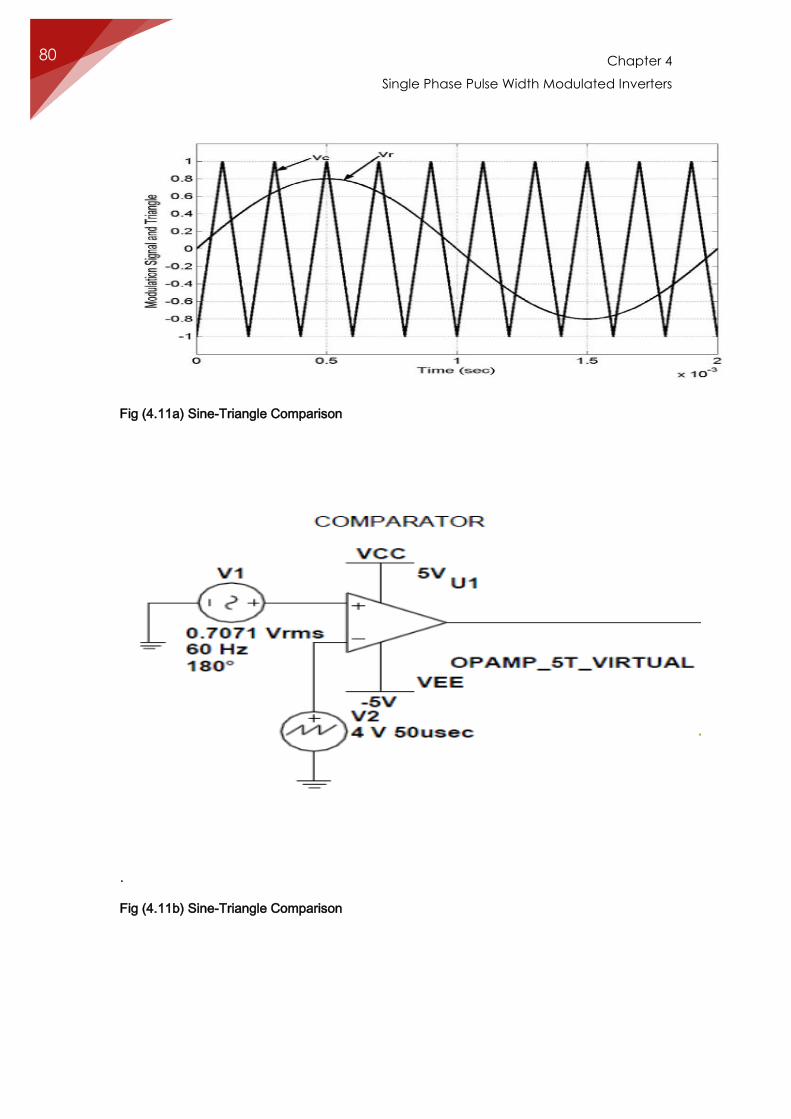
Chapter 4
Single Phase Pulse Width Modulated Inverters
80
Fig (4.11a) Sine-Triangle Comparison
.
Fig (4.11b) Sine-Triangle Comparison
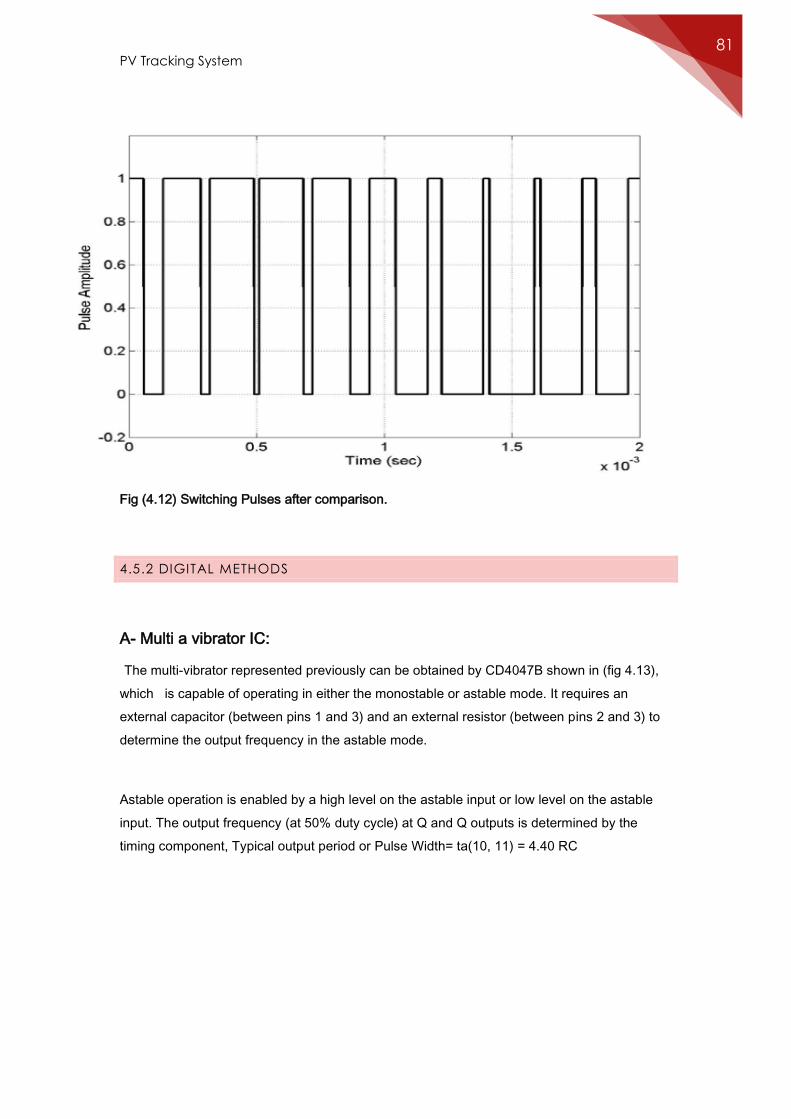
PV Tracking System 81
Fig (4.12) Switching Pulses after comparison.
4.5.2 DIGITAL METHODS
A- Multi a vibrator IC:
The multi-vibrator represented previously can be obtained by CD4047B shown in (fig 4.13),
which is capable of operating in either the monostable or astable mode. It requires an
external capacitor (between pins 1 and 3) and an external resistor (between pins 2 and 3) to
determine the output frequency in the astable mode.
Astable operation is enabled by a high level on the astable input or low level on the astable
input. The output frequency (at 50% duty cycle) at Q and Q outputs is determined by the
timing component, Typical output period or Pulse Width= ta(10, 11) = 4.40 RC
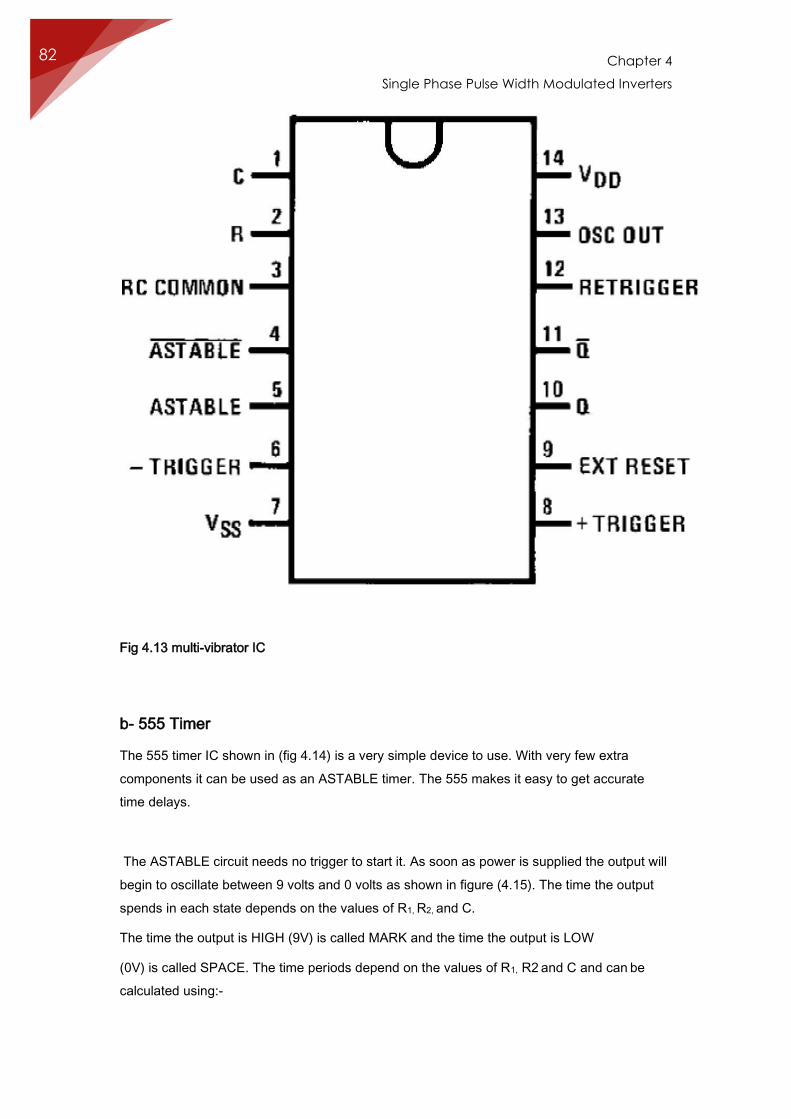
Chapter 4
Single Phase Pulse Width Modulated Inverters
82
Fig 4.13 multi-vibrator IC
b- 555 Timer
The 555 timer IC shown in (fig 4.14) is a very simple device to use. With very few extra
components it can be used as an ASTABLE timer. The 555 makes it easy to get accurate
time delays.
The ASTABLE circuit needs no trigger to start it. As soon as power is supplied the output will
begin to oscillate between 9 volts and 0 volts as shown in figure (4.15). The time the output
spends in each state depends on the values of R1, R2, and C.
The time the output is HIGH (9V) is called MARK and the time the output is LOW
(0V) is called SPACE. The time periods depend on the values of R1, R2 and C and can be
calculated using:-
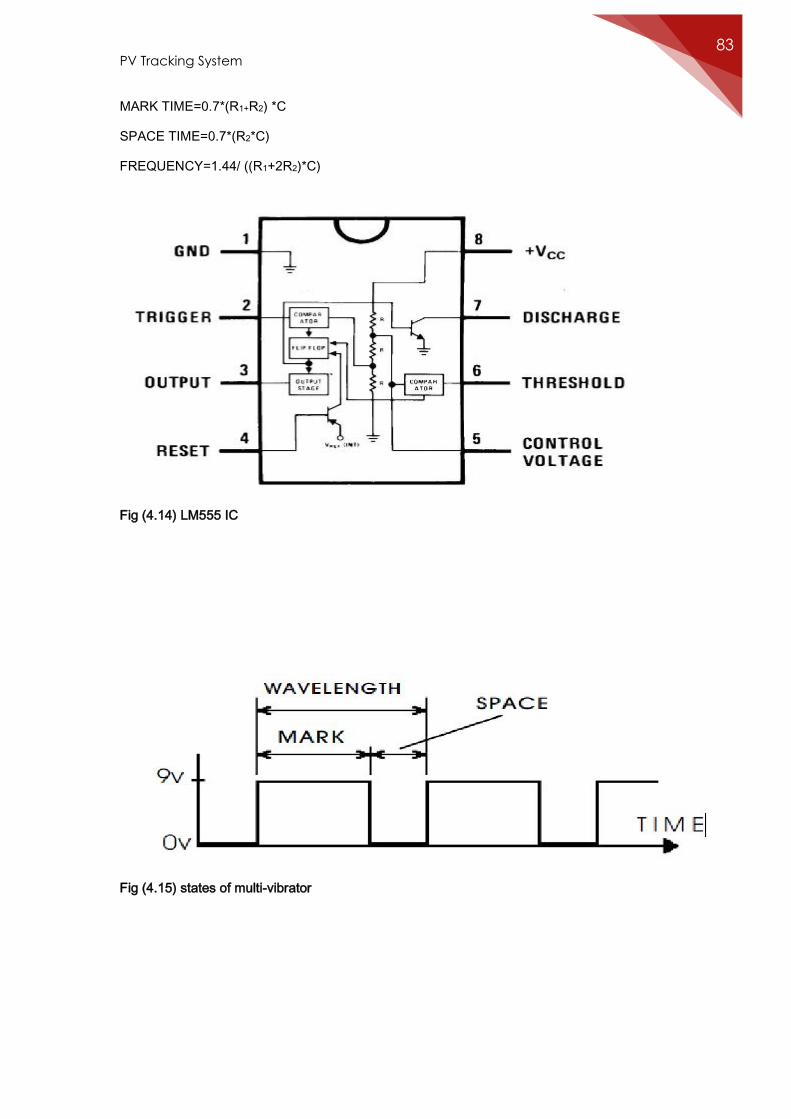
PV Tracking System 83
MARK TIME=0.7*(R1+R2) *C
SPACE TIME=0.7*(R2*C)
FREQUENCY=1.44/ ((R1+2R2)*C)
Fig (4.14) LM555 IC
Fig (4.15) states of multi-vibrator
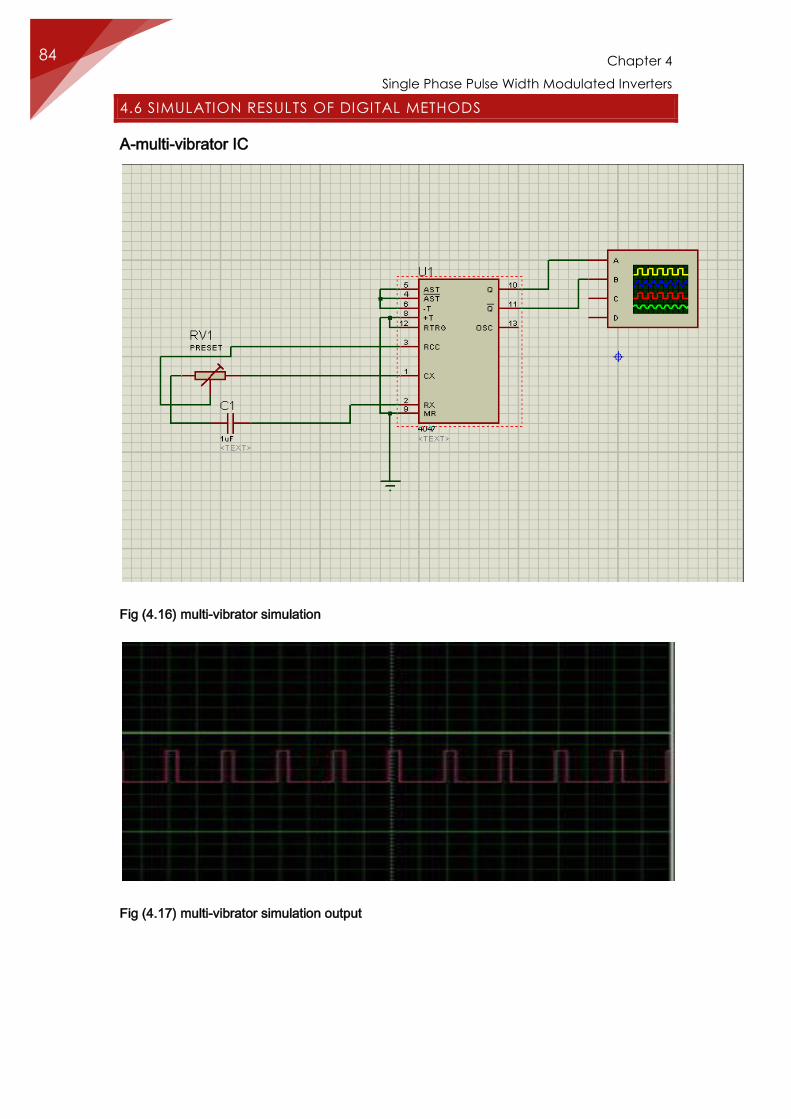
Chapter 4
Single Phase Pulse Width Modulated Inverters
84
4.6 SIMULATION RESULTS OF DIGITAL METHODS
A-multi-vibrator IC
Fig (4.16) multi-vibrator simulation
Fig (4.17) multi-vibrator simulation output
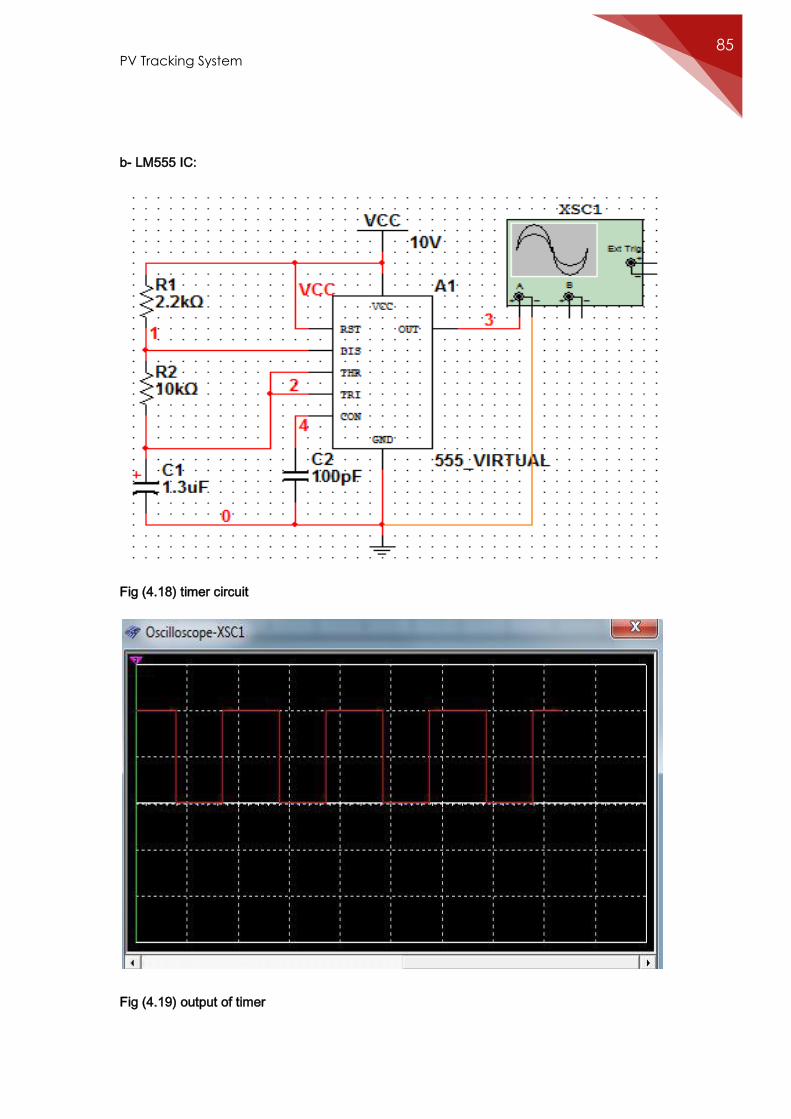
PV Tracking System 85
b- LM555 IC:
Fig (4.18) timer circuit
Fig (4.19) output of timer
Chapter 4
Single Phase Pulse Width Modulated Inverters
86
4.7 INVERTER USING LM555:
After trying all previous circuits and comparing their output wave shape, we
find that inverter using lm555 is the most suitable and effective one to be used
in our project.
4.8 APPLICATIONS
Uninterruptible power supplies
An uninterruptible power supply (UPS) uses batteries and an inverter to supply AC power
when main power is not available. When main power is restored, a rectifier supplies DC
power to recharge the batteries.
Induction heating
Inverters convert low frequency main AC power to higher frequency for use in induction
heating. To do this, AC power is first rectified to provide DC power. The inverter then changes
the DC power to high frequency AC power.
HVDC power transmission
With HVDC power transmission, AC power is rectified and high voltage DC power is
transmitted to another location. At the receiving location, an inverter in a static inverter plant
converts the power back to AC. The inverter must be synchronized with grid frequency and
phase and minimize harmonic generation.
Variable-frequency drives
A variable-frequency drive controls the operating speed of an AC motor by controlling the
frequency and voltage of the power supplied to the motor. An inverter provides the controlled
power. In most cases, the variable-frequency drive includes a rectifier so that DC power for
the inverter can be provided from main AC power.

PV Tracking System 87
Since an inverter is the key component, variable-frequency drives are sometimes called
inverter drives or just inverters.
VFDs that operate directly from an AC source without first converting it to DC are called
cycloconverters. They are now commonly used on large ships to drive the propulsion motors.
Air conditioning
An inverter air conditioner uses a variable-frequency drive to control the speed of the motor
and thus the compressor

Chapter 4
Single Phase Pulse Width Modulated Inverters
88
Chapter 5
Battery and Charger Controller
90
CHAPTER 5
BATTERY AND CHARGER
CONTROLLER
5.1 INTRODUCTION
In electricity, a battery is a device consisting of one or more electrochemical cells that convert
stored chemical energy into electrical energy. Since the invention of the first battery (or
"voltaic pile") in 1800 by Alessandro Volta and especially since the technically improved
Daniell cell in 1836, batteries have become a common power source for many household and
industrial applications. According to a 2005 estimate, the worldwide battery industry
generates US$48 billion in sales each year, with 6% annual growth.
There are two types of batteries primary batteries, this is a one-way process – the chemical
energy is converted to electrical energy, but the process is not reversible and electrical
energy cannot be converted to chemical energy. This means that a primary battery cannot be
recharged. For a secondary battery, the conversion process between electrical and chemical
energy is reversible, – chemical energy is converted to electrical energy, and electrical energy
can be converted to chemical energy, allowing the battery to be recharged. Batteries come in
many sizes, from miniature cells used to power hearing aids and wristwatches to battery
banks the size of rooms that provide standby power for telephone exchanges and computer
data centers and photovoltaic storing energy. For photovoltaic systems, batteries should be
rechargeable or secondary batteries.
5.2 STORAGE IN PV SYSTEMS
A fundamental characteristic of a photovoltaic system is that power is produced only while
sunlight is available. For systems in which the photovoltaic is the sole generation source, an
exact match between available sunlight and the load is limited to a few types of systems - for
example powering a cooling fan – and therefore storage is typically required. Even in hybrid or
grid-connected systems, where batteries are not inherently required, they may be beneficially
PV Tracking System 91
included for load matching or power conditioning. By far the most common type of storage is
chemical storage in the form of a battery.
However, in some cases other forms of storage can be used. For example, for small, short
term storage a flywheel or capacitor can be used for storage, or for specific, single-purpose
photovoltaic systems such as water pumping or refrigeration, the storage can be in the form
of water or ice.
In any photovoltaic system that includes batteries, the batteries have a major effect on the
system, impacting performance, cost, maintenance requirements, reliability, and design of the
photovoltaic system. The cost of the batteries in a stand-alone system is similar to the cost of
the photovoltaic modules. Because of large impact of batteries in a stand-alone photovoltaic
system, understanding the properties of batteries is critical in understanding the operation of
photovoltaic systems. The important battery parameters are the battery capacity and voltage
(and how these change and interact with other system parameters), battery maintenance
requirements, lifetime of the battery. These are controlled not only by the initial choice of the
battery but also by how it is used in the system, particularly how it is charged and discharged
and its temperature.
The primary functions of a storage battery in a PV system are to:
Energy Storage Capacity and Autonomy to store electrical energy when it is produced
by the PV array and to supply energy to electrical loads as needed or on demand.
Voltage and Current Stabilization to supply power to electrical loads at stable
voltages and currents, by suppressing or ' smoothing out' transients that may occur in
PV systems.
Supply Surge Currents to supply surge or high peak operating currents to electrical
loads or appliances.
5.3 BATTERY DESIGN AND CONSTRUCTION:
Materials and construction methods have evolved steadily, however, making modern batteries
far more powerful and reliable than their ancestors.
Chapter 5
Battery and Charger Controller
92
Manufacturers have variations in the details of their battery construction, but some common
construction features can be described for most all batteries. Some important components of
battery construction are described below
. Terminals
Depending on the model, batteries come either with AMP Faston type terminals made of tin
plated brass, post type terminals of the same composition with threaded nut and bolt
hardware, or heavy duty flag terminals made of lead alloy.
A special epoxy is used as sealing material surrounding the terminals
. Relief valve
In case of excessive gas pressure build-up inside the battery, the relief valve will open and
relieve the pressure. The one-way valve not only ensures that no air gets into the battery
where the oxygen would react with the plates causing internal discharge, but also represents
an important safety device in the event of excessive overcharge.
Vent release pressure is between 2-6 psi; the seal ring material is neoprene rubber.
Plates (electrodes)
Power-Sonic utilizes the latest technology and equipment to cast grids from a lead-calcium
alloy free of antimony. The small amount of calcium and tin in the grid alloy imparts strength
to the plate and guarantees durability even in extensive cycle service. Lead dioxide paste is
added to the grid to form the electrically active material.
In the charged state, the negative plate paste is pure lead and that of the positive lead
dioxide. Both of these are in a porous or spongy form to optimize surface area and thereby
maximize capacity. The heavy duty lead calcium alloy grids provide an extra margin of
performance and life in both cyclic and float applications and give unparalleled recovery from
deep discharge.
Separators
Power-Sonic separators are made of non-woven glass fiber cloth with high heat and oxidation
resistance. The material further offers superior electrolyte absorption and retaining ability, as
well as excellent ion conductivity.
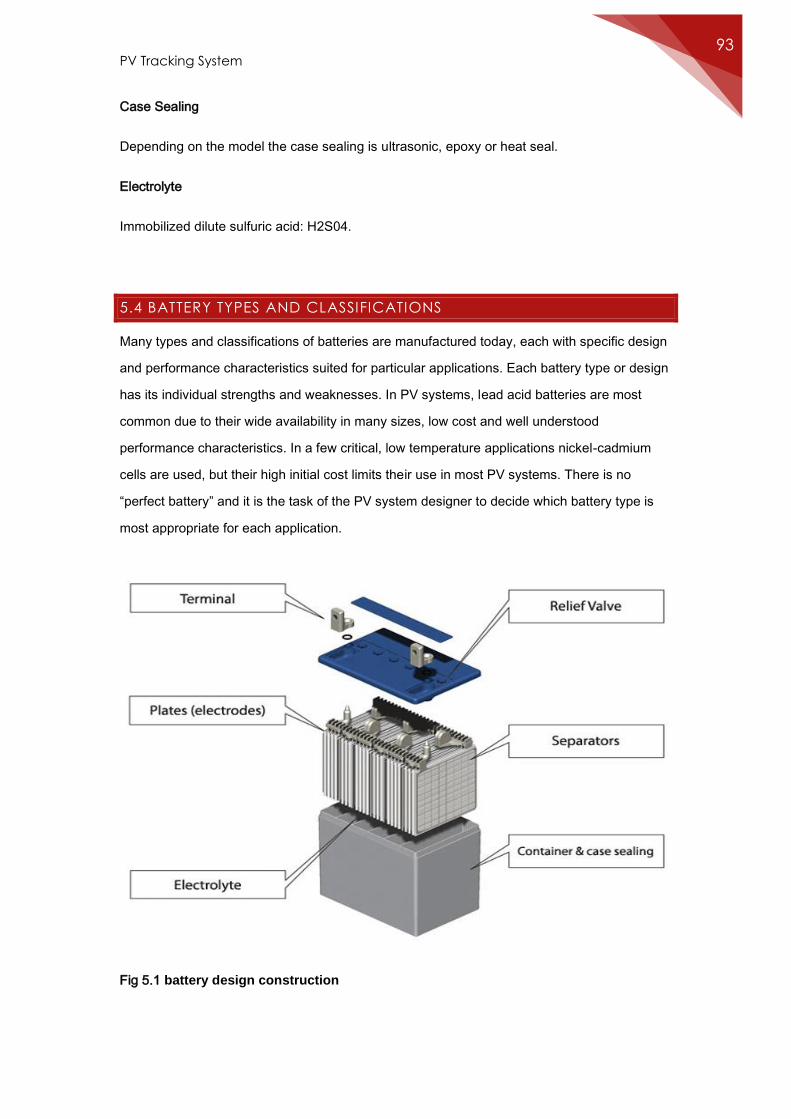
PV Tracking System 93
Case Sealing
Depending on the model the case sealing is ultrasonic, epoxy or heat seal.
Electrolyte
Immobilized dilute sulfuric acid: H2S04.
5.4 BATTERY TYPES AND CLASSIFICATIONS
Many types and classifications of batteries are manufactured today, each with specific design
and performance characteristics suited for particular applications. Each battery type or design
has its individual strengths and weaknesses. In PV systems, lead acid batteries are most
common due to their wide availability in many sizes, low cost and well understood
performance characteristics. In a few critical, low temperature applications nickel-cadmium
cells are used, but their high initial cost limits their use in most PV systems. There is no
“perfect battery” and it is the task of the PV system designer to decide which battery type is
most appropriate for each application.
Fig 5.1 battery design construction
Chapter 5
Battery and Charger Controller
94
In general, electrical storage batteries can be divided into two major categories, primary and
secondary batteries.
5.4.1 PRIMARY BATTERIES
Primary batteries can store and deliver electrical energy, but cannot be recharged. Typical
carbon-zinc and lithium batteries commonly used in consumer electronic devices are primary
batteries. Primary batteries are not used in PV systems because they cannot be recharged.
5.4.2 SECONDARY BATTERIES
A secondary battery can store and deliver electrical energy, and can be recharged by passing
a current through it in an opposite direction to the discharge current. Common lead-acid
batteries used in automobiles and PV systems are secondary batteries.
Lead Acid Battery
Lead acid batteries, the oldest type of rechargeable batteries are still used today. Most people
today still use them quite significantly as a matter of fact, these are the batteries found in our
cars. The life expectancy of these batteries is not the greatest, but also not the worst. The
average lifespan of a car battery is about 5 to 8 years before the battery itself dies. There are
also other factors that can help to prolong the battery’s life as well. This can be seen through
the way in which lead acid batteries can be charged or recharged
There are several types of lead-acid batteries manufactured. The following sections describe
the types of lead-acid batteries commonly used in PV systems.
Lead-Antimony Batteries
Lead-antimony batteries are a type of lead-acid battery which use antimony (Sb) as the
primary alloying element with lead in the plate grids. The use of lead-antimony alloys in the
grids has both advantages and disadvantages.
Advantages include providing greater mechanical strength than pure lead grids, and excellent
deep discharge and high discharge rate performance. Lead-antimony grids also limit the
shedding of active material and have better lifetime than lead-calcium batteries when
operated at higher temperatures.
PV Tracking System 95
Disadvantages of lead-antimony batteries are a high self-discharge rate, and as the result of
necessary overcharge, require frequent water additions depending on the temperature and
amount of overcharge.
Lead-antimony batteries with thick plates and robust design are generally classified as motive
power or traction type batteries, are widely available and are typically used in electrically
operated vehicles where deep cycle long-life performance is required.
Lead-Calcium Batteries
Lead-calcium batteries are a type of lead-acid battery which uses calcium (Ca) as the primary
alloying element with lead in the plate grids. Like lead-antimony, the use of lead-calcium
alloys in the grids has both advantages and disadvantage.
Advantages include providing greater mechanical strength than pure lead grids, a low self-
discharge rate, and reduced gassing resulting in lower water loss and lower maintenance
requirements than for lead-antimony batteries.
Disadvantages of lead-calcium batteries include poor charge acceptance after deep
discharges and shortened battery life at higher operating temperatures and if discharged to
greater than 25% depth of discharge repeatedly.
Lead-Antimony/Lead-Calcium Hybrid
These are typically flooded batteries, with capacity ratings of over 200 ampere-hours.
A common design for this battery type uses lead-calcium tubular positive electrodes and
pasted lead-antimony negative plates. This design combines the advantages of both lead-
calcium and lead-antimony design, including good deep cycle performance, low water loss
and long life. Stratification and sulfation can also be a problem with these batteries, and must
be treated accordingly. These batteries are sometimes used in PV systems with larger
capacity and deep cycle requirements. A common hybrid battery using tubular plates is the
Exide Solar battery line manufactured in the United States.
Captive Electrolyte Lead-Acid Batteries
These which we use in our project to store the energy from PV system, because it suitable
type, easy to portable, robust, and have medium cost.
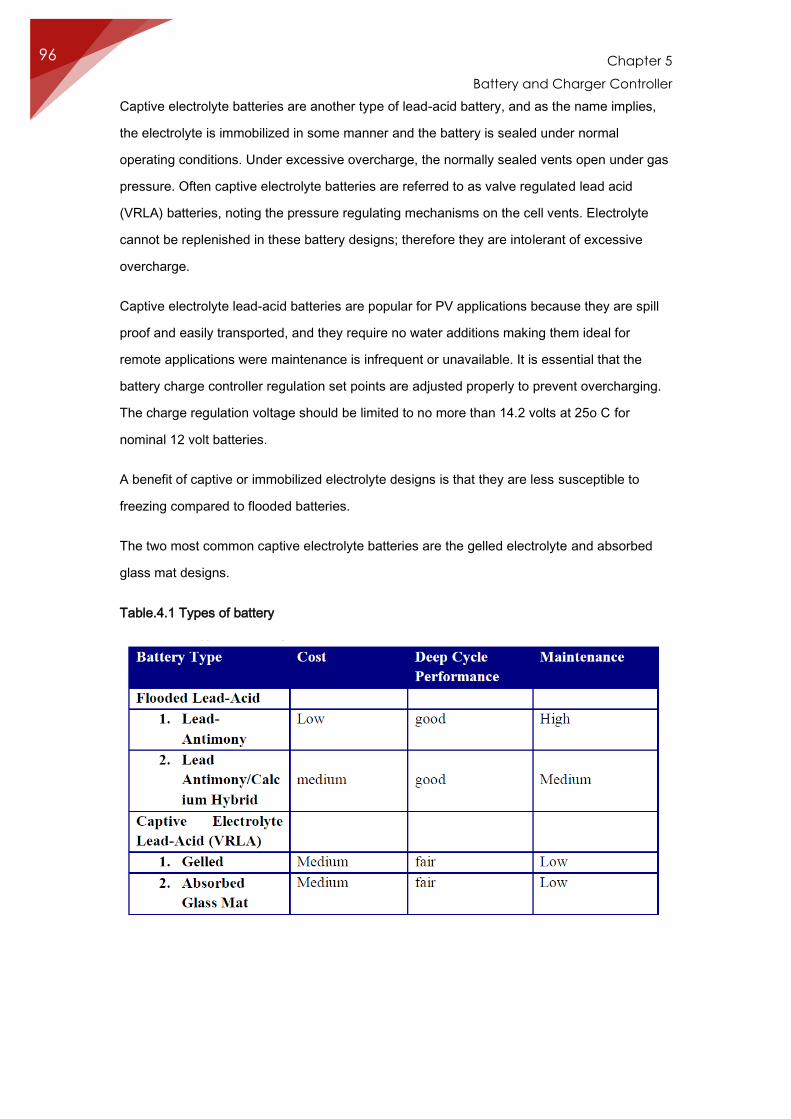
Chapter 5
Battery and Charger Controller
96
Captive electrolyte batteries are another type of lead-acid battery, and as the name implies,
the electrolyte is immobilized in some manner and the battery is sealed under normal
operating conditions. Under excessive overcharge, the normally sealed vents open under gas
pressure. Often captive electrolyte batteries are referred to as valve regulated lead acid
(VRLA) batteries, noting the pressure regulating mechanisms on the cell vents. Electrolyte
cannot be replenished in these battery designs; therefore they are intolerant of excessive
overcharge.
Captive electrolyte lead-acid batteries are popular for PV applications because they are spill
proof and easily transported, and they require no water additions making them ideal for
remote applications were maintenance is infrequent or unavailable. It is essential that the
battery charge controller regulation set points are adjusted properly to prevent overcharging.
The charge regulation voltage should be limited to no more than 14.2 volts at 25o C for
nominal 12 volt batteries.
A benefit of captive or immobilized electrolyte designs is that they are less susceptible to
freezing compared to flooded batteries.
The two most common captive electrolyte batteries are the gelled electrolyte and absorbed
glass mat designs.
Table.4.1 Types of battery
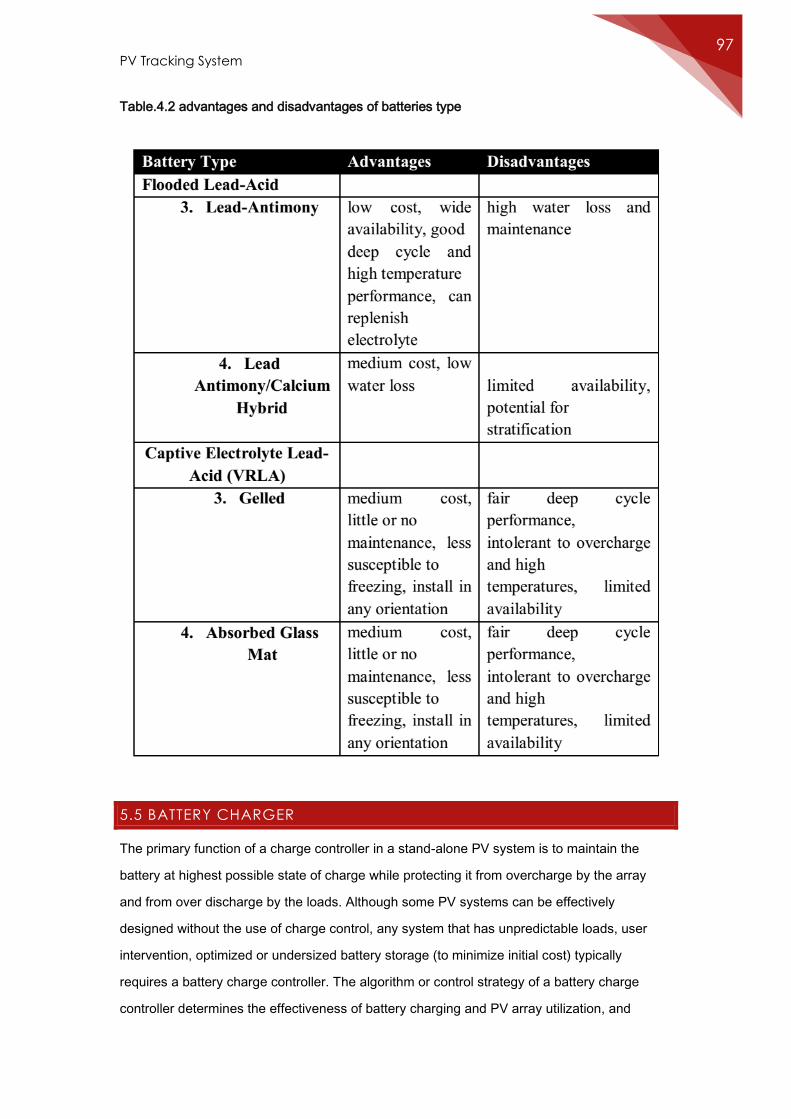
PV Tracking System 97
Table.4.2 advantages and disadvantages of batteries type
5.5 BATTERY CHARGER
The primary function of a charge controller in a stand-alone PV system is to maintain the
battery at highest possible state of charge while protecting it from overcharge by the array
and from over discharge by the loads. Although some PV systems can be effectively
designed without the use of charge control, any system that has unpredictable loads, user
intervention, optimized or undersized battery storage (to minimize initial cost) typically
requires a battery charge controller. The algorithm or control strategy of a battery charge
controller determines the effectiveness of battery charging and PV array utilization, and
Chapter 5
Battery and Charger Controller
98
ultimately the ability of the system to meet the load demands. Additional features such as
temperature compensation, alarms, meters, remote voltage sense leads and special
algorithms can enhance the ability of a charge controller to maintain the health and extend the
lifetime of a battery, as well as providing an indication of operational status to the system
caretaker.
Important functions of battery charge controllers and system controls are:
Prevent Battery Overcharge: to limit the energy supplied to the battery by the PV array when
the battery becomes fully charged.
Prevent Battery Over discharge: to disconnect the battery from electrical loads when the
battery reaches low state of charge.
Provide Load Control Functions: to automatically connect and disconnect an electrical load at
a specified time, for example operating a lighting load from sunset to sunrise.
5.5.1 OVERCHARGE PROTECTION
A photovoltaic system with battery storage is designed so that it will meet the system
electrical load requirements under reasonably determined worst-case conditions, usually for
the month of the year with the lowest isolation to load ratio. When the array is operating under
good-to-excellent weather conditions (typically during summer), energy generated by the
array often exceeds the electrical load demand. To prevent battery damage resulting from
overcharge, a charge controller is used to protect the battery. A charge controller should
prevent overcharge of a battery regardless of the system sizing/design and seasonal changes
in the load profile, operating temperatures and solar isolation.
Charge regulation is the primary function of a battery charge controller, and perhaps the
single most important issue related to battery performance and life. The purpose of a charge
controller is to supply power to the battery in a manner which fully recharges the battery
without overcharging. Without charge control, the current from the array will flow into a battery
proportional to the irradiance, whether the battery needs charging or not. If the battery is fully
charged, unregulated charging will cause the battery voltage to reach exceedingly high levels,
causing severe gassing, electrolyte loss, internal heating and accelerated grid corrosion. In
PV Tracking System 99
most cases if a battery is not protected from overcharge in PV system, premature failure of
the battery and loss of load are likely to occur.
Charge controllers prevent excessive battery overcharge by interrupting or limiting the current
flow from the array to the battery when the battery becomes fully charged.
Charge regulation is most often accomplished by limiting the battery voltage to a maximum
value, often referred to as the voltage regulation (VR) set point.
Sometimes, other methods such as integrating the ampere-hours into and out of the battery
are used.
Depending on the regulation method, the current may be limited while maintaining the
regulation voltage, or remain disconnected until the battery voltage drops to the array
reconnect voltage (ARV) set point. A further discussion of charge regulation strategies set
points is contained later in this chapter.
5.5.2 OVER DISCHARGE PROTECTION
During periods of below average isolation and/or during periods of excessive electrical load
usage, the energy produced by the PV array may not be sufficient enough to keep the battery
fully recharged. When a battery is deeply discharged, the reaction in the battery occurs close
to the grids, and weakens the bond between the active materials and the grids. When a
battery is excessively discharged repeatedly, loss of capacity and life will eventually occur. To
protect batteries from over discharge, most charge controllers include an optional feature to
disconnect the system loads once the battery reaches a low voltage or low state of charge
condition.
In some cases, the electrical loads in a PV system must have sufficiently high enough voltage
to operate. If batteries are too deeply discharged, the voltage falls below the operating range
of the loads, and the loads may operate improperly or not at all. This is another important
reason to limit battery over discharge in PV systems.
Over discharge protection in charge controllers is usually accomplished by open circuiting the
connection between the battery and electrical load when the battery reaches a pre-set or
adjustable low voltage load disconnect (LVD) set point. Most charge controllers also have an
indicator light or audible alarm to alert the system user/operator to the load disconnect
Chapter 5
Battery and Charger Controller
100
condition. Once the battery is recharged to a certain level, the loads are again reconnected to
a battery.
Non-critical systems loads are generally always protected from over discharging the battery
by connection to the low voltage load disconnect circuitry of the charge controller. If the
battery voltage falls to a low but safe level, a relay can open and disconnect the load,
preventing further battery discharge. Critical loads can be connected directly to the battery, so
that they are not automatically disconnected by the charge controller.
However, the danger exists that these critical loads might over discharge the battery.
An alarm or other method of user feedback should be included to give information on the
battery status if critical loads are connected directly to the battery.
5.6 CHARGE CONTROLLER TERMINOLOGY AND DEFINITIONS
Charge regulation is the primary function of a battery charge controller, and perhaps the
single most important issue related to battery performance and life. The purpose of a charge
controller is to supply power to the battery in a manner to fully recharge the battery without
overcharging. Regulation or limiting the PV array current to a battery in a PV system may be
accomplished by several methods. The most popular method is battery voltage sensing,
however other methods such as amp hour integration are also employed.
Generally, voltage regulation is accomplished by limiting the PV array current at a predefined
charge regulation voltage. Depending on the regulation algorithm, the current may be limited
while maintaining the regulation voltage, or remain disconnected until the battery voltage
drops to the array reconnect set point.
While the specific regulation method or algorithm varies among charge controllers, all have
basic parameters and characteristics. Charge controller manufacturer's data generally
provides the limits of controller application such as PV and load currents, operating
temperatures, parasitic losses, set points, and set point hysteresis values. In some cases the
set points may be dependent upon the temperature of the battery and/or controller, and the
magnitude of the battery current. A discussion of basic charge controller terminology follows:
PV Tracking System 101
Charge Controller Set Points:
The battery voltage levels at which a charge controller performs control or switching functions
are called the controller set points. Four basic control set points are defined for most charge
controllers that have battery overcharge and over discharge protection features. The voltage
regulation (VR) and the array reconnect voltage (ARV) refer to the voltage set points at which
the array is connected and disconnected from the battery. The low voltage loads disconnect
(LVD) and load reconnect voltage (LRV) refers to the voltage set points at which the load is
disconnected from the battery to prevent over discharge. A detailed discussion of each
charge controller set point follows.
High Voltage Disconnect (HVD) Set Point
The high voltages disconnect (HVD) set point is one of the key specifications for charge
controllers. The voltage regulation set point is the maximum voltage that the charge controller
allows the battery to reach, limiting the overcharge of the battery.
Once the controller senses that the battery reaches the voltage regulation set point, the
controller will either discontinue battery charging or begin to regulate the amount of current
delivered to the battery.
Array Reconnect Voltage (ARV) Set Point
In interrupting (on-off) type controllers, once the module or array current is disconnected at
the voltage regulation set point, the battery voltage will begin to decrease. If the charge and
discharge rates are high, the battery voltage will decrease at a greater rate when the battery
voltage decreases to a predefined voltage, the module is again reconnected to the battery for
charging. The voltage at which the module is reconnected is defined as the array reconnects
voltage (ARV) set point.
Voltage Regulation Hysteresis (VRH)
The voltage differences between the high voltages disconnect set point and the array
reconnect voltage is often called the voltage regulation hysteresis (VRH). The VRH is a major
factor which determines the effectiveness of battery recharging for interrupting (on-off) type
controller. If the hysteresis is too big, the module current remains disconnected for long
Chapter 5
Battery and Charger Controller
102
periods, effectively lowering the module energy utilization and making it very difficult to fully
recharge the battery. If the regulation hysteresis is too small, the module will cycle on and off
rapidly. Most interrupting (on-off) type controllers have hysteresis values between 0.4 and 1.4
volts for nominal 12 volts systems.
Low Voltage Load Disconnect (LVD) Set Point
Deep discharging the battery can make it susceptible to freezing and shorten its operating life.
If battery voltage drops too low, due to prolonged bad weather or certain non-essential loads
are connected the charge controller disconnected the load from the battery to prevent further
discharge. This can be done using a low voltage load disconnect (LVD) device is connected
between the battery and non-essential loads. The LVD is either a relay or a solid-state switch
that interrupts the current from the battery to the load.
Load Reconnect Voltage (LRV) Set Point
The battery voltage at which a controller allows the load to be reconnected to the battery is
called the load reconnect voltage (LRV). After the controller disconnects the load from the
battery at the LVD set point, the battery voltage rises to its open circuit voltage. When the PV
module connected for charging, the battery voltage rises even more. At some point, the
controller senses that the battery voltage and state of charge are high enough to reconnect
the load, called the load reconnect voltage set point. LRV should be 0.08 V/cell (or 0.5 V per
12 V) higher than the load disconnection voltage. Typically LVD set points used in small PV
systems are between 12.5 volts and 13.0 volts for most nominal 12 volt lead-acid battery. If
the LRV set point is selected too low, the load may be reconnected before the battery has
been charged.
Low Voltage Load Disconnect Hysteresis (LVLH)
The voltage difference between the low voltage disconnect set point and the load reconnect
voltage is called the low voltage disconnect hysteresis. If the low voltage disconnect
hysteresis is too small, the load may cycle on and off rapidly at low battery state-of-charge
(SOC), possibly damaging the load or controller, and extending the time it required to charge
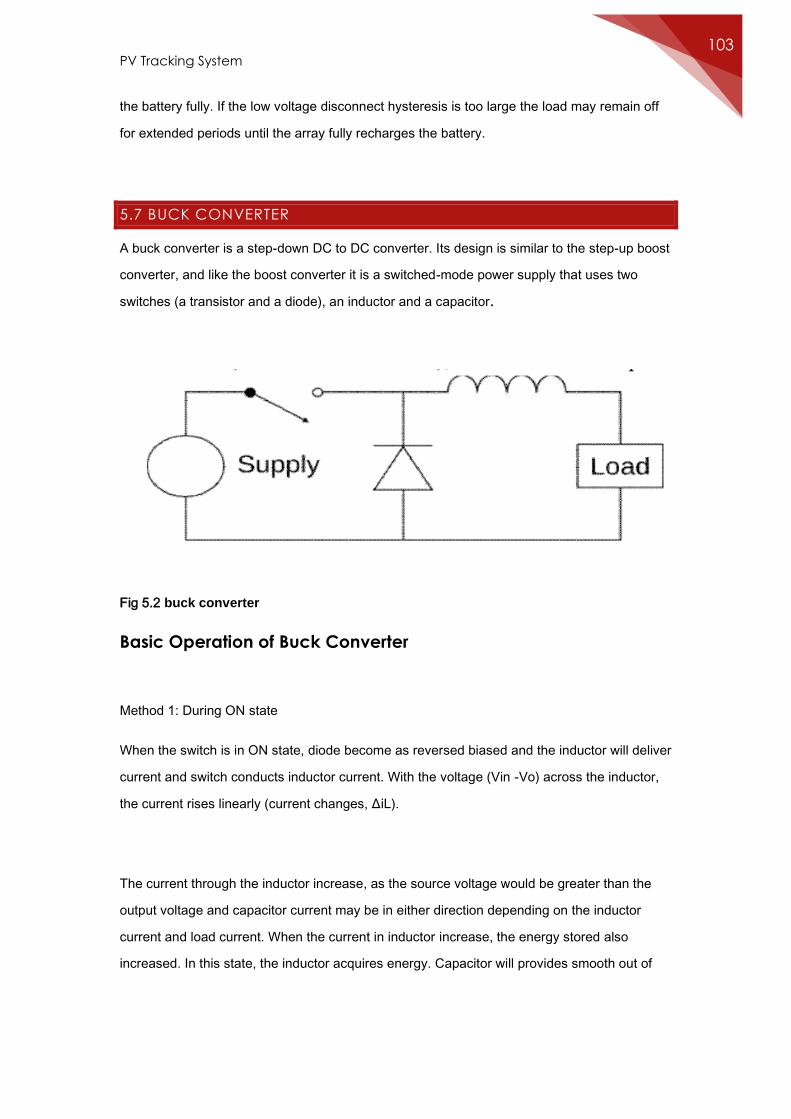
PV Tracking System 103
the battery fully. If the low voltage disconnect hysteresis is too large the load may remain off
for extended periods until the array fully recharges the battery.
5.7 BUCK CONVERTER
A buck converter is a step-down DC to DC converter. Its design is similar to the step-up boost
converter, and like the boost converter it is a switched-mode power supply that uses two
switches (a transistor and a diode), an inductor and a capacitor.
Fig 5.2 buck converter
Basic Operation of Buck Converter
Method 1: During ON state
When the switch is in ON state, diode become as reversed biased and the inductor will deliver
current and switch conducts inductor current. With the voltage (Vin -Vo) across the inductor,
the current rises linearly (current changes, ΔiL).
The current through the inductor increase, as the source voltage would be greater than the
output voltage and capacitor current may be in either direction depending on the inductor
current and load current. When the current in inductor increase, the energy stored also
increased. In this state, the inductor acquires energy. Capacitor will provides smooth out of
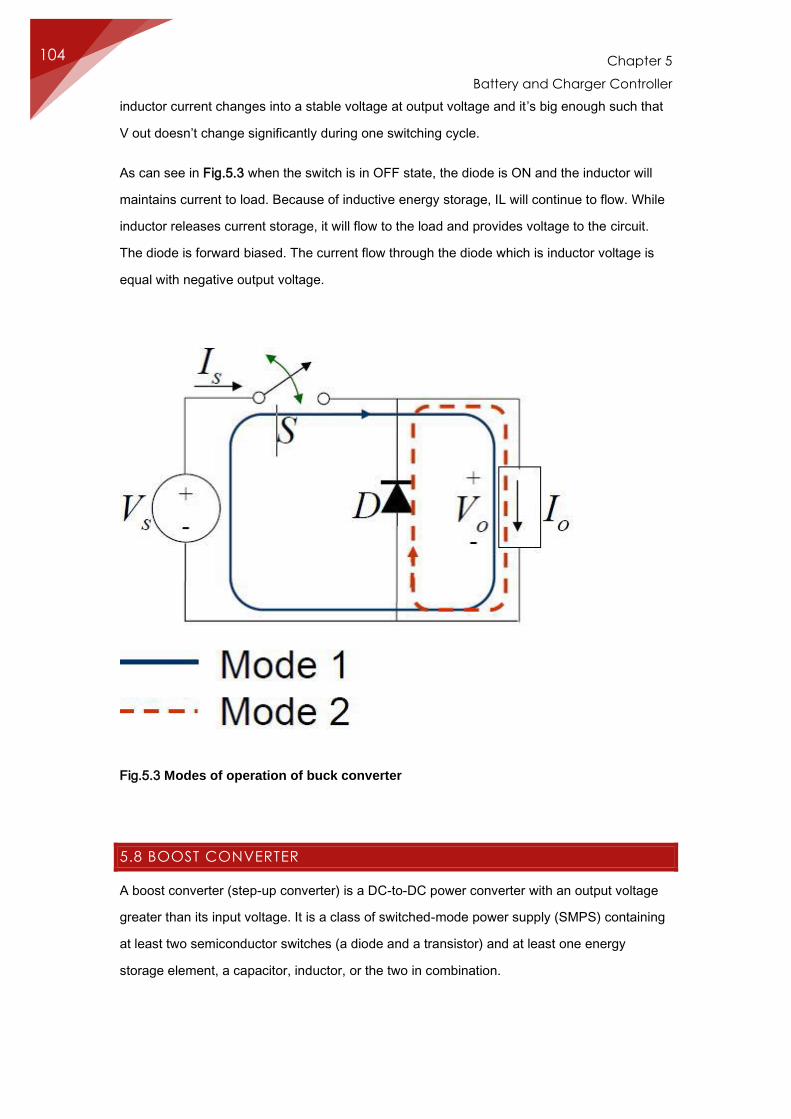
Chapter 5
Battery and Charger Controller
104
inductor current changes into a stable voltage at output voltage and it’s big enough such that
V out doesn’t change significantly during one switching cycle.
As can see in Fig.5.3 when the switch is in OFF state, the diode is ON and the inductor will
maintains current to load. Because of inductive energy storage, IL will continue to flow. While
inductor releases current storage, it will flow to the load and provides voltage to the circuit.
The diode is forward biased. The current flow through the diode which is inductor voltage is
equal with negative output voltage.
Fig.5.3 Modes of operation of buck converter
5.8 BOOST CONVERTER
A boost converter (step-up converter) is a DC-to-DC power converter with an output voltage
greater than its input voltage. It is a class of switched-mode power supply (SMPS) containing
at least two semiconductor switches (a diode and a transistor) and at least one energy
storage element, a capacitor, inductor, or the two in combination.
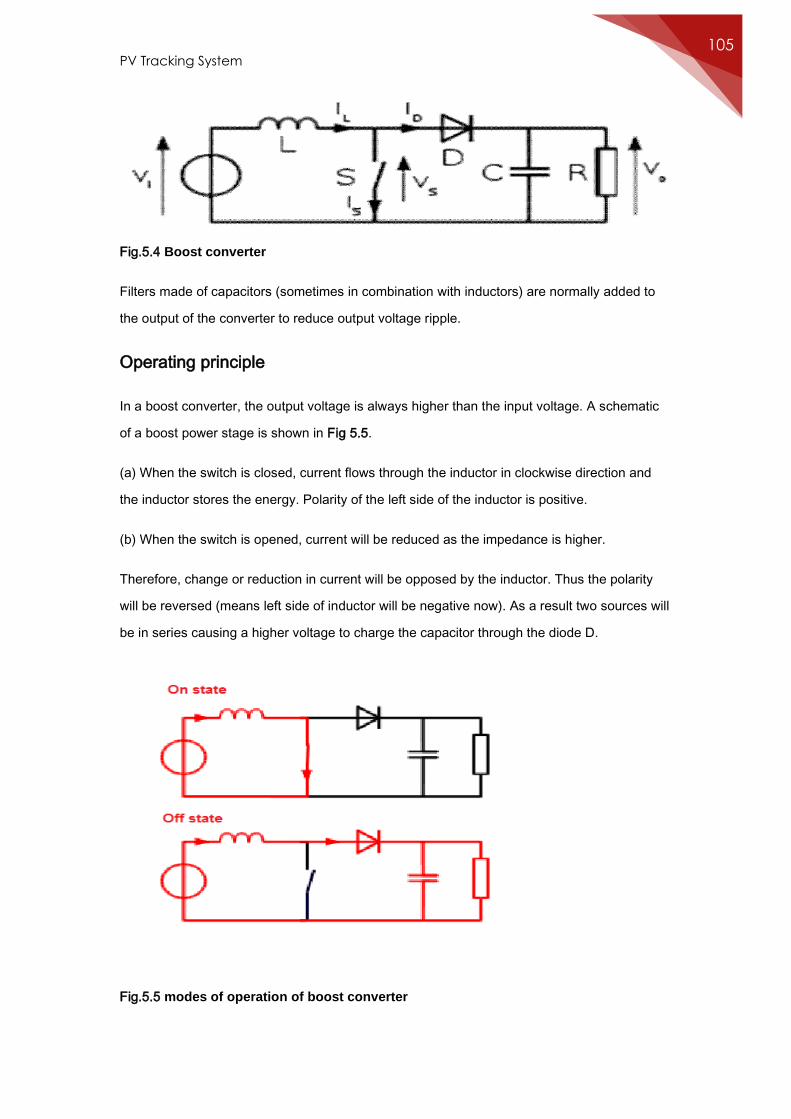
PV Tracking System 105
Fig.5.4 Boost converter
Filters made of capacitors (sometimes in combination with inductors) are normally added to
the output of the converter to reduce output voltage ripple.
Operating principle
In a boost converter, the output voltage is always higher than the input voltage. A schematic
of a boost power stage is shown in Fig 5.5.
(a) When the switch is closed, current flows through the inductor in clockwise direction and
the inductor stores the energy. Polarity of the left side of the inductor is positive.
(b) When the switch is opened, current will be reduced as the impedance is higher.
Therefore, change or reduction in current will be opposed by the inductor. Thus the polarity
will be reversed (means left side of inductor will be negative now). As a result two sources will
be in series causing a higher voltage to charge the capacitor through the diode D.
Fig.5.5 modes of operation of boost converter
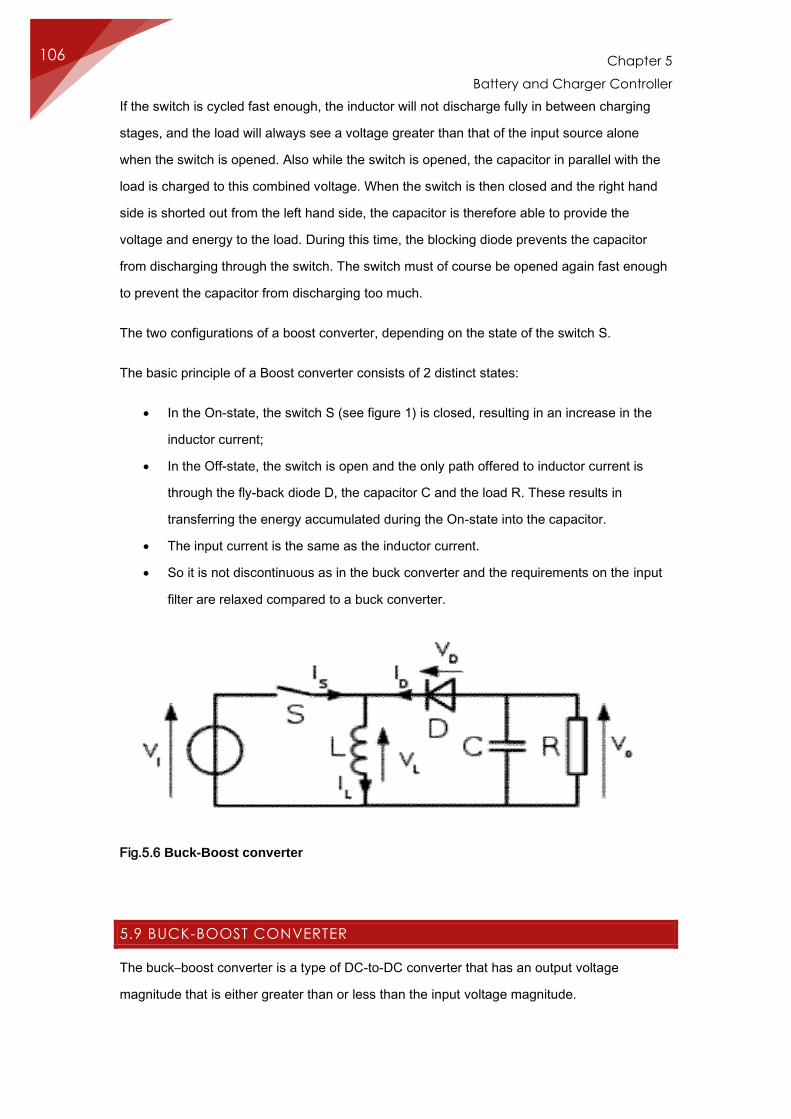
Chapter 5
Battery and Charger Controller
106
If the switch is cycled fast enough, the inductor will not discharge fully in between charging
stages, and the load will always see a voltage greater than that of the input source alone
when the switch is opened. Also while the switch is opened, the capacitor in parallel with the
load is charged to this combined voltage. When the switch is then closed and the right hand
side is shorted out from the left hand side, the capacitor is therefore able to provide the
voltage and energy to the load. During this time, the blocking diode prevents the capacitor
from discharging through the switch. The switch must of course be opened again fast enough
to prevent the capacitor from discharging too much.
The two configurations of a boost converter, depending on the state of the switch S.
The basic principle of a Boost converter consists of 2 distinct states:
In the On-state, the switch S (see figure 1) is closed, resulting in an increase in the
inductor current;
In the Off-state, the switch is open and the only path offered to inductor current is
through the fly-back diode D, the capacitor C and the load R. These results in
transferring the energy accumulated during the On-state into the capacitor.
The input current is the same as the inductor current.
So it is not discontinuous as in the buck converter and the requirements on the input
filter are relaxed compared to a buck converter.
Fig.5.6 Buck-Boost converter
5.9 BUCK-BOOST CONVERTER
The buck–boost converter is a type of DC-to-DC converter that has an output voltage
magnitude that is either greater than or less than the input voltage magnitude.
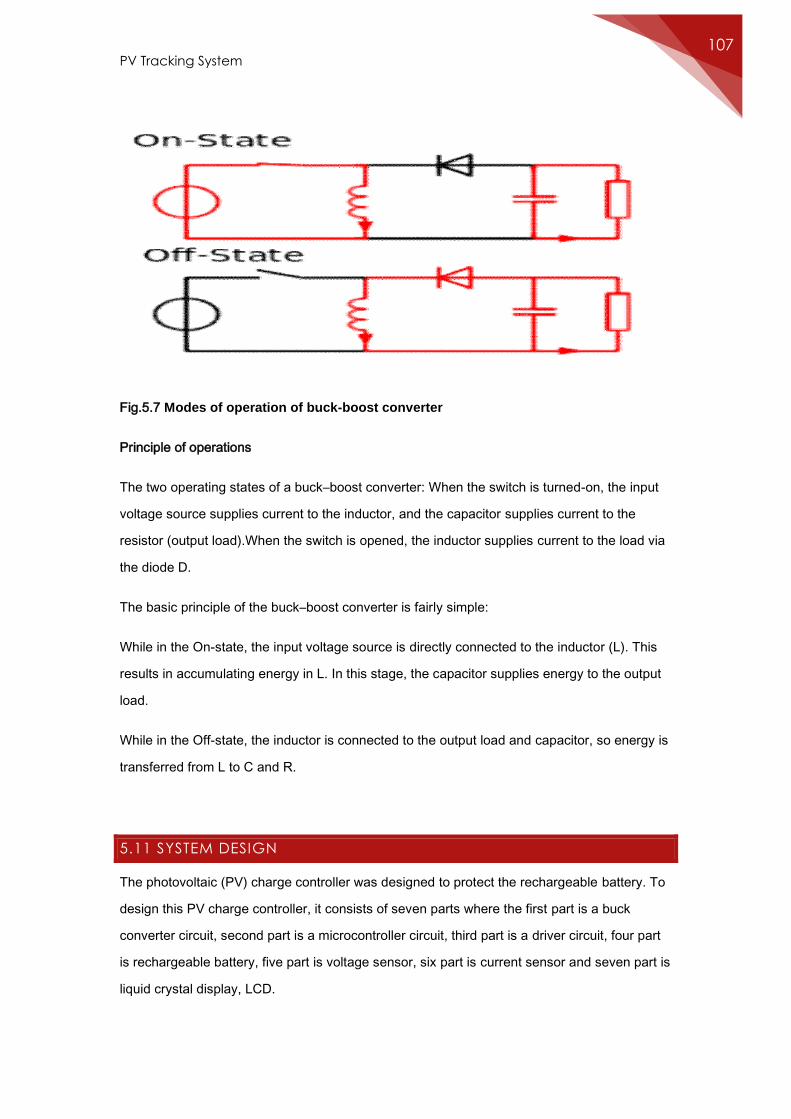
PV Tracking System 107
Fig.5.7 Modes of operation of buck-boost converter
Principle of operations
The two operating states of a buck–boost converter: When the switch is turned-on, the input
voltage source supplies current to the inductor, and the capacitor supplies current to the
resistor (output load).When the switch is opened, the inductor supplies current to the load via
the diode D.
The basic principle of the buck–boost converter is fairly simple:
While in the On-state, the input voltage source is directly connected to the inductor (L). This
results in accumulating energy in L. In this stage, the capacitor supplies energy to the output
load.
While in the Off-state, the inductor is connected to the output load and capacitor, so energy is
transferred from L to C and R.
5.11 SYSTEM DESIGN
The photovoltaic (PV) charge controller was designed to protect the rechargeable battery. To
design this PV charge controller, it consists of seven parts where the first part is a buck
converter circuit, second part is a microcontroller circuit, third part is a driver circuit, four part
is rechargeable battery, five part is voltage sensor, six part is current sensor and seven part is
liquid crystal display, LCD.
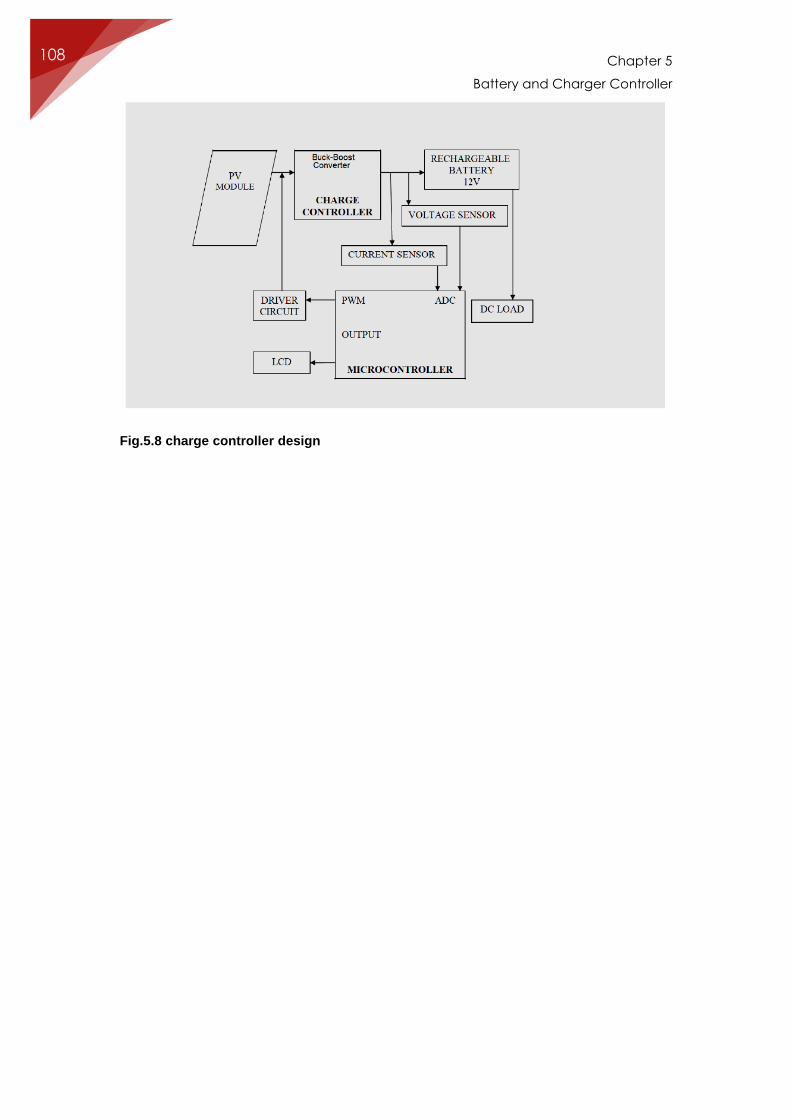
Chapter 5
Battery and Charger Controller
108
Fig.5.8 charge controller design
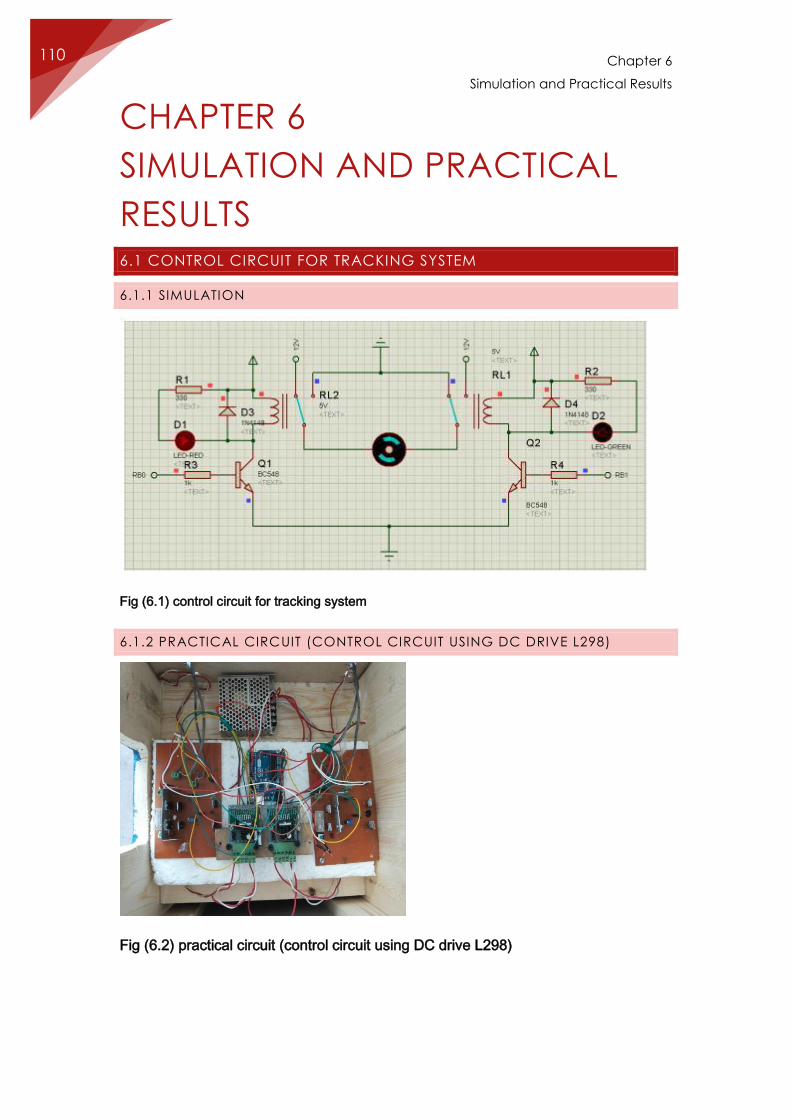
Chapter 6
Simulation and Practical Results
110
CHAPTER 6
SIMULATION AND PRACTICAL
RESULTS 6.1 CONTROL CIRCUIT FOR TRACKING SYSTEM
6.1.1 SIMULATION
Fig (6.1) control circuit for tracking system
6.1.2 PRACTICAL CIRCUIT (CONTROL CIRCUIT USING DC DRIVE L298)
Fig (6.2) practical circuit (control circuit using DC drive L298)
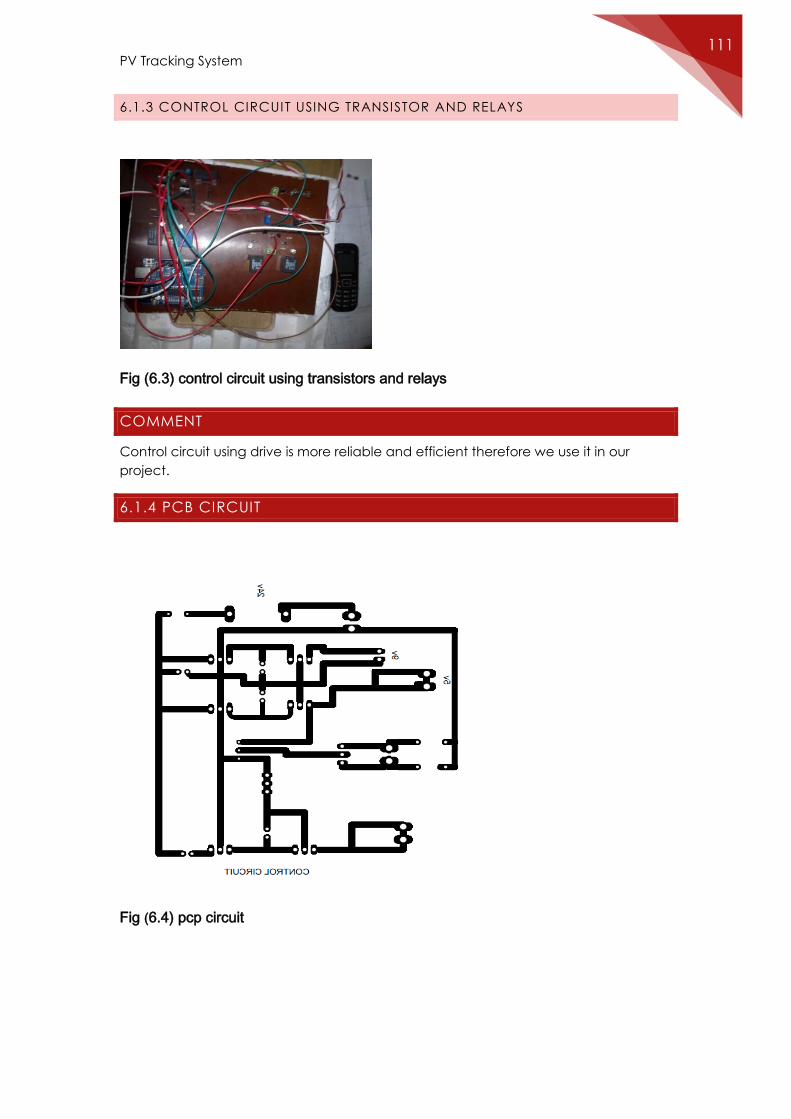
PV Tracking System 111
6.1.3 CONTROL CIRCUIT USING TRANSISTOR AND RELAYS
Fig (6.3) control circuit using transistors and relays
COMMENT
Control circuit using drive is more reliable and efficient therefore we use it in our
project.
6.1.4 PCB CIRCUIT
Fig (6.4) pcp circuit
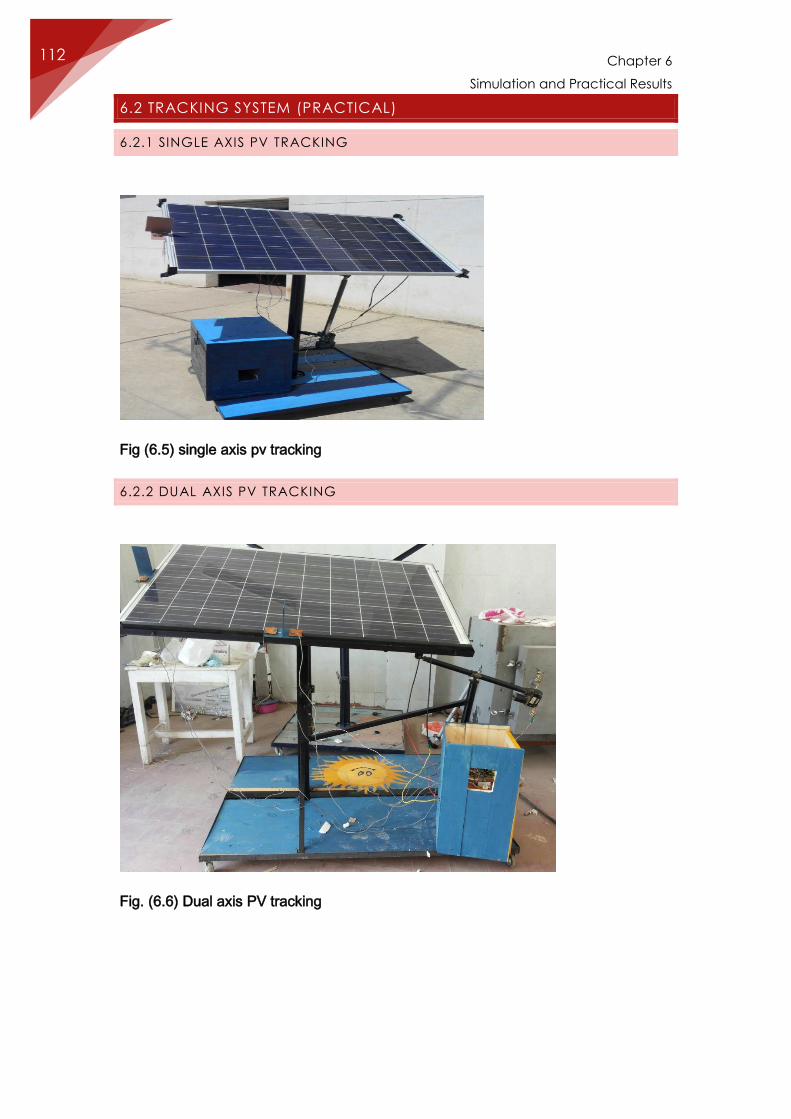
Chapter 6
Simulation and Practical Results
112
6.2 TRACKING SYSTEM (PRACTICAL)
6.2.1 SINGLE AXIS PV TRACKING
Fig (6.5) single axis pv tracking
6.2.2 DUAL AXIS PV TRACKING
Fig. (6.6) Dual axis PV tracking
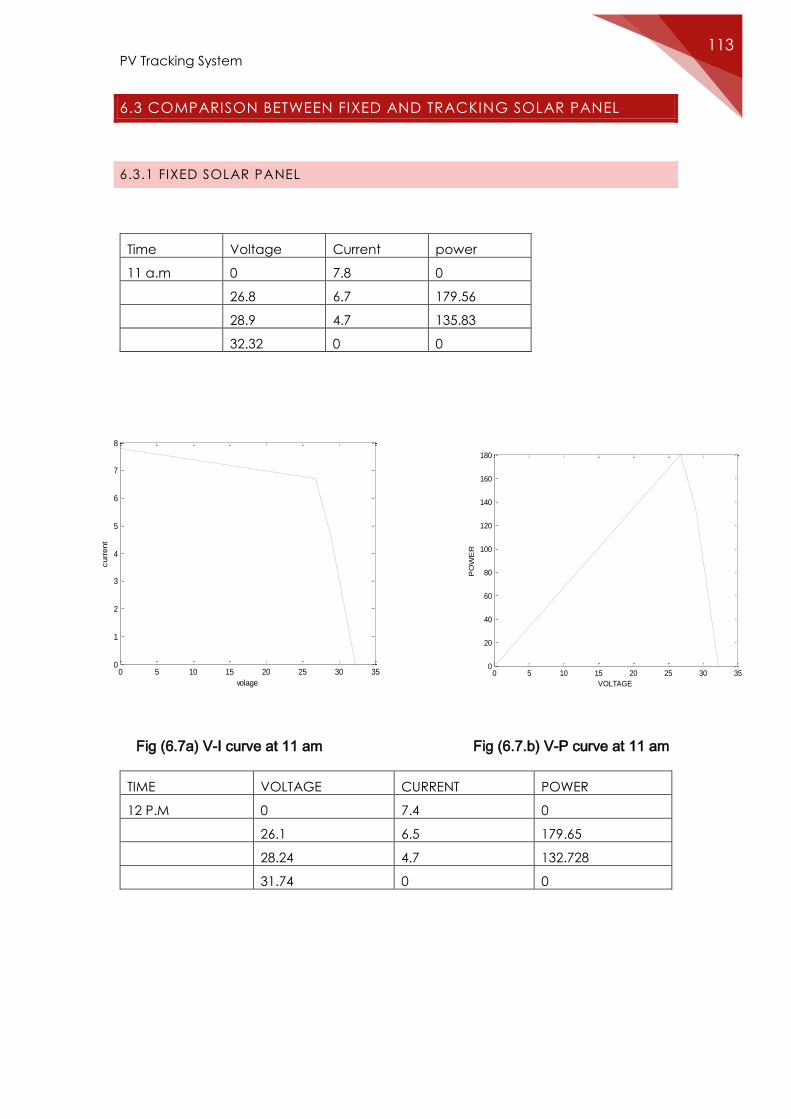
PV Tracking System 113
6.3 COMPARISON BETWEEN FIXED AND TRACKING SOLAR PANEL
6.3.1 FIXED SOLAR PANEL
Fig (6.7a) V-I curve at 11 am Fig (6.7.b) V-P curve at 11 am
TIME VOLTAGE CURRENT POWER
12 P.M 0 7.4 0
26.1 6.5 179.65
28.24 4.7 132.728
31.74 0 0
Time Voltage Current power
11 a.m 0 7.8 0
26.8 6.7 179.56
28.9 4.7 135.83
32.32 0 0
0 5 10 15 20 25 30 350
20
40
60
80
100
120
140
160
180
VOLTAGE
PO
WE
R
0 5 10 15 20 25 30 350
1
2
3
4
5
6
7
8
volage
curr
ent
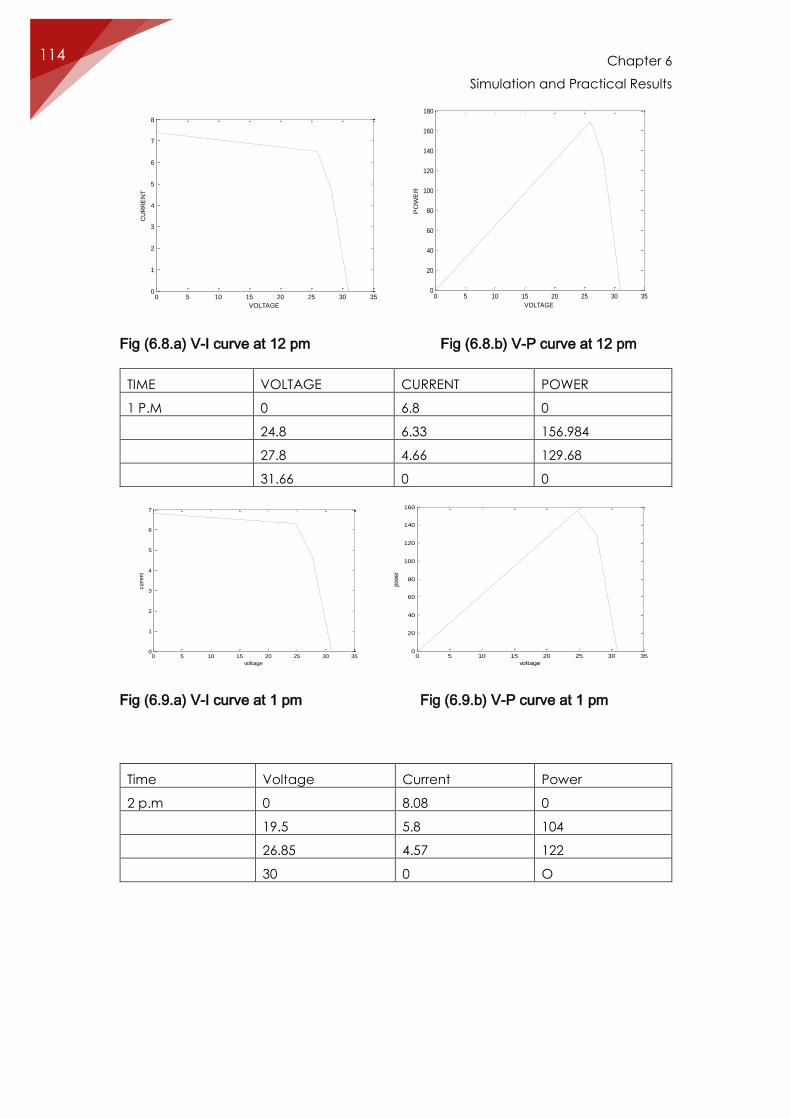
Chapter 6
Simulation and Practical Results
114
Fig (6.8.a) V-I curve at 12 pm Fig (6.8.b) V-P curve at 12 pm
TIME VOLTAGE CURRENT POWER
1 P.M 0 6.8 0
24.8 6.33 156.984
27.8 4.66 129.68
31.66 0 0
Fig (6.9.a) V-I curve at 1 pm Fig (6.9.b) V-P curve at 1 pm
Time Voltage Current Power
2 p.m 0 8.08 0
19.5 5.8 104
26.85 4.57 122
30 0 O
0 5 10 15 20 25 30 350
1
2
3
4
5
6
7
8
VOLTAGE
CU
RR
EN
T
0 5 10 15 20 25 30 350
20
40
60
80
100
120
140
160
180
VOLTAGE
PO
WE
R
0 5 10 15 20 25 30 350
1
2
3
4
5
6
7
voltage
curr
ent
0 5 10 15 20 25 30 350
20
40
60
80
100
120
140
160
voltage
pow
er
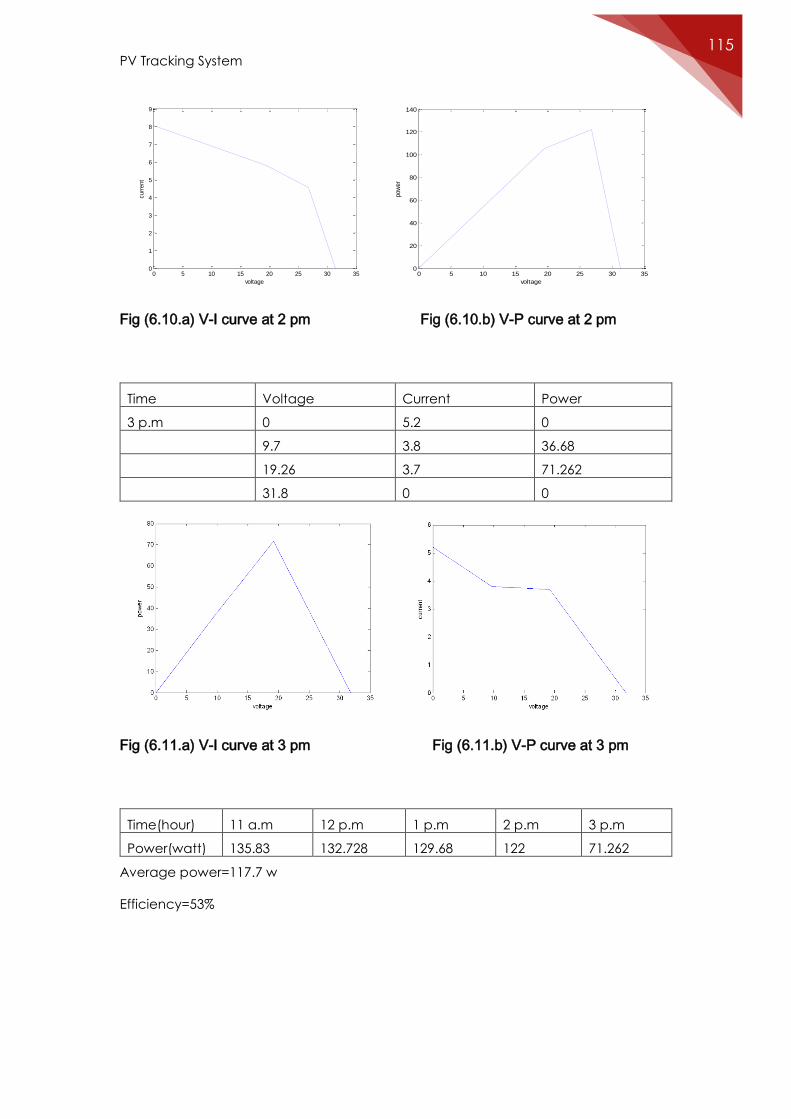
PV Tracking System 115
Fig (6.10.a) V-I curve at 2 pm Fig (6.10.b) V-P curve at 2 pm
Time Voltage Current Power
3 p.m 0 5.2 0
9.7 3.8 36.68
19.26 3.7 71.262
31.8 0 0
Fig (6.11.a) V-I curve at 3 pm Fig (6.11.b) V-P curve at 3 pm
Time(hour) 11 a.m 12 p.m 1 p.m 2 p.m 3 p.m
Power(watt) 135.83 132.728 129.68 122 71.262
Average power=117.7 w
Efficiency=53%
0 5 10 15 20 25 30 350
1
2
3
4
5
6
7
8
9
voltage
curr
ent
0 5 10 15 20 25 30 350
20
40
60
80
100
120
140
voltage
pow
er
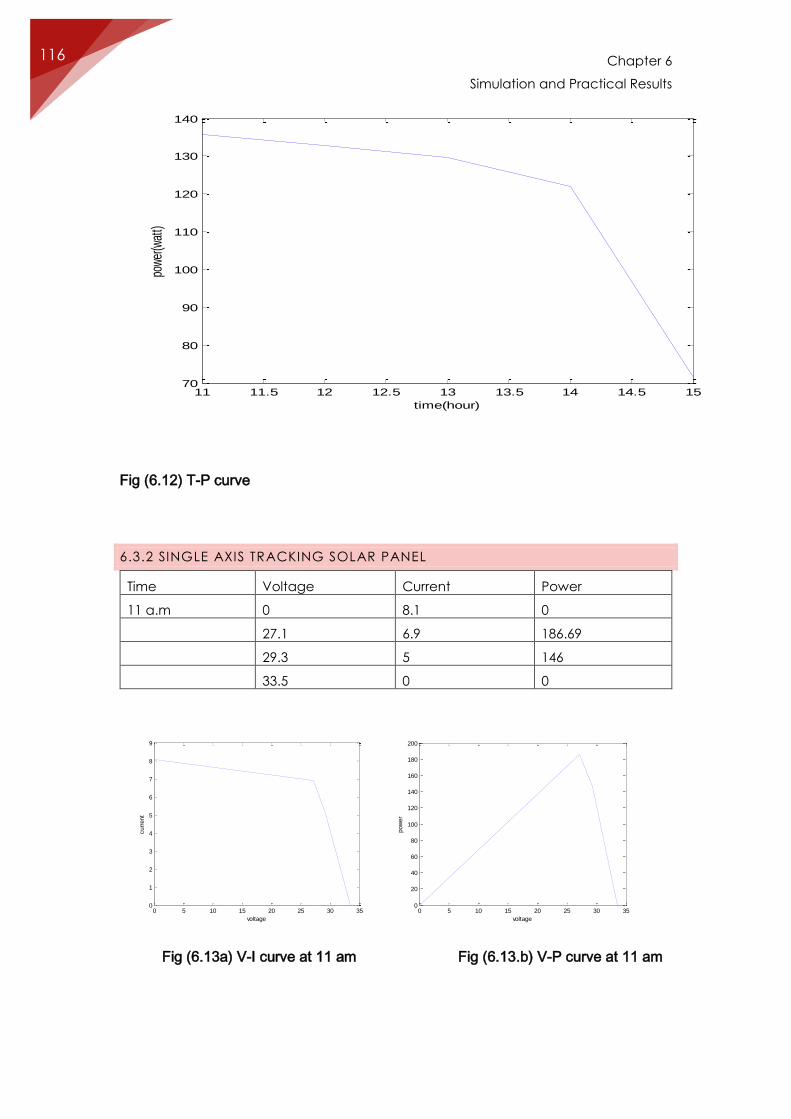
Chapter 6
Simulation and Practical Results
116
Fig (6.12) T-P curve
6.3.2 SINGLE AXIS TRACKING SOLAR PANEL
Time Voltage Current Power
11 a.m 0 8.1 0
27.1 6.9 186.69
29.3 5 146
33.5 0 0
Fig (6.13a) V-I curve at 11 am Fig (6.13.b) V-P curve at 11 am
11 11.5 12 12.5 13 13.5 14 14.5 1570
80
90
100
110
120
130
140
time(hour)
pow
er(w
att)
0 5 10 15 20 25 30 350
1
2
3
4
5
6
7
8
9
voltage
curr
ent
0 5 10 15 20 25 30 350
20
40
60
80
100
120
140
160
180
200
voltage
pow
er
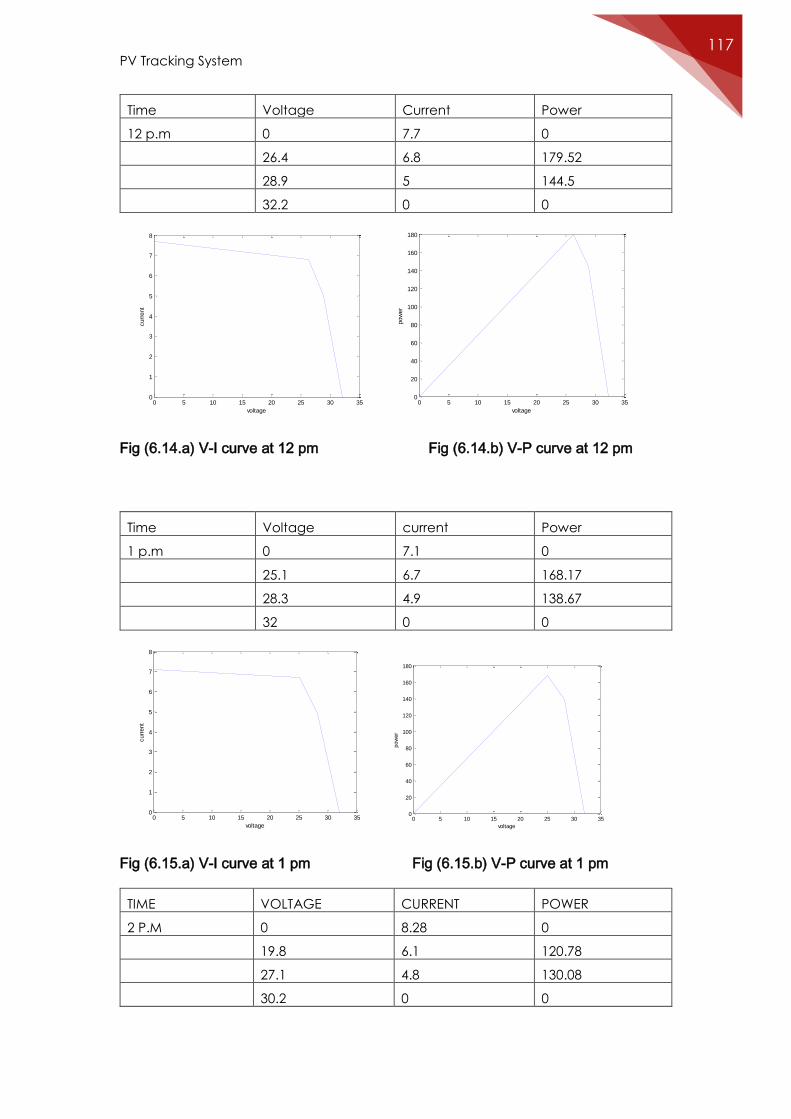
PV Tracking System 117
Time Voltage Current Power
12 p.m 0 7.7 0
26.4 6.8 179.52
28.9 5 144.5
32.2 0 0
Fig (6.14.a) V-I curve at 12 pm Fig (6.14.b) V-P curve at 12 pm
Time Voltage current Power
1 p.m 0 7.1 0
25.1 6.7 168.17
28.3 4.9 138.67
32 0 0
Fig (6.15.a) V-I curve at 1 pm Fig (6.15.b) V-P curve at 1 pm
TIME VOLTAGE CURRENT POWER
2 P.M 0 8.28 0
19.8 6.1 120.78
27.1 4.8 130.08
30.2 0 0
0 5 10 15 20 25 30 350
1
2
3
4
5
6
7
8
voltage
curr
ent
0 5 10 15 20 25 30 350
20
40
60
80
100
120
140
160
180
voltage
pow
er
0 5 10 15 20 25 30 350
1
2
3
4
5
6
7
8
voltage
curr
ent
0 5 10 15 20 25 30 350
20
40
60
80
100
120
140
160
180
voltage
pow
er
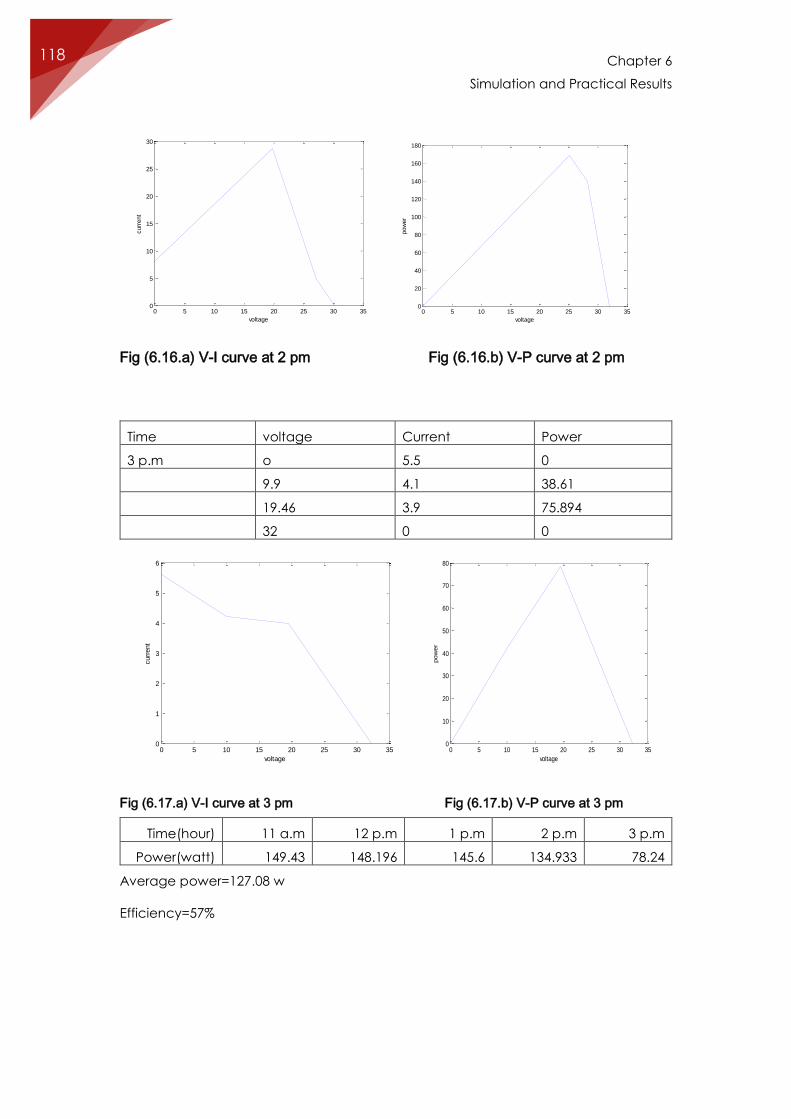
Chapter 6
Simulation and Practical Results
118
Fig (6.16.a) V-I curve at 2 pm Fig (6.16.b) V-P curve at 2 pm
Time voltage Current Power
3 p.m o 5.5 0
9.9 4.1 38.61
19.46 3.9 75.894
32 0 0
Fig (6.17.a) V-I curve at 3 pm Fig (6.17.b) V-P curve at 3 pm
Average power=127.08 w
Efficiency=57%
0 5 10 15 20 25 30 350
5
10
15
20
25
30
voltage
curr
ent
0 5 10 15 20 25 30 350
20
40
60
80
100
120
140
160
180
voltage
pow
er
0 5 10 15 20 25 30 350
1
2
3
4
5
6
voltage
curr
ent
0 5 10 15 20 25 30 350
10
20
30
40
50
60
70
80
voltage
pow
er
Time(hour) 11 a.m 12 p.m 1 p.m 2 p.m 3 p.m
Power(watt) 149.43 148.196 145.6 134.933 78.24
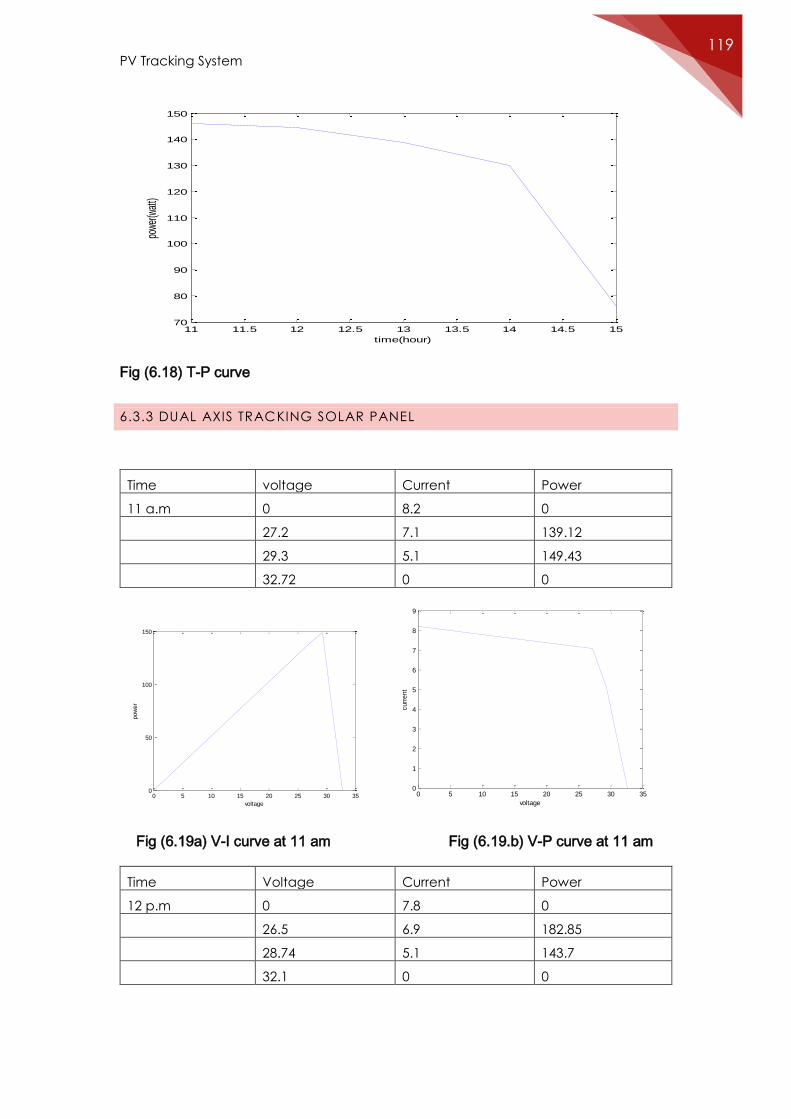
PV Tracking System 119
Fig (6.18) T-P curve
6.3.3 DUAL AXIS TRACKING SOLAR PANEL
Time voltage Current Power
11 a.m 0 8.2 0
27.2 7.1 139.12
29.3 5.1 149.43
32.72 0 0
Fig (6.19a) V-I curve at 11 am Fig (6.19.b) V-P curve at 11 am
Time Voltage Current Power
12 p.m 0 7.8 0
26.5 6.9 182.85
28.74 5.1 143.7
32.1 0 0
11 11.5 12 12.5 13 13.5 14 14.5 1570
80
90
100
110
120
130
140
150
time(hour)
powe
r(wat
t)
0 5 10 15 20 25 30 350
50
100
150
voltage
pow
er
0 5 10 15 20 25 30 350
1
2
3
4
5
6
7
8
9
voltage
curr
ent
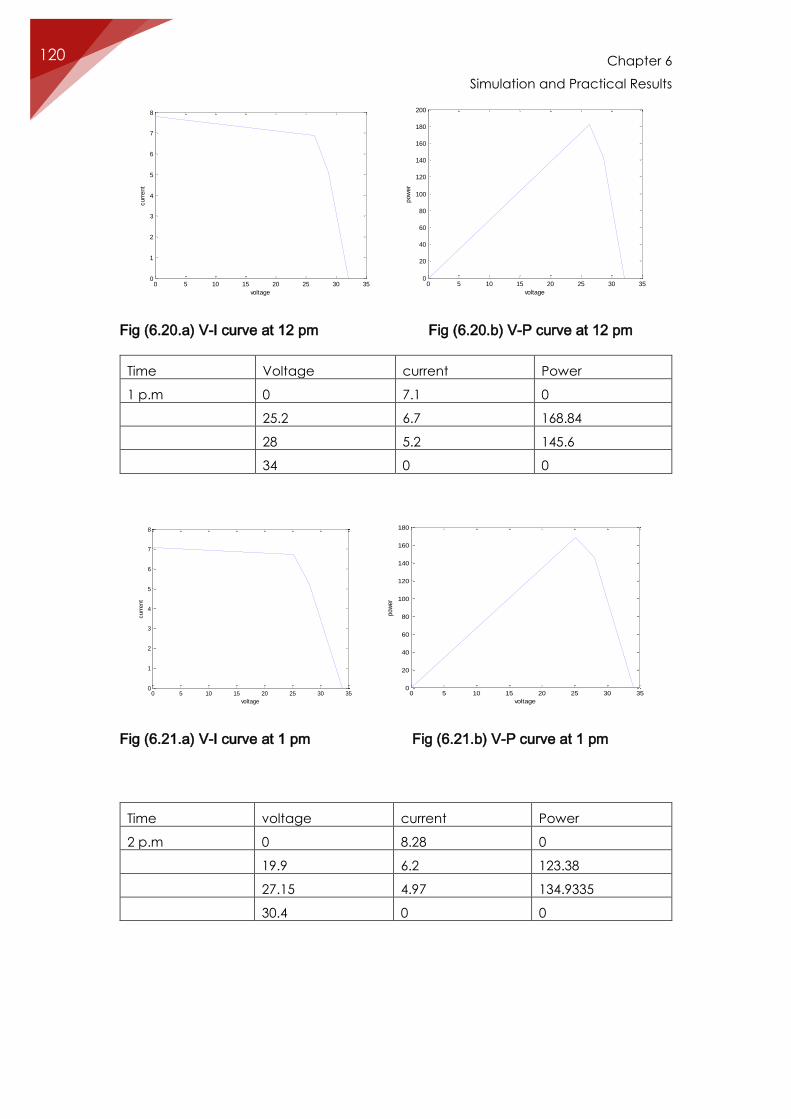
Chapter 6
Simulation and Practical Results
120
Fig (6.20.a) V-I curve at 12 pm Fig (6.20.b) V-P curve at 12 pm
Time Voltage current Power
1 p.m 0 7.1 0
25.2 6.7 168.84
28 5.2 145.6
34 0 0
Fig (6.21.a) V-I curve at 1 pm Fig (6.21.b) V-P curve at 1 pm
Time voltage current Power
2 p.m 0 8.28 0
19.9 6.2 123.38
27.15 4.97 134.9335
30.4 0 0
0 5 10 15 20 25 30 350
1
2
3
4
5
6
7
8
voltage
curr
ent
0 5 10 15 20 25 30 350
20
40
60
80
100
120
140
160
180
200
voltage
pow
er
0 5 10 15 20 25 30 350
1
2
3
4
5
6
7
8
voltage
curr
ent
0 5 10 15 20 25 30 350
20
40
60
80
100
120
140
160
180
voltage
pow
er
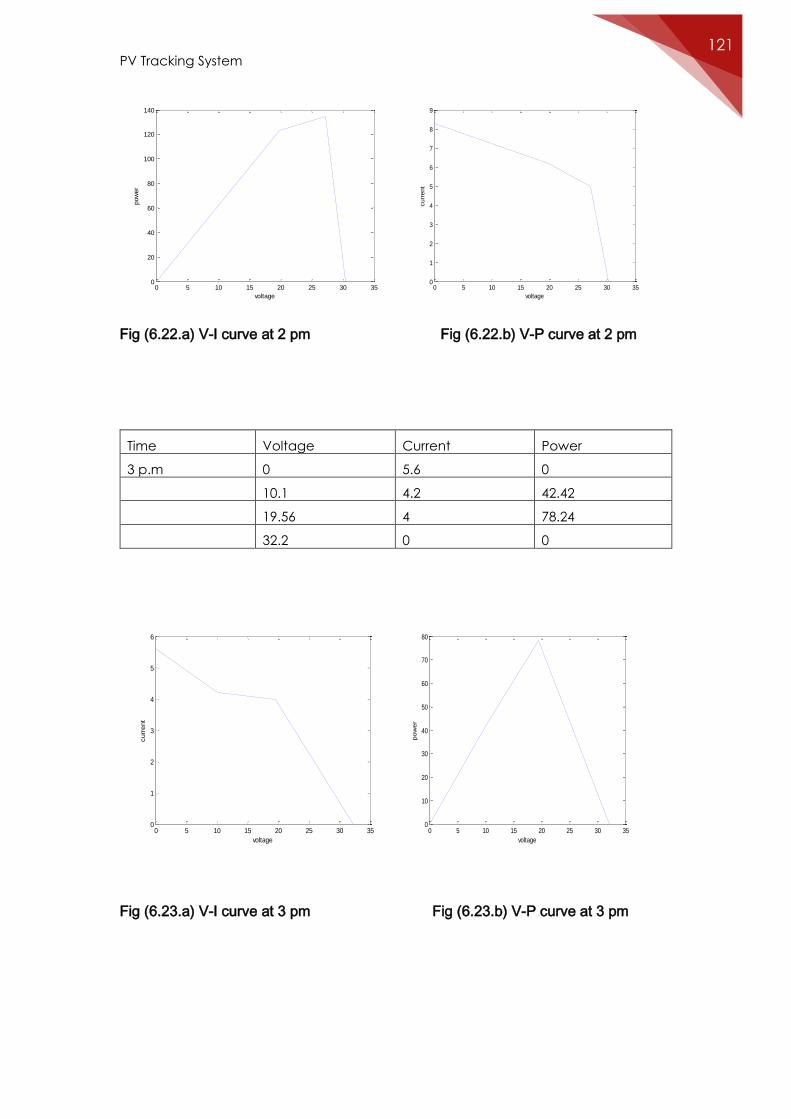
PV Tracking System 121
Fig (6.22.a) V-I curve at 2 pm Fig (6.22.b) V-P curve at 2 pm
Time Voltage Current Power
3 p.m 0 5.6 0
10.1 4.2 42.42
19.56 4 78.24
32.2 0 0
Fig (6.23.a) V-I curve at 3 pm Fig (6.23.b) V-P curve at 3 pm
0 5 10 15 20 25 30 350
20
40
60
80
100
120
140
voltage
pow
er
0 5 10 15 20 25 30 350
1
2
3
4
5
6
7
8
9
voltage
curr
ent
0 5 10 15 20 25 30 350
1
2
3
4
5
6
voltage
curr
ent
0 5 10 15 20 25 30 350
10
20
30
40
50
60
70
80
voltage
pow
er
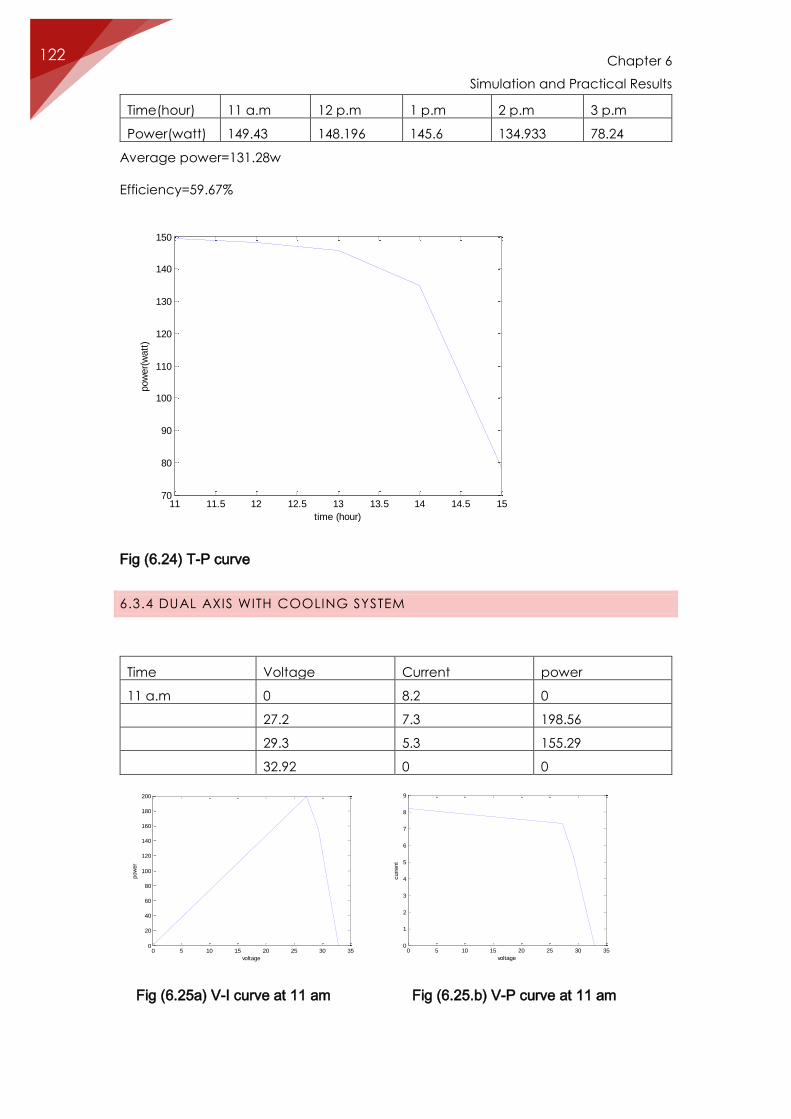
Chapter 6
Simulation and Practical Results
122
Time(hour) 11 a.m 12 p.m 1 p.m 2 p.m 3 p.m
Power(watt) 149.43 148.196 145.6 134.933 78.24
Average power=131.28w
Efficiency=59.67%
Fig (6.24) T-P curve
6.3.4 DUAL AXIS WITH COOLING SYSTEM
Time Voltage Current power
11 a.m 0 8.2 0
27.2 7.3 198.56
29.3 5.3 155.29
32.92 0 0
Fig (6.25a) V-I curve at 11 am Fig (6.25.b) V-P curve at 11 am
11 11.5 12 12.5 13 13.5 14 14.5 1570
80
90
100
110
120
130
140
150
time (hour)
pow
er(
watt
)
0 5 10 15 20 25 30 350
20
40
60
80
100
120
140
160
180
200
voltage
pow
er
0 5 10 15 20 25 30 350
1
2
3
4
5
6
7
8
9
voltage
curr
ent
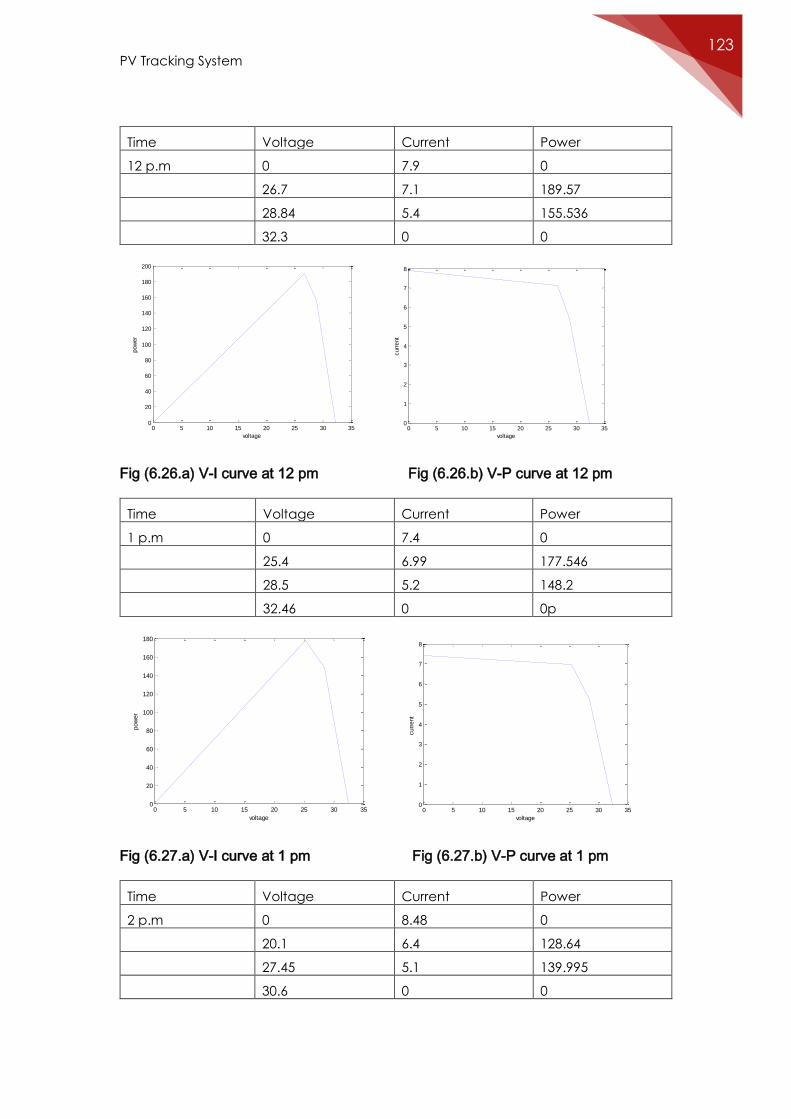
PV Tracking System 123
Time Voltage Current Power
12 p.m 0 7.9 0
26.7 7.1 189.57
28.84 5.4 155.536
32.3 0 0
Fig (6.26.a) V-I curve at 12 pm Fig (6.26.b) V-P curve at 12 pm
Time Voltage Current Power
1 p.m 0 7.4 0
25.4 6.99 177.546
28.5 5.2 148.2
32.46 0 0p
Fig (6.27.a) V-I curve at 1 pm Fig (6.27.b) V-P curve at 1 pm
Time Voltage Current Power
2 p.m 0 8.48 0
20.1 6.4 128.64
27.45 5.1 139.995
30.6 0 0
0 5 10 15 20 25 30 350
20
40
60
80
100
120
140
160
180
200
voltage
pow
er
0 5 10 15 20 25 30 350
1
2
3
4
5
6
7
8
voltage
curr
ent
0 5 10 15 20 25 30 350
20
40
60
80
100
120
140
160
180
voltage
pow
er
0 5 10 15 20 25 30 350
1
2
3
4
5
6
7
8
curr
ent
voltage
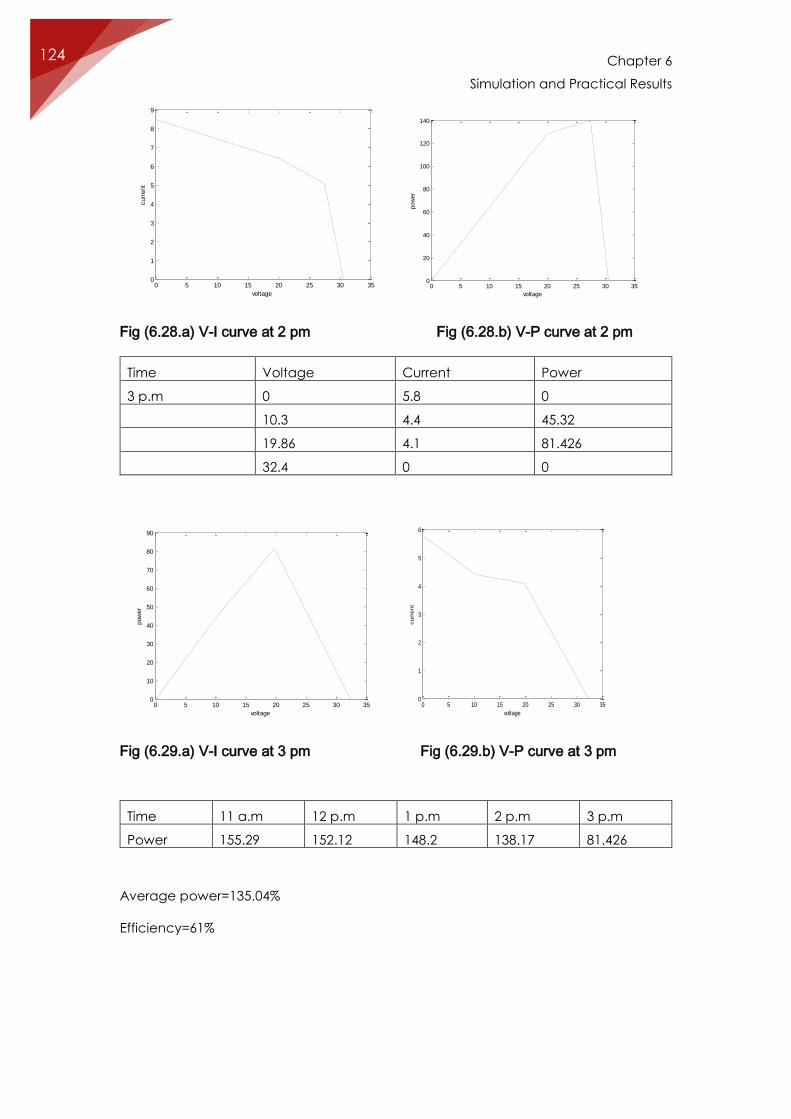
Chapter 6
Simulation and Practical Results
124
Fig (6.28.a) V-I curve at 2 pm Fig (6.28.b) V-P curve at 2 pm
Time Voltage Current Power
3 p.m 0 5.8 0
10.3 4.4 45.32
19.86 4.1 81.426
32.4 0 0
Fig (6.29.a) V-I curve at 3 pm Fig (6.29.b) V-P curve at 3 pm
Time 11 a.m 12 p.m 1 p.m 2 p.m 3 p.m
Power 155.29 152.12 148.2 138.17 81.426
Average power=135.04%
Efficiency=61%
0 5 10 15 20 25 30 350
1
2
3
4
5
6
7
8
9
voltage
curr
ent
0 5 10 15 20 25 30 350
20
40
60
80
100
120
140
voltage
pow
er
0 5 10 15 20 25 30 350
10
20
30
40
50
60
70
80
90
voltage
pow
er
0 5 10 15 20 25 30 350
1
2
3
4
5
6
voltage
curr
ent
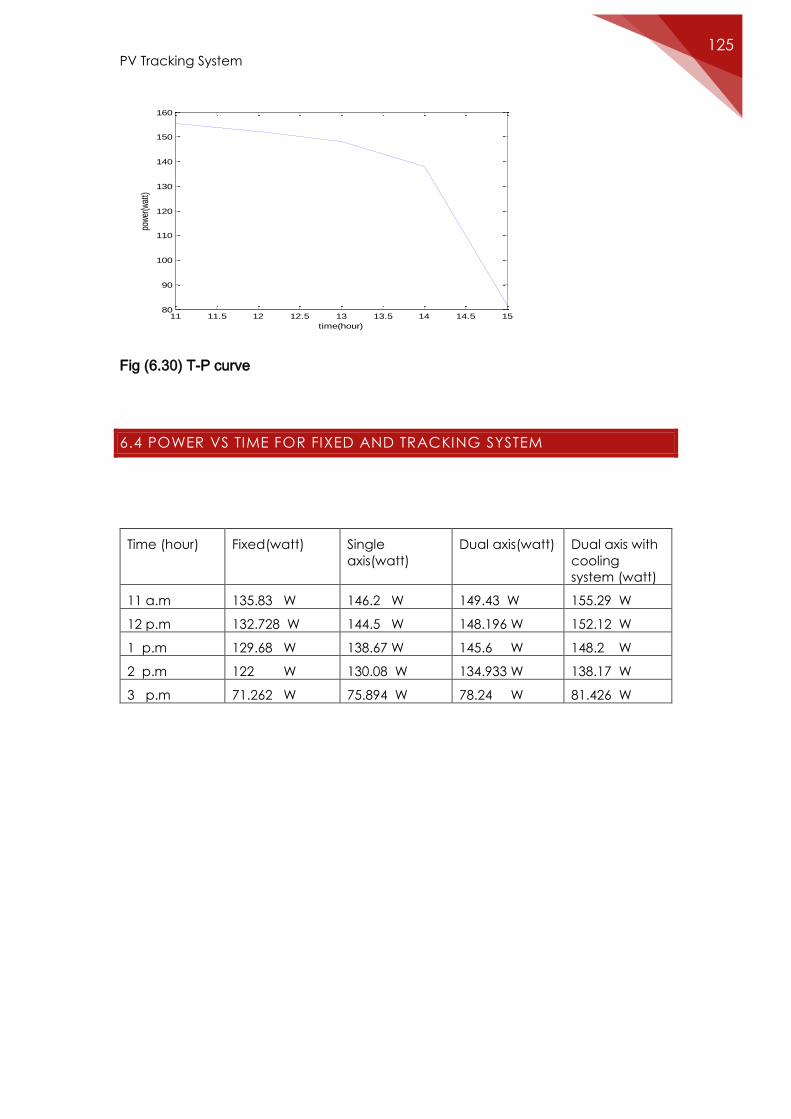
PV Tracking System 125
Fig (6.30) T-P curve
6.4 POWER VS TIME FOR FIXED AND TRACKING SYSTEM
Time (hour) Fixed(watt) Single
axis(watt)
Dual axis(watt) Dual axis with
cooling
system (watt)
11 a.m 135.83 W 146.2 W 149.43 W 155.29 W
12 p.m 132.728 W 144.5 W 148.196 W 152.12 W
1 p.m 129.68 W 138.67 W 145.6 W 148.2 W
2 p.m 122 W 130.08 W 134.933 W 138.17 W
3 p.m 71.262 W 75.894 W 78.24 W 81.426 W
11 11.5 12 12.5 13 13.5 14 14.5 1580
90
100
110
120
130
140
150
160
time(hour)
pow
er(w
att)
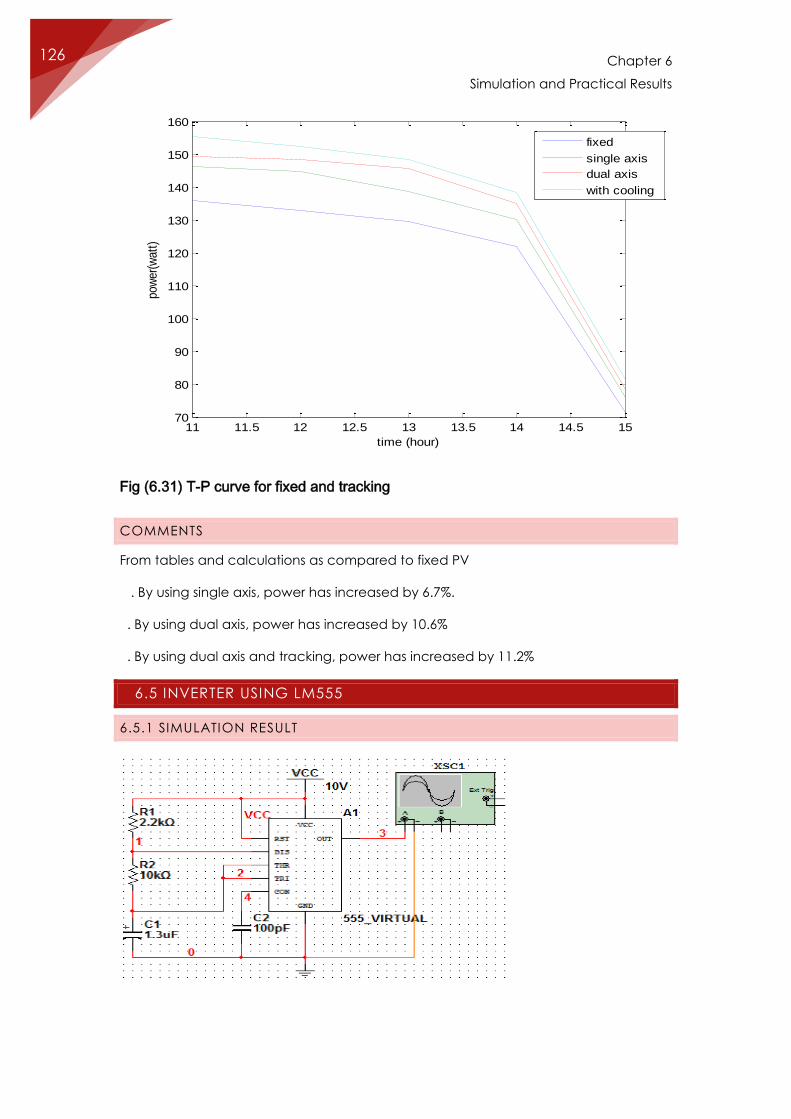
Chapter 6
Simulation and Practical Results
126
Fig (6.31) T-P curve for fixed and tracking
COMMENTS
From tables and calculations as compared to fixed PV
. By using single axis, power has increased by 6.7%.
. By using dual axis, power has increased by 10.6%
. By using dual axis and tracking, power has increased by 11.2%
6.5 INVERTER USING LM555
6.5.1 SIMULATION RESULT
11 11.5 12 12.5 13 13.5 14 14.5 1570
80
90
100
110
120
130
140
150
160
time (hour)
pow
er(w
att)
fixed
single axis
dual axis
with cooling
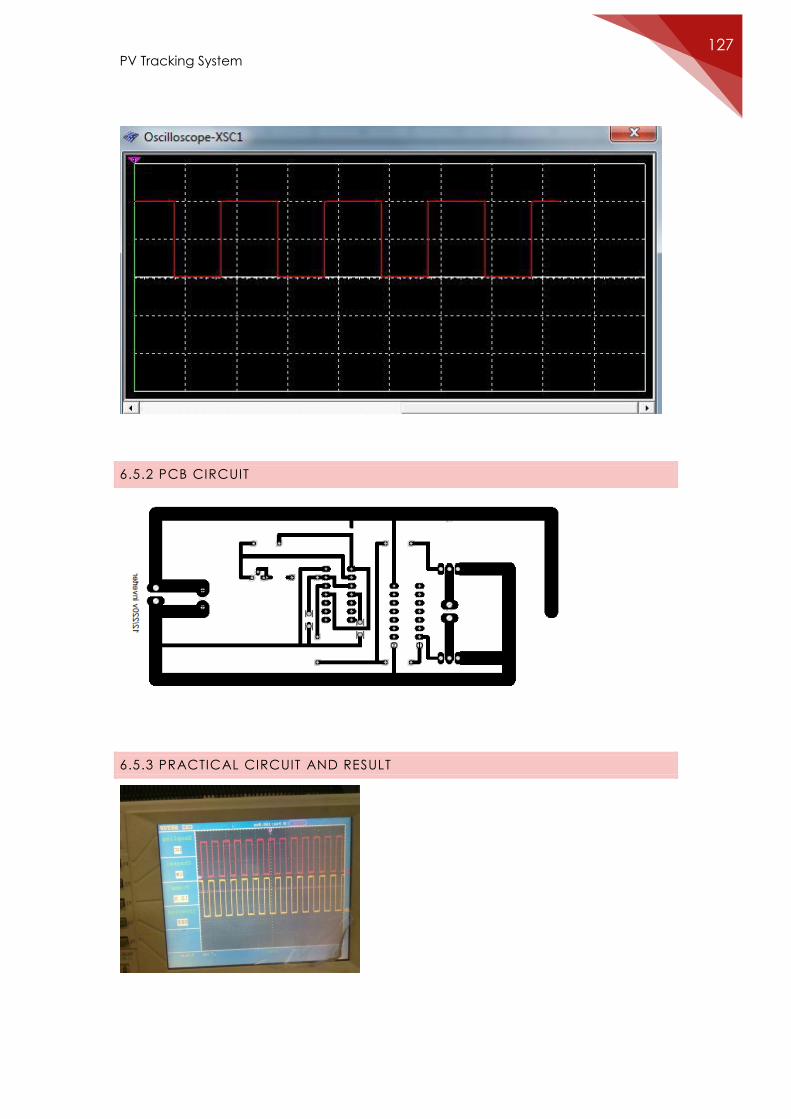
PV Tracking System 127
6.5.2 PCB CIRCUIT
6.5.3 PRACTICAL CIRCUIT AND RESULT
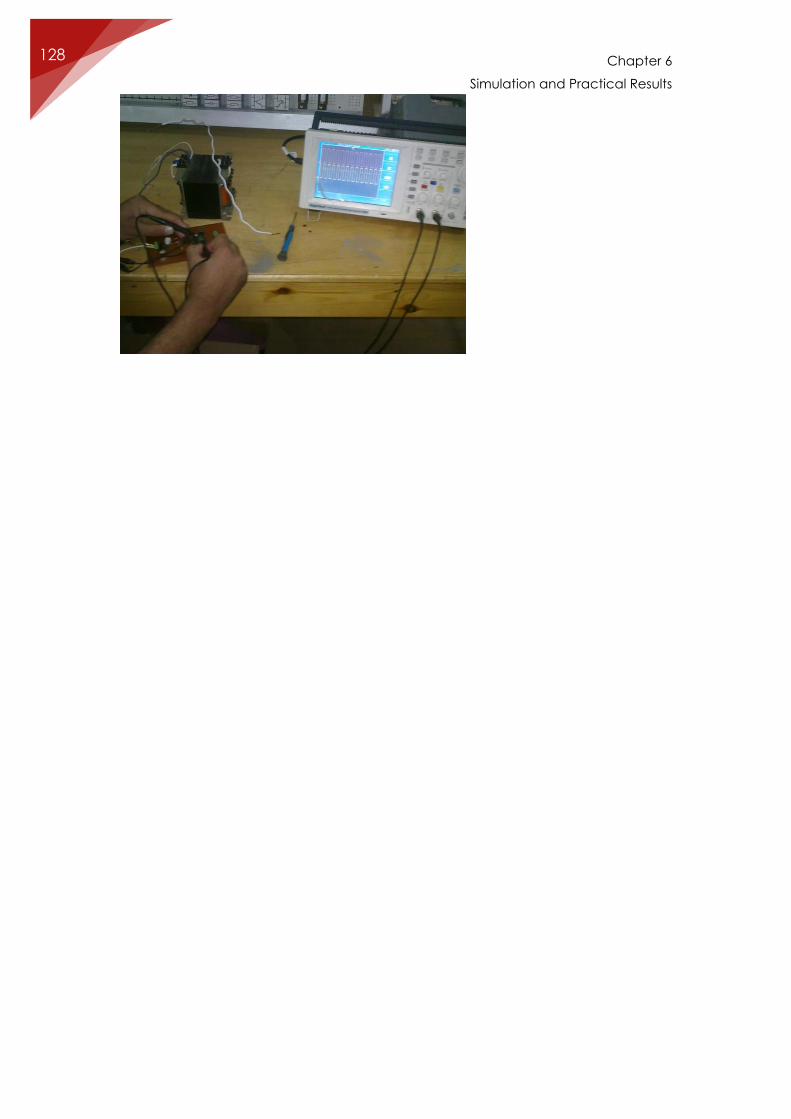
Chapter 6
Simulation and Practical Results
128
130
CONCLUSION In this project work a sun tracker has been developed to increase the amount of power
generated by the solar panel by using two-axis tracking system.
The system was designed, as automatic system such that energy generated by solar
panel would be maximum.
The tracking mechanism is capable of tracking the sun automatically so that the
direction of beam propagation of solar radiation is perpendicular to the PV panel.
From the results of the performance test of designed system the following conclusion
can be drawn.
1. Mechanical set up characterizes the tracker and micro controller operated control
system. During its relatively short time of operation, it proved to be fairly precise and
reliable, even in adverse weather conditions.
2. The designed solar tracker automatically follows the sun path according to the
direction of beam propagation of solar radiation.
3. The excess output-power of the tracking solar panel with respect to fixed panel was
30-45% at average solar intensity of 1000% w/m2.
4. I.V characteristics also tested from PV cell outputs ,which approximately meet the
ideal characteristics curve.it was observed that at high temperature PV cell
performance becomes low.
5. The use of software outside the mechanical part makes the tracker flexible for future
development
6. Design simplicity, low cost and material availability will make the designed tracking
system more effective and competitive to other designed system.
7. The developed tracking mechanism can used efficiently to orient other concentrating
collectors such as parabolic dish collectors.
PV Tracking System 131
Considering all above aspects of this tracking system it can be concluded that, it is
flexible tracking system with low cost electromechanical set-up, low maintenance
requirements and ease of installation and operation.
Dual axis solar tracking system prototype model is successfully developed. The
designed system is focus on designing controller part and main concern is to design
appropriate circuits and circuits supposed to be able to control two DC-gear motor
rotation direction without considering motor speed.
The system is able to track and follow sun light intensity in order to collect maximum
solar power regardless of motor speed. The unique of developed system, motor speed
is not critical consideration because the DC -geared motors offers low output rated
speed and high output rated torque.

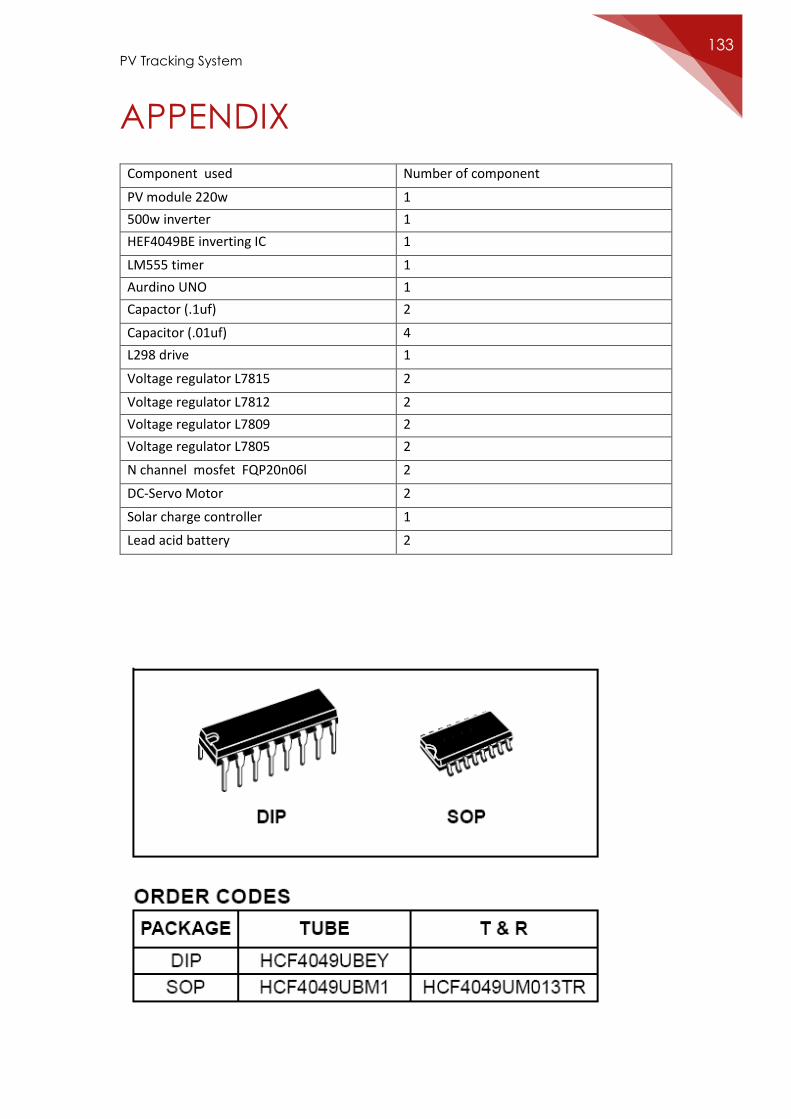
PV Tracking System 133
APPENDIX
Component used Number of component
PV module 220w 1
500w inverter 1
HEF4049BE inverting IC 1
LM555 timer 1
Aurdino UNO 1
Capactor (.1uf) 2
Capacitor (.01uf) 4
L298 drive 1
Voltage regulator L7815 2
Voltage regulator L7812 2
Voltage regulator L7809 2
Voltage regulator L7805 2
N channel mosfet FQP20n06l 2
DC-Servo Motor 2
Solar charge controller 1
Lead acid battery 2
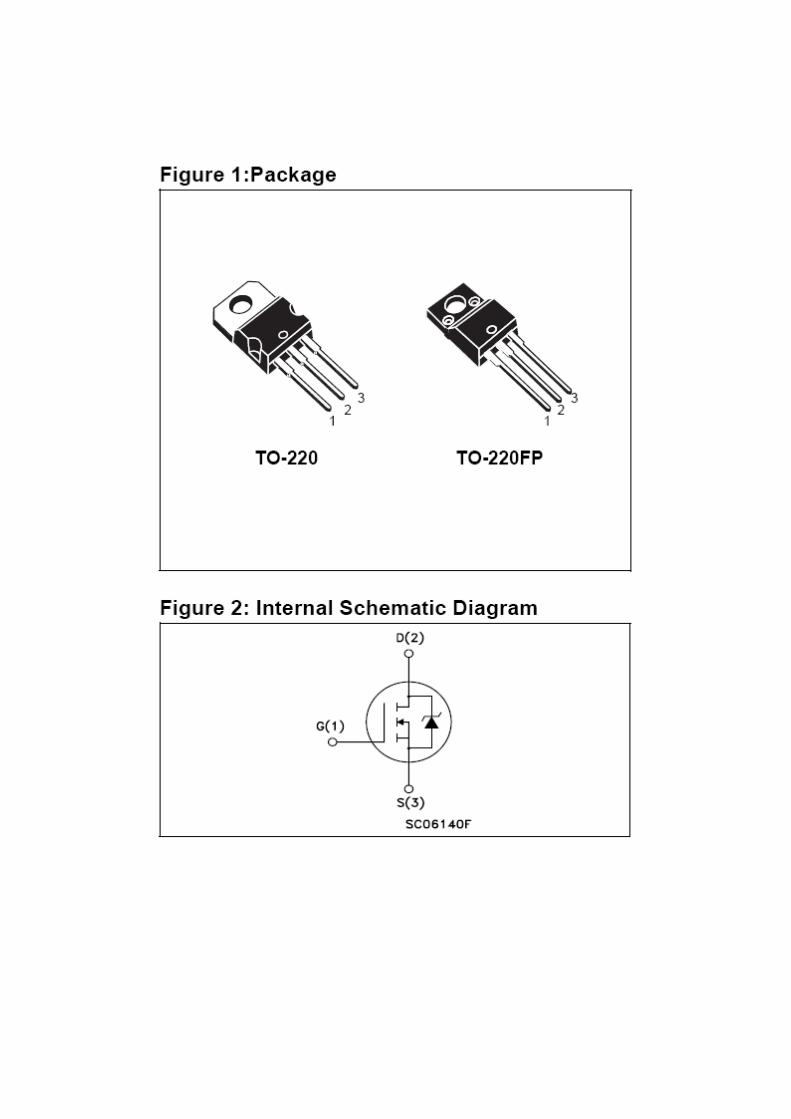
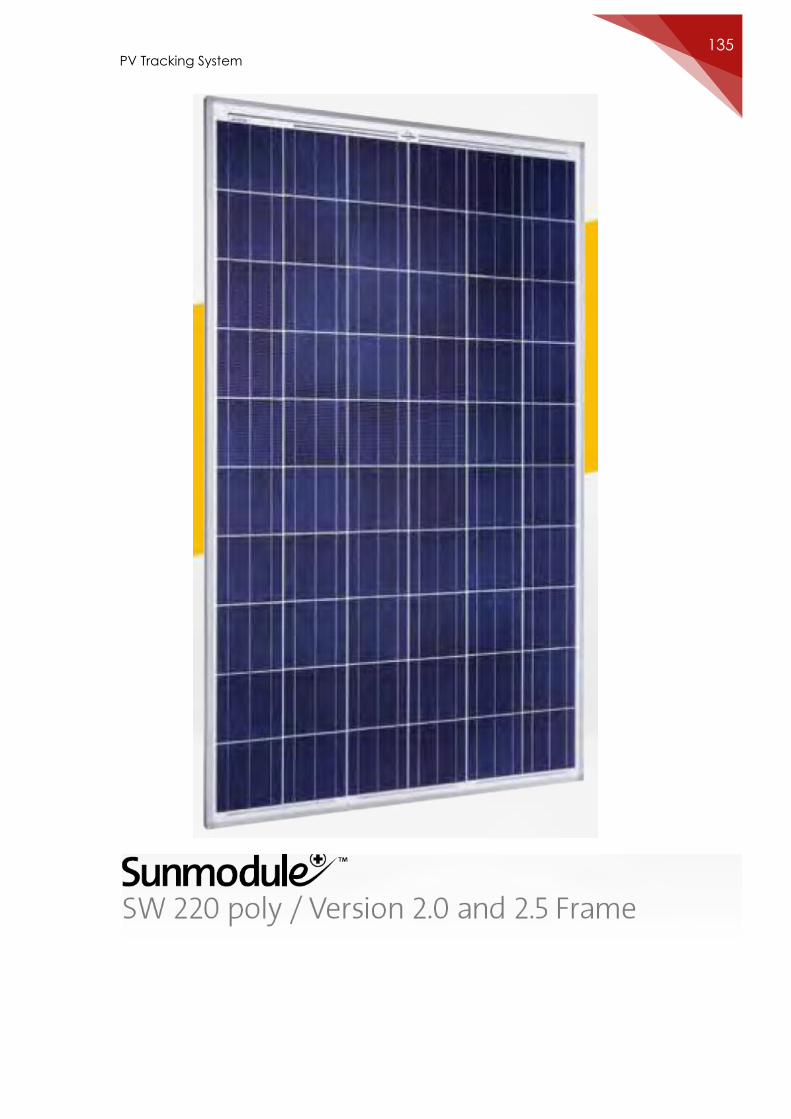
PV Tracking System 135
REFERENCES [1] Wikipedia, “Wind Power,” Wikimedia Foundation. 2007. Last Retrieved
March 30, 2007 from http://en.wikipedia.org/wiki/Wind_power
[2] Wind and Hydropower Technologies Program, “Advantages and
Disadvantages of Wind Energy,” U.S. Department of Energy. August 2005.
Last Retrieved March 31, 2007.
http://www1.eere.energy.gov/windandhydro/wind_ad.html
[3] T. Hammons, “Geothermal Power Generation Worldwide,” Power Tech
Conference Proceedings, IEEE Bologna. Volume 1, Pg. 1-8. June 2003.
[4] S. Sheth, M. Shahidehpour, “Geothermal Energy in Power Systems,” Power
Engineering Society General Meeting. Volume 2, Pg. 1972-1977. June 2004.
[5] Citizens and Scientists for Environmental Solutions, “How Hydroelectric
Energy Works,” Union of Concerned Scientists. September 2005. Last
Retrieved March 19, 2007. http://www.ucsusa.org/clean_energy/
renewable_energy_basics/how-hydroelectric-energy-works.html
[6] A. Darvill, “Hydro-electric power is generated from falling water,” Energy
Resources. December 2006. Last Retrieved March 19, 2007.
http://home.clara.net/darvill/altenerg/hydro.html
[7] T. Penick, B. Louk, “Photovoltaic Power Generation,” TEI
Controls. December 1998. Last Retrieved March 30, 2007.
http://www.teicontrols.com/notes/ TechCommunicationsEE333T/FinalReport-
PhotovoltaicPowerGeneration.pdf
[8] William David Lubitz, "Effect of Manual Tilt Adjustments on Incident
Irradiance on Fixed and Tracking Solar Panels", Applied Energy, Volume 88
(2011), pp. 1710-1719
[9] Ignacio Luque-Heredia et al., "The Sun Tracker in Concentrator
Photovoltaics" in Cristobal, A.B.,Martí, A.,and Luque, A. Next Generation
Photovoltaics, Springer Verlag, 2012
[10] B. Sc. Final Year Project “PV Tracking System and Inverter”, Egypt,
Qena, South Valley university, Faculty of Engineering 2013