Embed Size (px)
Citation preview
PVAAS + Other Data Consultation 2013
PVAAS AND OTHER DATA TOOLS SCHOOL CONSULTATION
FALL 2013
PVAAS + Other Data Consultation 2013
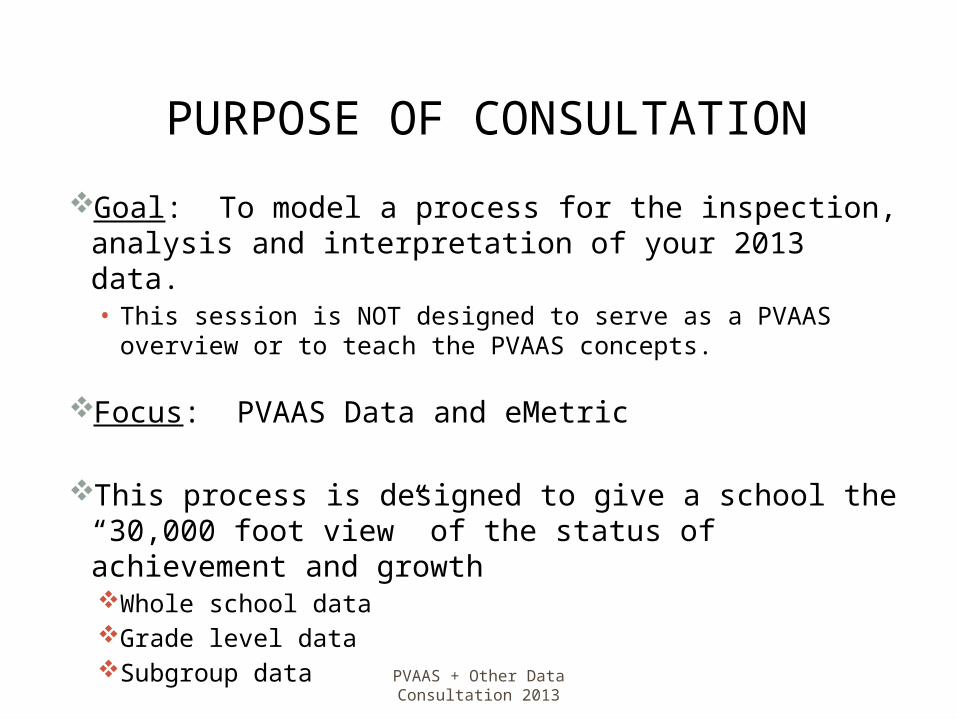
PURPOSE OF CONSULTATION
Goal: To model a process for the inspection, analysis and interpretation of your 2013 data.• This session is NOT designed to serve as a PVAAS
overview or to teach the PVAAS concepts.
Focus: PVAAS Data and eMetric
This process is designed to give a school the “30,000 foot view” of the status of achievement and growthWhole school dataGrade level dataSubgroup data
PVAAS + Other Data Consultation 2013
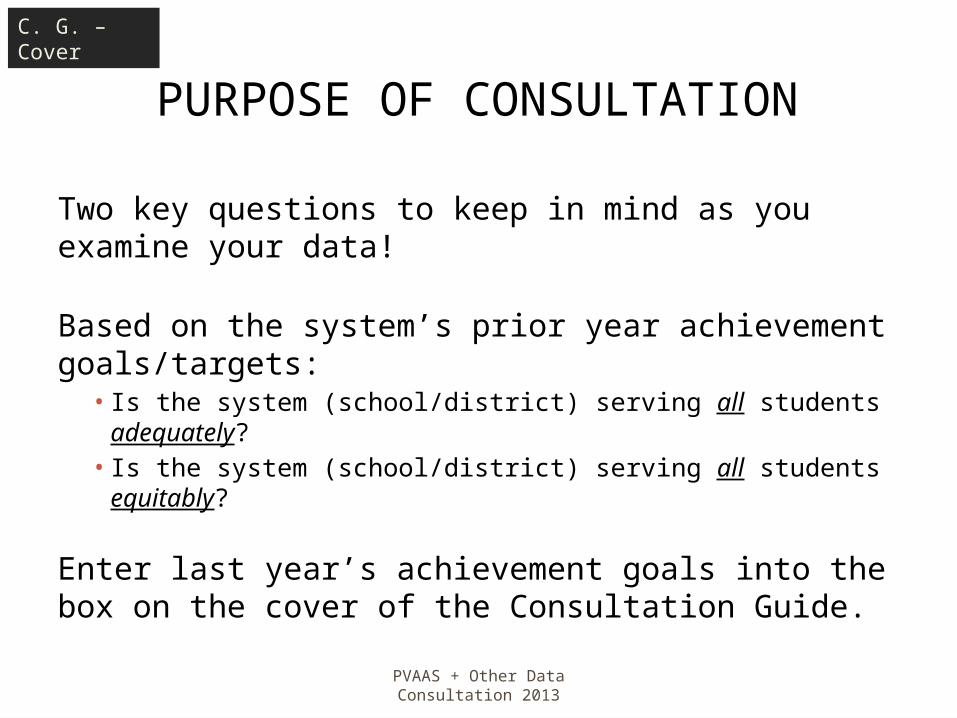
Two key questions to keep in mind as you examine your data!
Based on the system’s prior year achievement goals/targets:
• Is the system (school/district) serving all students adequately?
• Is the system (school/district) serving all students equitably?
Enter last year’s achievement goals into the box on the cover of the Consultation Guide.
PURPOSE OF CONSULTATION
C. G. – Cover
PVAAS + Other Data Consultation 2013
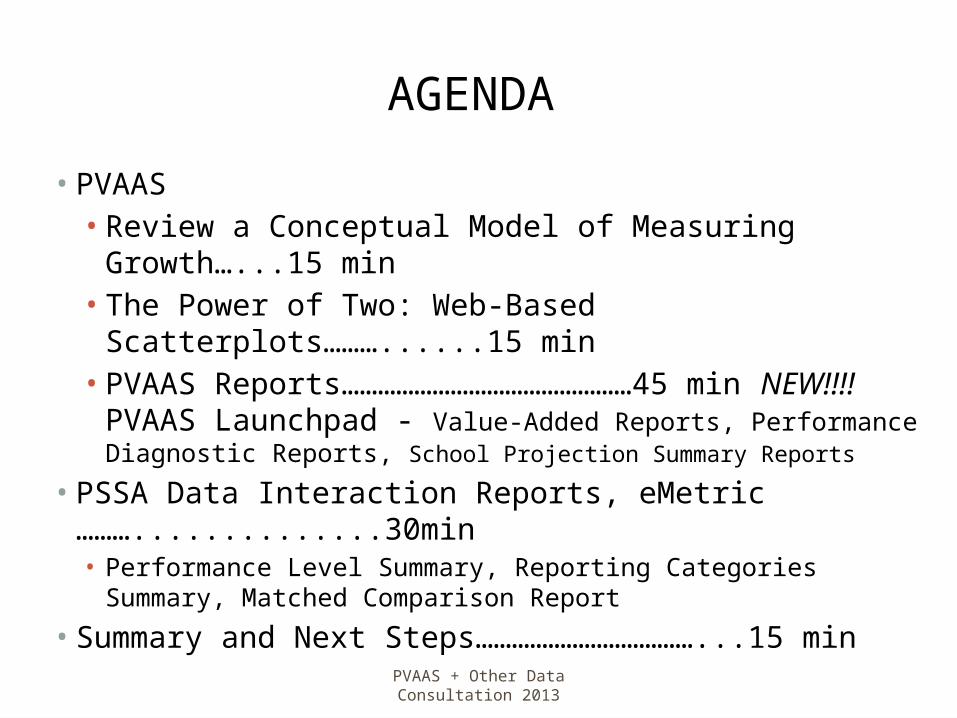
AGENDA
• PVAAS• Review a Conceptual Model of Measuring Growth…...15
min• The Power of Two: Web-Based Scatterplots………......15
min• PVAAS Reports…………………………………………45 min
NEW!!!! PVAAS Launchpad - Value-Added Reports, Performance Diagnostic Reports, School Projection Summary Reports
• PSSA Data Interaction Reports, eMetric ………..............30min• Performance Level Summary, Reporting Categories Summary,
Matched Comparison Report
• Summary and Next Steps………………………………...15 min
PVAAS + Other Data Consultation 2013
CONSULTATION GUIDE
• Decide on the focus for your team to make the most use of today’s time.• On what subject will you focus?• What grade level(s) within the subject?• What subgroup within the grade and subject?
• Purpose is to model a process that can be used to determine the status of achievement & growth in your school.
• The next step is to begin to investigate WHY you are getting these results.
PVAAS + Other Data Consultation 2013
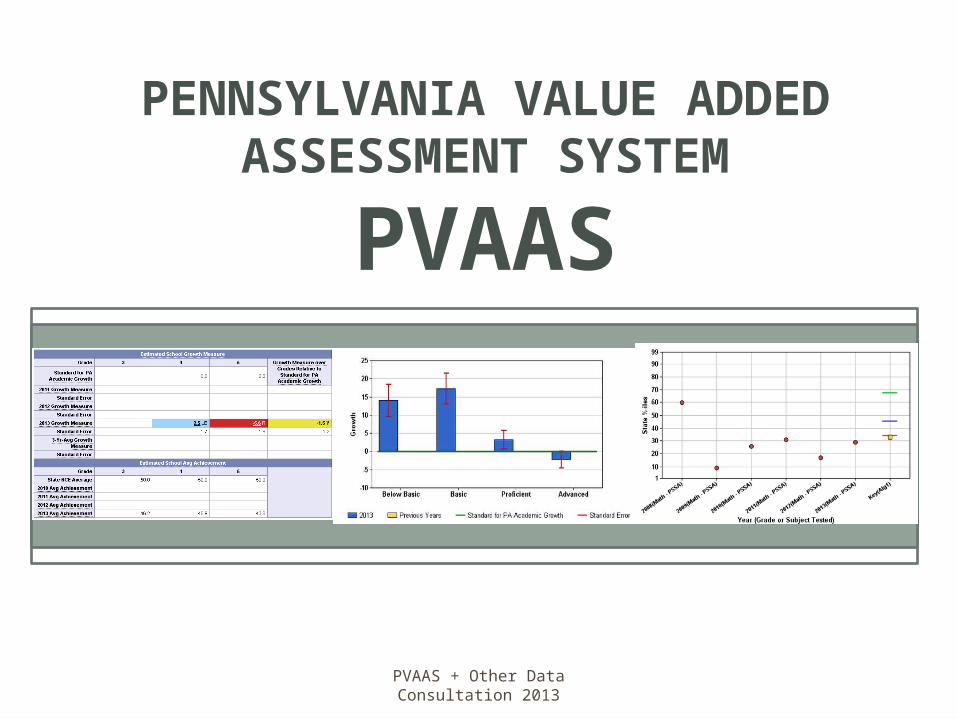
PENNSYLVANIA VALUE ADDED ASSESSMENT SYSTEM
PVAAS
MEASURING GROWTH IN PVAAS
P VA A S C O N S U LTAT I O N G U I D E
PVAAS + Other Data Consultation 2013
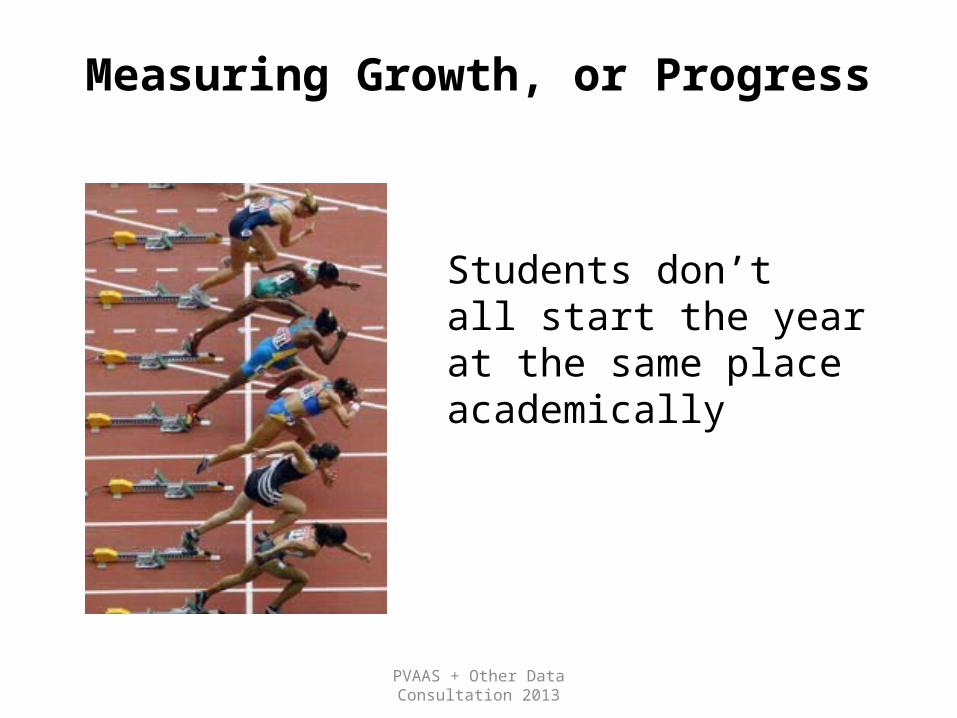
Measuring Growth, or Progress
Students don’t all start the year at the same place academically
PVAAS + Other Data Consultation 2013
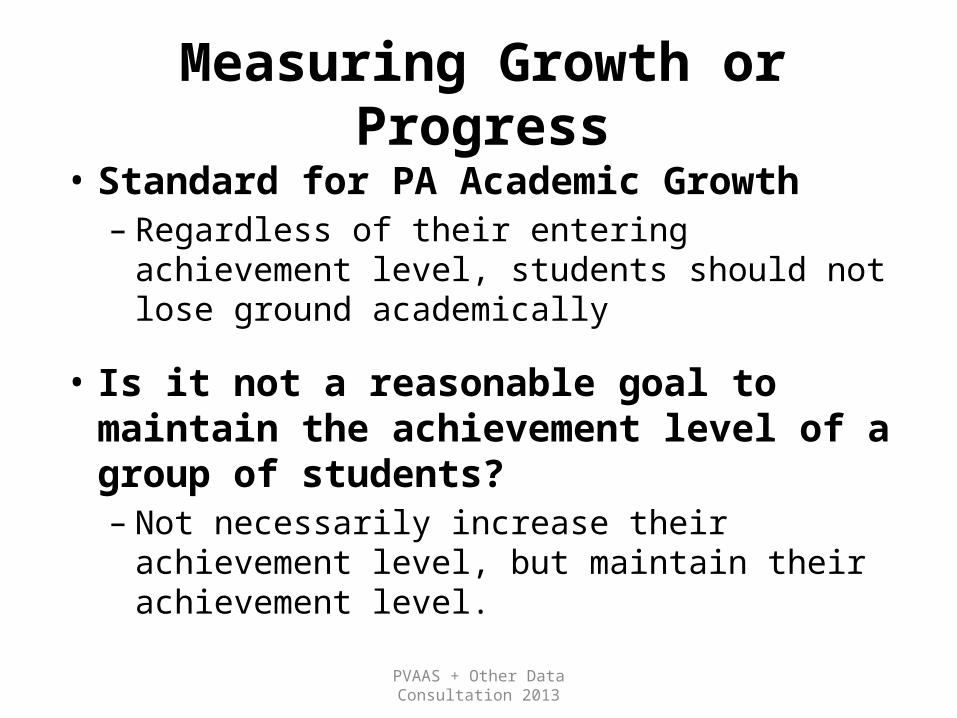
Measuring Growth or Progress
• Standard for PA Academic Growth– Regardless of their entering achievement level,
students should not lose ground academically
• Is it not a reasonable goal to maintain the achievement level of a group of students?– Not necessarily increase their achievement level,
but maintain their achievement level.
PVAAS + Other Data Consultation 2013
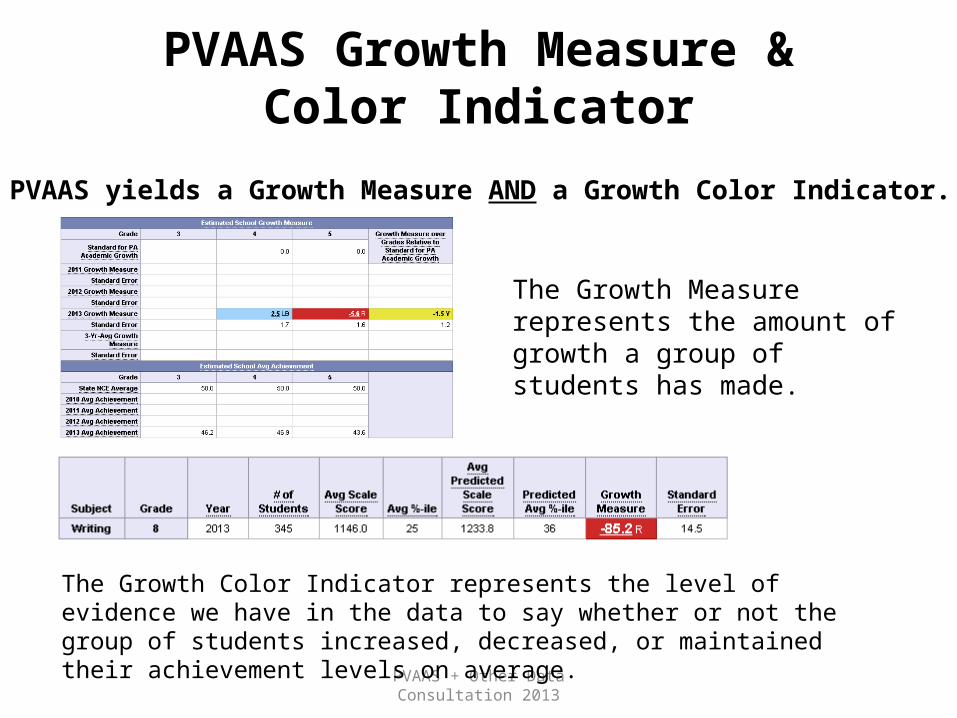
PVAAS Growth Measure &Color Indicator
The Growth Measure represents the amount of growth a group of students has made.
PVAAS yields a Growth Measure AND a Growth Color Indicator.
PVAAS + Other Data Consultation 2013
The Growth Color Indicator represents the level of evidence we have in the data to say whether or not the group of students increased, decreased, or maintained their achievement levels on average.
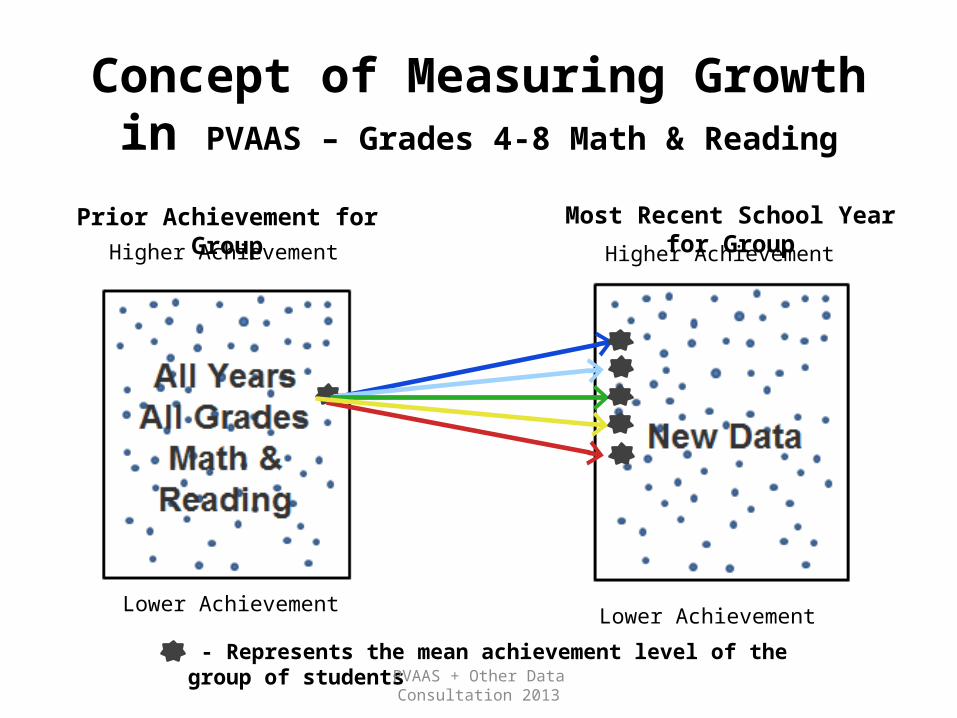
Prior Achievement for Group Most Recent School Year for GroupHigher Achievement
Concept of Measuring Growth in PVAAS – Grades 4-8 Math & Reading
- Represents the mean achievement level of the group of students
Lower Achievement
Higher Achievement
Lower Achievement
PVAAS + Other Data Consultation 2013
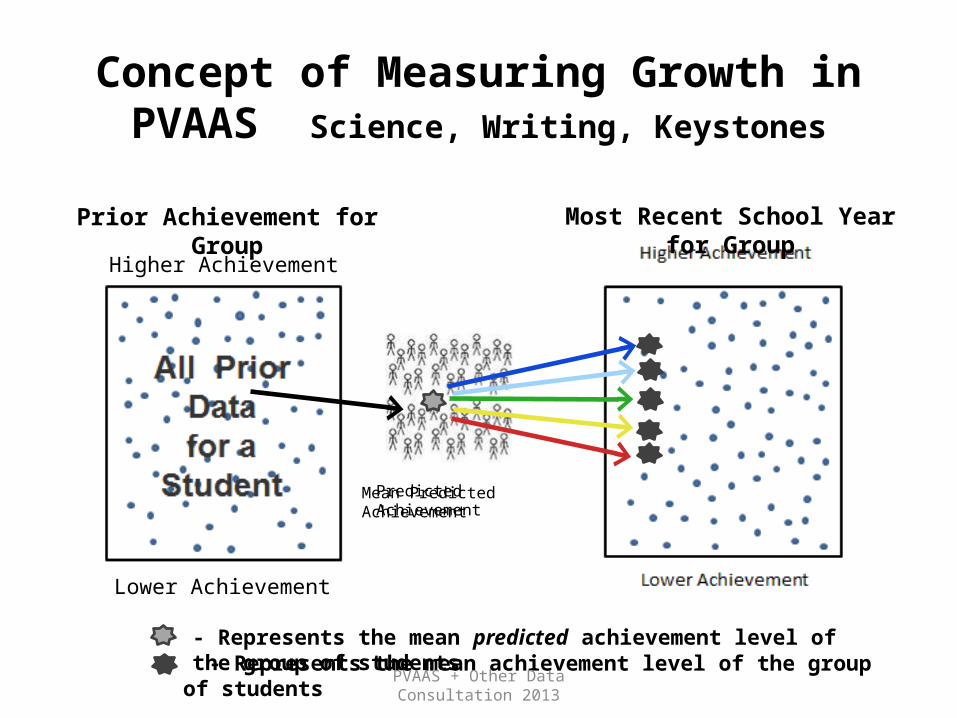
Prior Achievement for Group
Higher Achievement
Concept of Measuring Growth in PVAAS Science, Writing, Keystones
Lower Achievement
Predicted AchievementMean Predicted Achievement
- Represents the mean achievement level of the group of students- Represents the mean predicted achievement level of the group of students
PVAAS + Other Data Consultation 2013
Most Recent School Year for Group
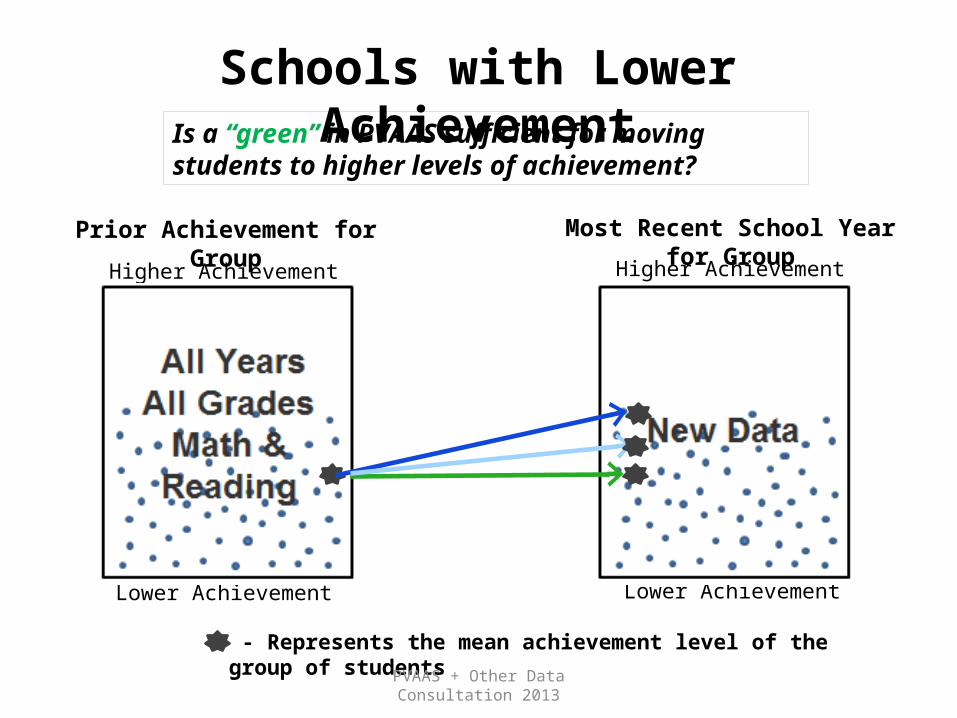
Schools with Lower Achievement
- Represents the mean achievement level of the group of students
Is a “green” in PVAAS sufficient for moving students to higher levels of achievement?
Higher Achievement
Lower Achievement
Prior Achievement for Group Most Recent School Year for Group
Higher Achievement
Lower Achievement
PVAAS + Other Data Consultation 2013
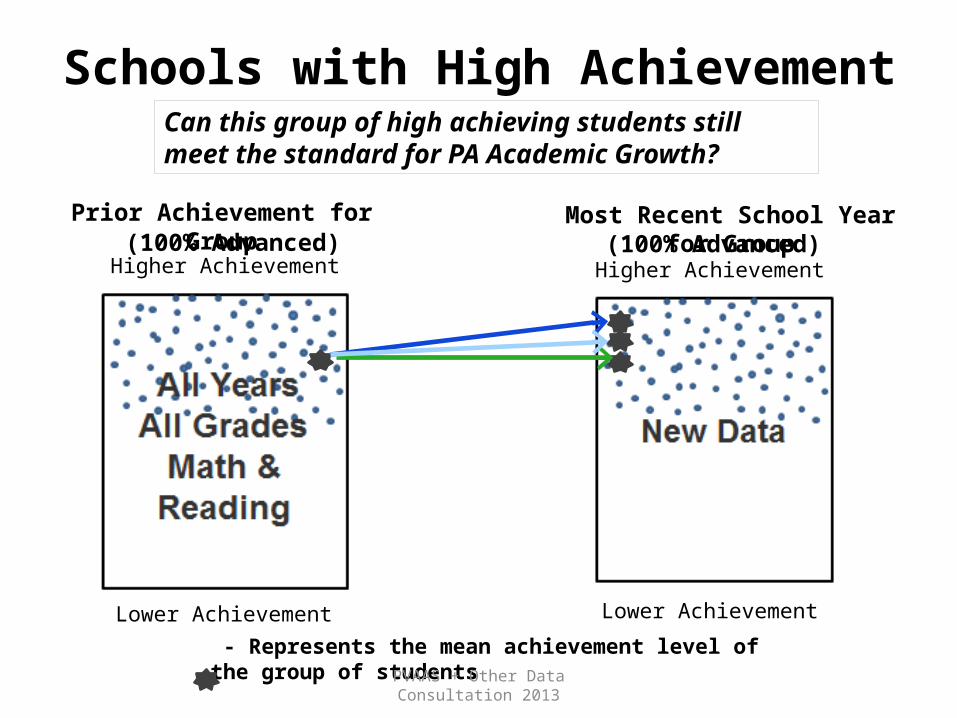
(100% Advanced)
Schools with High Achievement
- Represents the mean achievement level of the group of students
Can this group of high achieving students still meet the standard for PA Academic Growth?
Higher Achievement Higher Achievement
Lower Achievement Lower Achievement
Prior Achievement for Group Most Recent School Year for Group(100% Advanced)
PVAAS + Other Data Consultation 2013
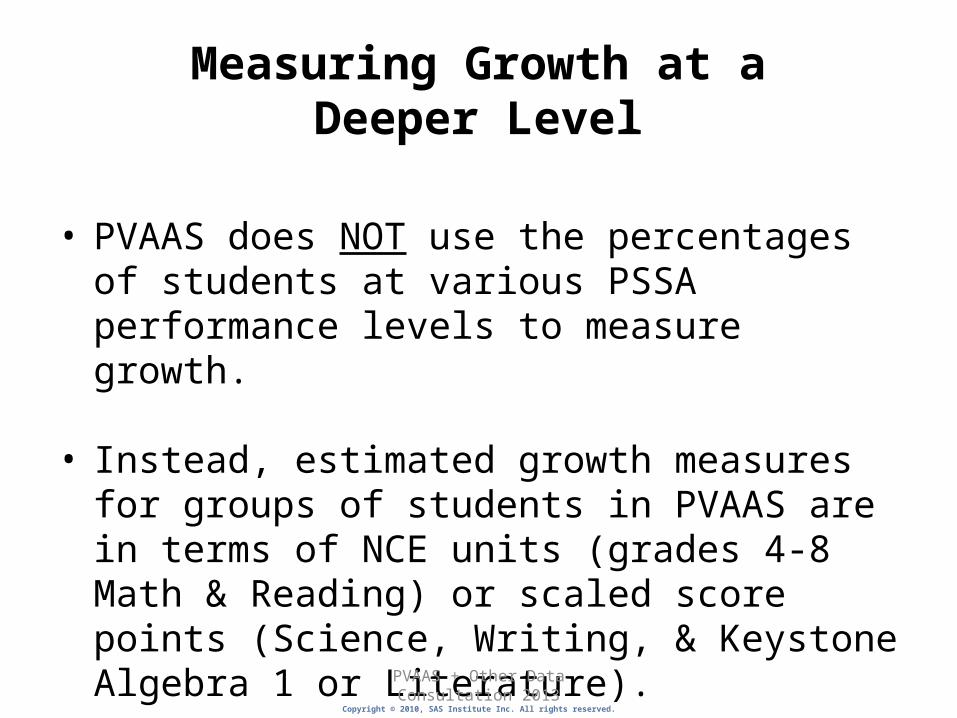
Measuring Growth at aDeeper Level
• PVAAS does NOT use the percentages of students at various PSSA performance levels to measure growth.
• Instead, estimated growth measures for groups of students in PVAAS are in terms of NCE units (grades 4-8 Math & Reading) or scaled score points (Science, Writing, & Keystone Algebra 1 or Literature).
PVAAS + Other Data Consultation 2013
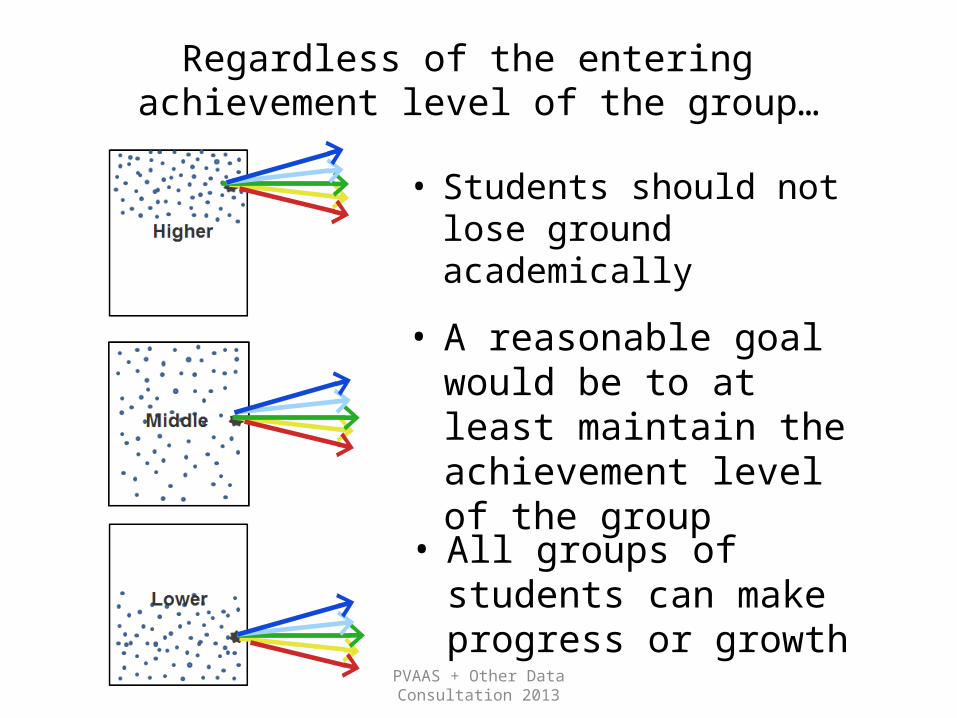
Regardless of the entering achievement level of the group…
• Students should not lose ground academically
• A reasonable goal would be to at least maintain the achievement level of the group
• All groups of students can make progress or growth
PVAAS + Other Data Consultation 2013
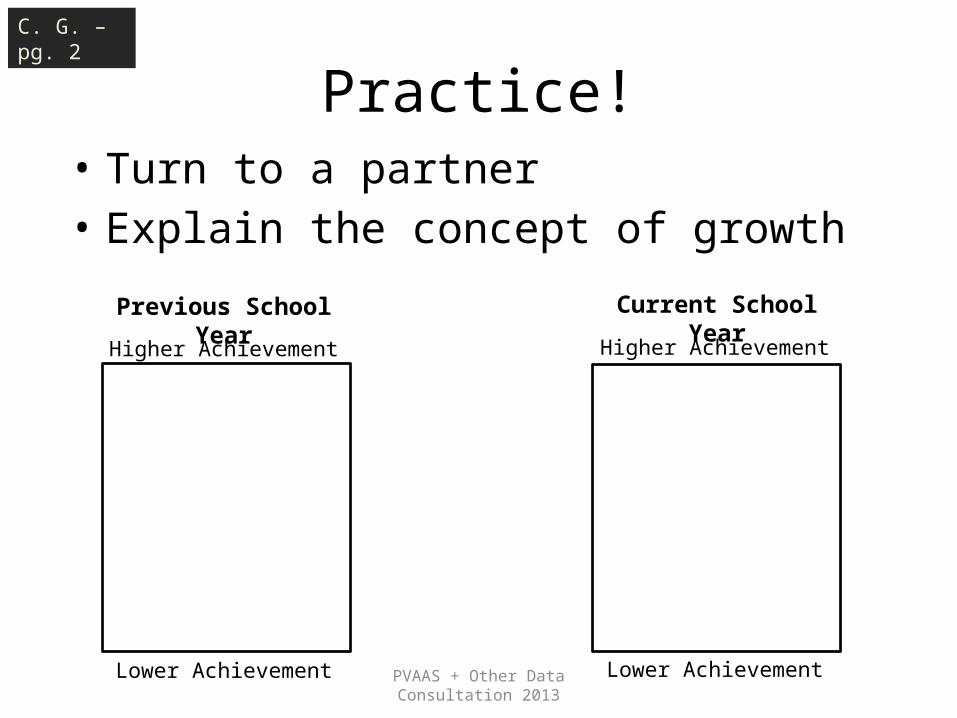
Practice!• Turn to a partner• Explain the concept of growth
Previous School Year Current School Year
Higher Achievement
Lower Achievement
Higher Achievement
Lower Achievement
C. G. – pg. 2
PVAAS + Other Data Consultation 2013
THE POWER OF TWO!C O N S I D E R I N G A C H I E V E M E N T A N D G R O W T H T O G E T H E R !
PVAAS + Other Data Consultation 2013
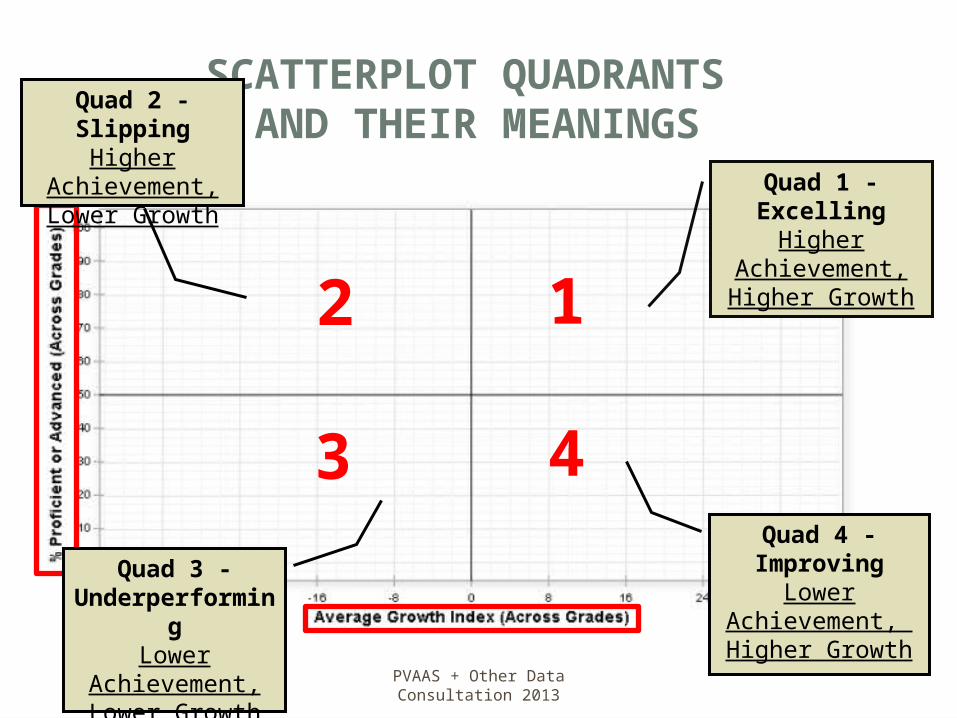
SCATTERPLOT QUADRANTS AND THEIR MEANINGS
PVAAS + Other Data Consultation 2013
Quad 1 - Excelling
Higher Achievement,Higher Growth
Quad 2 - SlippingHigher
Achievement,Lower Growth
Quad 4 - Improving
Lower Achievement, Higher Growth
Quad 3 - Underperforming
Lower Achievement,Lower Growth
12
3 4
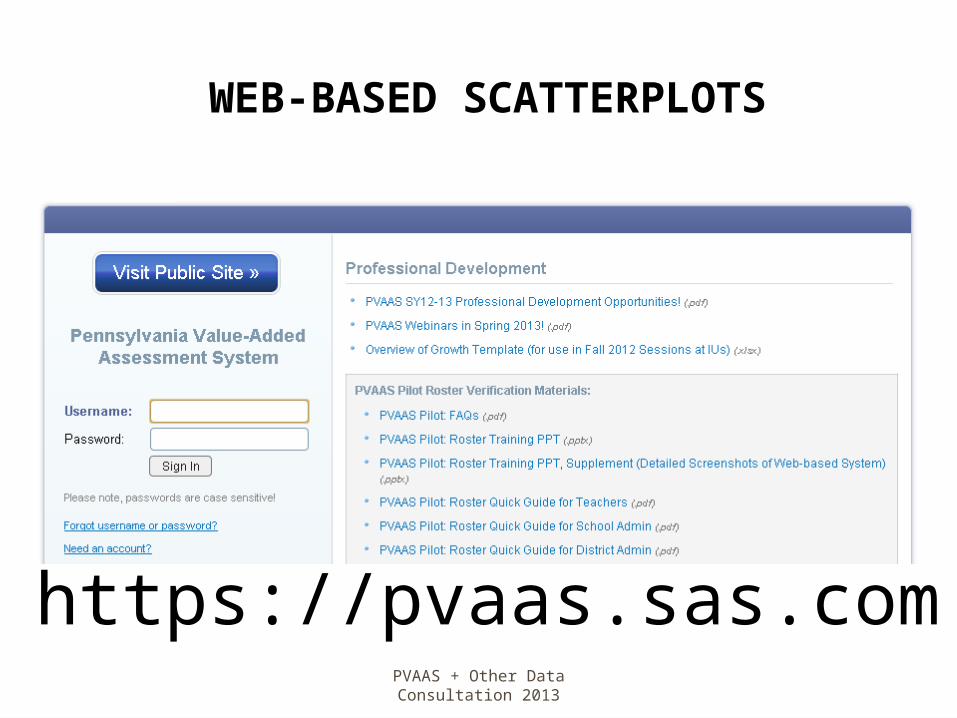
WEB-BASED SCATTERPLOTS
https://pvaas.sas.comPVAAS + Other Data Consultation
2013
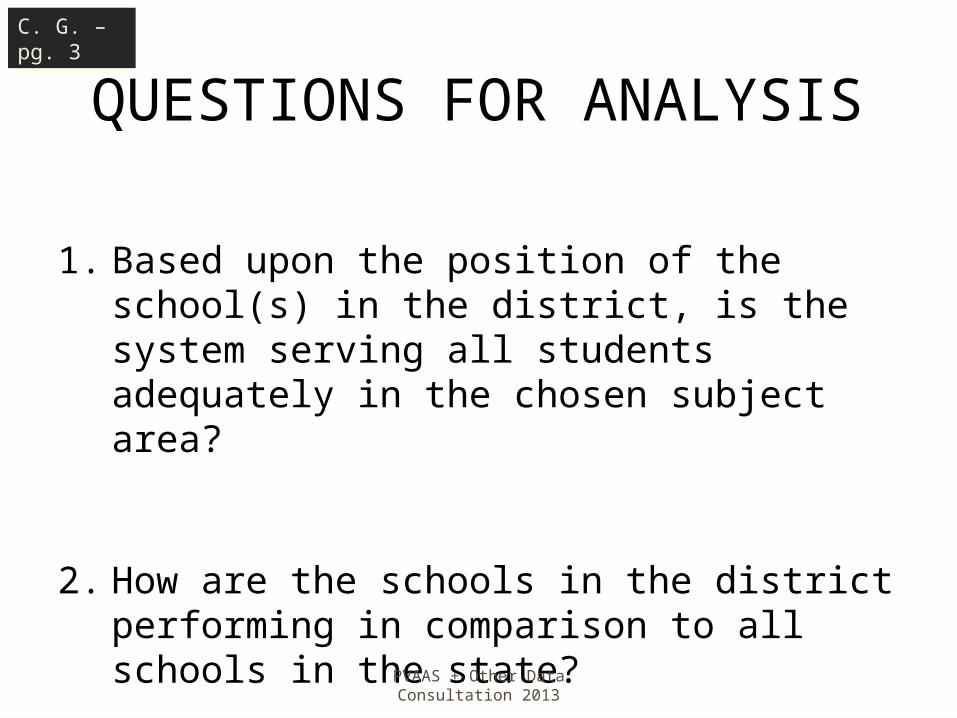
QUESTIONS FOR ANALYSIS
1. Based upon the position of the school(s) in the district, is the system serving all students adequately in the chosen subject area?
2. How are the schools in the district performing in comparison to all schools in the state?
C.G. Pg. 2
PVAAS + Other Data Consultation 2013
C. G. – pg. 3
PVAAS REPORTS
https://pvaas.sas.com
PVAAS + Other Data Consultation 2013
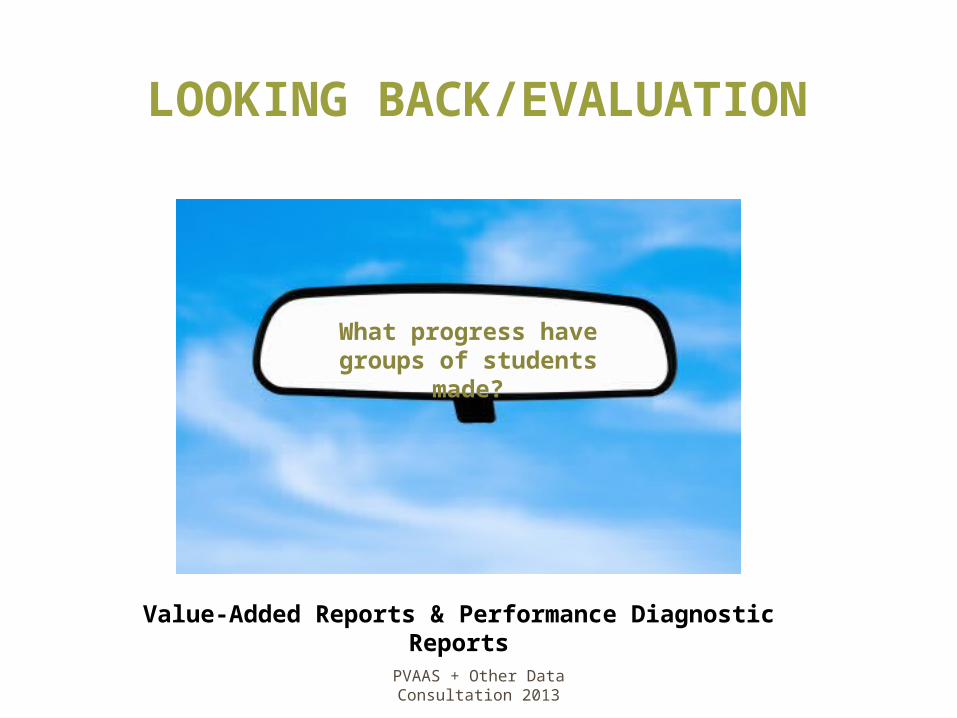
LOOKING BACK/EVALUATION
PVAAS + Other Data Consultation 2013
What progress have groups of students made?
Value-Added Reports & Performance Diagnostic Reports

PVAAS + Other Data Consultation 2013
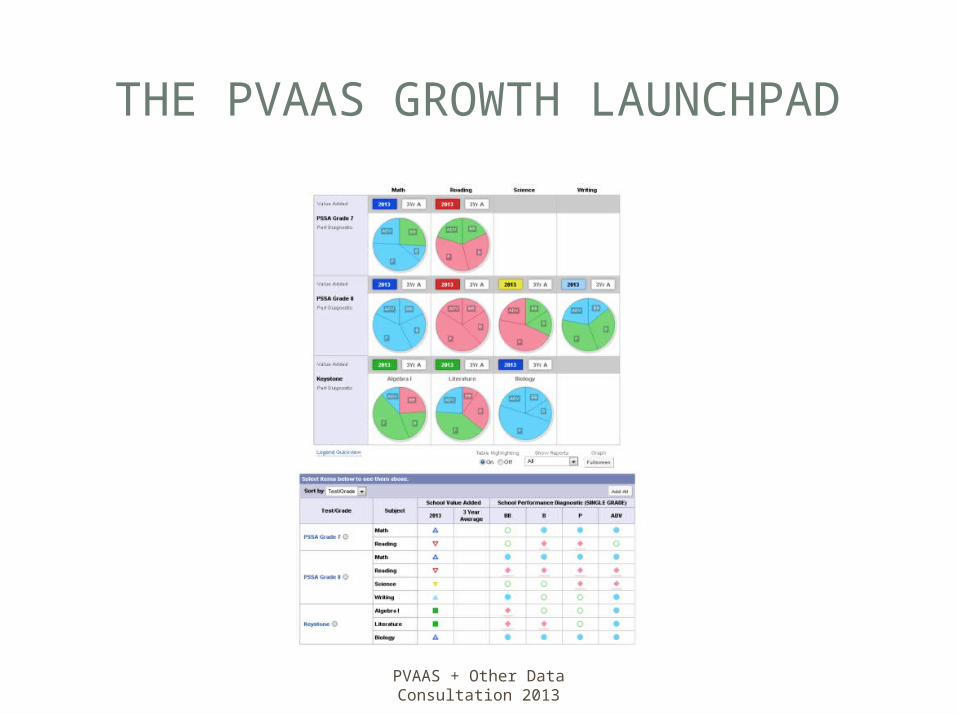
THE PVAAS GROWTH LAUNCHPAD
PVAAS + Other Data Consultation 2013
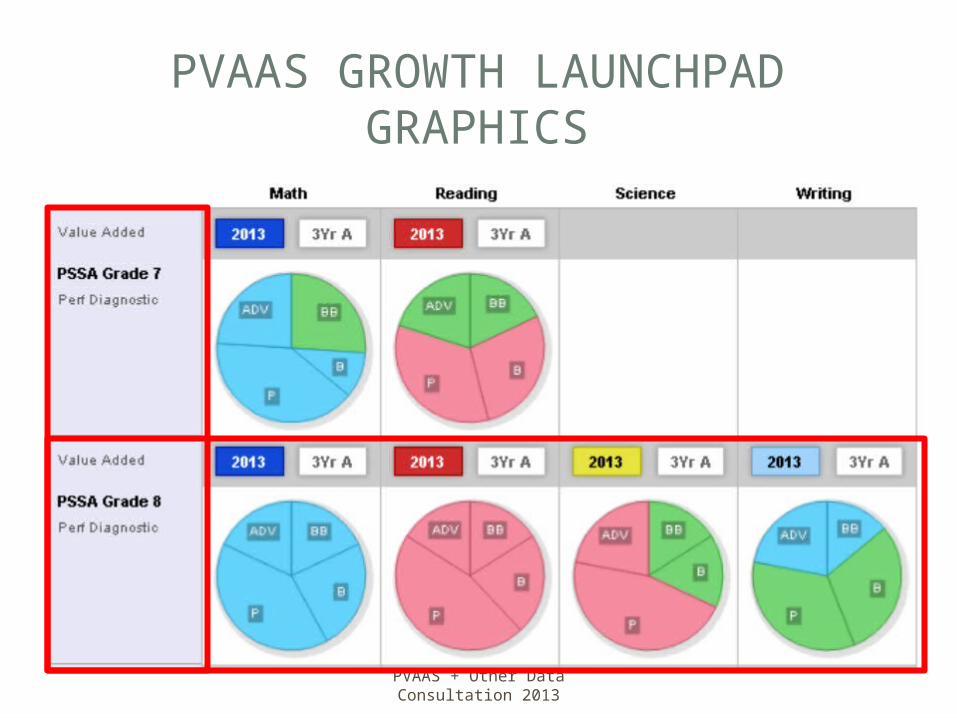
PVAAS GROWTH LAUNCHPAD GRAPHICS
PVAAS + Other Data Consultation 2013
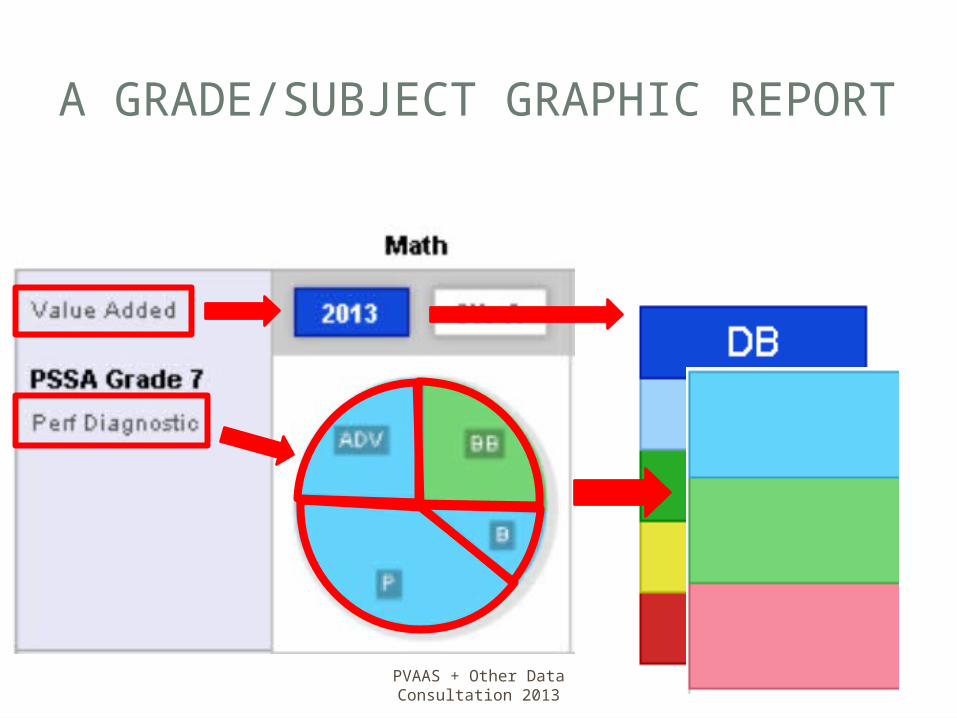
A GRADE/SUBJECT GRAPHIC REPORT
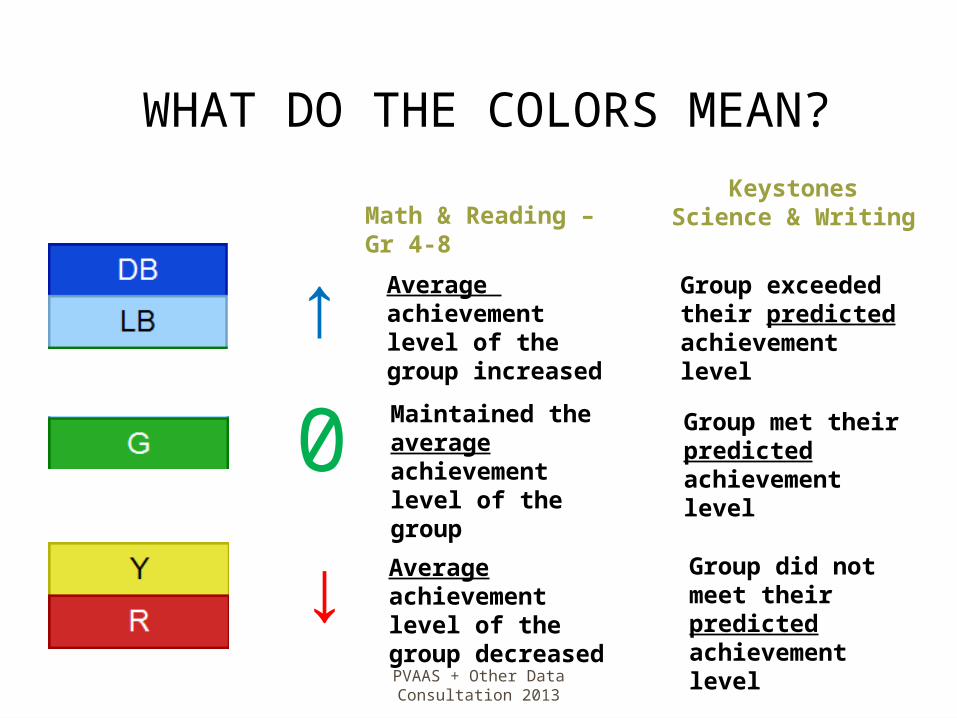
WHAT DO THE COLORS MEAN?
PVAAS + Other Data Consultation 2013
Average achievement level of the group increased
↑
0 Maintained the average achievement level of the group
↓ Average achievement level of the group decreased
Group exceeded their predicted achievement level
Group met their predicted achievement level
Group did not meet their predicted achievement level
Math & Reading – Gr 4-8
KeystonesScience & Writing
PVAAS + Other Data Consultation 2013
THE PVAAS GROWTH LAUNCHPAD
PVAAS + Other Data Consultation 2013
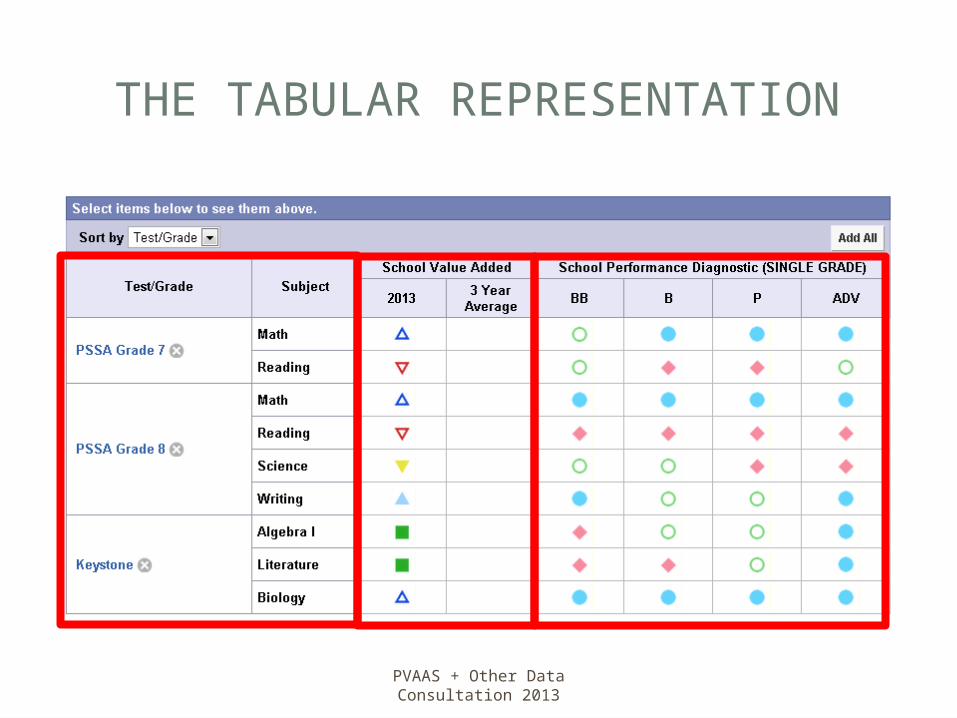
THE TABULAR REPRESENTATION
PVAAS + Other Data Consultation 2013
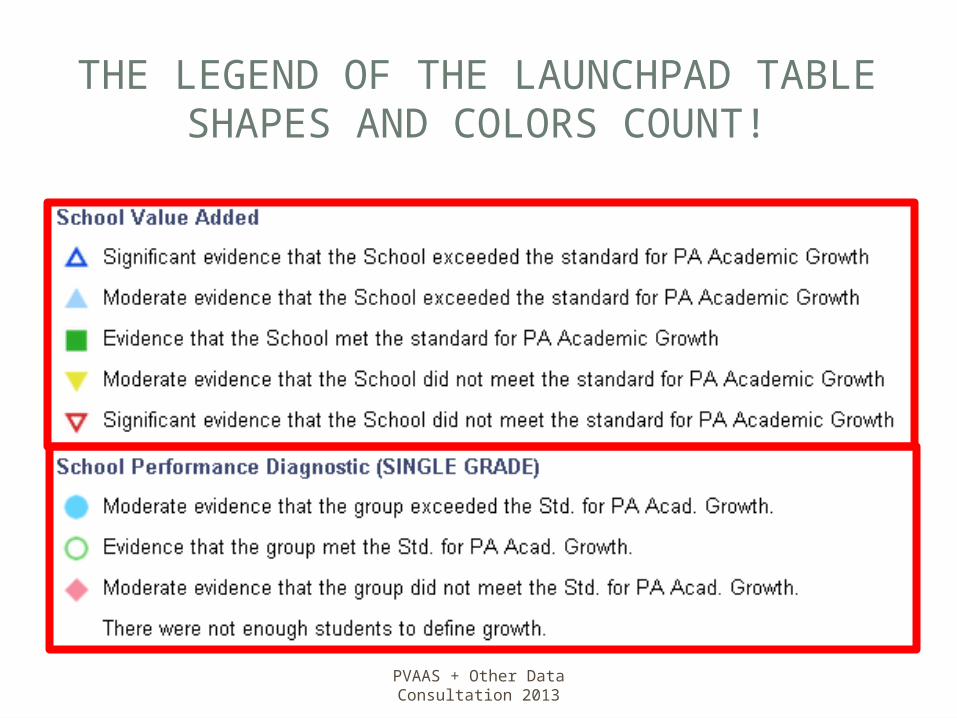
THE LEGEND OF THE LAUNCHPAD TABLESHAPES AND COLORS COUNT!
PVAAS + Other Data Consultation 2013
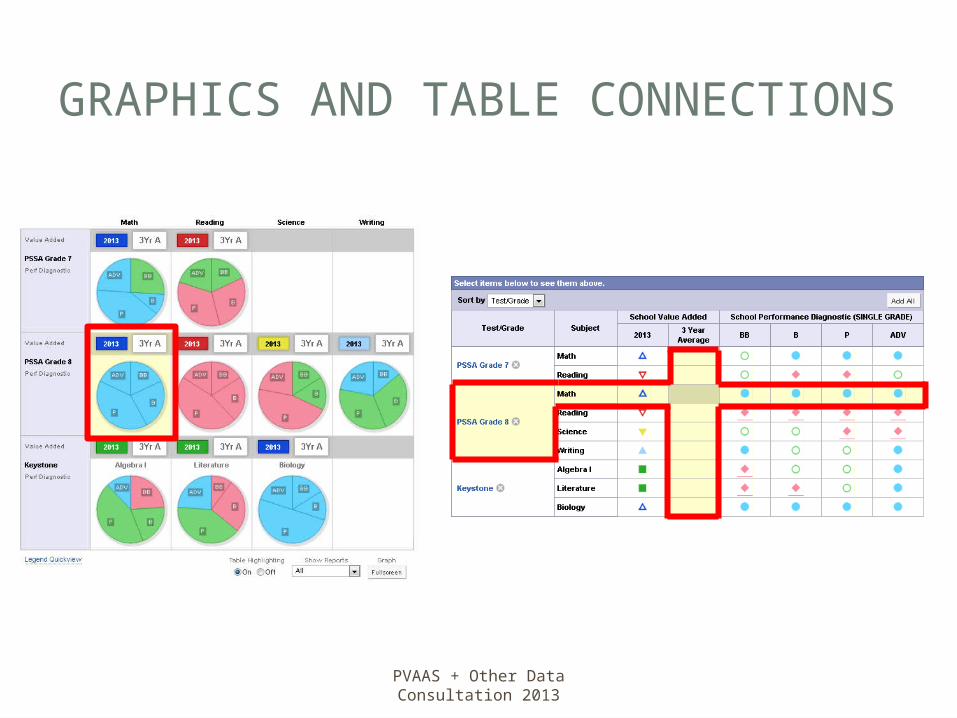
GRAPHICS AND TABLE CONNECTIONS
PVAAS + Other Data Consultation 2013
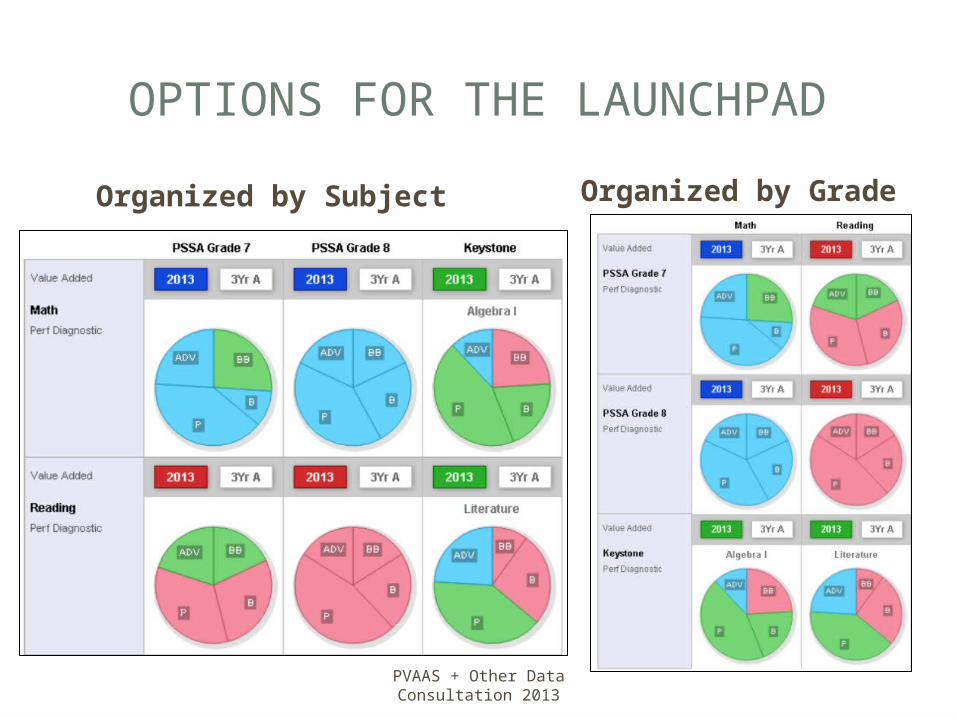
OPTIONS FOR THE LAUNCHPAD
Organized by SubjectOrganized by
Grade
PVAAS + Other Data Consultation 2013
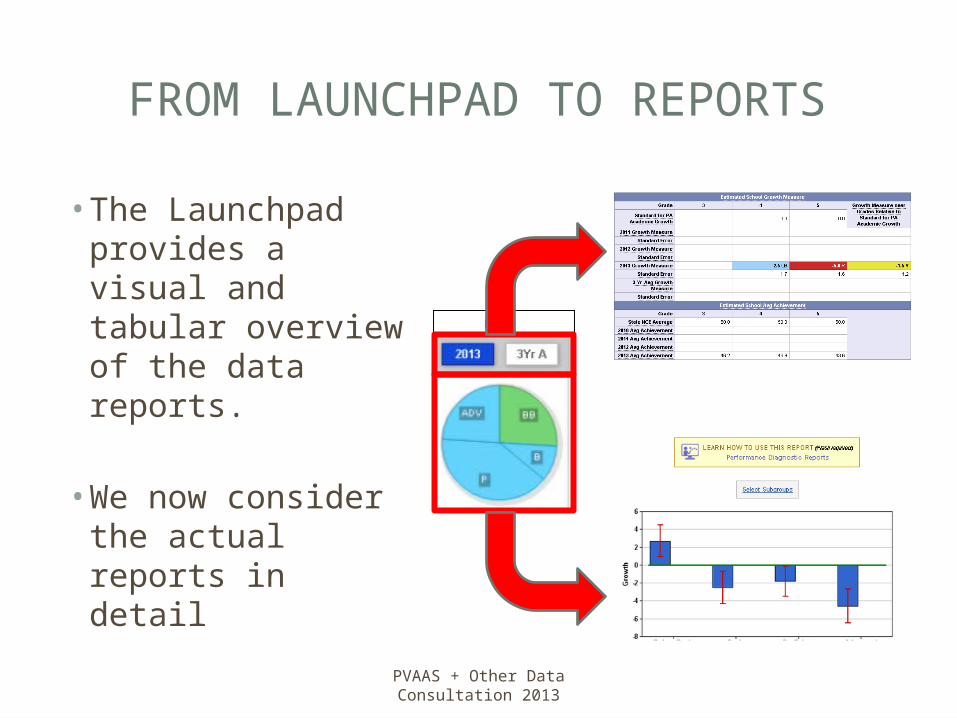
FROM LAUNCHPAD TO REPORTS
• The Launchpad provides a visual and tabular overview of the data reports.
• We now consider the actual reports in detail
PVAAS + Other Data Consultation 2013
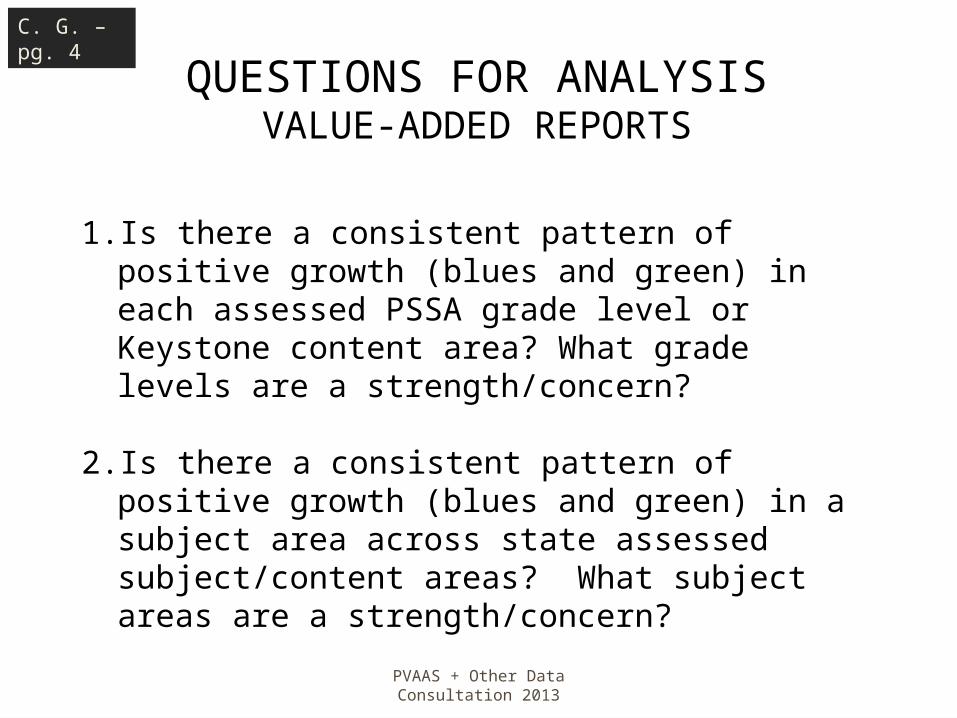
QUESTIONS FOR ANALYSISVALUE-ADDED REPORTS
C. G. – pg. 4
1. Is there a consistent pattern of positive growth (blues and green) in each assessed PSSA grade level or Keystone content area? What grade levels are a strength/concern?
2. Is there a consistent pattern of positive growth (blues and green) in a subject area across state assessed subject/content areas? What subject areas are a strength/concern?
PVAAS + Other Data Consultation 2013
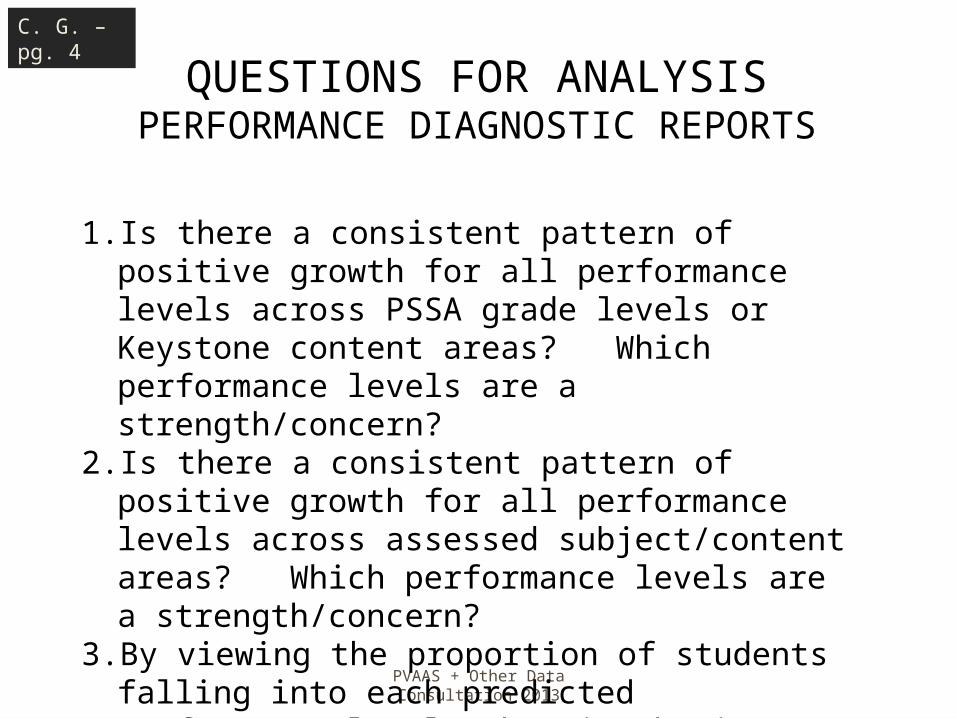
QUESTIONS FOR ANALYSISPERFORMANCE DIAGNOSTIC REPORTS
C. G. – pg. 4
1. Is there a consistent pattern of positive growth for all performance levels across PSSA grade levels or Keystone content areas? Which performance levels are a strength/concern?
2. Is there a consistent pattern of positive growth for all performance levels across assessed subject/content areas? Which performance levels are a strength/concern?
3. By viewing the proportion of students falling into each predicted performance level, what is the impact of the growth pattern for your students?
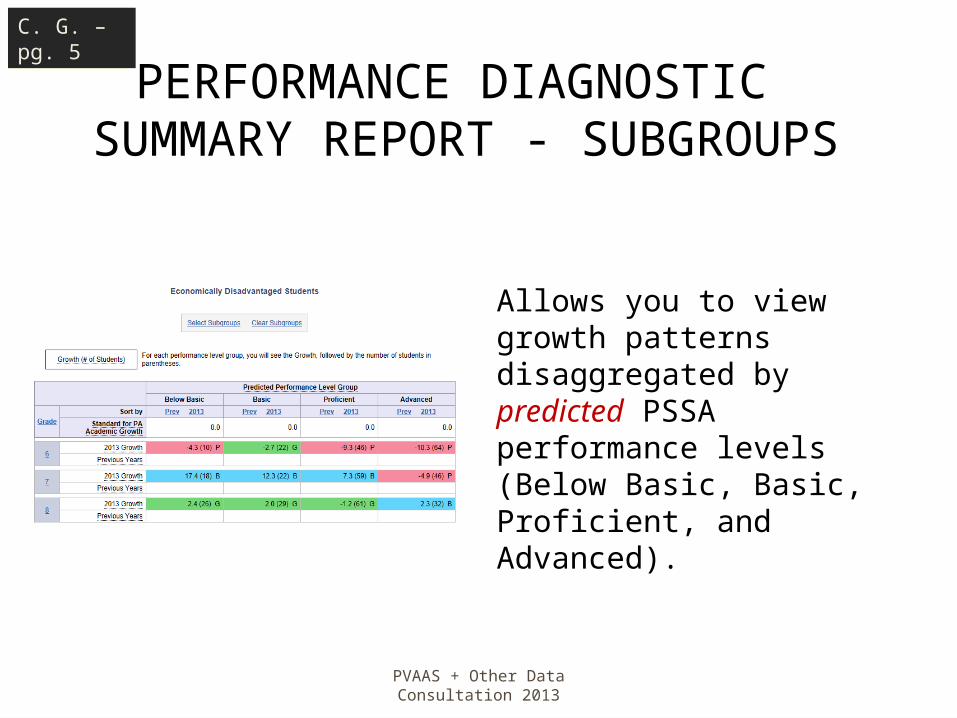
PERFORMANCE DIAGNOSTIC SUMMARY REPORT - SUBGROUPS
Allows you to view growth patterns disaggregated by predicted PSSA performance levels (Below Basic, Basic, Proficient, and Advanced).
C.G. Pg. 8
PVAAS + Other Data Consultation 2013
C. G. – pg. 5
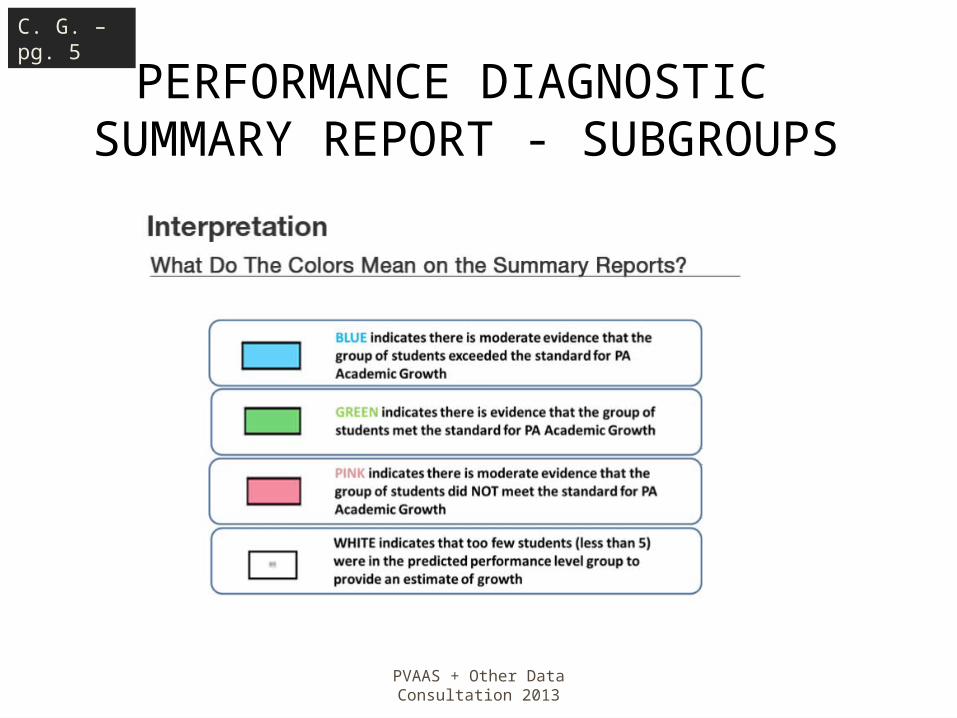
PERFORMANCE DIAGNOSTIC SUMMARY REPORT - SUBGROUPS
PVAAS + Other Data Consultation 2013
C. G. – pg. 5
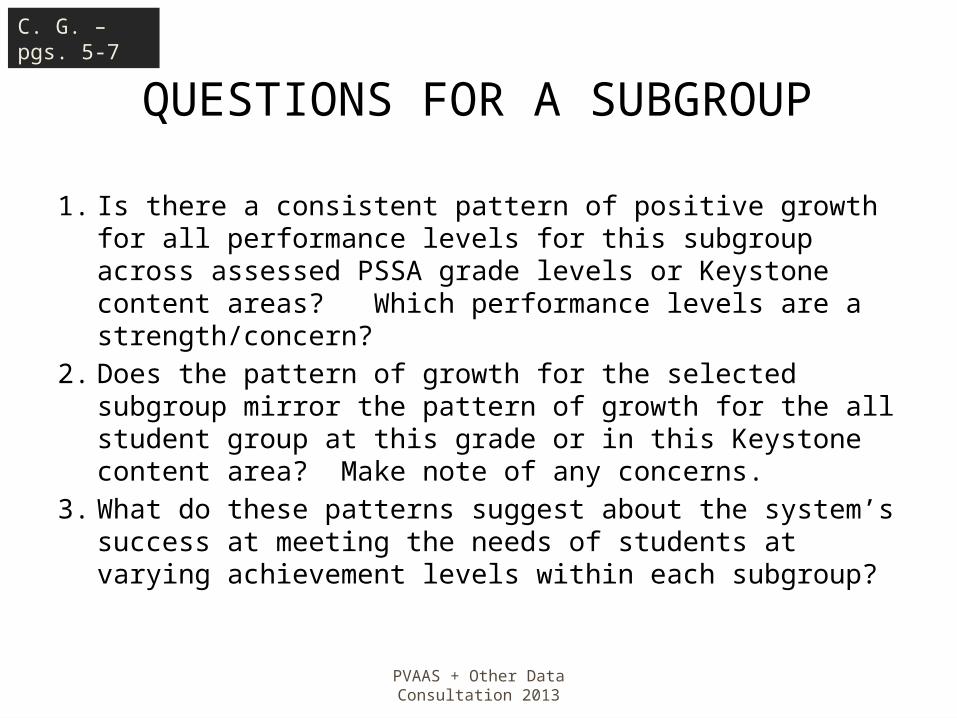
QUESTIONS FOR A SUBGROUP
1. Is there a consistent pattern of positive growth for all performance levels for this subgroup across assessed PSSA grade levels or Keystone content areas? Which performance levels are a strength/concern?
2. Does the pattern of growth for the selected subgroup mirror the pattern of growth for the all student group at this grade or in this Keystone content area? Make note of any concerns.
3. What do these patterns suggest about the system’s success at meeting the needs of students at varying achievement levels within each subgroup?
PVAAS + Other Data Consultation 2013
C. G. – pgs. 5-7
LOOKING FORWARD/PLANNING
PVAAS + Other Data Consultation 2013
Projection Summary Reports
Where are our students headed?
C. G. – pg. 8
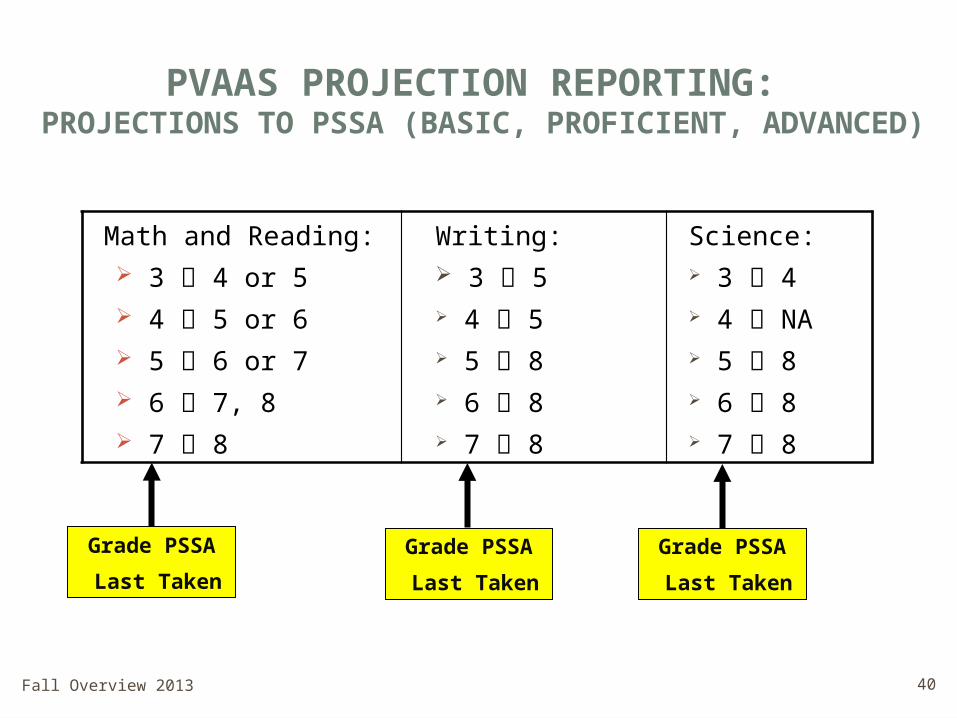
PVAAS PROJECTION REPORTING: PROJECTIONS TO PSSA (BASIC, PROFICIENT,
ADVANCED)
Grade PSSA
Last Taken
Math and Reading: 3 4 or 5 4 5 or 6 5 6 or 7 6 7, 8 7 8
Writing: 3 5 4 5 5 8 6 8 7 8
Science: 3 4 4 NA 5 8 6 8 7 8
Grade PSSA
Last Taken
Grade PSSA
Last Taken
Fall Overview 2013 40
PVAAS PROJECTION REPORTING: PROJECTIONS TO KEYSTONES (BASIC, PROFICIENT,
ADVANCED)
Fall Overview 2013 41
• Anticipating projections to future Keystone exams will be available to students who last tested in grade 5
• Remember, projections to a Keystone exam are NOT grade specific.
• The projection probability indicates the probability of a student reaching the indicated performance level on a future Keystone exam – not necessarily at a specific grade level.
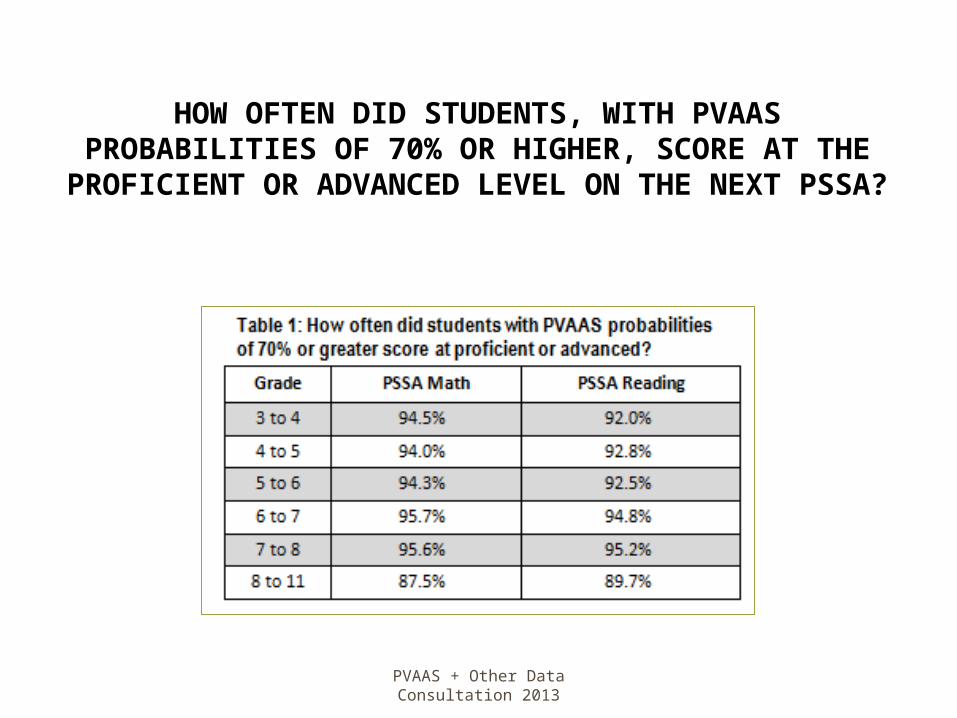
HOW OFTEN DID STUDENTS, WITH PVAAS PROBABILITIES OF 70% OR HIGHER, SCORE AT THE PROFICIENT OR
ADVANCED LEVEL ON THE NEXT PSSA?
PVAAS + Other Data Consultation 2013
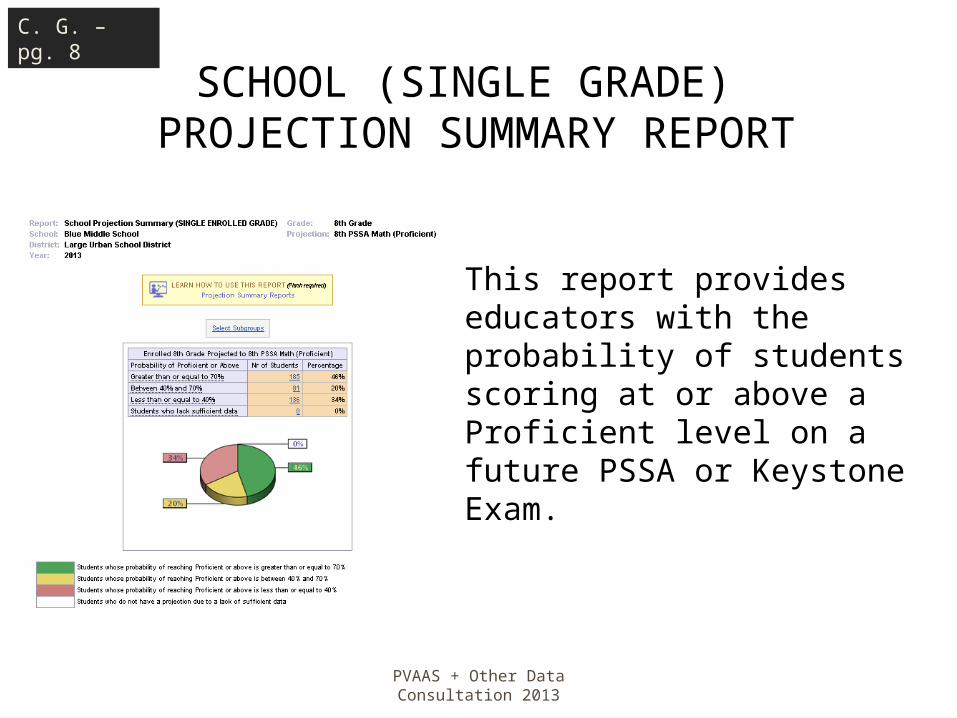
SCHOOL (SINGLE GRADE) PROJECTION SUMMARY REPORT
This report provides educators with the probability of students scoring at or above a Proficient level on a future PSSA or Keystone Exam.
PVAAS + Other Data Consultation 2013
C. G. – pg. 8
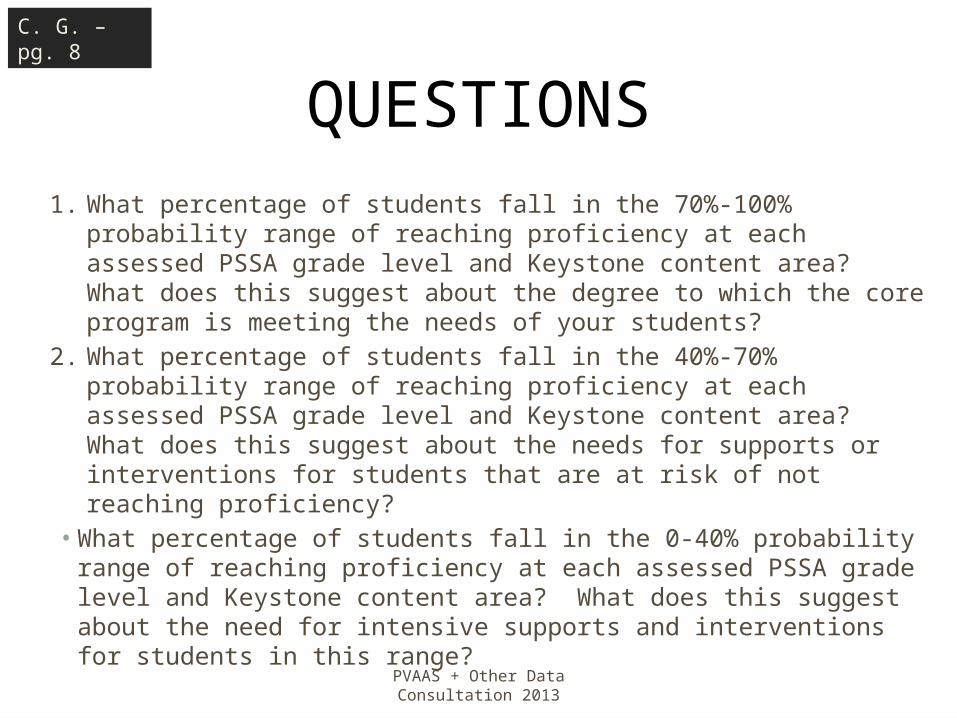
QUESTIONS1. What percentage of students fall in the 70%-100% probability
range of reaching proficiency at each assessed PSSA grade level and Keystone content area? What does this suggest about the degree to which the core program is meeting the needs of your students?
2. What percentage of students fall in the 40%-70% probability range of reaching proficiency at each assessed PSSA grade level and Keystone content area? What does this suggest about the needs for supports or interventions for students that are at risk of not reaching proficiency?
• What percentage of students fall in the 0-40% probability range of reaching proficiency at each assessed PSSA grade level and Keystone content area? What does this suggest about the need for intensive supports and interventions for students in this range?PVAAS + Other Data Consultation
2013
C. G. – pg. 8
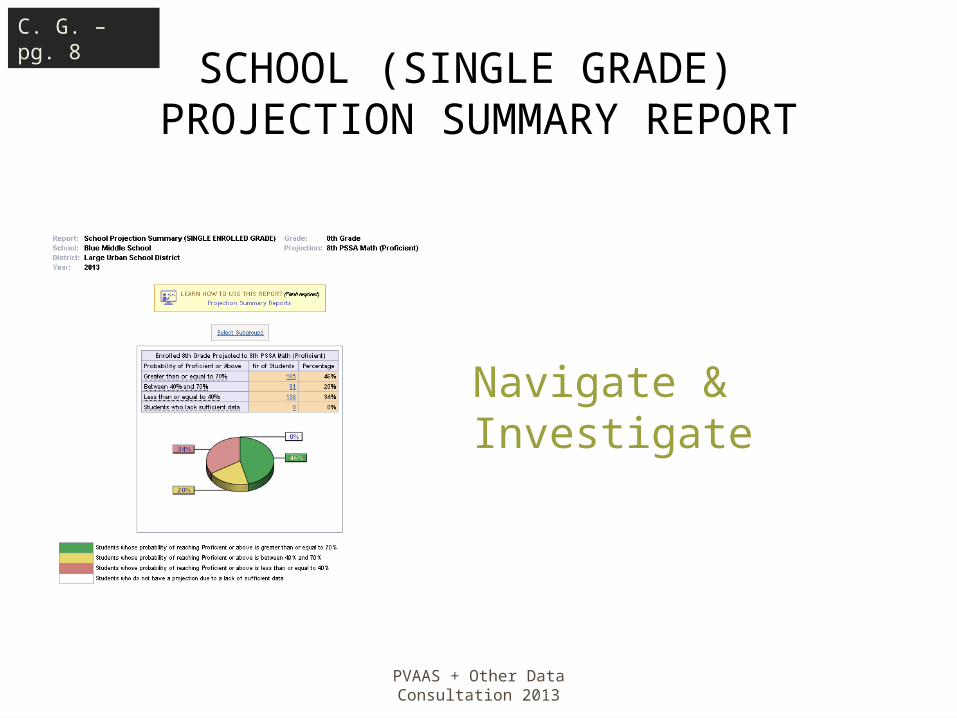
SCHOOL (SINGLE GRADE) PROJECTION SUMMARY REPORT
PVAAS + Other Data Consultation 2013
Navigate & Investigate
C. G. – pg. 8
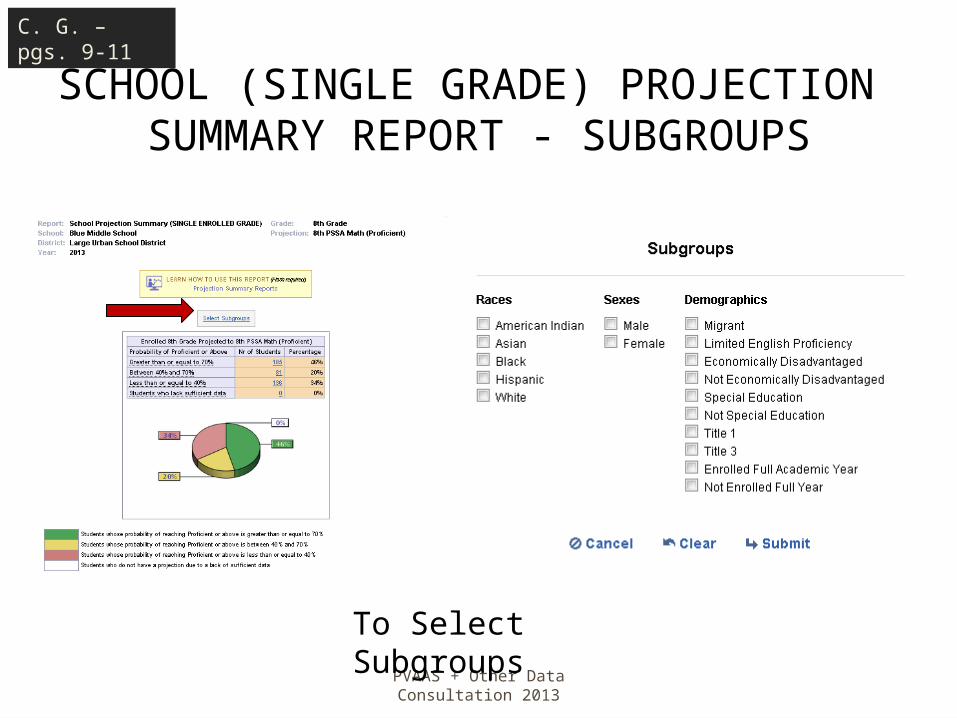
SCHOOL (SINGLE GRADE) PROJECTION SUMMARY REPORT - SUBGROUPS
PVAAS + Other Data Consultation 2013
C. G. – pgs. 9-11
To Select Subgroups
QUESTIONS FOR A SUBGROUP
1. In what probability range do most of the students in this subgroup fall in each assessed PSSA grade level and Keystone content area? Greater than 70%, Between 40% to 70%, or Less than 40%?
2. What do the data suggest about the degree to which your core program is meeting the needs of the selected subgroup of students?
3. What interventions, supports, and/or services have been provided for these students?
PVAAS + Other Data Consultation 2013
C. G. – pgs. 9-11
PVAAS + Other Data Consultation 2013
PSSA DATA INTERACTION – EMETRIC
https://solutions1.emetric.net/pssa/
C. G. – pg. 12
PVAAS + Other Data Consultation 2013
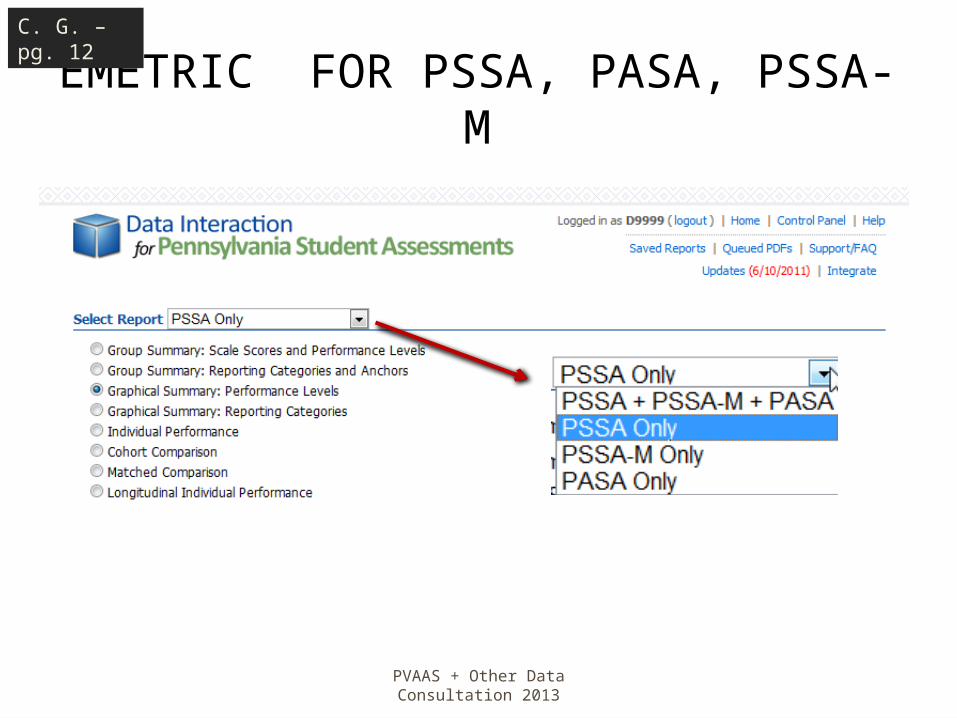
EMETRIC
• Password-protected site
• PSSA Reports and Keystone Reports• Grade level data
• Multiple years
• Student groups within grade levels• Ethnicity• Gender• ED, IEP, LEP• Title I
C. G. – pg. 12
PVAAS + Other Data Consultation 2013
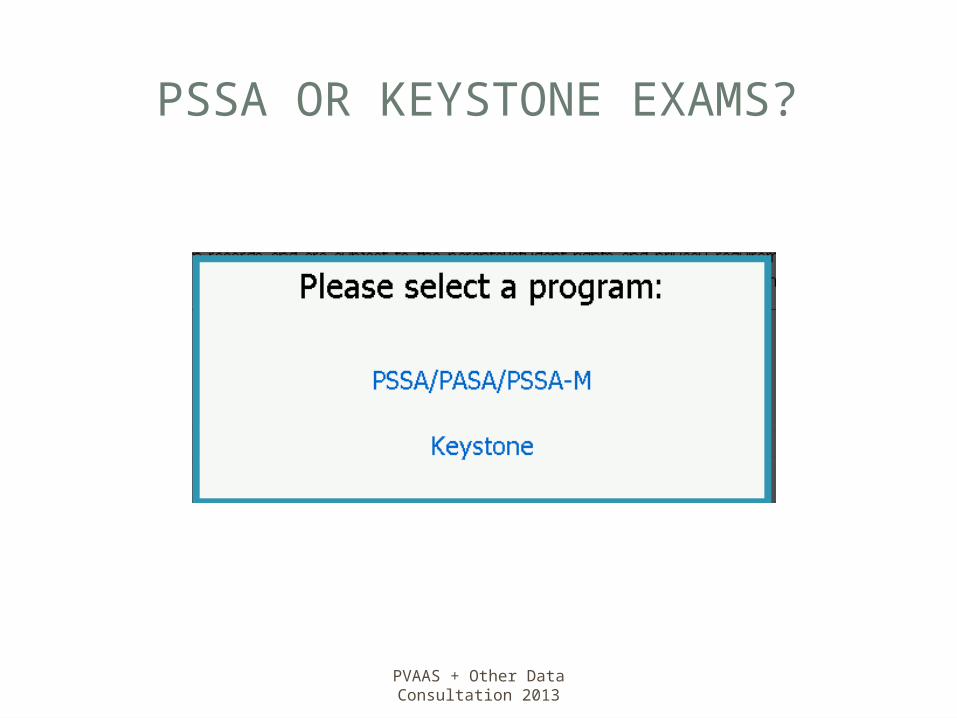
PSSA OR KEYSTONE EXAMS?
PVAAS + Other Data Consultation 2013
EMETRIC FOR PSSA, PASA, PSSA-M
C. G. – pg. 12
PVAAS + Other Data Consultation 2013
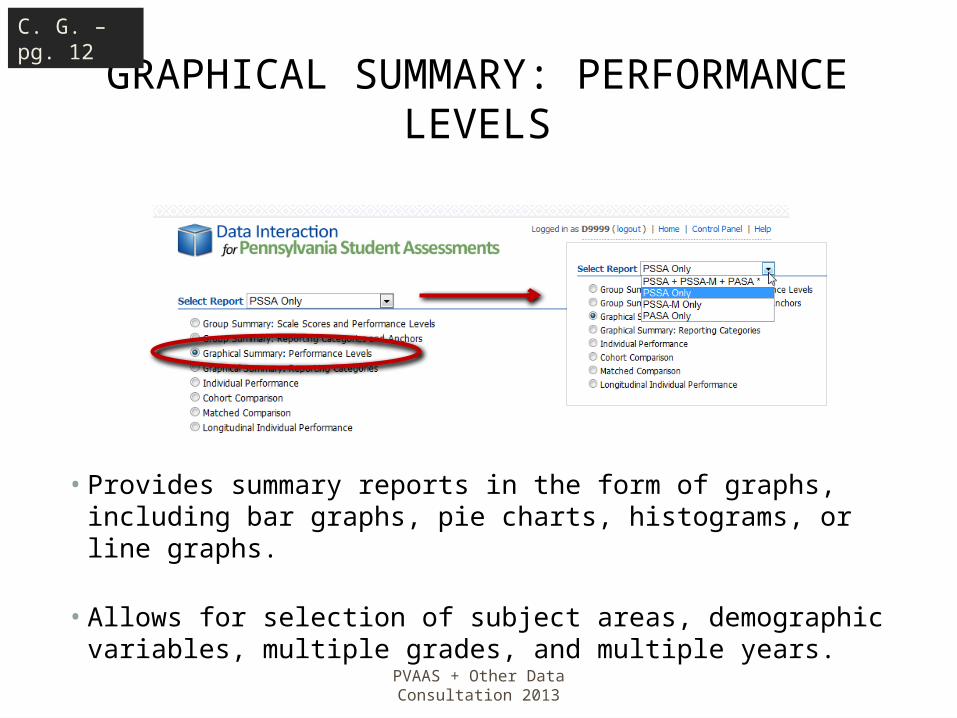
GRAPHICAL SUMMARY: PERFORMANCE LEVELS
• Provides summary reports in the form of graphs, including bar graphs, pie charts, histograms, or line graphs.
• Allows for selection of subject areas, demographic variables, multiple grades, and multiple years.
C. G. – pg. 12
PVAAS + Other Data Consultation 2013
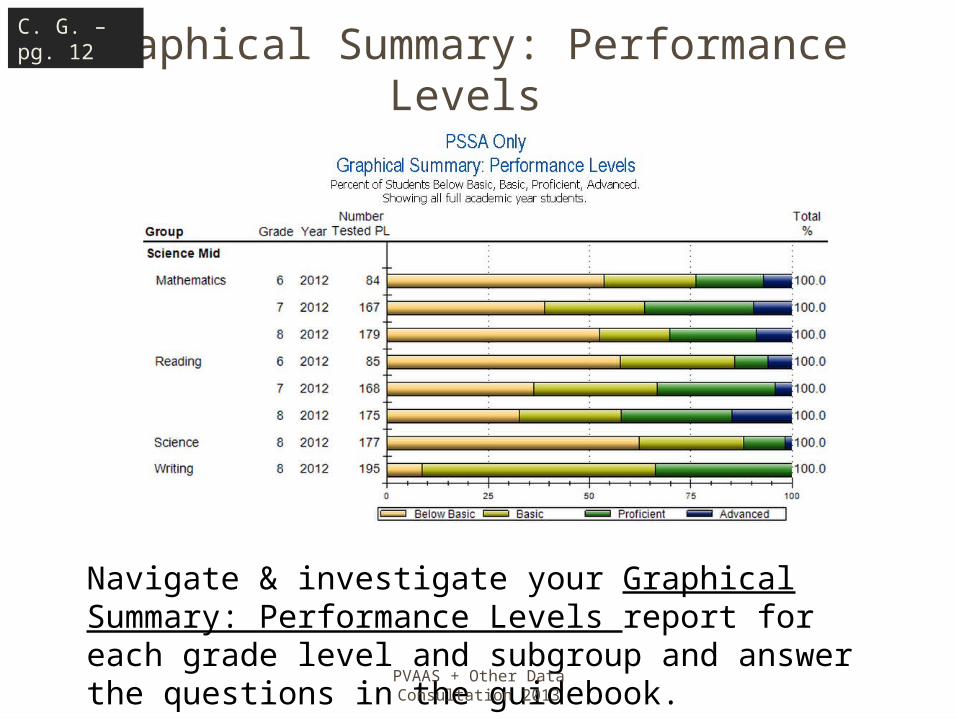
Navigate & investigate your Graphical Summary: Performance Levels report for each grade level and subgroup and answer the questions in the guidebook.
Graphical Summary: Performance Levels
C. G. – pg. 12
QUESTIONS
1. Over time, is the percentage of students scoring in the proficient and advanced performance levels increasing in each subject area? Make note of any concerns.
2. Over time, is the percentage of students in relevant subgroups (n≥ 40) scoring in the proficient and advanced performance levels increasing in each subject area? Make note of any concerns.
3. Does the pattern of performance for the selected subgroup mirror the pattern of performance for the grade as a whole in each subject area?
C. G. – pg. 12
PVAAS + Other Data Consultation 2013
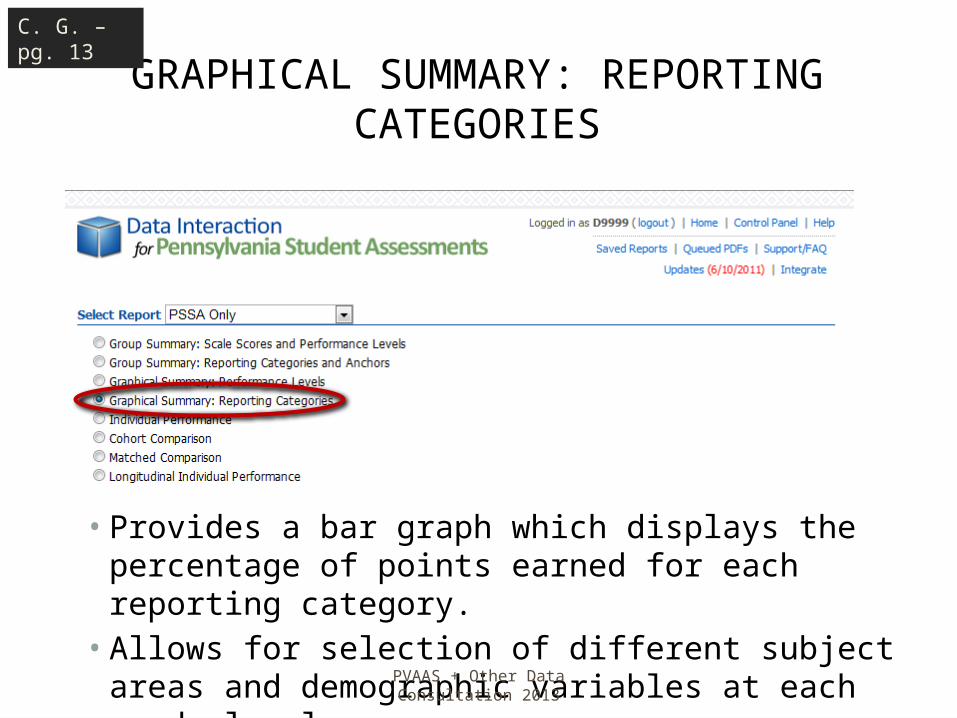
GRAPHICAL SUMMARY: REPORTING CATEGORIES
• Provides a bar graph which displays the percentage of points earned for each reporting category.
• Allows for selection of different subject areas and demographic variables at each grade level.
C. G. – pg. 13
PVAAS + Other Data Consultation 2013
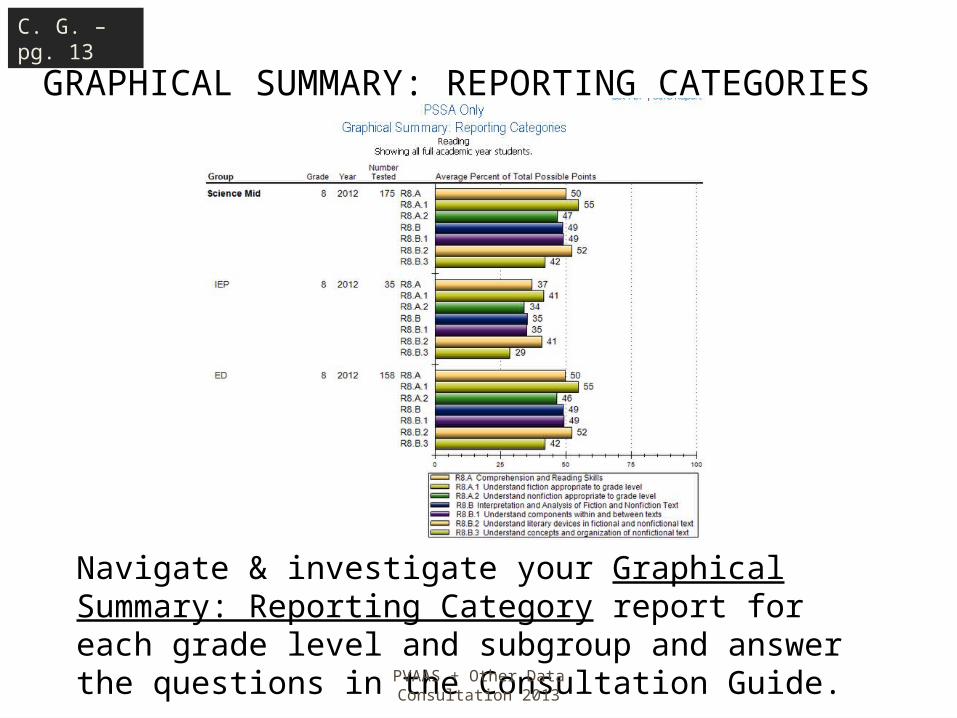
Navigate & investigate your Graphical Summary: Reporting Category report for each grade level and subgroup and answer the questions in the Consultation Guide.
GRAPHICAL SUMMARY: REPORTING CATEGORIES
C. G. – pg. 13
PVAAS + Other Data Consultation 2013
QUESTIONS
1. At each grade level, did all students perform satisfactorily (at least 60% correct) in all reporting categories in the targeted subject area?
2. Does the pattern of performance across reporting categories for the selected subgroups mirror the pattern of performance across reporting categories for the grade as a whole?
C. G. – pg. 13
PVAAS + Other Data Consultation 2013
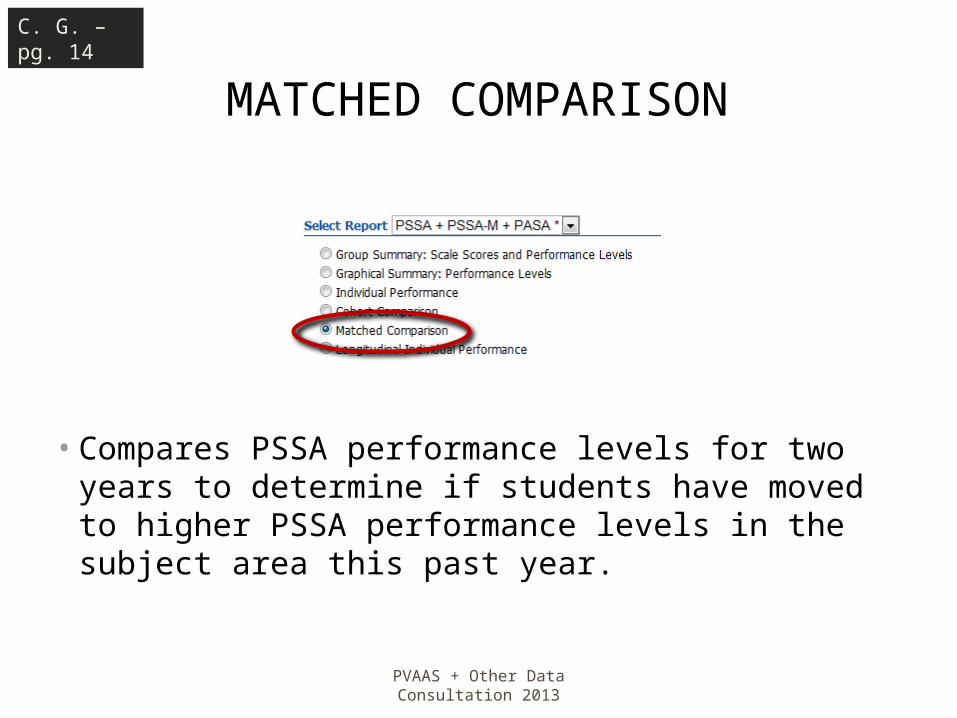
MATCHED COMPARISON
• Compares PSSA performance levels for two years to determine if students have moved to higher PSSA performance levels in the subject area this past year.
C. G. – pg. 14
PVAAS + Other Data Consultation 2013
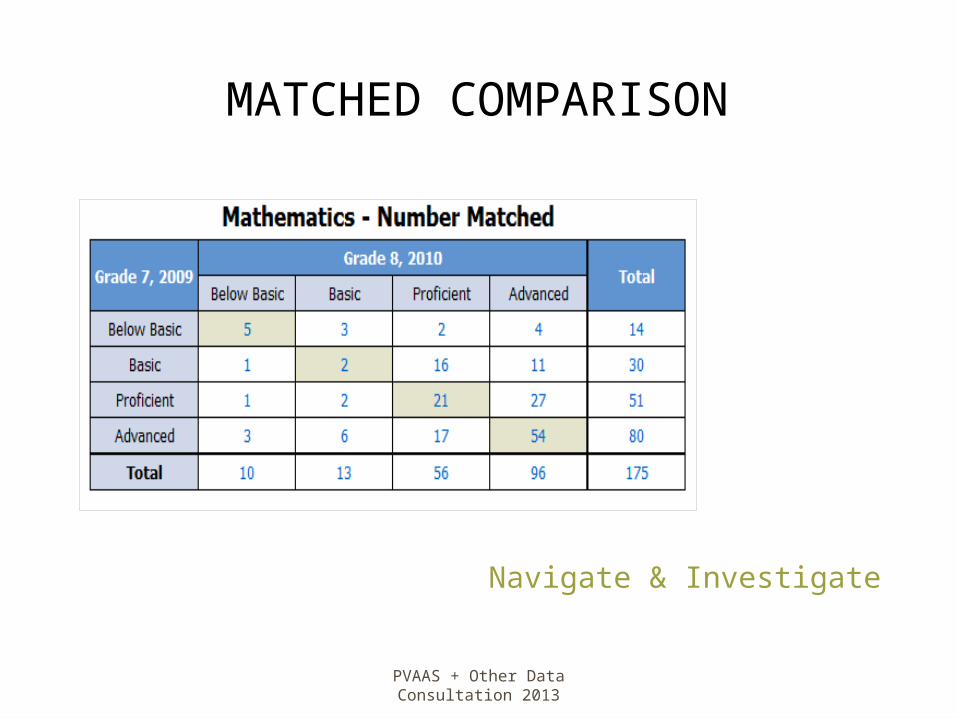
MATCHED COMPARISON
Navigate & Investigate
PVAAS + Other Data Consultation 2013
QUESTIONS
1. In each grade level, have more students moved to higher PSSA performance levels, remained in the same performance levels, or moved to lower performance levels?
2. How do these results impact your school’s achievement goals?
C. G. – pg. 14
PVAAS + Other Data Consultation 2013
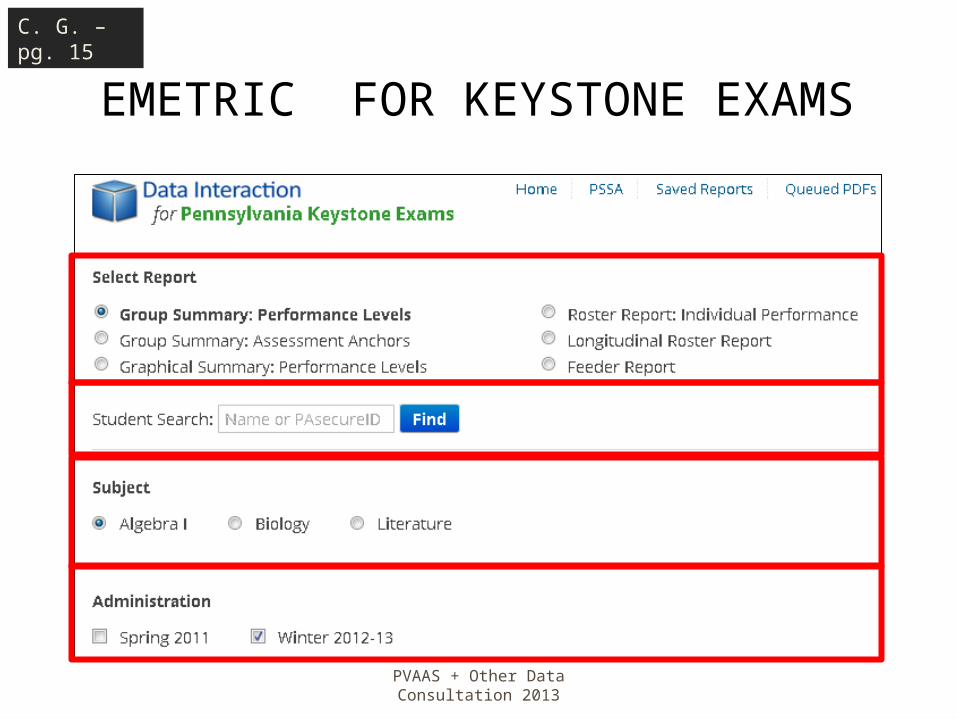
EMETRIC FOR KEYSTONE EXAMS
C. G. – pg. 15
PVAAS + Other Data Consultation 2013
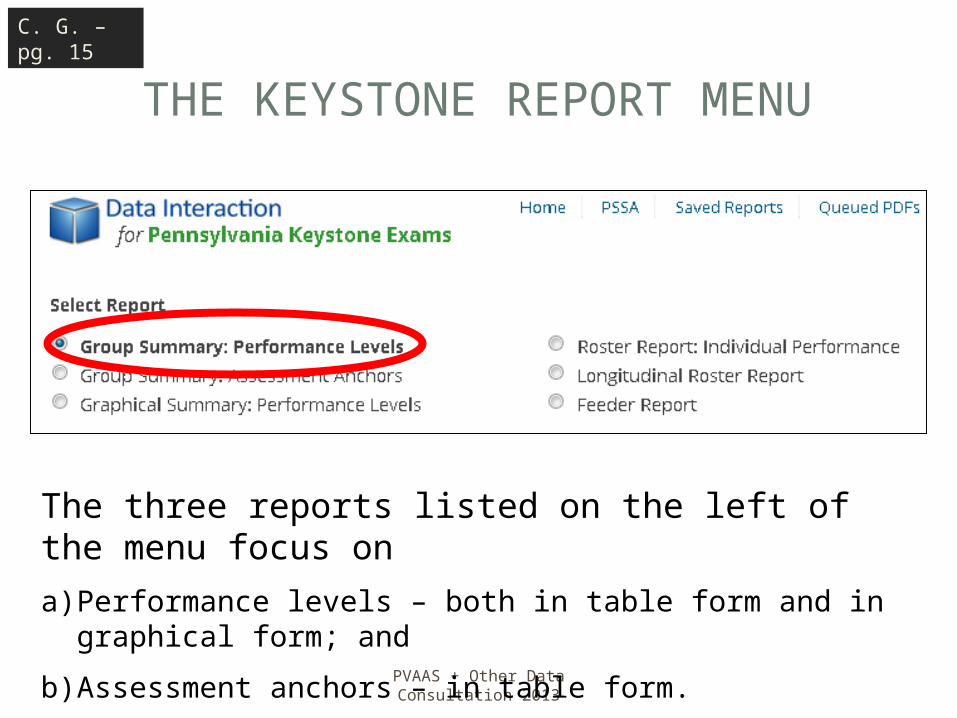
THE KEYSTONE REPORT MENU
The three reports listed on the left of the menu focus on
a) Performance levels – both in table form and in graphical form; and
b) Assessment anchors – in table form.
C. G. – pg. 15
PVAAS + Other Data Consultation 2013
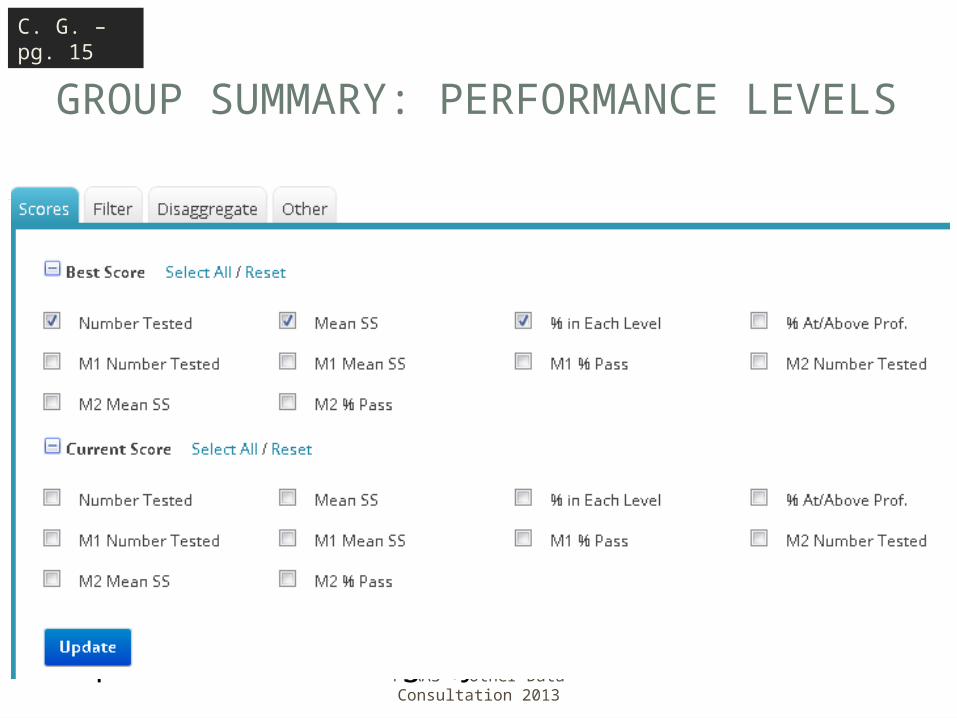
GROUP SUMMARY: PERFORMANCE LEVELS
Data Reported:• School name• Administration• Number Tested • Percentage of students in each performance
category
C. G. – pg. 15
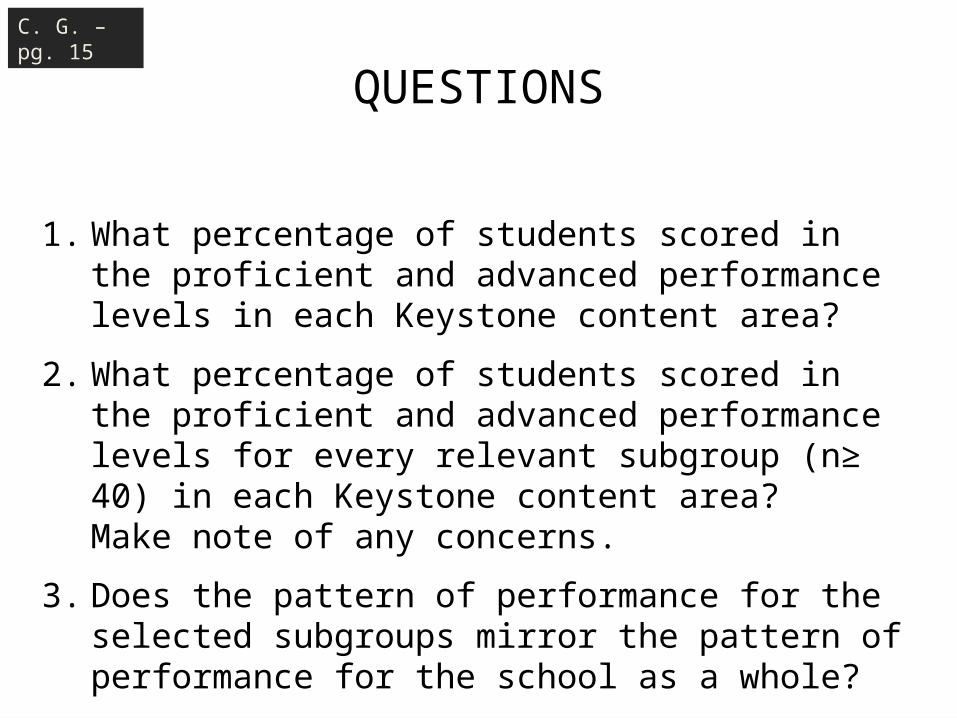
QUESTIONS
1. What percentage of students scored in the proficient and advanced performance levels in each Keystone content area?
2. What percentage of students scored in the proficient and advanced performance levels for every relevant subgroup (n≥ 40) in each Keystone content area? Make note of any concerns.
3. Does the pattern of performance for the selected subgroups mirror the pattern of performance for the school as a whole?
C. G. – pg. 15
PVAAS + Other Data Consultation 2013
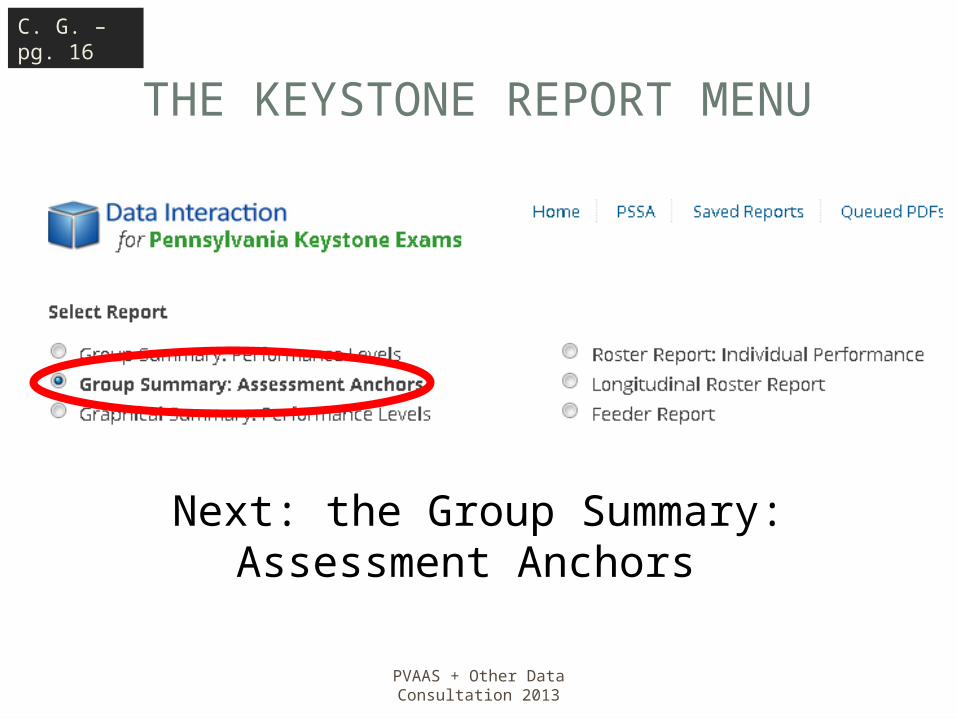
THE KEYSTONE REPORT MENU
Next: the Group Summary: Assessment Anchors
C. G. – pg. 16
PVAAS + Other Data Consultation 2013
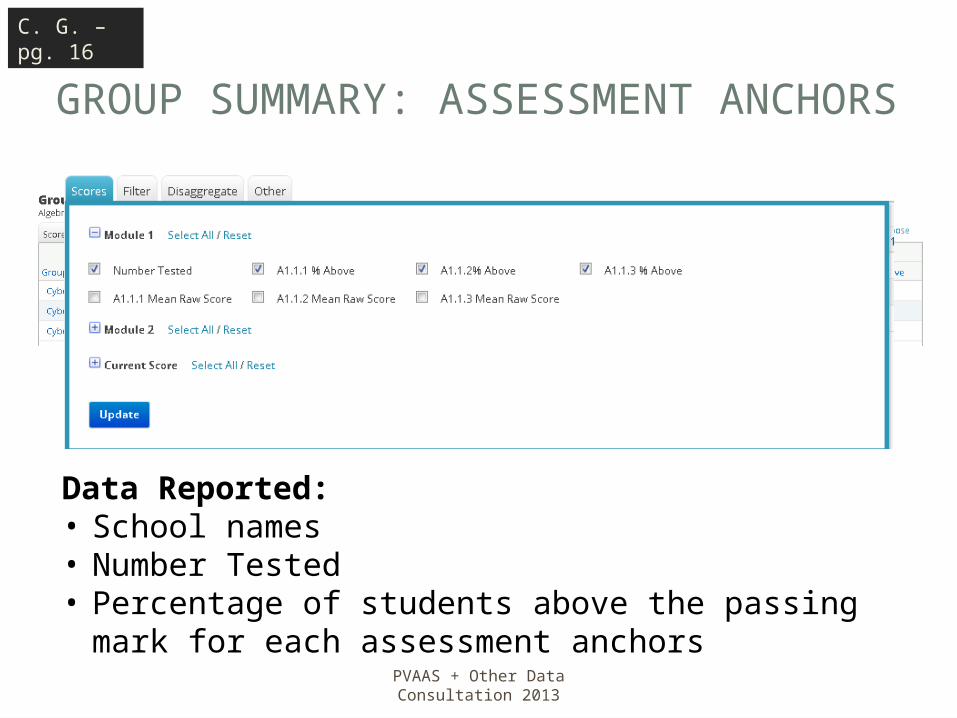
GROUP SUMMARY: ASSESSMENT ANCHORS
Data Reported:• School names• Number Tested • Percentage of students above the passing mark
for each assessment anchors
C. G. – pg. 16
PVAAS + Other Data Consultation 2013
QUESTIONS
1. For each Keystone content area, did all students perform satisfactorily in all anchor areas for the targeted subject area?
2. Does the pattern of performance across the anchors for the selected subgroups mirror the pattern of performance across the anchors for the entire group as a whole?
C. G. – pg. 16
PVAAS + Other Data Consultation 2013
SUMMARY OF ESSENTIAL FINDINGS
• Based on your system’s achievement goals and analysis of your PVAAS data, how would you answer the two main questions?• Is the system (school/district) serving all students
adequately?• Is the system (school/district) serving all students
equitably?
• List three findings from today’s session for each subject area.
C. G. – pg. 17
PVAAS + Other Data Consultation 2013
NEXT STEPS
• What about other data?• What other data sources are available for staff? • Benchmark Assessments (4-Sight, MAPS, Acuity)• CDT – Classroom Diagnostic Tool• DIBELS, AIMSweb, G-MADE, GRADE, Study Island,
STAR• District/School Common Assessments
• Who has access to these data?• How often is it shared and discussed?
C. G. – pg. 18
PVAAS + Other Data Consultation 2013
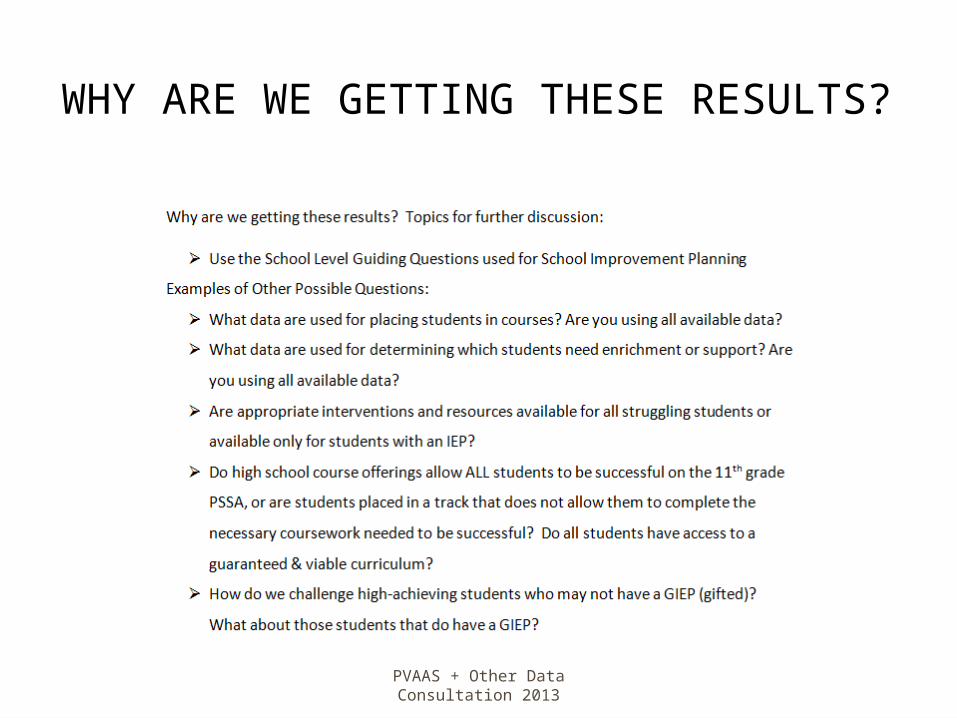
WHY ARE WE GETTING THESE RESULTS?
PVAAS + Other Data Consultation 2013
QUESTIONS:
PVAAS MATERIALS OR STATEWIDE
IMPLEMENTATION
717-606-1911
PVAAS REPORT WEB SITE
HTTPS://PVAAS.SAS.COM
www.pde.state.pa.us
PVAAS + Other Data Consultation 2013