Embed Size (px)
Citation preview
IEA SHC TASK 60 | PVT SYSTEMS
Numerical simulation tools for PVT collectors and systems
PVT Systems
Numerical simulation tools
for PVT collectors and systems
SHC Task 60/Report C1
Editor: Asier Sanz (TECNALIA)
Authors (in alphabetical order):
Antonio Gagliano (UNICT), Corry Dekeizer (TNO), Daniel Chemisana (UDL), Danny Jonas (University of Saarland), David Sauter (ZHAW), Giuseppe Tina (UNICT), Isabel Guedea (ENDEF), Kefer Patrick (FH-WELS), Laetitia Brottier (Dualsun), Len Rijvers (TUE), Luca Molinaroli (POLIMI), Maike Schubert (SPF), Marco Pellegrini (Unibersity of Bologna), Mark Dannemand (DTU), Maria Herrando (UNIZAR), Puneet Kumar (UD), Riccardo Simonetti (POLIMI), Xingxing Zhang (UD)
2020/09/28
RC1 Revision 1, DOI 10.18777/ieashc-task60-2020-0006
The contents of this report do not necessarily reflect the viewpoints or policies of the International Energy Agency (IEA) or its member countries, the IEA Solar Heating and Cooling Technology Collaboration Programme (SHC TCP) members or the participating researchers.

IEA Solar Heating and Cooling Technology Collaboration Programme (IEA SHC)
The Solar Heating and Cooling Technology Collaboration Programme was founded in 1977 as one of the first multilateral
technology initiatives ("Implementing Agreements") of the International Energy Agency. Its mission is “To enhance
collective knowledge and application of solar heating and cooling through international collaboration to reach the goal set
in the vision of solar thermal energy meeting 50% of low temperature heating and cooling demand by 2050.”
The members of the IEA SHC collaborate on projects (referred to as Tasks) in the field of research, development,
demonstration (RD&D), and test methods for solar thermal energy and solar buildings.
Research topics and the associated Tasks in parenthesis include:
• Solar Space Heating and Water Heating (Tasks 14, 19, 26, 44, 54)
• Solar Cooling (Tasks 25, 38, 48, 53, 65)
• Solar Heat for Industrial or Agricultural Processes (Tasks 29, 33, 49, 62, 64)
• Solar District Heating (Tasks 7, 45, 55)
• Solar Buildings/Architecture/Urban Planning (Tasks 8, 11, 12, 13, 20, 22, 23, 28, 37, 40, 41, 47, 51, 52, 56, 59, 63)
• Solar Thermal & PV (Tasks 16, 35, 60)
• Daylighting/Lighting (Tasks 21, 31, 50, 61)
• Materials/Components for Solar Heating and Cooling (Tasks 2, 3, 6, 10, 18, 27, 39)
• Standards, Certification, and Test Methods (Tasks 14, 24, 34, 43, 57)
• Resource Assessment (Tasks 1, 4, 5, 9, 17, 36, 46)
• Storage of Solar Heat (Tasks 7, 32, 42, 58)
In addition to our Task work, other activities of the IEA SHC include our:
➢ International Conference on Solar Heating and Cooling for Buildings and Industry
➢ SHC Solar Academy
➢ Solar Heat Worldwide annual statics report
➢ Collaboration with solar thermal trade associations
Country Members
Australia
Austria
Belgium
Canada
China
Denmark
European Commission
France
Germany
Italy
Netherlands
Norway
Portugal
Slovakia
South Africa
Spain
Sweden
Switzerland
Turkey
United Kingdom
Sponsor Members
European Copper Institute ECREEE
International Solar Energy Society RCREEE
CCREEE SACREEE
EACREEE
For more information on the IEA SHC work, including many free publications, please visit www.iea-shc.org
Numerical simulation tools for PVT collectors and systems
Page i
Contents
Contents .................................................................................................................................................................. i
Executive summary ............................................................................................................................................... 1
1 Introduction .................................................................................................................................................... 2
2 Tools and environments ................................................................................................................................ 3
2.1 Specific purpose software ......................................................................................................................... 3
2.1.1 TRNSYS® ........................................................................................................................................... 3
2.1.2 Polysun® ............................................................................................................................................ 4
2.2 General purpose environments ................................................................................................................. 6
2.2.1 TRANSOL® ........................................................................................................................................ 6
2.2.2 COMSOL® .......................................................................................................................................... 6
2.2.3 ANSYS Fluent® .................................................................................................................................. 6
2.2.4 STAR-CCM+ ...................................................................................................................................... 7
2.2.5 EES® .................................................................................................................................................. 7
2.2.6 MS Excel® .......................................................................................................................................... 7
2.2.7 NX® .................................................................................................................................................... 8
2.2.8 Matlab® .............................................................................................................................................. 8
2.2.9 SOLO® ............................................................................................................................................... 9
2.2.10 Other self-developments ................................................................................................................ 9
3 Examples ....................................................................................................................................................... 10
3.1 Collectors ................................................................................................................................................ 10
3.1.1 WISC or Unglazed PVT collector thermal absorber with PCM (TECNALIA) .................................... 10
3.1.2 Retrofitted PVT collector (ZHAW) .................................................................................................... 12
3.1.3 Glazed PVT absorber-exchanger designs analysis (UNIZAR) ......................................................... 14
3.1.4 Sensitivity analysis of key parameters of a concentrated PVT (UD) ................................................ 16
3.1.5 Uncovered roll-bond PVT analysis (UNICT) ..................................................................................... 20
3.1.6 Stainless steel heat exchanger for unglazed PVT (DualSun) ........................................................... 22
3.1.7 Dielectric PVT concentrator for building-façade integration (UDL) ................................................... 24
3.1.8 PVT solar collectors dynamic modelling (UDL) ................................................................................ 26
3.1.9 Unglazed PVT collectors’ thermal performance estimation for DHW production (UNIBO) ............... 29
3.1.10 PVT solar collector dynamic modelling and validation (POLIMI) .................................................. 31
3.1.11 Unglazed PVT Collector (FH Wels) .............................................................................................. 33
3.1.12 Unglazed PVT Collectors (TNO/TUE) .......................................................................................... 34
3.1.13 WISC and covered PVT collectors (Saarland University)) ............................................................ 35
3.2 Systems .................................................................................................................................................. 38
3.2.1 Direct expansion PVT coupled heat pump (TECNALIA) .................................................................. 38
3.2.2 “L-Sol” heating system modelled in Polysun (ZHAW) ...................................................................... 40
3.2.3 Combined heat and power for single family homes (UNIZAR) ......................................................... 42
3.2.4 Combined heat and power for tertiary building (UNIZAR) ................................................................ 45

3.2.5 PVT plant for the provision of domestic hot water (UNICT) .............................................................. 47
3.2.6 PVT collector connected to a brine-to-water heat pump and two storage tanks for DHW (DTU) ..... 49
3.2.7 Energetic and economic optimisation of solar assisted heat pump systems using MILP (POLIMI) . 53
3.2.8 Solarhybrid Energy Solutions (FH Wels) .......................................................................................... 56
3.2.9 PVT-HP coupled systems (TNO/TUE) ............................................................................................. 58
3.2.10 Unglazed PVT for swimming pool (DUALSUN) ............................................................................ 60
3.2.11 Solar and heat pump systems for the energy supply of buildings (Saarland University)) ............. 61
4 Conclusions .................................................................................................................................................. 63
Annex - Link for PVT collectors between normative coefficients and numerical tools ................................ 64


Numerical simulation tools for PVT collectors and systems
Page 1
Executive summary
The computer-based experimentation covers almost the entire activity chain of the PVT sector. The PVT community
carries out very different kind of modelling and simulation labours in order to answer to very diverse needs, such
as proof-of-concepts, research, design, sizing, controlling, optimization, validation, marketing, sales, O&M, etc.
The modelling and simulation activities are key for success, but only if the outcomes are reliable and “good enough”
for desired KPI estimation. Thus, the current report represents the current numerical simulation tools that the
community is using for PVT collectors and systems modelling.
During the IEA SHC Task 60 the experience of the community with up to 11 different tools has been gathered for
PVT collector and/or system level modelling, including 24 different case studies. Additionally, the gap between the
user expectation and real experience has been collected and clustered. Finally, a useful guideline for PVT collector
model parameterization is included, as a link between normative coefficients and numerical tools.

Page 2 RStat
1 Introduction
The report summarizes the currently available and most commonly used tools for solar photovoltaic-thermal (PVT)
solutions performance determination.
Although computer-based modelling and simulation covers almost the entire value chain of the PVT community
activity, proof of new concepts, applied research, solutions design, components sizing, control strategies tuning,
overall optimization, validation, marketing/sales labors, operation and maintenance, etc. the current work is mainly
focused on PVT collectors and systems energy performance determination.
However, within the PVT community there are two modelling approaches depending on the partner needs or
purpose of the simulation activity, based on the accuracy vs quick results trade off.
Thus, the report first addresses some general considerations about the specific modelling activity considered within
the Task 60, then the different tools are presented, included some modelling examples, and finally current modelling
gaps are highlighted.
Numerical simulation tools for PVT collectors and systems
Page 3
2 Tools and environments
The tools and environments considered in the current chapter are the ones used or known by the PVT community
represented in the Task 60. However, other initiatives might be available or under use for collectors and systems
performance modelling and simulation.
The numerical modelling solutions considered in the current analysis are listed below in two different groups. On
the one hand, the tools or specifically suited software for energy systems entire year performance determination.
On the other, numerical analysis environments or programming solutions that could be used for different kind of
modelling purposes.
2.1 Specific purpose software
The entire year PVT based solutions energy performance determination is a common need among the PVT
community members. In order to obtain those energy performance figures, there are two main commercial software
currently used, TRNSYS® and Polysun®. Both initiatives are based on configurable transient analysis, and are
offering different components portfolio and some flexibility for component parameterization/development.
2.1.1 TRNSYS®
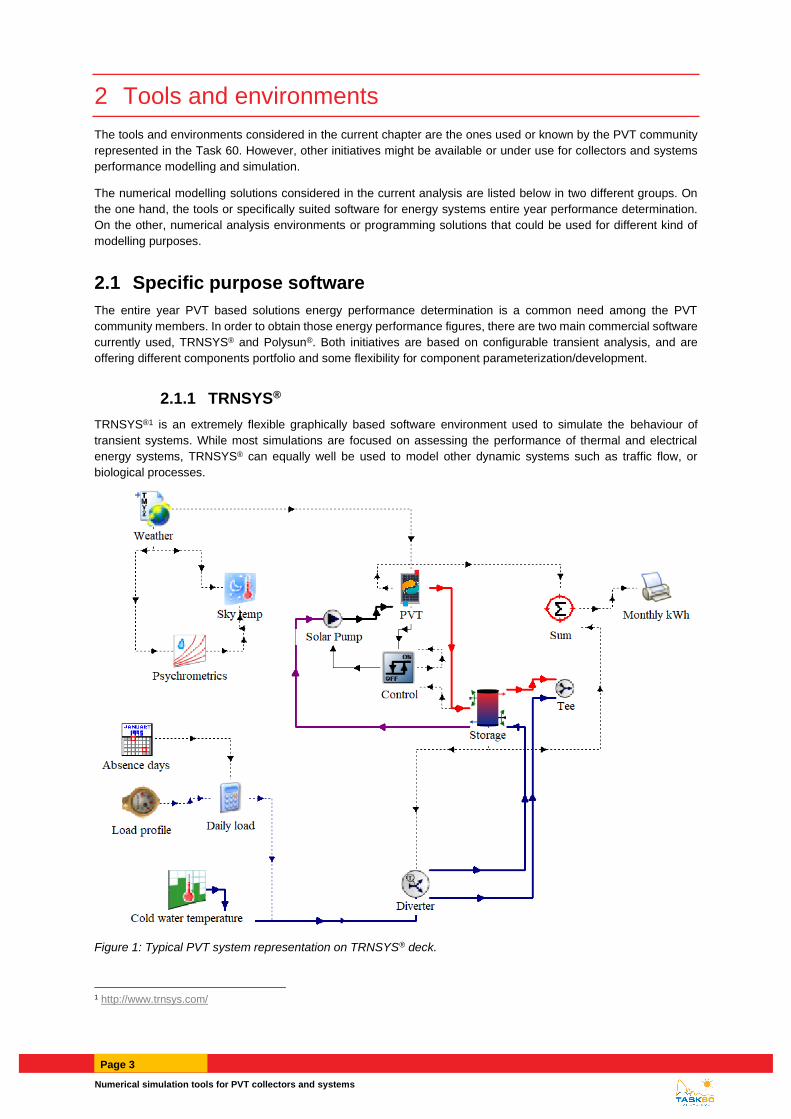
TRNSYS®1 is an extremely flexible graphically based software environment used to simulate the behaviour of
transient systems. While most simulations are focused on assessing the performance of thermal and electrical
energy systems, TRNSYS® can equally well be used to model other dynamic systems such as traffic flow, or
biological processes.
Figure 1: Typical PVT system representation on TRNSYS® deck.
1 http://www.trnsys.com/
Page 4 RStat
TRNSYS is made up of two parts.
a) An engine or kernel that reads and processes the input file, iteratively solves the system, determines
convergence, and plots system variables. The kernel also provides utilities that determine thermophysical
properties, invert matrices, perform linear regressions, and interpolate external data files.
b) An extensive library of components, each of which models the performance of one part of the system. The
standard library includes approximately 150 models ranging from pumps to multizone buildings, wind
turbines to electrolyzers, weather data processors to economics routines, and basic HVAC equipment to
cutting edge emerging technologies. Models are constructed in such a way that users can modify existing
components or write their own, extending the capabilities of the environment.
After 35 years of commercial availability, TRNSYS® continues to be a flexible, component-based software package
that accommodates the ever-changing needs of both researchers and practitioners in the energy simulation
community.
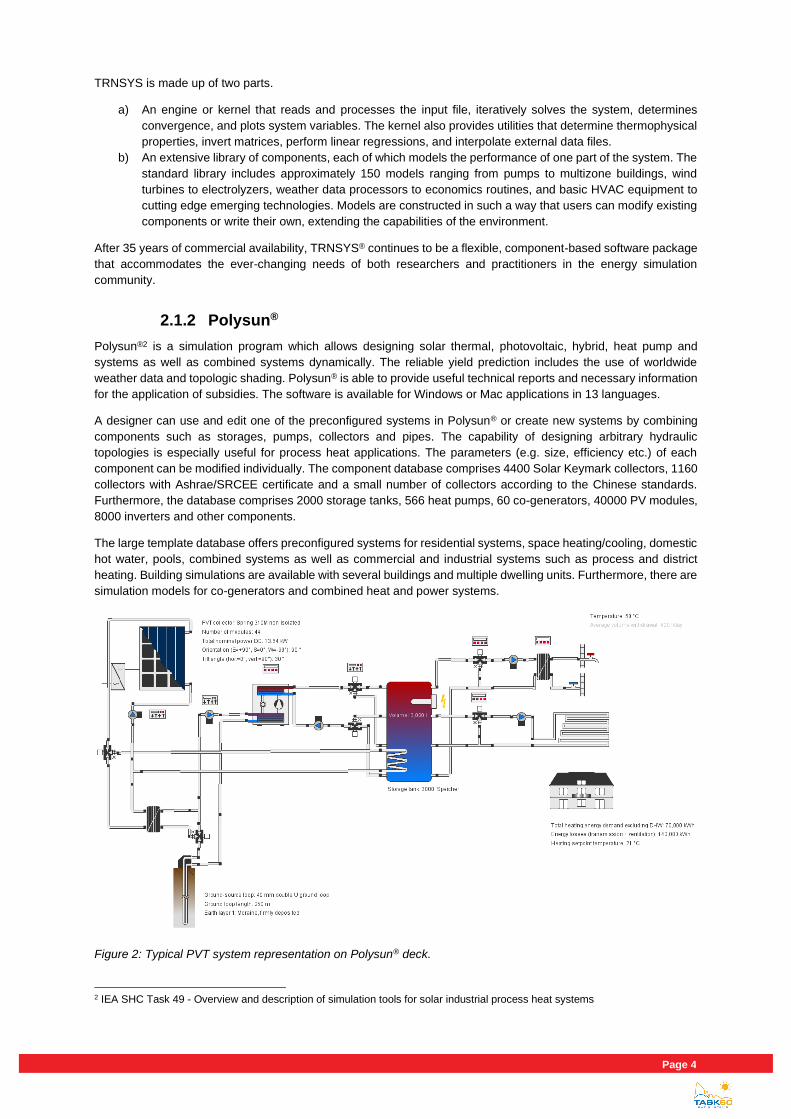
2.1.2 Polysun®
Polysun®2 is a simulation program which allows designing solar thermal, photovoltaic, hybrid, heat pump and
systems as well as combined systems dynamically. The reliable yield prediction includes the use of worldwide
weather data and topologic shading. Polysun® is able to provide useful technical reports and necessary information
for the application of subsidies. The software is available for Windows or Mac applications in 13 languages.
A designer can use and edit one of the preconfigured systems in Polysun® or create new systems by combining
components such as storages, pumps, collectors and pipes. The capability of designing arbitrary hydraulic
topologies is especially useful for process heat applications. The parameters (e.g. size, efficiency etc.) of each
component can be modified individually. The component database comprises 4400 Solar Keymark collectors, 1160
collectors with Ashrae/SRCEE certificate and a small number of collectors according to the Chinese standards.
Furthermore, the database comprises 2000 storage tanks, 566 heat pumps, 60 co-generators, 40000 PV modules,
8000 inverters and other components.
The large template database offers preconfigured systems for residential systems, space heating/cooling, domestic
hot water, pools, combined systems as well as commercial and industrial systems such as process and district
heating. Building simulations are available with several buildings and multiple dwelling units. Furthermore, there are
simulation models for co-generators and combined heat and power systems.
Figure 2: Typical PVT system representation on Polysun® deck.
2 IEA SHC Task 49 - Overview and description of simulation tools for solar industrial process heat systems

Numerical simulation tools for PVT collectors and systems
Page 5
The Polysun® software comprises economic analysis. However, it is optimized for solar thermal heating systems
and rooftop PV systems. Therefore, in some process heat applications for instance, it is necessary to enhance the
economic analysis by means of the Polysun® simulation results and special calculations, e.g. in MS Excel®.
Yearly system parameters such as efficiency, solar fraction or auxiliary heat demand are calculated from the
simulation results.
Page 6 RStat
2.2 General purpose environments
The general-purpose tools are usually but not always used for a PVT system component modelling and simulation.
Thus, the environments are more generic and might not be originally prepared for energy solutions transient
analysis. In this sense, the different tools are mainly used for collector, control strategies or system parts analysis.
2.2.1 TRANSOL®
TRANSOL®3 is a tool for the design, calculation and optimization of solar thermal systems. Transol makes dynamic
simulation easy, based on TRNSYS engine, through a user-friendly interface. TRANSOL is also based on TRNSYS
models, but instead of a single configuration, as in F-Chart, includes about 40 system configurations, allowing more
than 140 system variations.
Within PVT field has been used for fast system level just thermal performance determination, as it offers a wider
range of installations as well as hourly energy data.
2.2.2 COMSOL®
COMSOL®4 Multiphysics® is a general-purpose Computational Fluid Dynamics (CFD) and Finite Element Method
(FEM) simulation software for modelling designs, devices, and processes in all fields of engineering, manufacturing,
and scientific research. In addition to using multiphysics modelling for your own projects, you can also turn your
models into simulation applications and digital twins for use by other design teams, manufacturing departments,
test labs, customers, and more.
The platform product can be used on its own or expanded with functionality from any combination of add-on modules
for simulating electromagnetics, structural mechanics, acoustics, fluid flow, heat transfer, and chemical engineering.
The add-on modules and LiveLink™ products connect seamlessly for a modelling workflow that remains the same
regardless of what you are modelling.
Within the PVT field, it has been used to model in detail the PVT collector’s performance. The PVT collectors can
be modelled in 3-D, including the physical properties and dimensions of the different PVT layers, along with the
different multi-physics involved (e.g. fluid dynamics, heat transfer). The PVT collector can be modelled in steady-
state and in time-varying conditions. With these models it is possible to obtain the theoretical performance curve of
the PVT collector, and also to analyse the temperature and flow distribution throughout the collector. If the solid
mechanics physic is also included in the model, it is possible to analyse the thermal stress and structural
deformation of the collector at different operation conditions.
2.2.3 ANSYS Fluent®
Fluent5 software contains the broad, physical modelling capabilities needed to model flow, turbulence, heat transfer
and reactions for industrial applications. These range from air flow over an aircraft wing to combustion in a furnace,
from bubble columns to oil platforms, from blood flow to semiconductor manufacturing and from clean room design
to wastewater treatment plants. Fluent spans an expansive range, including special models, with capabilities to
model in-cylinder combustion, aero-acoustics, turbomachinery and multiphase systems.
Fluent also offers highly scalable, high-performance computing (HPC) to help solve complex, large-model
computational fluid dynamics (CFD) simulations quickly and cost-effectively. Fluent set a world supercomputing
record by scaling to 172.000 cores.
Within the PVT field, it has been used to model in detail the PVT collector’s performance. The PVT collectors can
be modelled in 3-D, including the physical properties and dimensions of the different PVT layers, along with the
different multi-physics involved (e.g. fluid dynamics, heat transfer). Similarly as before, with these models it is
possible to obtain the theoretical performance curve of the PVT collector, and to analyse the temperature and flow
distribution throughout the collector.
3 https://aiguasol.coop/design-of-solar-thermal-systems-with-transol/ 4 https://www.comsol.com/products 5 https://www.ansys.com/products/fluids/ansys-fluent
Numerical simulation tools for PVT collectors and systems
Page 7
2.2.4 STAR-CCM+
STAR-CCM + is CFD (Computational Fluid Dynamic) software developed by CD-ADAPCO in 2004. It is an
improvement of the STAR-CD software. The CCM suffix stands for Computational Continuum Mechanics. The
strong point of this calculation code is that it makes it possible to simultaneously solve the problems of flux and heat
transfer, unlike other codes which use two coupled solvers, which makes it possible to gain in precision.
It is not a simple CFD solver. Indeed, it makes it possible to solve problems of mechanics and fluid / structure
interaction. It provides a suite of integrated components that meet a wide variety of modeling needs. These
components include:
• 3D-CAD and CAD modeler
• Surface preparation tool
• Automatic mesh technology
• A variety of physical models (turbulence, combustion, etc.)
• Post processing
The STAR-CCM + interface is coded in Java. It is based on the principle of object-oriented programming. This can
be seen from the user interface. An object tree is provided for each simulation; it contains all associated data. In
addition, the code can be executed either in series or in parallel on several cores.
Within the PVT field, it has been used to model in detail the PVT collector’s performance. The PVT collectors can
be modelled in 3-D, including the physical properties and dimensions of the different PVT layers, along with the
different multi-physics involved (e.g. fluid dynamics, heat transfer).
2.2.5 EES®
EES6 is a general equation-solving program that can numerically solve thousands of coupled non-linear algebraic
and differential equations. The program can also be used to solve differential and integral equations, do
optimization, provide uncertainty analyses, perform linear and non-linear regression, convert units, check unit
consistency, and generate publication-quality plots. A major feature of EES is the high accuracy thermodynamic
and transport property database that is provided for hundreds of substances in a manner that allows it to be used
with the equation solving capability.
Within the PVT field, it has been used to model PVT collectors and wider PVT systems. The performance of the
PVT collector can be modelled through the energy balance equations of the different layers, considering radiative,
convective and conductive thermal exchanges between the layers, the cooling water flow and the environment
(where relevant). A wider PVT system can also be modelled including the energy balances of a water (thermal)
storage tank, the energy consumed by the water circulator pump of the closed loop, and other energy losses of the
interconnecting pipework. This type of analysis can be undertaken at different time steps during days or a year. The
software also allows to do parametric analyses varying different PVT system parameters, and also economic and
environmental analyses if the corresponding equations are implemented in the model.
2.2.6 MS Excel®
Microsoft Excel7 is a spreadsheet developed by Microsoft for Windows, macOS, Android and iOS. It features
calculation, graphing tools, pivot tables, and a macro programming language called Visual Basic for Applications.
It has been a very widely applied spreadsheet for these platforms, especially since version 5 in 1993, and it has
replaced Lotus 1-2-3 as the industry standard for spreadsheets. Excel forms part of the Microsoft Office suite of
software.
Within the PVT community MS Excel has been used for modules performance forecasting through a combination
of daily/monthly/yearly environmental data for a certain location (i.e. solar radiation, ambient temperature) and the
application of equations able to describe PV and thermal output of PVT collector.
6 http://www.fchart.com/ees/ 7 https://en.wikipedia.org/wiki/Microsoft_Excel
Page 8 RStat
2.2.7 NX®
NX, previously known as UG, is an advanced high-end CAD/CAM/CAE mechanical design software. It is used,
among other tasks, for:
• Design (parametric and direct solid/surface modelling)
• Engineering analysis (static; dynamic; electro-magnetic; thermal, using the finite element method; and
fluid, using the finite volume method).
• Manufacturing finished design by using included machining modules.
Within the PVT community, NX has been used for collector modelling in order to different layers thermal
performance determination.
2.2.8 Matlab®
MATLAB8, matrix laboratory, is a multi-paradigm numerical computing environment and proprietary programming
language developed by MathWorks. MATLAB allows matrix manipulations, plotting of functions and data,
implementation of algorithms, creation of user interfaces, and interfacing with programs written in other languages,
including to other programming environments as C, C++, C#, Java, Fortran and Python.
Although MATLAB is intended primarily for numerical computing, an optional toolbox uses the MuPAD symbolic
engine, allowing access to symbolic computing abilities. An additional package, Simulink, adds graphical multi-
domain simulation and model-based design for dynamic and embedded systems.
Within the PVT community Matlab has been used for collector PV laminate temperature map and PV cell effect
determination, and for whole PVT system analysis on Matlab Simulink.
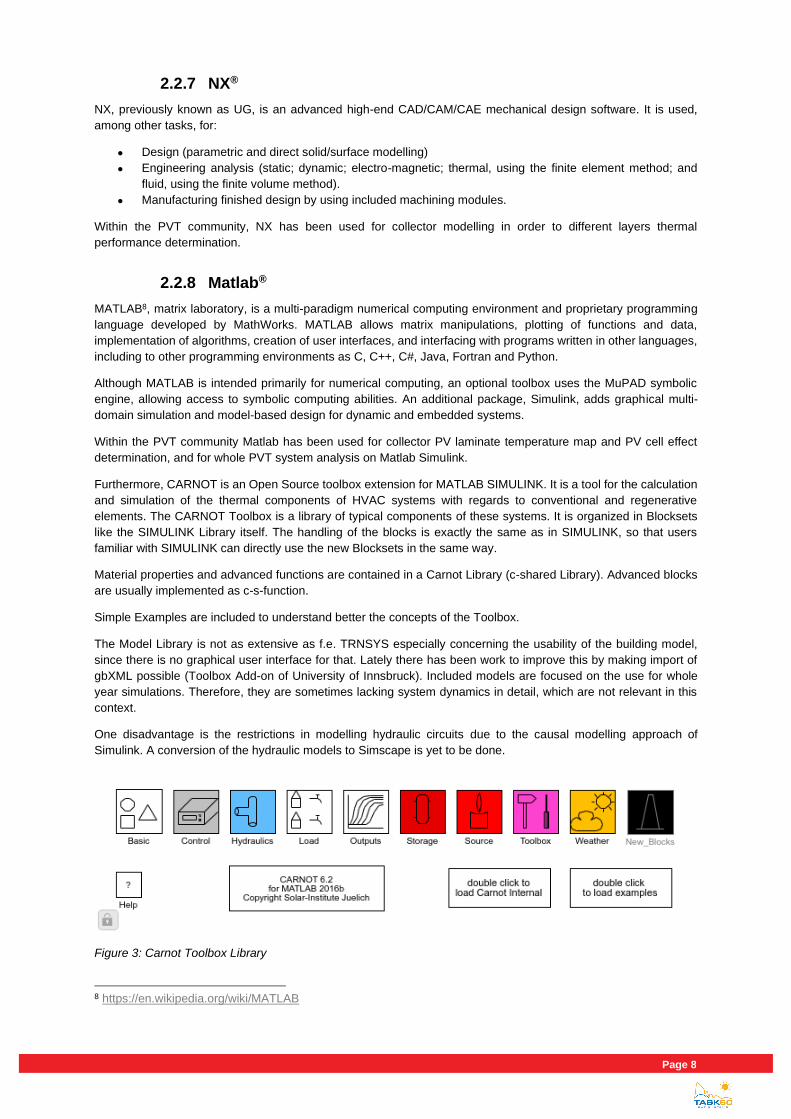
Furthermore, CARNOT is an Open Source toolbox extension for MATLAB SIMULINK. It is a tool for the calculation
and simulation of the thermal components of HVAC systems with regards to conventional and regenerative
elements. The CARNOT Toolbox is a library of typical components of these systems. It is organized in Blocksets
like the SIMULINK Library itself. The handling of the blocks is exactly the same as in SIMULINK, so that users
familiar with SIMULINK can directly use the new Blocksets in the same way.
Material properties and advanced functions are contained in a Carnot Library (c-shared Library). Advanced blocks
are usually implemented as c-s-function.
Simple Examples are included to understand better the concepts of the Toolbox.
The Model Library is not as extensive as f.e. TRNSYS especially concerning the usability of the building model,
since there is no graphical user interface for that. Lately there has been work to improve this by making import of
gbXML possible (Toolbox Add-on of University of Innsbruck). Included models are focused on the use for whole
year simulations. Therefore, they are sometimes lacking system dynamics in detail, which are not relevant in this
context.
One disadvantage is the restrictions in modelling hydraulic circuits due to the causal modelling approach of
Simulink. A conversion of the hydraulic models to Simscape is yet to be done.
Figure 3: Carnot Toolbox Library
8 https://en.wikipedia.org/wiki/MATLAB
Numerical simulation tools for PVT collectors and systems
Page 9
2.2.9 SOLO®
The SOLO method was developed in France by the Scientific and Technical Center for Building (CSTB) in the
1980s to size solar domestic hot water installations (SDHW) in individual and collective housing. SOLO is a free
software which calculates the coverage in domestic hot water according to the location, the needs, the type and the
volume of storage, the surface of collectors with their inclination and the orientation. SOLO does not use any quasi-
dynamic method. Equations that have been established by interpolation thanks to thermal experts, give directly
results in a monthly base.
Within the PVT community, it has been used for fast thermal performance determination, it is only limited to hot
water heating systems.
2.2.10 Other self-developments
The existing tools or platforms do not always satisfy the users needs. Thus, the PVT community requires an
adaptation of the tools in order to carry out the modelling, simulation and further optimization. Below, two different
examples are shown.
Endef: a Spanish PVT company
The approach of Endef to modelling and simulation covers the two tendencies on the PVT community and the
activity is addressed in different ways.
• For daily client enquiries: EndeF uses an in-home software designed and developed internally by EndeF
based on the f-chart model, a static method to evaluate the thermal production. This method is adapted to
the hybrid generation, including the temperature influence between both parts on the photovoltaic
production. The software allows to calculate basic PVT configurations, varying the type of panel, the final
application and the auxiliary heat device. As a result, the software returns monthly energy generation, as
well as it provides visual information about monthly irradiation, annual saving and emission cut. • For research purposes: for a deeper energy analysis EndeF uses the commercial software Transol, based
on Trnsys model, which uses a dynamic model to evaluate the thermal production. Transol provides a
wider range of installations as well as hourly energy data. The commercial software PVsyst is used to
quantify the photovoltaic production.
DualSun: a French PVT compamy
To give their client a performance estimation for each project, DualSun has developed an application called
MyDualSun (https://app.my.dualsun.com/home) MyDualSun provides a simulation of the solar project based on the
building's characteristics and energy needs. MyDualSun tells how many DualSun hybrid panels are needed and
presents a detailed analysis of the energy production and the financial savings that the installation could generate.
The MyDualSun application uses the TRNSYS thermodynamic simulation software to calculate panel production.
The DualSun panel has been modeled and integrated into the software by the thermal studies agency TESS
(Thermal Energy Systems Specialists), in order to ensure the independence and reliability of the results of our
MyDualSun simulator. This validation took place in 2 stages:
• The model has successfully passed 8 tests showing that it respects the laws of thermodynamics and that
its theoretical behavior was therefore consistent (https://news.dualsun.com/wp-
content/uploads/Validation-de-lexercice-MyDualSun-par-Tess.pdf)
• The equivalent of 1 month of field data from a running DualSun installation was recorded and analyzed at
one minute intervals by TESS. They combine both meteorological data and production data from DualSun
panels. These data were then compared to the theoretical data. It can be concluded to an almost complete
correspondence between the productions announced by MyDualSun and the field survey.
(https://news.dualsun.com/wp-content/uploads/Validation-du-mode%cc%80le-MyDualSun-par-Tess.pdf)
Page 10 RStat
3 Examples
This chapter summarizes different modelling activities carried out by the PVT community at both the collector level
and the system level. As the computer-based activity covers almost the entire value chain of an installation.
of the PVT community activity, proof of new concepts, applied research, solutions design, components sizing,
controlling strategies, overall
3.1 Collectors
3.1.1 WISC or Unglazed PVT collector thermal absorber with PCM (TECNALIA)
Description of the solution to be modelled
The solution analysed is an unglazed PVT collector with local phase change materials (PCM) buffer and back sheet
insulation.
The collector is composed by:
• With/without front glazing
• an air chamber
• a PV laminate
• a heat absorber
• a PCM layer
• back thermal insulation
Purpose of the modelling and simulation activity
The modelling and simulation activity have been focused on the development phase, assessing:
a) The selection of which absorber layout offers greater thermal and hydraulic performance.
b) The selection and optimization of the PCM to be integrated in order to reduce production peaks.
Tool
The collector has been modelled on NX from Siemens PLM.
Model
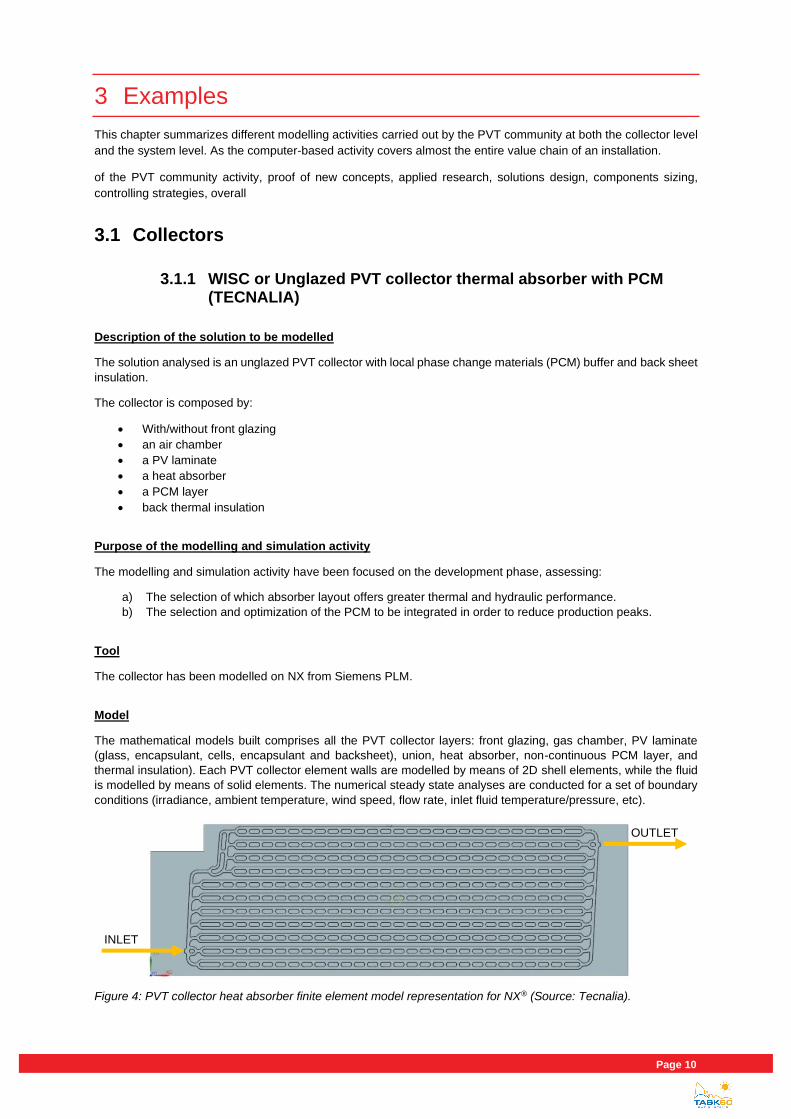
The mathematical models built comprises all the PVT collector layers: front glazing, gas chamber, PV laminate
(glass, encapsulant, cells, encapsulant and backsheet), union, heat absorber, non-continuous PCM layer, and
thermal insulation). Each PVT collector element walls are modelled by means of 2D shell elements, while the fluid
is modelled by means of solid elements. The numerical steady state analyses are conducted for a set of boundary
conditions (irradiance, ambient temperature, wind speed, flow rate, inlet fluid temperature/pressure, etc).
Figure 4: PVT collector heat absorber finite element model representation for NX® (Source: Tecnalia).
INLET
OUTLET
Numerical simulation tools for PVT collectors and systems
Page 11
Main outputs or KPIs
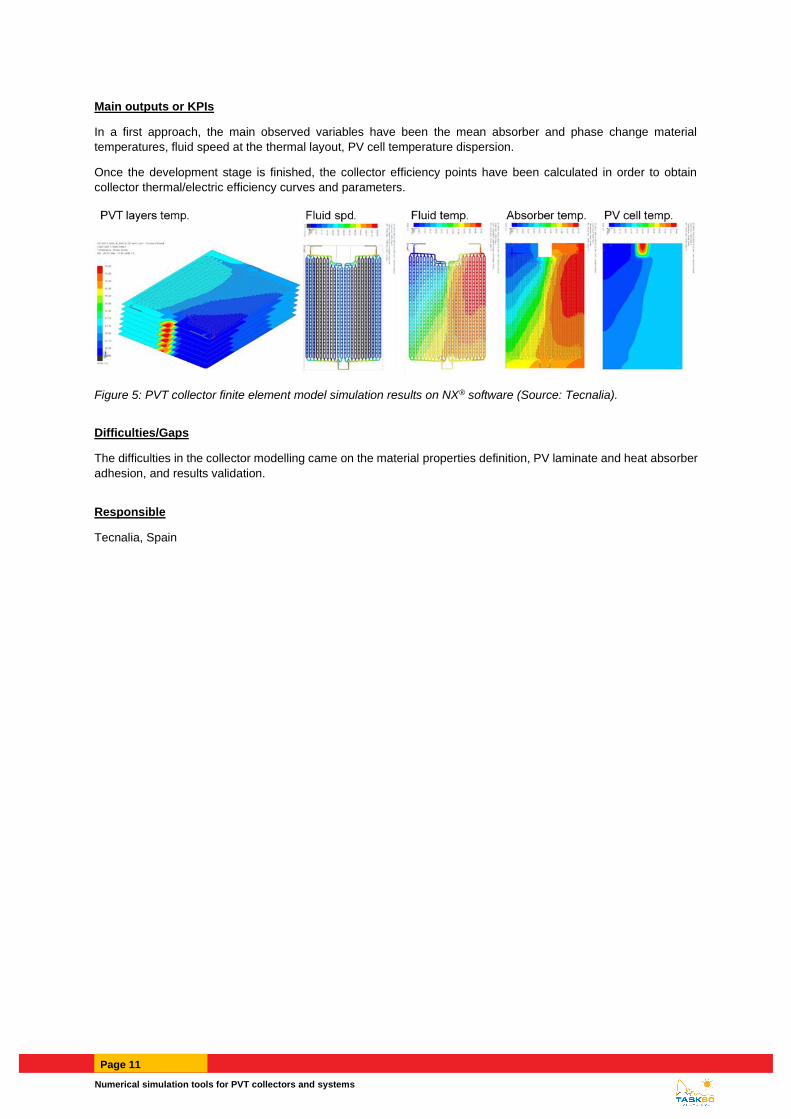
In a first approach, the main observed variables have been the mean absorber and phase change material
temperatures, fluid speed at the thermal layout, PV cell temperature dispersion.
Once the development stage is finished, the collector efficiency points have been calculated in order to obtain
collector thermal/electric efficiency curves and parameters.
Figure 5: PVT collector finite element model simulation results on NX® software (Source: Tecnalia).
Difficulties/Gaps
The difficulties in the collector modelling came on the material properties definition, PV laminate and heat absorber
adhesion, and results validation.
Responsible
Tecnalia, Spain
Page 12 RStat
3.1.2 Retrofitted PVT collector (ZHAW)
Description of the solution to be modelled
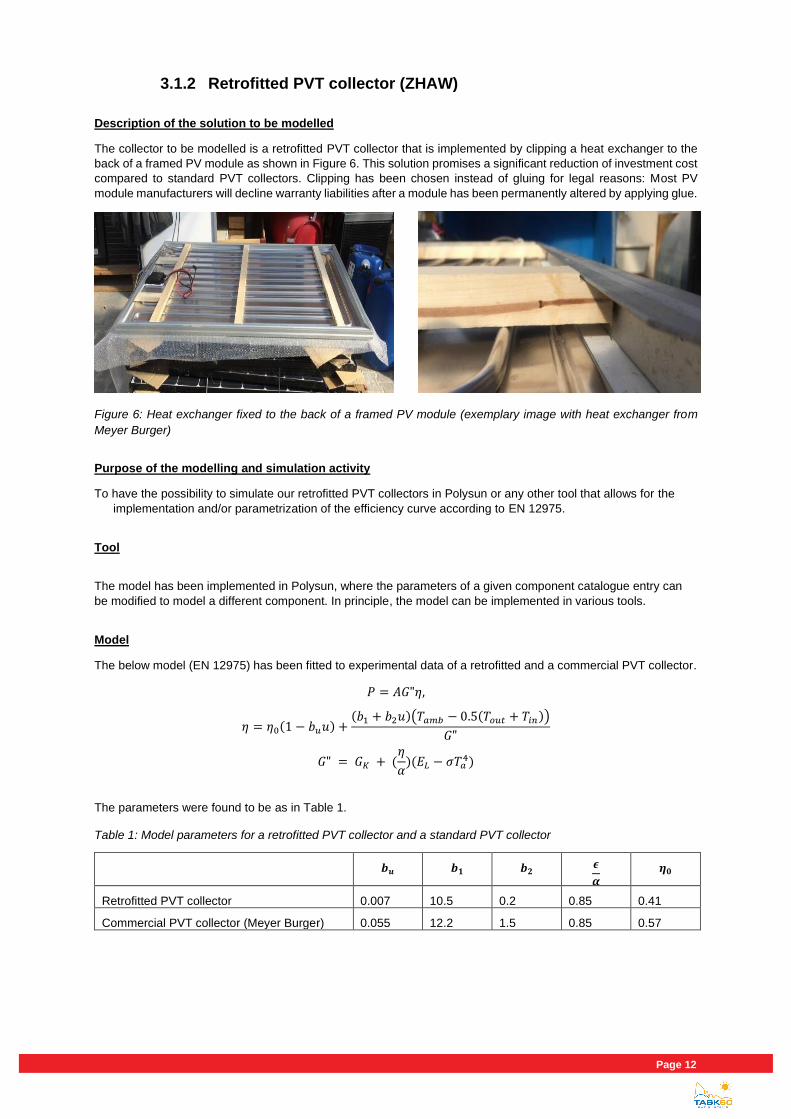
The collector to be modelled is a retrofitted PVT collector that is implemented by clipping a heat exchanger to the
back of a framed PV module as shown in Figure 6. This solution promises a significant reduction of investment cost
compared to standard PVT collectors. Clipping has been chosen instead of gluing for legal reasons: Most PV
module manufacturers will decline warranty liabilities after a module has been permanently altered by applying glue.
Figure 6: Heat exchanger fixed to the back of a framed PV module (exemplary image with heat exchanger from
Meyer Burger)
Purpose of the modelling and simulation activity
To have the possibility to simulate our retrofitted PVT collectors in Polysun or any other tool that allows for the
implementation and/or parametrization of the efficiency curve according to EN 12975.
Tool
The model has been implemented in Polysun, where the parameters of a given component catalogue entry can
be modified to model a different component. In principle, the model can be implemented in various tools.
Model
The below model (EN 12975) has been fitted to experimental data of a retrofitted and a commercial PVT collector.
𝑃 = 𝐴𝐺"𝜂,
𝜂 = 𝜂0(1 − 𝑏𝑢𝑢) +(𝑏1 + 𝑏2𝑢)(𝑇𝑎𝑚𝑏 − 0.5(𝑇𝑜𝑢𝑡 + 𝑇𝑖𝑛))
𝐺"
𝐺" = 𝐺𝐾 + (𝜂
𝛼)(𝐸𝐿 − 𝜎𝑇𝑎
4)
The parameters were found to be as in Table 1.
Table 1: Model parameters for a retrofitted PVT collector and a standard PVT collector
𝒃𝒖 𝒃𝟏 𝒃𝟐 𝝐
𝜶 𝜼𝟎
Retrofitted PVT collector 0.007 10.5 0.2 0.85 0.41
Commercial PVT collector (Meyer Burger) 0.055 12.2 1.5 0.85 0.57

Numerical simulation tools for PVT collectors and systems
Page 13
Main outputs or KPIs
The model output is the well-known efficiency curve that allows for determining the thermal power and the return
temperature of the collector.
Difficulties/Gaps
The experimental data for parameter determination extends over a time span of only 2.5 months in spring and
early summer. A longer measurement campaign, that includes winter months, could influence the parameters.
Furthermore, the model does not include thermal inertia of the collector, e.g. steep gradients of input quantities
(such as fast changes of irradiation) lead to peaks in return temperature that were not observed experimentally.
Responsible
ZHAW Zurich University of Applied Sciences, Switzerland
Page 14 RStat
3.1.3 Glazed PVT absorber-exchanger designs analysis (UNIZAR)
Description of the solution to be modelled
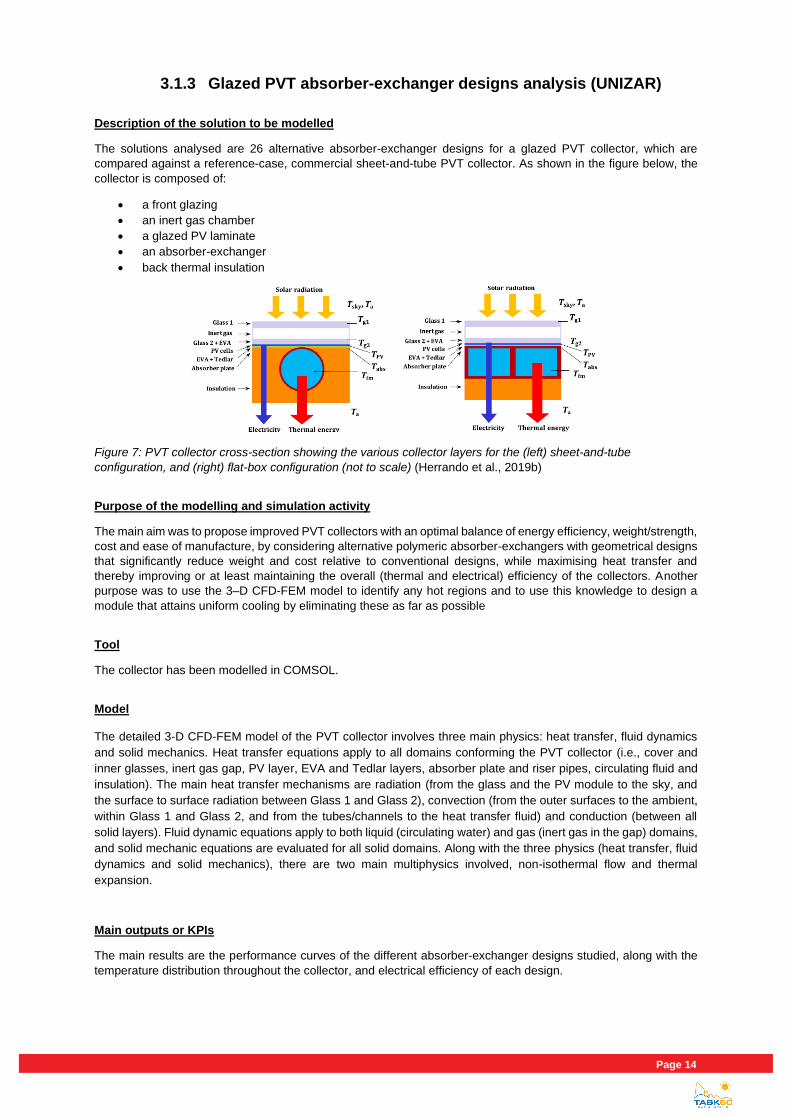
The solutions analysed are 26 alternative absorber-exchanger designs for a glazed PVT collector, which are
compared against a reference-case, commercial sheet-and-tube PVT collector. As shown in the figure below, the
collector is composed of:
• a front glazing
• an inert gas chamber
• a glazed PV laminate
• an absorber-exchanger
• back thermal insulation
Figure 7: PVT collector cross-section showing the various collector layers for the (left) sheet-and-tube
configuration, and (right) flat-box configuration (not to scale) (Herrando et al., 2019b)
Purpose of the modelling and simulation activity
The main aim was to propose improved PVT collectors with an optimal balance of energy efficiency, weight/strength,
cost and ease of manufacture, by considering alternative polymeric absorber-exchangers with geometrical designs
that significantly reduce weight and cost relative to conventional designs, while maximising heat transfer and
thereby improving or at least maintaining the overall (thermal and electrical) efficiency of the collectors. Another
purpose was to use the 3–D CFD-FEM model to identify any hot regions and to use this knowledge to design a
module that attains uniform cooling by eliminating these as far as possible
Tool
The collector has been modelled in COMSOL.
Model
The detailed 3-D CFD-FEM model of the PVT collector involves three main physics: heat transfer, fluid dynamics
and solid mechanics. Heat transfer equations apply to all domains conforming the PVT collector (i.e., cover and
inner glasses, inert gas gap, PV layer, EVA and Tedlar layers, absorber plate and riser pipes, circulating fluid and
insulation). The main heat transfer mechanisms are radiation (from the glass and the PV module to the sky, and
the surface to surface radiation between Glass 1 and Glass 2), convection (from the outer surfaces to the ambient,
within Glass 1 and Glass 2, and from the tubes/channels to the heat transfer fluid) and conduction (between all
solid layers). Fluid dynamic equations apply to both liquid (circulating water) and gas (inert gas in the gap) domains,
and solid mechanic equations are evaluated for all solid domains. Along with the three physics (heat transfer, fluid
dynamics and solid mechanics), there are two main multiphysics involved, non-isothermal flow and thermal
expansion.
Main outputs or KPIs
The main results are the performance curves of the different absorber-exchanger designs studied, along with the
temperature distribution throughout the collector, and electrical efficiency of each design.
Numerical simulation tools for PVT collectors and systems
Page 15
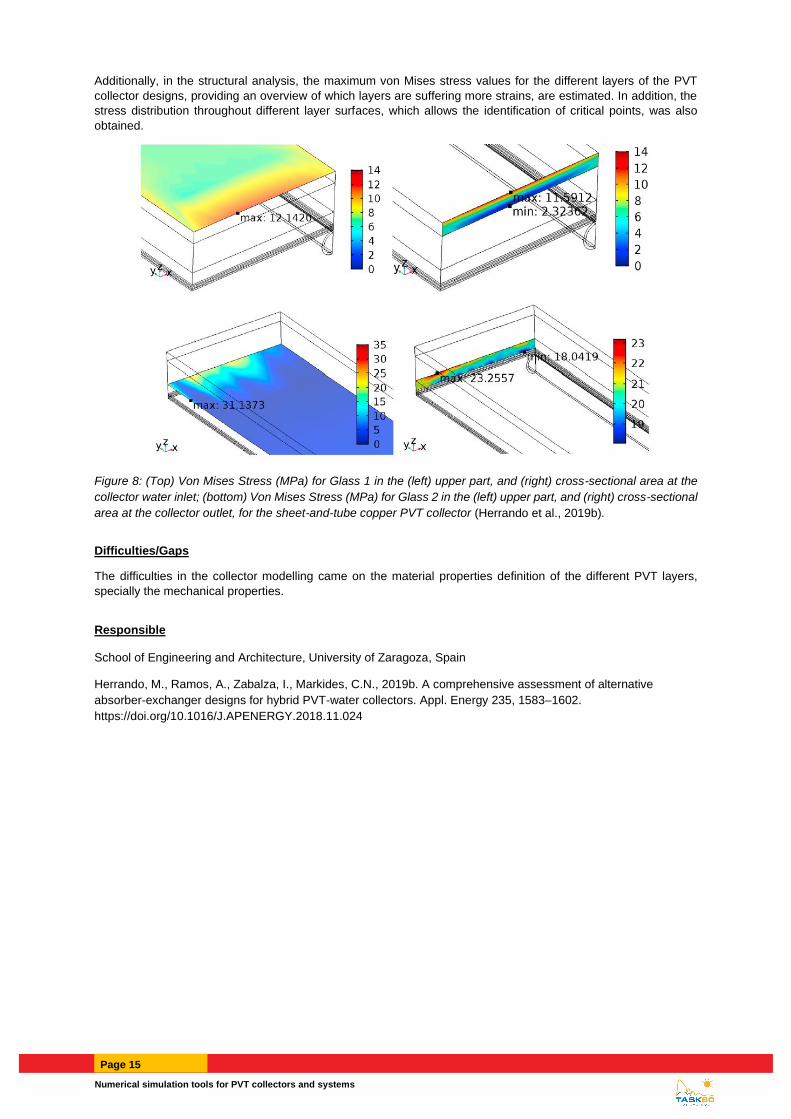
Additionally, in the structural analysis, the maximum von Mises stress values for the different layers of the PVT
collector designs, providing an overview of which layers are suffering more strains, are estimated. In addition, the
stress distribution throughout different layer surfaces, which allows the identification of critical points, was also
obtained.
Figure 8: (Top) Von Mises Stress (MPa) for Glass 1 in the (left) upper part, and (right) cross-sectional area at the
collector water inlet; (bottom) Von Mises Stress (MPa) for Glass 2 in the (left) upper part, and (right) cross-sectional
area at the collector outlet, for the sheet-and-tube copper PVT collector (Herrando et al., 2019b).
Difficulties/Gaps
The difficulties in the collector modelling came on the material properties definition of the different PVT layers,
specially the mechanical properties.
Responsible
School of Engineering and Architecture, University of Zaragoza, Spain
Herrando, M., Ramos, A., Zabalza, I., Markides, C.N., 2019b. A comprehensive assessment of alternative
absorber-exchanger designs for hybrid PVT-water collectors. Appl. Energy 235, 1583–1602.
https://doi.org/10.1016/J.APENERGY.2018.11.024
Page 16 RStat
3.1.4 Sensitivity analysis of key parameters of a concentrated PVT (UD)
Description of the solution to be modelled
The reference PVT technology is a concentrated type (named X10). The X10 PVT consists of a cylinder-parabolic
reflecting mirror, made by aluminium, that concentrates 17.8 times the solar light onto the receiver. Inside the
receiver, the PV component is composed of 166 mono-crystalline solar cells in series with the size of each cell at
32×110 mm. The thermal component is structured in triangular with a double aluminium section bar substrate. Each
bar is built in with a fluid channel for counter current flow. On the two receiver sides, opposite to the parabolic
concentrator, there are laser groove buried contact solar cells on the surface; whereas the top side of the receiver
is covered with a thermal absorber. The whole PVT concentrator has a gross area of 10.91 m2 and an aperture
area of 10.37 m2. The tracking of the sun is based on special electrical custom-designed high-quality linear actuator,
which is carried out by rotating the structure around an axis oriented in the east–west direction.
Purpose of the modelling and simulation activity
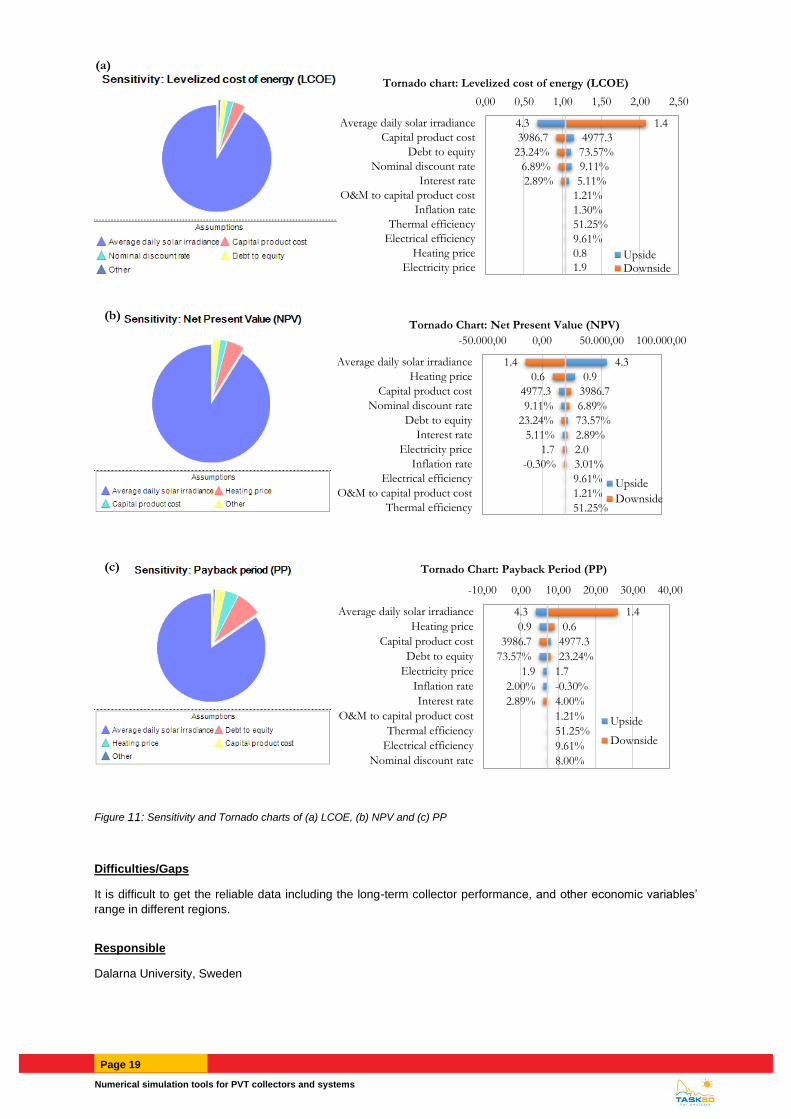
A sensitivity analysis was conducted to assess the sensitivity of the variations in input variables to the evaluation
metrics. In this model, 11 essential input variables, i.e. average daily solar irradiance, electrical/thermal efficiency,
prices of electricity/heating, operation & management (OM) cost, PVT capital cost, debt to equity ratio, interest rate,
discount rate, and inflation rate, are considered, while the economic evaluation metrics, such as levelized cost of
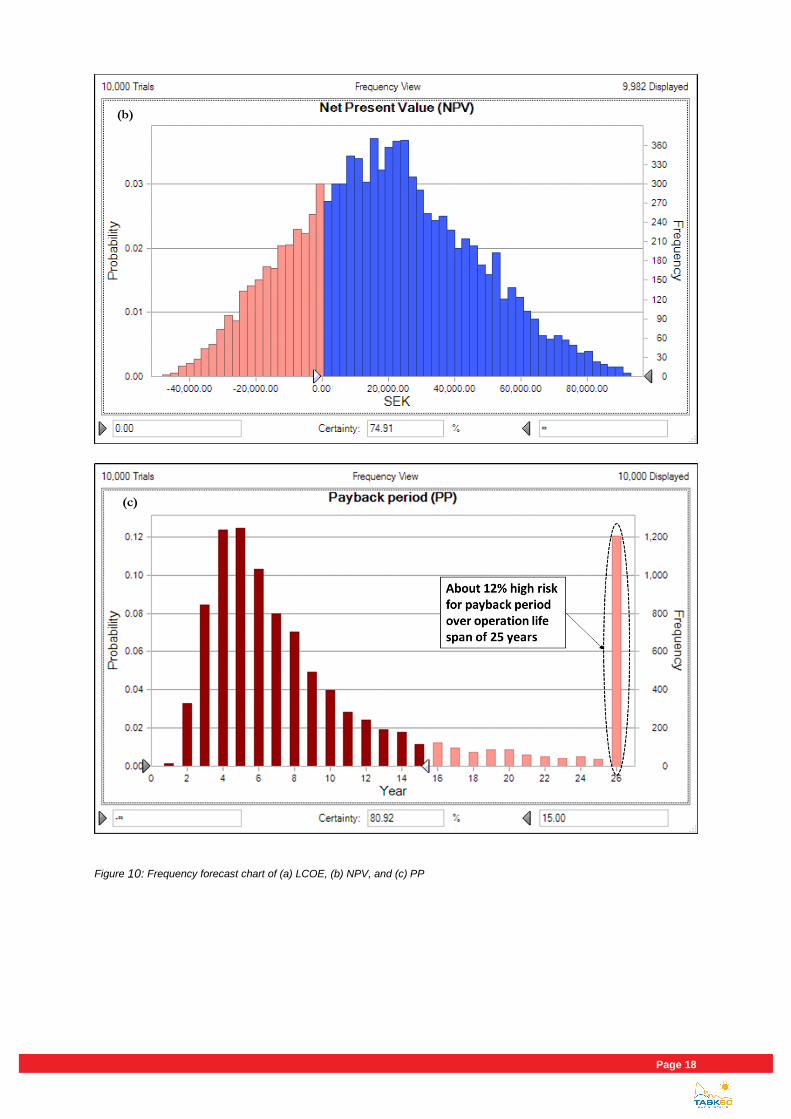
energy (LCOE), net present value (NPV), and payback period (PP), are primarily assessed.
Tool
A Monte Carlo analytical model for techno-economic analysis of a PVT concentrator is developed upon Crystal Ball
in MS Excel environment9, which is a leading spreadsheet-based application for predictive modelling, forecasting,
simulation, and optimization.
Model
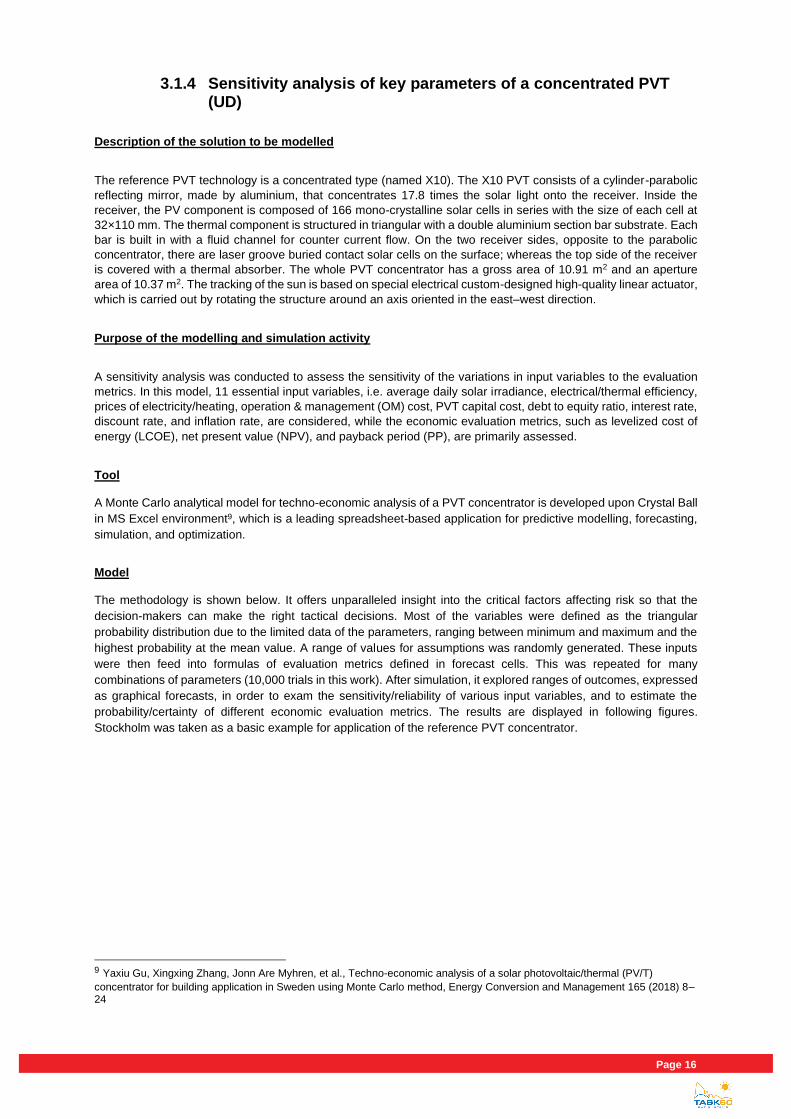
The methodology is shown below. It offers unparalleled insight into the critical factors affecting risk so that the
decision-makers can make the right tactical decisions. Most of the variables were defined as the triangular
probability distribution due to the limited data of the parameters, ranging between minimum and maximum and the
highest probability at the mean value. A range of values for assumptions was randomly generated. These inputs
were then feed into formulas of evaluation metrics defined in forecast cells. This was repeated for many
combinations of parameters (10,000 trials in this work). After simulation, it explored ranges of outcomes, expressed
as graphical forecasts, in order to exam the sensitivity/reliability of various input variables, and to estimate the
probability/certainty of different economic evaluation metrics. The results are displayed in following figures.
Stockholm was taken as a basic example for application of the reference PVT concentrator.
9 Yaxiu Gu, Xingxing Zhang, Jonn Are Myhren, et al., Techno-economic analysis of a solar photovoltaic/thermal (PV/T)
concentrator for building application in Sweden using Monte Carlo method, Energy Conversion and Management 165 (2018) 8–24
Numerical simulation tools for PVT collectors and systems
Page 17
Figure 9: Flow chart of techno-economic analysis method in MS Excel environment
(a)
Page 18 RStat
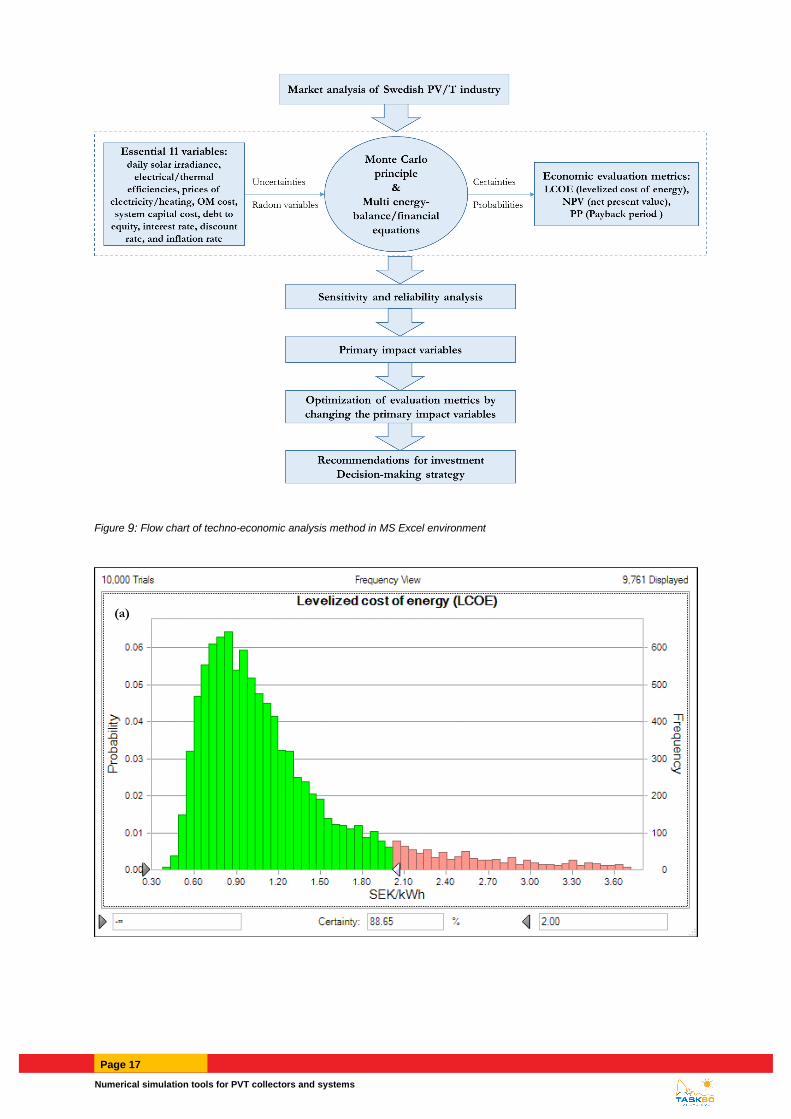
Figure 10: Frequency forecast chart of (a) LCOE, (b) NPV, and (c) PP
(b)
(c)
Numerical simulation tools for PVT collectors and systems
Page 19
Figure 11: Sensitivity and Tornado charts of (a) LCOE, (b) NPV and (c) PP
Difficulties/Gaps
It is difficult to get the reliable data including the long-term collector performance, and other economic variables’
range in different regions.
Responsible
Dalarna University, Sweden
4.3
4977.3
73.57%
9.11%
5.11%
1.4
3986.7
23.24%
6.89%
2.89%
1.21%
1.30%
51.25%
9.61%
0.8
1.9
0,00 0,50 1,00 1,50 2,00 2,50
Average daily solar irradiance
Capital product cost
Debt to equity
Nominal discount rate
Interest rate
O&M to capital product cost
Inflation rate
Thermal efficiency
Electrical efficiency
Heating price
Electricity price
Tornado chart: Levelized cost of energy (LCOE)
UpsideDownside
4.3
0.9
4977.3
9.11%
73.57%
5.11%
2.0
3.01%
1.4
0.6
3986.7
6.89%
23.24%
2.89%
1.7
-0.30%
9.61%
1.21%
51.25%
-50.000,00 0,00 50.000,00 100.000,00
Average daily solar irradiance
Heating price
Capital product cost
Nominal discount rate
Debt to equity
Interest rate
Electricity price
Inflation rate
Electrical efficiency
O&M to capital product cost
Thermal efficiency
Tornado Chart: Net Present Value (NPV)
Upside
Downside
4.3
0.9
4977.3
73.57%
1.9
2.00%
4.00%
1.4
0.6
3986.7
23.24%
1.7
-0.30%
2.89%
1.21%
51.25%
9.61%
8.00%
-10,00 0,00 10,00 20,00 30,00 40,00
Average daily solar irradiance
Heating price
Capital product cost
Debt to equity
Electricity price
Inflation rate
Interest rate
O&M to capital product cost
Thermal efficiency
Electrical efficiency
Nominal discount rate
Tornado Chart: Payback Period (PP)
Upside
Downside
(c)
(b)
(a)
Page 20 RStat
3.1.5 Uncovered roll-bond PVT analysis (UNICT)
Description of the solution to be modelled
The model describes a PVT collector constituted by uncovered roll-bond modules. Moreover, the hydronic circuit,
the thermal solar tank and the energy demand are modelled.
In order to validate the mathematical model, a comparison between the measured variables (environmental,
electrical and thermal) coming from the monitoring system of the PVT plant installed at the University of Catania
(Tina et al., 2016) and the output of the numerical model was carried out.
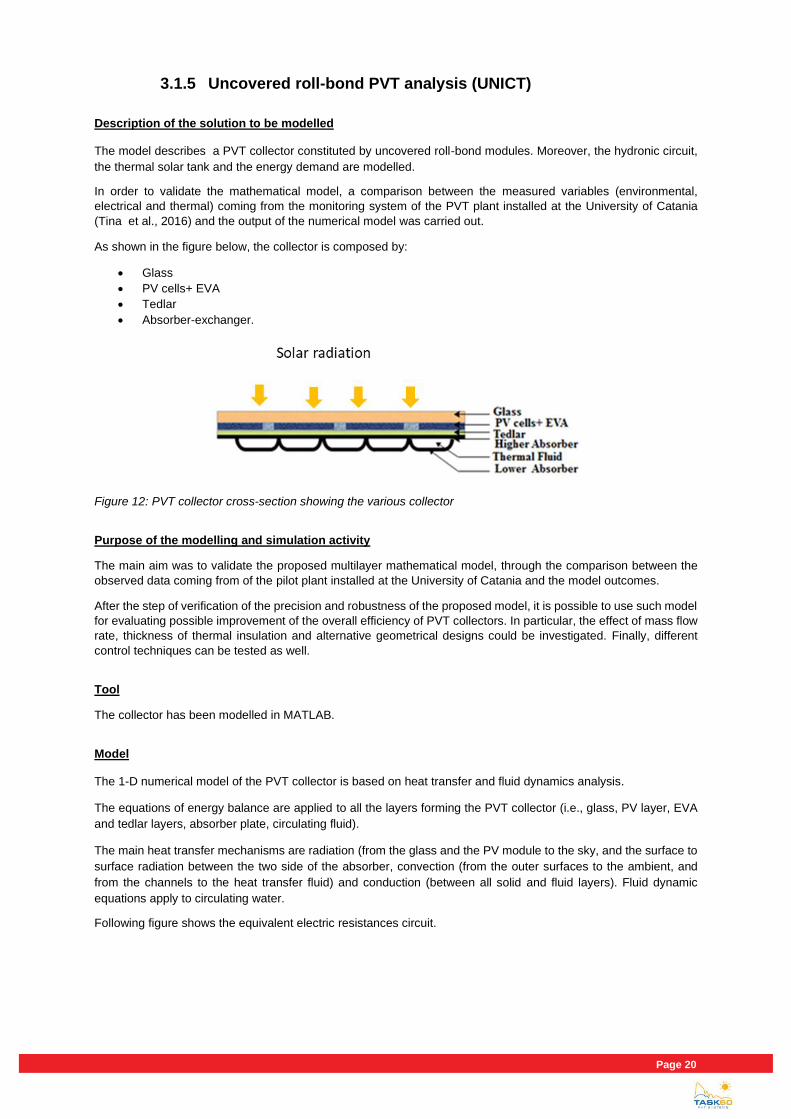
As shown in the figure below, the collector is composed by:
• Glass
• PV cells+ EVA
• Tedlar
• Absorber-exchanger.
Figure 12: PVT collector cross-section showing the various collector
Purpose of the modelling and simulation activity
The main aim was to validate the proposed multilayer mathematical model, through the comparison between the
observed data coming from of the pilot plant installed at the University of Catania and the model outcomes.
After the step of verification of the precision and robustness of the proposed model, it is possible to use such model
for evaluating possible improvement of the overall efficiency of PVT collectors. In particular, the effect of mass flow
rate, thickness of thermal insulation and alternative geometrical designs could be investigated. Finally, different
control techniques can be tested as well.
Tool
The collector has been modelled in MATLAB.
Model
The 1-D numerical model of the PVT collector is based on heat transfer and fluid dynamics analysis.
The equations of energy balance are applied to all the layers forming the PVT collector (i.e., glass, PV layer, EVA
and tedlar layers, absorber plate, circulating fluid).
The main heat transfer mechanisms are radiation (from the glass and the PV module to the sky, and the surface to
surface radiation between the two side of the absorber, convection (from the outer surfaces to the ambient, and
from the channels to the heat transfer fluid) and conduction (between all solid and fluid layers). Fluid dynamic
equations apply to circulating water.
Following figure shows the equivalent electric resistances circuit.
Numerical simulation tools for PVT collectors and systems
Page 21
Figure 13: equivalent electric resistances circuit.
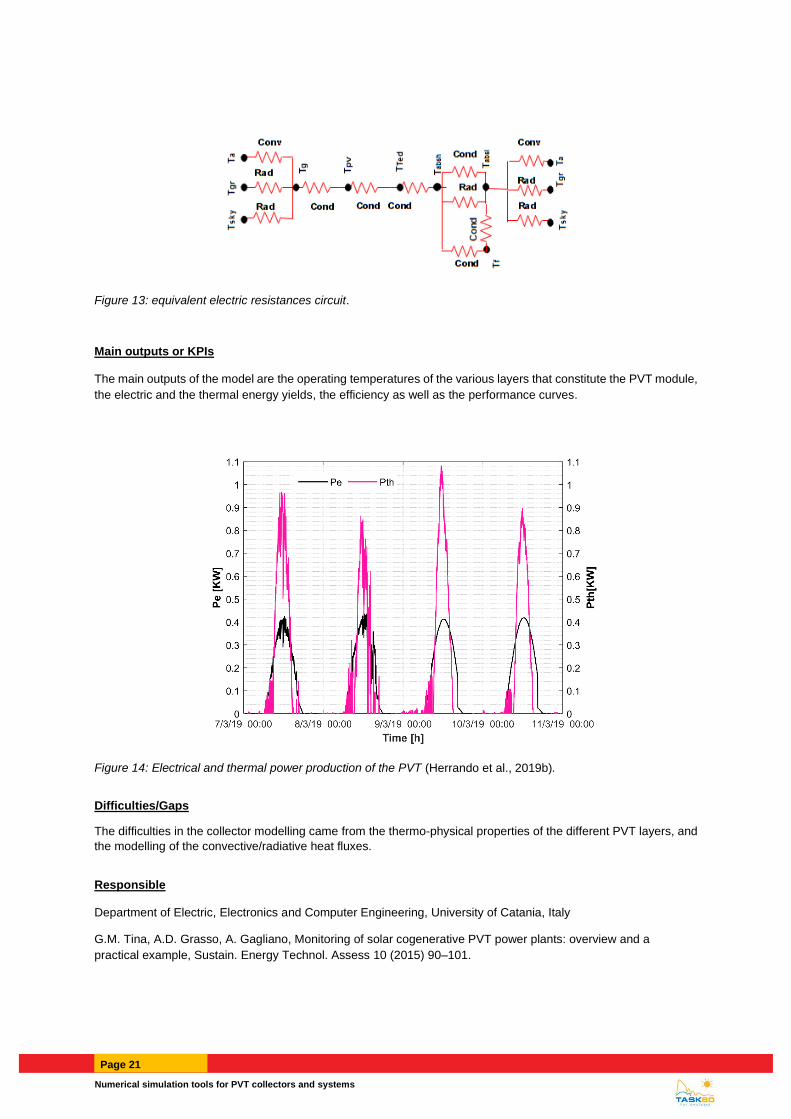
Main outputs or KPIs
The main outputs of the model are the operating temperatures of the various layers that constitute the PVT module,
the electric and the thermal energy yields, the efficiency as well as the performance curves.
Figure 14: Electrical and thermal power production of the PVT (Herrando et al., 2019b).
Difficulties/Gaps
The difficulties in the collector modelling came from the thermo-physical properties of the different PVT layers, and
the modelling of the convective/radiative heat fluxes.
Responsible
Department of Electric, Electronics and Computer Engineering, University of Catania, Italy
G.M. Tina, A.D. Grasso, A. Gagliano, Monitoring of solar cogenerative PVT power plants: overview and a
practical example, Sustain. Energy Technol. Assess 10 (2015) 90–101.
Page 22 RStat
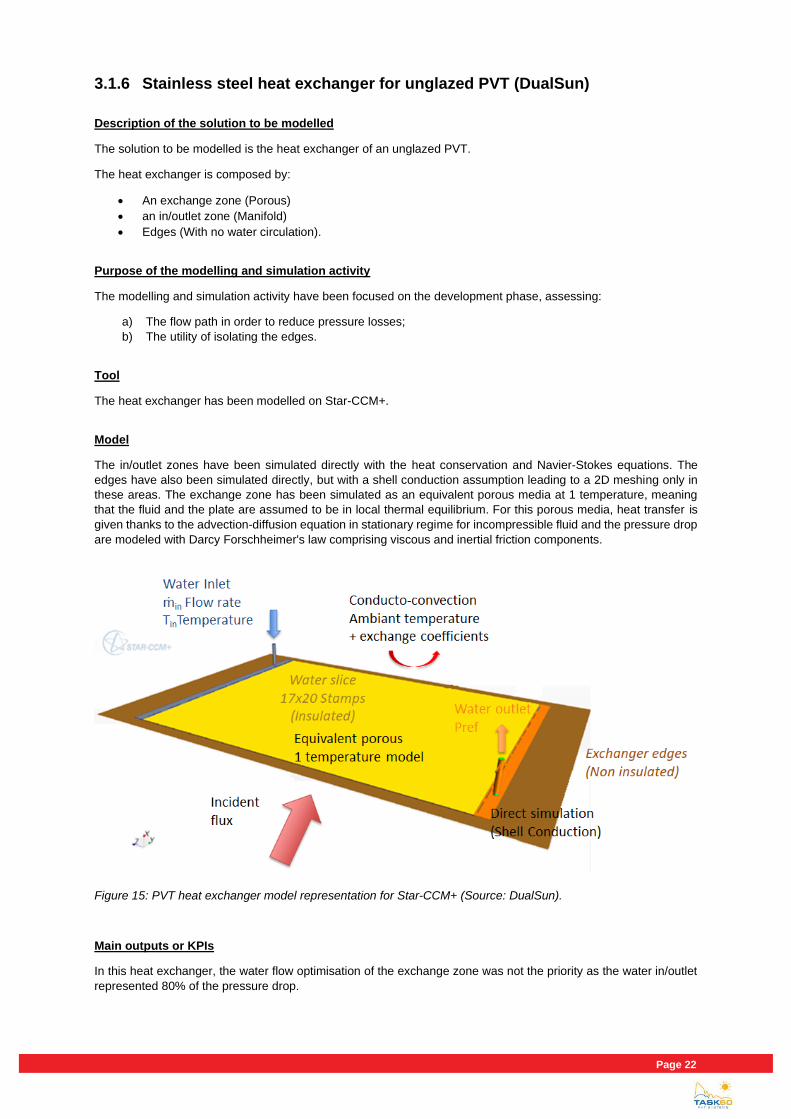
3.1.6 Stainless steel heat exchanger for unglazed PVT (DualSun)
Description of the solution to be modelled
The solution to be modelled is the heat exchanger of an unglazed PVT.
The heat exchanger is composed by:
• An exchange zone (Porous)
• an in/outlet zone (Manifold)
• Edges (With no water circulation).
Purpose of the modelling and simulation activity
The modelling and simulation activity have been focused on the development phase, assessing:
a) The flow path in order to reduce pressure losses;
b) The utility of isolating the edges.
Tool
The heat exchanger has been modelled on Star-CCM+.
Model
The in/outlet zones have been simulated directly with the heat conservation and Navier-Stokes equations. The
edges have also been simulated directly, but with a shell conduction assumption leading to a 2D meshing only in
these areas. The exchange zone has been simulated as an equivalent porous media at 1 temperature, meaning
that the fluid and the plate are assumed to be in local thermal equilibrium. For this porous media, heat transfer is
given thanks to the advection-diffusion equation in stationary regime for incompressible fluid and the pressure drop
are modeled with Darcy Forschheimer's law comprising viscous and inertial friction components.
Figure 15: PVT heat exchanger model representation for Star-CCM+ (Source: DualSun).
Main outputs or KPIs
In this heat exchanger, the water flow optimisation of the exchange zone was not the priority as the water in/outlet
represented 80% of the pressure drop.
Numerical simulation tools for PVT collectors and systems
Page 23
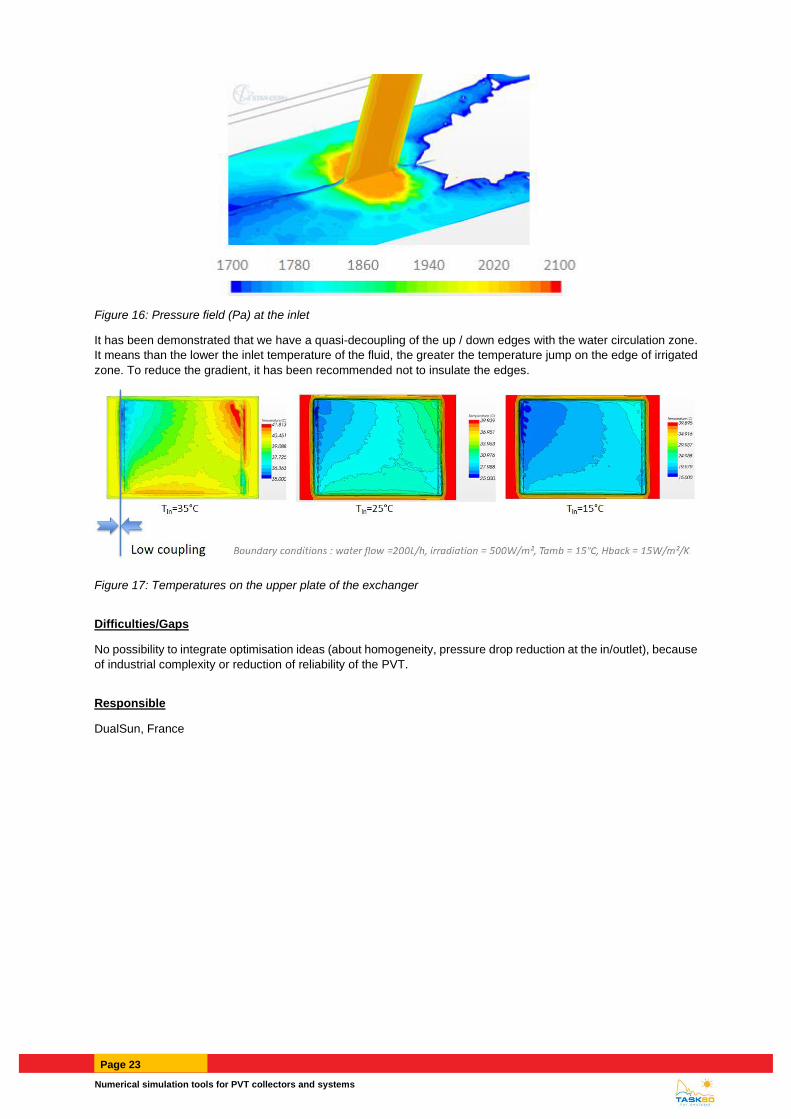
Figure 16: Pressure field (Pa) at the inlet
It has been demonstrated that we have a quasi-decoupling of the up / down edges with the water circulation zone.
It means than the lower the inlet temperature of the fluid, the greater the temperature jump on the edge of irrigated
zone. To reduce the gradient, it has been recommended not to insulate the edges.
Figure 17: Temperatures on the upper plate of the exchanger
Difficulties/Gaps
No possibility to integrate optimisation ideas (about homogeneity, pressure drop reduction at the in/outlet), because
of industrial complexity or reduction of reliability of the PVT.
Responsible
DualSun, France
Page 24 RStat
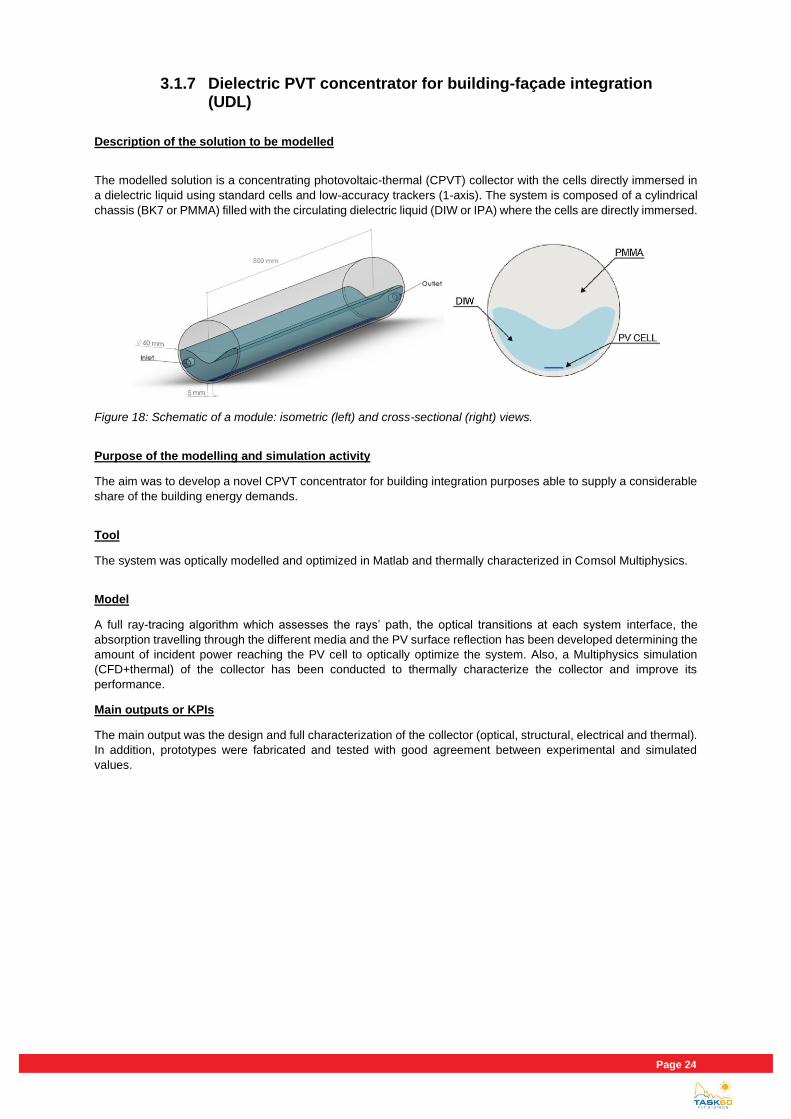
3.1.7 Dielectric PVT concentrator for building-façade integration (UDL)
Description of the solution to be modelled
The modelled solution is a concentrating photovoltaic-thermal (CPVT) collector with the cells directly immersed in
a dielectric liquid using standard cells and low-accuracy trackers (1-axis). The system is composed of a cylindrical
chassis (BK7 or PMMA) filled with the circulating dielectric liquid (DIW or IPA) where the cells are directly immersed.
Figure 18: Schematic of a module: isometric (left) and cross-sectional (right) views.
Purpose of the modelling and simulation activity
The aim was to develop a novel CPVT concentrator for building integration purposes able to supply a considerable
share of the building energy demands.
Tool
The system was optically modelled and optimized in Matlab and thermally characterized in Comsol Multiphysics.
Model
A full ray-tracing algorithm which assesses the rays’ path, the optical transitions at each system interface, the
absorption travelling through the different media and the PV surface reflection has been developed determining the
amount of incident power reaching the PV cell to optically optimize the system. Also, a Multiphysics simulation
(CFD+thermal) of the collector has been conducted to thermally characterize the collector and improve its
performance.
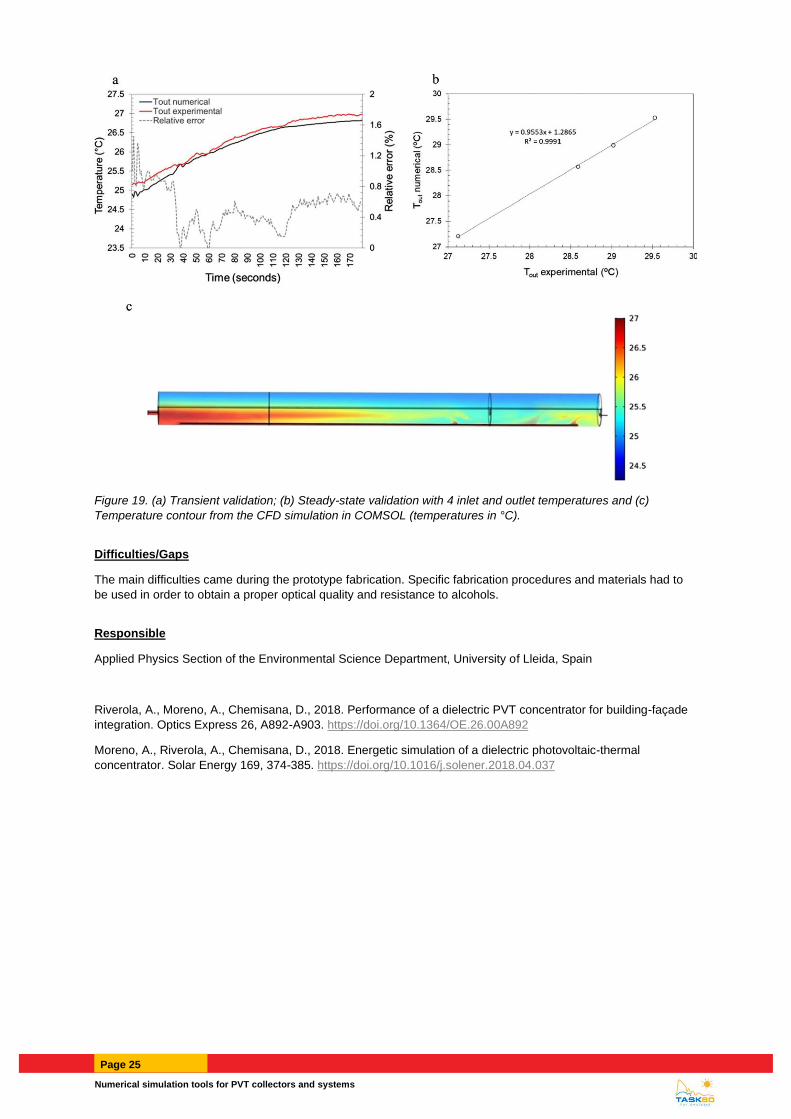
Main outputs or KPIs
The main output was the design and full characterization of the collector (optical, structural, electrical and thermal).
In addition, prototypes were fabricated and tested with good agreement between experimental and simulated
values.
Numerical simulation tools for PVT collectors and systems
Page 25
Figure 19. (a) Transient validation; (b) Steady-state validation with 4 inlet and outlet temperatures and (c)
Temperature contour from the CFD simulation in COMSOL (temperatures in °C).
Difficulties/Gaps
The main difficulties came during the prototype fabrication. Specific fabrication procedures and materials had to
be used in order to obtain a proper optical quality and resistance to alcohols.
Responsible
Applied Physics Section of the Environmental Science Department, University of Lleida, Spain
Riverola, A., Moreno, A., Chemisana, D., 2018. Performance of a dielectric PVT concentrator for building-façade
integration. Optics Express 26, A892-A903. https://doi.org/10.1364/OE.26.00A892
Moreno, A., Riverola, A., Chemisana, D., 2018. Energetic simulation of a dielectric photovoltaic-thermal
concentrator. Solar Energy 169, 374-385. https://doi.org/10.1016/j.solener.2018.04.037
Page 26 RStat
3.1.8 PVT solar collectors dynamic modelling (UDL)
Description of the solution to be modelled
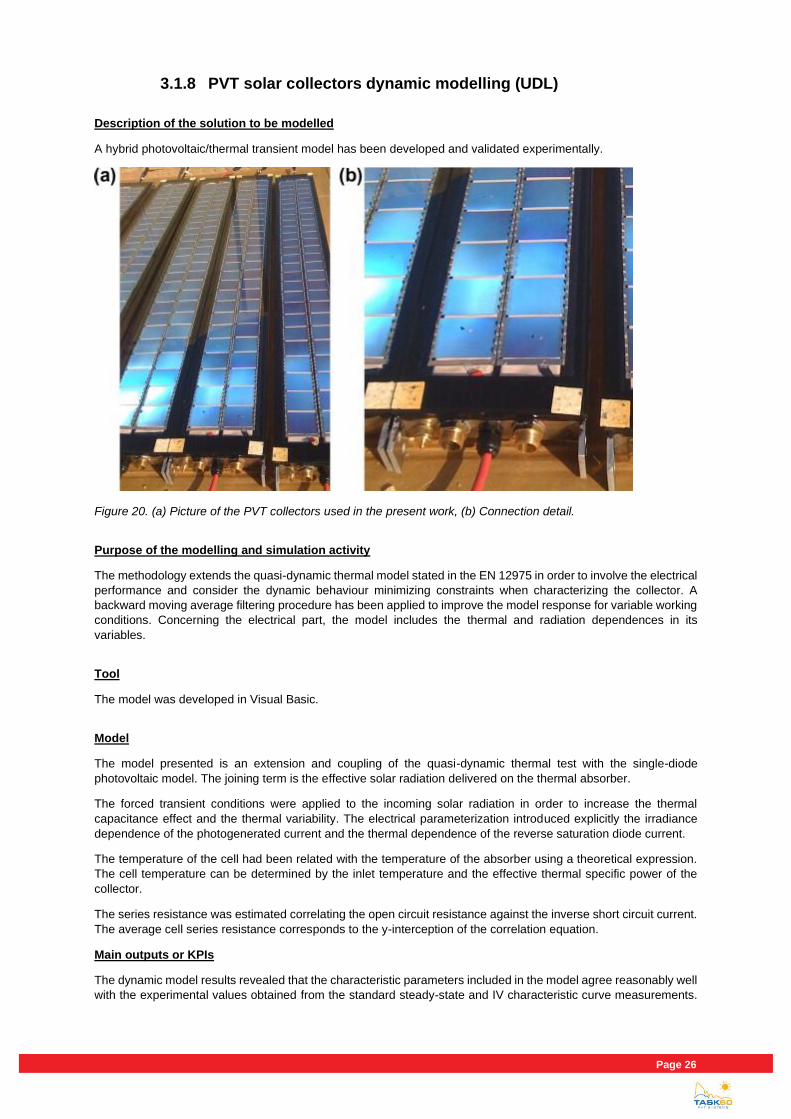
A hybrid photovoltaic/thermal transient model has been developed and validated experimentally.
Figure 20. (a) Picture of the PVT collectors used in the present work, (b) Connection detail.
Purpose of the modelling and simulation activity
The methodology extends the quasi-dynamic thermal model stated in the EN 12975 in order to involve the electrical
performance and consider the dynamic behaviour minimizing constraints when characterizing the collector. A
backward moving average filtering procedure has been applied to improve the model response for variable working
conditions. Concerning the electrical part, the model includes the thermal and radiation dependences in its
variables.
Tool
The model was developed in Visual Basic.
Model
The model presented is an extension and coupling of the quasi-dynamic thermal test with the single-diode
photovoltaic model. The joining term is the effective solar radiation delivered on the thermal absorber.
The forced transient conditions were applied to the incoming solar radiation in order to increase the thermal
capacitance effect and the thermal variability. The electrical parameterization introduced explicitly the irradiance
dependence of the photogenerated current and the thermal dependence of the reverse saturation diode current.
The temperature of the cell had been related with the temperature of the absorber using a theoretical expression.
The cell temperature can be determined by the inlet temperature and the effective thermal specific power of the
collector.
The series resistance was estimated correlating the open circuit resistance against the inverse short circuit current.
The average cell series resistance corresponds to the y-interception of the correlation equation.
Main outputs or KPIs
The dynamic model results revealed that the characteristic parameters included in the model agree reasonably well
with the experimental values obtained from the standard steady-state and IV characteristic curve measurements.
Numerical simulation tools for PVT collectors and systems
Page 27
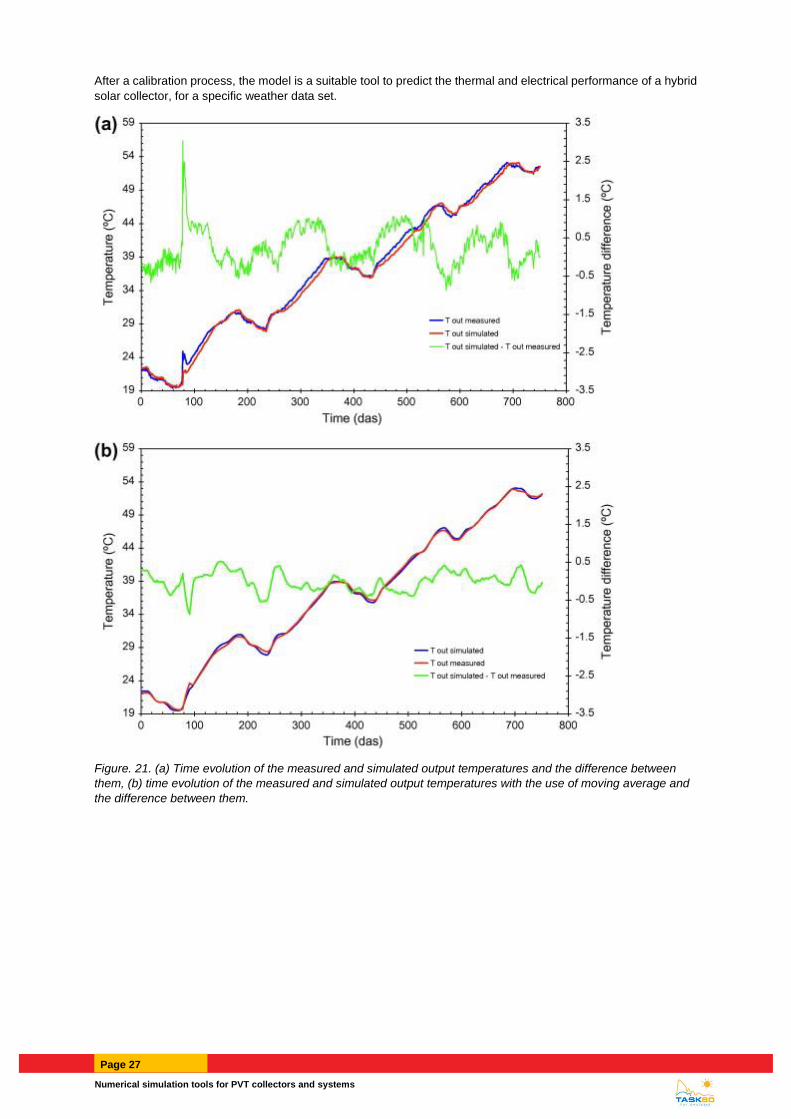
After a calibration process, the model is a suitable tool to predict the thermal and electrical performance of a hybrid
solar collector, for a specific weather data set.
Figure. 21. (a) Time evolution of the measured and simulated output temperatures and the difference between
them, (b) time evolution of the measured and simulated output temperatures with the use of moving average and
the difference between them.
Page 28 RStat
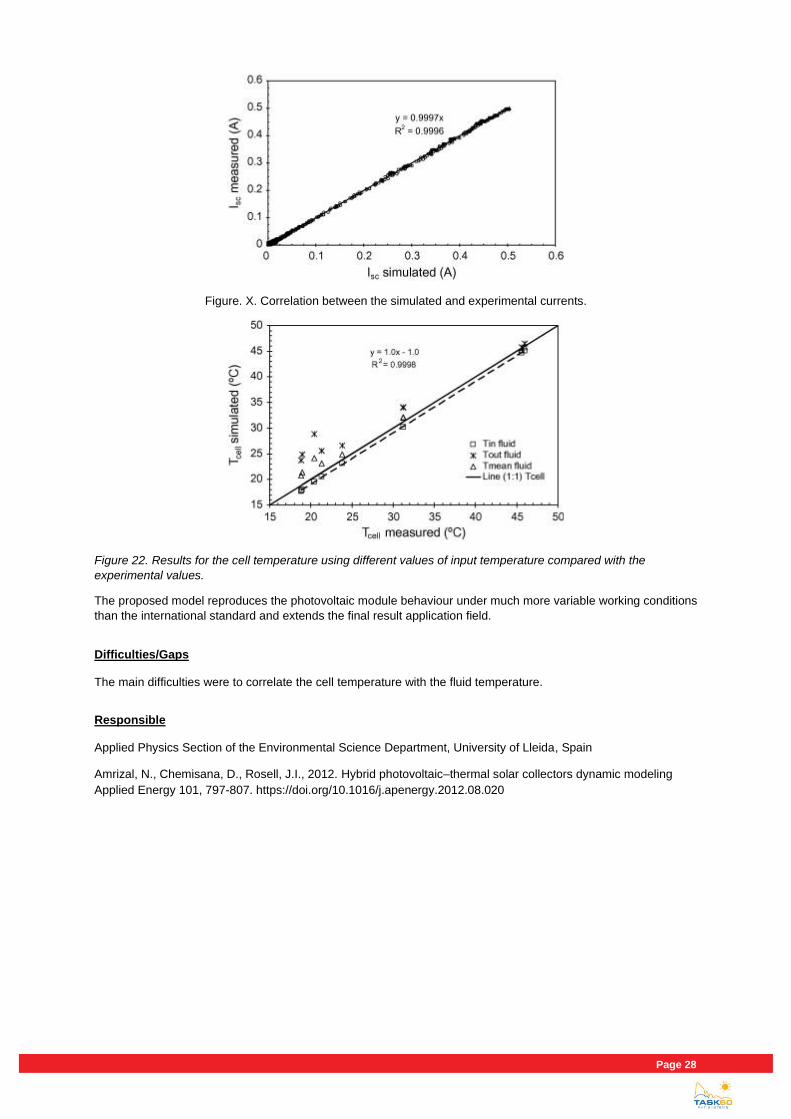
Figure. X. Correlation between the simulated and experimental currents.
Figure 22. Results for the cell temperature using different values of input temperature compared with the
experimental values.
The proposed model reproduces the photovoltaic module behaviour under much more variable working conditions
than the international standard and extends the final result application field.
Difficulties/Gaps
The main difficulties were to correlate the cell temperature with the fluid temperature.
Responsible
Applied Physics Section of the Environmental Science Department, University of Lleida, Spain
Amrizal, N., Chemisana, D., Rosell, J.I., 2012. Hybrid photovoltaic–thermal solar collectors dynamic modeling
Applied Energy 101, 797-807. https://doi.org/10.1016/j.apenergy.2012.08.020
Numerical simulation tools for PVT collectors and systems
Page 29
3.1.9 Unglazed PVT collectors’ thermal performance estimation for DHW production (UNIBO)
Description of the solution to be modelled
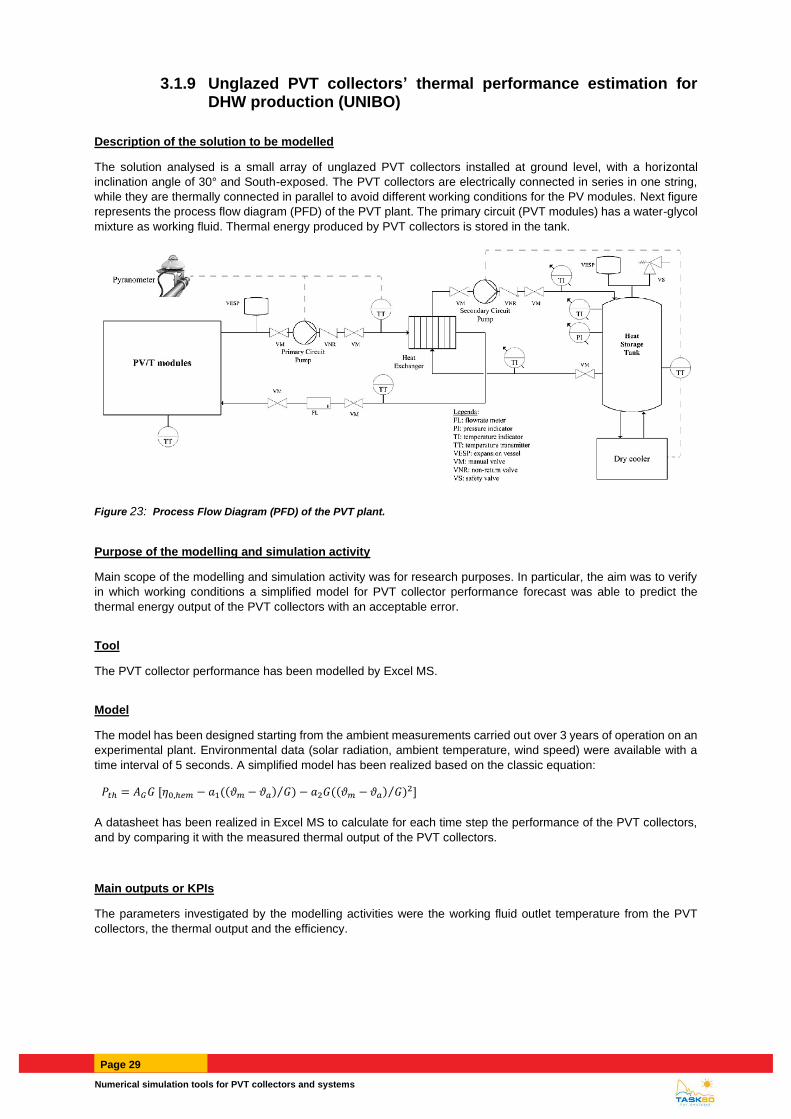
The solution analysed is a small array of unglazed PVT collectors installed at ground level, with a horizontal
inclination angle of 30° and South-exposed. The PVT collectors are electrically connected in series in one string,
while they are thermally connected in parallel to avoid different working conditions for the PV modules. Next figure
represents the process flow diagram (PFD) of the PVT plant. The primary circuit (PVT modules) has a water-glycol
mixture as working fluid. Thermal energy produced by PVT collectors is stored in the tank.
Figure 23: Process Flow Diagram (PFD) of the PVT plant.
Purpose of the modelling and simulation activity
Main scope of the modelling and simulation activity was for research purposes. In particular, the aim was to verify
in which working conditions a simplified model for PVT collector performance forecast was able to predict the
thermal energy output of the PVT collectors with an acceptable error.
Tool
The PVT collector performance has been modelled by Excel MS.
Model
The model has been designed starting from the ambient measurements carried out over 3 years of operation on an
experimental plant. Environmental data (solar radiation, ambient temperature, wind speed) were available with a
time interval of 5 seconds. A simplified model has been realized based on the classic equation:
𝑃𝑡ℎ = 𝐴𝐺𝐺 [𝜂0,ℎ𝑒𝑚 − 𝑎1((𝜗𝑚 − 𝜗𝑎) 𝐺⁄ ) − 𝑎2𝐺((𝜗𝑚 − 𝜗𝑎) 𝐺⁄ )2]
A datasheet has been realized in Excel MS to calculate for each time step the performance of the PVT collectors,
and by comparing it with the measured thermal output of the PVT collectors.
Main outputs or KPIs
The parameters investigated by the modelling activities were the working fluid outlet temperature from the PVT
collectors, the thermal output and the efficiency.

Page 30 RStat
Difficulties/Gaps
The simplified model can be applied with good approximation to predict PVT thermal yield in the medium-long term
or for installations characterized by daily stable environmental conditions, since the presence of daily unstable
conditions increases model errors.
Responsible
Prof. Marco Pellegrini, University of Bologna, Italy
Bianchini A., Guzzini A., Pellegrini M., Saccani C., Photovoltaic/thermal (PV/T) solar system: experimental
measurements, performance analysis and economic assessment, Renewable Energy, Vol. 111, pg. 543-555, 2017.
doi.org/10.1016/j.renene.2017.04.051
Numerical simulation tools for PVT collectors and systems
Page 31
3.1.10 PVT solar collector dynamic modelling and validation (POLIMI)
Description of the solution to be modelled
The collector analysed is an unglazed PVT solar collector that is composed of:
• a front glass
• monocrystalline PV cells (EVA + amorphous silicon cell + EVA + Tedlar)
• an aluminium plate absorber glued to the Tedlar layer through a transparent thermal adhesive
• a bended copper tube soldered to the back of the aluminium plate (sheet-and-tube configuration)
• an insulating foam layer
• a Forex frame.
Purpose of the modelling and simulation activity
The purpose of the modelling and simulation activity is to develop and validate a comprehensive tool for PVT
collector simulation with two goals:
1. Forecasting the electrical and thermal energy production on a short-term (hours), mid-term (days) or long-
term (year) basis.
2. Optimizing the PVT layout, materials and cost with particular focus on the shape and dimensions of the
water circuit.
Tool
The PVT model is developed in Matlab® environment.
Model
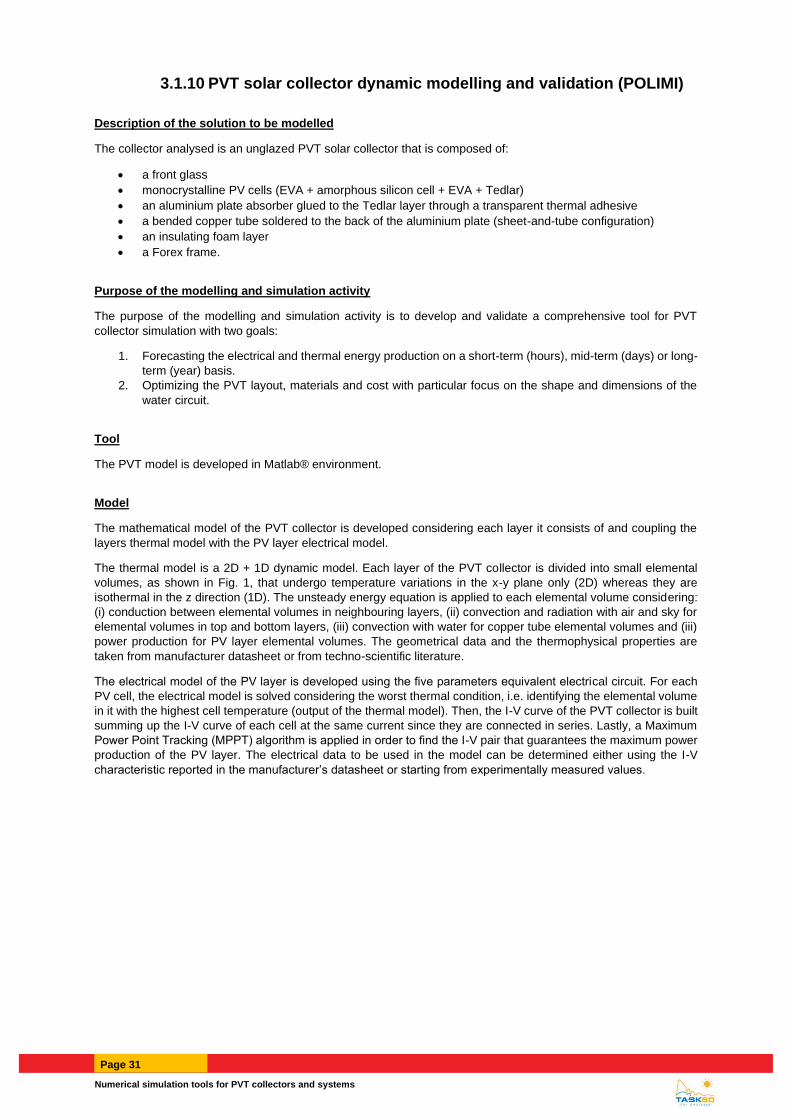
The mathematical model of the PVT collector is developed considering each layer it consists of and coupling the
layers thermal model with the PV layer electrical model.
The thermal model is a 2D + 1D dynamic model. Each layer of the PVT collector is divided into small elemental
volumes, as shown in Fig. 1, that undergo temperature variations in the x-y plane only (2D) whereas they are
isothermal in the z direction (1D). The unsteady energy equation is applied to each elemental volume considering:
(i) conduction between elemental volumes in neighbouring layers, (ii) convection and radiation with air and sky for
elemental volumes in top and bottom layers, (iii) convection with water for copper tube elemental volumes and (iii)
power production for PV layer elemental volumes. The geometrical data and the thermophysical properties are
taken from manufacturer datasheet or from techno-scientific literature.
The electrical model of the PV layer is developed using the five parameters equivalent electrical circuit. For each
PV cell, the electrical model is solved considering the worst thermal condition, i.e. identifying the elemental volume
in it with the highest cell temperature (output of the thermal model). Then, the I-V curve of the PVT collector is built
summing up the I-V curve of each cell at the same current since they are connected in series. Lastly, a Maximum
Power Point Tracking (MPPT) algorithm is applied in order to find the I-V pair that guarantees the maximum power
production of the PV layer. The electrical data to be used in the model can be determined either using the I-V
characteristic reported in the manufacturer’s datasheet or starting from experimentally measured values.
Page 32 RStat
.
Figure 24: Mesh of the generic layer of the PVT collector and work or heat fluxes for the energy balance (Simonetti
et al., 2018).
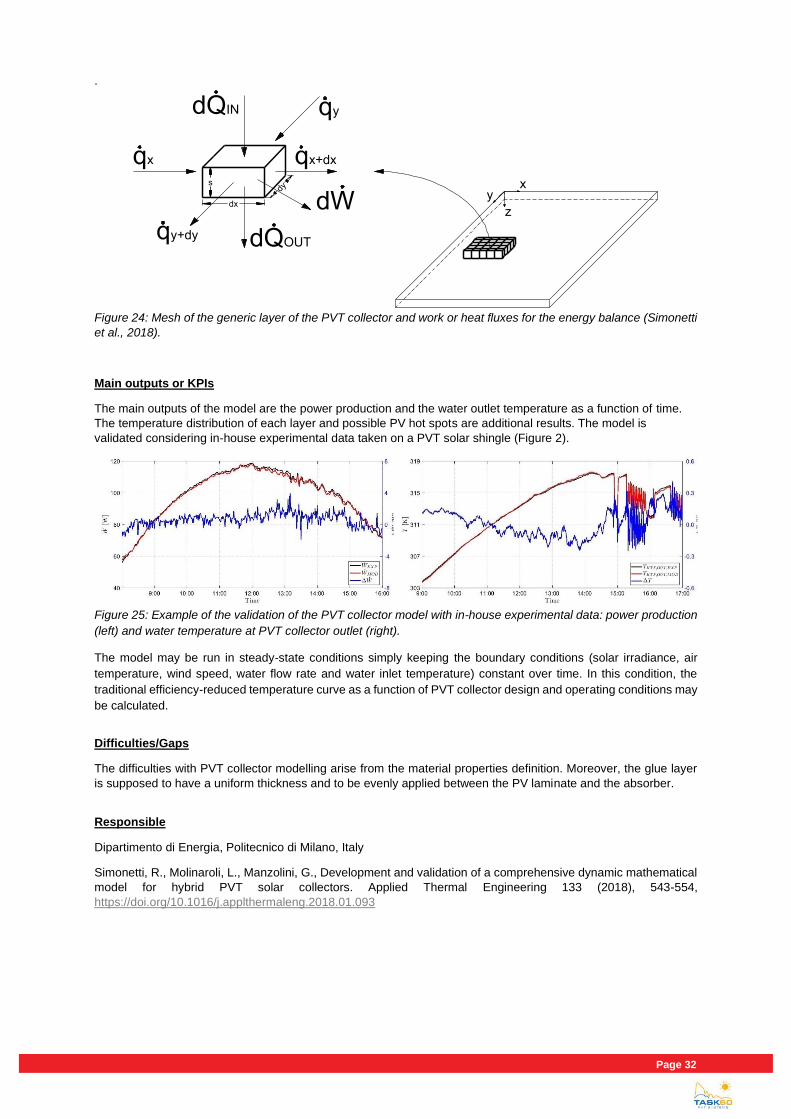
Main outputs or KPIs
The main outputs of the model are the power production and the water outlet temperature as a function of time.
The temperature distribution of each layer and possible PV hot spots are additional results. The model is
validated considering in-house experimental data taken on a PVT solar shingle (Figure 2).
Figure 25: Example of the validation of the PVT collector model with in-house experimental data: power production
(left) and water temperature at PVT collector outlet (right).
The model may be run in steady-state conditions simply keeping the boundary conditions (solar irradiance, air
temperature, wind speed, water flow rate and water inlet temperature) constant over time. In this condition, the
traditional efficiency-reduced temperature curve as a function of PVT collector design and operating conditions may
be calculated.
Difficulties/Gaps
The difficulties with PVT collector modelling arise from the material properties definition. Moreover, the glue layer
is supposed to have a uniform thickness and to be evenly applied between the PV laminate and the absorber.
Responsible
Dipartimento di Energia, Politecnico di Milano, Italy
Simonetti, R., Molinaroli, L., Manzolini, G., Development and validation of a comprehensive dynamic mathematical
model for hybrid PVT solar collectors. Applied Thermal Engineering 133 (2018), 543-554,
https://doi.org/10.1016/j.applthermaleng.2018.01.093
Numerical simulation tools for PVT collectors and systems
Page 33
3.1.11 Unglazed PVT Collector (FH Wels)
Description of the solution to be modelled
The solution is a model for a typical unglazed pvt collector with following composition.
• glazed PV-laminate
• Heat-exchanger on backside
Purpose of the modelling and simulation activity
The model was used in system simulation to compare the performance of several solutions to reduce primary
consumption in a hybrid (combined electric and thermal energy sources) HVAC system.
Tool
The model was implemented in Matlab/Simulink to be used in conjunction with Carnot-Toolbox.
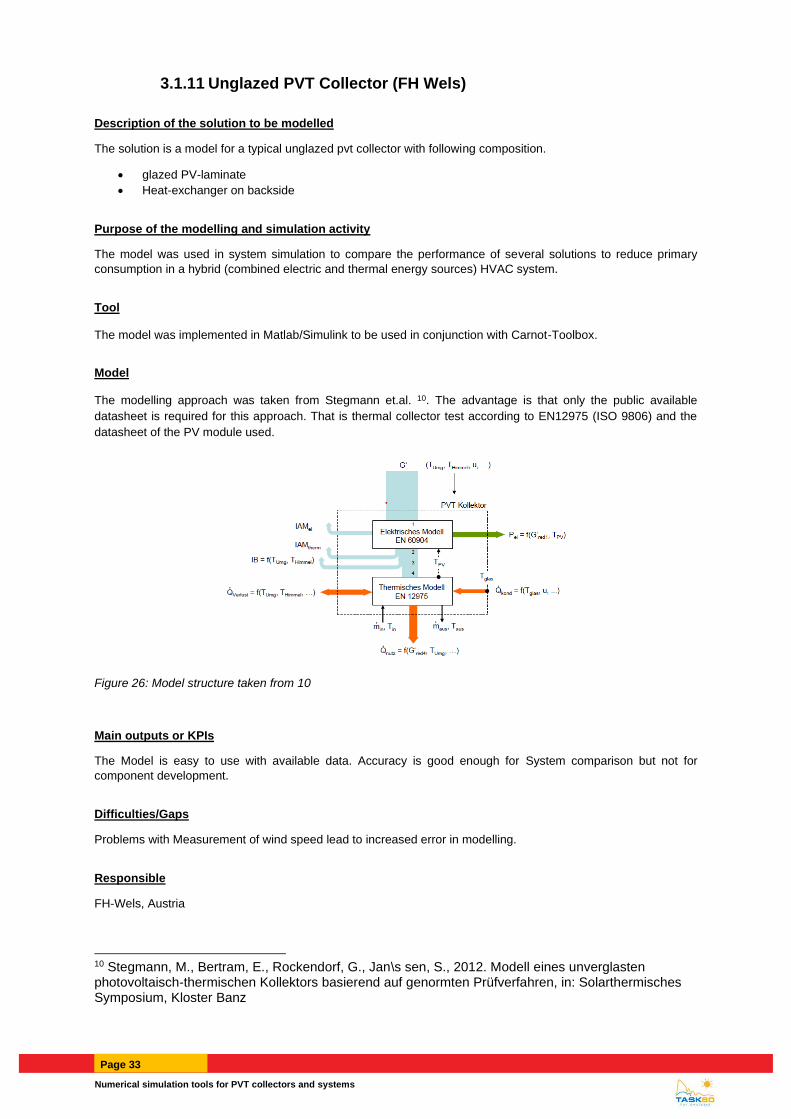
Model
The modelling approach was taken from Stegmann et.al. 10. The advantage is that only the public available
datasheet is required for this approach. That is thermal collector test according to EN12975 (ISO 9806) and the
datasheet of the PV module used.
Figure 26: Model structure taken from 10
Main outputs or KPIs
The Model is easy to use with available data. Accuracy is good enough for System comparison but not for
component development.
Difficulties/Gaps
Problems with Measurement of wind speed lead to increased error in modelling.
Responsible
FH-Wels, Austria
10 Stegmann, M., Bertram, E., Rockendorf, G., Jan\s sen, S., 2012. Modell eines unverglasten photovoltaisch-thermischen Kollektors basierend auf genormten Prüfverfahren, in: Solarthermisches Symposium, Kloster Banz
Page 34 RStat
3.1.12 Unglazed PVT Collectors (TNO/TUE)
Description of the solution to be modelled
Unglazed, or WISC, PVT collectors from different manufacturers are characterized and modelled.
Purpose of the modelling and simulation activity
The thermal and electrical performance characteristics are determined with use of an indoor solar simulator, located
at the Eindhoven University of technology. Currently, the PVT collector is located at approximately 10 centimetres
of the solar simulator surface. Consequently, there is an unknown net- long-wave – radiation gain from the solar
simulator. The experimental setup, including the PVT collector, is modelled to estimate the long-wave radiation
gain. With this information, the indoor performance of the PVT collector can be translated to the performance under
similar outdoor conditions.
Tool
The PVT collectors are modelled with MATLAB.
Model
A steady-state model is developed. For more information the reader is referred to the article of Munish Katiyar:
https://www.sciencedirect.com/science/article/abs/pii/S0038092X17305868
Main outputs or KPIs
Currently, the model is used to estimate the net long-wave radiation gain. However, it should be noted that in
previous research activities the model has been used to optimize the collector design.
Difficulties/Gaps
In short, the main difficulty is the number of unknown parameters in the model. To give an example, the model is
fitted such that the modelled performance is an agreement with the measured performance. Hereto, the internal
thermal resistances of the PVT collector need to be determined. Ideally, the interior construction of the PVT
collectors needs to be adapted. In some cases, this is not possible if the adaptations cannot be reversed. In other
cases where this has proven to be a time-consuming task.
Responsible
The measurement and modelling activities are performed in the context of the PVT inSHaPe project. In this
project, a broad consortium of partners, including the Eindhoven University of Technology (TU/e) and the Solar
Energy Application Centre (SEAC), work together to analyse, design and optimize PVT-HP system concepts.
More information can be found via the following link: https://www.seac.cc/combining-pvt-with-heat-pumps-pvt-
inshape-project-kicked-off/
Numerical simulation tools for PVT collectors and systems
Page 35
3.1.13 WISC and covered PVT collectors (Saarland University))
Description of the solution to be modelled
The model was developed to describe the thermal and electrical behavior of PVT collectors, especially WISC and
covered collectors.
Purpose of the modelling and simulation activity
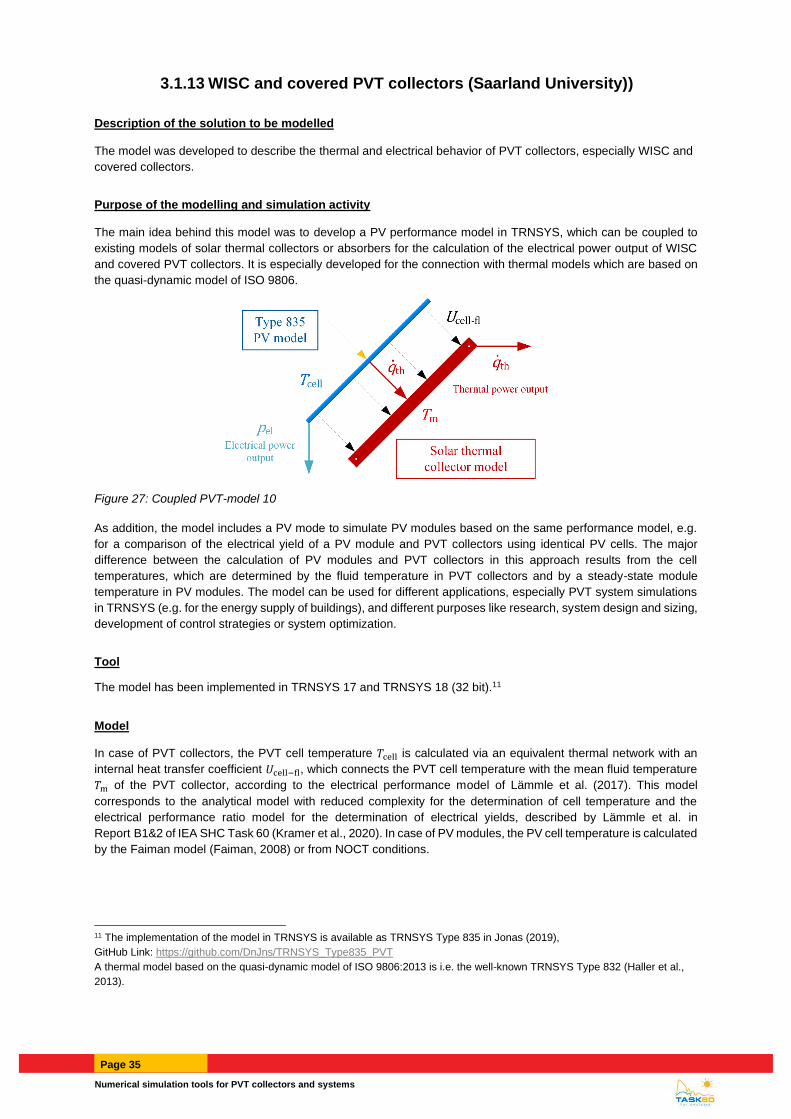
The main idea behind this model was to develop a PV performance model in TRNSYS, which can be coupled to
existing models of solar thermal collectors or absorbers for the calculation of the electrical power output of WISC
and covered PVT collectors. It is especially developed for the connection with thermal models which are based on
the quasi-dynamic model of ISO 9806.
Figure 27: Coupled PVT-model 10
As addition, the model includes a PV mode to simulate PV modules based on the same performance model, e.g.
for a comparison of the electrical yield of a PV module and PVT collectors using identical PV cells. The major
difference between the calculation of PV modules and PVT collectors in this approach results from the cell
temperatures, which are determined by the fluid temperature in PVT collectors and by a steady-state module
temperature in PV modules. The model can be used for different applications, especially PVT system simulations
in TRNSYS (e.g. for the energy supply of buildings), and different purposes like research, system design and sizing,
development of control strategies or system optimization.
Tool
The model has been implemented in TRNSYS 17 and TRNSYS 18 (32 bit).11
Model
In case of PVT collectors, the PVT cell temperature 𝑇cell is calculated via an equivalent thermal network with an
internal heat transfer coefficient 𝑈cell−fl, which connects the PVT cell temperature with the mean fluid temperature
𝑇m of the PVT collector, according to the electrical performance model of Lämmle et al. (2017). This model
corresponds to the analytical model with reduced complexity for the determination of cell temperature and the
electrical performance ratio model for the determination of electrical yields, described by Lämmle et al. in
Report B1&2 of IEA SHC Task 60 (Kramer et al., 2020). In case of PV modules, the PV cell temperature is calculated
by the Faiman model (Faiman, 2008) or from NOCT conditions.
11 The implementation of the model in TRNSYS is available as TRNSYS Type 835 in Jonas (2019),
GitHub Link: https://github.com/DnJns/TRNSYS_Type835_PVT
A thermal model based on the quasi-dynamic model of ISO 9806:2013 is i.e. the well-known TRNSYS Type 832 (Haller et al.,
2013).
Page 36 RStat
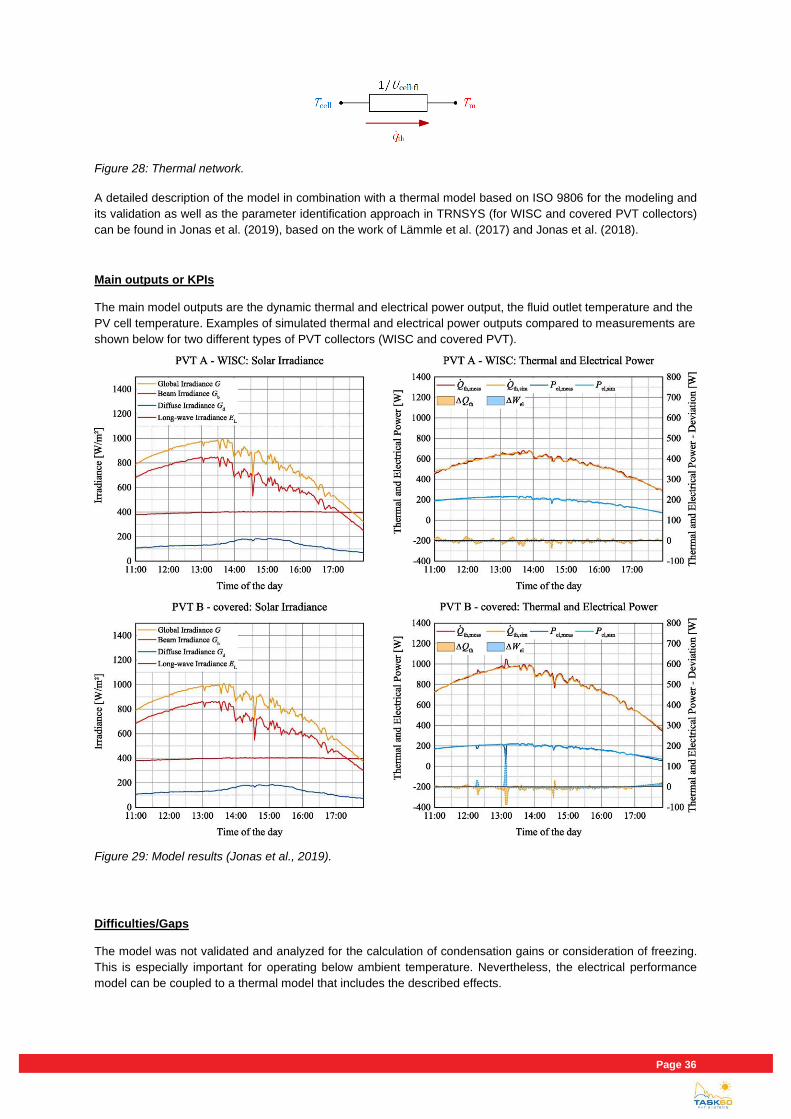
Figure 28: Thermal network.
A detailed description of the model in combination with a thermal model based on ISO 9806 for the modeling and
its validation as well as the parameter identification approach in TRNSYS (for WISC and covered PVT collectors)
can be found in Jonas et al. (2019), based on the work of Lämmle et al. (2017) and Jonas et al. (2018).
Main outputs or KPIs
The main model outputs are the dynamic thermal and electrical power output, the fluid outlet temperature and the
PV cell temperature. Examples of simulated thermal and electrical power outputs compared to measurements are
shown below for two different types of PVT collectors (WISC and covered PVT).
Figure 29: Model results (Jonas et al., 2019).
Difficulties/Gaps
The model was not validated and analyzed for the calculation of condensation gains or consideration of freezing.
This is especially important for operating below ambient temperature. Nevertheless, the electrical performance
model can be coupled to a thermal model that includes the described effects.
Numerical simulation tools for PVT collectors and systems
Page 37
Responsible
Saarland University, Germany
References
Faiman, D., 2008. Assessing the outdoor operating temperature of photovoltaic modules. Progress in Photovoltaics:
Research and Applications 16, 307–315. https://doi.org/10.1002/pip.813
Haller, M., Perers, B., Bales, C., Paavilainen, J., Dalibard, A., Fischer, S., Bertram, E., 2013. TRNSYS Type 832
v5.01, Dynamic Collector Model by Bengt Perers. Updated Input-Output Reference.
Jonas, D., 2019: TRNSYS Type 835: PV model for the coupling with solar thermal absorber and collector models
as PVT model. https://doi.org/10.5281/zenodo.1446414
Jonas, D., Theis, D., Frey, G., 2018. Implementation and Experimental Validation of a Photovoltaic-Thermal (PVT)
Collector Model in TRNSYS. In: Proceedings of the 12th International Conference on Solar Energy for Buildings
and Industry (EuroSun2018), Rapperswil, Switzerland. https://doi.org/10.18086/eurosun2018.02.16
Jonas, D., Lämmle, M., Theis, D., Schneider, S., Frey, G., 2019: Performance modeling of PVT collectors:
Implementation, validation and parameter identification approach using TRNSYS. Solar Energy 193, 51-64.
https://doi.org/10.1016/j.solener.2019.09.047
Kramer, K. et al., 2020. Status Quo of PVT Characterization. Report B1&2, IEA SHC Task 60 PVT Systems.
International Energy Agency, Solar Heating and Cooling Programme.
Lämmle, M., Oliva, A., Hermann, M., Kramer, K., Kramer, W., 2017. PVT collector technologies in solar thermal
systems: A systematic assessment of electrical and thermal yields with the novel characteristic temperature
approach. Solar Energy 155, 867-879. https://doi.org/10.1016/j.solener.2017.07.015
Page 38 RStat
3.2 Systems
3.2.1 Direct expansion PVT coupled heat pump (TECNALIA)
Description of the solution to be modelled
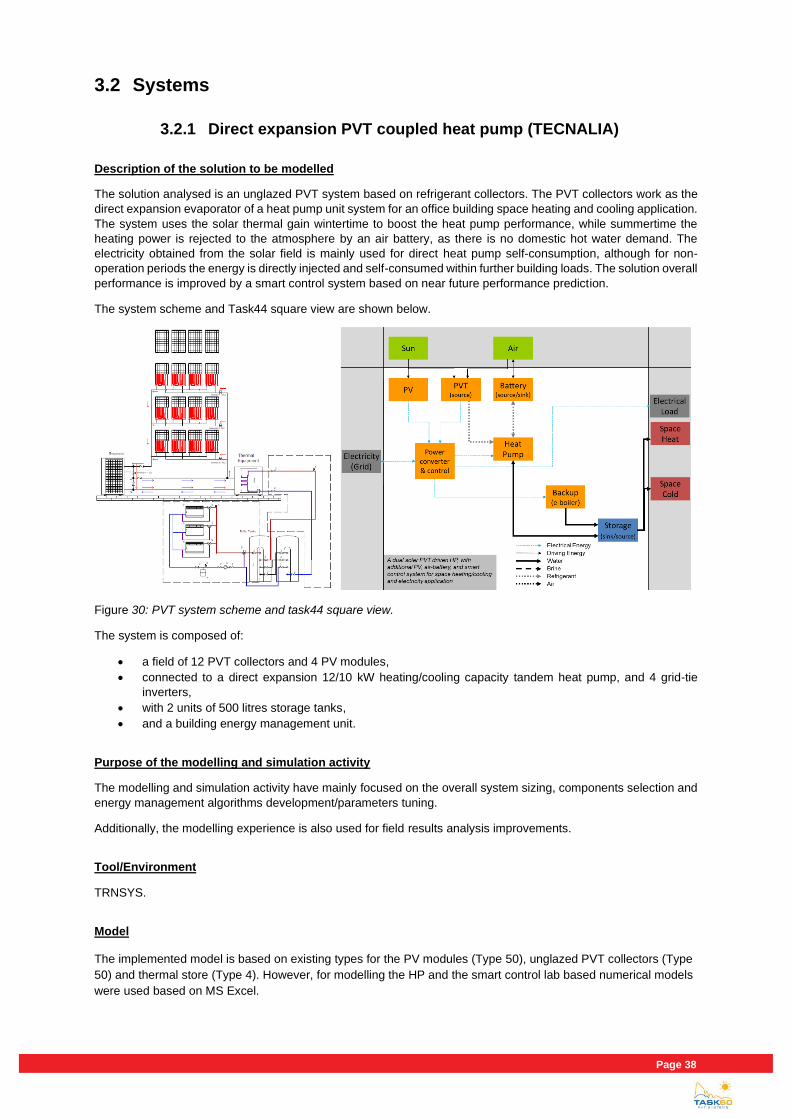
The solution analysed is an unglazed PVT system based on refrigerant collectors. The PVT collectors work as the
direct expansion evaporator of a heat pump unit system for an office building space heating and cooling application.
The system uses the solar thermal gain wintertime to boost the heat pump performance, while summertime the
heating power is rejected to the atmosphere by an air battery, as there is no domestic hot water demand. The
electricity obtained from the solar field is mainly used for direct heat pump self-consumption, although for non-
operation periods the energy is directly injected and self-consumed within further building loads. The solution overall
performance is improved by a smart control system based on near future performance prediction.
The system scheme and Task44 square view are shown below.
Figure 30: PVT system scheme and task44 square view.
The system is composed of:
• a field of 12 PVT collectors and 4 PV modules,
• connected to a direct expansion 12/10 kW heating/cooling capacity tandem heat pump, and 4 grid-tie
inverters,
• with 2 units of 500 litres storage tanks,
• and a building energy management unit.
Purpose of the modelling and simulation activity
The modelling and simulation activity have mainly focused on the overall system sizing, components selection and
energy management algorithms development/parameters tuning.
Additionally, the modelling experience is also used for field results analysis improvements.
Tool/Environment
TRNSYS.
Model
The implemented model is based on existing types for the PV modules (Type 50), unglazed PVT collectors (Type
50) and thermal store (Type 4). However, for modelling the HP and the smart control lab based numerical models
were used based on MS Excel.
Numerical simulation tools for PVT collectors and systems
Page 39
Main outputs or KPIs
The modelling, simulation and optimization activity carried out has been focused on yearly base KPIs. The analysed
main features have been the renewable energy share (considering PV, PVT and HP contributions), the solar
fraction, the self-consumption ratio (for the electric generation of both PV and PVT and HP consumption) and self-
sufficiency ratio. All the KPIs calculation are aligned with Task 60 definitions.
The computer-based design gave us the opportunity to size properly the number of PVT collectors and buffer
volume, although for real implementation some deviations where introduced to satisfy building restrictions.
Furthermore, the activity enabled both, the tuning of the realtime controller parameterization and high-level energy
prediction based management strategies definition.
Difficulties/Gaps
The main difficulties that have been found within the modelling activity are listed below:
1. The refrigerant PVT collector liquid-gas phase change performance modelling is not easy to be
determined. In order to model it, the implemented approach assumes the collector is a single liquid type
with a primary circuit that ensures an output temperature equal to the input plus the overheating
temperature of the heat pump evaporator. The cooling capacity is directly obtained from the heat pump
performance and thermal losses in the pipelines are not considered.
2. The performance at negative reduced temperatures are quite common and critical to be modelled.
Currently the additional gain is modelled just based on collector one entire year experimental data,
although condensation and icing phenomena are not properly addressed.
3. The advanced control strategies based on near future performance determination are not easy to be
simulated. The machine learning techniques give non-realistic good results for the deterministic load or
meteorological profiles used on modelling phase, while under real profiles the deviation is higher. Thus, a
potential conservative determination of these new techniques is difficult to be quantified.
Responsible
Tecnalia, Spain
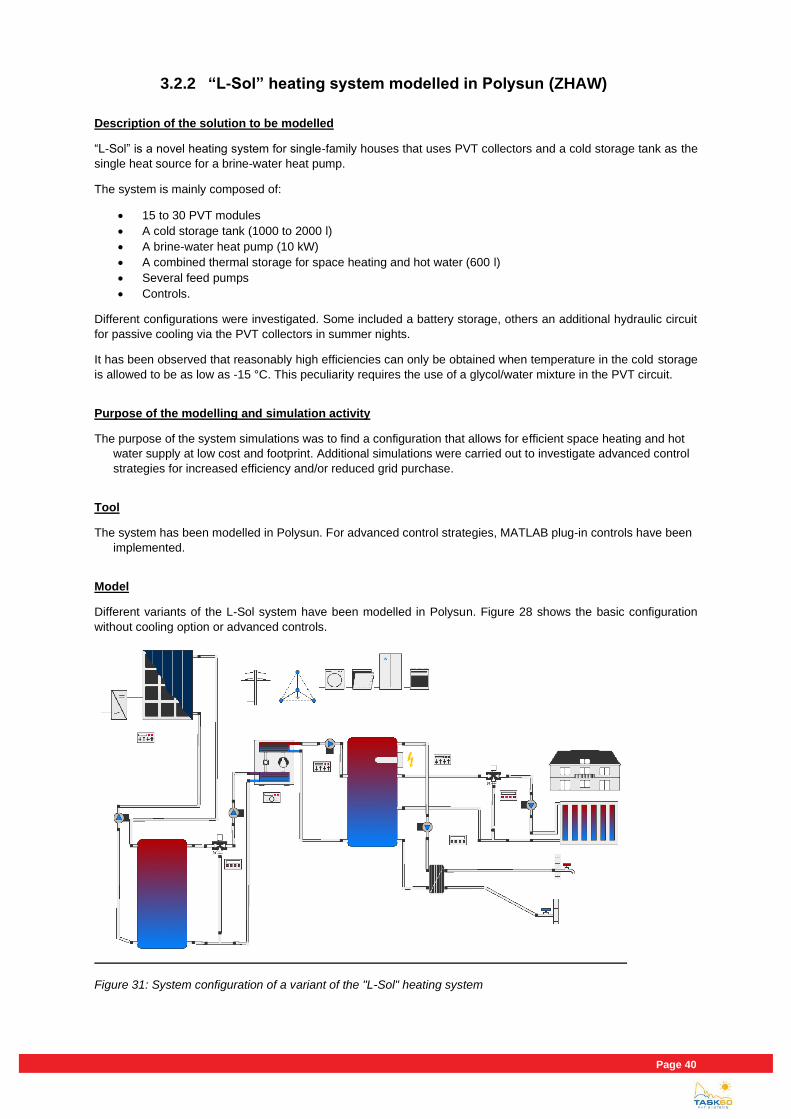
Page 40 RStat
3.2.2 “L-Sol” heating system modelled in Polysun (ZHAW)
Description of the solution to be modelled
“L-Sol” is a novel heating system for single-family houses that uses PVT collectors and a cold storage tank as the
single heat source for a brine-water heat pump.
The system is mainly composed of:
• 15 to 30 PVT modules
• A cold storage tank (1000 to 2000 l)
• A brine-water heat pump (10 kW)
• A combined thermal storage for space heating and hot water (600 l)
• Several feed pumps
• Controls.
Different configurations were investigated. Some included a battery storage, others an additional hydraulic circuit
for passive cooling via the PVT collectors in summer nights.
It has been observed that reasonably high efficiencies can only be obtained when temperature in the cold storage
is allowed to be as low as -15 °C. This peculiarity requires the use of a glycol/water mixture in the PVT circuit.
Purpose of the modelling and simulation activity
The purpose of the system simulations was to find a configuration that allows for efficient space heating and hot
water supply at low cost and footprint. Additional simulations were carried out to investigate advanced control
strategies for increased efficiency and/or reduced grid purchase.
Tool
The system has been modelled in Polysun. For advanced control strategies, MATLAB plug-in controls have been
implemented.
Model
Different variants of the L-Sol system have been modelled in Polysun. Figure 28 shows the basic configuration
without cooling option or advanced controls.
Figure 31: System configuration of a variant of the "L-Sol" heating system

Numerical simulation tools for PVT collectors and systems
Page 41
Main outputs or KPIs
The system has been investigated mainly regarding system efficiency, total electricity consumption, grid purchase,
and degree of self-sufficiency in some cases. However, Polysun allows for numerous other outputs.
Difficulties/Gaps
The main limitation of the tool Polysun to model such a heating system is that only very few PVT collectors are
currently (2020) available in the Polysun component library. Furthermore, the available models are not ideal for
special applications like the one above. E.g. the implications of flow temperatures as low as -15 °C are not
considered (icing etc.). In addition, it is unclear how suitable the component models are for special applications like
cooling via the PVT modules.
Responsible
ZHAW Zurich University of Applied Sciences, Switzerland
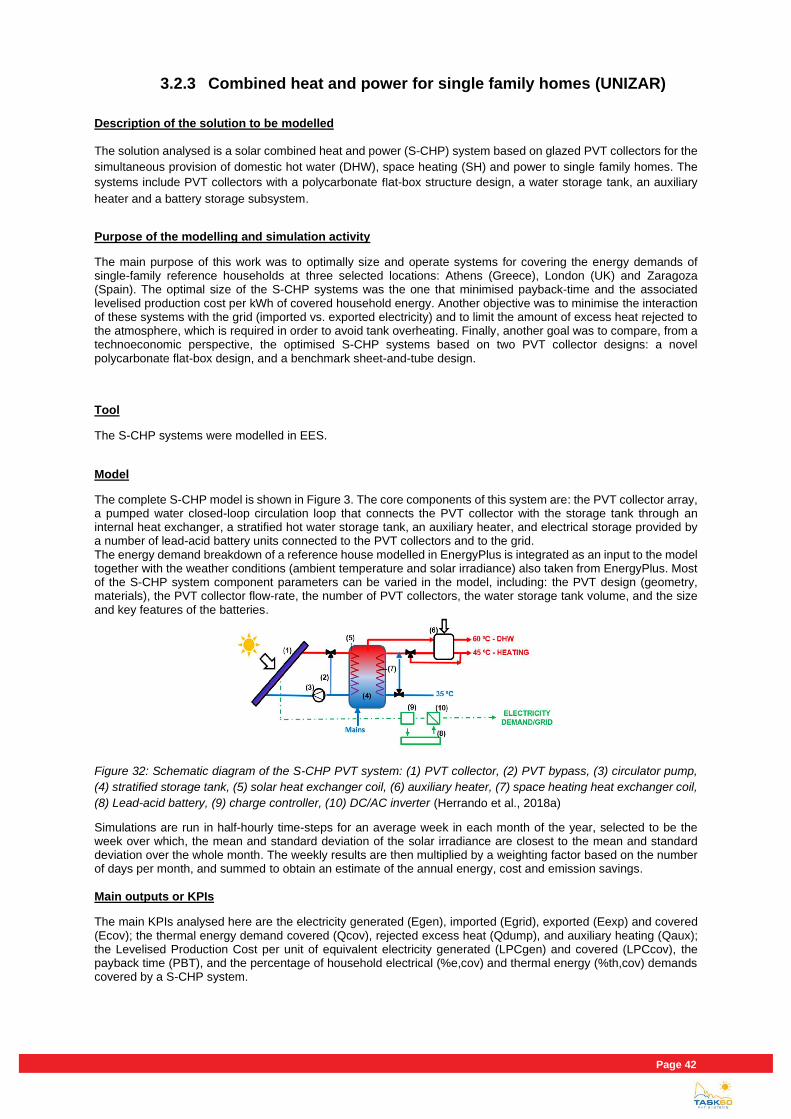
Page 42 RStat
3.2.3 Combined heat and power for single family homes (UNIZAR)
Description of the solution to be modelled
The solution analysed is a solar combined heat and power (S-CHP) system based on glazed PVT collectors for the
simultaneous provision of domestic hot water (DHW), space heating (SH) and power to single family homes. The
systems include PVT collectors with a polycarbonate flat-box structure design, a water storage tank, an auxiliary
heater and a battery storage subsystem.
Purpose of the modelling and simulation activity
The main purpose of this work was to optimally size and operate systems for covering the energy demands of single-family reference households at three selected locations: Athens (Greece), London (UK) and Zaragoza (Spain). The optimal size of the S-CHP systems was the one that minimised payback-time and the associated levelised production cost per kWh of covered household energy. Another objective was to minimise the interaction of these systems with the grid (imported vs. exported electricity) and to limit the amount of excess heat rejected to the atmosphere, which is required in order to avoid tank overheating. Finally, another goal was to compare, from a technoeconomic perspective, the optimised S-CHP systems based on two PVT collector designs: a novel polycarbonate flat-box design, and a benchmark sheet-and-tube design.
Tool
The S-CHP systems were modelled in EES.
Model
The complete S-CHP model is shown in Figure 3. The core components of this system are: the PVT collector array, a pumped water closed-loop circulation loop that connects the PVT collector with the storage tank through an internal heat exchanger, a stratified hot water storage tank, an auxiliary heater, and electrical storage provided by a number of lead-acid battery units connected to the PVT collectors and to the grid. The energy demand breakdown of a reference house modelled in EnergyPlus is integrated as an input to the model together with the weather conditions (ambient temperature and solar irradiance) also taken from EnergyPlus. Most of the S-CHP system component parameters can be varied in the model, including: the PVT design (geometry, materials), the PVT collector flow-rate, the number of PVT collectors, the water storage tank volume, and the size and key features of the batteries.
Figure 32: Schematic diagram of the S-CHP PVT system: (1) PVT collector, (2) PVT bypass, (3) circulator pump,
(4) stratified storage tank, (5) solar heat exchanger coil, (6) auxiliary heater, (7) space heating heat exchanger coil,
(8) Lead-acid battery, (9) charge controller, (10) DC/AC inverter (Herrando et al., 2018a)
Simulations are run in half-hourly time-steps for an average week in each month of the year, selected to be the week over which, the mean and standard deviation of the solar irradiance are closest to the mean and standard deviation over the whole month. The weekly results are then multiplied by a weighting factor based on the number of days per month, and summed to obtain an estimate of the annual energy, cost and emission savings. Main outputs or KPIs
The main KPIs analysed here are the electricity generated (Egen), imported (Egrid), exported (Eexp) and covered (Ecov); the thermal energy demand covered (Qcov), rejected excess heat (Qdump), and auxiliary heating (Qaux); the Levelised Production Cost per unit of equivalent electricity generated (LPCgen) and covered (LPCcov), the payback time (PBT), and the percentage of household electrical (%e,cov) and thermal energy (%th,cov) demands covered by a S-CHP system.
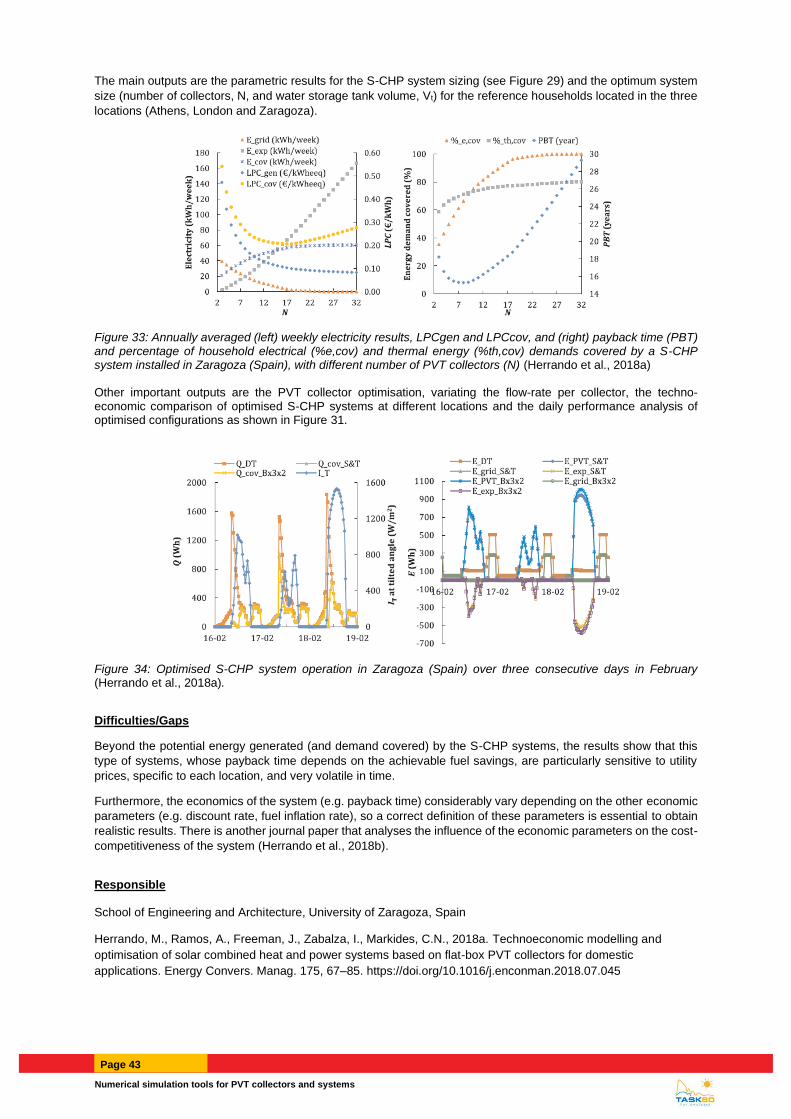
Numerical simulation tools for PVT collectors and systems
Page 43
The main outputs are the parametric results for the S-CHP system sizing (see Figure 29) and the optimum system
size (number of collectors, N, and water storage tank volume, Vt) for the reference households located in the three
locations (Athens, London and Zaragoza).
Figure 33: Annually averaged (left) weekly electricity results, LPCgen and LPCcov, and (right) payback time (PBT) and percentage of household electrical (%e,cov) and thermal energy (%th,cov) demands covered by a S-CHP system installed in Zaragoza (Spain), with different number of PVT collectors (N) (Herrando et al., 2018a) Other important outputs are the PVT collector optimisation, variating the flow-rate per collector, the techno-economic comparison of optimised S-CHP systems at different locations and the daily performance analysis of optimised configurations as shown in Figure 31.
Figure 34: Optimised S-CHP system operation in Zaragoza (Spain) over three consecutive days in February (Herrando et al., 2018a).
Difficulties/Gaps
Beyond the potential energy generated (and demand covered) by the S-CHP systems, the results show that this
type of systems, whose payback time depends on the achievable fuel savings, are particularly sensitive to utility
prices, specific to each location, and very volatile in time.
Furthermore, the economics of the system (e.g. payback time) considerably vary depending on the other economic
parameters (e.g. discount rate, fuel inflation rate), so a correct definition of these parameters is essential to obtain
realistic results. There is another journal paper that analyses the influence of the economic parameters on the cost-
competitiveness of the system (Herrando et al., 2018b).
Responsible
School of Engineering and Architecture, University of Zaragoza, Spain
Herrando, M., Ramos, A., Freeman, J., Zabalza, I., Markides, C.N., 2018a. Technoeconomic modelling and
optimisation of solar combined heat and power systems based on flat-box PVT collectors for domestic
applications. Energy Convers. Manag. 175, 67–85. https://doi.org/10.1016/j.enconman.2018.07.045

Page 44 RStat
Herrando, M., Ramos, A., Zabalza, I., 2018b. Cost competitiveness of a novel PVT-based solar combined heating
and power system: Influence of economic parameters and financial incentives. Energy Convers. Manag. 166,
758–770. https://doi.org/10.1016/j.enconman.2018.04.005
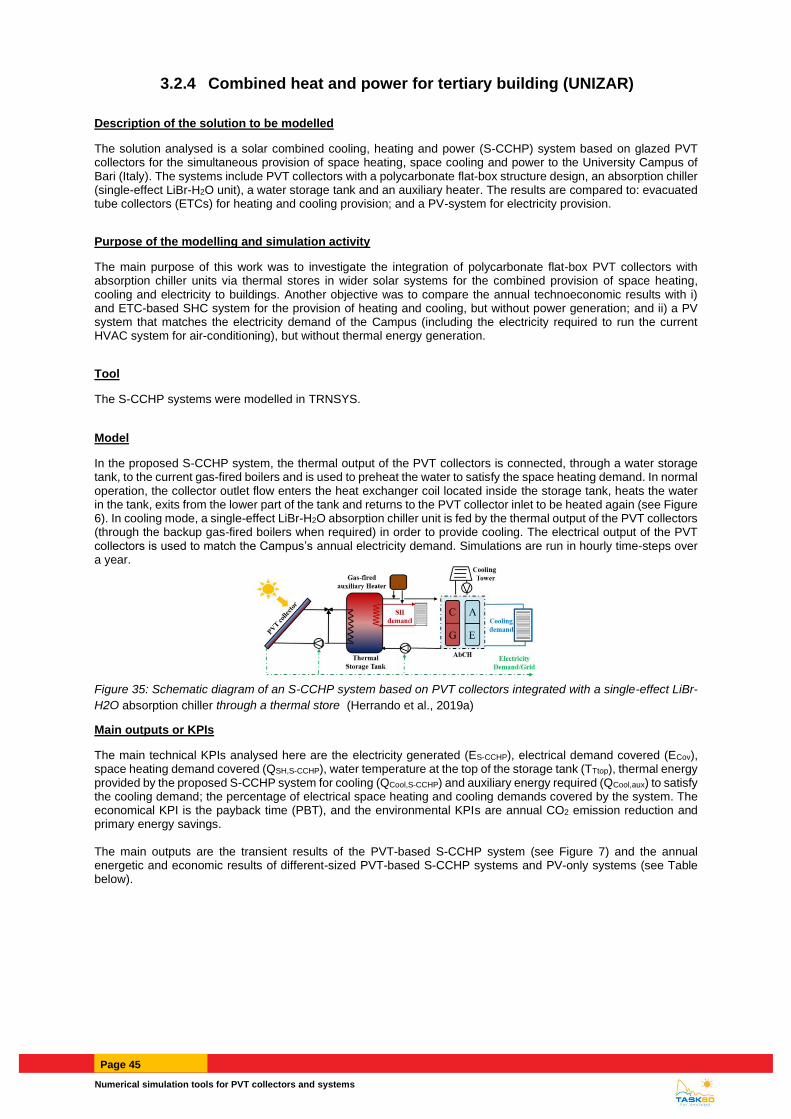
Numerical simulation tools for PVT collectors and systems
Page 45
3.2.4 Combined heat and power for tertiary building (UNIZAR)
Description of the solution to be modelled
The solution analysed is a solar combined cooling, heating and power (S-CCHP) system based on glazed PVT collectors for the simultaneous provision of space heating, space cooling and power to the University Campus of Bari (Italy). The systems include PVT collectors with a polycarbonate flat-box structure design, an absorption chiller (single-effect LiBr-H2O unit), a water storage tank and an auxiliary heater. The results are compared to: evacuated tube collectors (ETCs) for heating and cooling provision; and a PV-system for electricity provision.
Purpose of the modelling and simulation activity
The main purpose of this work was to investigate the integration of polycarbonate flat-box PVT collectors with absorption chiller units via thermal stores in wider solar systems for the combined provision of space heating, cooling and electricity to buildings. Another objective was to compare the annual technoeconomic results with i) and ETC-based SHC system for the provision of heating and cooling, but without power generation; and ii) a PV system that matches the electricity demand of the Campus (including the electricity required to run the current HVAC system for air-conditioning), but without thermal energy generation.
Tool
The S-CCHP systems were modelled in TRNSYS.
Model
In the proposed S-CCHP system, the thermal output of the PVT collectors is connected, through a water storage tank, to the current gas-fired boilers and is used to preheat the water to satisfy the space heating demand. In normal operation, the collector outlet flow enters the heat exchanger coil located inside the storage tank, heats the water in the tank, exits from the lower part of the tank and returns to the PVT collector inlet to be heated again (see Figure 6). In cooling mode, a single-effect LiBr-H2O absorption chiller unit is fed by the thermal output of the PVT collectors (through the backup gas-fired boilers when required) in order to provide cooling. The electrical output of the PVT collectors is used to match the Campus’s annual electricity demand. Simulations are run in hourly time-steps over a year.
Figure 35: Schematic diagram of an S-CCHP system based on PVT collectors integrated with a single-effect LiBr-
H2O absorption chiller through a thermal store (Herrando et al., 2019a)
Main outputs or KPIs
The main technical KPIs analysed here are the electricity generated (ES-CCHP), electrical demand covered (ECov), space heating demand covered (QSH,S-CCHP), water temperature at the top of the storage tank (TTtop), thermal energy provided by the proposed S-CCHP system for cooling (QCool,S-CCHP) and auxiliary energy required (QCool,aux) to satisfy the cooling demand; the percentage of electrical space heating and cooling demands covered by the system. The economical KPI is the payback time (PBT), and the environmental KPIs are annual CO2 emission reduction and primary energy savings. The main outputs are the transient results of the PVT-based S-CCHP system (see Figure 7) and the annual energetic and economic results of different-sized PVT-based S-CCHP systems and PV-only systems (see Table below).
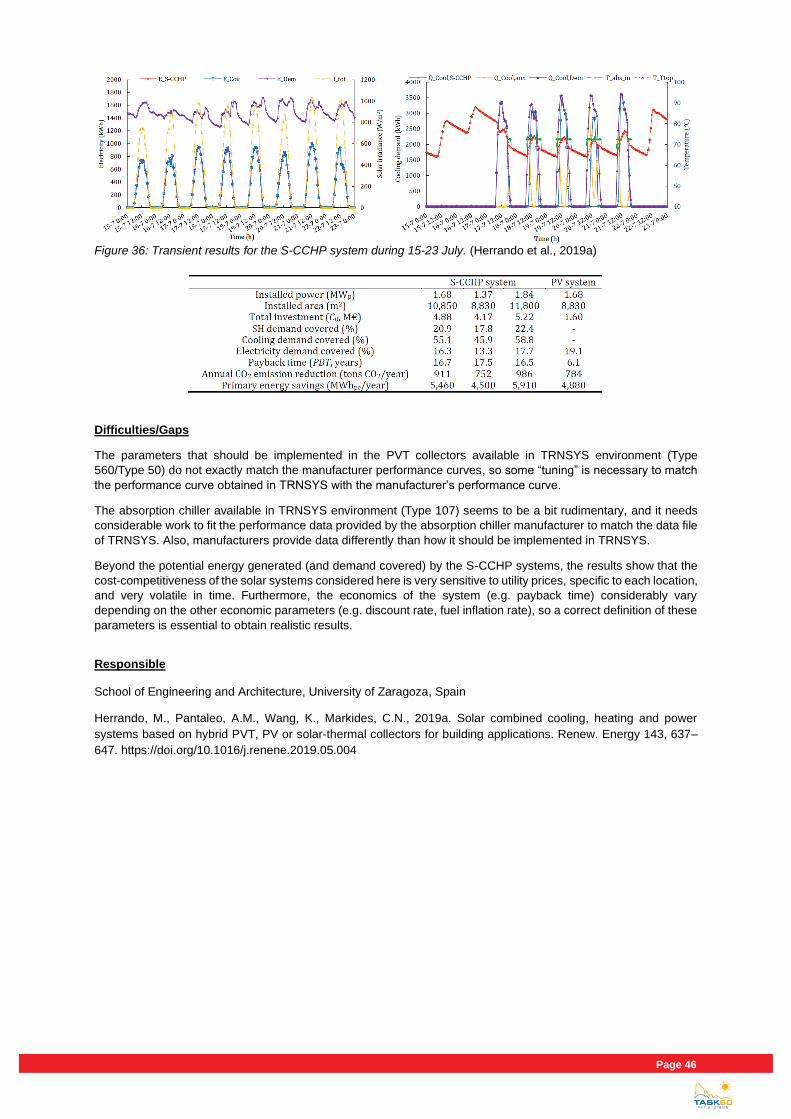
Page 46 RStat
Figure 36: Transient results for the S-CCHP system during 15-23 July. (Herrando et al., 2019a)
Difficulties/Gaps
The parameters that should be implemented in the PVT collectors available in TRNSYS environment (Type
560/Type 50) do not exactly match the manufacturer performance curves, so some “tuning” is necessary to match
the performance curve obtained in TRNSYS with the manufacturer’s performance curve.
The absorption chiller available in TRNSYS environment (Type 107) seems to be a bit rudimentary, and it needs
considerable work to fit the performance data provided by the absorption chiller manufacturer to match the data file
of TRNSYS. Also, manufacturers provide data differently than how it should be implemented in TRNSYS.
Beyond the potential energy generated (and demand covered) by the S-CCHP systems, the results show that the
cost-competitiveness of the solar systems considered here is very sensitive to utility prices, specific to each location,
and very volatile in time. Furthermore, the economics of the system (e.g. payback time) considerably vary
depending on the other economic parameters (e.g. discount rate, fuel inflation rate), so a correct definition of these
parameters is essential to obtain realistic results.
Responsible
School of Engineering and Architecture, University of Zaragoza, Spain
Herrando, M., Pantaleo, A.M., Wang, K., Markides, C.N., 2019a. Solar combined cooling, heating and power
systems based on hybrid PVT, PV or solar-thermal collectors for building applications. Renew. Energy 143, 637–
647. https://doi.org/10.1016/j.renene.2019.05.004
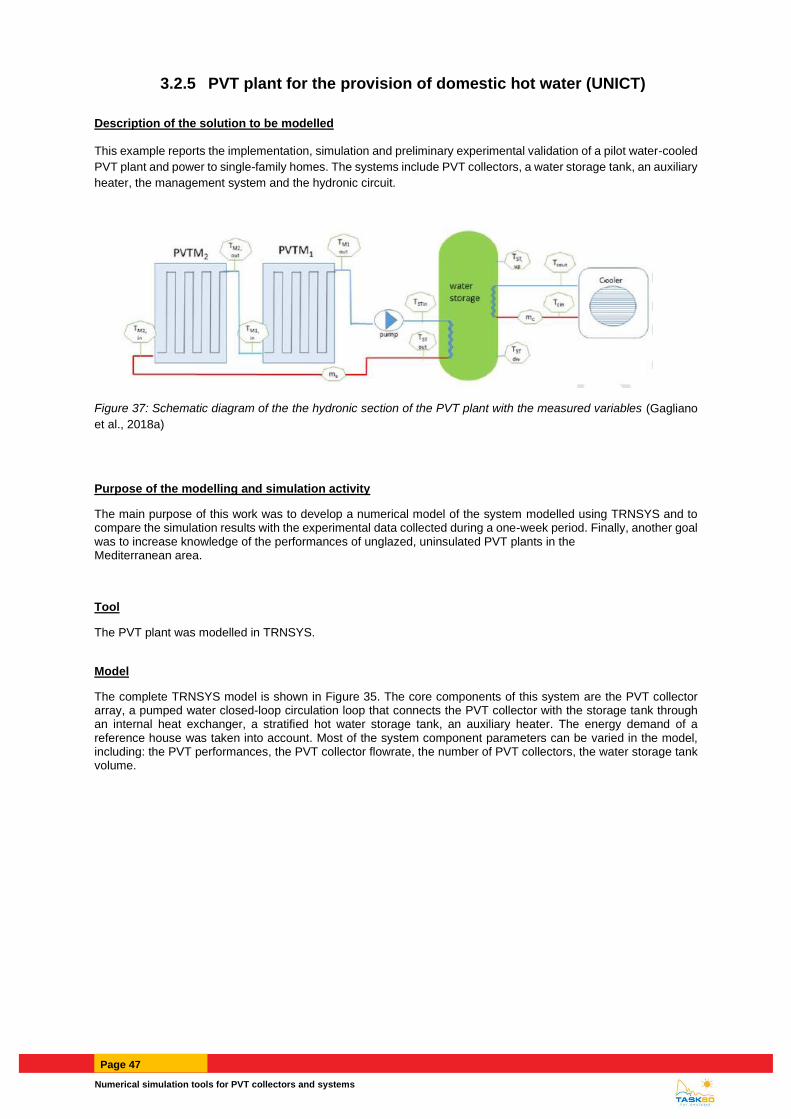
Numerical simulation tools for PVT collectors and systems
Page 47
3.2.5 PVT plant for the provision of domestic hot water (UNICT)
Description of the solution to be modelled
This example reports the implementation, simulation and preliminary experimental validation of a pilot water-cooled
PVT plant and power to single-family homes. The systems include PVT collectors, a water storage tank, an auxiliary
heater, the management system and the hydronic circuit.
Figure 37: Schematic diagram of the the hydronic section of the PVT plant with the measured variables (Gagliano
et al., 2018a)
Purpose of the modelling and simulation activity
The main purpose of this work was to develop a numerical model of the system modelled using TRNSYS and to compare the simulation results with the experimental data collected during a one-week period. Finally, another goal was to increase knowledge of the performances of unglazed, uninsulated PVT plants in the Mediterranean area.
Tool
The PVT plant was modelled in TRNSYS.
Model
The complete TRNSYS model is shown in Figure 35. The core components of this system are the PVT collector array, a pumped water closed-loop circulation loop that connects the PVT collector with the storage tank through an internal heat exchanger, a stratified hot water storage tank, an auxiliary heater. The energy demand of a reference house was taken into account. Most of the system component parameters can be varied in the model, including: the PVT performances, the PVT collector flowrate, the number of PVT collectors, the water storage tank volume.
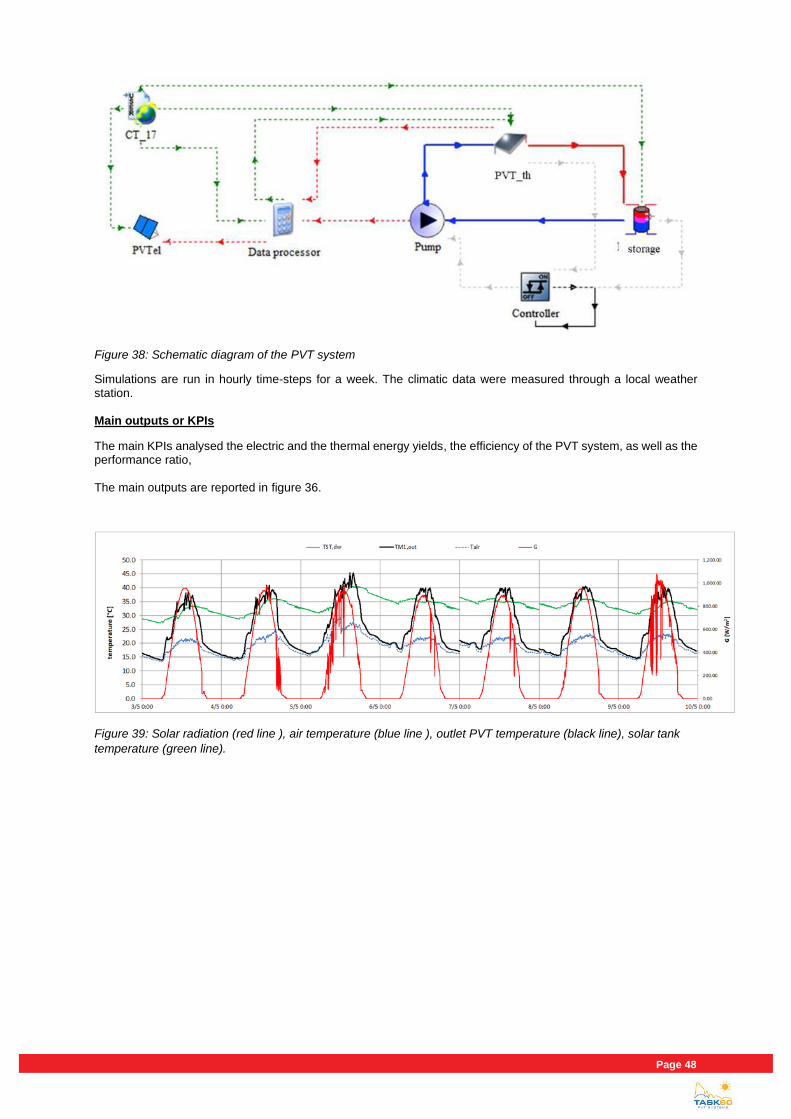
Page 48 RStat
Figure 38: Schematic diagram of the PVT system
Simulations are run in hourly time-steps for a week. The climatic data were measured through a local weather station. Main outputs or KPIs
The main KPIs analysed the electric and the thermal energy yields, the efficiency of the PVT system, as well as the performance ratio,
The main outputs are reported in figure 36.
Figure 39: Solar radiation (red line ), air temperature (blue line ), outlet PVT temperature (black line), solar tank
temperature (green line).
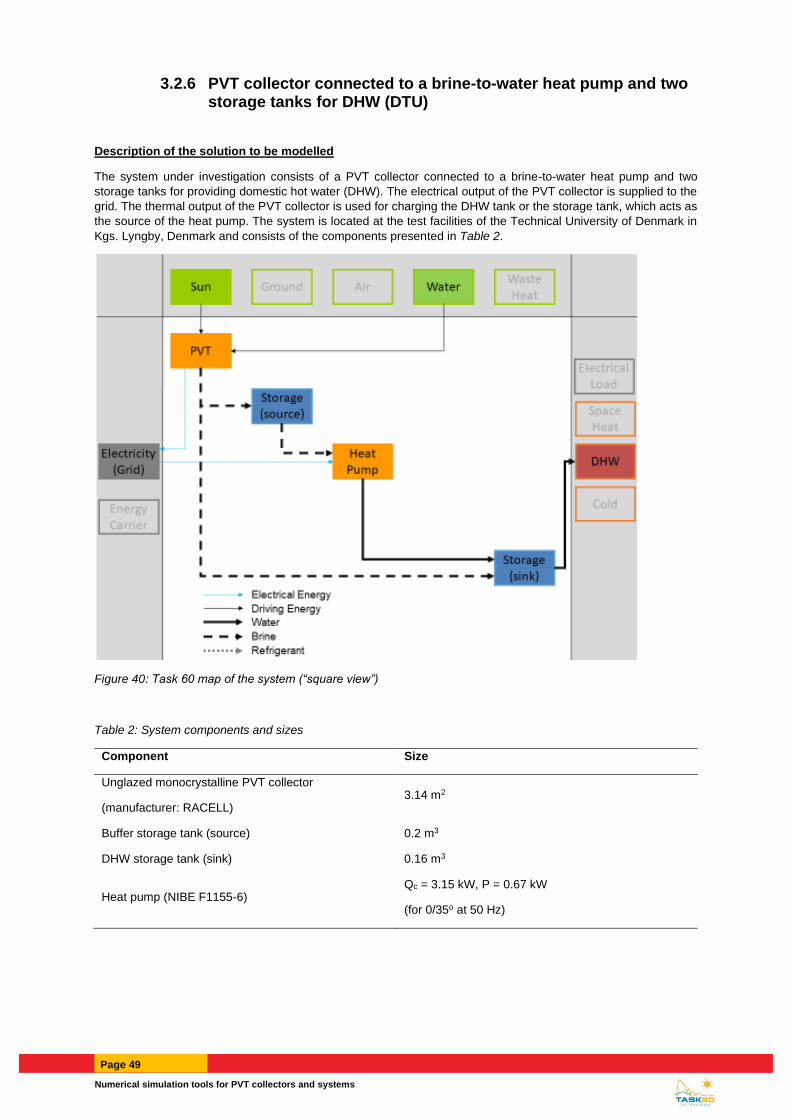
Numerical simulation tools for PVT collectors and systems
Page 49
3.2.6 PVT collector connected to a brine-to-water heat pump and two storage tanks for DHW (DTU)
Description of the solution to be modelled
The system under investigation consists of a PVT collector connected to a brine-to-water heat pump and two
storage tanks for providing domestic hot water (DHW). The electrical output of the PVT collector is supplied to the
grid. The thermal output of the PVT collector is used for charging the DHW tank or the storage tank, which acts as
the source of the heat pump. The system is located at the test facilities of the Technical University of Denmark in
Kgs. Lyngby, Denmark and consists of the components presented in Table 2.
Figure 40: Task 60 map of the system (“square view”)
Table 2: System components and sizes
Component Size
Unglazed monocrystalline PVT collector
(manufacturer: RACELL) 3.14 m2
Buffer storage tank (source) 0.2 m3
DHW storage tank (sink) 0.16 m3
Heat pump (NIBE F1155-6) Qc = 3.15 kW, P = 0.67 kW
(for 0/35o at 50 Hz)
Page 50 RStat
Purpose of the modelling and simulation activity
The purpose of the modelling and simulation of this system was “proof-of-concept” and “design evaluation” for the
heating systems with a storage tank acting as a source for the heat pump. The idea of using a buffer tank (instead
of e.g. ground source heat exchanger) sounded promising, due to easier installation and lower total system cost.
For that reason, simulation results were used for assessing performance of the system and identifying
problems/weaknesses. Finally, component sizes were investigated for improving the system’s performance.
Tool
All simulations were performed using the Transient System Simulation Tool (TRNSYS).
Model
First, the simulation model was validated with measurement over a 6-month period (August to December).
Yearly simulation carried out using TRNSYS reference year weather files and DHW load and T_cold temperature
corresponding to actual systems in Denmark.
Main outputs or KPIs
The performance of the system was evaluated with selected KPIs.
• Solar thermal fraction:
𝑓𝑠𝑜𝑙,𝑡ℎ = 𝑄𝑃𝑉𝑇
𝑄𝑠𝑢𝑝,𝐻𝑆
Where:
𝑄𝑠𝑢𝑝,𝐻𝑆 = 𝑄𝑝𝑟𝑖𝑚𝑎𝑟𝑦,𝐻𝑃 + 𝑄𝑃𝑉𝑇,𝐷𝐻𝑊
Where QPVT is the thermal energy produced by the PVT collector, Qsup,HS is the thermal energy supplied to the DHW
tank and heat pump, Qprimary,HP is the thermal energy supplied to the primary (source) side of the heat pump and
QPVT,DHW Thermal energy supplied by the PVT to the DHW tank.
• Solar electrical fraction:
𝑓𝑠𝑜𝑙,𝑒𝑙 = 𝐸𝑃𝑉𝑇
𝐸𝐻𝑆
Where EPVT is the electrical energy produced by the PVT collector and EHS is the electrical energy consumed by
the heating system.
• Net renewable energy fraction:
𝑓𝑟𝑒𝑛 = 𝑄𝑃𝑉𝑇+ 𝐸𝑃𝑉𝑇
𝑄𝑠𝑢𝑝,𝐻𝑆+ 𝐸𝐻𝑆
• Inverse system seasonal performance factor (ISPF):
𝑓𝐼𝑆𝑃𝐹 = 𝐸𝐻𝑆− 𝐸𝑃𝑉𝑇
𝑄𝐻𝑆
The results of the parameter variation of the component sizes in the system are displayed in the figures below.
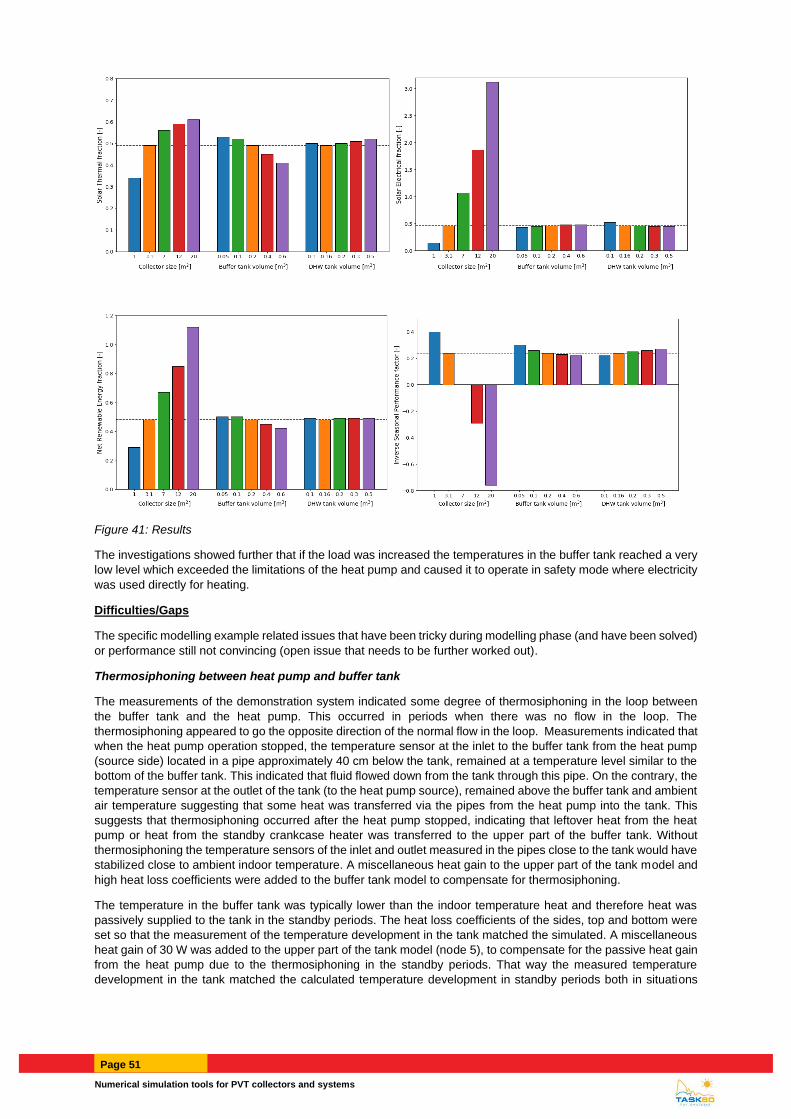
Numerical simulation tools for PVT collectors and systems
Page 51
Figure 41: Results
The investigations showed further that if the load was increased the temperatures in the buffer tank reached a very
low level which exceeded the limitations of the heat pump and caused it to operate in safety mode where electricity
was used directly for heating.
Difficulties/Gaps
The specific modelling example related issues that have been tricky during modelling phase (and have been solved)
or performance still not convincing (open issue that needs to be further worked out).
Thermosiphoning between heat pump and buffer tank
The measurements of the demonstration system indicated some degree of thermosiphoning in the loop between
the buffer tank and the heat pump. This occurred in periods when there was no flow in the loop. The
thermosiphoning appeared to go the opposite direction of the normal flow in the loop. Measurements indicated that
when the heat pump operation stopped, the temperature sensor at the inlet to the buffer tank from the heat pump
(source side) located in a pipe approximately 40 cm below the tank, remained at a temperature level similar to the
bottom of the buffer tank. This indicated that fluid flowed down from the tank through this pipe. On the contrary, the
temperature sensor at the outlet of the tank (to the heat pump source), remained above the buffer tank and ambient
air temperature suggesting that some heat was transferred via the pipes from the heat pump into the tank. This
suggests that thermosiphoning occurred after the heat pump stopped, indicating that leftover heat from the heat
pump or heat from the standby crankcase heater was transferred to the upper part of the buffer tank. Without
thermosiphoning the temperature sensors of the inlet and outlet measured in the pipes close to the tank would have
stabilized close to ambient indoor temperature. A miscellaneous heat gain to the upper part of the tank model and
high heat loss coefficients were added to the buffer tank model to compensate for thermosiphoning.
The temperature in the buffer tank was typically lower than the indoor temperature heat and therefore heat was
passively supplied to the tank in the standby periods. The heat loss coefficients of the sides, top and bottom were
set so that the measurement of the temperature development in the tank matched the simulated. A miscellaneous
heat gain of 30 W was added to the upper part of the tank model (node 5), to compensate for the passive heat gain
from the heat pump due to the thermosiphoning in the standby periods. That way the measured temperature
development in the tank matched the calculated temperature development in standby periods both in situations
Page 52 RStat
where the temperature in the tank was close to the ambient indoor temperature and in cases where the temperature
in the buffer tank was significantly lower than the indoor temperature.
Heat pump thermal capacity
The thermal capacity of the heat pump was not included in type 927, which was used for the heat pump in the
TRNSYS simulation. Due to relative short operation periods (15-30 minutes) of the heat pump in the physical
system, a relatively high amount of heat was lost to the ambient. This is because some energy is used to heat up
the components of the heat pump when it starts up which is lost to the ambient when the heat pump stops after a
short operation period. To include the thermal mass of the heat pump 19 meter of pipes (type 604 which includes
thermal mass) was added to the load side of the heat pump and 2 meters of pipes (type 604) was added to the
source side of the heat pump. In this way, the simulated temperature developments and the energy transfer on the
source and load loops of the heat pump matched the experimental measurements.
Heat pump modulation
The physical heat pump in the demonstration system used a frequency inverter in order to modulate the heat pump’s
compressor operation for optimal performance. The electrical power consumption of the heat pump varied
throughout the measurement period, having higher electrical consumption for colder inlet temperatures on the
source side of the heat pump. Modulating heat pump technology is currently not included in any of the standard
TRNSYS heat pump components (Type 927 was used). For this reason, a function using the source temperature
entering the heat pump was included in the heat pump model to control the heat pump’s scale factor. This way, the
thermal output and electrical consumption of the heat pump could be increased or decreased according to the
source temperature, simulating the modulating power operation of the heat pump. In this way, the electrical
consumption of the heat pump varied with the operating conditions in a similar way as it did in the experimental
setup. Lastly, in order to include the standby electricity consumption of the heat pump in TRNSYS, a constant 19
W were added to the heat pump electrical power consumption.
PVT collector model
The prototype PVT collector had not been characterized in detail before the PVT system was set in operation.
Therefore, a model only focusing on the collector was initially built in order to identify the collector’s coefficients.
TRNSYS “Type 203: PVT collector” developed by Institut für Solarenergieforschung GmbH (ISFH) [40] was chosen
for the PVT collector. The thermal and electrical outputs of the model calculated using the measured weather
conditions, inlet temperatures and flows, were compared to the measured output of the PVT prototype. The collector
parameters in the model were adjusted to give a good fit between measurements and calculations. This was done
considering the characteristics of similar collectors, but also the installation, in order to have reasonable parameters
for the PVT collector.
Responsible
Mark Dannemand – Technical University of Denmark (DTU) ([email protected])
Ioannis Sifnaios – Technical University of Denmark (DTU) ([email protected])
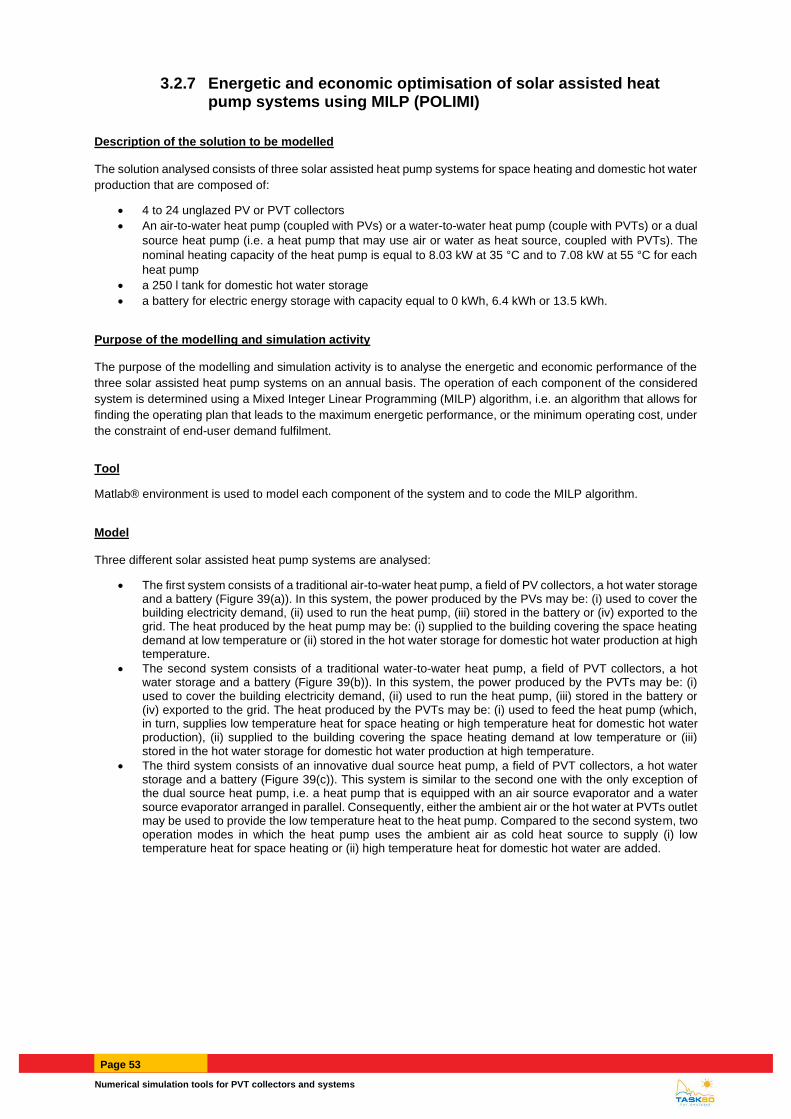
Numerical simulation tools for PVT collectors and systems
Page 53
3.2.7 Energetic and economic optimisation of solar assisted heat pump systems using MILP (POLIMI)
Description of the solution to be modelled
The solution analysed consists of three solar assisted heat pump systems for space heating and domestic hot water
production that are composed of:
• 4 to 24 unglazed PV or PVT collectors
• An air-to-water heat pump (coupled with PVs) or a water-to-water heat pump (couple with PVTs) or a dual
source heat pump (i.e. a heat pump that may use air or water as heat source, coupled with PVTs). The
nominal heating capacity of the heat pump is equal to 8.03 kW at 35 °C and to 7.08 kW at 55 °C for each
heat pump
• a 250 l tank for domestic hot water storage
• a battery for electric energy storage with capacity equal to 0 kWh, 6.4 kWh or 13.5 kWh.
Purpose of the modelling and simulation activity
The purpose of the modelling and simulation activity is to analyse the energetic and economic performance of the
three solar assisted heat pump systems on an annual basis. The operation of each component of the considered
system is determined using a Mixed Integer Linear Programming (MILP) algorithm, i.e. an algorithm that allows for
finding the operating plan that leads to the maximum energetic performance, or the minimum operating cost, under
the constraint of end-user demand fulfilment.
Tool
Matlab® environment is used to model each component of the system and to code the MILP algorithm.
Model
Three different solar assisted heat pump systems are analysed:
• The first system consists of a traditional air-to-water heat pump, a field of PV collectors, a hot water storage and a battery (Figure 39(a)). In this system, the power produced by the PVs may be: (i) used to cover the building electricity demand, (ii) used to run the heat pump, (iii) stored in the battery or (iv) exported to the grid. The heat produced by the heat pump may be: (i) supplied to the building covering the space heating demand at low temperature or (ii) stored in the hot water storage for domestic hot water production at high temperature.
• The second system consists of a traditional water-to-water heat pump, a field of PVT collectors, a hot water storage and a battery (Figure 39(b)). In this system, the power produced by the PVTs may be: (i) used to cover the building electricity demand, (ii) used to run the heat pump, (iii) stored in the battery or (iv) exported to the grid. The heat produced by the PVTs may be: (i) used to feed the heat pump (which, in turn, supplies low temperature heat for space heating or high temperature heat for domestic hot water production), (ii) supplied to the building covering the space heating demand at low temperature or (iii) stored in the hot water storage for domestic hot water production at high temperature.
• The third system consists of an innovative dual source heat pump, a field of PVT collectors, a hot water storage and a battery (Figure 39(c)). This system is similar to the second one with the only exception of the dual source heat pump, i.e. a heat pump that is equipped with an air source evaporator and a water source evaporator arranged in parallel. Consequently, either the ambient air or the hot water at PVTs outlet may be used to provide the low temperature heat to the heat pump. Compared to the second system, two operation modes in which the heat pump uses the ambient air as cold heat source to supply (i) low temperature heat for space heating or (ii) high temperature heat for domestic hot water are added.
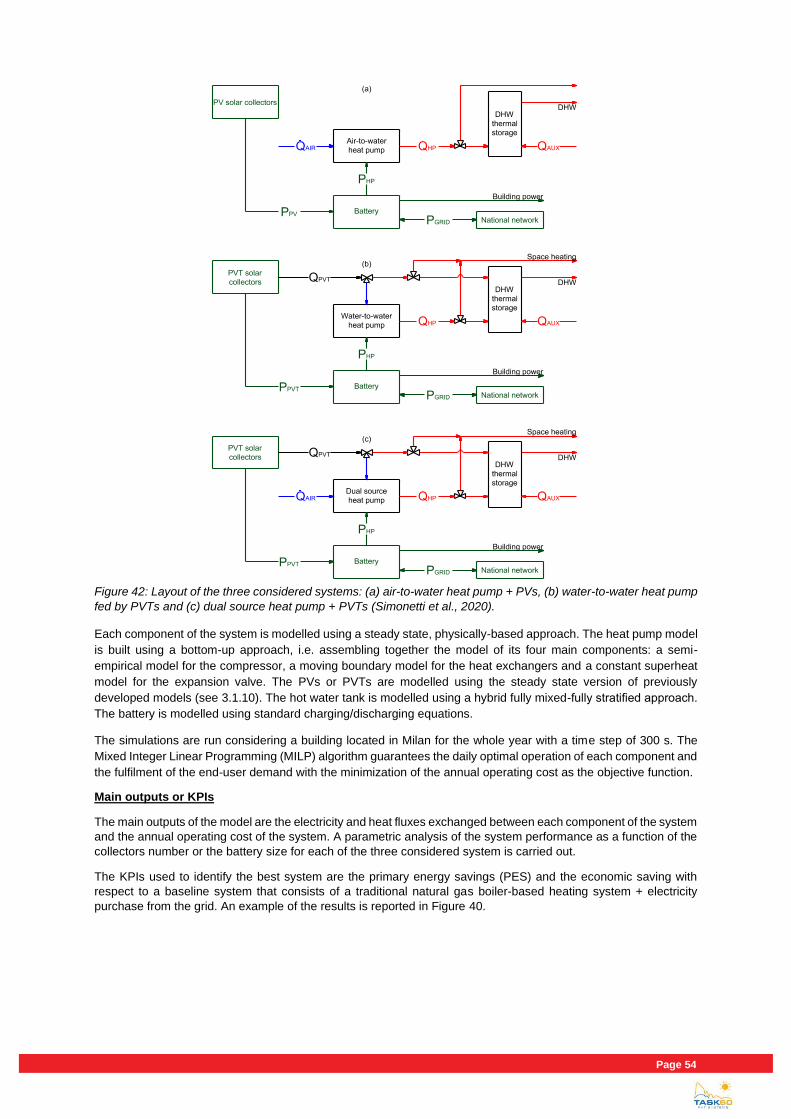
Page 54 RStat
Figure 42: Layout of the three considered systems: (a) air-to-water heat pump + PVs, (b) water-to-water heat pump
fed by PVTs and (c) dual source heat pump + PVTs (Simonetti et al., 2020).
Each component of the system is modelled using a steady state, physically-based approach. The heat pump model
is built using a bottom-up approach, i.e. assembling together the model of its four main components: a semi-
empirical model for the compressor, a moving boundary model for the heat exchangers and a constant superheat
model for the expansion valve. The PVs or PVTs are modelled using the steady state version of previously
developed models (see 3.1.10). The hot water tank is modelled using a hybrid fully mixed-fully stratified approach.
The battery is modelled using standard charging/discharging equations.
The simulations are run considering a building located in Milan for the whole year with a time step of 300 s. The
Mixed Integer Linear Programming (MILP) algorithm guarantees the daily optimal operation of each component and
the fulfilment of the end-user demand with the minimization of the annual operating cost as the objective function.
Main outputs or KPIs
The main outputs of the model are the electricity and heat fluxes exchanged between each component of the system
and the annual operating cost of the system. A parametric analysis of the system performance as a function of the
collectors number or the battery size for each of the three considered system is carried out.
The KPIs used to identify the best system are the primary energy savings (PES) and the economic saving with
respect to a baseline system that consists of a traditional natural gas boiler-based heating system + electricity
purchase from the grid. An example of the results is reported in Figure 40.
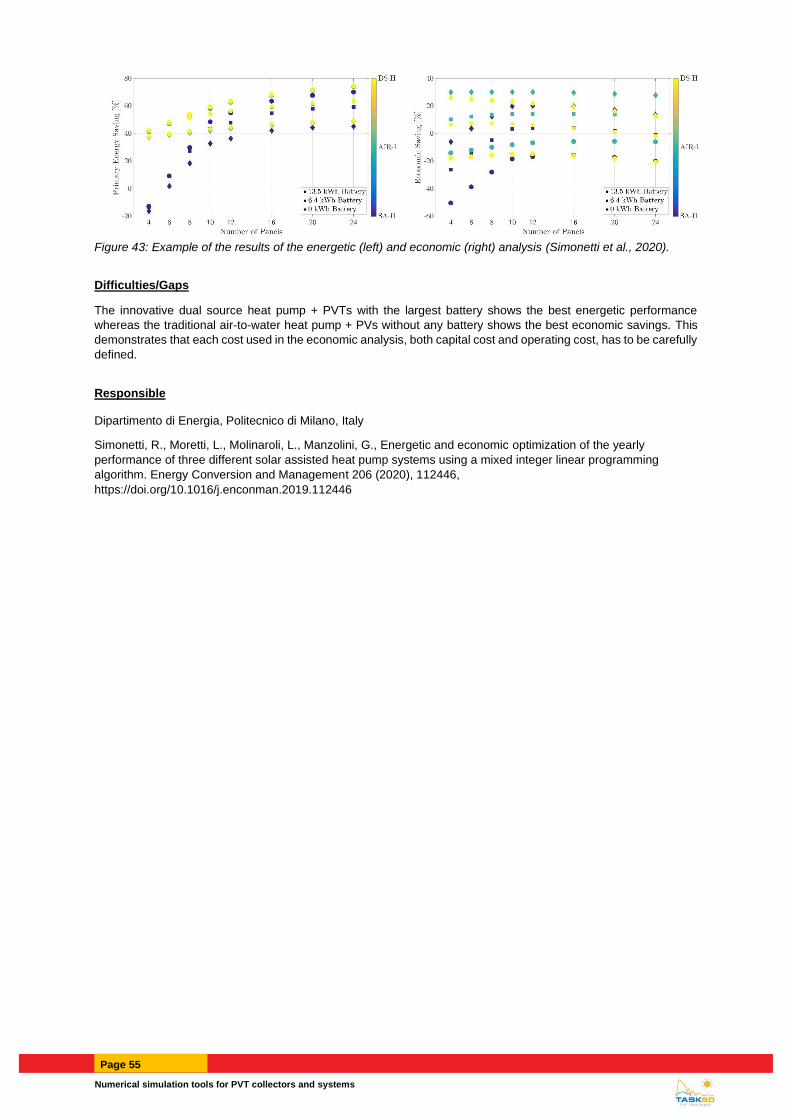
Numerical simulation tools for PVT collectors and systems
Page 55
Figure 43: Example of the results of the energetic (left) and economic (right) analysis (Simonetti et al., 2020).
Difficulties/Gaps
The innovative dual source heat pump + PVTs with the largest battery shows the best energetic performance
whereas the traditional air-to-water heat pump + PVs without any battery shows the best economic savings. This
demonstrates that each cost used in the economic analysis, both capital cost and operating cost, has to be carefully
defined.
Responsible
Dipartimento di Energia, Politecnico di Milano, Italy
Simonetti, R., Moretti, L., Molinaroli, L., Manzolini, G., Energetic and economic optimization of the yearly
performance of three different solar assisted heat pump systems using a mixed integer linear programming
algorithm. Energy Conversion and Management 206 (2020), 112446,
https://doi.org/10.1016/j.enconman.2019.112446
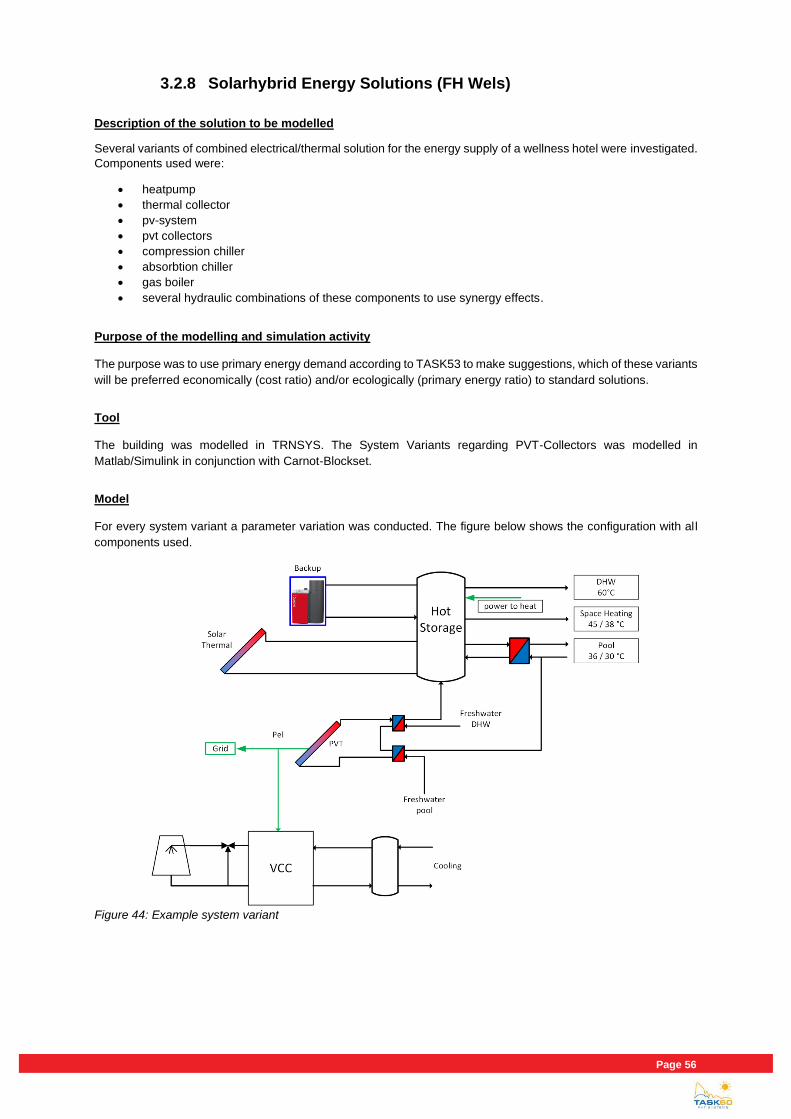
Page 56 RStat
3.2.8 Solarhybrid Energy Solutions (FH Wels)
Description of the solution to be modelled
Several variants of combined electrical/thermal solution for the energy supply of a wellness hotel were investigated.
Components used were:
• heatpump
• thermal collector
• pv-system
• pvt collectors
• compression chiller
• absorbtion chiller
• gas boiler
• several hydraulic combinations of these components to use synergy effects.
Purpose of the modelling and simulation activity
The purpose was to use primary energy demand according to TASK53 to make suggestions, which of these variants
will be preferred economically (cost ratio) and/or ecologically (primary energy ratio) to standard solutions.
Tool
The building was modelled in TRNSYS. The System Variants regarding PVT-Collectors was modelled in
Matlab/Simulink in conjunction with Carnot-Blockset.
Model
For every system variant a parameter variation was conducted. The figure below shows the configuration with all
components used.
Figure 44: Example system variant
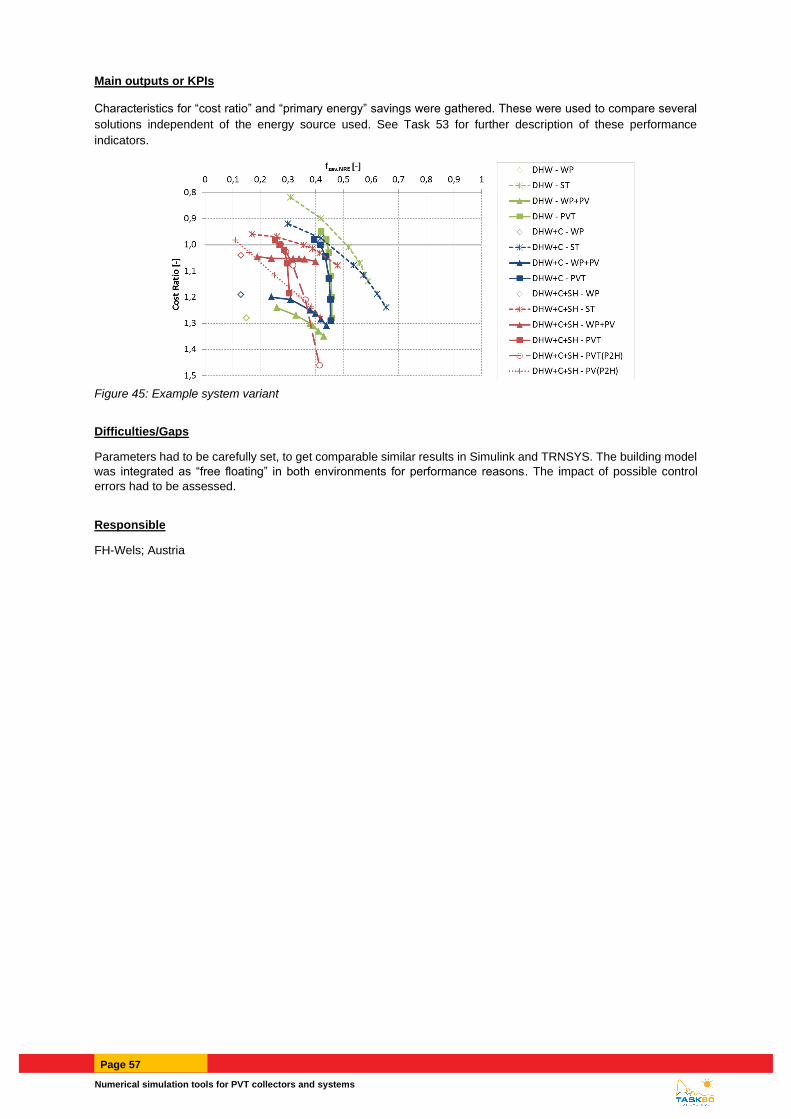
Numerical simulation tools for PVT collectors and systems
Page 57
Main outputs or KPIs
Characteristics for “cost ratio” and “primary energy” savings were gathered. These were used to compare several
solutions independent of the energy source used. See Task 53 for further description of these performance
indicators.
Figure 45: Example system variant
Difficulties/Gaps
Parameters had to be carefully set, to get comparable similar results in Simulink and TRNSYS. The building model
was integrated as “free floating” in both environments for performance reasons. The impact of possible control
errors had to be assessed.
Responsible
FH-Wels; Austria
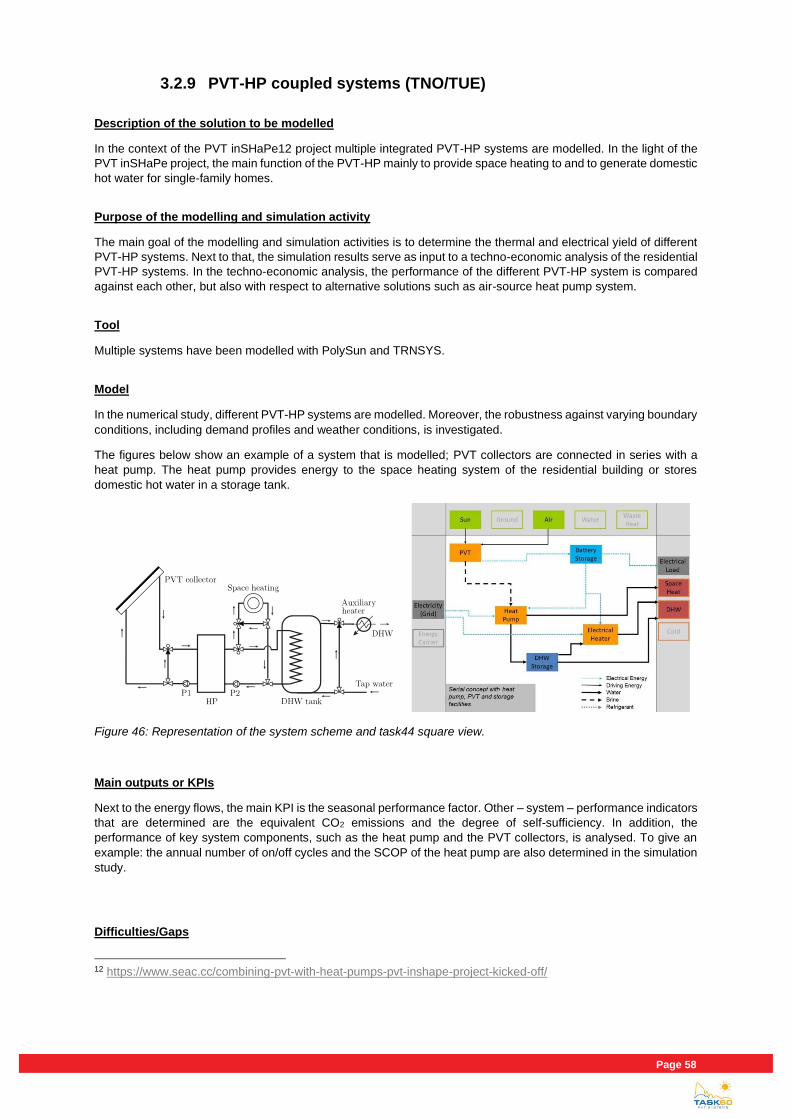
Page 58 RStat
3.2.9 PVT-HP coupled systems (TNO/TUE)
Description of the solution to be modelled
In the context of the PVT inSHaPe12 project multiple integrated PVT-HP systems are modelled. In the light of the
PVT inSHaPe project, the main function of the PVT-HP mainly to provide space heating to and to generate domestic
hot water for single-family homes.
Purpose of the modelling and simulation activity
The main goal of the modelling and simulation activities is to determine the thermal and electrical yield of different
PVT-HP systems. Next to that, the simulation results serve as input to a techno-economic analysis of the residential
PVT-HP systems. In the techno-economic analysis, the performance of the different PVT-HP system is compared
against each other, but also with respect to alternative solutions such as air-source heat pump system.
Tool
Multiple systems have been modelled with PolySun and TRNSYS.
Model
In the numerical study, different PVT-HP systems are modelled. Moreover, the robustness against varying boundary
conditions, including demand profiles and weather conditions, is investigated.
The figures below show an example of a system that is modelled; PVT collectors are connected in series with a
heat pump. The heat pump provides energy to the space heating system of the residential building or stores
domestic hot water in a storage tank.
Figure 46: Representation of the system scheme and task44 square view.
Main outputs or KPIs
Next to the energy flows, the main KPI is the seasonal performance factor. Other – system – performance indicators
that are determined are the equivalent CO2 emissions and the degree of self-sufficiency. In addition, the
performance of key system components, such as the heat pump and the PVT collectors, is analysed. To give an
example: the annual number of on/off cycles and the SCOP of the heat pump are also determined in the simulation
study.
Difficulties/Gaps
12 https://www.seac.cc/combining-pvt-with-heat-pumps-pvt-inshape-project-kicked-off/

Numerical simulation tools for PVT collectors and systems
Page 59
One of the difficulties when using TRNSYS is that there is a lack of input data for the heat pump performance. When
combined with a PVT collector, the operating temperatures at the source side of the heat pump may drop to
temperatures below zero. At these conditions, the HP performance is often unknown. The second key issue is also
related to the heat pump performance. As far as known, there is no model of a modulating heat pump available in
TRNSYS. The lack of heat pump performance data hinders the assessment of state-of-the-art heat pumps and thus
PVT-HP systems.
Responsible
The measurement and modelling activities are performed in the context of the PVT inSHaPe project. In this project,
a broad consortium of partners, including the Eindhoven University of Technology (TU/e) and the Solar Energy
Application Centre (SEAC NL), work together to analyse, design and optimize PVT-HP system concepts.
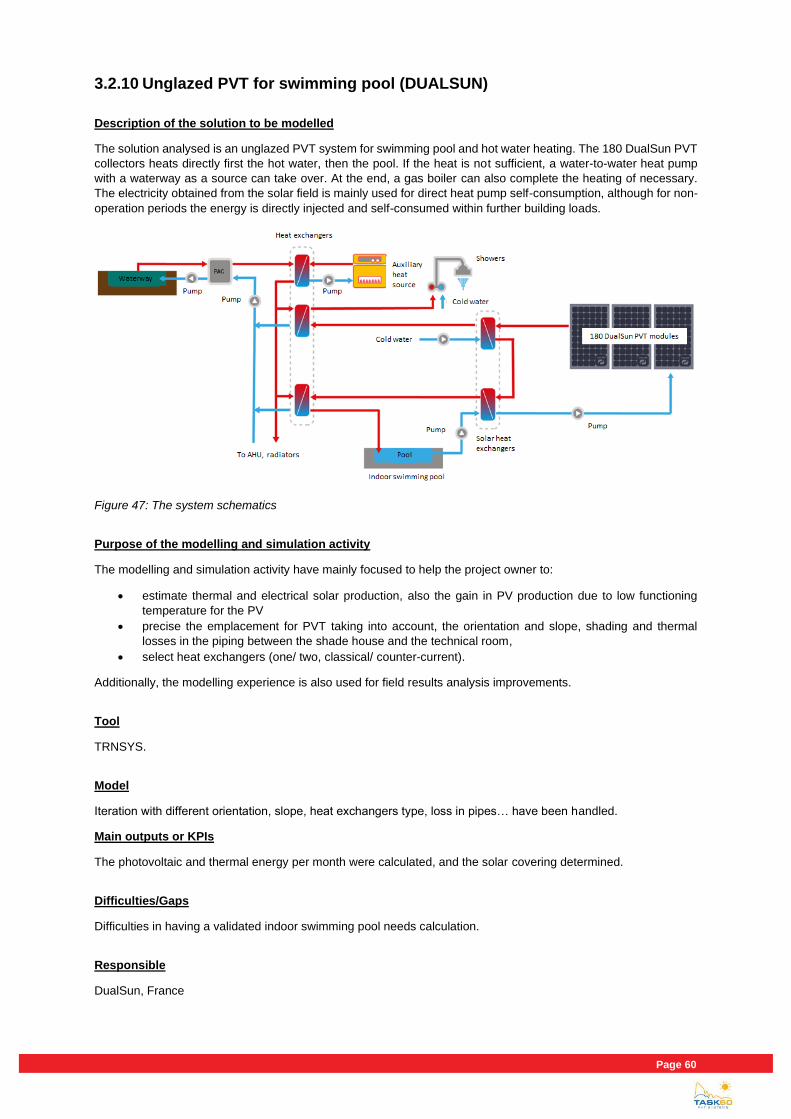
Page 60 RStat
3.2.10 Unglazed PVT for swimming pool (DUALSUN)
Description of the solution to be modelled
The solution analysed is an unglazed PVT system for swimming pool and hot water heating. The 180 DualSun PVT
collectors heats directly first the hot water, then the pool. If the heat is not sufficient, a water-to-water heat pump
with a waterway as a source can take over. At the end, a gas boiler can also complete the heating of necessary.
The electricity obtained from the solar field is mainly used for direct heat pump self-consumption, although for non-
operation periods the energy is directly injected and self-consumed within further building loads.
Figure 47: The system schematics
Purpose of the modelling and simulation activity
The modelling and simulation activity have mainly focused to help the project owner to:
• estimate thermal and electrical solar production, also the gain in PV production due to low functioning
temperature for the PV
• precise the emplacement for PVT taking into account, the orientation and slope, shading and thermal
losses in the piping between the shade house and the technical room,
• select heat exchangers (one/ two, classical/ counter-current).
Additionally, the modelling experience is also used for field results analysis improvements.
Tool
TRNSYS.
Model
Iteration with different orientation, slope, heat exchangers type, loss in pipes… have been handled.
Main outputs or KPIs
The photovoltaic and thermal energy per month were calculated, and the solar covering determined.
Difficulties/Gaps
Difficulties in having a validated indoor swimming pool needs calculation.
Responsible
DualSun, France
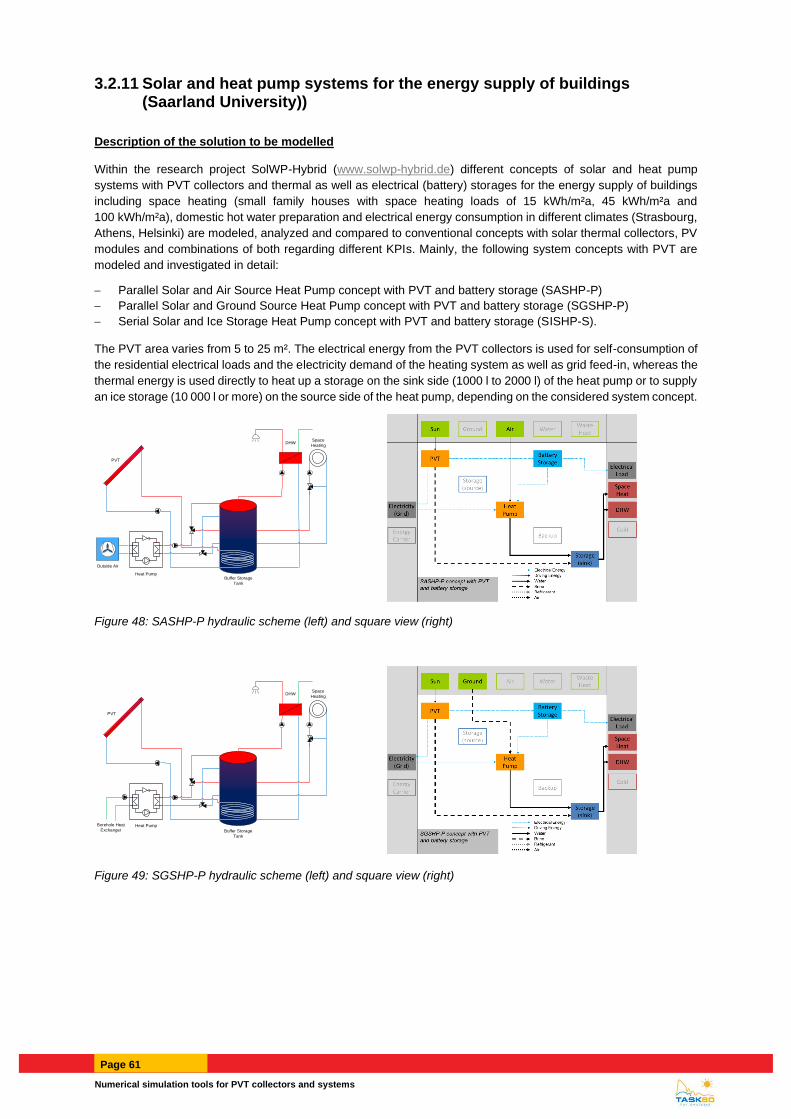
Numerical simulation tools for PVT collectors and systems
Page 61
3.2.11 Solar and heat pump systems for the energy supply of buildings (Saarland University))
Description of the solution to be modelled
Within the research project SolWP-Hybrid (www.solwp-hybrid.de) different concepts of solar and heat pump
systems with PVT collectors and thermal as well as electrical (battery) storages for the energy supply of buildings
including space heating (small family houses with space heating loads of 15 kWh/m²a, 45 kWh/m²a and
100 kWh/m²a), domestic hot water preparation and electrical energy consumption in different climates (Strasbourg,
Athens, Helsinki) are modeled, analyzed and compared to conventional concepts with solar thermal collectors, PV
modules and combinations of both regarding different KPIs. Mainly, the following system concepts with PVT are
modeled and investigated in detail:
− Parallel Solar and Air Source Heat Pump concept with PVT and battery storage (SASHP-P)
− Parallel Solar and Ground Source Heat Pump concept with PVT and battery storage (SGSHP-P)
− Serial Solar and Ice Storage Heat Pump concept with PVT and battery storage (SISHP-S).
The PVT area varies from 5 to 25 m². The electrical energy from the PVT collectors is used for self-consumption of
the residential electrical loads and the electricity demand of the heating system as well as grid feed-in, whereas the
thermal energy is used directly to heat up a storage on the sink side (1000 l to 2000 l) of the heat pump or to supply
an ice storage (10 000 l or more) on the source side of the heat pump, depending on the considered system concept.
Figure 48: SASHP-P hydraulic scheme (left) and square view (right)
Figure 49: SGSHP-P hydraulic scheme (left) and square view (right)
Buffer Storage
Tank
PVT
DHWSpace
Heating
Heat Pump
Outside Air
Buffer Storage
Tank
Heat Pump
DHWSpace
Heating
Borehole Heat
Exchanger
PVT
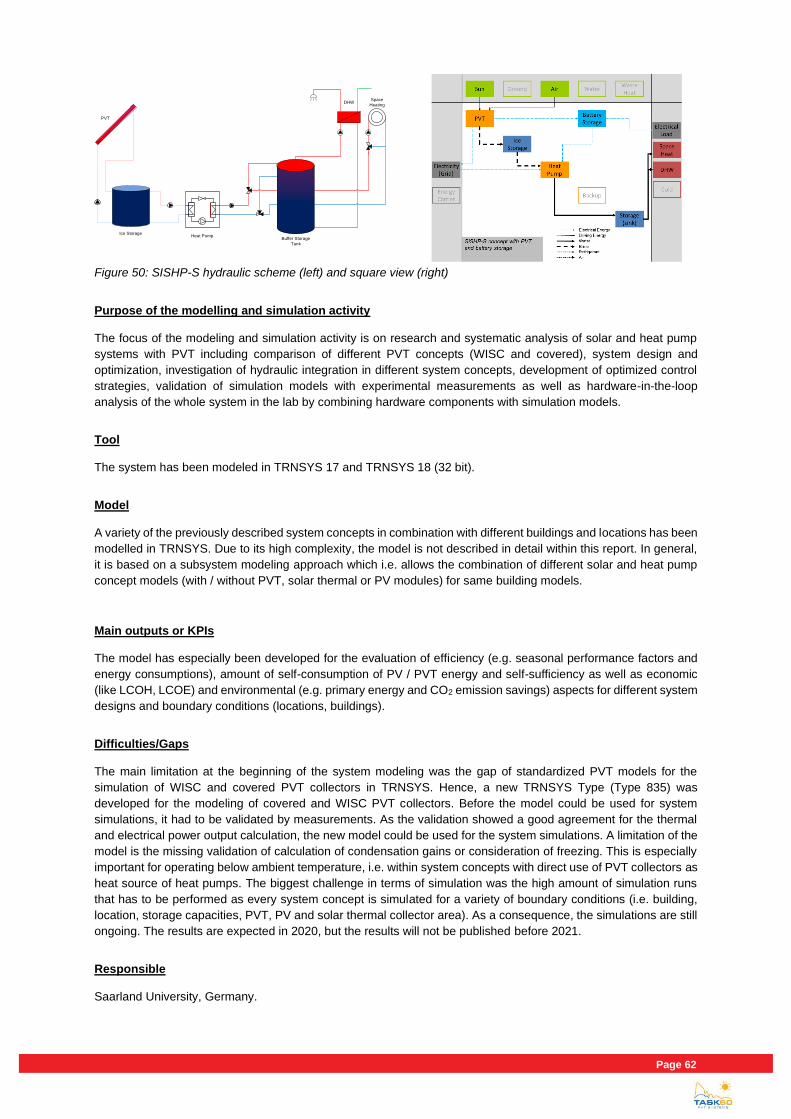
Page 62 RStat
Figure 50: SISHP-S hydraulic scheme (left) and square view (right)
Purpose of the modelling and simulation activity
The focus of the modeling and simulation activity is on research and systematic analysis of solar and heat pump
systems with PVT including comparison of different PVT concepts (WISC and covered), system design and
optimization, investigation of hydraulic integration in different system concepts, development of optimized control
strategies, validation of simulation models with experimental measurements as well as hardware-in-the-loop
analysis of the whole system in the lab by combining hardware components with simulation models.
Tool
The system has been modeled in TRNSYS 17 and TRNSYS 18 (32 bit).
Model
A variety of the previously described system concepts in combination with different buildings and locations has been
modelled in TRNSYS. Due to its high complexity, the model is not described in detail within this report. In general,
it is based on a subsystem modeling approach which i.e. allows the combination of different solar and heat pump
concept models (with / without PVT, solar thermal or PV modules) for same building models.
Main outputs or KPIs
The model has especially been developed for the evaluation of efficiency (e.g. seasonal performance factors and
energy consumptions), amount of self-consumption of PV / PVT energy and self-sufficiency as well as economic
(like LCOH, LCOE) and environmental (e.g. primary energy and CO2 emission savings) aspects for different system
designs and boundary conditions (locations, buildings).
Difficulties/Gaps
The main limitation at the beginning of the system modeling was the gap of standardized PVT models for the
simulation of WISC and covered PVT collectors in TRNSYS. Hence, a new TRNSYS Type (Type 835) was
developed for the modeling of covered and WISC PVT collectors. Before the model could be used for system
simulations, it had to be validated by measurements. As the validation showed a good agreement for the thermal
and electrical power output calculation, the new model could be used for the system simulations. A limitation of the
model is the missing validation of calculation of condensation gains or consideration of freezing. This is especially
important for operating below ambient temperature, i.e. within system concepts with direct use of PVT collectors as
heat source of heat pumps. The biggest challenge in terms of simulation was the high amount of simulation runs
that has to be performed as every system concept is simulated for a variety of boundary conditions (i.e. building,
location, storage capacities, PVT, PV and solar thermal collector area). As a consequence, the simulations are still
ongoing. The results are expected in 2020, but the results will not be published before 2021.
Responsible
Saarland University, Germany.
Ice Storage
Buffer Storage
Tank
Heat Pump
DHWSpace
Heating
PVT
Numerical simulation tools for PVT collectors and systems
Page 63
4 Conclusions
The numerical simulation tools that the community is currently using for PVT collectors and systems modelling have
been gathered. Two main environments have been reported, TRNSYS and Polysun, specifically designed for yearly
basis system level energy performance determination. Furthermore, the experience with some general-purpose
tools have also been collected. These environments are more generic and might not be originally prepared for
energy solutions transient analysis, but offer interesting features for component (collector, control strategies, etc.)
or system partial analysis. Additionally, the experience of the community with these tools has also been reported
by means of case studies. Up to 24 different modelling examples are included, 13 for module and 11 for system
level.
The performance and features of the current tools present a difference between the user expectations and real
experience. These modelling and simulation gaps have been analysed. At collector level the outcomes are included
in report B1. For systems 4 main difficulties have been identified.
• Components parameterization is not an easy task. Additional tuning labour is frequently required for
matching simulation results with real performance figures. There are few library components for some not
common applications. For some components, such us heat pumps, there is a great difference between
datasheet information and model parameters.
• Combination of components. The operation of components out of their conventional and known range
could lead to poor results, quite common for heat pump coupled collector systems. Additionally, there is a
great difficulty to quantify smart control strategies real impact.
• Reliable boundaries, especially when determining load profiles and meteorological data.
• High sensitivity of environmental and economic key performance indicators.
Finally, a useful guideline for PVT collector model parameterization is included, as a link between normative
coefficients and numerical tools.
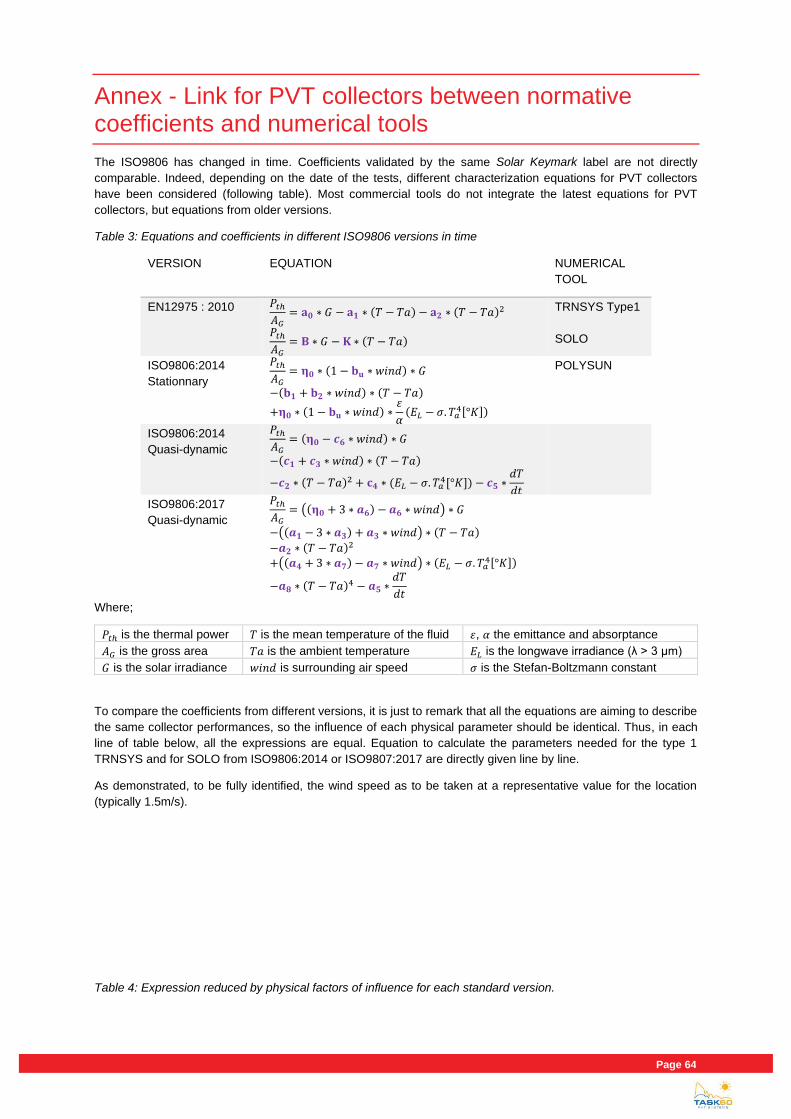
Page 64 RStat
Annex - Link for PVT collectors between normative coefficients and numerical tools
The ISO9806 has changed in time. Coefficients validated by the same Solar Keymark label are not directly
comparable. Indeed, depending on the date of the tests, different characterization equations for PVT collectors
have been considered (following table). Most commercial tools do not integrate the latest equations for PVT
collectors, but equations from older versions.
Table 3: Equations and coefficients in different ISO9806 versions in time
VERSION EQUATION NUMERICAL
TOOL
EN12975 : 2010 𝑃𝑡ℎ
𝐴𝐺= 𝐚𝟎 ∗ 𝐺 − 𝐚𝟏 ∗ (𝑇 − 𝑇𝑎) − 𝐚𝟐 ∗ (𝑇 − 𝑇𝑎)2
𝑃𝑡ℎ
𝐴𝐺= 𝐁 ∗ 𝐺 − 𝐊 ∗ (𝑇 − 𝑇𝑎)
TRNSYS Type1
SOLO
ISO9806:2014
Stationnary
𝑃𝑡ℎ
𝐴𝐺= 𝛈𝟎 ∗ (1 − 𝐛𝐮 ∗ 𝑤𝑖𝑛𝑑) ∗ 𝐺
−(𝐛𝟏 + 𝐛𝟐 ∗ 𝑤𝑖𝑛𝑑) ∗ (𝑇 − 𝑇𝑎)
+𝛈𝟎 ∗ (1 − 𝐛𝐮 ∗ 𝑤𝑖𝑛𝑑) ∗𝜀
𝛼(𝐸𝐿 − 𝜎. 𝑇𝑎
4[°𝐾])
POLYSUN
ISO9806:2014
Quasi-dynamic
𝑃𝑡ℎ
𝐴𝐺= (𝛈𝟎 − 𝒄𝟔 ∗ 𝑤𝑖𝑛𝑑) ∗ 𝐺
−(𝒄𝟏 + 𝒄𝟑 ∗ 𝑤𝑖𝑛𝑑) ∗ (𝑇 − 𝑇𝑎)
−𝒄𝟐 ∗ (𝑇 − 𝑇𝑎)2 + 𝐜𝟒 ∗ (𝐸𝐿 − 𝜎. 𝑇𝑎4[°𝐾]) − 𝒄𝟓 ∗
𝑑𝑇
𝑑𝑡
ISO9806:2017
Quasi-dynamic
𝑃𝑡ℎ
𝐴𝐺= ((𝛈𝟎 + 3 ∗ 𝒂𝟔) − 𝒂𝟔 ∗ 𝑤𝑖𝑛𝑑) ∗ 𝐺
−((𝒂𝟏 − 3 ∗ 𝒂𝟑) + 𝒂𝟑 ∗ 𝑤𝑖𝑛𝑑) ∗ (𝑇 − 𝑇𝑎)
−𝒂𝟐 ∗ (𝑇 − 𝑇𝑎)2
+((𝒂𝟒 + 3 ∗ 𝒂𝟕) − 𝒂𝟕 ∗ 𝑤𝑖𝑛𝑑) ∗ (𝐸𝐿 − 𝜎. 𝑇𝑎4[°𝐾])
−𝒂𝟖 ∗ (𝑇 − 𝑇𝑎)4 − 𝒂𝟓 ∗𝑑𝑇
𝑑𝑡
Where;
𝑃𝑡ℎ is the thermal power 𝑇 is the mean temperature of the fluid 𝜀, 𝛼 the emittance and absorptance
𝐴𝐺 is the gross area 𝑇𝑎 is the ambient temperature 𝐸𝐿 is the longwave irradiance (λ > 3 μm)
𝐺 is the solar irradiance 𝑤𝑖𝑛𝑑 is surrounding air speed 𝜎 is the Stefan-Boltzmann constant
To compare the coefficients from different versions, it is just to remark that all the equations are aiming to describe
the same collector performances, so the influence of each physical parameter should be identical. Thus, in each
line of table below, all the expressions are equal. Equation to calculate the parameters needed for the type 1
TRNSYS and for SOLO from ISO9806:2014 or ISO9807:2017 are directly given line by line.
As demonstrated, to be fully identified, the wind speed as to be taken at a representative value for the location
(typically 1.5m/s).
Table 4: Expression reduced by physical factors of influence for each standard version.
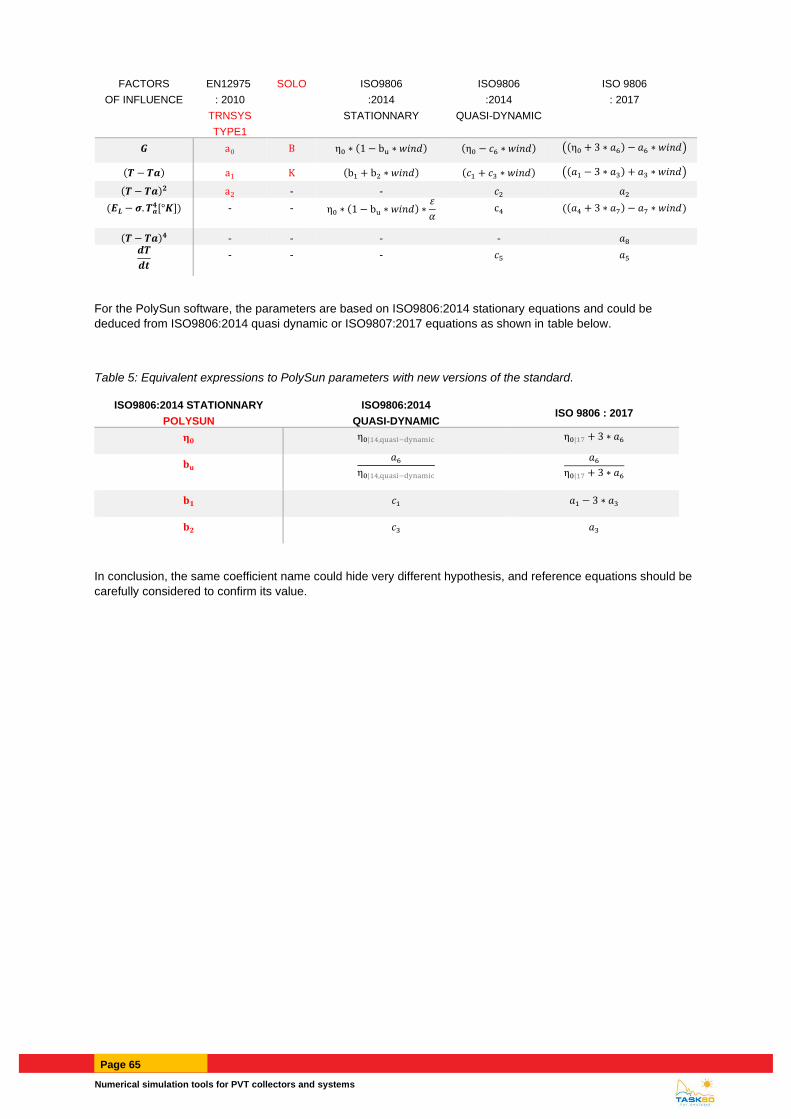
Numerical simulation tools for PVT collectors and systems
Page 65
FACTORS
OF INFLUENCE
EN12975
: 2010
TRNSYS
TYPE1
SOLO ISO9806
:2014
STATIONNARY
ISO9806
:2014
QUASI-DYNAMIC
ISO 9806
: 2017
𝑮 a0 B η0 ∗ (1 − bu ∗ 𝑤𝑖𝑛𝑑) (η0 − 𝑐6 ∗ 𝑤𝑖𝑛𝑑) ((η0 + 3 ∗ 𝑎6) − 𝑎6 ∗ 𝑤𝑖𝑛𝑑)
(𝑻 − 𝑻𝒂) a1 K (b1 + b2 ∗ 𝑤𝑖𝑛𝑑) (𝑐1 + 𝑐3 ∗ 𝑤𝑖𝑛𝑑) ((𝑎1 − 3 ∗ 𝑎3) + 𝑎3 ∗ 𝑤𝑖𝑛𝑑)
(𝑻 − 𝑻𝒂)𝟐 a2 - - 𝑐2 𝑎2
(𝑬𝑳 − 𝝈. 𝑻𝒂𝟒[°𝑲]) - - η0 ∗ (1 − bu ∗ 𝑤𝑖𝑛𝑑) ∗
𝜀
𝛼 c4 ((𝑎4 + 3 ∗ 𝑎7) − 𝑎7 ∗ 𝑤𝑖𝑛𝑑)
(𝑻 − 𝑻𝒂)𝟒 - - - - 𝑎8 𝒅𝑻
𝒅𝒕 - - - 𝑐5 𝑎5
For the PolySun software, the parameters are based on ISO9806:2014 stationary equations and could be
deduced from ISO9806:2014 quasi dynamic or ISO9807:2017 equations as shown in table below.
Table 5: Equivalent expressions to PolySun parameters with new versions of the standard.
ISO9806:2014 STATIONNARY
POLYSUN
ISO9806:2014
QUASI-DYNAMIC ISO 9806 : 2017
𝛈𝟎 η0|14,quasi−dynamic η0|17 + 3 ∗ 𝑎6
𝐛𝐮 𝑎6
η0|14,quasi−dynamic
𝑎6
η0|17 + 3 ∗ 𝑎6
𝐛𝟏 𝑐1 𝑎1 − 3 ∗ 𝑎3
𝐛𝟐 𝑐3 𝑎3
In conclusion, the same coefficient name could hide very different hypothesis, and reference equations should be
carefully considered to confirm its value.


![Untitled Document [task23.iea-shc.org]task23.iea-shc.org/data/sites/1/publications/MCDM_user... · 2009. 12. 3. · Title: Untitled Document Created Date: 0-01-01T00:00:00Z](https://img.pdfslide.net/doc/110x75/5fe561702f2dfb2397726e32/untitled-document-2009-12-3-title-untitled-document-created-date-0-01-01t000000z.jpg)