Embed Size (px)
Citation preview

pwc.com.au
Private Sector National Hospital Cost Data Collection
Cost ReportRound 17 (2012-2013)Overnight Private Hospitals
17 December 2014
DRG Version: AR-DRG 6.0x
‘

List of abbreviations
Abbreviation Description
AHPCS Australian Hospital Patient Costing Standards
AIHW Australian Institute of Health and Welfare
ALOS Average length of stay
AR-DRG Australian refined diagnosis related group
CM Cost modelled
DoHA Department of Health and Ageing
DRG Diagnosis related group
IHPA Independent Hospital Pricing Authority
LOS Length of stay
MDC Major diagnostic category
NHCDC National hospital cost data collection
NHDD National Health Data Dictionary
PC Patient costed
PHDB Private Hospital Data Bureau
PwC PricewaterhouseCoopers Australia
SPS Specialist procedure suites
falseOvernight Private Hospitalsi1Prospect nameiProspect namei

Contents
List of abbreviations i
Contents 1
1 Executive Summary 4
1.1 Purpose of this report4
1.2 Background to the Private Sector NHCDC4
1.3 Reporting format4
2 Introduction 7
2.1 Purpose of this report7
2.2 Format of the report7
2.4 History of the Private Sector NHCDC9
2.5 Public and private sector differences10
2.6 Confidentiality of data10
2.7 Reliances and limitations10
3 Methodology 12
3.1 Identifying the minimum sample size12
3.2 Costing methodologies12
3.3 Stages and Phases of the private sector NHCDC13
3.6 Analysis and reporting16
4 Summary of results 18
4.1 Summary of Round 17 Sample to Population18
4.2 Comparison of cost-bucket break-down to Round 1619
Overnight Private HospitalsProspect nameProspect name

4.3 DRG Analysis20
Appendix A Glossary of NHCDC terms 39
Appendix B Analysis performed to determine the minimum sample size 43
Appendix C Further detail on the costing process 45
Stage 1 – The data collection phase 45
Stage 2 – Pre-costing checks and review 46
Stage 3 – Costing 46
Appendix D Standard error range, Round 17 Private sector 51
Appendix E Costs included in the cost buckets 53
Appendix F Cost weight tables by DRG 55
Overnight Private HospitalsProspect nameProspect name

This Report has been prepared by PricewaterhouseCoopers Australia (PwC) at the request of IHPA in our capacity as advisors in accordance with the Terms of Reference and Terms and Conditions contained in the contract between IHPA and PwC.
This document is not intended to be used or relied upon by any persons other than IHPA, nor to be used for any purpose other than that articulated in the Terms of Reference. PwC accept no responsibility in any way whatsoever for the use of this report by any other persons or for any other purpose.
Accordingly, whilst the statements made in this report are given in good faith, PwC accept no responsibility for any errors in the information provided to us nor the effect of any such errors on our analysis, suggestions or report.
Overnight Private HospitalsProspect nameProspect name

Executive Summary
1 Executive Summary1.1 Purpose of this reportThe private sector National Hospital Cost Data Collection (NHCDC) is a voluntary collection that produces a range of hospital cost and activity information by Australian Refined Diagnosis Related Groups (AR-DRG or DRG). PricewaterhouseCoopers Australia (PwC) were engaged by the Independent Hospital Pricing Authority (IHPA) to provide the collection, processing and reporting of services in relation to Round 17 (12 months ending 30 June 2013) of the NHCDC for acute admitted care provided by overnight private hospitals.
This report documents the data, processes, methodology and results for acute admitted care1 provided by overnight private hospitals. The scope of the collection is in relation to those hospitals with at least 200 acute admitted separations in the 2012-13 financial year. Emergency department costs are excluded.
1.2 Background to the Private Sector NHCDC
The first Australian national private sector cost study was conducted as part of the 1991-92 National Cost Study. 29 private sector facilities were involved in this initial study which evolved to become the National Hospital Cost Data Collection (NHCDC). Its objective is to provide Australian governments and the health care industry with a nationally consistent method of costing all types of hospital activity and publishing meaningful results which are used for benchmarking, funding and planning hospital based services.
Round 1 commenced in 1996-97 with voluntary participation for both the private and public sector. The private sector collection has grown steadily in representation from the initial 23 hospitals and 240,000 episodes in Round 1. Since the first round, there have been a number of years where no publication was released due to the Commonwealth deciding that the low participation rates in these rounds created an unacceptable risk of invalid or unreliable results or bypassed as agreed with the sector. The last two publications were for Round 16 (2011-12) and Round 13 (2008-09).
While there are a variety of additional data sets on private hospital sector activity, such as Hospital Casemix Protocol (HCP), Private Hospital Data Bureau (PHDB), National Admitted Patient Collection (APC), and Private Health Establishments Collection (PHE) – the Private Sector NHCDC is unique insofar as it reports on the costs of service by classified activity.
1.3 Reporting formatPrior to Round 16, the DRG-level information showed average costs by DRG, split by direct and overhead, and for seventeen cost buckets. As part of the Round 16 publication, it was agreed with private hospital representatives that the DRG-level information would be restricted to the publication of total cost weights, and cost weights for a selection of grouped cost buckets (Operating Room & Specialist Procedure Suites, Critical Care, and other cost buckets grouped into a category called “Miscellaneous”). For Round 17, as discussed and agreed with private hospital representatives, the public report in Round 17 has been expanded to show the cost weights for prostheses separately.
1 Section 3.6 describes how acute admitted separations have been identified.
Overnight Private HospitalsProspect nameProspect name

Executive Summary
1.4 Key findings and features of the Round 17 Sample
This year’s sample consisted of 95 hospitals and represented 60% of the separations in the population. Across the sample the total acute admitted separations was 1.65 million, which is a decrease of 7% compared to Round 16 last year. The average length of stay of the sample increased from 2.51 days to 2.53 days for Round 17. Additionally, six of the top 20 DRGs with the highest cost weight were neonate DRGs. The ranking of the top 20 DRGs that are estimated to consume the most resources by private hospitals (defined as the top 20 cost-weighted separation DRGs) have remained consistent since Round 16.
In Round 17 there were changes in the rankings of DRGs with the highest cost weights. These changes are likely due to the use of feeder data by many hospitals this year. Prosthetics and critical care costs were in many cases allocated directly from feeder data in this Round instead of service weights in Round 16. Since the service weights are based on public sector results, and there are many differences between private and public sector cost results and practices, the use of the feeder data is more likely to lead to DRG cost weights that are more reflective of the private sector in the current round.
In 2012/13, the DRG with the highest cost weight of 50.39 was DRG P61Z “Neonate, AdmWt <750 g”. The average length of stay for this DRG was 84 days. The DRG with the highest number of separations (population-adjusted) of 207,697 was R63Z “Chemotherapy”. This DRG has a low cost-weight (0.21) and the average length of stay was 1.2 days. The DRG that accounted for the highest proportion of hospital costs was I04B “Knee Replacement W/O Catastrophic or Severe CC”. There were 24,615 separations (population-adjusted) with this DRG. The cost weight for this DRG is 5.5 and the average length of stay is 5.7 days. The table below illustrates the top five AR-DRGs in regards to cost weight, volume and level of consumption.
Table 1 AR-DRG Rankings
Rank
DRG Description CostWeight
Number of Seps
Cost Weighted
Seps
ALOS
DRGs with the highest cost-weight1 P61Z Neonate, AdmWt <750 g 50.39 21 1,065 84.0
2 A06A Tracheostomy W Ventilation >95 hours W Catastrophic CC
43.27 277 11,989 52.5
3 P62Z Neonate, AdmWt 750-999 g 39.45 41 1,614 64.8
4 F01A Implantation or Replacement of AICD, Total System W Catastrophic CC
28.76 300 8,621 7.6
5 P06A Neonate, AdmWt >2499 g W Significant OR Procedure W Multi Major Problems
27.69 28 788 36.6
DRGs with the highest number of separations1 R63Z Chemotherapy 0.21 207,697 44,363 1.2
2 G48C Colonoscopy, Sameday 0.21 110,786 23,341 1.1
3 L61Z Haemodialysis 0.12 105,160 12,105 1.0
4 Z40Z Endoscopy W Diagnoses of Other Contacts W Health Services, Sameday
0.19 78,499 14,603 1.1
5 Z64B Other Factors Influencing 0.20 72,613 14,235 1.2
Overnight Private HospitalsPwC

Executive Summary
Rank
DRG Description CostWeight
Number of Seps
Cost Weighted
Seps
ALOS
Health Status, Sameday
DRGs with the highest number of cost-weighted separations*1 I04B Knee Replacement W/O
Catastrophic or Severe CC5.50 24,615 135,355 5.7
2 I03B Hip Replacement W/O Catastrophic CC
6.54 18,684 122,186 6.0
3 I09B Spinal Fusion W/O Catastrophic CC
8.35 9,801 81,805 6.1
4 F01B Implantation or Replacement of AICD, Total System W/O Catastrophic CC
23.46 2,268 53,217 2.2
5 O01C Caesarean Delivery W/O Catastrophic or Severe CC
1.67 29,303 48,914 4.8
Notesa) See the Glossary in Appendix Ab) “Number of seps” means the number of separations in 2012/13, population adjusted. c) See the Glossary in Appendix Ad) ALOS means “Average length of stay”* Cost-weighted separations calculated as number of separations times the cost weight for the DRG shown. Reflects relative resource consumption.
Overnight Private HospitalsPwC

Introduction
2 Introduction2.1 Purpose of this reportThe private sector National Hospital Cost Data Collection (NHCDC) is a voluntary collection that produces a range of hospital cost and activity information by Australian Refined Diagnosis Related Groups (AR-DRG or DRG). The AR-DRG code is a patient classification scheme that provides a means of relating the number and types of patients treated in a hospital to the resources required by the hospital2. An individual AR-DRG represents a class of patients with similar clinical conditions that require similar hospital services. This report documents the data, processes, methodology and results for acute admitted care3 provided by overnight private hospitals. The results of the collection are expressed as national cost weights by AR-DRG version 6.0x, and associated analytical tables.
2.2 Format of the report In 2012 a series of consultations were conducted to determine the views of the private sector around publication options for the NHCDC. These consultations were in the form of workshops and undertaken with key informants from the private hospital sector and peak bodies.
Consultation with the sector highlighted concern with commercial sensitivity of the published data, in particular the perceived negative impact it may have on negotiations with private health insurers. These concerns impacted on sector participation in the past and it was recommended that future publication be amended from Round 16 (2011-12) onwards.
Addressing these concerns, IHPA communicated to the private sector that the private NHCDC results would contain materially reduced detail. The Round 17 publication would only include DRG information, cost weights and other cost relativities. The report would no longer contain the seventeen cost components, direct and overhead cost breakdowns or the total average cost of the DRG.
Specifically, this report contains the Round 17 private sector national cost weights by AR-DRG 6.0x. A “cost weight” for a selected DRG is calculated as the average cost for that DRG, expressed as a weight relative to the overall average cost across all DRGs. The national cost weight across all DRGs is equal to 1.00, with higher cost DRGs having a cost weight higher than 1.00 (e.g. A06A: Tracheostomy W Ventilation >95 Hours W Catastrophic Cc with a cost weight of 43.1), and lower cost DRGs having a cost weight lower than 1.00 (e.g. J67B Minor Skin Disorders, Same day with a cost weight of 0.20).
As discussed and agreed with private hospital representatives, this report has been expanded to separate prosthesis costs into a separate bucket. DRG information will now be displayed in the following 5 cost weight buckets:
Total cost per AR-DRG;
The combined costs of Operating Room and Specialist Procedure Suites (“SPS”);
2 DOHA (Department of Health and Ageing) 2011, Data Definitions Manual 3 Section 3.6 describes how acute admitted separations have been identified.
Overnight Private HospitalsProspect nameProspect name

Introduction
Critical Care, which covers costs incurred in both intensive and coronary care units;
Prostheses; and
Miscellaneous, which combines the costs of Ward Medical, Ward Nursing, Non-clinical salaries, Pathology, Imaging, Allied Health, Pharmacy, Depreciation, On-costs, Hotel and Supplies.
2.3 Scope of this collectionThe scope of the collection is all acute-admitted separations with a discharge date in 2012/13, performed at private overnight hospitals with at least 200 acute admitted separations in 2012/13. This defines the population from which the sample is drawn. Emergency department costs are excluded.
Admitted episodes of care in hospitals are classified according to a data element called a “Care Type”, which is defined in the AIHW National Health Data Dictionary. 4 The care types are acute care (admitted care), rehabilitation care (admitted care), palliative care, geriatric evaluation and management, psychogeriatric care, maintenance care, newborn care, other admitted patient care, organ procurement - posthumous (other care) and hospital boarder (other care)
Acute admitted care (including newborn care) consumes the vast majority of hospital resources. In 2012/13, 93% of separations and 86% of patient days relate to acute admitted care in the private sector, and 96% of separations and 82% of patient days in the public sector.5
Separations are defined as in or out of scope based on three variables – the date of discharge for the separation, the care type of the separation, and a non-missing DRG.
Care type:
The costs and separations associated with acute admitted care and newborn care with qualified care days are included in the calculation of the DRG-level cost weights. The costs associated with unqualified neonate separations6 have been included in the costs of care on an adjusted basis: the costs of care have been allocated back to the delivery DRGs of the birth-giving mothers and the counts of the care type newborn care, with zero qualified care days, have been removed. This approach is consistent with other forms of national reporting on acute admitted care by the Australian Institute of Health and Welfare, and it is consistent with the treatment of acute admitted and neonate care in the National Efficient Price determination7. A further discussion of the treatment of neonate separations and costs is provided in Section 3.6;
Discharge date:
4 e.g. refer to the 15th edition5 Australian Institute of Health and Welfare (AIHW), Australian Hospital Statistics 2010-11, Cat No, HSE117.6 These are separations with care type 7.0 (new born care), with zero qualified days in the neonate DRGs (Major
Diagnostic Category 15 newborns and other neonates)7 E.g. refer to Table 3 of IHPA’s “Technical Specifications 2014–15 National Pricing Model” Version 1.0
February 2014
Overnight Private HospitalsPwC

Introduction
Separations discharged in the financial year 1 July 2012 to 30 June 2013 are included. There were a small number of costed separations reported by one of the self-costed hospitals, with a discharge date of 30 June 2012. These separations were removed from the calculation of the DRG cost weights;
Non-missing DRG:
Thirteen separations from one of the self-costed hospitals had a missing DRG. These separations were removed prior to the calculation of cost weights.
The costs in-scope associated with patient care are specified in the Australian Hospital Patient Costing Standards v2.0 – 1 March 2011 (“AHPCS v2.0”).8 These costs are defined as “all expenditure incurred by or on behalf of the hospital related to day to day delivery of services”9. This includes an allocation of costs that could be incurred outside the hospital but relate to the delivery of services (e.g. shared service functions). The standards also discuss the types of costs that are excluded from patient costing, such as commercial business entities that might include activities such as operating a retail florist business, commercial parking, and child care centres. Hospitals were requested to submit costs that comply with the AHPCS v2.0 to support consistency in the input data used to calculate the cost weights.
Some of the self-costed hospitals allocated costs to the Emergency Department cost bucket. Emergency Department (“ED”) costs are out of scope for Round 17, so the ED costs for these hospitals were removed.
2.4 History of the Private Sector NHCDCRound 1 of the NHCDC was conducted in 1996-97 with 23 hospitals and 240,000 episodes being represented. Since then, the collection has grown steadily although no publication was released for round 8, 9, or Rounds 14 due to low participation rates. No collection was carried out for Round 10 or Round 15 (2010-11) as the sector elected to bypass that year and move directly to the following round. The table below shows the participation rate for Round 17 and the last five published rounds.
8 http://www.health.gov.au/internet/main/publishing.nsf/Content/Australia-Hospital-Patient-Costing-Standards, accessed 15 April 2013
9 Page 19 of Australian Hospital Patient Costing Standards v2.0 – 1 March 2011
Overnight Private HospitalsPwC

Introduction
Table 2 Summary of private hospital participation
Round #R7
(03-04)R11(06-07)
R12(06-07)
R13(08-09)
R16(11-12)
R17(12-13)
Number of hospitals
113 82 109 110 105 95
Sample separations
1,240,388
1,297,147
1,607,678
1,648,989
1,775,059
1,650,816
Percentage of population separations
65% 59% 72% 71% 66% 60%
AR-DRG version
4.2 4.2 4.2 5.1 6.0x 6.0x
2.5 Public and private sector differencesThis report does not seek to compare the average cost per separation between the public and private sectors, as the scope of costs between the two sectors is different. Many of the cost items present in the public sector such as Medical Salaries, Pathology, Pharmacy, Imaging or Allied Health are not equally represented in Private Hospital general ledgers. For example, imaging and pathology costs are generally not reported for the private sector because the majority of hospitals do not provide these services directly and patients pay for these services separately. Many patients make private arrangements and they are charged on a fee-for-service basis. As a result, these costs are not captured in a hospital’s general ledger. Medical costs are also generally charged direct to patients by providers on a fee-for-service basis. Training of medical officers is generally not a feature of the private sector, and accordingly salaried medical officers are not represented within the cost files unless there is an intensive care unit or emergency department, where an around-the-clock medical practitioner is required.
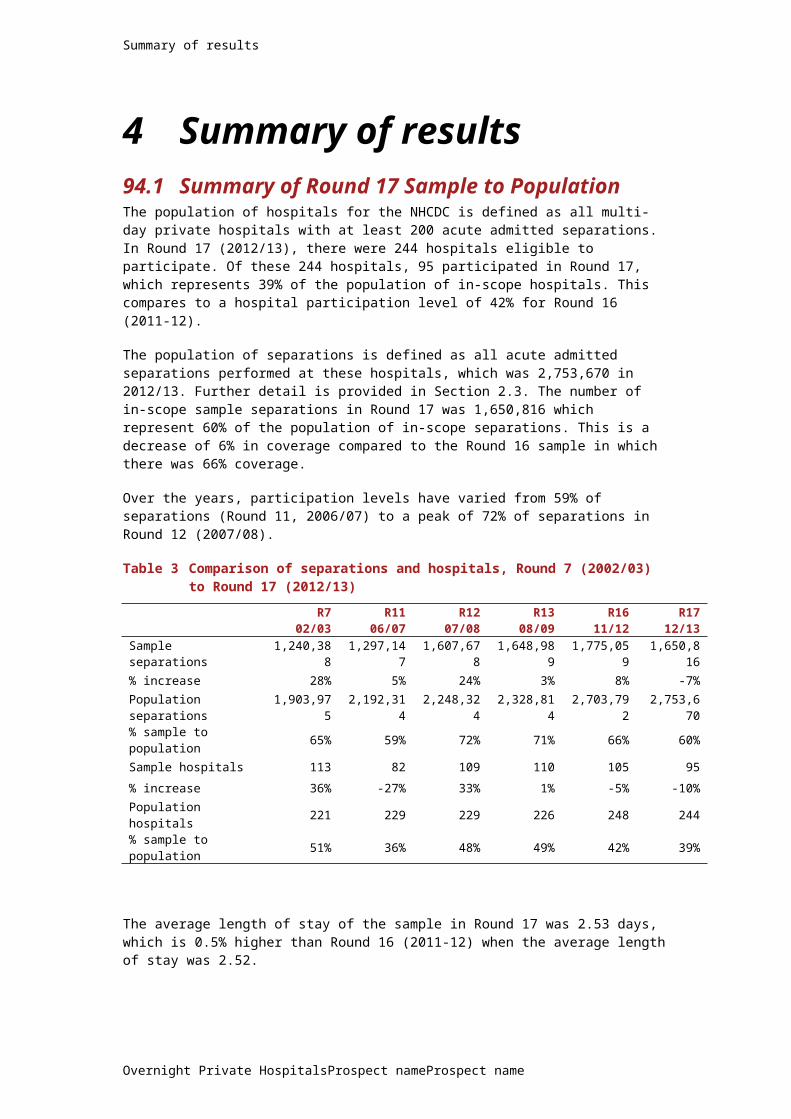
2.6 Confidentiality of dataDue to the commercial nature of the sector, all participating hospitals in Round 17 are assured that hospital level data will not be released in any form without the prior, written permission of the organisation from which the data originated. Where a cost weight reported for a DRG is based on less than five separations, the figures for this cost weight have been replaced by asterisks (*****). If the number of contributing hospitals for a particular DRG is less than three, the figures for this cost weight have been replaced by dashes (-----).
2.7 Reliances and limitationsData checks and reasonableness tests have been performed at three stages of the costing process: at data submission, during the costing process and on the aggregated data at the end of the process. However, this information has not been audited. The collection also required signoffs from hospitals during the costing process. A description of the checks is provided throughout this report.
Overnight Private HospitalsPwC

Introduction
The following areas can have a material impact on the reported costs and cost weights. The costing process relies on information provided by hospitals in the following areas:
1 Hospitals were requested to report costs that comply with the AHPCS v2.0. A review of the extent to which the costs reported by hospitals comply with the AHPCS v2.0 was out of scope of this project, and no tests of procedures have been performed to validate that the costs reported by hospitals comply with those standards.
2 The mapping of cost general ledger accounts to cost areas was performed by the participant hospitals.
3 Product fractions: this fraction is assigned to each cost centre by participant hospitals and denotes the proportion of costs related to each of the hospitals products. These fractions have a significant effect on the reported results as the fractions determine the cost base that is to be allocated to patients.
4 A small number of hospitals have participated by submitting costed data using their own costing systems. Many of these hospitals are experienced in hospital costing and the costed results are critically reviewed by their internal management. It has been assumed that the hospitals have performed the costing process in accordance with the AHPCS v2.0.
5 There are a small number of patients that were admitted prior to 1 July 2012, and discharged in 2012/13. These patients are called WiP patients as their episode crosses a financial year boundary. Adjustments for these WiP patients will not be made. That is, 2012/13 costs have been allocated to WiP patients without special adjustment for the period of the episode occurring in the prior financial year as the adjustments are expected to be immaterial yet require considerable effort to determine. For DRG cost-weight reporting purposes, only those patients who were discharged in the 2012/13 financial year have been included.
Overnight Private HospitalsPwC

Methodology
3 Methodology3.1 Identifying the minimum sample sizePrior to the commencement of the Round 16 collection, the minimum number of separations, number of hospitals and number of hospital groups required to participate was calculated based on data received from the Independent Hospital Pricing Authority (IHPA), the Department of Health, and Private Health Data Bureau dataset (PHDB).
The methodology that was adopted was described in Section 3 of the Round 16 report. A copy of that methodology is provided in Appendix B - Analysis performed to determine the minimum sample size. Based on this analysis:
approximately 60% of all separations would be required in order to achieve a robust sample;10
the collection should include at least 90 hospitals and 10 hospital ‘groups’ (of 2 or more hospitals) to be representative.
These minimum targets were used as the condition on which the Round 17 collection would go ahead. Hospitals were requested whether they had an intention to participate. The indicative participation rate exceeded the 60% and 90 hospital threshold requirements for the collection to proceed.
3.2 Costing methodologiesHospital costing is the process of identifying the resources and inputs used during an episode and applying the costs of those inputs to the different types of clinical procedures and treatments provided to each patient in a hospital.
There are two main methodologies adopted for hospital cost allocations: cost modelled or patient costed:
Patient costing (PC)Patient costed sites are hospitals that provide a calculated cost of care at the patient level for each episode of care. This is done using actual patient level consumption data if practical. For example, Direct Pathology costs may be based on the actual number of pathology tests performed for each patient. If actual patient consumption is impractical to measure, allocation methods are required. The PC method of costing is often referred to as a ‘bottom up’ method of costing because cost aggregates are devised from individual items of patient consumption11.
Cost modelling (CM)Cost modelling makes minimal use of measures of resource consumption by individual patients, and aims to estimate mean costs for classes of patients (e.g. by DRG). Cost modelled sites are hospitals that ‘model’ their cost centres using service weights, which are pre-determined statistics and service consumption weights. Service weights are applied to apportion costs to patient groups defined by their DRG (in the case of acute admitted care). This is also known as ‘top down’ costing because the hospital starts with an aggregate cost and
10 Defined as 95% confidence level and 4% acceptable margin of error for the overall average cost. The 95% confidence level and 4% margin of error parameters were informed by considering participation levels in historic publications that were considered acceptable for publication.
11 DoHA, Hospital Reference Manual for Round 11 (2006-07)
Overnight Private HospitalsProspect nameProspect name

Methodology
apportions it across cost centres based on assumptions about relative resource utilisation which are set at the DRG level. Patient level costing yields results that are closer to the true cost of an encounter within a hospital, however due to the dependency on feeder systems, perfect patient level costing can be difficult to achieve.
3.3 Stages and Phases of the private sector NHCDC
The three stages of the collection were:
Stage 1 - Data collection: At the commencement of the data collection phase a data specification guide was prepared and distributed to all participants. Hospitals were informed of their data collection window and provided access to a secure website to upload and submit all relevant files such as the patient activity data items, general ledger data and mapping files. Participants electing to perform their own costing provided data at the separation level with the allocated cost.
Stage 2 – Pre-costing checks and review: All participating hospitals were issued a pre-costing reasonableness and validation report. This phase comprised detailed pre-costing reasonableness and quality review checks by the costing team and alerting the hospital of any unexpected or unusual results so they can be corrected prior to costing. If hospital results fell outside the expected range of values, the hospital had the option to correct the data items and resubmit their data until all the issues are resolved or agreed by the hospital.
Stage 3 - Costing: The costing phase comprised of performing episode level costing using specialised costing software (PPM2) for all participating hospitals. After costing was completed, detailed checks were performed on the costed datasets.
Once the review was complete, the costed results for each hospital were shared with the hospitals to review and provide feedback. If unexplained variances were present in the costed reports, the costing staff reviewed the data that was submitted and contacted the hospital for further investigation where required. The approach to resolve issues identified during the checks were agreed with hospitals.
Each of these three Stages is described in more detail in Appendix C - Further detail on the costing process.
3.4 Costing approach for Round 17For the Round 17 collection, focus was placed on improving the costing methodology by using feeder system data to allocate costs for the major patient care areas in private hospitals, such as prosthetics, operating rooms, critical care and ward nursing costs. Service weights were used to allocate costs to the smaller cost buckets, such as pharmacy, pathology (if any), and imaging (if any). In this round, the following categories of patient level data components have been utilised during the costing process:
Financial data: This includes the general ledger cost centres and accounts, along with mapping of those cost centres to patient care areas and standardised line items.
Overnight Private HospitalsPwC

Methodology
Activity data: This includes the encounter level data (such as patient ID, encounter ID, date of birth etc.) and transfer information identifying when patients have transferred between operating rooms and wards.
Allocation data: This includes data used to allocate overhead cost centres to patient care areas (such as allocation of Finance or IT department costs to wards and other patient care areas).
Feeder data: This includes data that identifies patient consumption of hospital products or services within a patient care area. For example, a prosthesis feeder might list the prosthetic items received by a patient and the cost of each. This feeder can be used to allocate costs in the general ledger as it identified how much of the prosthesis products each encounter consumed.
Allocation of patient care area costs to encounters:After overheads are allocated, patient care areas are allocated to encounters. As each patient care area provides a different product or service to patients (known as intermediate products) then the method used to allocate these costs changes. A list of allocation methods for the Round 17 collection is provided below: Ward Nursing costs – allocated using fractional bed days. The ‘fractional
bed days’ value is derived from the patient transfer file which details the time and date in which patients were transferred in and out of wards.
Prostheses costs – allocated using a prosthesis listing. This identifies the direct cost of the prosthesis used by a patient during their encounter. If no prosthetics listing is provided by the hospital, and no information was made available from PHDB or HCP, these costs are allocated using service weights.
Operating room – allocated using theatre minutes, provided directly from a feeder system. If no operating room data is provided, and no information was made available from PHDB or HCP, these costs are allocated using service weights.
Critical care – allocated using Intensive Care Unit or Critical Care minutes (ICU or CC minutes), provided directly from a feeder system or patient transfer records. If no critical care data is provided, and no information was made available from PHDB or HCP, these costs are allocated using service weights.
Other patient care areas: service weights were adopted.
Cost components (“cost buckets”)In the NHCDC, the cost of an episode of acute admitted care is reported by allocating patient level costs to a set of pre-defined cost components or “cost buckets”. The cost buckets are listed as follows:
1 Ward Medical2 Ward Nursing3 Non-clinical Salaries4 Pathology5 Imaging6 Allied Health7 Pharmacy8 Critical Care9 Operating Rooms10 Emergency Departments
Overnight Private HospitalsPwC

Methodology
11 Supplies12 Specialist Procedure Suites13 On-costs14 Prostheses15 Hotel16 Depreciation
Once each of the cost buckets are calculated for an individual patient, the patient’s total cost of care is derived as the sum of the above components. The definition of cost buckets are included in the Australian Hospital Reference Manual previously released by Department of Health and Ageing (DoHA), and now by IHPA. A description of the cost buckets is provided in Appendix E - Costsincluded in the cost buckets.
DRG Version 6.0xRound 17 data in this report is presented in DRG version 6.0x. However, some of the sites costed provided data in an earlier version of the DRG classification system. For these sites, the patient data was regrouped (reclassified) to DRG version 6.0x using the original diagnosis and procedure codes recorded by the hospital. This process ensures consistency across the reporting process, as there are some additions, removals and amendments to the DRG classification system between each version released.
Service weightsThe AR-DRGv6.0x service weights were used in Round 17, which are derived from patient-costed sites in public sector hospitals.
Costing standardsCosting was performed in compliance with AHPCS v2.0.
3.5 Changes in methodology compared to the Round 16 (2011/12) collection
A mix of patient-costing and cost modelling has been adopted for Round 17. The changes adopted in Round 17 represent less reliance on service weights compared to Round 16, and an increase in reliance on the measures that represent the resources consumed for each separation:
1 Use of feeder data: The cost modelling approach in Round 16 allocated costs in wards to separations on the basis of fractional bed days, while all other cost centres were allocated to encounters based on service weights. In Round 17, a number of patient level data source or feeder systems were introduced. It was recommended hospitals submit data for prosthesis, operating room and critical care feeder data to improve accuracy of the cost allocation. Hospitals were also able to select the PHDB or HCP submissions as alternative source systems of feeder data.
2 Allocation of overheads to patient care areas: While the majority of hospitals in Round 17 chose not to submit overhead allocation statistics, participating hospitals were able to provide allocation statistics for allocating costs of overhead cost centres to patient care areas. If no allocation statistics were provided, overheads were allocated to patient care areas using a ‘share of total expenses’ method.
3 Product fraction: While the scope of R17 Private Sector is limited to acute inpatients only, as many hospitals provide additional products to patients (such as outpatient or emergency department services) it is important to separate out costs relating to those products. As such,
Overnight Private HospitalsPwC

Methodology
participants are asked to enter patient fractions (PFRACs) to indicate how much of each cost centre’s cost relates to each of the hospital products instead of the Inpatient Fraction (IFRAC) used in Round 16.
4 General ledger data: Negative expense accounts were accepted as part of the hospital general ledger submission.
5 Changes in reporting: As discussed and agreed with the private hospital representatives, the public report in Round 17 has been expanded to separate prosthesis costs into a separate bucket. DRG information will now be displayed in the following 5 cost weight buckets:
a Total costs
b Operating Room and Special Procedure Suites
c Critical Care
d Prosthesis; and
e Miscellaneous (Including Ward Medical, Ward Nursing, Non-clinical salaries, Pathology, Imagining, Allied Health, Pharmacy, Depreciation, On-costs, Hotel and Supplies.)
3.6 Analysis and reportingThe costing dataset was constructed from the combined hospital costed outputs. The following adjustments were applied to the dataset:
Neonate adjustmentThe costs for newborn infants with zero qualified days, in respect of care type 7 (newborn care), and neonate DRGs were allocated to the delivery DRGs of mothers at the same hospital. The definition of unqualified days is provided in the National Health Data Dictionary12: “unqualified days” relates to the first 9 days of a newborn’s life, unless the newborn is a second or subsequent live born infant or it requires intensive care. This adjustment has been performed consistent with the methodology adopted and applied to the public sector collection for Rounds 14 and 15 as inputs to the National Efficient Price weights.13
12 AIHW National Health Data Dictionary, 15th edition13 Advice from IHPA
Overnight Private HospitalsPwC

Methodology
Population adjustment processTo ensure the results reflect the full range of Australia’s private hospitals, an estimation process is adopted to create representative national costing and activity figures from sample data. The estimation process produces ‘population’ data by estimating weights, on the basis of acute admitted separations, that are applied to the sample data so that the acute admitted separations equal the total population figures.
The methodology adopted for Round 17 is the same as that adopted in Round 16. As part of consultations with the private hospital sector for Round 16 it was agreed that a market-based approach would be adopted to weight the sample so that the weighted separations and costs of the larger participants did not exceed their actual markets shares based on separation counts.
In order to compile a study and strata file that is required for the population estimation process, the number of acute hospital separations for 2012-13 for each hospital was obtained from the PHDB. All private acute hospitals in Australia (excluding private day hospital facilities) with more than 200 acute admitted separations during the financial year are included in the population file. An issue with the PHDB file was that a number of hospitals missed a monthly PHDB submission. This means that the PHDB was not complete and unsuitable for estimating the population without some form of adjustment for the missing data. Our approach to adjust for missing data was as follows:
1 If a hospital participated in Round 17, then the number of separations was based on the number of costed acute admitted separations;
2 If a hospital did not participate in the NHCDC, then the number of separations was based on the PHDB. If one of these hospitals missed a monthly PHDB submission, then an annualised estimate at hospital level was taken based on analysis of the average number of separations from the other monthly submissions.
The number of hospitals in the population file for Round 17 is 244.
The population separations have increased by 1.8% from Round 16 to Round 17 (see Table 3 for more detail.)
Overnight Private HospitalsPwC

Summary of results
4 Summary of results4.1 Summary of Round 17 Sample to
PopulationThe population of hospitals for the NHCDC is defined as all multi-day private hospitals with at least 200 acute admitted separations. In Round 17 (2012/13), there were 244 hospitals eligible to participate. Of these 244 hospitals, 95 participated in Round 17, which represents 39% of the population of in-scope hospitals. This compares to a hospital participation level of 42% for Round 16 (2011-12).
The population of separations is defined as all acute admitted separations performed at these hospitals, which was 2,753,670 in 2012/13. Further detail is provided in Section 2.3. The number of in-scope sample separations in Round 17 was 1,650,816 which represent 60% of the population of in-scope separations. This is a decrease of 6% in coverage compared to the Round 16 sample in which there was 66% coverage.
Over the years, participation levels have varied from 59% of separations (Round 11, 2006/07) to a peak of 72% of separations in Round 12 (2007/08).
Table 3 Comparison of separations and hospitals, Round 7 (2002/03) to Round 17 (2012/13)
R702/03
R1106/07
R1207/08
R13 08/09
R1611/12
R1712/13
Sample separations 1,240,388 1,297,147 1,607,678 1,648,989 1,775,059 1,650,816
% increase 28% 5% 24% 3% 8% -7%
Population separations 1,903,975 2,192,314 2,248,324 2,328,814 2,703,792 2,753,670
% sample to population 65% 59% 72% 71% 66% 60%
Sample hospitals 113 82 109 110 105 95
% increase 36% -27% 33% 1% -5% -10%
Population hospitals 221 229 229 226 248 244
% sample to population 51% 36% 48% 49% 42% 39%
The average length of stay of the sample in Round 17 was 2.53 days, which is 0.5% higher than Round 16 (2011-12) when the average length of stay was 2.52.
Table 4 Average length of stay (ALOS) of Sample Separations, Round 7 (2002/03) to Round 17 (2012/13)
Round 7 2002/03
Round 11 2006/07
Round 12 2007/08
Round 13 2008/09
Round 16 2011/12
Round 17 2012/13
Average length of stay 2.97 2.88 2.62 2.57 2.52 2.53
% change -3.0% -9.0% -1.9% -2.2% +0.5%
Overnight Private HospitalsProspect nameProspect name

Summary of results
4.2 Comparison of cost-bucket break-down to Round 16
In Round 16 the private hospital sector agreed to the publication of cost weights for total costs, operating rooms and specialist procedure suites (combined), critical care, and “other” (representing the remainder). In Round 17 the sector agreed to the publication of cost weights for total costs, operating rooms and specialist procedure suites (combined), critical care, prostheses, and “miscellaneous” (representing the remainder). “Miscellaneous” represents the combined costs for ward nursing, supplies, on-costs, non-clinical costs, depreciation, hotel, pharmacy, allied health, ward medical, pathology, and imaging. The definition of cost buckets are included in the Australian Hospital Reference Manual previously released by Department of Health and Ageing (DoHA), and now by IHPA.
In Round 17, operating rooms and specialist procedure suites (“ORSPS”) represented 20.5% of costs, which is a 1.8% increase compared to Round 16. Critical care in Round 17 is 5.8% compared to 5% in Round 16, and the remainder of costs is 73.7% in Round 17 compared to 76.3% in Round 16. These movements are likely to represent the changes and the improvements in the costing allocation process for Round 17 compared to Round 16: in Round 16, ORSPS and critical care costs were allocated using service weights. In Round 17, feeder systems for ORSPS and critical care for actual minutes were adopted if available, otherwise service weights were adopted.
In Round 17, the sector requested the prostheses cost weights to be published. Across all DRGs, prostheses costs represent a large proportion at 22.9% of total costs.
Table 5 Breakdown of cost by cost-bucket group, Round 17 versus Round 16
Round 16 Round 17Cost-bucket group 2011-12 2012-13 ChangeOperating rooms and Specialist Procedure Suites 18.7% 20.5% 1.8%
Critical Care 5.0% 5.8% 0.8%
Remainder 76.3% 73.7% -2.6%
Round 17 breakdown of "Remainder"
Miscellaneous n/a 50.9%
Prostheses n/a 22.9%
Total 100.0% 100.0% 0.0%
Overnight Private HospitalsPwC

Summary of results
4.3 DRG AnalysisThe twenty DRGs ranked by highest cost weightsDRGs with the highest cost weights are those DRGs that have the highest average cost per separation. The DRG with the highest cost weight in Round 17 is DRG P61Z “Neonate, Admission Weight less than 760grams”. This DRG has a long average length of stay of 84 days. The cost weight for this DRG is 50.39, which means that the average cost of this DRG is 50.39 times the average separation cost across all DRGs in the private sector. Six of the Top 20 cost weight DRGs relate to neonates with ranks 1, 3, 5, 6, 8 and 12. A further 4 DRGS are those that are classified in the Major Diagnostic Grouping as “High Cost Procedures”. These are ranked 2, 9, 13, and 17. A number of the remaining high-cost DRGs relate to cardiac procedures and spinal fusion procedures. 18 of the top 20 DRGs are surgical, and two are classified as medical, both of which are Neonate DRGs (P61Z, and P62Z).
Twelve of the Round 17 top 20 cost-weight DRGs were also in the Round 16 Top 20. There are two Round 17 DRGs (P61Z and P05Z) for which no data was received last year and consequently no cost weight produced. The changes in the Top 20 rankings between Round 16 and Round 17 are likely due to the use of feeder data by many hospitals this year. Prosthetics and critical care costs were in many cases allocated directly from feeder data in this Round instead of service weights in Round 16. Since the service weights are based on public sector results, and there are many differences between private and public sector cost results and practices, the use of the feeder data is more likely to lead to DRG cost weights that are more reflective of resource consumption in the private sector. Furthermore, the top DRGs have high standard errors. Movements are therefore expected year-to-year for high-cost / low-volume DRGs.
The DRG with the highest number of separations was F01B “Implantation or replacement of AICD (Automatic Implantable Cardioverter-Defibrillator), Total system without catastrophic complications and/or co-morbidities”. In 2012/13, this DRG had a cost weight of 23.46, and there was an estimated 2,268 separations.
The top 20 cost-weight DRGs account for 5.0% of total resources in 2012/13, but represent only 0.3% of total separations.
Overnight Private HospitalsProspect nameProspect name

Summary of results
Table 6 DRGs with twenty highest cost weights, AR-DRG 6.0x, Round 17 (2012/13)Indicator: Cost ALOS % of % of
DRG Top 20 Rank Cost Weighted Number of (days) Std total CWType R16? R17 DRG Description Weight Seps Seps Days (e) = Error seps seps
(a) (b) (c)=(a)x(b) (d) (d)/(b)
M N/A 1 P61Z Neonate, AdmWt <750 g 50.39 21 1,065 1,776 84.0 9.34 0.0% 0.0%S Yes 2 A06A Tracheostomy W Ventilation >95 hours W Catastrophic CC 43.27 277 11,989 14,559 52.5 2.47 0.0% 0.4%M Yes 3 P62Z Neonate, AdmWt 750-999 g 39.45 41 1,614 2,650 64.8 4.58 0.0% 0.1%S Yes 4 F01A Implantation or Replacement of AICD, Total System W Catastrophic CC 28.76 300 8,621 2,282 7.6 0.64 0.0% 0.3%S Yes 5 P06A Neonate, AdmWt >2499 g W Significant OR Procedure W Multi Major Problems 27.69 28 788 1,043 36.6 6.91 0.0% 0.0%S No 6 P03Z Neonate, AdmWt 1000-1499 g W Significant OR Procedure 23.97 44 1,059 1,869 42.3 3.15 0.0% 0.0%S Yes 7 F01B Implantation or Replacement of AICD, Total System W/O Catastrophic CC 23.46 2,268 53,217 5,000 2.2 0.25 0.1% 1.9%S Yes 8 P04Z Neonate, AdmWt 1500-1999 g W Significant OR Procedure 21.71 32 702 1,194 36.9 5.18 0.0% 0.0%S Yes 9 A06B Trach W Vent >95 hours W/O Cat CC or Trach/Vent >95 hours W Cat CC 18.02 803 14,479 22,136 27.6 0.61 0.0% 0.5%S No 10 W01Z Ventilation or Cranial Procedures for Multiple Significant Trauma 16.90 8 134 285 35.8 3.87 0.0% 0.0%S Yes 11 I06Z Spinal Fusion W Deformity 15.57 793 12,347 7,958 10.0 0.53 0.0% 0.4%S N/A 12 P05Z Neonate, AdmWt 2000-2499 g W Significant OR Procedure 14.03 13 184 315 24.0 6.61 0.0% 0.0%S No 13 A11A Insertion of Implantable Spinal Infusion Device W Catastrophic CC 13.52 14 183 314 23.2 2.59 0.0% 0.0%S Yes 14 I09A Spinal Fusion W Catastrophic CC 13.41 833 11,176 11,324 13.6 0.35 0.0% 0.4%S Yes 15 F03A Cardiac Valve Proc W CPB Pump W Invasive Cardiac Investigation W Cat CC 12.98 467 6,063 8,188 17.5 0.33 0.0% 0.2%S No 16 I32A Knee Revision W Catastrophic CC 12.34 197 2,433 3,772 19.1 0.66 0.0% 0.1%S No 17 A07Z Allogeneic Bone Marrow Transplant 12.08 12 146 287 23.8 1.81 0.0% 0.0%S Yes 18 F07A Other Cardiothoracic/Vascular Procedures W CPB Pump W Catastrophic CC 11.73 251 2,948 3,231 12.9 1.21 0.0% 0.1%S Yes 19 I01A Bilateral/Multiple Major Joint Proc of Lower Extremity W Revision or W Cat CC 11.70 284 3,324 4,938 17.4 0.40 0.0% 0.1%S No 20 D01Z Cochlear Implant 11.67 522 6,094 810 1.6 0.22 0.0% 0.2%
12 Sub-total, top 20 highest cost weight 19.22 7,210 138,567 93,934 13.0 0.3% 5.0%in R16 All DRGs 1.00 2,753,670 2,753,670 6,904,289 2.5 100% 100%Top 20 Top 20, % of all DRGs 0.3% 5.0% 1.4%
Notes: DRGs with fewer than 5 separations or 3 participating hospitals are excluded from the above table. (b) Separations shown are weighted using the methodology described in Section 3.5 (e) ALOS means average length of stay
Overnight Private HospitalsPwC
Summary of results
Figure 1 below highlights the cost-weight (height) and volume (width) of these twenty DRGs and plots them relative to the cost weight and volume of all other DRGs, illustrating the significant difference in cost-weight for these DRGs. The in-set area focuses specifically on the top-20 DRGs, where the width of each bar represents the number of separations. (The main chart has been truncated on the vertical axis for clarity.) From this chart and Table 6, the top 20 cost-weight DRGs that had relatively higher separation volumes were F01B (Implantation Or Replacement Of Aicd, Total System W/O Catastrophic Cc), A06B (Trach W Vent >95 Hours W/O Cat Cc Or Trach/Vent >95 Hours W Cat Cc), I06Z (Spinal Fusion W Deformity) and I09A (Spinal Fusion W Catastrophic Cc).
Figure 1 Twenty highest cost-weight AR-DRGs – plot of cost weight versus number of separations
Overnight Private HospitalsPwC
200k 400k 600k 800k 1,000k 1,200k 1,400k 1,600k -
5
10
15
20
25
o
▲ Cost Weight ► Separations
0.7k 1.4k 2.2k 2.9k 3.6k 4.3k 5.0k 5.8k 6.5k 7.2k -
10.0
20.0
30.0
40.0
50.0
60.0
Spinal Fusion W DeformityNeonate, Admwt 750-999 G
Trach W Vent >95 Hours W/O Cat Cc Or Trach/Vent >95
Hours W Cat Cc
Spinal Fusion W Catastrophic Cc
Implantation Or Replacement Of Aicd, Total
System W/O Catastrophic Cc

Summary of results
Twenty DRGs with the highest number of separations in 2012/13The DRG with the highest number of population-weighted separations is R63Z Chemotherapy (207,697, 7.5% of the total of 2,753,670). Five of the top 20 by volume DRGs are from the Major Diagnostic Category “Diseases and disorders of the digestive system”). These are: G48C (Colonoscopy SameDay, ranked 2), G46C (Complex Gastroscopy SameDay, ranked 6), G47C (Other Gastroscopy SameDay, ranked 7), G10B (Hernia procedures w/ Cc, ranked 13) and G11Z (Anal And Stomal Procedures, ranked 17). The top 20 frequency DRGs account for 44% of separations in 2012/13, and are estimated to consume 17% of resources in the overnight private hospital sector (based on cost weighted separations). A high proportion of separations in these DRGs are same-day separations with low cost weights (and therefore lower average cost). The exception to this is O60B and O01C (vaginal and caesarean delivery DRGs without catastrophic or severe complications). 19 of these DRGs were ranked in the top 20 highest volume in Round 16. The ranks are very similar to the Round 16 ranks. This means that there has been little movement in the profile of DRGs in 2012/13 compared to 2011/12. The DRGs comprise a mixture of Medical DRGs, Surgical DRGs, and Other DRGs.
Table 7 Twenty highest volume (number of separations) DRGs, AR-DRG 6.0x, Round 17 (2012/13)Indicator:Volume Cost ALOS % of % of
DRG Top 20 Rank Cost Weighted Number of (days) Std total CWType R16? R17 Description Weight Seps Seps Days (e) = Error seps seps
(a) (b) (c)=(a)x(b) (d) (d)/(b)
M Yes 1 R63Z Chemotherapy 0.21 207,697 44,363 241,009 1.2 0.001 7.5% 1.6%O Yes 2 G48C Colonoscopy, Sameday 0.21 110,786 23,341 116,356 1.1 0.001 4.0% 0.8%M Yes 3 L61Z Haemodialysis 0.12 105,160 12,105 109,974 1.0 0.000 3.8% 0.4%O Yes 4 Z40Z Endoscopy W Diagnoses of Other Contacts W Health Services, Sameday 0.19 78,499 14,603 83,555 1.1 0.001 2.9% 0.5%M Yes 5 Z64B Other Factors Influencing Health Status, Sameday 0.20 72,613 14,235 84,479 1.2 0.002 2.6% 0.5%O Yes 6 G46C Complex Gastroscopy, Sameday 0.26 72,419 18,817 77,486 1.1 0.001 2.6% 0.7%O Yes 7 G47C Other Gastroscopy, Sameday 0.15 63,075 9,720 67,046 1.1 0.001 2.3% 0.4%S Yes 8 I18Z Other Knee Procedures 0.43 62,526 26,708 71,143 1.1 0.002 2.3% 1.0%O Yes 9 D40Z Dental Extractions and Restorations 0.37 55,351 20,366 59,116 1.1 0.002 2.0% 0.7%M Yes 10 E63Z Sleep Apnoea 0.27 43,513 11,787 46,882 1.1 0.001 1.6% 0.4%S Yes 11 C16Z Lens Procedures 0.54 40,917 22,062 43,570 1.1 0.002 1.5% 0.8%S Yes 12 J11Z Other Skin, Subcutaneous Tissue and Breast Procedures 0.35 37,193 13,112 43,334 1.2 0.003 1.4% 0.5%S Yes 13 G10B Hernia Procedures W/O CC 0.86 36,921 31,595 49,328 1.3 0.003 1.3% 1.1%M Yes 14 O60B Vaginal Delivery W/O Catastrophic or Severe CC 1.33 36,332 48,185 147,603 4.1 0.005 1.3% 1.7%S Yes 15 I16Z Other Shoulder Procedures 1.19 35,952 42,765 46,342 1.3 0.005 1.3% 1.6%S Yes 16 N07Z Other Uterine and Adnexa Procedures for Non-Malignancy 0.47 34,211 16,136 40,216 1.2 0.003 1.2% 0.6%S Yes 17 G11Z Anal and Stomal Procedures 0.44 31,009 13,685 43,371 1.4 0.008 1.1% 0.5%O Yes 18 L41Z Cystourethroscopy, Sameday 0.18 29,854 5,416 32,172 1.1 0.002 1.1% 0.2%S Yes 19 O01C Caesarean Delivery W/O Catastrophic or Severe CC 1.67 29,303 48,914 141,214 4.8 0.023 1.1% 1.8%S No 20 I30Z Hand Procedures 0.64 28,367 18,243 33,292 1.2 0.005 1.0% 0.7%
19 Sub-total, 20 highest separation count 0.38 1,211,697 456,161 1,577,488 1.3 44% 17%in R16 All DRGs 1.00 2,753,670 2,753,670 6,904,289 2.5 100% 100%Top 20 Top 20 separation count, % of all DRGs 44% 17% 23%
Notes: DRGs with fewer than 5 separations or 3 participating hospitals are excluded from the above table. (b) Separations shown are weighted using the methodology described in
Overnight Private HospitalsPwC

Summary of results
Section 3.5 (e) ALOS means average length of stay
Overnight Private HospitalsPwC

Summary of results
Figure 2 illustrates the relationship between separation counts for these top 20 (44% of total separations), versus resources consumed (17%, as measured by “cost weighted separations”).
Figure 2 Twenty DRGs with the highest number of separations in 2012/13:
17%
44%
83%
56%
Cost Weighted Separations
Separations
Remaining DRGsTop 20 DRGs by volume
Overnight Private HospitalsPwC

Summary of results
Figure 3 plots the top 20-volume DRGs against all other DRGs, comparing both volume and cost weight. The darker bars in the main chart show that these high-volume DRGs have relatively low cost weights compared to other DRGs. The in-set focuses only on the top-20 by volume, where the wider bars represent the higher volume DRGs such as Chemotherapy, and the height of each bar represents the cost-weight. Taller DRGs are those with the relatively higher cost weights (such as Caesarean Delivery w/o Catastrophic or Severe Cc).
Figure 3 Twenty highest volume DRGs – plot of cost weight versus number of separations (illustrates that most of them have relatively low cost-weights)
Overnight Private HospitalsPwC
200k 400k 600k 800k 1,000k 1,200k 1,400k 1,600k -
5
10
15
20
25
▲ Cost Weight ► Separations
120k 240k 360k 480k 600k 720k 840k 960k 1,080k 1,200k -
0.2
0.4
0.6
0.8
1.0
1.2
1.4
1.6
1.8
Endoscopy W Diagnoses Of Other Contacts W Health
Services, Sameday
Other Shoulder Procedures
Caesarean Delivery W/O Catastrophic Or Severe Cc
Chemotherapy
Lens Procedures

Summary of results
The twenty DRGs with the highest volume x cost-weight (“cost-weighted separations”) in 2012/13These DRGs are those that account for the highest proportion of total costs in the private overnight sector. Cost-weighted separations are calculated as the total number of separations multiplied by the cost weight. The percentage distribution of cost-weighted separations represents the percentage distribution of hospital costs incurred in delivering patient care.
The top 3 DRGs that account for the highest proportion of hospitals costs incurred in 2012/13 are:
I04B “Knee Replacement W/O Catastrophic Or Severe Cc” representing 135,355 cost weighted separations (4.9%), cost weight of 5.50, and average length of stay of 5.7 days;
I03B “Hip Replacement W/O Catastrophic Cc”, representing 122,186 cost weighted separations (4.4%), cost weight 6.54, and average length of stay 6.0 days; and
I09B “Spinal Fusion W/O Catastrophic Cc”, representing 81,805 of cost weighted separations (3.0%), cost weight 8.35, and average length of stay 6.1 days.
Combined, these 3 DRGs represent 339,346 cost weighted separations which is 12.3% of total cost weighted separations of 2,753,670. Therefore, these 3 DRGs alone account for 12.3% of total hospital costs in 2012/13.
Nineteen of this year’s top-20 DRGs were ranked in the top 20 in Round 16, indicating that the DRGs accounting for a significant proportion of total hospital costs in 2012/13 also accounted for total hospital costs in 2011/12. Overall, this group of DRGs accounts for 33% of total hospital costs in 2012/13, 25% of total separations, and 21% of total patient days.
Overnight Private HospitalsPwC

Summary of results
Table 8 DRGs with the twenty highest number of cost-weighted separations, AR-DRG 6.0x, Round 17 (2012/13)Indicator: Cost % of % of
DRG Top 20 Rank Cost Weighted Number of ALOS Std total CWType R16? R17 Description Weight SeparationsSeparations Days (days) Error seps seps
(a) (b) (c)=(a)x(b) (d) (e)=(d)/(b)
S Yes 1 I04B Knee Replacement W/O Catastrophic or Severe CC 5.50 24,615 135,355 139,618 5.7 0.01 0.9% 4.9%S Yes 2 I03B Hip Replacement W/O Catastrophic CC 6.54 18,684 122,186 111,249 6.0 0.02 0.7% 4.4%S Yes 3 I09B Spinal Fusion W/O Catastrophic CC 8.35 9,801 81,805 59,451 6.1 0.07 0.4% 3.0%S Yes 4 F01B Implantation or Replacement of AICD, Total System W/O Catastrophic CC 23.46 2,268 53,217 5,000 2.2 0.25 0.1% 1.9%S Yes 5 O01C Caesarean Delivery W/O Catastrophic or Severe CC 1.67 29,303 48,914 141,214 4.8 0.02 1.1% 1.8%M Yes 6 O60B Vaginal Delivery W/O Catastrophic or Severe CC 1.33 36,332 48,185 147,603 4.1 0.00 1.3% 1.7%S Yes 7 F12B Implantation or Replacement of Pacemaker, Total System W/O Catastrophic CC 6.92 6,705 46,374 20,251 3.0 0.05 0.2% 1.7%M Yes 8 R63Z Chemotherapy 0.21 207,697 44,363 241,009 1.2 0.00 7.5% 1.6%S Yes 9 I16Z Other Shoulder Procedures 1.19 35,952 42,765 46,342 1.3 0.00 1.3% 1.6%S Yes 10 G10B Hernia Procedures W/O CC 0.86 36,921 31,595 49,328 1.3 0.00 1.3% 1.1%S Yes 11 I04A Knee Replacement W Catastrophic or Severe CC 6.42 4,309 27,661 35,057 8.1 0.04 0.2% 1.0%O Yes 12 F42B Circulatory Disorders W/O AMI W Invasive Cardiac Inves Proc W/O Cat or Sev CC 1.15 23,472 27,036 48,335 2.1 0.01 0.9% 1.0%S Yes 13 F15B Interventional Coronary Procs W/O AMI W Stent Implantation W/O Cat or Sev CC 2.96 9,067 26,870 17,014 1.9 0.02 0.3% 1.0%S Yes 14 I18Z Other Knee Procedures 0.43 62,526 26,708 71,143 1.1 0.00 2.3% 1.0%S Yes 15 K04B Major Procedures for Obesity W/O CC 2.29 10,692 24,438 23,147 2.2 0.01 0.4% 0.9%S Yes 16 I10B Other Back and Neck Procedures W/O Catastrophic or Severe CC 1.68 14,355 24,173 48,976 3.4 0.01 0.5% 0.9%S Yes 17 F04A Cardiac Valve Proc W CPB Pump W/O Invasive Cardiac Inves W Cat CC 10.69 2,236 23,900 26,619 11.9 0.15 0.1% 0.9%O No 18 G48C Colonoscopy, Sameday 0.21 110,786 23,341 116,356 1.1 0.00 4.0% 0.8%S Yes 19 C16Z Lens Procedures 0.54 40,917 22,062 43,570 1.1 0.00 1.5% 0.8%S Yes 20 I13B Humerus, Tibia, Fibula and Ankle Procedures W/O CC 1.49 14,276 21,217 30,636 2.1 0.01 0.5% 0.8%
19 Sub-total, top 20 highest cost-weighted separations 1.29 700,916 902,167 1,421,918 2.0 25% 33%in R16 All DRGs 1.00 2,753,670 2,753,670 6,904,289 2.5 100% 100%Top 20 Top 20 cost-weighted separations, % of all DRGs 25% 33% 21%
Notes: DRGs with fewer than 5 separations or 3 participating hospitals are excluded from the above table. (b) Separations shown are weighted using the methodology described in Section 3.5 (e) ALOS means average length of stay
Overnight Private HospitalsPwC

Summary of results
Figure 4 illustrates the relationship between separation counts for these top 20 (44% of total separations), versus resources consumed (25%, as measured by “cost weighted separations”).
Figure 4 Twenty DRGs with the highest number of cost-weighted separations
Overnight Private HospitalsPwC
Remaining DRGsTop 20 DRGs by cost weighted separations

Summary of results
The DRGs in this group consist of a mixture of high / medium / low cost weight DRGs, as highlighted by the spread of dark red areas in Figure 5 below. The height of each bar represents the cost weight, while the width of each bar represents the number of separations. Figure 5 below highlights the cost-weight and volume of these DRGs (dark red) and plots them relative to the cost weight and volume of all other DRGs.
Figure 5 Twenty DRGs with the highest number of cost-weighted separations – plot of cost weight versus number of separations
Overnight Private HospitalsPwC
200k 400k 600k 800k 1,000k 1,200k 1,400k 1,600k -
5
10
15
20
25
▲ Cost Weight ► Separations
72k 144k 216k 288k 360k 432k 504k 576k 648k 720k -
5.0
10.0
15.0
20.0
25.0
Chemotherapy
Implantation Or Replacement Of Pacemaker,
Total System W/O
Implantation Or Replacement Of Aicd, Total
System W/O Catastrophic Cc
Other Knee ProceduresOther Back And Neck
Procedures W/O Catastrophic Or Severe Cc

Summary of results
DRG Analysis – Miscellaneous Group of CostsMiscellaneous combines the costs of Ward Medical, Ward Nursing, Non-clinical salaries, Pathology, Imaging, Allied Health, Pharmacy, Depreciation, On-costs, Hotel and Supplies. The total cost weight across all DRGs is 0.51, which means that miscellaneous costs represent 51% of total costs in 2012/13.
The DRG with the highest miscellaneous cost weight is A06A “Tracheostomy W Ventilation >95 Hours W Catastrophic Cc”. The cost weight is 13.28, i.e. these costs are 13.28 times the average cost across all separations and cost buckets. This DRG has a high proportion of costs (61%) incurred in the critical care cost bucket.
The next 2 DRGs are A07z (Allogenic bone marrow transplant, miscellaneous cost weight 11.58, representing 96% of total cost) and B60A (Acute paraplegia/quadriplegia, miscellaneous cost weight 10.07, representing 90% of total cost).
DRGs with high miscellaneous cost weights are characterised by significantly longer length of stay than the overall average of 2.5 days, and significantly higher proportion of critical care costs (46% of total cost) compared to all DRGs (critical care being 6% of total cost). Eleven of the DRGs are surgical DRGs, with the remaining nine being medical DRGs.
Twelve of the top-20 miscellaneous cost-weight DRGs were ranked in the top 20 for Round 16. There has been some movement in the ranking of miscellaneous cost weights. These movements reflect the refinements to the costing allocation process for Round 17, which better reflect the costs for the private sector, compared to Round 16 which placed greater reliance on public sector service weights.
Overnight Private HospitalsPwC

Summary of results
Table 9 Twenty DRGs with the highest cost weight for Miscellaneous costs, AR-DRG 6.0x, Round 17 (2012/13) % of DRG Total Cost (f)
Indicator: Miscellaneous OverallDRG Top 20 Cost Cost ALOSType R16? DRG Description Weight Separations Weight (days)
(a) (b) (c) (e)
S Yes 1 A06A Tracheostomy W Ventilation >95 hours W Catastrophic CC 13.28 277 43.27 52.5 4% 61% 31% 4%S Yes 2 A07Z Allogeneic Bone Marrow Transplant 11.58 12 12.08 23.8 3% 0% 96% 1%M Yes 3 B60A Acute Paraplegia/Quadriplegia W or W/O OR Procs W Cat CC 10.07 21 11.16 39.0 3% 4% 90% 3%M N/A 4 P61Z Neonate, AdmWt <750 g 9.85 21 50.39 84.0 0% 80% 20% 0%M Yes 5 P62Z Neonate, AdmWt 750-999 g 7.61 41 39.45 64.8 0% 80% 19% 0%S No 6 W01Z Ventilation or Cranial Procedures for Multiple Significant Trauma 7.50 8 16.90 35.8 8% 22% 44% 26%S Yes 7 P06A Neonate, AdmWt >2499 g W Significant OR Procedure W Multi Major Problems 7.48 28 27.69 36.6 5% 68% 27% 0%S Yes 8 A08A Autologous Bone Marrow Transplant W Catastrophic CC 7.29 155 8.32 25.3 2% 9% 88% 2%M Yes 9 P65A Neonate, AdmWt 1500-1999 g W/O Significant OR Proc W Multi Major Problems 7.27 18 11.58 26.1 0% 37% 63% 0%S Yes 10 W04A Other OR Procs for Multiple Significant Trauma W Catastrophic or Severe CC 6.94 18 11.41 32.4 14% 6% 61% 20%M Yes 11 R60A Acute Leukaemia W Catastrophic CC 6.89 294 7.33 23.6 2% 4% 94% 1%S Yes 12 A06B Trach W Vent >95 hours W/O Cat CC or Trach/Vent >95 hours W Cat CC 6.51 803 18.02 27.6 6% 51% 36% 7%S No 13 P04Z Neonate, AdmWt 1500-1999 g W Significant OR Procedure 6.39 32 21.71 36.9 1% 69% 29% 0%S Yes 14 F11A Amputation for Circ System Except Upper Limb and Toe W Catastrophic CC 6.24 70 8.37 29.4 10% 12% 75% 3%S No 15 A11A Insertion of Implantable Spinal Infusion Device W Catastrophic CC 6.23 14 13.52 23.2 4% 8% 46% 42%M Yes 16 P63Z Neonate, AdmWt 1000-1249 g W/O Significant OR Procedure 5.97 47 10.01 25.6 0% 40% 60% 0%M No 17 P64Z Neonate, AdmWt 1250-1499 g W/O Significant OR Procedure 5.91 143 10.52 30.8 0% 44% 56% 0%M No 18 B82A Chronic and Unspecified Paraplegia/Quadriplegia W or W/O OR Procs W Cat CC 5.64 175 7.37 27.1 7% 9% 77% 8%S No 19 I02A Microvascular Tissue Transfer or (Skin Graft W Cat or Sev CC), Excluding Hand 5.58 308 8.93 24.9 16% 5% 63% 17%M No 20 F61A Infective Endocarditis W Catastrophic CC 5.46 59 6.63 26.9 3% 13% 82% 1%
12 Sub-total, top 20 highest miscellaneous cost-weight DRGs 7.21 2,545 16.58 30.9 5% 46% 43% 5%in R16 All DRGs 0.51 2,753,670 1.00 2.5 21% 6% 51% 23%Top 20 Top 20 Miscellaneous cost-weight DRGs, % of all DRGs 0.1%
Oper Rooms &
Spec Proc Critical
CareMisce-
llaneous Prosthe
ses
Notes : (a) For cost weight (cost bucket specific) calculations please refer to the "Appendix A: Glossary of NHCDC terms". DRGs with fewer than 5 separations or 3 participating hospitals are excluded from the above table. (b) Separations shown are weighted using the methodology described in Section 3.5 (c) Cost weight for total costs (e) ALOS means average length of stay (f) Derived from the cost weights shown in Appendix F, divided by the overall cost weight shown in (c).
Overnight Private HospitalsPwC

Summary of results
DRG Analysis – Operating room and Specialist Procedure Suite (“ORSPS”) cost weightsAcross all DRGs, the ORSPS cost weight is 0.21, which means that ORSPS costs on average represent 21% of total costs incurred. The 20 DRGs with the highest ORSPS cost weights are all surgical DRGs. DRG J01A (“Microvas Tiss Transf For Skin, Subcutaneous Tiss & Breast Disd W Cat/Sev Cc”) has an ORSPS cost weight of 2.52, which means that the average ORSPS cost for this DRG is 2.52 times the overall average cost of all separations. This DRG has an average length of stay of 11.7 days. J01B (“Microvas Tiss Transf For Skin, Subcutaneous Tiss & Breast Disd W/O Cat/Sev Cc”) is ranked 2 and I06Z (“Spinal Fusion W Deformity”) is ranked 3. These DRGs are characterised by a combined average length of stay of 13.5 days which is significantly longer than the overall average length of stay of 2.5 days. Overall, the proportion of costs incurred in the critical care cost bucket for this group of DRGs is 23%, which is higher than 6% for all DRGs.
Table 10Twenty DRGs with the highest cost weight for Operating rooms and Specialist Procedure Suites, AR-DRG 6.0x, Round 17 (2012/13)
% of DRG Total Cost (f)Indicator: OR and SPS Overall
DRG Top 20 Cost Cost ALOSType R16? DRG Description Weight Separations Weight (days)
(a) (b) (c) (e)
S Yes 1 J01A Microvas Tiss Transf for Skin, Subcutaneous Tiss & Breast Disd W Cat/Sev CC 2.52 144 6.89 11.7 37% 12% 45% 6%S Yes 2 J01B Microvas Tiss Transf for Skin, Subcutaneous Tiss & Breast Disd W/O Cat/Sev CC 2.18 251 5.02 7.5 43% 6% 40% 10%S Yes 3 I06Z Spinal Fusion W Deformity 1.97 793 15.57 10.0 13% 4% 22% 61%S Yes 4 F07A Other Cardiothoracic/Vascular Procedures W CPB Pump W Catastrophic CC 1.94 251 11.73 12.9 17% 35% 37% 11%S Yes 5 A06A Tracheostomy W Ventilation >95 hours W Catastrophic CC 1.81 277 43.27 52.5 4% 61% 31% 4%S Yes 6 F07B Other Cardiothoracic/Vascular Procedures W CPB Pump W Severe or Moderate CC 1.77 126 7.45 8.2 24% 22% 42% 12%S No 7 A06D Tracheostomy W/O Catastrophic CC 1.75 74 6.72 11.2 26% 32% 35% 7%S Yes 8 I15Z Cranio-Facial Surgery 1.59 161 4.39 5.1 36% 12% 30% 22%S Yes 9 F03A Cardiac Valve Proc W CPB Pump W Invasive Cardiac Investigation W Cat CC 1.58 467 12.98 17.5 12% 21% 41% 25%S Yes 10 F04A Cardiac Valve Proc W CPB Pump W/O Invasive Cardiac Inves W Cat CC 1.56 2,236 10.69 11.9 15% 23% 35% 27%S Yes 11 W04A Other OR Procs for Multiple Significant Trauma W Catastrophic or Severe CC 1.56 18 11.41 32.4 14% 6% 61% 20%S No 12 H01A Pancreas, Liver and Shunt Procedures W Catastrophic CC 1.48 555 7.93 15.5 19% 19% 53% 9%S Yes 13 I09A Spinal Fusion W Catastrophic CC 1.47 833 13.41 13.6 11% 6% 32% 51%S Yes 14 F05A Coronary Bypass W Invasive Cardiac Investigation W Reoperation or W Cat CC 1.43 758 9.42 15.2 15% 30% 45% 10%S Yes 15 F07C Other Cardiothoracic/Vascular Procedures W CPB Pump W/O CC 1.43 115 6.11 7.3 23% 26% 42% 8%S Yes 16 I02A Microvascular Tissue Transfer or (Skin Graft W Cat or Sev CC), Excluding Hand 1.40 308 8.93 24.9 16% 5% 63% 17%S No 17 P06A Neonate, AdmWt >2499 g W Significant OR Procedure W Multi Major Problems 1.40 28 27.69 36.6 5% 68% 27% 0%S No 18 F03B Cardiac Valve Proc W CPB Pump W Invasive Cardiac Investigation W/O Cat CC 1.38 209 9.20 9.3 15% 17% 38% 30%S Yes 19 F04B Cardiac Valve Proc W CPB Pump W/O Invasive Cardiac Inves W/O Cat CC 1.36 1,427 7.84 8.7 17% 20% 34% 28%S No 20 D02A Head and Neck Procedures W Catastrophic or Severe CC 1.36 153 4.32 7.1 31% 15% 49% 5%
15 Sub-total, top 20 highest ORSPS cost-weight DRGs 1.58 9,184 11.17 13.5 14% 23% 35% 27%in R16 All DRGs 0.21 2,753,670 1.00 2.5 21% 6% 51% 23%Top 20 Top 20 OR and SPS cost-weight DRGs, % of all DRGs 0.3%
Oper Rooms &
Spec Proc Critical
CareMisce-
llaneous Prosthe
ses
Notes: (a) For cost weight (cost bucket specific) calculations please refer to the "Appendix A: Glossary of NHCDC terms". DRGs with fewer than 5 separations or 3 participating hospitals are excluded from the above table. (b) Separations shown are weighted using the methodology described in Section 3.5 (c) Cost weight for total costs (e) ALOS means
Overnight Private HospitalsPwC

Summary of results
average length of stay (f) Derived from the cost weights shown in Appendix F, divided by the overall cost weight shown in (c).
Overnight Private HospitalsPwC

Summary of results
DRG Analysis – Critical Care cost weightTen of the top 20 DRGs with the highest critical care cost weight are neonate DRGs.
The DRG with the highest critical care cost weight of 40.39 is for P61Z “Neonate, Admwt <750 G”. The overall cost weight for this DRG is 50.39 therefore the critical care cost bucket is a significant proportion (80%, equal to 40.39 / 50.39) of the total costs incurred for this DRG. This DRG had an average length of stay of 84 days.
For all DRGs, critical care costs represent 6% of total costs. However, for this group of high critical care cost-weight DRGs, critical care costs represent a significant proportion (56% for the top-20) of total costs incurred. These DRGs have a combined average length of stay of 28.2 days, significantly higher than the 2.5 average across all DRGs.
There has been some movement in the rankings since Round 16, with only 10 of the 20 shown below ranked in the top 20 last year. These changes are likely due to the use of feeder data by many hospitals this year for critical care costs, compared to the use of service weights last year. Since feeder data has been used for critical care costs by many hospitals, the current round is likely to be more reflective of relative resource usage for the private sector than Round 16.
Overnight Private HospitalsPwC

Summary of results
Table 11Twenty DRGs with the highest cost weight for Critical Care costs, AR-DRG 6.0x, Round 17 (2012/13)
% of DRG Total Cost (f)Indicator: Critical Care Overall
DRG Top 20 Cost Cost ALOSType R16? DRG Description Weight Separations Weight (days)
(a) (b) (c) (e)
M N/A 1 P61Z Neonate, AdmWt <750 g 40.39 21 50.39 84.0 0% 80% 20% 0%M Yes 2 P62Z Neonate, AdmWt 750-999 g 31.65 41 39.45 64.8 0% 80% 19% 0%S Yes 3 A06A Tracheostomy W Ventilation >95 hours W Catastrophic CC 26.52 277 43.27 52.5 4% 61% 31% 4%S Yes 4 P03Z Neonate, AdmWt 1000-1499 g W Significant OR Procedure 19.55 44 23.97 42.3 0% 82% 18% 0%S Yes 5 P06A Neonate, AdmWt >2499 g W Significant OR Procedure W Multi Major Problems 18.81 28 27.69 36.6 5% 68% 27% 0%S Yes 6 P04Z Neonate, AdmWt 1500-1999 g W Significant OR Procedure 15.08 32 21.71 36.9 1% 69% 29% 0%S N/A 7 P05Z Neonate, AdmWt 2000-2499 g W Significant OR Procedure 10.28 13 14.03 24.0 7% 73% 20% 0%S Yes 8 A06B Trach W Vent >95 hours W/O Cat CC or Trach/Vent >95 hours W Cat CC 9.17 803 18.02 27.6 6% 51% 36% 7%O Yes 9 B42A Nervous System Diagnosis W Ventilator Support W Catastrophic CC 5.42 10 8.00 6.6 0% 68% 32% 0%O Yes 10 E40A Respiratory System Diagnosis W Ventilator Support W Catastrophic CC 5.06 76 8.98 16.2 1% 56% 42% 1%M No 11 P65B Neonate, AdmWt 1500-1999 g W/O Significant OR Procedure W Major Problem 4.97 212 9.36 25.7 0% 53% 47% 0%M No 12 P64Z Neonate, AdmWt 1250-1499 g W/O Significant OR Procedure 4.61 143 10.52 30.8 0% 44% 56% 0%O Yes 13 F40A Circulatory System Diagnosis W Ventilator Support W Catastrophic CC 4.36 45 7.14 11.8 3% 61% 34% 2%M No 14 P65A Neonate, AdmWt 1500-1999 g W/O Significant OR Proc W Multi Major Problems 4.31 18 11.58 26.1 0% 37% 63% 0%O No 15 F43Z Circulatory System Diagnosis W Non-Invasive Ventilation 4.18 126 7.05 16.0 1% 59% 39% 0%S No 16 F07A Other Cardiothoracic/Vascular Procedures W CPB Pump W Catastrophic CC 4.14 251 11.73 12.9 17% 35% 37% 11%M No 17 P63Z Neonate, AdmWt 1000-1249 g W/O Significant OR Procedure 4.01 47 10.01 25.6 0% 40% 60% 0%S Yes 18 W01Z Ventilation or Cranial Procedures for Multiple Significant Trauma 3.65 8 16.90 35.8 8% 22% 44% 26%O No 19 T40Z Infectious and Parasitic Diseases W Ventilator Support 3.26 29 5.46 10.5 2% 60% 38% 0%M No 20 P65C Neonate, AdmWt 1500-1999 g W/O Significant OR Procedure W Other Problem 3.11 268 7.18 20.5 0% 43% 57% 0%
10 Sub-total, top 20 highest critical care cost-weight DRGs 9.63 2,494 17.32 28.2 5% 56% 36% 4%in R16 All DRGs 0.06 2,753,670 1.00 2.5 21% 6% 51% 23%Top 20 Top 20 Critical Care cost-weight DRGs, % of all DRGs 0.1%
Oper Rooms &
Spec Proc Critical
CareMisce-
llaneous Prosthe
ses
Notes: (a) For cost weight (cost bucket specific) calculations please refer to the "Appendix A: Glossary of NHCDC terms". DRGs with fewer than 5 separations or 3 participating hospitals are excluded from the above table. (b) Separations shown are weighted using the methodology described in Section 3.5 (c) Cost weight for total costs (e) ALOS means average length of stay (f) Derived from the cost weights shown in Appendix F, divided by the overall cost weight shown in (c).
Overnight Private HospitalsPwC 36

Summary of results
DRG Analysis – Prosthesis cost weightThe prostheses cost weight for all DRGs is 0.23, i.e. prostheses costs represent 23% of total costs, making it one of the larger cost buckets for the overnight private hospital sector.
All of the Top-20 prostheses cost-weight DRGs are surgical DRGs. The 3 highest-ranked DRGs are:
F01A “Implantation or Replacement of AICD (Automatic Implantable Cardioverter-Defibrillator), Total System W Catastrophic Complications and/or co-morbidities”, the highest prostheses cost-weight rank. The prostheses cost for this DRG is 21.69 times the overall average cost per separation for all DRGs, while the overall cost weight for this DRG is 28.76. Therefore, the prostheses cost bucket is a significant proportion (75% = 21.69 / 28.76) of the costs for this DRG. The average length of stay is 7.6 days;
F01B “Implantation or Replacement of AICD, Total System W/O Catastrophic CC (catastrophic complications and/or co-morbidities)”, the 2nd highest-ranked DRG for the prostheses cost weight at 19.61. For this DRG, prostheses costs represent 84% of the total cost. The average length of stay (“ALOS”) is 2.2 days which is shorter than the ALOS for all DRGs and is notably shorter than the ALOS of 7.6 days for DRG F01A;
I06Z “Spinal Fusion w Deformity”, the 3rd highest-ranked DRG for the prostheses cost weight at 9.57. For this DRG, prostheses costs represent 61% of the total cost. The ALOS is 10.0 days.
For the 20 highest-ranked prostheses cost weight DRGs, prostheses costs represent a significant proportion of total costs (68%). There has been some movement in the rankings since Round 16, with 15 of this year’s top 20 ranked in the top 20 last year. These changes are likely due to the use of feeder data by many hospitals this year for prosthetics costs, compared to the use of service weights last year. Since feeder data has been used for prostheses costs by many hospitals, the current round is likely to be more reflective of relative resource usage for the private sector than Round 16.
Overnight Private HospitalsPwC

Summary of results
Table 12Twenty DRGs with the highest cost weight for Prostheses costs, AR-DRG 6.0x, Round 17 (2012/13)
% of Total Cost (f)Indicator: Prostheses Overall
DRG Top 20 Cost Cost ALOSType R16? DRG Description Weight Separations Weight (days)
(a) (b) (c) (e)
S Yes 1 F01A Implantation or Replacement of AICD, Total System W Catastrophic CC 21.69 300 28.76 7.6 2% 4% 19% 75%S Yes 2 F01B Implantation or Replacement of AICD, Total System W/O Catastrophic CC 19.61 2,268 23.46 2.2 2% 1% 13% 84%S Yes 3 I06Z Spinal Fusion W Deformity 9.57 793 15.57 10.0 13% 4% 22% 61%S Yes 4 D01Z Cochlear Implant 8.90 522 11.67 1.6 7% 0% 16% 76%S Yes 5 A12Z Insertion of Neurostimulator Device 8.49 1,800 11.20 3.6 5% 1% 18% 76%S Yes 6 A11B Insertion of Implantable Spinal Infusion Device W/O Catastrophic CC 7.06 36 10.78 8.5 5% 3% 26% 66%S Yes 7 I09A Spinal Fusion W Catastrophic CC 6.79 833 13.41 13.6 11% 6% 32% 51%S Yes 8 A11A Insertion of Implantable Spinal Infusion Device W Catastrophic CC 5.71 14 13.52 23.2 4% 8% 46% 42%S Yes 9 I32A Knee Revision W Catastrophic CC 5.61 197 12.34 19.1 8% 4% 42% 45%S Yes 10 I01A Bilateral/Multiple Major Joint Proc of Lower Extremity W Revision or W Cat CC 5.32 284 11.70 17.4 10% 5% 39% 45%S No 11 F17A Insertion or Replacement of Pacemaker Generator W Catastrophic or Severe CC 5.17 110 7.53 5.3 6% 3% 22% 69%S Yes 12 I09B Spinal Fusion W/O Catastrophic CC 5.15 9,801 8.35 6.1 11% 2% 25% 62%S No 13 F12A Implantation or Replacement of Pacemaker, Total System W Catastrophic CC 5.02 579 9.52 11.7 6% 11% 30% 53%S Yes 14 I01B Bilateral/Multiple Major Joint Pr of Lower Extremity W/O Revision W/O Cat CC 4.97 1,887 8.38 7.2 10% 3% 28% 59%S No 15 F12B Implantation or Replacement of Pacemaker, Total System W/O Catastrophic CC 4.90 6,705 6.92 3.0 6% 4% 19% 71%S Yes 16 I32B Knee Revision W Severe CC 4.59 321 8.76 11.0 10% 2% 35% 52%S No 17 F17B Insertion or Replacement of Pacemaker Generator W/O Catastrophic or Severe CC 4.51 2,157 5.75 1.5 5% 1% 15% 79%S No 18 W01Z Ventilation or Cranial Procedures for Multiple Significant Trauma 4.43 8 16.90 35.8 8% 22% 44% 26%S Yes 19 I05A Other Joint Replacement W Catastrophic or Severe CC 4.23 332 8.15 9.5 11% 4% 33% 52%S Yes 20 I31A Hip Revision W Catastrophic CC 4.08 328 11.01 21.2 10% 8% 46% 37%
15 Sub-total, top 20 highest prosthetic cost-weight DRGs 6.74 29,275 9.90 5.4 8% 3% 22% 68%in R16 All DRGs 0.23 2,753,670 1.00 2.5 21% 6% 51% 23%Top 20 Top 20 Protheses cost-weight DRGs, % of all DRGs 1.1%
Oper Rooms &
Spec Proc Critical
CareMisce-
llaneous Prosthe
ses
Notes: (a) For cost weight (cost bucket specific) calculations please refer to the "Appendix A: Glossary of NHCDC terms" (b) Separations shown are strata weighted. (c) DRG cost weight across all cost buckets. (e) ALOS means average length of stay
Overnight Private HospitalsPwC 38

Summary of results
ConclusionsIn summary:
Six of the 20 highest-ranked DRGs by overall cost weight are neonate DRGs. The highest cost-weight DRG is P61Z “Neonate, Admission Weight less than 760grams”. DRGs with the 20 highest cost-weights represent 5.0% of total costs but only 0.3% of separations;
Five of the top 20 by volume DRGs are from the Major Diagnostic Category “Diseases and disorders of the digestive system”). The DRG with the highest volume in 2012/13 is R63Z Chemotherapy. DRGs with the 20 highest-ranked volume represent 44% of all separations in 2012/13, and 23% of total costs. A high proportion of these separations are same-day separations;
The 3 highest-ranked DRGs by cost-weighted separations represent 12.3% of total hospital costs in 2012/13: I04B “Knee Replacement W/O Catastrophic or Severe CC”, I03B “Hip Replacement W/O Catastrophic CC”, and I09B “Spinal Fusion W/O Catastrophic CC”. Nineteen of these DRGs were ranked in the top 20 in Round 16, indicating that the DRGs accounting for a significant proportion of total hospital costs in 2012/13 also accounted for total hospital costs in 2011/12;
The DRG profile for Round 17 is relatively consistent with the Round 16 DRG profile, as 19 of the 20 highest-ranked DRGs by volume were also ranked in the top 20 in Round 16. However, when DRGs are ranked by total costs or by cost buckets, there has been more movement between rounds. Since feeder data has been used for by many hospitals this year, the current round is likely to be more reflective of relative resource usage for the private sector than Round 16.
Overnight Private HospitalsPwC

Appendix A Glossary of NHCDC termsActual data: The hospital data received by the NHCDC that is used as the sample data to produce national average costs. Actual data (or sample data) is used in the estimation process as defined by the NHCDC (see Estimated).
Note: As actual data is a sample only; caution should be taken when comparing this data as it is not necessarily representative of the population.
Acute inpatient: An admitted patient whose illness is acute, and has one or more problems which require short–term health care in an admitted patient setting.
In the Casemix context, episodes of care which can appropriately be classified by AR–DRG, and which do not meet the definitions for rehabilitation, palliation, or non–acute admitted patient.
Admitted patient: A patient who has been formally admitted to a hospital.
Further, admitted patients are categorised by care type into acute, rehabilitation, palliation, and non-acute.
Adjacent DRGs: Adjacent DRGs consist of one or more DRGs generally defined by the same diagnosis or procedure code list. DRGs within adjacent DRGs have differing levels of resource consumption and are partitioned on the basis of several factors, including complicating diagnoses/procedures, age and/or the patient clinical complexity level (PCCL).
The fourth character of a DRG code represents the severity of a DRG. A severity code of "A” indicates the highest consumption of resources; a severity code of "B" indicates the next highest consumption of resources; code "C" indicates the next highest consumption of resources; and severity code "D" indicates the least consumption of resources within a DRG.
A severity code of "Z" indicates that there is no split for the DRG. Therefore the adjacent DRG data for DRG with a severity code of "Z" has no change to the cost by volume.
ALOS: See average length of stay.
AR–DRG: See Australian Refined Diagnosis Related Groups.
Australian Refined Diagnosis Related Groups (AR–DRGs): A variant of the DRG system designed specifically for use in Australia. The national standard. The current version in use is Version 6.0x, which recognises 702 categories of DRG.
Average cost: In the costing context, the total cost of production divided by the number of products in a period. Also known as full average cost.
Average Length of Stay (ALOS): The ALOS is calculated by dividing the number of days by the number of separations for each DRG. The calculation of ALOS includes all days and separations. That is, no trimming is applied when calculating this statistic. In other national reporting, length of stay is adjusted to remove leave days, however this adjustment was not applied in this report because most hospitals did not supply leave days.
falseOvernight Private Hospitals4141Prospect name41Prospect name41

Care type: The overall nature of a clinical service provided to an admitted patient during an episode of admitted care (e.g. acute, rehabilitation, palliative, psychogeriatric, maintenance, newborn and other admitted patient care).
Cost buckets: Also known as ‘cost components’, cost buckets determine the detail of the reporting framework for NHCDC products. For a complete list of the cost buckets and what they include and exclude, see the Definitions chapter in the Hospital Reference Manual.
Cost centre (CC): An accounting entity where all costs associated with a particular type of activity can be recorded. Sometimes abbreviated to CC.
Cost modelling (CM): A popular for a type of product costing which makes minimal use of measures of resource consumption by individual patients, and aims only to estimate mean costs for classes of patients. CM sites are hospitals that ‘model’ their cost centres using pre-determined statistics and ‘weights’ in order to apportion their costs across product groups and types. This is also known as ‘top down’ costing because you start with an aggregate cost and apportion it across cost centres.
Cost weight (total): The average cost across all AR–DRGs for the total cost is chosen as the reference value, and given a weight of 1. A cost weight of an AR-DRG is calculated as the average total cost for that AR-DRG divided by the reference value. The formula to calculate the cost weight is:
Costweight DRG=Average cos tDRGAverage cos tAll
Example for AR-DRG = "XXX"
Average Cost across All DRGs = $80 Total Average Cost for DRG:XXX = $100"XXX" Total Cost Weight = $100/$80 = 1.25
Cost weight (specific cost bucket): A cost weight for an AR-DRG for a specific cost bucket is calculated as the average cost for that AR-DRG and relevant cost bucket, divided by the reference value. The reference value equals the total average cost across all AR-DRGs, as per that used in the Cost Weight (Total Costs).The formula to calculate the cost weight is:
Costweightc , DRG=Average cos t c, DRGAveragecos t All, All
Where:
c is the specific cost bucket or combination of cost buckets
Example for AR-DRG = "XXX
Average Cost across all DRGs = $80 Total Average Cost for DRG:XXX = $100Critical Care Average Cost for DRG: XXX = $40"XXX" Critical Care Cost Weight = $40/$80 = 0.5
Cost-weighted separations: This is calculated as the DRG cost weight (total costs), multiplied by the number of separations for a given DRG, and aggregated across a set of DRGs. It is an indicator of the relative resource consumption of acute care hospitals. The formula to calculate cost-weighted separations is:
falseOvernight Private Hospitals4242Prospect name42Prospect name42

Further detail on the costing process
Cost−weighted separations=∑i
k
n i×CW i
Where:
ni is the number of separations in the ith DRGk is the number of DRGs (in AR-DRGv6.0x it is 702)CWi is the cost weight (total cost) for the ith DRG
Critical Care Unit: A patient care area in a hospital which is staffed and equipped to handle patients at particular risk due to high severity of illness. Includes intensive care units, neonatal intensive care units and coronary care units.
Direct cost centre: In the product costing context, cost centres are generally classified as either overhead or direct product. The latter type is also known as ‘Direct Cost Centres’.
Direct products are those able to be delivered directly to the customer. The main types of direct products are patient episodes of care. Direct product cost centres therefore include all those which provide their services to patients rather than to other cost centres (as is the case for overhead cost centres). Examples are nursing, emergency department, and imaging.
Estimated data: The total costs are estimated by, increasing within each stratum, the sample of hospitals data to the estimated volumes for the total population. The aim is to minimise bias in the collection caused by the sample of the participating hospitals, by weighting the sample results according to the known characteristics of the population.
Grouper: An analytical tool (usually a computer program) which supports the assignment of patient care episodes to Casemix classes.
ICU: Intensive Care Unit. See Critical Care Unit.
Indirect costs: Used in several ways to designate costs which are not easily able to be related to specific products. In the standard product costing method, costs which are passed to cost centres from overhead cost centres.
Inpatient: See admitted patient.
Intensive Care Unit (ICU): See Critical Care Unit.
Length of stay (LOS): The number of days an inpatient spends in hospital. It is calculated in different ways for different purposes. The most common involves subtracting the admission date from the discharge date. In other national reporting, length of stay is adjusted to remove leave days, however this adjustment was not applied in this report because most hospitals did not supply leave days.
Overhead costs: In the product costing context, cost centres are generally classified as either overhead or direct products (patient care). An overhead cost centre provides its services to other cost centres rather than directly to patients (as is the case for patient care cost centres). Examples are building costs and linen services.
Overnight Private HospitalsPwC 43

Further detail on the costing process
Patient costing (PC): A generic term for a type of product costing which makes use of
measures of resource consumption by individual patients, and aims to estimate costs for each individual patient care episode. PC sites are hospitals that are able to calculate the cost of care at the patient level. Generally, this is done using actual patient level consumption data.
The PC method of costing is also known as a ‘bottom up’ method of costing because cost aggregates are devised from individual items of patient consumption.
Service weights: The relative costs of a service for each type of patient care product. For example, the relative costs of imaging or nursing across all ARDRGs. Also known as service weights.
Separations: The NHDD version 15.0 defines a separation as “the process by which an episode of care for an admitted patient ceases”.
Standard error: Standard errors, reported against DRG cost weights in tables across the Cost Weights Report, indicate the reliability of cost weights in terms of variation in costs and variation from the sample design.
Weighted separation: see cost-weighted separation.
Overnight Private HospitalsPwC 44

Appendix B Analysis performed to determine the minimum sample sizePrior to the commencement of the Round 16 collection, the minimum number of separations, number of hospitals and number of hospital groups required to participate was calculated based on data received from the Independent Hospital Pricing Authority (IHPA), the Department of Health, and Private Health Data Bureau dataset (PHDB).
This Appendix describes the methodology and analysis performed to derive the minimum sample size requirements for the collection.
Data analysisIn determining the minimum participation level, the following datasets were received and reviewed:1 The published cost weight tables for Round 13;2 A summary of the NHCDC sample for Round 13 and Round 14, by hospital
and DRG, for the overnight sector;3 From the Private Hospital Data Bureau dataset(PHDB): a summary of the
population levels of activity, showing the total number of separations by hospital in-scope for the collection (at least 200 separations), for Round 13 and Round 14, for the overnight sector;
4 From the PHDB dataset: a summary of the population levels of activity, average length of stay, and standard deviation of the length of stay, by hospital and DRG, for all private hospitals, i.e. for private overnight hospitals and private day hospitals.
Item 1 above was obtained from the Department of Health and Ageing (DoHA) website14. Items 2 and 3 above were provided by IHPA. Item 4 above was provided by DoHA.
In order for the NHCDC sample to be representative of the patient population and the population of private hospitals, minimum participation levels have been specified in terms of:
1 Separation sample size expressed as a percentage of the population levels of activity, where “population” is defined as the total number of separations for hospitals in-scope for the collection. The minimum separation sample size considered to provide sufficient reliability consistent with common statistical practice and historical publication practices was based on the following parameters:a Standard deviation of costs per DRG;b Margin of error in the estimated average cost per DRG; andc Statistical confidence that the estimates fall within the specified
margin of error.
14 http://www.health.gov.au/internet/main/publishing.nsf/Content/Round_13-cost-reports, accessed 3 April 2012
falseOvernight Private Hospitals4545Prospect name45Prospect name45

Further detail on the costing process
Parameters (b) and (c) above were informed by reviewing the minimum sample size considered robust enough for publication in the Round 7 to 13 collections and parameter (a) was derived from the Round 13 cost weights.
2 The minimum number of hospitals that are required to participate, in aggregate and by hospital characteristic, to ensure that the collection is representative of the population of private hospitals; and
3 The minimum number of hospital groups that are required to participate, to ensure that the results represent the population of private hospitals.
Percentage of population separationsA key objective of the collection is to produce estimated costs and cost-weights by classified activity. The percentage of population separations that is required in a sample depends upon the tolerable “margin of error”, statistical confidence15 required, and the standard deviation of costs. To obtain an estimate of the average episode cost of a given DRG, say “k”, within a margin of error m and with x% confidence, the required sample size for DRG(k) is:
sample¿DRG (k )
¿( (Z−scoreof x )×(standarddeviation of episode cost for DRG(k ))(margin of error m) )
2
A dataset with a lower margin of error, higher statistical confidence, and higher standard deviation, will require a larger sample size. The standard deviation of each DRG varies, and so the sample size required for each DRG (given the same parameters for error and confidence) will vary. However, given that the NHCDC collection is a voluntary one, it will be impossible to achieve target samples for each DRG. Hence, the sample sizes across all DRGs were aggregated. In performing this aggregation, two weighting methods were investigated:
1 Number of separations by DRG;2 Total cost by DRG (number of separations per DRG multiplied by the
average cost per DRG).The two approaches resulted in similar minimum samples sizes for overnight and day-only hospitals. For overnight hospitals, a weighting by number of separations resulted in a slightly higher aggregate minimum sample size than weighting the results by total cost.
ResultsFor overnight hospitals, the summary findings of this exercise were that:
approximately 60% of all separations would be required in order to achieve a robust sample;16
the collection should include at least 90 hospitals and 10 hospital ‘groups’ (of 2 or more hospitals) to be representative.
These minimum targets were used as the condition on which the collection would go ahead. Hospitals were requested whether they had an intention to
15 In this context: the probability that an estimate falls within the margin of error of the true mean.16 Defined as 95% confidence level and 4% acceptable margin of error for the overall average cost. The 95%
confidence level and 4% margin of error parameters were informed by considering participation levels in historic publications that were considered acceptable for publication.
Overnight Private HospitalsPwC 46

Further detail on the costing process
participate. The indicative participation rate exceeded the 60% and 90 hospital threshold requirements for the collection to proceed.
Overnight Private HospitalsPwC 47

Appendix C Further detail on the costing processStage 1 – The data collection phaseSteps of the data collection phase for the Round17 private sector collection include:
R17 Data specifications document: hospitals were provided a data specification document detailing data required for participation and the format of the data to be submitted. The data requirements were discussed and agreed with the Round 16 participants and other hospital groups during the focus group, which was held on 11 December 2013.
References to the Australian Hospital Patient Costing Standards (Version 2.0 – 1 March 2011) were included where relevant to guide hospitals on the scope of costs to be included. Guidance was also provided on:
a. how to map hospital cost centres and accounts to the NHCDC line items and cost buckets;
b. the type of activity to be included in the collection;c. the types of costs to be included in the collection; d. the allocation of costs based on the proportion of acute admitted patient
activity (use of patient fractions);e. submitting cost allocation data used for overhead cost allocation;f. submitting feeder data used to allocate Critical Care, Prosthetics and
Operating Theatre costs; andg. examples of these requested data items.
Data submission templates: hospitals were provided data submission templates to guide them through what was required for submission. The templates provided participants with consistent data requirements so that the submitted data could be interpreted in a consistent manner.
Website portal for data submissions: hospitals were provided access to a secure website to submit data which enabled them to upload each of the data inputs. The data collection website contains data validation checks and reasonableness checks which flagged any issues at the point of submission. A real-time summary of hospitals’ data during the data submission process meant that hospitals could correct data anomalies at the time of submission. A confirmation/override was required by the user if the results fell outside of the range.
Election to use the Private Hospital Data Bureau (PHDB) and Hospital Casemix Protocol (HCP) activity data: Access was granted to use the data submitted by private hospitals to the Private Hospital Data Bureau and Hospital Casemix Protocol. Hospitals were given the option to use their PHDB or HCP submissions for the purpose of the Round 17 NHCDC submissions of patient activity and feeder data such as admission records, Prosthetics charges, Operating Theatre and Critical Care minutes.
falseOvernight Private Hospitals4848Prospect name48Prospect name48

Further detail on the costing process
Hospitals were able to access and review the PHDB and HCP datasets via the data collection website and make further changes to these datasets for Round 17 submissions.
A number of hospitals elected to submit their own activity data, rather than to use the submitted PHDB or HCP data, to ensure that the most recent and up to date patient records were used in the costing.
Allocation of overheads to patient care areas: In round 17, participating hospitals were able to provide allocation statistics for allocating costs of overhead cost centres to patient care areas. This represents a change in requirement and costing approach from Round 16 NHCDC. However, the majority of the hospitals did not submit this information and overhead costs were allocated to each patient care area based on that area’s share of the total expenses.
Self Costed Sites: As part of round 17 collection, a small number of hospitals have also participated by submitting costed data using their own costing systems. Many of these hospitals are experienced in hospital costing and have robust systems and reports which are critically reviewed by their internal management. During the data collection phase, discussions were held with all hospitals performing their own costing to understand their key assumptions, while also reviewing their mapping of accounts and costs buckets for consistent reporting for the collection.
Stage 2 – Pre-costing checks and reviewAll participating hospitals were provided with a validation and reasonableness report for them to review before the costing final submission. The reports were distributed to the hospitals for detailed review and resubmission if necessary. Below are some examples of the checks included in these reports:
Initial indicators: Examples include missing activity, spread of activity during the year, benchmark against R16 data - total costs, average cost per episode, total & average LOS, proportion of encounters that are classed as error DRGs;
Reasonableness tests: Examples include care area & Line Item mapping – highlight line items & areas with no costs, average cost per hour for operating theatres, critical care areas and general nursing areas, prosthetics cost allocation – total allocated cost $ vs Actual charge etc;
Variability tests: Examples include Length of Stay by DRG check – highlight each encounter LOS per DRG vs average LOS etc.;
These tests were aimed at identifying where there may be critical errors and highlight these early in the costing process.The reports were also provided to the self-costed hospitals to review the reports for any unexpected or unusual results. Once satisfied with the results of the report, the hospitals finalised their submission for the collection.
Stage 3 – CostingChanges in methodology compared to the Round 16 (2011/12) collectionSome identified differences in processes and assumptions are detailed below:
Overnight Private HospitalsPwC 49

Further detail on the costing process
1 Use of feeder data: The cost modelling approach in Round 16 allocated costs in wards to separations on the basis of fractional bed days, while all other cost centres were allocated to encounters based on service weights. In Round 17, a number of patient level data source or feeder systems were introduced. It was recommended hospitals submit data for prosthesis, operating room and critical care feeder data to improve accuracy of the cost allocation. Hospitals were also able to select the PHDB or HCP submissions as alternative source systems of feeder data.
2 Allocation of overheads to patient care areas: While the majority of hospitals in Round 17 chose not to submit overhead allocation statistics, participating hospitals were able to provide allocation statistics for allocating costs of overhead cost centres to patient care areas.
3 Product fraction: While the scope of R17 Private Sector is limited to acute inpatients only, as many hospitals provide additional products to patients (such as outpatient or emergency department services), it is important to separate out costs relating to those products. As such, participants are asked to enter patient fractions (PFRACs) to indicate how much of each cost centre’s cost relates to each of the hospital products instead of the Inpatient Fraction (IFRAC) used in Round 16.
4 General ledger data: Negative expense accounts were accepted as part of the hospital general ledger submission.
5 Changes in reporting: As discussed and agreed with private hospital representatives, the public report in Round 17 has been expanded to separate prosthesis costs into a separate bucket. DRG information will now be displayed in the following 5 cost weight buckets:
a Total costs
b Operating Room and Special Procedure Suites
c Critical Care
d Prosthesis; and
e Miscellaneous (Including Ward Medical, Ward Nursing, Non-clinical salaries, Pathology, Imagining, Allied Health, Pharmacy, Depreciation, On-costs, Hotel and Supplies.)
Hospital-level quality review checksDuring the costing process, checks were performed at the hospital level, for the following:
1 Consistency between encounter data and ward transfer data;
2 All DRGs are valid DRGs based on DRGv6.0x;
3 Identification and removal of duplicate encounter and transfer records;
4 Reconciliation of allocated costs to the general ledger;
5 Overhead allocation by cost centre and cost bucket;
6 Identification of separations with negative costs;
Overnight Private HospitalsPwC 50

Further detail on the costing process
7 Identification of separations costs lower than $20;
8 Reporting and investigation of the top and bottom 50 separations for episode cost, average cost per day, and length of stay;
9 Statistical outliers by DRG, based on analysis of percentile bands from the Round 16 collection;
10 If a hospital participated in Round 16, a comparison of costs to the previous collection by cost bucket;
11 A comparison of the hospital’s costs by cost bucket, compared what would be expected from the Round 17 collection.
Issues encountered during the data collection and costing phasesBelow is a list of issues associated with the Round 17 collection:
Activity information
Not all of the patient records were submitted to the Private Hospital Data Bureau (PHDB) or Hospital Casemix Protocol (HCP) collection;
Inability to link all ward transfer records to encounter records;
Inaccurate or non-existent ward transfer data (i.e. either transfer time is set to midnight or transfer data was created from the encounter data)
Feeder data
Not all of the patient records were submitted to the Private Hospital Data Bureau (PHDB) or Hospital Casemix Protocol (HCP) collection;
Duplications and mismatches were identified between the Private Hospital Data Bureau (PHDB) or Hospital Casemix Protocol (HCP) data submissions;
A reasonable number of PHDB/HCP patient records with less than 7 minutes of recorded theatre time were identified during data submission and costing process. The majority of Round 17 participating hospitals were impacted by this issue.
A number of hospitals submitted feeder data containing negative duration (theatre and critical care) or theatre/critical care duration exceeding the total episode LOS.
General ledger data
Inconsistent General Ledger structures and the impact on account and cost centre mapping, e.g. some hospitals allocated costs into patient care cost centres directly, whereas some have distinct overhead cost centres. Similarly, there is variation in the level of detail in General Ledger data, e.g. some hospitals only have one cost centre for both a ward and operating theatre, or one cost centre for operating rooms and specialist procedure suites. This is a feature of the variation in hospital structures and must be borne in mind when interpreting the cost weight results;
Costing assumptions and process
Overnight Private HospitalsPwC 51

Further detail on the costing process
Version 6.0x service weights for the public sector (derived from the 2013 National Efficient Pricing dataset for patient costed sites) were used. These weights did not have a weight for Specialist Procedure Suites). The service weights for Operating Rooms were used for Specialist Procedure Suites costs and allocated across all DRGs at a patient episode level. Theatre minutes were not used to allocate Special Procedure Suites costs as separate SPS theatre duration is not available in PHDB or HCP collection.
DRG average duration is used for records containing negative theatre duration.
The majority of these issues have been raised in previous rounds and the approach to resolve these issues was agreed with each hospital.
Feedback provided to hospitalsAfter going through the quality review checks, results from the costing process were sent back to hospitals for review and comment. This reporting included:
The cost of each encounter, split by cost bucket;
A profile of the hospital’s activity and cost data, including:
– Captured occupancy levels per day and month for overnight patients;
– The number of same-day patients per day and month;
– LOS by all DRGs,
– Ward activity (transfer records) and percentage of cost allocation
– Allocated cost by Care areas and Line Items,
– Prosthetics cost allocation check,
– The direct and overhead split by cost bucket.
These reports provided hospitals with overall data to enable a review of the reasonableness of the draft results and to provide comments or queries before the results were finalised.
Overnight Private HospitalsPwC 52

Appendix DStandard error range, Round 17 Private sectorStandard errors, reported against DRG cost weights in tables across the Cost Weights Report, indicate the reliability of cost weights in terms of variation in costs and variation from the sample design. The following tables summarise the reliability of DRG cost weights by grouping the standard errors into a number of ranges.
Numbers of DRGs and separations falling into standard error ranges in column 2 provide insight into the global impact of estimation error on cost weights.
Table 13Number of DRGs by Standard Error range, AR-DRG 6.0x, Private Sector, Round 17
Number of DRGs
Separations
Percentage of DRGs
(%)
Percentageof Total
Separations (%)
0.000 - 0.039 230 2,423,702 33% 88%0.040 - 0.099 147 203,559 21% 7%0.100 - 0.149 87 64,449 13% 2%0.150 - 0.199 47 22,940 7% 1%0.200 - 0.399 101 30,141 15% 1%0.400 + 80 8,836 12% 0%Total* 692 2,753,627* 100% 100%
* The standard error for some DRGs cannot be estimated due to low separation counts in the sample.
The results above show that 54% (33% + 21%) of v6.0x DRGs have cost weight estimates with a standard error range of less than 0.1. Almost 95% of separations are within the subset of DRGs that have standard error less than 0.1.
falseOvernight Private Hospitals5353Prospect name53Prospect name53

Appendix E Costs included in the cost buckets1. Ward Medical: This is also known as Medical Clinical Services, includes the salaries and wages of all medical officers including sessional payments. Note that medical costs may also be found in other buckets that have a medical salary and wages component e.g. Imaging, Pathology, Critical Care, Operating Rooms, Emergency Department, Specialist Procedure Suites, Allied Health and Pharmacy.
2. Ward Nursing: This bucket includes Nursing salaries and wages reported in Clinical Service areas.
3. Non-clinical Salaries: This cost bucket includes all other costs of service provision for each inpatient separation.
4. Pathology: Pathology cost bucket includes costs of diagnostic clinical laboratory testing for the diagnosis and treatment of patients and associated salaries.
5. Imaging: The Imaging cost bucket covers the area of diagnostic and therapeutic imaging produced under the direction of a qualified technician and reported by a medical practitioner and associated salaries.
6. Allied Health: The Allied Health cost bucket includes clinical services which are delivered by qualified Allied Health professionals who have direct patient contact in areas like audiology, physiotherapy, podiatry etc.
7. Pharmacy: The Pharmacy cost bucket covers the area of the hospital responsible for the provision of pharmaceuticals. This includes the purchase, production, distribution, supply and storage of drug products and clinical pharmacy services.
8. Critical Care: The Critical Care cost bucket covers the Intensive Care Unit and Coronary Care Units.
9. Operating Rooms: The Operating Rooms cost bucket covers the area of a hospital where significant surgical procedures are carried out under surgical conditions under the supervision of qualified medical practitioners. The operating room must be equipped to deliver general anaesthesia and conform to the College of Anaesthetists and the Faculty of Intensive Care standards.
10. Emergency Department (ED): The ED cost bucket covers the area of the hospital where patients who present in an unscheduled manner can be triaged, assessed and treated. The ED must conform to the requirements of the Australian Council on Healthcare Standards trauma guidelines, with the capacity to provide complex, multi-system life support (including mechanical ventilation and invasive cardiovascular monitoring) for a limited period of time.
11. Supplies: ‘Supplies’ is an abbreviation for the Supplies and Ward Overheads cost bucket. It includes costs for goods and services, medical and surgical supplies, ward overheads and clinical department overheads. In other words, it includes all costs attributed to a ward that are not included in any other cost buckets.
12. Specialist Procedures Suites (SPS): The SPS includes costs equipped specifically to provide an environment where diagnostic and therapeutic falseOvernight Private Hospitals5555Prospect name55Prospect name55

procedures can be performed under the direction of suitably qualified medical practitioners. Does not include Operating Room costs.
13. On-costs: The On-costs cost bucket includes superannuation, termination payments, workers compensation, long service leave etc.
14. Prostheses: The Prostheses cost bucket includes the costs of all prostheses appearing on hospital accounts and costs incurred by the hospital but have not been included in their accounts.
15. Hotel: The Hotel Services cost bucket includes such items as food service, linen, grocery supplies and recorded as overheads.
16. Depreciation: The Depreciation cost bucket includes depreciation for items that are durable, able to support production for an appreciable period of time and purchased outright or donated.
More details on these costs are available in the Hospital Reference Manual on the Casemix website.
falseOvernight Private Hospitals5656Prospect name56Prospect name56

Cost weight tables by DRG
Appendix F Cost weight tables by DRGIntentionally left blank
falseOvernight Private Hospitals5757Prospect name57Prospect name57

Cost weight tables by DRG
Private Sector - Estimated Round 17 (2012-13) AR-DRG 6.0x ReportPrivate Sector Estimated - National Consolidated Cost Weights
List of Caveats and Notes for the Round 17 National Hospital Cost Data Collection (NHCDC) Private Cost Weight Tables
Comparing private hospitals to public hospitalsDirect comparison of total patient costs cannot currently be made between private and public hospitals. Private hospital treatment may include medical, pharmacy, and pathology costs that are not included in existing private hospital cost information. These costs are included in public cost information.
Private NHCDC1. For the NHCDC Private sector data note:
a. the Private Hospitals Data Bureau data may have been supplied inconsistently by some private hospitals and as a result
national definitions such as care type may not be recorded consistently;b. hospitals may not have provided the general ledger data in the requested format; this may result in some inappropriate
allocation of costs i.e. large direct costs such as pharmacy included in overhead cost centres instead of pharmacy cost centres;
c. a mixture of patient costing and cost modelling approaches have been adopted for Round 17. Refer to the main report, Section 3.4, which describes the costing allocation processes and methodology;
d. the version 6.0x service weights have gaps - these weights did not have a weight for Specialist Procedure Suites.The service weights for Operating Rooms were adopted.
Confidentiality Rules2 To protect the patient and hospital confidentiality:
a. DRGs with less than 5 separations are marked '*****' in the cost weight table; andb. if the number of contributing hospitals for a particular DRG is less than 3, DRGs are marked ' -----' in the cost weight
table.
falseOvernight Private Hospitals5858Prospect name58Prospect name58

Cost weight tables by DRG
Introductory Notes to Cost WeightsThese notes provide assistance in interpreting the cost weight tables that follow. For further information, see Glossary of the National Hospital Cost Data Collection Cost Report Round 17 (2012-13) For Overnight Private Hospitals. Further detail of NHCDC terms can be found in the Australian Hospital Patient Costing Standards (v2.0), which is found athttp://www.ihpa.gov.au/internet/ihpa/publishing.nsf/Content/Australia-Hospital-Patient-Costing-Standards.htm
Additional notesThe sample separations submitted to the NHCDC have been population adjusted in all tables and cost weights except where noted. Hospitals with less than 200 acute separations or classed as same day facilities were excluded from both sample and population hospitals. Seven separations were removed before calculating the cost weights. These separations had costs that were inconsistent with their DRG, and had significant influence on the DRG cost weight and the cost weight relative to adjacent DRGs. One very high cost separation was excluded from DRG A06C (Ventilation >95 hours W/O Catastrophic CC), 3 low cost separations were excluded from DRG P66A (Neonate, AdmWt 1500-1999 g W/O Significant OR Proc W Multi Major Problems), and 3 high cost separations were excluded from DRG P66B (Neonate, AdmWt 1500-1999 g W/O Significant OR Procedure W Major Problem).
Care should be taken when comparing average costs between the public and private sectors as cost components differ between sectors. Please refer to the National Hospital Cost Data Collection Cost Report Round 17 (2012-13) for Overnight Private Hospitals for more detail. Slight differences may occur between figures in the tables displayed in the Round 17 Cost Report and figures displayed in the attached Cost Weight reports due to rounding.
Cost Weight Table ColumnsThe following is a brief explanation of each of the ‘cost bucket’ columns displayed in the Cost Weight Report.
AR-DRG: AR-DRGs or Australian Refined Diagnosis Related Groups is a patient classification scheme that provides a clinically meaningful way of relating the number and types of patients treated in a hospital to the resources required by the hospital.
AR-DRG Description: Descriptive text for the AR-DRG code.
Number of Seps: This column displays the number of separations. A separation is termed to be one complete episode of care for a given patient. Separations are population-adjusted.
Overnight Private HospitalsPwC 59

Cost weight tables by DRG
Number of Days: Number of Days is the sum of lengths of stay of the separations for a given DRG. Length of stay was calculated as the difference between Admission Date and Separation Date, subject to a minimum of 1 day. In other national reporting, length of stay is adjusted to remove leave days, however this adjustment was not applied in this report because most hospitals did not supply leave days.
ALOS: The ALOS is calculated by dividing the number of days by the number of separations for each DRG. The calculation of ALOS includes all days and separations.Cost Weight (Total Costs): The average cost across all AR–DRGs for the total cost is chosen as the denominator for the costs weights, and given a weight of 1. A cost weight of an AR-DRG is calculated as the average total cost for that AR-DRG divided by the average cost across all DRGs..
Example for AR-DRG = "XXX"
Average Cost across All DRGs = $80 Total Average Cost for DRG:XXX = $100"XXX" Total Cost Weight = $100/$80 = 1.25
Cost Weight (specific cost bucket): A cost weight for an AR-DRG for a specific cost bucket is calculated as the average cost for that AR-DRG and relevant cost bucket, divided by the average total cost across all DRGs.
Example for AR-DRG = "XXX"
Average Cost across All DRGs = $80 Total Average Cost for DRG:XXX = $100Critical Care Average Cost for DRG: XXX = $40 "XXX" Critical Care Cost Weight = $40/$80 = 0.5
Cost-bucket specific cost weights are shown for:
Oper. room and Spec Proc SuitesThis column is an abbreviation for "Operating room and Specialist Procedure Suites". It displays the cost weight for the
combined costs, per DRG, of Operating room and Specialist Procedure Suites.
Overnight Private HospitalsPwC 60

Cost weight tables by DRG
Operating Rooms reports costs for a health care facility under sterile conditions, where significant surgical procedures are carried out under the direction of suitably qualified medical practitioners.
Specialist Procedure Suites includes costs equipped specifically to provide an environment where diagnostic and therapeutic procedures can be performed under the direction of suitably qualified medical practitioners. Does not include Operating Room costs.
Critical Care: The Critical Care column displays the cost weight for critical care costs. These costs are the combination of intensive care and coronary care costs.
Prostheses: The Prostheses column displays the cost weight for prostheses costs.Miscellaneous: This column reports the cost weight for the combined costs of all other cost buckets:
Ward Medical: Also known as Medical Clinical Services, this bucket includes the salaries and wages of all medical officers including sessional payments.Ward Nursing: This bucket includes Nursing salaries and wages reported in Clinical Service areas.
Non-clinical Salaries: This cost bucket includes all other costs of service provision for each inpatient separation.
Pathology: This contains the costs recorded from diagnostic clinical laboratory tests for the diagnosis and treatment of patients and associated salaries. Imaging: This contains the costs for diagnostic and therapeutic images produced under the direction of a qualified radiographer or suitably qualified technician and reported by a medical practitioner (radiologist) and associated salaries.
Allied Health: Includes clinical services that are delivered by qualified Allied Health professionals who have direct patient contact in areas like audiology, physiotherapy, podiatry etc.
Pharmacy: Covers the area of the hospital responsible for the provision of pharmaceuticals. This includes the purchase, production, distribution, supply and storage of drug products and clinical pharmacy services.
Supplies: ‘Supplies’ is an abbreviation for the Supplies and Ward Overheads cost bucket. It includes costs for goods and services, medical and surgical supplies, ward and clinical department overheads. In other words, it includes all costs attributed to a ward that are not included in any other cost buckets.
Overnight Private HospitalsPwC 61

Cost weight tables by DRG
On-costs: Includes superannuation, termination payments, workers compensation, long service leave etc.
Hotel: Includes such items as food service, linen, grocery supplies and recorded as overheads.
Depreciation: Includes depreciation for items that are durable, able to support production for an appreciable period of time and purchased outright or donated.
Standard Error: Standard errors indicate the reliability of cost weights in terms of variation in costs and variation from the sample design.
No. of Hosps: This column displays the number of sample hospitals which reported data for a particular AR-DRG.
Additional informationAny additional information can be accessed at the IHPA website:www.ihpa.gov.au
Overnight Private HospitalsPwC 62

Cost weight tables by DRG
Private Sector - Estimated Round 17 (2012-13) AR-DRG 6.0x ReportPrivate Sector Estimated - National Consolidated Cost Weights
Cost Weight for Selected Cost Buckets
DRG DRG Description Total(a)801A OR Procedures Unrelated to Principal Diagnosis W Catastrophic CC 947 18,080 19.09 1.6% 7.3742 0.5455 1.2902 4.2601 1.2784 0.26 56801B OR Procedures Unrelated to Principal Diagnosis W Severe or Moderate CC 1,115 8,579 7.69 7.4% 4.0724 0.4734 0.2999 1.8351 1.4640 0.18 64801C OR Procedures Unrelated to Principal Diagnosis W/O CC 3,143 8,396 2.67 25.0% 1.9421 0.4625 0.0491 0.6768 0.7538 0.06 85960Z Ungroupable 30,402 77,325 2.54 38.3% 1.5767 0.2122 0.0776 0.7902 0.4967 0.02 21961Z Unacceptable Principal Diagnosis 123 476 3.88 15.8% 1.7548 0.0570 0.0000 1.6978 0.0000 0.20 4963Z Neonatal Diagnosis Not Consistent W Age/Weight ****** ****** ****** ****** ****** ****** ****** ****** ****** ****** ******A01Z Liver Transplant ****** ****** ****** ****** ****** ****** ****** ****** ****** ****** ******A03Z Lung or Heart/Lung Transplant ****** ****** ****** ****** ****** ****** ****** ****** ****** ****** ******A05Z Heart Transplant ****** ****** ****** ****** ****** ****** ****** ****** ****** ****** ******A06A Tracheostomy W Ventilation >95 hours W Catastrophic CC 277 14,559 52.55 0.6% 43.2725 1.8126 26.5169 13.2827 1.6603 2.47 38A06B Trach W Vent >95 hours W/O Cat CC or Trach/Vent >95 hours W Cat CC 803 22,136 27.55 2.8% 18.0211 1.1423 9.1699 6.5084 1.2005 0.61 41A06C Ventilation >95 hours W/O Catastrophic CC ****** ****** ****** ****** ****** ****** ****** ****** ****** ****** ******A06D Tracheostomy W/O Catastrophic CC 74 825 11.17 3.8% 6.7227 1.7517 2.1388 2.3810 0.4512 0.56 17A07Z Allogeneic Bone Marrow Transplant 12 287 23.76 58.6% 12.0785 0.4004 0.0000 11.5823 0.0958 1.81 4A08A Autologous Bone Marrow Transplant W Catastrophic CC 155 3,921 25.33 0.0% 8.3189 0.1363 0.7525 7.2922 0.1380 0.77 4A08B Autologous Bone Marrow Transplant W/O Catastrophic CC 45 566 12.57 0.0% 3.5508 0.1072 0.0179 3.3161 0.1095 0.41 7A09A Renal Transplant W Pancreas Transplant or W Catastrophic CC ****** ****** ****** ****** ****** ****** ****** ****** ****** ****** ******A09B Renal Transplant W/O Pancreas Transplant W/O Catastrophic CC ------ ------ ------ ------ ------ ------ ------ ------ ------ ------ ------A10Z Insertion of Ventricular Assist Devices ****** ****** ****** ****** ****** ****** ****** ****** ****** ****** ******A11A Insertion of Implantable Spinal Infusion Device W Catastrophic CC 14 314 23.16 20.6% 13.5196 0.5078 1.0674 6.2318 5.7125 2.59 6A11B Insertion of Implantable Spinal Infusion Device W/O Catastrophic CC 36 305 8.52 0.0% 10.7822 0.5395 0.3393 2.8395 7.0639 1.00 11A12Z Insertion of Neurostimulator Device 1,800 6,520 3.62 11.1% 11.2021 0.5729 0.1013 2.0371 8.4908 0.19 51A40Z ECMO ****** ****** ****** ****** ****** ****** ****** ****** ****** ****** ******B01A Ventricular Shunt Revision W Catastrophic or Severe CC 53 416 7.90 3.2% 3.1386 0.5360 0.3198 1.7239 0.5588 0.32 12B01B Ventricular Shunt Revision W/O Catastrophic or Severe CC 75 322 4.29 6.7% 2.2732 0.5461 0.0915 1.0623 0.5733 0.20 12B02A Cranial Procedures W Catastrophic CC 676 11,789 17.44 4.7% 7.3584 1.0150 1.2641 4.1159 0.9633 0.22 25B02B Cranial Procedures W Severe CC 683 5,982 8.75 6.0% 4.7890 0.8971 0.5962 2.3433 0.9524 0.13 25B02C Cranial Procedures W/O Catastrophic or Severe CC 2,111 12,998 6.16 7.3% 3.8409 0.9242 0.4354 1.6427 0.8385 0.05 29B03A Spinal Procedures W Catastrophic or Severe CC 287 2,663 9.29 1.5% 5.9804 0.8593 0.3543 2.8319 1.9350 0.35 36B03B Spinal Procedures W/O Catastrophic or Severe CC 2,579 8,638 3.35 5.0% 3.2972 0.6251 0.0794 1.0352 1.5576 0.06 54B04A Extracranial Vascular Procedures W Catastrophic CC 153 1,636 10.70 1.1% 5.1130 0.7983 1.3953 2.4799 0.4395 0.41 29B04B Extracranial Vascular Procedures W/O Catastrophic CC 1,225 4,593 3.75 1.4% 2.2257 0.6557 0.3791 0.9084 0.2825 0.04 45B05Z Carpal Tunnel Release 14,798 16,344 1.10 72.1% 0.3023 0.1860 0.0008 0.1109 0.0046 0.00 91B06A Procs for Cerebral Palsy, Muscular Dystrophy, Neuropathy W CC 250 1,526 6.11 25.1% 2.8431 0.4023 0.2014 1.8935 0.3459 0.24 53B06B Procs for Cerebral Palsy, Muscular Dystrophy, Neuropathy W/O CC 4,545 5,860 1.29 49.2% 0.6068 0.2906 0.0049 0.2806 0.0306 0.01 92B07A Peripheral and Cranial Nerve and Other Nervous System Procedures W CC 129 1,621 12.52 7.1% 4.4349 0.4935 0.1927 2.6594 1.0893 0.50 32B07B Peripheral and Cranial Nerve and Other Nervous System Procedures W/O CC 1,485 2,198 1.48 39.5% 0.7551 0.3628 0.0085 0.3289 0.0549 0.03 84B40Z Plasmapheresis W Neurological Disease, Sameday 803 943 1.17 44.8% 0.3425 0.0179 0.0023 0.3004 0.0219 0.03 3B41Z Telemetric EEG Monitoring ****** ****** ****** ****** ****** ****** ****** ****** ****** ****** ******B42A Nervous System Diagnosis W Ventilator Support W Catastrophic CC 10 65 6.56 16.9% 7.9962 0.0137 5.4178 2.5270 0.0377 2.60 4B42B Nervous System Diagnosis W Ventilator Support W/O Catastrophic CC 18 78 4.42 9.4% 4.4758 0.0128 3.0542 1.3983 0.0105 0.68 8B60A Acute Paraplegia/Quadriplegia W or W/O OR Procs W Cat CC 21 832 39.01 0.0% 11.1557 0.3338 0.4599 10.0740 0.2879 3.17 10B60B Acute Paraplegia/Quadriplegia W or W/O OR Procs W/O Cat CC 20 294 14.99 0.0% 5.0489 0.7319 0.3131 2.4832 1.5207 1.08 9B61A Spinal Cord Conditions W or W/O OR Procedures W Catastrophic or Severe CC 91 1,681 18.55 3.1% 5.6228 0.4736 0.5762 3.9839 0.5891 0.50 31B61B Spinal Cord Conditions W or W/O OR Procedures W/O Catastrophic or Severe CC 343 1,352 3.94 16.7% 2.7393 0.4633 0.1103 1.1867 0.9789 0.21 43B62Z Apheresis ****** ****** ****** ****** ****** ****** ****** ****** ****** ****** ******
Percentage of same day
seps incl in ALOS
Number of Seps
Number of days
ALOS (Days)
No. of hospitals
Critical Care (b)
Misce-llaneous
(b)
Oper Rooms & Spec Proc Suites (b)
Prostheses (b)
Standard Error (Total
Cost Weight)
Overnight Private HospitalsPwC 63

Cost weight tables by DRG
Private Sector - Estimated Round 17 (2012-13) AR-DRG 6.0x ReportPrivate Sector Estimated - National Consolidated Cost Weights
Cost Weight for Selected Cost Buckets
DRG DRG Description Total(a)B63Z Dementia and Other Chronic Disturbances of Cerebral Function 1,250 15,515 12.41 3.6% 2.1895 0.0309 0.0176 2.1396 0.0014 0.07 76B64A Delirium W Catastrophic CC 391 5,325 13.62 4.1% 2.8607 0.0718 0.1070 2.6771 0.0048 0.15 51B64B Delirium W/O Catastrophic CC 1,400 10,702 7.65 5.2% 1.4856 0.0231 0.0240 1.4379 0.0006 0.05 79B65Z Cerebral Palsy 153 243 1.59 19.6% 0.3030 0.1000 0.0000 0.2011 0.0018 0.05 16B66A Nervous System Neoplasm W Catastrophic or Severe CC 794 9,595 12.08 2.7% 2.4562 0.0143 0.0341 2.4057 0.0021 0.13 58B66B Nervous System Neoplasm W/O Catastrophic or Severe CC 913 5,529 6.06 19.1% 1.3075 0.0374 0.0154 1.2527 0.0019 0.08 73B67A Degenerative Nervous System Disorders W Catastrophic or Severe CC 614 7,443 12.13 11.3% 2.3954 0.0317 0.1303 2.2260 0.0074 0.11 71B67B Degenerative Nervous System Disorders W Moderate CC 369 2,529 6.85 10.3% 1.3587 0.0247 0.0343 1.2964 0.0034 0.10 55B67C Degenerative Nervous System Disorders W/O CC 3,463 7,710 2.23 43.0% 0.4277 0.0244 0.0052 0.3910 0.0072 0.02 82B68A Multiple Sclerosis and Cerebellar Ataxia W CC 198 1,596 8.07 33.9% 2.3535 0.0274 0.0715 2.2240 0.0306 0.24 31B68B Multiple Sclerosis and Cerebellar Ataxia W/O CC 7,616 9,771 1.28 54.5% 0.2042 0.0067 0.0023 0.1946 0.0007 0.00 64B69A TIA and Precerebral Occlusion W Catastrophic or Severe CC 458 3,667 8.02 2.6% 1.4902 0.0377 0.0888 1.3524 0.0113 0.07 55B69B TIA and Precerebral Occlusion W/O Catastrophic or Severe CC 1,618 5,388 3.33 14.5% 0.6730 0.0423 0.0447 0.5821 0.0039 0.02 69B70A Stroke and Other Cerebrovascular Disorders W Catastrophic CC 899 15,184 16.90 0.7% 3.4668 0.0556 0.1228 3.2781 0.0103 0.10 72B70B Stroke and Other Cerebrovascular Disorders W Severe CC 1,038 9,519 9.17 1.7% 1.9273 0.0429 0.0943 1.7886 0.0015 0.06 66B70C Stroke and Other Cerebrovascular Disorders W/O Catastrophic or Severe CC 1,907 9,813 5.14 7.8% 1.1384 0.0513 0.0657 0.9948 0.0266 0.03 77B70D Stroke and Other Cerebrovascular Disorders, Died or Transferred <5 Days 366 801 2.19 18.6% 0.5674 0.0137 0.0230 0.5288 0.0020 0.03 50B71A Cranial and Peripheral Nerve Disorders W CC 901 6,294 6.98 28.9% 1.4804 0.0300 0.0741 1.3639 0.0124 0.07 74B71B Cranial and Peripheral Nerve Disorders W/O CC 7,935 13,668 1.72 63.1% 0.2856 0.0256 0.0067 0.2497 0.0035 0.01 88B72A Nervous System Infection Except Viral Meningitis W Cat or Sev CC 168 2,040 12.17 14.9% 3.2090 0.0374 0.4030 2.7632 0.0053 0.27 37B72B Nervous System Infection Except Viral Meningitis W/O Cat or Sev CC 482 2,465 5.11 23.6% 1.0986 0.0230 0.0717 0.9919 0.0120 0.06 59B73Z Viral Meningitis 303 1,134 3.75 5.3% 0.8500 0.0263 0.0198 0.8028 0.0010 0.06 39B74A Nontraumatic Stupor and Coma W CC 107 763 7.13 4.2% 1.2905 0.0092 0.1065 1.1749 0.0000 0.11 28B74B Nontraumatic Stupor and Coma W/O CC 234 318 1.36 9.5% 0.3256 0.0284 0.0038 0.2703 0.0231 0.03 30B75Z Febrile Convulsions 21 32 1.53 0.0% 0.8431 0.0075 0.1495 0.6860 0.0000 0.34 5B76A Seizure W Catastrophic or Severe CC 412 3,202 7.78 2.1% 1.7211 0.0192 0.1871 1.5136 0.0011 0.12 51B76B Seizure W/O Catastrophic or Severe CC 1,361 3,977 2.92 11.5% 0.7511 0.0257 0.0711 0.6518 0.0026 0.03 64B77Z Headache 3,298 9,406 2.85 18.7% 0.6474 0.0457 0.0269 0.5729 0.0019 0.11 81B78A Intracranial Injury W Catastrophic or Severe CC 209 2,614 12.50 5.0% 2.5981 0.0395 0.1513 2.4027 0.0045 0.25 43B78B Intracranial Injury W/O Catastrophic or Severe CC 373 1,788 4.79 7.2% 0.9824 0.0125 0.0437 0.9250 0.0012 0.05 50B79A Skull Fractures W Catastrophic or Severe CC 10 184 18.60 0.0% 3.6411 0.1150 0.1257 3.4004 0.0000 1.37 5B79B Skull Fractures W/O Catastrophic or Severe CC 67 226 3.39 25.1% 0.6872 0.0348 0.0919 0.5605 0.0000 0.11 23B80Z Other Head Injury 471 1,401 2.98 20.1% 0.5238 0.0363 0.0146 0.4728 0.0000 0.03 46B81A Other Disorders of the Nervous System W Catastrophic or Severe CC 1,007 12,098 12.01 2.8% 2.4297 0.0442 0.0963 2.2722 0.0169 0.17 71B81B Other Disorders of the Nervous System W/O Catastrophic or Severe CC 3,039 10,312 3.39 24.5% 0.7162 0.0620 0.0173 0.6226 0.0143 0.02 85B82A Chronic and Unspecified Paraplegia/Quadriplegia W or W/O OR Procs W Cat CC 175 4,747 27.13 5.6% 7.3691 0.4816 0.6877 5.6391 0.5607 0.67 34B82B Chronic and Unspecified Paraplegia/Quadriplegia W or W/O OR Procs W Severe CC 198 1,767 8.93 4.7% 2.4210 0.1839 0.1173 1.8872 0.2325 0.29 40B82C Chronic and Unspecified Paraplegia/Quadriplegia W or W/O OR Pr W/O Cat/Sev CC 488 2,004 4.11 29.2% 1.4847 0.2349 0.0396 0.8762 0.3340 0.17 56C01Z Procedures for Penetrating Eye Injury 51 110 2.13 41.4% 0.6853 0.2802 0.0000 0.3294 0.0757 0.06 16C02Z Enucleations and Orbital Procedures 210 331 1.58 26.2% 1.1682 0.5439 0.0058 0.4716 0.1469 0.06 28C03Z Retinal Procedures 8,411 8,609 1.02 8.9% 0.2594 0.1656 0.0000 0.0756 0.0182 0.00 29C04Z Major Corneal, Scleral and Conjunctival Procedures 315 354 1.12 30.5% 1.5065 0.5095 0.0013 0.3492 0.6466 0.05 17C05Z Dacryocystorhinostomy 936 1,066 1.14 32.2% 0.8086 0.4710 0.0116 0.2698 0.0562 0.02 37C10Z Strabismus Procedures 725 807 1.11 24.6% 0.6281 0.3958 0.0011 0.2138 0.0173 0.02 29C11Z Eyelid Procedures 4,621 5,122 1.11 51.7% 0.6302 0.4316 0.0018 0.1935 0.0033 0.01 79C12Z Other Corneal, Scleral and Conjunctival Procedures 1,933 2,041 1.06 61.9% 0.5039 0.3312 0.0000 0.1520 0.0207 0.01 45
Percentage of same day
seps incl in ALOS
Number of Seps
Number of days
ALOS (Days)
No. of hospitals
Critical Care (b)
Misce-llaneous
(b)
Oper Rooms & Spec Proc Suites (b)
Prostheses (b)
Standard Error (Total
Cost Weight)
Overnight Private HospitalsPwC 64

Cost weight tables by DRG
Private Sector - Estimated Round 17 (2012-13) AR-DRG 6.0x ReportPrivate Sector Estimated - National Consolidated Cost Weights
Cost Weight for Selected Cost Buckets
DRG DRG Description Total(a)E42A Bronchoscopy W Catastrophic CC 359 5,853 16.29 1.7% 4.0196 0.2368 0.3287 3.4399 0.0141 0.21 35E42B Bronchoscopy W/O Catastrophic CC 1,674 10,732 6.41 0.9% 1.7068 0.1834 0.0527 1.4128 0.0579 0.04 51E42C Bronchoscopy, Sameday 3,716 4,016 1.08 63.8% 0.2088 0.1115 0.0005 0.0948 0.0020 0.00 54E60A Cystic Fibrosis W Catastrophic or Severe CC 18 161 9.22 0.0% 3.7596 0.0000 0.0000 3.7515 0.0081 0.48 3E60B Cystic Fibrosis W/O Catastrophic or Severe CC 111 386 3.47 9.5% 1.0345 0.0087 0.0058 1.0174 0.0025 0.12 15E61A Pulmonary Embolism W Catastrophic CC 251 2,879 11.48 1.3% 2.7477 0.0241 0.4649 2.2457 0.0130 0.18 49E61B Pulmonary Embolism W/O Catastrophic CC 1,962 11,684 5.96 2.9% 1.2666 0.0188 0.1824 1.0622 0.0031 0.03 72E62A Respiratory Infections/Inflammations W Catastrophic CC 3,886 45,869 11.80 3.0% 2.5110 0.0536 0.2698 2.1658 0.0218 0.05 83E62B Respiratory Infections/Inflammations W Severe or Moderate CC 4,973 34,933 7.02 3.3% 1.4043 0.0296 0.0880 1.2825 0.0043 0.02 85E62C Respiratory Infections/Inflammations W/O CC 5,081 22,214 4.37 7.3% 0.8489 0.0141 0.0252 0.8049 0.0047 0.01 86E63Z Sleep Apnoea 43,513 46,882 1.08 2.2% 0.2709 0.0592 0.0004 0.2099 0.0014 0.00 68E64A Pulmonary Oedema and Respiratory Failure W Catastrophic CC 140 1,107 7.91 6.3% 2.4180 0.0348 0.6019 1.7334 0.0479 0.20 34E64B Pulmonary Oedema and Respiratory Failure W/O Catastrophic CC 255 1,428 5.59 9.7% 1.3605 0.0307 0.2690 1.0586 0.0022 0.11 50E65A Chronic Obstructive Airways Disease W Catastrophic CC 1,888 22,723 12.04 2.6% 2.3314 0.0358 0.2039 2.0803 0.0114 0.05 76E65B Chronic Obstructive Airways Disease W/O Catastrophic CC 7,872 56,191 7.14 4.5% 1.3418 0.0249 0.0595 1.2484 0.0090 0.04 87E66A Major Chest Trauma W Catastrophic CC 141 2,239 15.92 5.5% 3.2469 0.0197 0.5408 2.6748 0.0116 0.31 39E66B Major Chest Trauma W Severe or Moderate CC 412 3,597 8.74 2.7% 1.7798 0.0207 0.1323 1.6262 0.0005 0.12 62E66C Major Chest Trauma W/O CC 262 1,602 6.12 1.9% 1.0997 0.0068 0.0154 1.0775 0.0000 0.07 49E67A Respiratory Signs and Symptoms W Catastrophic or Severe CC 622 3,950 6.35 6.2% 1.3292 0.0452 0.1083 1.1713 0.0043 0.07 60E67B Respiratory Signs and Symptoms W/O Catastrophic or Severe CC 3,167 6,705 2.12 31.1% 0.4897 0.0833 0.0478 0.3459 0.0126 0.01 88E68A Pneumothorax W CC 129 772 5.99 7.1% 1.2735 0.0226 0.2580 0.9846 0.0083 0.12 35E68B Pneumothorax W/O CC 166 440 2.65 8.2% 0.6573 0.0088 0.1461 0.4992 0.0033 0.06 35E69A Bronchitis and Asthma W CC 1,377 9,251 6.72 3.7% 1.3206 0.0336 0.0928 1.1819 0.0123 0.04 71E69B Bronchitis and Asthma W/O CC 2,727 9,050 3.32 9.0% 0.6190 0.0134 0.0274 0.5683 0.0099 0.02 74E70A Whooping Cough and Acute Bronchiolitis W CC 314 1,628 5.18 0.5% 1.7224 0.0055 0.1494 1.5672 0.0002 0.12 23E70B Whooping Cough and Acute Bronchiolitis W/O CC 577 1,333 2.31 6.1% 0.6343 0.0007 0.0095 0.6241 0.0001 0.03 24E71A Respiratory Neoplasms W Catastrophic CC 1,018 11,706 11.50 3.0% 2.4213 0.0673 0.0823 2.2454 0.0263 0.09 70E71B Respiratory Neoplasms W/O Catastrophic CC 4,475 22,716 5.08 16.5% 1.1169 0.0353 0.0211 1.0545 0.0061 0.03 84E72Z Respiratory Problems Arising from Neonatal Period 31 94 2.97 8.9% 1.2261 0.0000 0.2943 0.9318 0.0000 0.79 5E73A Pleural Effusion W Catastrophic CC 243 2,542 10.47 3.4% 2.1587 0.0518 0.2030 1.8579 0.0460 0.11 49E73B Pleural Effusion W Severe or Moderate CC 570 3,197 5.61 6.2% 1.2477 0.0539 0.0940 1.0819 0.0180 0.06 65E73C Pleural Effusion W/O CC 664 1,705 2.57 24.0% 0.5968 0.0492 0.0269 0.5195 0.0013 0.03 66E74A Interstitial Lung Disease W Catastrophic CC 188 2,200 11.71 0.9% 2.4320 0.0213 0.1888 2.2171 0.0049 0.15 46E74B Interstitial Lung Disease W Severe or Moderate CC 295 2,369 8.02 6.8% 1.6139 0.0286 0.0739 1.4985 0.0128 0.08 54E74C Interstitial Lung Disease W/O CC 418 1,877 4.49 21.6% 0.8981 0.0368 0.0264 0.8252 0.0097 0.05 60E75A Other Respiratory System Diagnosis W Catastrophic CC 692 7,566 10.94 2.5% 2.2271 0.0376 0.1944 1.9908 0.0044 0.10 68E75B Other Respiratory System Diagnosis W Severe or Moderate CC 2,269 15,202 6.70 3.6% 1.3291 0.0299 0.0792 1.2130 0.0071 0.03 84E75C Other Respiratory System Diagnosis W/O CC 2,433 9,122 3.75 7.6% 0.7195 0.0260 0.0353 0.6572 0.0010 0.02 81E76Z Respiratory Tuberculosis 6 31 4.87 0.0% 1.1876 0.0028 0.0000 1.1848 0.0000 0.35 5F01A Implantation or Replacement of AICD, Total System W Catastrophic CC 300 2,282 7.62 2.6% 28.7645 0.6560 1.0298 5.3875 21.6912 0.64 32F01B Implantation or Replacement of AICD, Total System W/O Catastrophic CC 2,268 5,000 2.20 11.5% 23.4624 0.5157 0.1896 3.1499 19.6071 0.25 41F02Z Other AICD Procedures 179 720 4.03 7.1% 4.4002 0.4845 0.3250 1.2495 2.3413 0.63 30F03A Cardiac Valve Proc W CPB Pump W Invasive Cardiac Investigation W Cat CC 467 8,188 17.54 6.1% 12.9831 1.5757 2.7856 5.3238 3.2979 0.33 20F03B Cardiac Valve Proc W CPB Pump W Invasive Cardiac Investigation W/O Cat CC 209 1,955 9.35 12.5% 9.2028 1.3850 1.5553 3.5029 2.7596 0.27 19F04A Cardiac Valve Proc W CPB Pump W/O Invasive Cardiac Inves W Cat CC 2,236 26,619 11.90 2.5% 10.6868 1.5588 2.4881 3.7114 2.9285 0.15 22F04B Cardiac Valve Proc W CPB Pump W/O Invasive Cardiac Inves W/O Cat CC 1,427 12,479 8.75 3.9% 7.8366 1.3590 1.5944 2.6610 2.2222 0.08 21
Percentage of same day
seps incl in ALOS
Number of Seps
Number of days
ALOS (Days)
No. of hospitals
Critical Care (b)
Misce-llaneous
(b)
Oper Rooms & Spec Proc Suites (b)
Prostheses (b)
Standard Error (Total
Cost Weight)
Overnight Private HospitalsPwC 65
Cost weight tables by DRG
Private Sector - Estimated Round 17 (2012-13) AR-DRG 6.0x ReportPrivate Sector Estimated - National Consolidated Cost Weights
Cost Weight for Selected Cost Buckets
DRG DRG Description Total(a)F05A Coronary Bypass W Invasive Cardiac Investigation W Reoperation or W Cat CC 758 11,500 15.18 6.4% 9.4170 1.4342 2.8259 4.2188 0.9382 0.26 21F05B Coronary Bypass W Invasive Cardiac Investigation W/O Reoperation W/O Cat CC 571 6,101 10.68 9.0% 6.6003 1.3317 1.6995 3.0722 0.4968 0.14 21F06A Coronary Bypass W/O Invasive Cardiac Inves W Reoperation or W Cat or Sev CC 2,280 23,013 10.09 3.0% 6.4272 1.3263 2.0269 2.6412 0.4329 0.10 22F06B Coronary Bypass W/O Invasive Cardiac Inves W/O Reoperation W/O Cat or Sev CC 722 5,767 7.99 4.2% 5.0127 1.2908 1.3635 2.0577 0.3008 0.10 21F07A Other Cardiothoracic/Vascular Procedures W CPB Pump W Catastrophic CC 251 3,231 12.86 6.0% 11.7291 1.9413 4.1434 4.3425 1.3019 1.21 20F07B Other Cardiothoracic/Vascular Procedures W CPB Pump W Severe or Moderate CC 126 1,030 8.19 2.6% 7.4508 1.7742 1.6522 3.1120 0.9123 0.41 18F07C Other Cardiothoracic/Vascular Procedures W CPB Pump W/O CC 115 841 7.34 0.0% 6.1097 1.4315 1.5884 2.5768 0.5130 0.35 18F08A Major Reconstruct Vascular Procedures W/O CPB Pump W Catastrophic CC 805 11,336 14.08 0.8% 7.9583 1.1888 1.3925 3.5076 1.8693 0.21 37F08B Major Reconstruct Vascular Procedures W/O CPB Pump W/O Catastrophic CC 2,049 12,025 5.87 2.3% 4.8033 0.8621 0.3229 1.5880 2.0304 0.10 48F09A Other Cardiothoracic Procedures W/O CPB Pump W Catastrophic CC 182 2,003 11.01 2.7% 6.1358 0.6793 1.7477 2.5016 1.2072 0.53 25F09B Other Cardiothoracic Procedures W/O CPB Pump W Severe or Moderate CC 154 841 5.46 3.9% 3.8292 0.6413 0.6880 1.4064 1.0935 0.33 28F09C Other Cardiothoracic Procedures W/O CPB Pump W/O CC 329 968 2.94 11.5% 2.6413 0.6187 0.3992 0.8497 0.7737 0.16 35F10A Interventional Coronary Procedures W AMI W Catastrophic CC 454 4,221 9.29 1.5% 5.3554 0.4711 1.3898 1.9291 1.5653 0.18 30F10B Interventional Coronary Procedures W AMI W/O Catastrophic CC 3,103 11,275 3.63 2.7% 3.6396 0.4361 0.6575 0.9032 1.6427 0.04 36F11A Amputation for Circ System Except Upper Limb and Toe W Catastrophic CC 70 2,051 29.43 0.0% 8.3700 0.8663 0.9970 6.2394 0.2673 0.65 22F11B Amputation for Circ System Except Upper Limb and Toe W/O Catastrophic CC 83 1,193 14.40 0.0% 3.6289 0.4813 0.1106 2.9895 0.0474 0.23 21F12A Implantation or Replacement of Pacemaker, Total System W Catastrophic CC 579 6,779 11.72 2.0% 9.5150 0.5441 1.0509 2.9005 5.0196 0.22 39F12B Implantation or Replacement of Pacemaker, Total System W/O Catastrophic CC 6,705 20,251 3.02 4.4% 6.9163 0.4350 0.2790 1.3070 4.8954 0.05 45F13A Upper Limb and Toe Amputation for Circulatory Sys Disorders W Cat or Sev CC 124 2,343 18.91 2.3% 4.3277 0.4277 0.2140 3.4625 0.2235 0.35 32F13B Upper Limb and Toe Amputation for Circulatory Sys Disorders W/O Cat or Sev CC 151 865 5.74 6.1% 1.6622 0.2886 0.0382 1.1824 0.1530 0.13 43F14A Vascular Procs Except Major Reconstruction W/O CPB Pump W Cat CC 748 8,026 10.74 4.8% 4.4328 0.5865 0.4966 2.4379 0.9118 0.14 39F14B Vascular Procs Except Major Reconstruction W/O CPB Pump W Sev or Mod CC 2,237 6,016 2.69 15.2% 2.0432 0.4669 0.1048 0.7583 0.7131 0.04 44F14C Vascular Procs Except Major Reconstruction W/O CPB Pump W/O CC 6,238 9,764 1.57 14.0% 1.5732 0.3975 0.0330 0.4723 0.6704 0.02 63F15A Interventional Coronary Procs W/O AMI W Stent Implantation W Cat or Sev CC 1,749 6,684 3.82 3.0% 3.8924 0.4665 0.5628 1.1018 1.7613 0.06 37F15B Interventional Coronary Procs W/O AMI W Stent Implantation W/O Cat or Sev CC 9,067 17,014 1.88 4.0% 2.9635 0.4096 0.2688 0.6811 1.6041 0.02 39F16A Interventional Coronary Procedures W/O AMI W/O Stent Implantation W CC 149 738 4.94 1.1% 2.7901 0.5466 0.6473 1.0982 0.4980 0.28 28F16B Interventional Coronary Procedures W/O AMI W/O Stent Implantation W/O CC 466 876 1.88 7.8% 1.7857 0.4644 0.2683 0.5406 0.5124 0.08 35F17A Insertion or Replacement of Pacemaker Generator W Catastrophic or Severe CC 110 581 5.27 6.1% 7.5307 0.4762 0.2379 1.6461 5.1706 0.87 29F17B Insertion or Replacement of Pacemaker Generator W/O Catastrophic or Severe CC 2,157 3,219 1.49 29.6% 5.7453 0.2829 0.0587 0.8899 4.5138 0.13 44F18A Other Pacemaker Procedures W CC 79 619 7.88 2.1% 3.5356 0.5129 0.7321 1.7530 0.5377 0.41 21F18B Other Pacemaker Procedures W/O CC 226 497 2.20 9.4% 2.3243 0.3993 0.2009 0.6649 1.0593 0.36 33F19Z Trans-Vascular Percutaneous Cardiac Intervention 488 1,977 4.06 2.0% 4.6268 0.5884 0.2666 1.5897 2.1820 0.16 23F20Z Vein Ligation and Stripping 8,892 10,848 1.22 16.8% 0.7189 0.3971 0.0057 0.3068 0.0093 0.01 79F21A Other Circulatory System OR Procedures W Catastrophic CC 156 3,253 20.90 3.1% 4.5424 0.3879 0.5705 3.5320 0.0520 0.36 40F21B Other Circulatory System OR Procedures W/O Catastrophic CC 593 3,434 5.79 20.9% 1.5922 0.3376 0.0834 1.1045 0.0667 0.09 69F40A Circulatory System Diagnosis W Ventilator Support W Catastrophic CC 45 529 11.82 0.0% 7.1432 0.1978 4.3576 2.4164 0.1713 0.93 15F40B Circulatory System Diagnosis W Ventilator Support W/O Catastrophic CC 12 74 6.02 0.0% 3.3681 0.1221 2.0133 1.2158 0.0169 1.12 6F41A Circulatory Disorders W AMI W Invasive Cardiac Inves Proc W Cat or Sev CC 537 4,076 7.59 6.0% 2.8155 0.2454 1.1742 1.3399 0.0561 0.10 39F41B Circulatory Disorders W AMI W Invasive Cardiac Inves Proc W/O Cat or Sev CC 2,258 7,393 3.27 17.6% 1.3680 0.2203 0.4897 0.6170 0.0410 0.03 40F42A Circulatory Disorders W/O AMI W Invasive Cardiac Inves Proc W Cat or Sev CC 2,291 14,232 6.21 1.9% 2.3824 0.3739 0.6608 1.2757 0.0720 0.05 44F42B Circulatory Disorders W/O AMI W Invasive Cardiac Inves Proc W/O Cat or Sev CC 23,472 48,335 2.06 5.1% 1.1518 0.3607 0.1797 0.5487 0.0626 0.01 46F42C Circulatory Disorders W/O AMI W Invasive Cardiac Inves Proc, Sameday 20,955 22,955 1.10 80.0% 0.4638 0.2323 0.0121 0.1727 0.0467 0.00 44F43Z Circulatory System Diagnosis W Non-Invasive Ventilation 126 2,014 15.98 2.6% 7.0483 0.0813 4.1783 2.7723 0.0165 1.34 30F60A Circulatory Disorders W AMI W/O Invasive Cardiac Inves Proc W Catastrophic CC 499 5,421 10.86 3.1% 2.5641 0.0262 0.7129 1.8218 0.0032 0.14 61F60B Circulatory Disorders W AMI W/O Invasive Cardiac Inves Pr W/O Catastrophic CC 1,928 9,411 4.88 10.1% 1.2203 0.0082 0.4448 0.7578 0.0094 0.04 76F61A Infective Endocarditis W Catastrophic CC 59 1,590 26.91 2.8% 6.6260 0.2024 0.8885 5.4552 0.0799 0.69 22
Percentage of same day
seps incl in ALOS
Number of Seps
Number of days
ALOS (Days)
No. of hospitals
Critical Care (b)
Misce-llaneous
(b)
Oper Rooms & Spec Proc Suites (b)
Prostheses (b)
Standard Error (Total
Cost Weight)
Overnight Private HospitalsPwC 66

Cost weight tables by DRG
Private Sector - Estimated Round 17 (2012-13) AR-DRG 6.0x ReportPrivate Sector Estimated - National Consolidated Cost Weights
Cost Weight for Selected Cost Buckets
DRG DRG Description Total(a)F61B Infective Endocarditis W/O Catastrophic CC 155 2,150 13.83 12.9% 3.0683 0.2048 0.3514 2.4421 0.0700 0.24 35F62A Heart Failure and Shock W Catastrophic CC 3,358 40,668 12.11 2.8% 2.7125 0.0343 0.5167 2.1560 0.0056 0.06 82F62B Heart Failure and Shock W/O Catastrophic CC 7,394 49,268 6.66 5.4% 1.3529 0.0211 0.2198 1.1053 0.0067 0.02 87F63A Venous Thrombosis W Catastrophic or Severe CC 406 3,114 7.68 3.4% 1.6813 0.0443 0.0498 1.5824 0.0048 0.08 61F63B Venous Thrombosis W/O Catastrophic or Severe CC 1,500 7,090 4.73 7.9% 0.8928 0.0233 0.0339 0.8267 0.0089 0.03 73F64A Skin Ulcers in Circulatory Disorders W Catastrophic or Severe CC 248 4,156 16.74 3.8% 3.1838 0.0726 0.1119 2.9880 0.0114 0.26 57F64B Skin Ulcers in Circulatory Disorders W/O Catastrophic or Severe CC 560 3,315 5.92 27.8% 1.1406 0.0558 0.0446 1.0310 0.0092 0.07 64F65A Peripheral Vascular Disorders W Catastrophic or Severe CC 378 3,451 9.13 4.4% 1.8811 0.0817 0.0840 1.6791 0.0362 0.10 62F65B Peripheral Vascular Disorders W/O Catastrophic or Severe CC 3,308 6,370 1.93 42.3% 0.5402 0.1214 0.0280 0.3712 0.0195 0.01 80F66A Coronary Atherosclerosis W Catastrophic or Severe CC 483 4,185 8.66 4.2% 1.5702 0.0212 0.2944 1.2525 0.0022 0.10 56F66B Coronary Atherosclerosis W/O Catastrophic or Severe CC 2,034 5,325 2.62 18.1% 0.5565 0.0249 0.1592 0.3688 0.0036 0.02 72F67A Hypertension W Catastrophic or Severe CC 344 2,428 7.05 8.6% 1.3706 0.0237 0.1354 1.2095 0.0020 0.09 55F67B Hypertension W/O Catastrophic or Severe CC 1,866 6,522 3.50 9.8% 0.6626 0.0181 0.0662 0.5715 0.0068 0.03 74F68A Congenital Heart Disease W CC 50 126 2.50 67.4% 1.0123 0.1537 0.2736 0.5851 0.0000 0.23 15F68B Congenital Heart Disease W/O CC 313 352 1.13 71.2% 0.5539 0.2010 0.0132 0.2991 0.0406 0.06 33F69A Valvular Disorders W Catastrophic or Severe CC 377 2,914 7.73 7.8% 1.9227 0.0665 0.3736 1.4677 0.0149 0.13 52F69B Valvular Disorders W/O Catastrophic or Severe CC 2,384 4,695 1.97 34.7% 0.5367 0.0760 0.0947 0.3262 0.0398 0.02 68F72A Unstable Angina W Catastrophic or Severe CC 426 2,839 6.66 8.0% 1.5573 0.0235 0.5337 0.9974 0.0027 0.09 57F72B Unstable Angina W/O Catastrophic or Severe CC 1,710 4,765 2.79 9.5% 0.7678 0.0153 0.3502 0.4002 0.0020 0.02 59F73A Syncope and Collapse W Catastrophic or Severe CC 1,848 14,377 7.78 1.9% 1.7796 0.0282 0.1776 1.5635 0.0104 0.17 75F73B Syncope and Collapse W/O Catastrophic or Severe CC 4,941 15,503 3.14 12.3% 0.7962 0.0406 0.1063 0.5123 0.1370 0.01 84F74Z Chest Pain 14,376 27,853 1.94 20.5% 0.4300 0.0203 0.1340 0.2731 0.0027 0.01 84F75A Other Circulatory System Diagnoses W Catastrophic CC 627 6,808 10.85 2.3% 2.7050 0.0798 0.5549 2.0448 0.0254 0.20 67F75B Other Circulatory System Diagnoses W Severe or Moderate CC 1,811 9,089 5.02 11.9% 1.1953 0.0499 0.1988 0.9375 0.0091 0.03 80F75C Other Circulatory System Diagnoses W/O CC 2,229 5,781 2.59 27.6% 0.6321 0.0750 0.0982 0.4260 0.0330 0.02 78F76A Arrhythmia, Cardiac Arrest and Conduction Disorders W Cat or Sev CC 2,369 16,964 7.16 5.1% 1.7217 0.0408 0.5238 1.1525 0.0046 0.04 77F76B Arrhythmia, Cardiac Arrest and Conduction Disorders W/O Cat or Sev CC 17,116 34,747 2.03 37.8% 0.5381 0.0619 0.1485 0.3177 0.0100 0.01 80G01A Rectal Resection W Catastrophic CC 1,611 23,626 14.66 1.7% 6.4983 1.2134 1.2516 3.4394 0.5939 0.14 64G01B Rectal Resection W/O Catastrophic CC 3,040 21,779 7.16 2.5% 3.6277 0.9977 0.2181 1.8236 0.5883 0.03 72G02A Major Small and Large Bowel Procedures W Catastrophic CC 3,178 48,877 15.38 1.9% 6.0616 0.8783 1.1394 3.6218 0.4220 0.13 75G02B Major Small and Large Bowel Procedures W/O Catastrophic CC 6,764 37,728 5.58 7.6% 2.4790 0.6465 0.1483 1.3740 0.3102 0.02 84G03A Stomach, Oesophageal and Duodenal Procedure W Malignancy or W Catastrophic CC 813 10,973 13.50 1.8% 6.4736 1.1461 1.2887 3.4590 0.5798 0.21 57G03B Stomach, Oesophageal and Duodenal Procedures W/O Malignancy W Sev or Mod CC 592 2,516 4.25 5.5% 2.3357 0.6461 0.2338 1.1692 0.2866 0.08 58G03C Stomach, Oesophageal and Duodenal Procedures W/O Malignancy W/O CC 2,893 6,758 2.34 6.6% 1.4653 0.5637 0.0341 0.6733 0.1942 0.02 76G04A Peritoneal Adhesiolysis W Catastrophic CC 495 6,936 14.01 0.7% 5.3676 0.7694 1.0570 3.2137 0.3276 0.20 58G04B Peritoneal Adhesiolysis W Severe or Moderate CC 1,192 7,510 6.30 3.7% 2.5405 0.5711 0.2023 1.5041 0.2629 0.06 77G04C Peritoneal Adhesiolysis W/O CC 4,156 12,939 3.11 7.5% 1.5229 0.4532 0.0437 0.7594 0.2667 0.02 84G05A Minor Small and Large Bowel Procedures W Catastrophic CC 119 1,230 10.37 0.0% 3.3745 0.5157 0.3750 2.2811 0.2028 0.26 27G05B Minor Small and Large Bowel Procedures W Severe or Moderate CC 201 1,520 7.58 5.1% 2.3259 0.4516 0.0584 1.5924 0.2235 0.10 42G05C Minor Small and Large Bowel Procedures W/O CC 686 2,939 4.29 9.1% 1.4164 0.3932 0.0153 0.9008 0.1070 0.04 66G06Z Pyloromyotomy Procedure 27 59 2.18 0.0% 1.1114 0.3109 0.0000 0.8004 0.0001 0.13 3G07A Appendicectomy W Malignancy or Peritonitis or W Catastrophic or Severe CC 1,528 5,380 3.52 1.2% 1.3156 0.3696 0.0921 0.8146 0.0393 0.03 65G07B Appendicectomy W/O Malignancy or Peritonitis W/O Cat or Sev CC 5,435 10,716 1.97 2.4% 0.9056 0.2878 0.0082 0.5680 0.0416 0.10 85G10A Hernia Procedures W CC 2,274 8,400 3.69 4.5% 1.7199 0.4253 0.1418 0.9059 0.2469 0.03 85G10B Hernia Procedures W/O CC 36,921 49,328 1.34 17.5% 0.8558 0.3128 0.0056 0.3328 0.2046 0.00 91G11Z Anal and Stomal Procedures 31,009 43,371 1.40 51.6% 0.4413 0.1767 0.0058 0.2296 0.0292 0.01 88
Percentage of same day
seps incl in ALOS
Number of Seps
Number of days
ALOS (Days)
No. of hospitals
Critical Care (b)
Misce-llaneous
(b)
Oper Rooms & Spec Proc Suites (b)
Prostheses (b)
Standard Error (Total
Cost Weight)
Overnight Private HospitalsPwC 67

Cost weight tables by DRG
Private Sector - Estimated Round 17 (2012-13) AR-DRG 6.0x ReportPrivate Sector Estimated - National Consolidated Cost Weights
Cost Weight for Selected Cost Buckets
DRG DRG Description Total(a)G12A Other Digestive System OR Procedures W Catastrophic CC 307 5,132 16.74 2.8% 5.1018 0.5040 0.6847 3.5879 0.3252 0.35 45G12B Other Digestive System OR Procedures W Severe or Moderate CC 553 2,832 5.12 14.7% 2.1920 0.3579 0.1366 1.5920 0.1054 0.47 62G12C Other Digestive System OR Procedures W/O CC 1,272 3,319 2.61 29.1% 0.9103 0.2695 0.0220 0.5681 0.0508 0.03 81G46A Complex Gastroscopy W Catastrophic CC 435 5,869 13.49 0.8% 3.5475 0.2319 0.4226 2.7222 0.1709 0.15 56G46B Complex Gastroscopy W/O Catastrophic CC 7,366 24,106 3.27 1.5% 1.0288 0.1877 0.0325 0.7692 0.0394 0.01 86G46C Complex Gastroscopy, Sameday 72,419 77,486 1.07 73.5% 0.2598 0.1665 0.0005 0.0852 0.0076 0.00 86G47A Other Gastroscopy W Catastrophic CC 475 6,628 13.95 0.7% 3.1947 0.1433 0.2585 2.7604 0.0325 0.19 53G47B Other Gastroscopy W/O Catastrophic CC 5,214 19,749 3.79 1.3% 0.9163 0.1133 0.0362 0.7521 0.0147 0.02 85G47C Other Gastroscopy, Sameday 63,075 67,046 1.06 72.6% 0.1541 0.0835 0.0003 0.0675 0.0028 0.00 88G48A Colonoscopy W Catastrophic or Severe CC 898 7,495 8.35 1.4% 2.0910 0.2253 0.1000 1.7377 0.0278 0.08 73G48B Colonoscopy W/O Catastrophic or Severe CC 7,094 16,673 2.35 1.4% 0.7346 0.1687 0.0113 0.5383 0.0163 0.01 85G48C Colonoscopy, Sameday 110,786 116,356 1.05 71.1% 0.2107 0.1253 0.0009 0.0765 0.0080 0.00 85G60A Digestive Malignancy W Catastrophic CC 1,105 11,004 9.96 4.3% 2.3207 0.0850 0.0690 2.1297 0.0370 0.10 62G60B Digestive Malignancy W/O Catastrophic CC 5,624 21,325 3.79 18.2% 0.9178 0.0609 0.0096 0.8170 0.0303 0.02 83G61A GI Haemorrhage W Catastrophic or Severe CC 477 3,630 7.60 4.3% 1.5210 0.0101 0.1542 1.3553 0.0014 0.09 58G61B GI Haemorrhage W/O Catastrophic or Severe CC 1,405 4,158 2.96 9.5% 0.5952 0.0222 0.0383 0.5322 0.0026 0.02 78G62Z Complicated Peptic Ulcer 89 497 5.58 9.6% 1.0817 0.0489 0.0295 0.9770 0.0263 0.19 26G63Z Uncomplicated Peptic Ulcer 29 206 7.12 11.0% 0.5284 0.0535 0.0000 0.4749 0.0000 0.08 13G64A Inflammatory Bowel Disease W CC 242 1,202 4.96 8.5% 1.1956 0.0135 0.0158 1.1663 0.0001 0.07 51G64B Inflammatory Bowel Disease W/O CC 3,870 5,673 1.47 42.5% 0.3664 0.0175 0.0100 0.3253 0.0137 0.01 68G65A GI Obstruction W Catastrophic or Severe CC 1,072 9,131 8.52 2.6% 1.7561 0.0428 0.1014 1.5902 0.0217 0.07 69G65B GI Obstruction W/O Catastrophic or Severe CC 2,786 10,198 3.66 4.8% 0.7247 0.0183 0.0198 0.6837 0.0029 0.02 79G66Z Abdominal Pain or Mesenteric Adenitis 7,373 18,555 2.52 12.6% 0.4919 0.0186 0.0201 0.4468 0.0064 0.01 89G67A Oesophagitis and Gastroenteritis W Cat/Sev CC 2,316 19,213 8.30 3.1% 1.6499 0.0366 0.1443 1.4508 0.0182 0.06 79G67B Oesophagitis and Gastroenteritis W/O Cat/Sev CC 5,995 17,298 2.89 8.1% 0.5742 0.0181 0.0203 0.5329 0.0029 0.01 86G70A Other Digestive System Diagnoses W Catastrophic or Severe CC 4,322 24,456 5.66 3.2% 1.1760 0.0359 0.0809 1.0441 0.0151 0.03 86G70B Other Digestive System Diagnoses W/O Catastrophic or Severe CC 13,661 37,484 2.74 20.6% 0.5186 0.0297 0.0106 0.4740 0.0043 0.01 94H01A Pancreas, Liver and Shunt Procedures W Catastrophic CC 555 8,590 15.46 2.9% 7.9320 1.4785 1.4837 4.2431 0.7267 0.32 31H01B Pancreas, Liver and Shunt Procedures W/O Catastrophic CC 773 4,944 6.40 5.5% 3.4029 0.8380 0.4757 1.6162 0.4731 0.10 40H02A Major Biliary Tract Procedures W Catastrophic CC 156 2,566 16.43 0.0% 5.7747 0.8580 0.7969 3.6210 0.4988 0.31 25H02B Major Biliary Tract Procedures W Severe CC 128 1,129 8.84 4.8% 3.6450 0.8885 0.2262 2.1529 0.3774 0.19 31H02C Major Biliary Tract Procedures W/O Catastrophic or Severe CC 235 1,068 4.53 9.9% 1.9494 0.5546 0.0775 1.1352 0.1821 0.15 42H05A Hepatobiliary Diagnostic Procedures W Catastrophic CC 73 1,025 14.08 0.0% 4.8126 0.6386 0.5230 3.4070 0.2439 0.81 19H05B Hepatobiliary Diagnostic Procedures W/O Catastrophic CC 464 1,383 2.98 29.9% 1.1675 0.3012 0.0539 0.7186 0.0937 0.06 52H06A Other Hepatobiliary and Pancreas OR Procedures W Catastrophic CC 151 1,438 9.55 11.4% 4.8009 0.4414 0.3492 2.9007 1.1096 0.40 23H06B Other Hepatobiliary and Pancreas OR Procedures W/O Catastrophic CC 672 1,406 2.09 10.3% 2.3266 0.5069 0.0121 0.7424 1.0652 0.09 38H07A Open Cholecystectomy W Closed CDE or W Catastrophic CC 137 1,663 12.13 1.2% 4.6069 0.6541 1.0659 2.7083 0.1787 0.27 32H07B Open Cholecystectomy W/O Closed CDE W/O Catastrophic CC 418 2,084 4.98 2.9% 2.0246 0.6506 0.1272 1.1067 0.1402 0.06 66H08A Laparoscopic Cholecystectomy W Closed CDE or W (Cat or Sev CC) 2,312 11,130 4.81 2.3% 2.0363 0.5355 0.1861 1.1126 0.2021 0.04 78H08B Laparoscopic Cholecystectomy W/O Closed CDE W/O Cat or Sev CC 18,895 30,850 1.63 3.9% 1.0059 0.3950 0.0111 0.4459 0.1539 0.00 86H40A Endoscopic Procedures for Bleeding Oesophageal Varices W Catastrophic CC 19 171 8.90 0.0% 2.5138 0.2155 0.3116 1.9714 0.0152 0.40 7H40B Endoscopic Procedures for Bleeding Oesophageal Varices W/O Catastrophic CC 33 120 3.70 21.1% 1.2394 0.1658 0.2788 0.7935 0.0012 0.30 13H43A ERCP Procedures W Catastrophic or Severe CC 554 4,670 8.42 3.1% 2.7432 0.2598 0.2522 1.9014 0.3299 0.12 32H43B ERCP Procedures W/O Catastrophic or Severe CC 2,711 6,342 2.34 20.5% 0.8303 0.2059 0.0114 0.4957 0.1173 0.02 38H60A Cirrhosis and Alcoholic Hepatitis W Catastrophic CC 157 1,874 11.90 1.3% 2.4201 0.1225 0.0637 2.2242 0.0097 0.21 33H60B Cirrhosis and Alcoholic Hepatitis W Severe or Moderate CC 418 1,715 4.10 30.0% 1.2884 0.0728 0.0149 1.1987 0.0020 0.43 52
Percentage of same day
seps incl in ALOS
Number of Seps
Number of days
ALOS (Days)
No. of hospitals
Critical Care (b)
Misce-llaneous
(b)
Oper Rooms & Spec Proc Suites (b)
Prostheses (b)
Standard Error (Total
Cost Weight)
Overnight Private HospitalsPwC 68

Cost weight tables by DRG
Private Sector - Estimated Round 17 (2012-13) AR-DRG 6.0x ReportPrivate Sector Estimated - National Consolidated Cost Weights
Cost Weight for Selected Cost Buckets
DRG DRG Description Total(a)H60C Cirrhosis and Alcoholic Hepatitis W/O CC 439 758 1.73 49.9% 0.3514 0.0777 0.0041 0.2620 0.0076 0.03 49H61A Malignancy of Hepatobiliary System, Pancreas W Catastrophic CC 693 7,616 10.98 1.2% 2.3207 0.0609 0.0831 2.1524 0.0242 0.10 64H61B Malignancy of Hepatobiliary System, Pancreas W/O Catastrophic CC 3,126 11,992 3.84 24.4% 1.0299 0.0657 0.0083 0.8722 0.0837 0.04 81H62A Disorders of Pancreas Except for Malignancy W Catastrophic or Severe CC 377 3,371 8.93 1.3% 2.2546 0.0396 0.4135 1.7906 0.0109 0.20 56H62B Disorders of Pancreas Except for Malignancy W/O Catastrophic or Severe CC 1,908 5,802 3.04 25.1% 0.6396 0.0427 0.0238 0.5715 0.0016 0.02 69H63A Disorders of Liver Except Malig, Cirrhosis, Alcoholic Hepatitis W Cat/Sev CC 451 3,923 8.70 6.4% 1.9904 0.0618 0.1334 1.7877 0.0075 0.10 58H63B Disorders of Liver Excep Malig, Cirrhosis, Alcoholic Hepatitis W/O Cat/Sev CC 1,668 3,372 2.02 49.4% 0.4449 0.0695 0.0126 0.3608 0.0020 0.02 73H64A Disorders of the Biliary Tract W CC 723 4,671 6.46 8.0% 1.4409 0.0355 0.1266 1.2628 0.0160 0.06 71H64B Disorders of the Biliary Tract W/O CC 1,519 3,703 2.44 21.8% 0.4883 0.0355 0.0155 0.4337 0.0037 0.02 80I01A Bilateral/Multiple Major Joint Proc of Lower Extremity W Revision or W Cat CC 284 4,938 17.38 1.8% 11.7003 1.1828 0.5841 4.6118 5.3217 0.40 56I01B Bilateral/Multiple Major Joint Pr of Lower Extremity W/O Revision W/O Cat CC 1,887 13,511 7.16 1.2% 8.3758 0.8369 0.2287 2.3375 4.9727 0.08 64I02A Microvascular Tissue Transfer or (Skin Graft W Cat or Sev CC), Excluding Hand 308 7,681 24.94 6.6% 8.9279 1.4012 0.4331 5.5818 1.5117 0.52 53I02B Skin Graft W/O Catastrophic or Severe CC, Excluding Hand 635 2,647 4.17 24.4% 1.8806 0.4729 0.0328 1.1497 0.2252 0.11 71I03A Hip Replacement W Catastrophic CC 1,442 18,455 12.79 1.9% 7.8623 0.6957 0.5328 3.2655 3.3683 0.10 73I03B Hip Replacement W/O Catastrophic CC 18,684 111,249 5.95 1.5% 6.5396 0.6009 0.0636 1.8809 3.9941 0.02 83I04A Knee Replacement W Catastrophic or Severe CC 4,309 35,057 8.14 1.9% 6.4195 0.6267 0.1977 2.3130 3.2821 0.04 81I04B Knee Replacement W/O Catastrophic or Severe CC 24,615 139,618 5.67 1.2% 5.4989 0.5911 0.0412 1.6862 3.1805 0.01 83I05A Other Joint Replacement W Catastrophic or Severe CC 332 3,159 9.51 0.0% 8.1501 0.9099 0.3202 2.6935 4.2265 0.36 59I05B Other Joint Replacement W/O Catastrophic or Severe CC 3,361 13,725 4.08 1.7% 5.6011 0.7323 0.0332 1.3938 3.4420 0.05 75I06Z Spinal Fusion W Deformity 793 7,958 10.04 0.0% 15.5715 1.9651 0.6761 3.3646 9.5657 0.53 30I07Z Amputation 60 1,083 18.06 0.0% 5.6329 0.5901 0.4027 4.1052 0.5349 0.78 21I08A Other Hip and Femur Procedures W Catastrophic CC 1,017 18,423 18.12 3.2% 5.6557 0.6186 0.4443 3.7470 0.8457 0.16 67I08B Other Hip and Femur Procedures W/O Catastrophic CC 6,326 29,954 4.73 7.3% 2.3147 0.5247 0.0390 1.2248 0.5262 0.03 79I09A Spinal Fusion W Catastrophic CC 833 11,324 13.59 2.3% 13.4103 1.4695 0.8586 4.2918 6.7904 0.35 39I09B Spinal Fusion W/O Catastrophic CC 9,801 59,451 6.07 2.7% 8.3466 0.9578 0.1551 2.0886 5.1452 0.07 51I10A Other Back and Neck Procedures W Catastrophic or Severe CC 1,467 11,917 8.12 2.9% 3.1447 0.6361 0.1534 2.0250 0.3302 0.07 50I10B Other Back and Neck Procedures W/O Catastrophic or Severe CC 14,355 48,976 3.41 5.7% 1.6839 0.4828 0.0264 0.8779 0.2968 0.01 58I11Z Limb Lengthening Procedures 48 186 3.88 2.1% 4.1660 0.6162 0.0056 1.1957 2.3486 0.67 17I12A Infect/Inflam of Bone and Joint W Misc Musculoskeletal Procs W Cat CC 423 9,250 21.84 1.3% 5.7326 0.4117 0.3046 4.6970 0.3192 0.29 58I12B Infect/Inflam of Bone and Joint W Misc Musculoskeletal Procs W Sev or Mod CC 656 7,541 11.50 5.0% 3.0372 0.4039 0.0713 2.3548 0.2071 0.14 69I12C Infect/Inflam of Bone and Joint W Misc Musculoskeletal Procs W/O Sev or Mod CC 3,089 11,339 3.67 27.8% 1.3994 0.3436 0.0157 0.8309 0.2092 0.03 87I13A Humerus, Tibia, Fibula and Ankle Procedures W CC 1,121 9,247 8.25 6.0% 3.7842 0.6309 0.1212 1.9985 1.0336 0.12 74I13B Humerus, Tibia, Fibula and Ankle Procedures W/O CC 14,276 30,636 2.15 21.2% 1.4862 0.4441 0.0048 0.5939 0.4433 0.01 87I15Z Cranio-Facial Surgery 161 822 5.12 7.9% 4.3868 1.5857 0.5229 1.3299 0.9483 0.29 29I16Z Other Shoulder Procedures 35,952 46,342 1.29 6.6% 1.1895 0.4675 0.0068 0.3938 0.3214 0.00 87I17A Maxillo-Facial Surgery W CC 18 69 3.76 15.2% 3.0497 1.0977 0.2717 0.9365 0.7438 0.85 10I17B Maxillo-Facial Surgery W/O CC 266 396 1.49 18.9% 1.5374 0.5537 0.0572 0.4692 0.4573 0.13 49I18Z Other Knee Procedures 62,526 71,143 1.14 69.7% 0.4272 0.2376 0.0013 0.1733 0.0150 0.00 90I19A Other Elbow or Forearm Procedures W CC 419 2,349 5.60 9.6% 2.5937 0.5088 0.0898 1.1909 0.8042 0.12 63I19B Other Elbow or Forearm Procedures W/O CC 7,314 11,262 1.54 20.4% 1.5403 0.4345 0.0039 0.4379 0.6641 0.01 85I20Z Other Foot Procedures 13,908 22,580 1.62 21.2% 1.1558 0.3602 0.0049 0.4367 0.3540 0.01 90I21Z Local Excision and Removal of Internal Fixation Devices of Hip and Femur 567 1,001 1.77 21.7% 0.8457 0.3526 0.0059 0.4332 0.0539 0.05 65I23Z Local Excision and Removal of Internal Fixation Devices Excl Hip and Femur 10,220 12,825 1.25 58.6% 0.5030 0.2399 0.0035 0.1927 0.0669 0.01 90I24Z Arthroscopy 3,112 3,759 1.21 50.1% 0.5256 0.2724 0.0029 0.2165 0.0338 0.01 80I25A Bone and Joint Diagnostic Procedures Including Biopsy W CC 159 1,617 10.18 7.2% 2.4698 0.1242 0.0710 2.2301 0.0445 0.21 25I25B Bone and Joint Diagnostic Procedures Including Biopsy W/O CC 241 752 3.12 34.8% 0.7758 0.1242 0.0389 0.6028 0.0099 0.08 40
Percentage of same day
seps incl in ALOS
Number of Seps
Number of days
ALOS (Days)
No. of hospitals
Critical Care (b)
Misce-llaneous
(b)
Oper Rooms & Spec Proc Suites (b)
Prostheses (b)
Standard Error (Total
Cost Weight)
Overnight Private HospitalsPwC 69

Cost weight tables by DRG
Private Sector - Estimated Round 17 (2012-13) AR-DRG 6.0x ReportPrivate Sector Estimated - National Consolidated Cost Weights
Cost Weight for Selected Cost Buckets
DRG DRG Description Total(a)I27A Soft Tissue Procedures W CC 532 3,639 6.84 9.8% 2.2802 0.4137 0.0873 1.5940 0.1852 0.12 67I27B Soft Tissue Procedures W/O CC 9,116 14,297 1.57 36.3% 0.7310 0.2933 0.0043 0.3370 0.0964 0.01 91I28A Other Musculoskeletal Procedures W CC 266 2,276 8.55 8.7% 2.8802 0.3462 0.1374 1.9691 0.4275 0.15 52I28B Other Musculoskeletal Procedures W/O CC 3,792 6,002 1.58 23.5% 1.3112 0.3590 0.0057 0.4229 0.5236 0.02 87I29Z Knee Reconstruction or Revision 11,138 13,764 1.24 6.8% 1.4201 0.5022 0.0025 0.4244 0.4910 0.01 82I30Z Hand Procedures 28,367 33,292 1.17 55.7% 0.6431 0.3205 0.0026 0.2107 0.1094 0.00 92I31A Hip Revision W Catastrophic CC 328 6,944 21.16 1.0% 11.0081 1.0630 0.8470 5.0180 4.0801 0.32 54I31B Hip Revision W/O Catastrophic CC 2,369 19,276 8.14 1.0% 6.7867 0.8309 0.2113 2.2652 3.4793 0.08 69I32A Knee Revision W Catastrophic CC 197 3,772 19.13 1.7% 12.3353 0.9976 0.5439 5.1859 5.6079 0.66 47I32B Knee Revision W Severe CC 321 3,517 10.96 0.0% 8.7616 0.9120 0.1998 3.0563 4.5935 0.35 54I32C Knee Revision W/O Catastrophic or Severe CC 1,707 11,444 6.70 1.2% 6.4700 0.7578 0.0689 1.9775 3.6658 0.12 77I60Z Femoral Shaft Fractures 39 438 11.35 4.1% 2.2790 0.0988 0.0379 1.9829 0.1594 0.49 16I61A Distal Femoral Fractures W CC 58 625 10.78 5.5% 1.9632 0.0231 0.0638 1.8729 0.0034 0.31 24I61B Distal Femoral Fractures W/O CC 62 332 5.36 1.6% 1.0695 0.0369 0.0006 1.0210 0.0109 0.13 26I63A Sprains, Strains and Dislocations of Hip, Pelvis and Thigh W CC 107 977 9.14 1.6% 1.5650 0.0329 0.0229 1.5085 0.0006 0.15 29I63B Sprains, Strains and Dislocations of Hip, Pelvis and Thigh W/O CC 401 1,125 2.80 10.2% 0.5193 0.0286 0.0084 0.4821 0.0001 0.03 56I64A Osteomyelitis W Catastrophic or Severe CC 175 2,874 16.40 2.5% 3.3369 0.0590 0.1341 3.0153 0.1284 0.25 45I64B Osteomyelitis W/O Catastrophic or Severe CC 294 3,302 11.24 9.9% 2.0846 0.0582 0.0309 1.9561 0.0393 0.14 53I65A Musculoskeletal Malignant Neoplasms W Catastrophic CC 502 7,535 15.02 1.4% 3.1645 0.0425 0.0684 3.0400 0.0135 0.15 53I65B Musculoskeletal Malignant Neoplasms W/O Catastrophic CC 1,786 13,103 7.34 9.4% 1.4830 0.0331 0.0208 1.4218 0.0074 0.04 78I66A Inflammatory Musculoskeletal Disorders W Cat or Sev CC 290 2,962 10.22 9.1% 2.3411 0.0877 0.3144 1.9335 0.0056 0.20 54I66B Inflammatory Musculoskeletal Disorders W/O Cat or Sev CC 8,134 11,754 1.45 37.9% 0.2837 0.0254 0.0043 0.2486 0.0053 0.01 85I67A Septic Arthritis W Catastrophic or Severe CC 76 1,198 15.85 6.4% 3.3206 0.0489 0.2910 2.9637 0.0170 0.51 30I67B Septic Arthritis W/O Catastrophic or Severe CC 276 1,187 4.30 56.9% 0.7509 0.0273 0.0079 0.6969 0.0189 0.11 41I68A Non-surgical Spinal Disorders W CC 3,627 38,051 10.49 2.5% 2.0226 0.0493 0.0563 1.9127 0.0043 0.04 86I68B Non-surgical Spinal Disorders W/O CC 9,349 40,186 4.30 1.8% 0.8461 0.0534 0.0103 0.7791 0.0034 0.01 90I68C Non-surgical Spinal Disorders, Sameday 19,457 20,735 1.07 70.5% 0.2194 0.1145 0.0015 0.1006 0.0027 0.00 73I69A Bone Diseases and Arthropathies W Catastrophic or Severe CC 426 3,986 9.36 5.8% 1.8081 0.0287 0.0694 1.7075 0.0025 0.10 71I69B Bone Diseases and Arthropathies W/O Catastrophic or Severe CC 4,726 11,359 2.40 51.6% 0.4366 0.0355 0.0088 0.3882 0.0041 0.01 90I71A Other Musculotendinous Disorders W Catastrophic or Severe CC 363 3,219 8.87 4.9% 1.6092 0.0746 0.0367 1.4958 0.0021 0.08 61I71B Other Musculotendinous Disorders W/O Catastrophic or Severe CC 4,497 10,944 2.43 34.7% 0.5027 0.0590 0.0087 0.4320 0.0030 0.03 91I72A Specific Musculotendinous Disorders W Catastrophic or Severe CC 229 2,156 9.40 3.6% 1.8195 0.0315 0.0601 1.7215 0.0063 0.13 46I72B Specific Musculotendinous Disorders W/O Catastrophic or Severe CC 2,378 6,643 2.79 40.9% 0.5523 0.0551 0.0116 0.4809 0.0048 0.02 90I73A Aftercare of Musculoskeletal Implants/Prostheses W Catastrophic or Severe CC 273 3,610 13.24 2.4% 2.5855 0.0882 0.1928 2.2748 0.0296 0.21 53I73B Aftercare of Musculoskeletal Implants/Prostheses W/O Cat or Sev CC 2,254 8,687 3.85 21.6% 0.7582 0.0602 0.0056 0.6740 0.0185 0.03 87I74Z Injury to Forearm, Wrist, Hand or Foot 2,865 8,085 2.82 33.9% 0.5548 0.0986 0.0099 0.4358 0.0106 0.02 89I75A Injury to Shoulder, Arm, Elbow, Knee, Leg or Ankle W CC 1,066 12,414 11.65 3.9% 2.1323 0.0389 0.0640 1.9964 0.0330 0.10 79I75B Injury to Shoulder, Arm, Elbow, Knee, Leg or Ankle W/O CC 2,431 9,006 3.70 23.1% 0.6266 0.0408 0.0032 0.5748 0.0078 0.02 86I76A Other Musculoskeletal Disorders W Catastrophic or Severe CC 156 1,828 11.73 4.2% 2.0807 0.0401 0.1091 1.9116 0.0200 0.19 45I76B Other Musculoskeletal Disorders W/O Catastrophic or Severe CC 1,348 3,292 2.44 41.7% 0.4950 0.0936 0.0118 0.3857 0.0040 0.02 85I77A Fractures of Pelvis W Catastrophic or Severe CC 682 10,336 15.16 2.8% 2.7122 0.0273 0.0440 2.6377 0.0032 0.11 70I77B Fractures of Pelvis W/O Catastrophic or Severe CC 803 7,004 8.72 4.3% 1.5285 0.0432 0.0144 1.4694 0.0014 0.05 71I78A Fractures of Neck of Femur W Catastrophic or Severe CC 244 3,081 12.61 2.7% 2.1071 0.0198 0.0587 2.0192 0.0094 0.25 48I78B Fractures of Neck of Femur W/O Catastrophic or Severe CC 419 2,484 5.93 21.1% 0.9385 0.0190 0.0147 0.9021 0.0027 0.08 57I79A Pathological Fracture W Catastrophic CC 136 2,695 19.80 1.2% 4.0121 0.0826 0.1141 3.8075 0.0079 0.35 34I79B Pathological Fracture W/O Catastrophic CC 1,321 12,076 9.14 8.8% 1.7461 0.0341 0.0246 1.6742 0.0131 0.10 78
Percentage of same day
seps incl in ALOS
Number of Seps
Number of days
ALOS (Days)
No. of hospitals
Critical Care (b)
Misce-llaneous
(b)
Oper Rooms & Spec Proc Suites (b)
Prostheses (b)
Standard Error (Total
Cost Weight)
Overnight Private HospitalsPwC 70

Cost weight tables by DRG
Private Sector - Estimated Round 17 (2012-13) AR-DRG 6.0x ReportPrivate Sector Estimated - National Consolidated Cost Weights
Cost Weight for Selected Cost Buckets
DRG DRG Description Total(a)J01A Microvas Tiss Transf for Skin, Subcutaneous Tiss & Breast Disd W Cat/Sev CC 144 1,681 11.71 2.3% 6.8922 2.5176 0.8561 3.1086 0.4099 0.45 21J01B Microvas Tiss Transf for Skin, Subcutaneous Tiss & Breast Disd W/O Cat/Sev CC 251 1,873 7.46 3.2% 5.0245 2.1805 0.3204 2.0073 0.5163 0.21 28J06A Major Procedures for Malignant Breast Conditions 10,756 30,549 2.84 6.7% 1.3355 0.5183 0.0185 0.7136 0.0851 0.01 82J06B Major Procedures for Non-Malignant Breast Conditions 11,673 20,655 1.77 21.2% 1.3186 0.6795 0.0108 0.4934 0.1349 0.01 87J07A Minor Procedures for Malignant Breast Conditions 3,200 3,920 1.22 40.1% 0.5758 0.2947 0.0055 0.2658 0.0097 0.01 80J07B Minor Procedures for Non-Malignant Breast Conditions 5,296 6,219 1.17 58.5% 0.4448 0.2536 0.0021 0.1754 0.0138 0.01 90J08A Other Skin Graft and/or Debridement Procedures W CC 1,586 10,495 6.62 17.6% 1.9611 0.3967 0.0745 1.4651 0.0249 0.07 87J08B Other Skin Graft and/or Debridement Procedures W/O CC 21,066 29,210 1.39 56.9% 0.5939 0.3269 0.0030 0.2568 0.0072 0.00 93J09Z Perianal and Pilonidal Procedures 1,691 2,796 1.65 32.8% 0.5202 0.2131 0.0043 0.3007 0.0020 0.01 86J10Z Skin, Subcutaneous Tissue and Breast Plastic OR Procedures 17,393 23,694 1.36 56.8% 0.6366 0.3897 0.0058 0.2324 0.0086 0.01 91J11Z Other Skin, Subcutaneous Tissue and Breast Procedures 37,193 43,334 1.17 68.5% 0.3525 0.2045 0.0023 0.1391 0.0066 0.00 93J12A Lower Limb Procs W Ulcer/Cellulitis W Catastrophic CC 221 5,044 22.86 6.0% 5.7840 0.4561 0.2604 4.8041 0.2634 0.38 45J12B Lower Limb Procs W Ulcer/Cellulitis W/O Cat CC W Skin Graft/Flap Repair 387 5,375 13.90 7.6% 3.1532 0.3282 0.0417 2.6787 0.1045 0.17 61J12C Lower Limb Procs W Ulcer/Cellulitis W/O Cat CC W/O Skin Graft/Flap Repair 381 3,188 8.36 10.2% 1.8873 0.2184 0.0483 1.5988 0.0218 0.11 64J13A Lower Limb Procs W/O Ulcer/Cellulitis W Cat CC or W (Skin Graft and Sev CC) 410 4,263 10.41 3.4% 2.5908 0.4110 0.0731 2.0779 0.0287 0.12 67J13B Lower Limb Procs W/O Ulcer/Cellulitis W/O Cat CC W/O (Skin Graft and Sev CC) 4,938 16,156 3.27 28.7% 0.8961 0.2554 0.0113 0.6264 0.0029 0.01 90J14Z Major Breast Reconstructions 712 4,503 6.32 5.4% 3.5009 1.2194 0.1156 1.7762 0.3897 0.08 51J60A Skin Ulcers W Catastrophic CC 269 4,797 17.82 2.3% 3.2894 0.0647 0.1235 3.0926 0.0086 0.20 49J60B Skin Ulcers W/O Catastrophic CC 975 10,003 10.26 2.5% 1.8884 0.0444 0.0308 1.8011 0.0121 0.06 79J60C Skin Ulcers, Sameday 231 231 1.00 97.8% 0.0581 0.0123 0.0042 0.0405 0.0011 0.01 23J62A Malignant Breast Disorders W CC 2,147 7,328 3.41 18.2% 0.9767 0.0253 0.0109 0.9360 0.0045 0.04 59J62B Malignant Breast Disorders W/O CC 1,486 3,058 2.06 26.0% 0.6838 0.0709 0.0046 0.6014 0.0069 0.05 53J63A Non-Malignant Breast Disorders W CC 55 248 4.52 13.8% 1.1754 0.1480 0.0440 0.9833 0.0002 0.17 20J63B Non-Malignant Breast Disorders W/O CC 795 1,160 1.46 60.6% 0.3927 0.1646 0.0009 0.2263 0.0008 0.01 78J64A Cellulitis W Catastrophic or Severe CC 2,217 23,898 10.78 2.5% 2.1688 0.0562 0.0992 1.9963 0.0171 0.05 87J64B Cellulitis W/O Catastrophic or Severe CC 7,159 36,997 5.17 7.7% 0.9868 0.0402 0.0194 0.9202 0.0070 0.01 92J65A Trauma to the Skin, Subcutaneous Tissue and Breast W Cat or Sev CC 494 4,881 9.89 5.0% 1.8821 0.0521 0.0918 1.7366 0.0016 0.09 64J65B Trauma to the Skin, Subcutaneous Tissue and Breast W/O Cat or Sev CC 1,453 5,307 3.65 17.9% 0.7035 0.0639 0.0118 0.6177 0.0102 0.04 88J67A Minor Skin Disorders 1,070 4,717 4.41 1.5% 0.9098 0.0678 0.0155 0.8205 0.0060 0.04 84J67B Minor Skin Disorders, Sameday 3,365 3,506 1.04 76.0% 0.2071 0.1166 0.0006 0.0857 0.0042 0.00 93J68A Major Skin Disorders W Catastrophic or Severe CC 165 1,999 12.09 4.0% 2.4100 0.0227 0.0552 2.3224 0.0096 0.18 36J68B Major Skin Disorders W/O Catastrophic or Severe CC 603 2,885 4.79 2.2% 1.1176 0.0206 0.0283 1.0686 0.0001 0.06 60J68C Major Skin Disorders, Sameday 250 250 1.00 87.0% 0.1439 0.0388 0.0011 0.1039 0.0001 0.01 36J69A Skin Malignancy W Catastrophic CC 112 1,343 12.00 2.5% 2.9327 0.0525 0.0690 2.8064 0.0049 0.32 25J69B Skin Malignancy W/O Catastrophic CC 262 2,919 11.13 0.0% 2.7529 0.0455 0.0163 2.6882 0.0029 0.26 48J69C Skin Malignancy, Sameday 299 319 1.07 75.3% 0.1186 0.0545 0.0002 0.0628 0.0011 0.01 60K01A OR Procedures for Diabetic Complications W Catastrophic CC 158 5,163 32.74 0.0% 6.6334 0.5936 0.2858 5.4532 0.3009 0.79 34K01B OR Procedures for Diabetic Complications W/O Catastrophic CC 547 6,734 12.31 5.9% 2.9797 0.3669 0.0668 2.3874 0.1586 0.14 59K02A Pituitary Procedures W CC 139 1,149 8.29 3.6% 4.5529 0.9776 1.0729 2.0540 0.4485 0.25 16K02B Pituitary Procedures W/O CC 149 850 5.72 6.7% 3.1785 0.9282 0.4652 1.3617 0.4235 0.11 14K03Z Adrenal Procedures 247 1,123 4.56 2.6% 2.6610 0.7240 0.4967 1.2886 0.1517 0.16 31K04A Major Procedures for Obesity W CC 2,119 6,961 3.29 4.6% 3.0823 0.6199 0.2479 1.0765 1.1380 0.08 59K04B Major Procedures for Obesity W/O CC 10,692 23,147 2.16 4.5% 2.2856 0.4708 0.0343 0.6628 1.1177 0.01 67K05A Parathyroid Procedures W Catastrophic or Severe CC 117 805 6.86 5.2% 2.4840 0.6993 0.3090 1.3801 0.0956 0.21 30K05B Parathyroid Procedures W/O Catastrophic or Severe CC 2,254 3,339 1.48 4.8% 0.9141 0.4100 0.0819 0.3945 0.0277 0.01 59
Percentage of same day
seps incl in ALOS
Number of Seps
Number of days
ALOS (Days)
No. of hospitals
Critical Care (b)
Misce-llaneous
(b)
Oper Rooms & Spec Proc Suites (b)
Prostheses (b)
Standard Error (Total
Cost Weight)
Overnight Private HospitalsPwC 71

Cost weight tables by DRG
Private Sector - Estimated Round 17 (2012-13) AR-DRG 6.0x ReportPrivate Sector Estimated - National Consolidated Cost Weights
Cost Weight for Selected Cost Buckets
DRG DRG Description Total(a)K06A Thyroid Procedures W Catastrophic or Severe CC 556 2,016 3.62 1.7% 2.1675 0.8587 0.3070 0.9105 0.0913 0.09 62K06B Thyroid Procedures W/O Catastrophic or Severe CC 5,629 9,943 1.77 3.0% 1.1497 0.5637 0.0678 0.4676 0.0506 0.01 76K07Z Obesity Procedures 2,606 9,403 3.61 6.1% 1.9559 0.9812 0.0397 0.8578 0.0772 0.03 78K08Z Thyroglossal Procedures 182 228 1.26 11.2% 0.8278 0.4649 0.0162 0.3339 0.0129 0.03 45K09A Other Endocrine, Nutritional and Metabolic OR Procedures W Catastrophic CC 72 1,463 20.38 4.5% 7.4053 0.6866 1.2161 4.2334 1.2692 0.68 20K09B Other Endocrine, Nutritional and Metabolic OR Procs W Severe or Moderate CC 102 815 7.98 5.7% 2.7389 0.4899 0.1212 1.4252 0.7026 0.28 25K09C Other Endocrine, Nutritional and Metabolic OR Procedures W/O CC 349 739 2.11 33.4% 1.1362 0.3626 0.0473 0.5277 0.1986 0.07 47K40A Endoscopic or Investigative Proc for Metabolic Disorders W Catastrophic CC 115 1,796 15.66 0.0% 3.9522 0.2266 0.1772 3.5418 0.0065 0.32 27K40B Endoscopic or Investigative Proc for Metabolic Disorders W/O Catastrophic CC 976 3,549 3.64 1.3% 1.1043 0.2146 0.0281 0.8513 0.0102 0.04 77K40C Endoscopic or Investigative Procedure for Metabolic Disorders, Sameday 6,560 6,933 1.06 69.6% 0.2189 0.1268 0.0009 0.0834 0.0078 0.00 83K60A Diabetes W Catastrophic or Severe CC 895 9,312 10.40 4.5% 2.0392 0.0469 0.1581 1.8168 0.0174 0.07 66K60B Diabetes W/O Catastrophic or Severe CC 3,612 12,305 3.41 22.5% 1.5063 0.0956 0.0322 0.7056 0.6730 0.04 83K61Z Severe Nutritional Disturbance 158 1,584 9.99 6.1% 2.0481 0.0130 0.1186 1.8921 0.0245 0.18 37K62A Miscellaneous Metabolic Disorders W Catastrophic or Severe CC 1,798 15,365 8.55 4.9% 1.7651 0.0277 0.1175 1.6176 0.0023 0.06 81K62B Miscellaneous Metabolic Disorders W/O Catastrophic or Severe CC 7,772 15,298 1.97 43.3% 0.4303 0.0171 0.0210 0.3875 0.0047 0.01 90K63A Inborn Errors of Metabolism W CC 33 140 4.19 12.3% 1.1529 0.0367 0.0210 1.0745 0.0207 0.19 14K63B Inborn Errors of Metabolism W/O CC 158 224 1.42 46.7% 0.2649 0.0497 0.0030 0.2065 0.0056 0.03 31K64A Endocrine Disorders W Catastrophic or Severe CC 296 3,048 10.31 2.8% 2.2159 0.0378 0.3073 1.8443 0.0265 0.20 50K64B Endocrine Disorders W/O Catastrophic or Severe CC 1,113 3,464 3.11 18.9% 0.6377 0.0248 0.0301 0.5799 0.0029 0.03 72L02A Operative Insertion of Peritoneal Catheter for Dialysis W Cat or Sev CC 32 133 4.15 26.0% 2.9005 0.5092 0.3654 1.8865 0.1394 0.45 13L02B Operative Insertion of Peritoneal Catheter for Dialysis W/O Cat or Sev CC 165 303 1.84 13.6% 0.8329 0.3555 0.0097 0.4013 0.0666 0.04 22L03A Kidney, Ureter and Major Bladder Procedures for Neoplasm W Catastrophic CC 503 7,397 14.71 0.9% 6.5730 1.3066 1.2872 3.5360 0.4432 0.28 40L03B Kidney, Ureter and Major Bladder Procedures for Neoplasm W Severe CC 494 3,883 7.87 1.8% 4.0726 1.1367 0.5748 1.9532 0.4079 0.13 44L03C Kidney, Ureter and Major Bladder Procedures for Neoplasm W/O Cat or Sev CC 1,750 8,396 4.80 3.2% 2.4975 0.8778 0.2081 1.1288 0.2828 0.05 62L04A Kidney, Ureter & Major Bladder Procedures for Non-Neoplasm W Catastrophic CC 468 5,334 11.39 6.7% 4.1189 0.6500 0.6152 2.6131 0.2405 0.33 46L04B Kidney, Ureter and Major Bladder Procedures for Non-Neoplasm W Severe CC 472 2,327 4.93 13.4% 2.1317 0.5463 0.1152 1.2544 0.2158 0.10 60L04C Kidney, Ureter & Major Bladder Procedures for Non-Neoplasm W/O Cat or Sev CC 8,785 15,520 1.77 26.1% 1.0498 0.3949 0.0101 0.4393 0.2054 0.01 79L05A Transurethral Prostatectomy W Catastrophic or Severe CC 416 4,606 11.07 1.1% 2.8330 0.4381 0.2421 2.1316 0.0211 0.12 49L05B Transurethral Prostatectomy W/O Catastrophic or Severe CC 1,945 5,659 2.91 1.8% 1.0160 0.3679 0.0171 0.6199 0.0111 0.01 74L06A Minor Bladder Procedures W Catastrophic or Severe CC 364 2,992 8.22 6.2% 2.6381 0.4293 0.2713 1.7097 0.2279 0.16 55L06B Minor Bladder Procedures W/O Catastrophic or Severe CC 2,738 5,317 1.94 16.1% 0.9768 0.2491 0.0106 0.4632 0.2540 0.03 81L07A Transurethral Procedures Except Prostatectomy W CC 2,127 7,137 3.36 25.3% 1.1089 0.2517 0.0555 0.7458 0.0560 0.05 76L07B Transurethral Procedures Except Prostatectomy W/O CC 15,234 20,302 1.33 38.7% 0.4954 0.2201 0.0039 0.2528 0.0187 0.00 87L08A Urethral Procedures W CC 239 870 3.63 8.9% 1.1529 0.3028 0.0716 0.7545 0.0240 0.12 45L08B Urethral Procedures W/O CC 2,253 3,554 1.58 22.6% 0.5802 0.2458 0.0047 0.3226 0.0071 0.02 79L09A Other Procedures for Kidney and Urinary Tract Disorders W Cat CC 108 1,913 17.75 4.6% 6.2021 0.6660 1.1444 4.1508 0.2409 0.70 25L09B Other Procedures for Kidney and Urinary Tract Disorders W Sev CC 157 660 4.21 12.2% 1.8319 0.4061 0.0654 1.0255 0.3350 0.19 31L09C Other Procedures for Kidney and Urinary Tract Disorders W/O Cat or Sev CC 1,166 1,791 1.54 24.9% 1.4958 0.3799 0.0073 0.4179 0.6907 0.07 65L40Z Ureteroscopy 811 1,172 1.44 39.6% 0.5609 0.2251 0.0051 0.2957 0.0351 0.02 65L41Z Cystourethroscopy, Sameday 29,854 32,172 1.08 75.7% 0.1814 0.0999 0.0015 0.0747 0.0053 0.00 87L42Z ESW Lithotripsy for Urinary Stones 2,493 2,874 1.15 59.8% 0.4561 0.2737 0.0025 0.1683 0.0115 0.01 43L60A Renal Failure W Catastrophic CC 687 8,746 12.73 3.5% 3.1509 0.0534 0.5081 2.5697 0.0196 0.13 61L60B Renal Failure W Severe CC 757 5,795 7.65 3.8% 1.7213 0.0408 0.2123 1.4598 0.0084 0.08 68L60C Renal Failure W/O Catastrophic or Severe CC 1,076 5,164 4.80 11.2% 0.9197 0.0229 0.0406 0.8513 0.0049 0.03 78L61Z Haemodialysis 105,160 109,974 1.05 92.9% 0.1151 0.0226 0.0007 0.0918 0.0000 0.00 12L62A Kidney and Urinary Tract Neoplasms W Catastrophic or Severe CC 626 5,419 8.66 15.9% 1.8617 0.0591 0.0326 1.7637 0.0063 0.11 65L62B Kidney and Urinary Tract Neoplasms W/O Catastrophic or Severe CC 955 2,714 2.84 22.1% 0.6593 0.0721 0.0046 0.5728 0.0097 0.04 71
Percentage of same day
seps incl in ALOS
Number of Seps
Number of days
ALOS (Days)
No. of hospitals
Critical Care (b)
Misce-llaneous
(b)
Oper Rooms & Spec Proc Suites (b)
Prostheses (b)
Standard Error (Total
Cost Weight)
Overnight Private HospitalsPwC 72

Cost weight tables by DRG
Private Sector - Estimated Round 17 (2012-13) AR-DRG 6.0x ReportPrivate Sector Estimated - National Consolidated Cost Weights
Cost Weight for Selected Cost Buckets
DRG DRG Description Total(a)L63A Kidney and Urinary Tract Infections W Catastrophic or Severe CC 2,817 29,367 10.42 2.6% 2.0495 0.0388 0.1366 1.8527 0.0214 0.06 81L63B Kidney and Urinary Tract Infections W/O Catastrophic or Severe CC 7,027 31,234 4.44 8.5% 0.8389 0.0245 0.0201 0.7882 0.0062 0.02 92L64Z Urinary Stones and Obstruction 5,232 9,668 1.85 10.7% 0.4990 0.1034 0.0104 0.3559 0.0293 0.01 84L65A Kidney and Urinary Tract Signs and Symptoms W Catastrophic or Severe CC 744 5,373 7.22 1.8% 1.5172 0.0448 0.0620 1.4017 0.0087 0.06 72L65B Kidney and Urinary Tract Signs and Symptoms W/O Catastrophic or Severe CC 4,273 9,579 2.24 22.0% 0.4913 0.0571 0.0151 0.4127 0.0063 0.02 90L66Z Urethral Stricture 625 994 1.59 19.8% 0.4428 0.1238 0.0123 0.3023 0.0044 0.03 65L67A Other Kidney and Urinary Tract Diagnoses W Catastrophic or Severe CC 1,042 7,180 6.89 4.1% 1.5887 0.0543 0.1553 1.3693 0.0098 0.07 78L67B Other Kidney and Urinary Tract Diagnoses W/O Catastrophic or Severe CC 10,744 16,386 1.53 53.1% 0.3162 0.0453 0.0102 0.2523 0.0084 0.01 92L68Z Peritoneal Dialysis ****** ****** ****** ****** ****** ****** ****** ****** ****** ****** ******M01A Major Male Pelvic Procedures W Catastrophic or Severe CC 644 3,883 6.03 0.0% 3.5905 1.2424 0.3454 1.8353 0.1674 0.11 50M01B Major Male Pelvic Procedures W/O Catastrophic or Severe CC 5,110 16,249 3.18 0.2% 2.5950 1.1394 0.0818 1.2293 0.1445 0.02 59M02A Transurethral Prostatectomy W Catastrophic or Severe CC 1,098 7,286 6.64 1.0% 2.1540 0.4129 0.1662 1.4456 0.1292 0.11 69M02B Transurethral Prostatectomy W/O Catastrophic or Severe CC 11,875 30,105 2.54 1.5% 0.9531 0.3453 0.0147 0.5857 0.0073 0.01 81M03Z Penis Procedures 2,312 3,316 1.43 34.4% 1.4240 0.3574 0.0038 0.3773 0.6855 0.06 82M04Z Testes Procedures 6,173 7,699 1.25 39.5% 0.5351 0.2895 0.0041 0.2278 0.0136 0.01 89M05Z Circumcision 5,850 6,422 1.10 67.6% 0.3284 0.2020 0.0010 0.1208 0.0046 0.00 86M06A Other Male Reproductive System OR Procedures W CC 222 1,140 5.13 22.4% 1.9183 0.3114 0.0944 1.2981 0.2144 0.14 49M06B Other Male Reproductive System OR Procedures W/O CC 2,322 2,832 1.22 50.0% 1.2054 0.2319 0.0040 0.3620 0.6076 0.04 73M40Z Cystourethroscopy, Sameday 6,333 6,577 1.04 76.1% 0.1673 0.0991 0.0008 0.0652 0.0023 0.00 81M60A Malignancy, Male Reproductive System W Catastrophic or Severe CC 681 5,893 8.65 12.5% 1.9017 0.0861 0.0359 1.7744 0.0053 0.10 60M60B Malignancy, Male Reproductive System W/O Catastrophic or Severe CC 10,140 13,051 1.29 69.2% 0.2641 0.0901 0.0011 0.1698 0.0031 0.01 81M61Z Benign Prostatic Hypertrophy 1,316 1,937 1.47 62.9% 0.3087 0.0927 0.0024 0.2116 0.0020 0.01 74M62Z Inflammation of the Male Reproductive System 1,048 3,511 3.35 25.5% 0.6817 0.0541 0.0204 0.6031 0.0041 0.04 76M63Z Sterilisation, Male 5,942 6,316 1.06 92.0% 0.2323 0.1428 0.0008 0.0880 0.0008 0.00 59M64Z Other Male Reproductive System Diagnoses 1,282 1,641 1.28 67.3% 0.2946 0.1125 0.0131 0.1656 0.0034 0.02 75N01Z Pelvic Evisceration and Radical Vulvectomy 376 2,690 7.16 1.3% 3.1858 0.8816 0.2617 1.9116 0.1310 0.16 20N04A Hysterectomy for Non-Malignancy W Catastrophic or Severe CC 1,182 5,885 4.98 2.9% 2.1013 0.7841 0.0861 1.1150 0.1161 0.04 70N04B Hysterectomy for Non-Malignancy W/O Catastrophic or Severe CC 11,964 39,637 3.31 1.9% 1.4900 0.6526 0.0118 0.7564 0.0692 0.01 80N05A Oophorectomies and Complex Fallopian Tube Procs for Non-Malig W Cat or Sev CC 271 1,364 5.04 8.5% 2.1942 0.7022 0.3076 1.1063 0.0781 0.21 56N05B Oophorectomies & Complex Fallopian Tube Procs for Non-Malig W/O Cat or Sev CC 3,741 6,294 1.68 19.1% 1.0285 0.4998 0.0107 0.4683 0.0498 0.03 81N06A Female Reproductive System Reconstructive Procs W Catastrophic or Severe CC 968 4,354 4.50 3.4% 1.9159 0.5514 0.0850 0.9739 0.3056 0.05 68N06B Female Reproductive System Reconstructive Procs W/O Catastrophic or Severe CC 8,923 21,308 2.39 7.9% 1.2127 0.4033 0.0070 0.5490 0.2534 0.01 87N07Z Other Uterine and Adnexa Procedures for Non-Malignancy 34,211 40,216 1.18 70.6% 0.4717 0.2562 0.0033 0.1903 0.0218 0.00 86N08Z Endoscopic and Laparoscopic Procedures for Female Reproductive System 7,735 9,370 1.21 62.1% 0.5974 0.3331 0.0029 0.2104 0.0510 0.01 85N09Z Conisation, Vagina, Cervix and Vulva Procedures 11,881 13,370 1.13 75.2% 0.2983 0.1677 0.0014 0.1275 0.0017 0.01 90N10Z Diagnostic Curettage or Diagnostic Hysteroscopy 17,320 18,649 1.08 79.4% 0.2370 0.1414 0.0011 0.0927 0.0019 0.00 82N11Z Other Female Reproductive System OR Procedures 5,094 6,475 1.27 59.3% 0.2950 0.1125 0.0062 0.1641 0.0123 0.02 50N12A Uterine and Adnexa Procedures for Malignancy W Catastrophic CC 353 3,561 10.09 1.4% 4.4432 1.0247 0.7790 2.4400 0.1995 0.22 37N12B Uterine and Adnexa Procedures for Malignancy W/O Catastrophic CC 1,896 6,978 3.68 10.1% 1.7916 0.6677 0.1103 0.9541 0.0594 0.03 71N60A Malignancy, Female Reproductive System W Catastrophic CC 191 2,262 11.83 16.4% 2.6071 0.0548 0.1041 2.4412 0.0070 0.25 33N60B Malignancy, Female Reproductive System W/O Catastrophic CC 1,417 5,065 3.58 25.3% 0.9706 0.0449 0.0078 0.9070 0.0109 0.04 59N61Z Infections, Female Reproductive System 292 1,022 3.50 20.4% 0.8112 0.0340 0.0724 0.7037 0.0010 0.16 48N62Z Menstrual and Other Female Reproductive System Disorders 4,825 5,921 1.23 69.3% 0.2410 0.0969 0.0038 0.1381 0.0022 0.00 88O01A Caesarean Delivery W Catastrophic CC 1,374 14,418 10.49 0.8% 3.3763 0.5793 0.1890 2.5850 0.0229 0.10 41O01B Caesarean Delivery W Severe CC 5,338 32,238 6.04 1.4% 2.0438 0.4702 0.0370 1.5208 0.0159 0.02 41O01C Caesarean Delivery W/O Catastrophic or Severe CC 29,303 141,214 4.82 1.1% 1.6693 0.4236 0.0175 1.2109 0.0173 0.02 42
Percentage of same day
seps incl in ALOS
Number of Seps
Number of days
ALOS (Days)
No. of hospitals
Critical Care (b)
Misce-llaneous
(b)
Oper Rooms & Spec Proc Suites (b)
Prostheses (b)
Standard Error (Total
Cost Weight)
Overnight Private HospitalsPwC 73

Cost weight tables by DRG
Private Sector - Estimated Round 17 (2012-13) AR-DRG 6.0x ReportPrivate Sector Estimated - National Consolidated Cost Weights
Cost Weight for Selected Cost Buckets
DRG DRG Description Total(a)O02A Vaginal Delivery W OR Procedure W Catastrophic or Severe CC 288 1,579 5.49 3.4% 2.1197 0.3720 0.1091 1.6358 0.0028 0.10 37O02B Vaginal Delivery W OR Procedure W/O Catastrophic or Severe CC 875 3,808 4.35 1.7% 1.4385 0.1834 0.0145 1.2401 0.0003 0.03 40O03A Ectopic Pregnancy W CC 48 101 2.11 0.0% 1.0159 0.3664 0.1014 0.5339 0.0143 0.16 15O03B Ectopic Pregnancy W/O CC 538 758 1.41 18.2% 0.6518 0.3295 0.0029 0.3057 0.0137 0.03 54O04A Postpartum and Post Abortion W OR Procedure W Catastrophic or Severe CC 63 194 3.07 18.0% 1.4511 0.4876 0.1448 0.8068 0.0118 0.22 22O04B Postpartum and Post Abortion W OR Procedure W/O Catastrophic or Severe CC 768 1,079 1.40 51.9% 0.4520 0.1821 0.0131 0.2546 0.0022 0.02 56O05Z Abortion W OR Procedure 9,505 10,504 1.11 73.6% 0.2508 0.1301 0.0016 0.1179 0.0011 0.01 75O60A Vaginal Delivery W Catastrophic or Severe CC 4,248 21,287 5.01 1.6% 1.6972 0.1789 0.0300 1.4864 0.0019 0.02 42O60B Vaginal Delivery W/O Catastrophic or Severe CC 36,332 147,603 4.06 1.5% 1.3263 0.1598 0.0145 1.1512 0.0007 0.00 42O60C Vaginal Delivery Single Uncomplicated W/O Other Condition 5,459 19,629 3.60 1.6% 1.0867 0.1175 0.0118 0.9560 0.0015 0.01 41O61Z Postpartum and Post Abortion W/O OR Procedure 2,687 8,148 3.03 11.5% 0.6000 0.0142 0.0138 0.5712 0.0008 0.02 59O63Z Abortion W/O OR Procedure 454 629 1.39 24.9% 0.3702 0.0190 0.0090 0.3402 0.0019 0.04 41O64A False Labour Before 37 Weeks or W Catastrophic CC 1,931 5,002 2.59 15.5% 0.4752 0.0034 0.0058 0.4656 0.0004 0.02 41O64B False Labour After 37 Weeks W/O Catastrophic CC 819 912 1.11 43.4% 0.1534 0.0017 0.0010 0.1505 0.0001 0.01 40O66A Antenatal and Other Obstetric Admission 6,924 19,662 2.84 2.3% 0.6138 0.0281 0.0097 0.5748 0.0012 0.02 59O66B Antenatal and Other Obstetric Admission, Sameday 4,385 5,190 1.18 81.5% 0.1274 0.0215 0.0003 0.1020 0.0036 0.01 56P01Z Neonate, Died or Transferred <5 Days of Admission W Significant OR Procedure ****** ****** ****** ****** ****** ****** ****** ****** ****** ****** ******P02Z Cardiothoracic/Vascular Procedures for Neonates ------ ------ ------ ------ ------ ------ ------ ------ ------ ------ ------P03Z Neonate, AdmWt 1000-1499 g W Significant OR Procedure 44 1,869 42.32 5.9% 23.9748 0.0274 19.5488 4.3978 0.0008 3.15 3P04Z Neonate, AdmWt 1500-1999 g W Significant OR Procedure 32 1,194 36.93 0.0% 21.7109 0.2329 15.0837 6.3943 0.0000 5.18 4P05Z Neonate, AdmWt 2000-2499 g W Significant OR Procedure 13 315 24.00 0.0% 14.0310 0.9682 10.2812 2.7805 0.0011 6.61 4P06A Neonate, AdmWt >2499 g W Significant OR Procedure W Multi Major Problems 28 1,043 36.64 0.0% 27.6879 1.3982 18.8125 7.4769 0.0002 6.91 4P06B Neonate, AdmWt >2499 g W Significant OR Procedure W/O Multi Major Problems 70 549 7.82 2.3% 3.7856 0.3159 1.5842 1.8037 0.0819 0.64 11P60A Neonate, Died or Transferred <5 Days of Adm, W/O Significant OR Proc, Newborn 593 834 1.41 26.3% 0.6056 0.0021 0.1803 0.4232 0.0000 0.08 39P60B Neonate, Died or Transf <5 Days of Adm, W/O Significant OR Proc, Not Newborn 43 96 2.24 9.9% 1.7508 0.0000 0.9697 0.7810 0.0000 0.36 10P61Z Neonate, AdmWt <750 g 21 1,776 84.02 9.7% 50.3855 0.1472 40.3872 9.8497 0.0014 9.34 4P62Z Neonate, AdmWt 750-999 g 41 2,650 64.78 5.0% 39.4475 0.1804 31.6524 7.6147 0.0000 4.58 4P63Z Neonate, AdmWt 1000-1249 g W/O Significant OR Procedure 47 1,215 25.63 8.0% 10.0089 0.0285 4.0083 5.9721 0.0000 2.04 13P64Z Neonate, AdmWt 1250-1499 g W/O Significant OR Procedure 143 4,400 30.83 2.0% 10.5195 0.0039 4.6054 5.9102 0.0000 0.83 17P65A Neonate, AdmWt 1500-1999 g W/O Significant OR Proc W Multi Major Problems 18 482 26.15 9.0% 11.5751 0.0000 4.3084 7.2667 0.0000 3.09 9P65B Neonate, AdmWt 1500-1999 g W/O Significant OR Procedure W Major Problem 212 5,442 25.68 1.5% 9.3600 0.0003 4.9666 4.3931 0.0000 0.69 23P65C Neonate, AdmWt 1500-1999 g W/O Significant OR Procedure W Other Problem 268 5,494 20.49 1.8% 7.1816 0.0038 3.1130 4.0648 0.0000 0.48 26P65D Neonate, AdmWt 1500-1999 g W/O Significant OR Procedure W/O Problem 330 6,041 18.29 3.0% 5.2998 0.0045 1.0968 4.1985 0.0000 0.31 29P66A Neonate, AdmWt 2000-2499 g W/O Significant OR Proc W Multi Major Problems 21 435 20.78 0.0% 5.7540 0.0042 1.9686 3.7811 0.0000 0.92 8P66B Neonate, AdmWt 2000-2499 g W/O Significant OR Procedure W Major Problem 259 4,179 16.15 0.6% 5.5227 0.0014 2.3748 3.1464 0.0000 0.32 27P66C Neonate, AdmWt 2000-2499 g W/O Significant OR Procedure W Other Problem 1,532 18,820 12.28 0.9% 4.8435 0.0021 1.7078 3.1336 0.0000 0.19 36P66D Neonate, AdmWt 2000-2499 g W/O Significant OR Procedure W/O Problem 683 3,661 5.36 1.1% 1.9942 0.0017 0.7428 1.2496 0.0000 0.18 35P67A Neonate, AdmWt >2499 g W/O Significant OR Procedure W Multi Major Problems 193 1,929 9.98 0.0% 3.8067 0.0007 1.1144 2.6916 0.0001 0.48 35P67B Neonate, AdmWt >2499 g W/O Significant OR Procedure W Major Problem 1,269 9,448 7.45 2.0% 2.3810 0.0040 0.6512 1.7258 0.0000 0.14 40P67C Neonate, AdmWt >2499 g W/O Significant OR Procedure W Other Problem 6,125 38,886 6.35 1.1% 1.8645 0.0057 0.4584 1.3993 0.0010 0.05 42P67D Neonate, AdmWt >2499 g W/O Significant OR Procedure W/O Problem 21,990 89,411 4.07 3.0% 0.4210 0.0024 0.0536 0.3644 0.0006 0.01 44Q01Z Splenectomy 167 832 5.00 0.0% 2.8287 0.6909 0.2962 1.4019 0.4396 0.18 36Q02A Other OR Procedure of Blood and Blood Forming Organs W Cat or Sev CC 548 5,664 10.33 8.7% 4.4794 0.4548 0.5522 2.5703 0.9022 0.21 63Q02B Other OR Procedure of Blood and Blood Forming Organs W/O Cat or Sev CC 1,300 2,782 2.14 39.3% 0.9463 0.2694 0.0503 0.4366 0.1900 0.05 85Q60A Reticuloendothelial and Immunity Disorders W Catastrophic or Severe CC 946 6,803 7.19 8.4% 1.9152 0.0464 0.0827 1.7800 0.0061 0.08 55Q60B Reticuloendothelial and Immunity Disorders W/O Cat or Sev CC W Malignancy 640 1,956 3.06 34.7% 0.6865 0.0118 0.0021 0.6711 0.0015 0.03 41Q60C Reticuloendothelial and Immunity Disorders W/O Cat or Sev CC W/O Malignancy 8,375 12,051 1.44 61.5% 0.2421 0.0222 0.0040 0.2144 0.0015 0.01 83
Percentage of same day
seps incl in ALOS
Number of Seps
Number of days
ALOS (Days)
No. of hospitals
Critical Care (b)
Misce-llaneous
(b)
Oper Rooms & Spec Proc Suites (b)
Prostheses (b)
Standard Error (Total
Cost Weight)
Overnight Private HospitalsPwC 74

Cost weight tables by DRG
Private Sector - Estimated Round 17 (2012-13) AR-DRG 6.0x ReportPrivate Sector Estimated - National Consolidated Cost Weights
Cost Weight for Selected Cost Buckets
DRG DRG Description Total(a)Q61A Red Blood Cell Disorders W Catastrophic or Severe CC 2,647 17,118 6.47 10.9% 1.4137 0.0671 0.1369 1.1973 0.0123 0.05 85Q61B Red Blood Cell Disorders W/O Catastrophic or Severe CC 24,454 34,951 1.43 53.5% 0.2928 0.0683 0.0046 0.2131 0.0069 0.00 92Q62Z Coagulation Disorders 2,144 6,608 3.08 44.3% 0.5974 0.0197 0.0275 0.5477 0.0025 0.04 75R01A Lymphoma and Leukaemia W Major OR Procedures W Catastrophic or Severe CC 178 3,370 18.89 5.3% 7.7308 0.7754 0.9481 5.2557 0.7516 0.62 33R01B Lymphoma and Leukaemia W Major OR Procedures W/O Catastrophic or Severe CC 420 1,604 3.82 13.4% 1.9945 0.4412 0.1119 1.1269 0.3144 0.13 61R02A Other Neoplastic Disorders W Major OR Procedures W Catastrophic CC 133 1,650 12.45 0.0% 5.0893 1.2125 0.8270 2.6226 0.4272 0.39 33R02B Other Neoplastic Disorders W Major OR Procedures W Severe or Moderate CC 249 1,513 6.08 3.7% 2.7252 0.7320 0.3310 1.5175 0.1447 0.13 48R02C Other Neoplastic Disorders W Major OR Procedures W/O CC 1,148 4,064 3.54 6.3% 1.6144 0.6177 0.0670 0.8441 0.0856 0.04 73R03A Lymphoma and Leukaemia W Other OR Procedures W Catastrophic or Severe CC 346 5,985 17.28 2.5% 5.6963 0.3822 0.3376 4.4114 0.5651 0.33 47R03B Lymphoma and Leukaemia W Other OR Procedures W/O Catastrophic or Severe CC 1,265 2,753 2.18 36.7% 0.7888 0.2342 0.0197 0.4962 0.0387 0.03 79R04A Other Neoplastic Disorders W Other OR Procedures W CC 381 2,001 5.25 22.6% 1.7711 0.3916 0.1275 1.1713 0.0807 0.17 57R04B Other Neoplastic Disorders W Other OR Procedures W/O CC 606 1,033 1.70 41.7% 0.6531 0.2797 0.0100 0.3275 0.0359 0.03 68R60A Acute Leukaemia W Catastrophic CC 294 6,931 23.56 0.0% 7.3290 0.1165 0.2603 6.8906 0.0616 0.31 27R60B Acute Leukaemia W/O Catastrophic CC 1,793 4,956 2.76 53.2% 0.7090 0.0289 0.0261 0.6511 0.0028 0.03 53R61A Lymphoma and Non-Acute Leukaemia W Catastrophic CC 962 17,330 18.01 0.8% 4.6610 0.0793 0.3459 4.2107 0.0250 0.15 50R61B Lymphoma and Non-Acute Leukaemia W/O Catastrophic CC 7,639 33,453 4.38 0.5% 1.2050 0.0367 0.0152 1.1419 0.0112 0.02 79R61C Lymphoma and Non-Acute Leukaemia, Sameday 12,055 13,411 1.11 68.0% 0.2267 0.0215 0.0023 0.1974 0.0055 0.01 74R62A Other Neoplastic Disorders W CC 617 4,211 6.82 20.4% 1.4399 0.0409 0.0375 1.3512 0.0104 0.11 60R62B Other Neoplastic Disorders W/O CC 648 2,237 3.45 45.0% 0.8437 0.0952 0.0033 0.7346 0.0107 0.08 70R63Z Chemotherapy 207,697 241,009 1.16 60.9% 0.2136 0.0228 0.0026 0.1786 0.0096 0.00 61R64Z Radiotherapy ****** ****** ****** ****** ****** ****** ****** ****** ****** ****** ******S60Z HIV, Sameday 110 110 1.00 95.5% 0.0866 0.0144 0.0000 0.0722 0.0001 0.01 4S65A HIV-Related Diseases W Catastrophic CC ------ ------ ------ ------ ------ ------ ------ ------ ------ ------ ------S65B HIV-Related Diseases W Severe CC ****** ****** ****** ****** ****** ****** ****** ****** ****** ****** ******S65C HIV-Related Diseases W/O Catastrophic or Severe CC 8 59 7.68 0.0% 2.1983 0.0941 0.0000 2.1042 0.0000 0.76 4T01A OR Procedures for Infectious and Parasitic Diseases W Catastrophic CC 870 18,847 21.67 1.3% 7.5836 0.5970 1.1470 5.3172 0.5225 0.25 70T01B OR Procedures for Infectious and Parasitic Diseases W Severe or Moderate CC 890 8,422 9.46 5.0% 3.0722 0.4049 0.2051 2.1227 0.3395 0.14 65T01C OR Procedures for Infectious and Parasitic Diseases W/O CC 1,347 6,740 5.00 17.0% 1.5473 0.3102 0.0274 1.0817 0.1281 0.09 88T40Z Infectious and Parasitic Diseases W Ventilator Support 29 302 10.49 0.0% 5.4639 0.0952 3.2646 2.0846 0.0195 0.84 14T60A Septicaemia W Catastrophic CC 1,364 19,382 14.20 2.1% 3.5819 0.0590 0.6721 2.8055 0.0453 0.16 70T60B Septicaemia W/O Catastrophic CC 1,981 14,481 7.31 4.9% 1.8134 0.0382 0.0963 1.6451 0.0338 0.28 78T61A Postoperative and Post-Traumatic Infections W Catastrophic or Severe CC 805 7,050 8.76 2.4% 1.8789 0.0597 0.1210 1.6803 0.0180 0.08 69T61B Postoperative and Post-Traumatic Infections W/O Catastrophic or Severe CC 2,891 15,268 5.28 5.8% 1.0085 0.0319 0.0188 0.9423 0.0155 0.02 89T62A Fever of Unknown Origin W CC 1,269 6,952 5.48 4.3% 1.2072 0.0358 0.0424 1.1200 0.0091 0.04 65T62B Fever of Unknown Origin W/O CC 1,369 4,155 3.04 7.2% 0.5897 0.0172 0.0115 0.5587 0.0024 0.02 68T63Z Viral Illness 2,156 7,923 3.68 6.1% 0.6875 0.0205 0.0220 0.6426 0.0024 0.03 71T64A Other Infectious and Parasitic Diseases W Catastrophic CC 435 6,948 15.97 1.8% 3.7840 0.0814 0.3933 3.2946 0.0147 0.24 31T64B Other Infectious and Parasitic Diseases W Severe or Moderate CC 669 5,019 7.50 12.1% 1.4426 0.0486 0.0255 1.3598 0.0086 0.06 49T64C Other Infectious and Parasitic Diseases W/O CC 434 1,474 3.40 24.9% 0.7563 0.0650 0.0157 0.6392 0.0365 0.04 52U40Z Mental Health Treatment, Sameday, W ECT 480 480 1.00 100.0% 0.2220 0.0205 0.0000 0.2015 0.0000 0.01 5U60Z Mental Health Treatment, Sameday, W/O ECT 22,670 22,675 1.00 99.8% 0.1078 0.0011 0.0000 0.1067 0.0000 0.00 32U61A Schizophrenia Disorders W Mental Health Legal Status ****** ****** ****** ****** ****** ****** ****** ****** ****** ****** ******U61B Schizophrenia Disorders W/O Mental Health Legal Status 170 3,658 21.57 0.0% 3.0955 0.0223 0.0000 3.0628 0.0104 0.23 11U62A Paranoia & Acute Psych Disorder W Cat/Sev CC or W Mental Health Legal Status 15 274 18.23 0.0% 3.9027 0.1270 0.0000 2.7322 1.0435 1.84 7U62B Paranoia & Acute Psych Disorder W/O Cat/Sev CC W/O Mental Health Legal Status 37 554 14.95 0.0% 1.7759 0.0013 0.0000 1.7746 0.0000 0.28 12
Percentage of same day
seps incl in ALOS
Number of Seps
Number of days
ALOS (Days)
No. of hospitals
Critical Care (b)
Misce-llaneous
(b)
Oper Rooms & Spec Proc Suites (b)
Prostheses (b)
Standard Error (Total
Cost Weight)
Overnight Private HospitalsPwC 75

Cost weight tables by DRG
Private Sector - Estimated Round 17 (2012-13) AR-DRG 6.0x ReportPrivate Sector Estimated - National Consolidated Cost Weights
Cost Weight for Selected Cost Buckets
DRG DRG Description Total(a)U63A Major Affective Disorders Age >69 or W (Catastrophic or Severe CC) 496 12,438 25.07 0.0% 3.9777 0.0497 0.0229 3.8822 0.0229 0.19 28U63B Major Affective Disorders Age <70 W/O Catastrophic or Severe CC 1,797 37,829 21.05 0.0% 2.9516 0.0282 0.0012 2.9222 0.0000 0.08 22U64Z Other Affective and Somatoform Disorders 688 12,848 18.67 0.0% 2.3434 0.0226 0.0199 2.2764 0.0244 0.12 50U65Z Anxiety Disorders 1,409 6,979 4.95 1.7% 0.9409 0.0401 0.0156 0.8735 0.0117 0.05 67U66Z Eating and Obsessive-Compulsive Disorders 273 6,667 24.46 0.0% 2.8352 0.0113 0.0031 2.8207 0.0001 0.24 16U67Z Personality Disorders and Acute Reactions 964 18,505 19.19 0.0% 2.5629 0.0578 0.0061 2.2253 0.2738 0.09 36U68Z Childhood Mental Disorders 18 66 3.65 0.0% 1.8760 0.0643 0.0080 1.8037 0.0000 0.28 5V60A Alcohol Intoxication and Withdrawal W CC 41 247 6.03 14.2% 1.0551 0.0000 0.0103 1.0447 0.0000 0.24 14V60B Alcohol Intoxication and Withdrawal W/O CC 122 267 2.19 35.9% 0.3998 0.0049 0.0218 0.3732 0.0000 0.07 19V61Z Drug Intoxication and Withdrawal 67 471 7.08 2.4% 1.4559 0.0140 0.1301 1.2352 0.0767 0.21 22V62A Alcohol Use Disorder and Dependence 626 11,795 18.84 0.0% 1.8128 0.0154 0.0053 1.7901 0.0019 0.06 19V62B Alcohol Use Disorder and Dependence, Sameday 3,956 3,956 1.00 100.0% 0.1008 0.0109 0.0000 0.0899 0.0000 0.00 9V63Z Opioid Use Disorder and Dependence 44 416 9.50 14.5% 1.0365 0.0688 0.0759 0.8911 0.0006 0.22 10V64Z Other Drug Use Disorder and Dependence 98 559 5.68 55.2% 0.7372 0.0184 0.0382 0.6542 0.0265 0.10 8W01Z Ventilation or Cranial Procedures for Multiple Significant Trauma 8 285 35.80 0.0% 16.8981 1.3247 3.6489 7.4965 4.4280 3.87 5W02A Hip, Femur & Limb Pr for Mult Signif Trauma, Incl Implantation W Cat/Sev CC 49 1,154 23.66 3.4% 9.4928 1.2717 0.7782 5.0570 2.3858 1.49 16W02B Hip, Femur & Limb Pr for Mult Signif Trauma, Incl Implantation W/O Cat/Sev CC 27 321 11.80 0.0% 5.3801 0.5713 0.1713 2.9903 1.6472 1.00 12W03Z Abdominal Procedures for Multiple Significant Trauma ****** ****** ****** ****** ****** ****** ****** ****** ****** ****** ******W04A Other OR Procs for Multiple Significant Trauma W Catastrophic or Severe CC 18 576 32.43 0.0% 11.4124 1.5558 0.6639 6.9422 2.2504 3.36 6W04B Other OR Procs for Multiple Significant Trauma W/O Catastrophic or Severe CC 15 111 7.52 0.0% 4.5113 0.7108 0.0592 2.1329 1.6083 1.42 8W60Z Multiple Trauma, Died or Transferred to Another Acute Care Facility <5 Days 21 46 2.16 0.0% 1.0688 0.1438 0.1311 0.5005 0.2934 0.51 11W61A Multiple Trauma W/O Significant Procedures W Catastrophic or Severe CC 62 982 15.79 0.0% 3.3646 0.0057 0.3922 2.9584 0.0083 0.36 18W61B Multiple Trauma W/O Significant Procedures W/O Catastrophic or Severe CC 66 721 10.93 0.0% 2.0306 0.0083 0.1160 1.9056 0.0006 0.36 25X02A Microvascular Tiss Transfer or (Skin Graft W Cat/Sev CC) for Injuries to Hand 428 872 2.04 28.5% 1.1819 0.5429 0.0050 0.5654 0.0685 0.06 48X02B Skin Graft for Injuries to Hand W/O Catastrophic or Severe CC 966 1,327 1.37 34.0% 0.5583 0.2819 0.0018 0.2647 0.0099 0.02 58X04A Other Procedures for Injuries to Lower Limb W Catastrophic or Severe CC 243 2,364 9.74 5.3% 2.5971 0.3778 0.0622 1.9021 0.2550 0.19 54X04B Other Procedures for Injuries to Lower Limb W/O Catastrophic or Severe CC 1,074 2,594 2.42 29.3% 0.9578 0.2869 0.0123 0.5018 0.1567 0.05 78X05A Other Procedures for Injuries to Hand W CC 225 969 4.31 8.8% 1.1252 0.2269 0.0332 0.8546 0.0104 0.08 45X05B Other Procedures for Injuries to Hand W/O CC 2,686 3,395 1.26 44.6% 0.4586 0.2317 0.0008 0.2132 0.0128 0.01 75X06A Other Procedures for Other Injuries W Catastrophic or Severe CC 1,109 9,313 8.40 6.1% 2.7061 0.4247 0.3556 1.7231 0.2027 0.11 78X06B Other Procedures for Other Injuries W/O Catastrophic or Severe CC 6,958 13,380 1.92 23.0% 1.0255 0.3352 0.0167 0.4417 0.2318 0.02 92X07A Skin Graft for Injuries Ex Hand W Microvascular Tiss Tfr or W (Cat or Sev CC) 468 5,811 12.41 5.9% 3.3446 0.5462 0.0928 2.6247 0.0809 0.15 55X07B Skin Graft for Injuries Ex Hand W/O Microvascular Tiss Tfr W/O Cat or Sev CC 683 3,444 5.04 18.3% 1.4969 0.2956 0.0318 1.1452 0.0243 0.07 69X40Z Injuries, Poisoning and Toxic Effects of Drugs W Ventilator Support 12 89 7.68 14.4% 3.6617 0.0158 1.8403 1.8056 0.0000 0.86 6X60A Injuries W Catastrophic or Severe CC 1,307 12,321 9.43 3.3% 1.7367 0.0440 0.0686 1.6179 0.0061 0.06 75X60B Injuries W/O Catastrophic or Severe CC 2,916 11,165 3.83 17.8% 0.6486 0.0460 0.0131 0.5883 0.0012 0.02 91X61Z Allergic Reactions 327 711 2.18 20.3% 0.5149 0.0182 0.1593 0.3367 0.0008 0.05 45X62A Poisoning/Toxic Effects of Drugs and Other Substances W Cat or Sev CC 199 1,641 8.26 4.3% 1.6125 0.0154 0.2990 1.2969 0.0012 0.21 39X62B Poisoning/Toxic Effects of Drugs and Other Substances W/O Cat or Sev CC 506 1,104 2.18 17.4% 0.4818 0.0056 0.0830 0.3932 0.0000 0.03 50X63A Sequelae of Treatment W Catastrophic or Severe CC 965 6,040 6.26 7.6% 1.4813 0.0689 0.0968 1.2657 0.0499 0.06 72X63B Sequelae of Treatment W/O Catastrophic or Severe CC 4,911 12,804 2.61 19.1% 0.5700 0.0805 0.0159 0.4585 0.0151 0.02 91X64A Other Injury, Poisoning and Toxic Effect Diagnosis W Cat or Sev CC 42 311 7.37 3.8% 1.8028 0.1149 0.2031 1.4768 0.0080 0.34 15X64B Other Injury, Poisoning and Toxic Effect Diagnosis W/O Cat or Sev CC 174 378 2.18 19.8% 0.4178 0.0147 0.0467 0.3563 0.0001 0.10 44Y01Z Ventilation for Burns and Severe Full Thickness Burns ****** ****** ****** ****** ****** ****** ****** ****** ****** ****** ******Y02A Other Burns W Skin Graft W CC 12 135 11.22 0.0% 3.5003 0.3862 0.2927 2.8214 0.0000 0.63 5Y02B Other Burns W Skin Graft W/O CC 68 240 3.54 30.5% 1.3620 0.3272 0.0060 1.0213 0.0075 0.11 27
Percentage of same day
seps incl in ALOS
Number of Seps
Number of days
ALOS (Days)
No. of hospitals
Critical Care (b)
Misce-llaneous
(b)
Oper Rooms & Spec Proc Suites (b)
Prostheses (b)
Standard Error (Total
Cost Weight)
Overnight Private HospitalsPwC 76

Cost weight tables by DRG
Private Sector - Estimated Round 17 (2012-13) AR-DRG 6.0x ReportPrivate Sector Estimated - National Consolidated Cost Weights
Cost Weight for Selected Cost Buckets
DRG DRG Description Total(a)Y03Z Other OR Procedures for Other Burns 120 373 3.11 38.4% 1.1197 0.2955 0.0001 0.8218 0.0022 0.09 36Y60Z Burns, Transferred to Another Acute Care Facility <5 Days ------ ------ ------ ------ ------ ------ ------ ------ ------ ------ ------Y61Z Severe Burns ****** ****** ****** ****** ****** ****** ****** ****** ****** ****** ******Y62A Other Burns W CC 38 261 6.86 4.2% 1.2506 0.0017 0.0000 1.2489 0.0000 0.35 17Y62B Other Burns W/O CC 77 455 5.94 29.7% 0.8734 0.0133 0.0257 0.8335 0.0010 0.18 27Z01A OR Procedures W Diagnoses of Other Contacts W Health Services W Cat/Sev CC 1,182 2,614 2.21 56.6% 1.1727 0.2301 0.0672 0.6265 0.2488 0.12 75Z01B OR Procedures W Diagnoses of Other Contacts W Health Services W/O Cat/Sev CC 4,516 5,916 1.31 53.6% 0.6676 0.2289 0.0051 0.2346 0.1989 0.03 92Z40Z Endoscopy W Diagnoses of Other Contacts W Health Services, Sameday 78,499 83,555 1.06 69.9% 0.1860 0.1043 0.0012 0.0766 0.0039 0.00 90Z60A Rehabilitation W Catastrophic CC 1,853 27,508 14.85 5.4% 2.8630 0.0846 0.0003 2.7777 0.0003 0.14 21Z60B Rehabilitation W/O Catastrophic CC 7,354 69,775 9.49 9.5% 1.8231 0.1011 0.0002 1.7210 0.0009 0.06 27Z60C Rehabilitation, Sameday 20,588 21,917 1.06 82.4% 0.1051 0.0000 0.0000 0.1051 0.0000 0.00 17Z61A Signs and Symptoms 2,852 11,844 4.15 1.3% 1.2648 0.0375 0.0289 1.1971 0.0012 0.03 86Z61B Signs and Symptoms, Sameday 3,120 3,264 1.05 67.2% 0.2143 0.1142 0.0010 0.0952 0.0038 0.00 80Z63A Other Surgical Follow Up and Medical Care W Catastrophic CC 369 5,071 13.73 3.3% 2.8348 0.0211 0.2967 2.5132 0.0038 0.22 53Z63B Other Surgical Follow Up and Medical Care W/O Catastrophic CC 3,319 12,717 3.83 9.0% 0.8523 0.0164 0.0964 0.7385 0.0010 0.04 90Z64A Other Factors Influencing Health Status 5,223 11,669 2.23 1.7% 0.7439 0.1070 0.0098 0.5565 0.0707 0.02 88Z64B Other Factors Influencing Health Status, Sameday 72,613 84,479 1.16 60.2% 0.1960 0.0621 0.0016 0.1013 0.0311 0.00 92Z65Z Congenital Anomalies and Problems Arising from Neonatal Period 35 57 1.64 14.3% 0.6970 0.0110 0.0609 0.6251 0.0000 0.09 5Total 2,753,670 6,904,289 2.51 42.1% 1.0000 0.2051 0.0577 0.5085 0.2287 0.00 95
Percentage of same day
seps incl in ALOS
Number of Seps
Number of days
ALOS (Days)
No. of hospitals
Critical Care (b)
Misce-llaneous
(b)
Oper Rooms & Spec Proc Suites (b)
Prostheses (b)
Standard Error (Total
Cost Weight)
Overnight Private HospitalsPwC 77

© 2014 PricewaterhouseCoopers. All rights reserved.PwC refers to the Australian member firm, and may sometimes refer to the PwC network.Each member firm is a separate legal entity. Please see www.pwc.com/structure for further details
Liability limited by a scheme approved under Professional Standards Legislation
pwc.com.au