Embed Size (px)
Citation preview

Q-DAS STATISTICAL SOFTWARE
PRODUCT BROCHURE

Convincing argumentsEvaluation complying with national and international standards Correct and reliable – we have got a patent for “automated statistical evaluation of data”.
Statistical expertiseJoint definition of requirements – we are a professional partner involved in the creation of many company guidelines, standards and reference manuals.
Transfer of knowledgeExperts in statistics – we deliver all benefits of applying statistical procedures and focus on the aspects relevant in practice.
Authority of data formatQ-DAS ASCII transfer format – we developed the industry standard AQDEF for the exchange of quality information.
Variety of interfacesOut-of-the-box connection to measuring instruments – we already offer interfaces to numerous measuring instruments by default.
Converter interfacesFlexible and cost-efficient – we convert foreign formats in a way that Q-DAS products can read them.
System solutionsQ-DAS CAMERA Concept - we implement (quality) performance measurement systems efficiently due to our product and service standards.
Q-DAS insideIntegration into third-party systems – you may integrate our statistics library directly or as a web service into the application of other providers.
Open systemCommunication with other systems – we are able to exchange information with third-party systems, such as CAQ, MES or SAP.
Special functionsUnique – we implement special statistical functions in close collaboration with our customers; these features are only available in Q-DAS software.
Worldwide customer serviceInternational network of partners – we guarantee worldwide on-site service and provide our programs in the respective national language.
Global standardEstablished worldwide – our customers often choose a global roll-out and demand or recommend the application of Q-DAS products in their guidelines.
Q-DAS® CHANNELS DATA STREAMS FOR KNOWLEDGE ACQUISITION.
The instruments we develop are able to convert characteristic values and process parameters reliably into statistics and to present them appropriately. We pave the way for structured, customised evaluation and control of industrial processes. Our software products and know-how for the creation of performance measurement systems ensure that the entire potential of statistical evaluations may contribute to the increase in efficiency at any time – a valuable acquisition of knowledge leading to the success of our customers.
More than 8 000 companies in different industries and about 150 000 users worldwide trust in Q-DAS software. 55 countries all over the world use our standard tools. Uniform corporate standards ensure worldwide reproducibility of results. 21 supported languages overcome language barriers. The same applies to our network of subsidiaries and partners as well as divisions and branches of Hexagon Manufacturing Intelligence.

4
8
12
16
18
22
26
30
34
40
Measurement process capability / solara.MP®
Process qualification / qs-STAT®
Design of experiments / vidara®
Statistical package / destra®
Process control / procella®
Real-time visualisation / O-QIS®
Automated data processing / M-QIS®
Flexible display of results / Q-DAS Web
Visual support / 3D CAD Viewer
Individual report layout / Form Designer
Easy integration / interfaces
System solution / Q-DAS CAMERA® Concept
System implementation / Q-DAS services
42
44
38
CONTENTS

solara.MP®
MEASUREMENT PROCESS CAPABILITYThe evaluation of machines, production facilities and ongoing production is based on the statistical analysis of characteristic values. Processes measuring predefined characteristics provide these values. In order to avoid misinterpretations, the recorded measured values have to be reliable reflecting the real conditions. Measurement processes have to be capable of performing the demanded task in the respective situation. solara.MP is the perfect choice to establish measurement process capability.

Capability analysis according to MSA
solara.MP conducts required capability analyses to establish measurement system capability. Various companies of the automotive industry created corporate guidelines to specify these analyses in detail and to implement them in practice. The main differences between generally accepted procedures such as type-1 (Cg/Cgk), type-2 and type-3 studies (%GRR) or linearity and stability analyses are in the applied calculation methods and the respective limits. solara.MP encompasses many guidelines of the automotive industry, even the procedures given in the MSA manual of AIAG’s Core Tools, of course.
Appealing graphics and convincing statistics
solara.MP offers a broad variety of graphics users apply as a visual support to interpret the statistics they calculated. Users may customise any available graphic for a quick and professional overview of measurement process capability.
q-das.de | HexagonMI.com | HEXAGON MANUFACTURING INTELLIGENCE 5
solara.MP®

Measurement process capability according to VDA 5
VDA Volume 5 evaluates measurement processes based on measurement uncertainty. The calculation of measurement uncertainty is based on an approach that is quite as pragmatical as a MSA capability analysis; however, it follows the specifications of GUM (Guide to the expression of uncertainty in measurement) or EN V 13005. solara.MP combines uncertainty components into an uncertainty budget and calculates the expanded measurement uncertainty U. Providing evidence for conformity or nonconformity with specification according to ISO 14253, users are able to consider the estimated measurement uncertainty.
Attribute measurement system analysis
The signal detection approach is designed to compare attribute values to reference values. Without any reference values available, the Bowker test finds out whether users achieve comparable results. Type-7 study based on Fleiss’ kappa or Cohen’s kappa evaluates classified values (“ordinal” characteristic).
HEXAGON MANUFACTURING INTELLIGENCE | HexagonMI.com | q-das.de6

Reports
Reports provide users with a concise and appealing overview of statistics and graphics. These reports frequently document measurement process capability. They can be stored as PDF files or sent as an email attachment. Reports used as graphic files are easy to integrate into third-party systems.
Measurement uncertainty according to GUM
GUM (Guide to the expression of uncertainty in measurement) explains the theory about how to calculate expanded measurement uncertainty. This calculation requires modelling of the measurement process.
solara.MP illustrates the uncertainty model for each process in graphics. A flow chart provides an overview of the relationships between uncertainty components with each box representing a single uncertainty component. Users just click on a box to edit the uncertainty component. Due to an intuitive input method, the program makes it easy to calculate the combined standard uncertainty or expanded measurement uncertainty.
solara.MP is also available as a web application (p. 31).
q-das.de | HexagonMI.com | HEXAGON MANUFACTURING INTELLIGENCE 7
solara.MP®

qs-STAT®
PROCESS QUALIFICATIONqs-STAT is the tool of choice for the assessment and continuous improvement of processes in industrial production. The standards and guidelines included provide necessary orientation.

Graphics and statistics
There are numerous statistical procedures available identifying the best suitable distribution time model automatically and assigning the data to the respective process model as given in ISO 21747-2. qs-STAT also provides users with a rich set of
statistical summary graphics and graphics of individuals for the visual evaluation of processes.
Automated evaluation through evaluation strategies
There are different requirements and methods regarding the calculation of statistics like Cp and Cpk values. All of them are either based on standards, association and corporate guidelines (e.g. BMW, GMPT, Robert Bosch, Volkswagen etc.) or an individual approach. The evaluation strategy defines all the specifications required to calculate statistics. At the heart of Q-DAS software products, this strategy guarantees the reproducibility of results.
• Applying the integrated evaluation strategy, users always follow the correct approach to the calculation of statistics based on standards, association and corporate guidelines or an individual procedure.
• Results become comparable and can be validated.
• qs-STAT creates confidence in the reliability of results.
• Due to the option to adapt the evaluation strategy to specific requirements, users are able to satisfy individual demands.
q-das.de | HexagonMI.com | HEXAGON MANUFACTURING INTELLIGENCE 9
qs-STAT®
Reports
Reports provide users with a concise and appealing overview of statistics and graphics. They can be stored as PDF files or sent as an email attachment. Reports used as graphic files are easy to integrate into third-party systems.
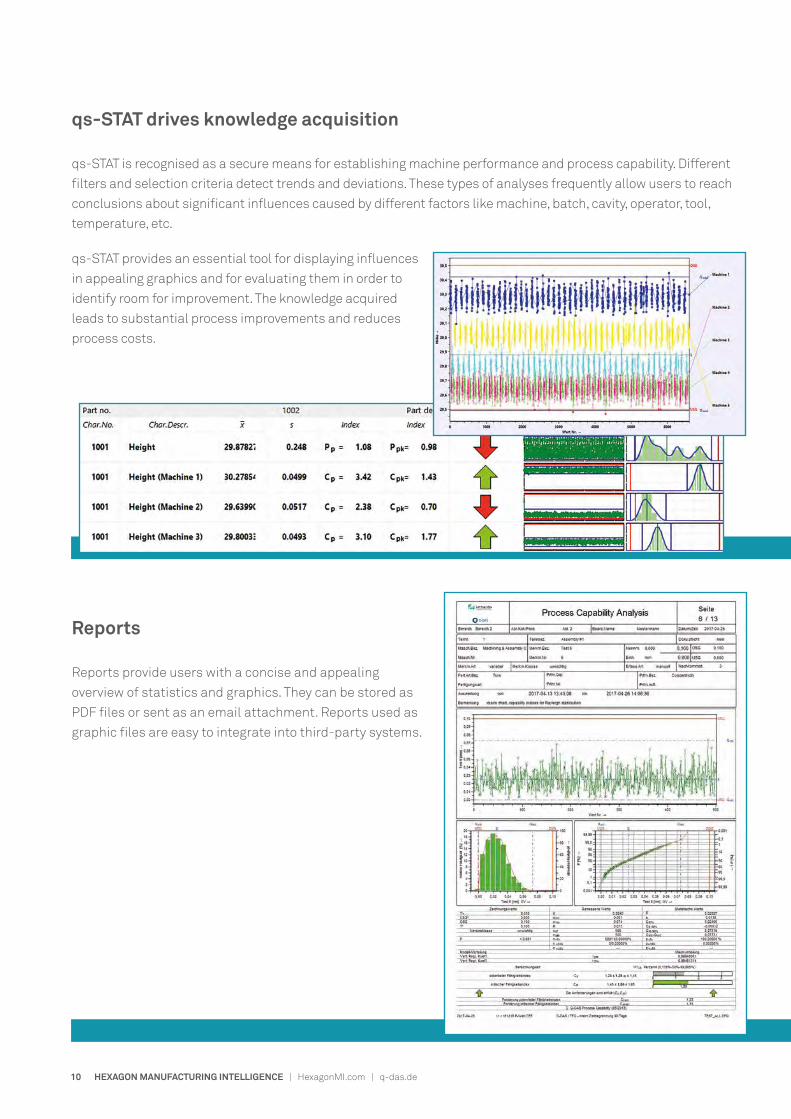
qs-STAT drives knowledge acquisition
qs-STAT is recognised as a secure means for establishing machine performance and process capability. Different filters and selection criteria detect trends and deviations. These types of analyses frequently allow users to reach conclusions about significant influences caused by different factors like machine, batch, cavity, operator, tool, temperature, etc.
qs-STAT provides an essential tool for displaying influences in appealing graphics and for evaluating them in order to identify room for improvement. The knowledge acquired leads to substantial process improvements and reduces process costs.
HEXAGON MANUFACTURING INTELLIGENCE | HexagonMI.com | q-das.de10

qs-STAT is also available as a web application (p. 31).
Individual settings
Even though qs-STAT focuses on the idea of an evaluation strategy, users are still able to select statistical test procedures and individual specifications.
An individual user management supports customised configurations specifying user rights, graphical user interfaces and graphics settings. Approved as an easy-to-use software, qs-STAT provides automated results as well as reports and offers all functionalities and details an expert in statistics needs.
q-das.de | HexagonMI.com | HEXAGON MANUFACTURING INTELLIGENCE 11
qs-STAT®

vidara®
DESIGN OF EXPERIMENTS Offering a variety of statistical methods and tests, vidara is the tool for process improvement. Users benefit from an intuitive user interface and appealing graphics for a quick interpretation of evaluation results. vidara is designed for users of qs-STAT and solara.MP looking for a reasonable extension including evaluation options with respect to improvement projects.

Design of experiments
Design of experiments analyses cause-and-effect relations between factors and responses and optimises products and processes. A well-structured acquisition of data plays a major role.
• Intuitive user interface to create individual experimental designs
• Appealing and significant graphics of results
• Optimisation of several responses
Analysis of variance and regression
The analysis of variance and regression supports users in adapting mathematical models to cause-and-effect relations between factors and responses.
• Excellent model designs
• Various designs for analysis of variance
• Formula editor
• Mixed effects
• Hierarchically nested models
• Unbalanced data
• Visual model diagnostics
• Cook’s distance, leverage values and residuals
q-das.de | HexagonMI.com | HEXAGON MANUFACTURING INTELLIGENCE 13
vidara®

Reliability analysis
Reliability analyses check whether a product meets its requirements under specific conditions over time. vidara helps users plan lifetime analyses, evaluates data collected in an experiment and shows the results in graphics.
• End-of-life test
• Censoring (type I, type II and hybrid censoring schemes)
• Sudden death test
• Eckel procedure for field failure
• Success run tests
Project Explorer structures analyses
The integrated Project Explorer combines analyses made in different modules into compact work packages and structures them. It virtually encloses related data and evaluation results and helps users switch easily and quickly to a different module of the respective project element.
HEXAGON MANUFACTURING INTELLIGENCE | HexagonMI.com | q-das.de14

Compact and clear structure of data and results
Users create different levels in the project structure. Work packages combine analyses of the same type in each project phase. Users define single sessions for each individual analysis step. These sessions include the data sources to be observed and evaluation methods. Various evaluation graphics and form sheets show the evaluation results of the respective session. The software saves the current status of all data and information to the respective project and users may continue their work at any time.
Navigation through the Project Explorer
Files available in the AQDEF format can serve as a data source for the single sessions in the project structure.
The program stores any data sources, analysis steps, evaluation results and graphics in a project file. It thus manages all relevant information. Project files facilitate cooperation since users provide the project file to any project staff in order to show them the current status of the project.
The Project Explorer navigates through different project phases and sessions or through available evaluation modules. In case users apply the Project Explorer to switch to a project phase completed in a Q-DAS software product that is not installed on their computer or whose licence is currently blocked by another user, the program switches automatically to the viewer mode. The software now shows the results of the respective project phase / session and thus provides all relevant information. However, users cannot edit the data in the viewer mode.
Users allocate external documents to each element in the created project structure and use the corresponding link as needed. The respective application opens the selected document.
q-das.de | HexagonMI.com | HEXAGON MANUFACTURING INTELLIGENCE 15
vidara®

destra®
STATISTICAL PACKAGEdestra is a comprehensive statistical package whose wizard guides users through the evaluation of process data leading to meaningful results. A multitude of statistical methods is available in destra; together these methods provide an essential tool for optimising the current state of a process.

destra’s wizard guides users through the evaluation of process data leading to meaningful results. Approved as a classical statistical package, destra is also the tool of choice for process optimisation in Six Sigma projects. Whether Green Belt, Black Belt or Master Black Belt, the software offers simple, graphic-assisted evaluation methods but also a broad variety of expert tools.
While destra offers a whole package of statistical tools, vidara is a software solution than can be combined with solara.MP and qs-STAT to offer the same range of functions yet including all available configuration options.
Comprehensive analysis
destra is the tool for in-depth data analysis required in corporate acceptance or new development projects. The product includes the following modules:
• Measurement System Analysis (establishing measurement system capability)
• Sample Analysis (short-term capability and acceptance of measuring equipment)
• Process Capability Analysis (process qualification for production processes)
• Analysis of Regression / Variance (analysis of cause-and-effect chains)
• Reliability Analysis (reliability based on Weibull distribution)
q-das.de | HexagonMI.com | HEXAGON MANUFACTURING INTELLIGENCE 17
destra®
procella®
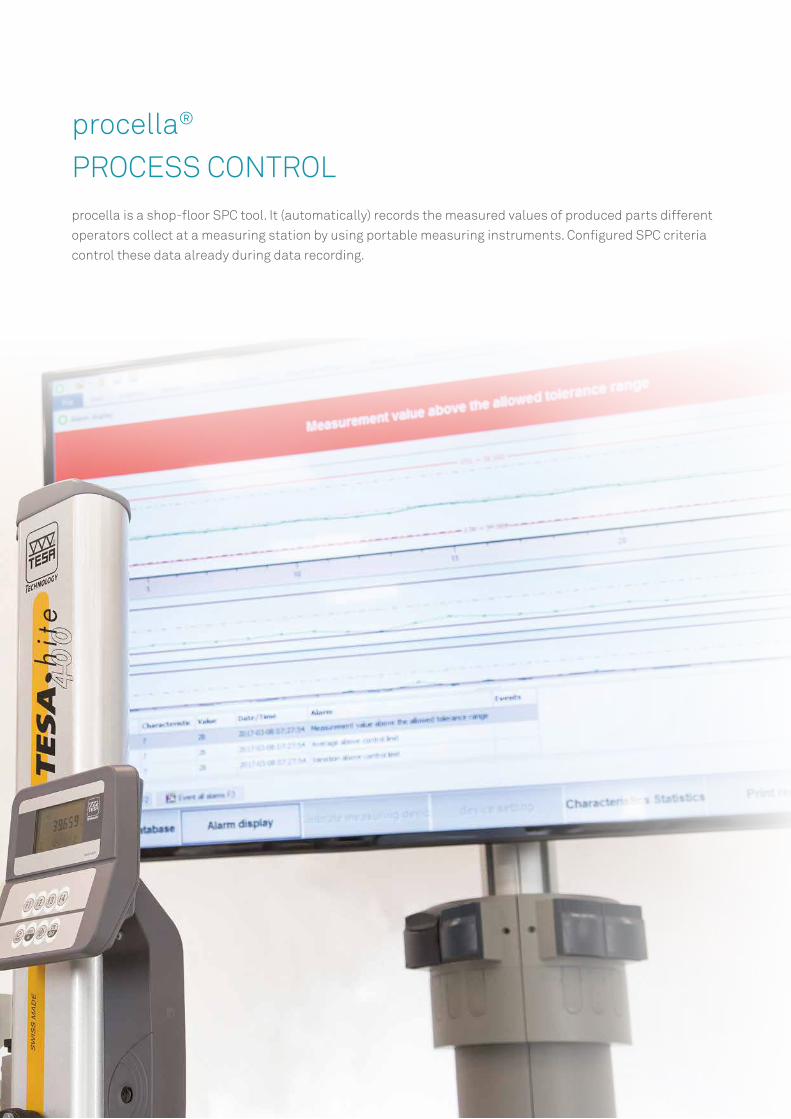
PROCESS CONTROL procella is a shop-floor SPC tool. It (automatically) records the measured values of produced parts different operators collect at a measuring station by using portable measuring instruments. Configured SPC criteria control these data already during data recording.

Test plans and test sequence
Operators first select the test plan of the part to be measured. They open the test plan directly either by choosing it from the list of all test plans applied at the respective measuring station, by applying filter criteria to narrow the list or by using a barcode scanner transferring a unique part ID.
With a test plan selected, procella shows a graphical user interface for an easy recording and evaluation of measurement and test data. The program guides operators through the part inspection task and indicates any deviations from the test sequence. Operators are able to schedule setup measurements and handle incomplete measurements.
Data recording
procella collects measurement and test data manually or transfers them directly from various types of measuring equipment via interface. Measuring equipment is either directly connected to the computer via interface or the equipment transmits data via multiplexer connected to the computer.
q-das.de | HexagonMI.com | HEXAGON MANUFACTURING INTELLIGENCE 19
procella®

User management
Operators usually record test data. Even though this sounds quite easy, this task first requires a careful definition of what an operator is allowed to do and not. This is what the user management of Q-DAS software products does so that operators can only see and use the predefined input screen mask. They are not able to change tolerances or delete input values. The user management defines every piece of information operators can or have to enter, e.g. to display additional data before or during the inspection. Operators do not need any training in procella since administrators clearly define the options and liberties available to them. The application of the software thus becomes self-evident.
Visual design
procella offers more than the “one and only“ default input screen mask. A flexible design is one of the key benefits of procella. The graphics displayed to the operators are defined during the program’s implementation and configuration. These graphics include value charts, summary graphics and even images, CAD drawingss and inspection notes regarding the part or characteristics to be measured. procella visually indicates where and how an operator has to measure the part. Operators may even change the view during a test sequence, e.g. when variable and attribute data are recorded, the software switches automatically to a different view as soon as the type of characteristic changes. Using buttons, operators can also switch views or drawings manually.
HEXAGON MANUFACTURING INTELLIGENCE | HexagonMI.com | q-das.de20

Alarms
procella visualises statistical deviations from process specifications in alarm dialogue boxes. Alarms are e.g. violations of tolerance limits, control limits, violations in quality control charts or trend processes. As soon as an alarm occurs, the operator will be prompted to enter events, causes and measures to identify clusters and record deviations. The application of quality control charts and the observation of control limits in particular maintain process stability.
Input of results
As soon as an alarm occurs, procella prompts the operator to provide events, causes and measures as a mandatory input. A catalogue offers a broad range of entries the operator can quickly choose from. A clear allocation and the frequency of events, measures and causes are part of the analysis. Mandatory input ensures that the operator documents any kind of deviations.
q-das.de | HexagonMI.com | HEXAGON MANUFACTURING INTELLIGENCE 21
procella®

O-QIS® REAL-TIME VISUALISATIONO-QIS is a tool designed to visualise and evaluate test and process data. There are various ways of generating these data. O-QIS offers the perfect solution to the respective task by providing different modules.
• MCA/CMM Reporting for the evaluation and acceptance of individual measurements referring to historical data
• procella for the manual input of test data or the transfer of data from measuring equipment and multiplexers via serial interface
• Monitoring for the visualisation of measurement data and process parameters directly from a programmable logic controller (PLC)
• Alert Manager for nearly real-time visualisation of alarms

procella
procella is part of O-QIS. Please find a detailed description of procella on p. 18.
MCA/CMM Reporting
The MCA/CMM Reporting module of O-QIS is dedicated to evaluating measured values after a part measurement is completed. The module assumes that the measurement system generates a file containing information about the measured part, its characteristics and current measured values after the measurement is completed. Typical applications are measurements of coordinate measuring machines. The measuring program and the measurements offer all required information that can be provided as a Q-DAS file. Many manufacturers of measuring instruments support the Q-DAS AQDEF data format. O-QIS visualises these data directly after their generation and shows them to the operator in configurable summary graphics. The software even includes measured values of previous measurements in the evaluation. Operators immediately detect trends and deviations in the current measurement and decide whether they want to accept or reject the measurement for statistical analysis (e.g. in case of erroneous measurements). They may automatically generate PDF reports or send them as an attachment by email.
q-das.de | HexagonMI.com | HEXAGON MANUFACTURING INTELLIGENCE 23
O-QIS®

Monitoring
A typical application of the Monitoring module is the visualisation of measurement and process data provided by a recording system in short time intervals. The recording system collects and stores the data and provides them cyclically in the AQDEF format. Monitoring accesses these data and visualises measurement information continuously. The software updates the visualisation of the measurement automatically with each measured value it collects and provides a clear overview even for numerous characteristics. Operators focus on their measurement data or parameters and are able to make prompt decisions when deviations occur, e.g. to readjust a machine. The program even visualises several data sources at a single work station simultaneously. The respective tile turns red when the machine shows deviations. Drill-down functionalities make it easy to identify the characteristics or individual measurement causing the deviation. Monitoring displays alarm notes in different colours depending on the violated type of SPC alarm criterion.
Parts of O-QIS are also available as a web application (p. 32).
HEXAGON MANUFACTURING INTELLIGENCE | HexagonMI.com | q-das.de24

Alert Manager
Various statistical alarms might occur during data recording, from tolerance violations to alarms in quality control charts. The different O-QIS modules are dedicated to showing all of them immediately. Visualising these alarms at a central location, the Alert Manager helps users assess the alarm status of single measuring stations even for extensive or spatially separated shop floor areas. The visualisation does not relate to parts but to additional data, e.g. machine.
The example below shows eight coloured tiles, one for each machine. A tile turns red when an alarm occurs. Users immediately see that machine 3 caused a problem. Clicking on this tile, they find the characteristic/s triggering the alarm and a respective alarm note. Selecting the characteristic, they get information about the measured values and even its history causing the alarm.
Users keep track of their production environment and are still able to acknowledge and comment on alarms.
q-das.de | HexagonMI.com | HEXAGON MANUFACTURING INTELLIGENCE 25
O-QIS®

automatisiertes Berichtssystem
M-QIS®
AUTOMATED DATA PROCESSING
Q-DAS statistical software products load data from the database, evaluate them and generate associated reports. M-QIS (Management Quality Information System) automates all these steps.

Automated generation of reportsA loaded data pool forms the basis for statistical evaluations. M-QIS Engine uses the data of selections including e.g. the data about product A recorded the previous week or the last 5 000 measured values of order X.
The next step is to choose the information giving valuable help in decision-making, e.g. a report containing value chart, histogram and process capability indices per characteristic.
Now the user defines the person receiving this information. A department head might require a weekly report for a meeting whereas the machine operator rather needs a report about the production line. This example also shows the next decisive aspect to be defined – the time when the system generates a report. The department head needs it once a week whereas the machine operator shall be able to take corrective action as early as possible, so he needs the report in nearly real-time.
M-QIS Engine transfers all these aspects to the software. Users define the time and the persons receiving a specific report and may even generate reports only in case of need. There will be no need for reports when everything is okay. If, however, machine 4 produces a part whose thickness exceeds specifications or whose process capability index does not meet requirements, the person responsible will promptly receive a message plus an individual report indicating the characteristics causing a problem.
This automatism provides users with reports about evaluation results. Users do not even have to operate the Q-DAS software interactively. The program sends PDF reports as an email attachment or stores them. All production-related departments benefit from statistical calculations and the knowledge acquired.
q-das.de | HexagonMI.com | HEXAGON MANUFACTURING INTELLIGENCE 27
M-QIS®

Long-term analyses based on compressed results
Analysing process statistics over a long period, users face a serious challenge since they often have to process a huge amount of data. M-QIS Engine’s data compression offers the solution. The software calculates statistics cyclically and saves them to the Q-DAS database. For an annual report illustrating a Cpk value and its changes per month, the program only accesses the monthly compressed results and thus reads twelve already calculated results even though they are based on about 50 million individuals. A configurable automatism defines the time when the software stores results and the compression criteria applying to the calculation of results.
Compression criteria are e.g. statistics over a certain period, machine, cavity, order etc. They do not depend on an individual process view.
The automated reporting system of M-QIS Engine is also able to send these reports.
28 HEXAGON MANUFACTURING INTELLIGENCE | HexagonMI.com | q-das.de28

Data archiving
Users rarely load data recorded two or three years ago for continuous process qualification. Yet they are required to comply with and fulfil the legal obligation to retain data. Q-ARC (archiving) optimises and keeps the performance of the database daily in use but still accesses historical data in case of need. The software also transfers data recorded over a defined period automatically from the database to an external storage location. As an example, the current Q-DAS database is supposed to contain nothing but data recorded within one year from the present day. The program always runs an archiving service on the first day of a month. However, the database now contains the data pool of a year and the month. So the service archives the data recorded during the first month included in order that the database contains nothing but the data recorded during the last year. Possible external storage locations for the measurement data of the excluded month are either archive databases or Q-DAS ASCII files. Users are always able to access the data stored in archives and to apply them again in Q-DAS software products.
q-das.de | HexagonMI.com | HEXAGON MANUFACTURING INTELLIGENCE 29
M-QIS®

Q-DAS® WEB SOLUTIONSFLEXIBLE DISPLAY OF RESULTS
We provide web solutions for Q-DAS software products that do not have to be installed on a computer but run on an Internet browser. There is more than just a single web solution since we separate functionalities based on the primary field of application. Their flexible use is one of the major benefits of web solutions since their licence is only locked in use. Q-DAS web products are also provided in all the languages offered by Q-DAS standard products. Users switch the graphical user interface to the language they need.

solara.MP Web
The web component of solara.MP is the perfect choice to perform measurement system analysis tasks. Just as solara.MP, the web application includes MSA studies and the calculation of statistics based on corporate guidelines. Users may look at already conducted studies and navigate interactively through the web interface. They open individuals and summary graphics and show, move or scale them as individual elements.
qs-STAT Web
Similar to the classical qs-STAT software, it focuses on sample analysis functionalities for machine performance studies and the range of functions required for continuous process capability analysis. Users load the data to be analysed from the Q-DAS database by applying filters and selection criteria. They generate and use statistics, graphics and reports interactively in a web environment.
q-das.de | HexagonMI.com | HEXAGON MANUFACTURING INTELLIGENCE 31
Q-DAS® WEB SOLUTIONS

O-QIS Web
O-QIS Web gives priority to data visualisation. The respective measurement information is already available in the Q-DAS database. O-QIS Web visualises and updates it cyclically benefiting from some database functionalities as the example below shows.
A manufacturing process includes five machines. The user has to detect deviations at a facility such as the violation of tolerance limits. O-QIS Web displays the hall plan with these five machines. Next to these machines it shows five traffic lights. These traffic lights access the alarms in the Q-DAS database. As soon as an alarm occurs, the light turns red indicating a problem to users of O-QIS Web. Clicking on this light, users get detailed information at the next website, e.g. about value charts of the part’s characteristics causing the problem, or it just shows the characteristic causing the alarm. Updating the view cyclically, users always load and visualise current measured values from the database.
The configuration of the single levels and the visual design is very flexible to design in O-QIS Web.
32 HEXAGON MANUFACTURING INTELLIGENCE | HexagonMI.com | q-das.de

M-QIS Web
M-QIS Web is the tool of choice for the display of statistics and graphics based on statistical analyses, e.g. compressed information (benchmarks, charts of statistics, etc.). A flexible structure allows for individual configurations based on additional data. However, what does this actually mean? The structure of an analysis reflects reality as closely as possible. As an example, there are three halls, each of these halls accommodates different production lines and each line requires different operations at various stations and applies machines having individual tools. All these levels provide quality information also including the information of lower levels. Users navigate through the displayed graphics top down to identify appropriate measures and room for improvement. The M-QIS Web tool creates and extends the structure of the single websites and generates these sites dynamically according to the defined structure.
q-das.de | HexagonMI.com | HEXAGON MANUFACTURING INTELLIGENCE 33
Q-DAS® WEB SOLUTIONS

3D CAD VIEWERVISUAL SUPPORTA CAD model specifying product requirements is an essential starting point for many quality processes. CAD models form the basis for the creation of measurement routines for measuring instruments or test plans intended for semi-automated or manual measuring stations recording test data. Additionally, it offers users visual support in performing inspection tasks. The integrated reporting system uses the CAD model to illustrate test and evaluation results.

Applying Q-DAS products already including a test plan and recorded measured values, users select characteristics and allocate them to the CAD model.
The parts/characteristics list makes it easy to display single features / characteristics in the CAD model. Selecting respective features /characteristics from the list, users show all characteristics, only characteristics of specific features or individual characteristics in the software.
3D CAD providing the basis for test plansUsers select and import features or features and associated characteristics interactively into the CAD model for test planning purposes in Q-DAS software products. The import supports established CAD formats (*.igs, *.3DXML, *.stl, *.cad, *.cto, *.CATPart, *.Obj). Functionalities like zooming, rotating or bending the model are designed to facilitate the selection.
If required, users add additional information about features or characteristics, such as specification limits, characteristic classes etc. They may select a different view for each characteristic, e.g. parts of the workpiece or the entire workpiece from a different perspective. The software stores the respective view and links it to the associated characteristic.
q-das.de | HexagonMI.com | HEXAGON MANUFACTURING INTELLIGENCE 35
3D CAD VIEWER

Supporting data recording O-QIS and procella are suitable for manual data input but they also record data via serial interface. Approved as tools for real-time visualisation of results and SPC alarm control, they are now even designed to show characteristic-specific views in the CAD model. The combination of these functionalities guides the operatore perfectly through the measuring task. This increases safety and minimises the risk of faulty insertions.
When the measurement data are not recorded by Q-DAS software products but by measuring instruments, e.g. a CMM, the CAD model serves as a programming basis during the creation of the measuring program.
Many measuring instruments already transfer data in the Q-DAS AQDEF data format to Q-DAS products for visualisation and statistical evaluation. Due to an integrated CAD model, Q-DAS software products like O-QIS visualise the measuring instrument’s measurement results in real time. The application requires measurement results and an available CAD model but also a description file allocating the features / characteristics in the CAD model. Most types of measurement software support these files.
Without any description file available for the allocation of features / characteristics, users once have to allocate these features / characteristics in Q-DAS products.
Without any description file available for the allocation of features / characteristics, users once have to allocate these features / characteristics in Q-DAS products.
HEXAGON MANUFACTURING INTELLIGENCE | HexagonMI.com | q-das.de36

Reports including 3D CADThe CAD models serve their purpose in many fields of statistical analysis; they can even be used in reports. Individual and customised reports refer to the respective CAD model. Since the features / characteristics are allocated to the drawing, the report automatically shows the relevant characteristics in the CAD model together with associated evaluation results.
The 3D CAD Viewer provides users with a rich set of features they may use in all Q-DAS software products. Users apply it for test planning or data recording purposes but it also facilitates evaluation and reporting.
q-das.de | HexagonMI.com | HEXAGON MANUFACTURING INTELLIGENCE 37
3D CAD VIEWER

FORM DESIGNERREPORT AND MASK DESIGNERAll Q-DAS products provide users with report templates. These are best practice recommended by Q-DAS. Reports contain test plan information, additional texts, calculated statistics and graphics. After loading a data set, the software shows the respective contents in the selected report template.

Report configurationUsers needing to adapt report templates use the Form designer to modify them or to create individual templates.
The Form Designer creates report templates for all Q-DAS products. Reports are able to show any kind of output point available in Q-DAS software products, e.g. texts, statistics, formulas and graphics. They also integrate
jpg and BMP graphics or CAD models directly and link them to characteristics information. The recipient of a report easily understands how statistics and graphics relate to the respective product. Users position output points in a report template by using drag & drop functionalities.
The Form Designer is often applied together with M-QIS Engine in order to create individual reports for different recipients. Users select and apply the created report templates in Q-DAS products.
q-das.de | HexagonMI.com | HEXAGON MANUFACTURING INTELLIGENCE 39
FORMDESIGNER

INTERFACESThere are different ways of transferring measurement data to Q-DAS software. Most frequently, data are transferred from portable measuring instruments or multiplexers via serial interface or via data interface in the Q-DAS AQDEF data format. Data available in a different format are transferred to the Q-DAS software by means of a converter. Due to interfaces to ERP, CAQ and MES, Q-DAS software can be implemented in an existing IT landscape.
AQDEF®: Advanced Quality Data Exchange Format
The AQDEF (Advanced Quality Data Exchange Format) data format is specified for the standardised exchange of data between measuring equipment and Q-DAS software products. The AQDEF industrial work group defines the contents of this data format and always considers basic customer requirements. Its members thus guarantee that the data format offers a representative scope and a uniform interpretation
and application of key fields.
The result the work group provides is a standardised catalogue of data fields that are relevant to many users. This catalogue lays the foundation for a quick and clear evaluation based on the acquired data in order to reach smart and reliable decisions without any time-consuming and error-prone data conversion.
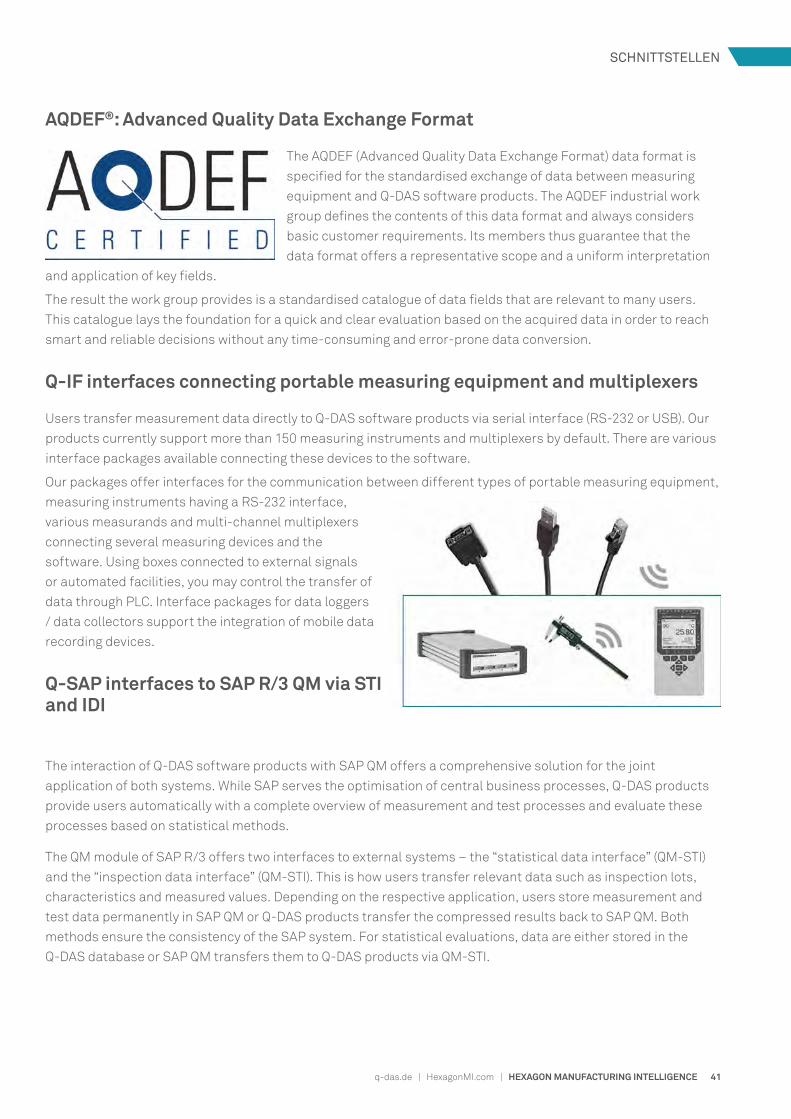
Q-IF interfaces connecting portable measuring equipment and multiplexers
Users transfer measurement data directly to Q-DAS software products via serial interface (RS-232 or USB). Our products currently support more than 150 measuring instruments and multiplexers by default. There are various interface packages available connecting these devices to the software.
Our packages offer interfaces for the communication between different types of portable measuring equipment, measuring instruments having a RS-232 interface, various measurands and multi-channel multiplexers connecting several measuring devices and the software. Using boxes connected to external signals or automated facilities, you may control the transfer of data through PLC. Interface packages for data loggers / data collectors support the integration of mobile data recording devices.
Q-SAP interfaces to SAP R/3 QM via STI and IDI
The interaction of Q-DAS software products with SAP QM offers a comprehensive solution for the joint application of both systems. While SAP serves the optimisation of central business processes, Q-DAS products provide users automatically with a complete overview of measurement and test processes and evaluate these processes based on statistical methods.
The QM module of SAP R/3 offers two interfaces to external systems – the “statistical data interface” (QM-STI) and the “inspection data interface” (QM-STI). This is how users transfer relevant data such as inspection lots, characteristics and measured values. Depending on the respective application, users store measurement and test data permanently in SAP QM or Q-DAS products transfer the compressed results back to SAP QM. Both methods ensure the consistency of the SAP system. For statistical evaluations, data are either stored in the Q-DAS database or SAP QM transfers them to Q-DAS products via QM-STI.
q-das.de | HexagonMI.com | HEXAGON MANUFACTURING INTELLIGENCE 41
SCHNITTSTELLEN

Q-DAS CAMERA® CONCEPTThe Q-DAS CAMERA Concept implements performance measurement systems efficiently for quality assessment in industrial production. It provides innovative software tools and procedures designing a well-structured and dynamic performance measurement system. Users can perform process analyses quickly in all phases of quality data flow. Task-related software packages offer practical solutions.
The Q-DAS CAMERA Concept does not only consist of Q-DAS software products but it is closely linked to a range of services supporting companies in introducing, implementing and maintaining this system. We advise you on any statistical issue from the definition and calculation of statistics through to the configuration of an evaluation strategy to process optimisation.

Phases of the Q-DAS CAMERA ConceptThe Q-DAS CAMERA Concept consists of different phases in the context of (automated) data recording. The collecting phase integrates systems processing quality-relevant data based on the Q-DAS AQDEF data format or via interfaces to measuring instruments, PLC controls or superior systems such as ERP, CAQ, MES etc. The software visualises recorded data in real time and controls them statistically in assessing. It immediately informs users as soon as any SPC alarm criterion is violated.
Central data storage and maintenance are key aspects for the management of data in the managing phase. The data are subject to automated statistical evaluations according to defined specifications (standard, corporate and association guidelines) in evaluating. These specified evaluation strategies form the basis for the reproducibility of results and the supply of information to the planning and management level.
The reporting phase of the Q-DAS CAMERA Concept documents these evaluation results. Q-DAS software products show results in manually generated result reports, automatically sent reports, dashboards or at websites etc. The archiving phase mainly focuses on applying available mechanisms to make huge amounts of data permanently accessible without any loss of information or performance.
Benefits of the Q-DAS CAMERA Concept• Standardised interfaces to various systems
• Comprehensive analysis through integration of quality and process data
• Validated statistical evaluation
• Automated evaluation and user-specific display of results
• Modular system
• Standardised implementation processes and extensive implementation experience
• International network for global support on site
q-das.de | HexagonMI.com | HEXAGON MANUFACTURING INTELLIGENCE 43
Q-DAS CAMERA® CONEPT

Q-DAS® SERVICES Our broad range of services supports customers in applying Q-DAS software in an optimal way.

Project monitoringAs a qualified and experienced team, the Q-DAS system integration centre supports the introduction of Q-DAS software products and the implementation of the Q-DAS CAMERA Concept. We assist you in all phases of the project, from design and specification to the maintenance of the running system.
WorkshopsWe discuss the respective details with respect to installation, configuration and initial operation of Q-DAS software in the course of a workshop. The first step is to define and analyse the current situation in your company. The understanding of process structures and operations offers important information build a system fulfilling your individual requirements.
Installation and configurationThe practical implementation of the Q-DAS CAMERA Concept starts with the implementation. We install the respective software components according to your system specification and configure and adjust them to your field of application.
UpgradesDo you want to upgrade your software version to benefit from an advanced or extended range of functions? Together we define an individual upgrade strategy, determine requirements and discuss the system configuration.
Product training coursesWe recommend you to conduct an individual training programme meeting the demands of your company already during or after the installation. Depending on the topics concerned, these practical seminars are provided by experienced TEQ trainers of Q-DAS GmbH. Please find our comprehensive training programme at teq.de.
System maintenance and optimisationWe support you in maintaining the installed system even after a successful implementation. Regular maintenance ensures long-term system stability. Maintenance includes the optimisation of data management and the definition of archiving strategies to improve system performance even when you process a huge amount of data.
Web supportWe perform remote maintenance and provide the option of desktop sharing for a quick and easy support regardless of location. Depending on the question you have, we access your system via Internet to save costs and time.
System documentationComprehensive system installations require an individual technical program documentation helping users operate and maintain the system.
q-das.de | HexagonMI.com | HEXAGON MANUFACTURING INTELLIGENCE 45
Q-DAS® SERVICES

CHINAQ-DAS© Software Technology Email: [email protected] www.q-das.cn
CZECH REPUBLICQ-DAS© spol. s.r.o. Email: [email protected] www.q-das.cz
FRANCEQ-DAS© France SARL Email: [email protected] www.q-das.fr
GERMANYQ-DAS© GmbH Eisleber Straße 2 69469 Weinheim T: +49 6201 3941-0 F: +49 6201 3941-224 Hotline: +49 6201 3941-14 Email: [email protected] www.q-das.de
INDIAQ-DAS© Software Pvt. Ltd. Email: [email protected] www.q-das.in
ITALYQ-DAS© s.r.l. Email: [email protected] www.q-das.it
KOREAQ-DAS© Ltd. Email: [email protected] www.q-das.com
USAQ-DAS© Incorporated Email: [email protected] www.q-das.com
CONTACT US
You are also welcome to contact any divisions or branches of Hexagon Manufacturing Intelligence.
Please find contact details at HexagonMI.com.

WE ARE PLEASED TO SUPPORT YOU. PROFESSIONALLY.
q-das.de | HexagonMI.com | HEXAGON MANUFACTURING INTELLIGENCE 47
CONTACT

© 2017 Hexagon AB and / or its subsidiaries and affiliates. All rights reserved. This document is accurate as of its publication date. Information is subject to change without notice.
Hexagon Manufacturing Intelligence helps industrial manufacturers develop the disruptive technologies of today and the life-changing products of tomorrow. As a leading metrology and manufacturing solution specialist, our expertise in sensing, thinking and acting – the collection, analysis and active use of measurement data – gives our customers the confidence to increase production speed and accelerate productivity while enhancing product quality.
Through a network of local service centres, production facilities and commercial operations across five continents, we are shaping smart change in manufacturing to build a world where quality drives productivity. For more information, visit HexagonMI.com.
Hexagon Manufacturing Intelligence is part of Hexagon (Nasdaq Stockholm: HEXA B; hexagon.com), a leading global provider of information technologies that drive quality and productivity across geospatial and industrial enterprise applications.
COORDINATE MEASURING MACHINES
3D LASER SCANNING
SENSORS
PORTABLE MEASURING ARMS
SERVICES
LASER TRACKERS & STATIONS
MULTISENSOR & OPTICAL SYSTEMS
WHITE LIGHT SCANNERS
METROLOGY SOFTWARE SOLUTIONS
CAD / CAM
STATISTICAL PROCESS CONTROL
AUTOMATED APPLICATIONS
MICROMETERS, CALIPERS AND GAUGES
DESIGN AND COSTING SOFTWARE
Q-DAS software sets standards for quality assurance in industrial production. 150 000 users all over the world trust in Q-DAS and successfully apply its software as well as associated training and consulting services to raise product and process quality. More than 8 000 customers from various industries have already chosen Q-DAS solutions, and are profitably harnessing the full potential of correct and reliable statistical evaluations. Q-DAS software products record, visualise and evaluate data in 55 countries to increase efficiency.
The broad Q-DAS catalogue of hands-on seminars delivers essential methodological skills of statistical process control, production metrology and quality assurance. This is complemented by general and company-specific training in any available Q-DAS software product. These support our users in focusing on goals while fulfilling their tasks.
For more information, visit q-das.de/en.


![Quasi quantum group covariant q-oscillators · These truncated quantum group algebras are examples of weak quasi quantum group algebras [2]. For primitive pth roots q, q = we consider](https://img.pdfslide.net/doc/110x75/5f162274aa808c1b5221f1e8/quasi-quantum-group-covariant-q-oscillators-these-truncated-quantum-group-algebras.jpg)


![Statistical Properties of Cross-Correlation in theKorean ... · arXiv:1010.2048v1 [q-fin.ST] 11 Oct 2010 Statistical Properties of Cross-Correlation in theKorean Stock Market Gabjin](https://img.pdfslide.net/doc/110x75/5bcc39b209d3f232618ddc13/statistical-properties-of-cross-correlation-in-thekorean-arxiv10102048v1.jpg)


![and statistical arbitrage arXiv:0709.3884v1 [q-fin.ST] …0709.3884v1 [q-fin.ST] 25 Sep 2007 Flexible least squares for temporal data mining and statistical arbitrage Giovanni Montana∗,](https://img.pdfslide.net/doc/110x75/5ae0952e7f8b9a5a668dc2a3/and-statistical-arbitrage-arxiv07093884v1-q-finst-07093884v1-q-finst.jpg)