Embed Size (px)
Citation preview

Health Services October I 2,201 o L O S A N G E L E S C O U N T Y
Los Angeles County Board of Supervisors
Gloria Molina First District
Mark Ridley-Thomas Second District
Zev Yaroslavsky Third District
Don Knabe Fourth District
Michael D. Antonovich Fifth District
John F. Schunhoff, Ph.D. Interim Director
Gail V. Anderson, Jr., M.D. Interim Chief Medical Officer
31 3 N. Figueroa Street, Suite 91 2 Los Angeles, CA 9001 2
Tel: (21 3) 240-81 01 F a : (21 3) 481 -0503
TO:
FROM:
SUBJECT:
Each Supervisor
John F. Schunhoff, Ph.D. q- lnterim Director
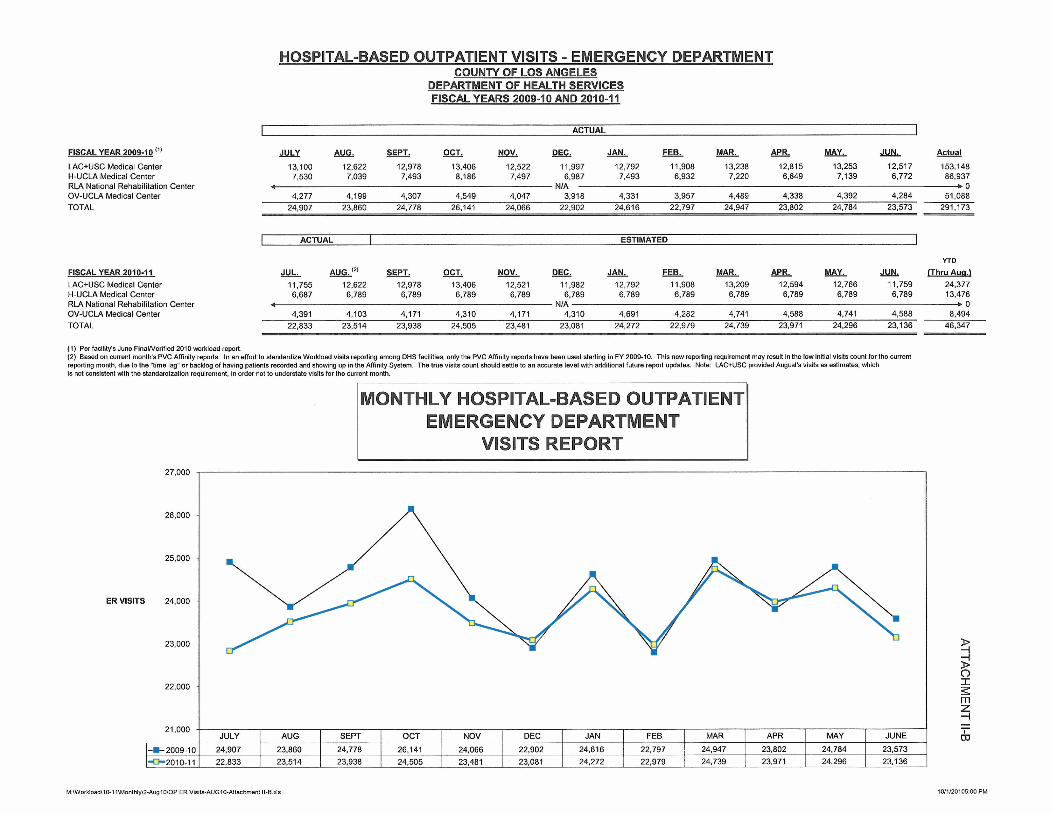
AVERAGE DAILY CENSUS, HOSPITAL-BASED OUTPATIENT VISITS (EMERGENCY DEPARTMENT), AND HOSPITAL-BASED OUTPATIENT VISITS (AMBULATORY CARE) MONTHLY REPORT - AUGUST 31,2010.
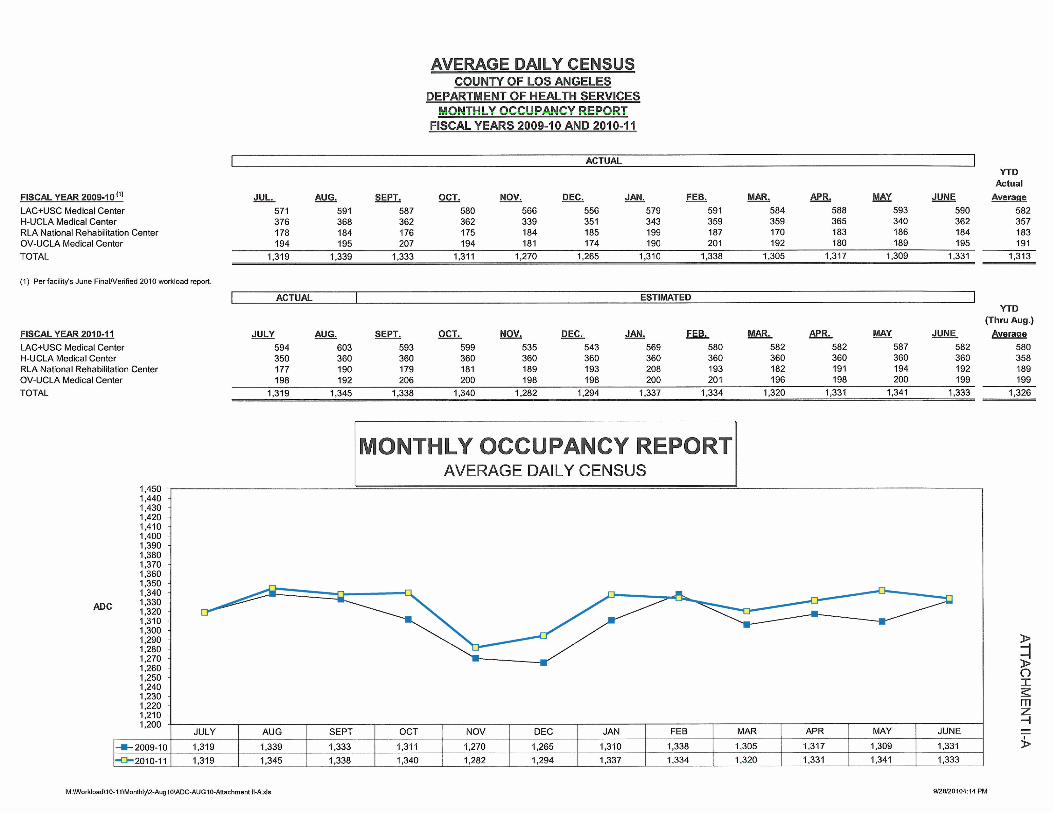
As requested, this is to provide you with a report of the Department of Health Services' Average Daily Census (ADC), Hospital-Based Outpatient Emergency Room (ER) visits, and Hospital-Based Outpatient Ambulatory Care (Amb Care) visits for the month ending August 31, 2010.
Each detailed report for ADC, ER, and Amb Care is provided in two attachments. Attachment I reflects Year-to-Date (YTD), Month-to-Date (MTD), and Full-Year- Estimated (FYE) data, plus comparative budget and prior year information. Attachment II displays: (a) a 12-month history, by hospital, for last fiscal year, (b) an actuallestimate table for the current fiscal year, by hospital, and (c) a graph that provides a quick snapshot view of our overall trends.
The August MTD actual census of 1,345 is 11 5 less than the August 201 0 census budget of 1,460, and 6 more than the actual ADC for August 2009
To improve health of 1,339. We will continue to closely monitor hospital census and its effect on financial performance of our facilities.
through leadership,
service and education. If you have questions or need additional information, please let me know.
Attachments
c: Chief Executive Office County Counsel Executive Off ice, Board of Supervisors

LAC+USC MEDICAL CENTER
H-UCLA MIEDICAL CENTER
RLA NATIONAL REHAB. CENTER
OV-UCLA MEDICAL CENTER
TOTAL
AVERAGE DAILY CENSUS COUNTY OF LOS ANGELES
DEPARTMENT OF HEALTH SERVICES MONTHLY OCCUPANCY REPORT
FOR THE MONTH ENDING AUGUST 31, 2010
(1 (2) (3) (4) (5) (6) FY 10-1 1
FY 10-1 1 YTD AUWlO MTD FY 10-1 1 FY 09-1 0 BUDGET BUDGET BUDGET ACTUAL W E ) ACTUAL
NOTES:
(1) Per the Fiscal Year (FY) 2010-11 Adopted Budget.
(2) YTD budget developed based on the census level necessary to achieve each facility's FY 2010-11 Budget. (3) Monthly budget developed for the report month based on the census level necessary to achieve each facility's FY 2010-11 Budget.
(4) The aggregate number of actual census days for the report month, averaged on a per-day basis.
(5) Facility's full-year-estimate (FYE) for census is developed based on the facility's operating plan. (6) Actual average daily census averaged for the 12-month period of FY 2009-10 based on facility's June FinaWerified 2010 workload report.
AVERAGE DAILY CENSUS COUNTY OF LOS ANGELES
DEPARTMENT OF HEALTH SERVICES
FISCAL YEAR 2009-10
LAC+USC Medical Center H-UCLA Medical Center RLA National Rehabilitation Center OV-UCLA Medical Center TOTAL
MONTHLY OCCUPANCY REPORT FISCAL YEARS 2009-1 0 AND 201 0-1 1
ACTUAL I YTD
Actual
JUL. - AUG. - SEPT. - OCT. - NOV. - DEC. - JAN. - FEB. - MAR. APR. - MAY - JUNE Averaae
571 591 587 580 566 556 579 591 584 588 593 590 582 376 368 362 362 339 351 343 359 359 365 340 362 357
(1) Per facility's June FinalNenRed 2010 workload report.
FISCAL YEAR 2010-1 1 LAC+USC Medical Center H-UCLA Medical Center RLA National Rehabilitation Center OV-UCLA Medical Center TOTAL
ACTUAL YTD
(Thm Aug.)
JULY AUG. - SEPT. OCT. - NOV. DEC. - JAN. FEB. - MAR. - APR. - MAY - JUNE Averaae
594 603 593 599 535 543 569 580 582 582 587 582 580 350 360 360 360 360 360 360 360 360 360 360 360 358 177 190 179 181 189 193 208 193 182 191 194 192 189 198 192 206 200 198 198 200 201 196 198 200 199 199
1,319 1,345 1,338 1,340 1,282 1,294 1,337 1,334 1,320 1,331 1,341 1,333 1,326 -
ESTIMATED
MONTHLY OCCUPANCY REPORTI AVERAGE DAILY CENSUS
1,450 1,440 - 1,430 - 1,420 - 1,410 - 1,400 - 1,390 - 1,380 - 1,370 - 1,360 - 1,350 - 1.340 - 1,330 - 1,320 - 1,310 - 1,300 - 1,290 - 1,280 - 1,270 - 1,260 - 1.250 -
1;200 -
f 2009-10
C 2 0 1 0 - 1 1
JUNE
1,331
1,333
APR
1,317
1,331
JULY
1,319
1,319
MAY
1,309
1,341
FEE
1,338
1,334
MAR
1,305
1,320
AUG
1,339
1,345
OCT
1,311
1,340
SEPT
1,333
1,338
NOV
1,270
1,282
DEC
1,265
1,294
JAN
1,310
1,337

HOSPITAL-BASED OUTPATIENT VISITS - EMERGENCY DEPARTMENT COUNTY OF LOS ANGELES
DEPARTMENT OF HEALTH SERVICES FOR THE MONTH ENDING AUGST 31, 2010
(1) (2) (3) (4) (5) (6) FY 10-1 1
FY 10-1 1 YTD AUG110 MTD FY 10-11 FY 09-1 0 BUDGET BUDGET BUDGET ACTUAL W E ) ACTUAL
LAC+USC MEDICAL CENTER
H-UCLA MEDICAL CENTER
RLA NATIONAL REHAB. CENTER
OV-UCLA MEDICAL CENTER
TOTAL
NOTES:
(1) Per the Fiscal Year (FY) 2010-11 Adopted Budget.
(2) YTD budget developed based on the number of Visits necessary to achieve each facility's FY 2010-11 Budget.
(3) Monthly budget developed for the report month based on the number of Visits necessary to achieve each facility's FY 2010-11 Budget.
(4) The aggregate number of actual Visits for the report month.
(5) Facility's full-year-estimate (FYE) for census is developed based on the facility's operating plan. (6) Actual average daily census averaged for the 12-month period of FY 2009-10 based on facility's June FinalNerified 2010 workload report.
FISCAL YEAR 200911Q(~)
LACtUSC Medical Center H-UCLA Medical Center RLA National Rehabilitation Center OV-UCLA Medical Center TOTAL
FISCAL YEAR 2010-1 1 LAC+USC Medical Center H-UCLA Medical Center RLA National Rehabilitation Center OV-UCLA Medical Center TOTAL
HOSPITAL-BASED OUTPATIENT VlSlTS - EMERGENCY DEPARTMENT COUNTY OF LOS ANGELES
DEPARTMENT OF HEALTH SERVICES FISCAL YEARS 2009-10 AND 2010-11
4!&Y AUG. SEPT, - NOV. - DEC. - JAN. - FEB. - MAR. Am - MAY. - JUN. 13,100 12.622 12,978 13,406 12,522 11.997 12,792 11,908 13.238 12.815 13.253 12.517 153,148 7,530 7,039 7,493 8,186 7,497 6.987 7,493 6,932 7.220 6.649 7,139 6.772 86.937
4 NIA .O
I ACTUAL I ESTIMATED
YTD
L &(" SEPT. - OCT. NOV. - DEC. - JAN. - FEB. MAR. APR. - MAY. - JUN. IThru Aua.)
11,755 12,622 12,978 13,406 12,521 11.982 12,792 11,908 13,209 12,594 12.766 11,759 24.377 6,687 6,789 6,789 6,789 6,789 6.789 6.789 6.789 6,789 6,789 6.789 6,789 13.476
4 NIA .O 4.391 4,103 4,171 4,310 4,171 4.310 4.691 4.282 4,741 4,588 4.741 4,588 8.494
22.833 23,514 23,938 24,505 23,481 23.081 24.272 22.979 24,739 23,971 24.296 23,136 46,347 - P
(1) Per fadliiy's June FinaiNenfiad 2010 wrkload report. (2) Based on current monthk W C Affinity repatkt In an effolt to standardize Workload visits reporting among DHS facilities, only the PVC Affinity reporls have been used starting in FY 200810. This new reporting requirement may result in the low initial visits munt for the current reporting month, due to the 'time lag" or backlog of having patients remrded and showing up in the Affinity System. The true visits munt should settle to an accurate level with additional future report updates. Note: LAC+USC provided August's visits as estimates. Which is not mnsialent with the standardization requirement, in order not to understatevisitsfor the current month.
ER VlSlTS 24.000
MONTHLY HOSPITAL-BASED OUTPATIENT EMERGENCY DEPARTMENT
VlSlTS REPORT
JULY
24.907
22.833
SEPT
24,778 23,938
AUG
23.860 23.514
OCT
26,141
24,505
JAN
24.616 24.272
NOV
24.066
23.481
FEB
22.797
22.979
DEC
22,902
23,081
MAR
24,947
24,739
APR
23,802
23,971
MAY
24,784 24,296
JUNE
23.573 23.136

HOSPITAL-BASED OUTPATIENT VISITS - AMBULATORY CARE COUNTY OF LOS ANGELES
DEPARTMENT OF HEALTH SERVICES FOR THE MONTH ENDING AUGUST 31, 2010
(1 (2) (3) (4) (5) (6) FY 10-1 1
FY 10-1 1 YTD AUWlO MTD FY 10-1 1 FY 09-1 0 BUDGET BUDGET BUDGET ACTUAL (PIE) ACTUAL
LAC+USC MEDICAL CENTER
H-UCLA MEDICAL CENTER
RLA NATIONAL REHAB. CENTER
OV-UCLA MEDICAL CENTER
TOTAL
NOTES:
(1) Per the Fiscal Year (FY) 201 0-1 1 Adopted Budget.
(2) YTD budget developed based on the number of Visits necessary to achieve each facility's FY 2010-1 1 Budget.
(3) Monthly budget developed for the report month based on the number of Visits necessary to achieve each facility's FY 2010-11 Budget. (4) The aggregate number of actual Visits for the report month.
(5) Facility's full-year-estimate (FYE) for census is developed based on the facility's operating plan. (6) Actual average daily census averaged for the 12-month period of FY 2009-10 based on facility's June FinaWerified 2010 workload report.

FISCAL YEAR 2009-lo("
LAC+USC Medical Center H-UCLA Medical Center RLA National Rehabilitation Center OV-UCLA Medical Center TOTAL
FISCAL YEAR 2010-11 LAC+USC Medical Center H-UCLA Medical Center RLA National Rehabilitation Center OV-UCLA Medical Center TOTAL
HOSPITAL-BASED OUTPATIENT VlSlTS - AMBULATORY CARE COUNTY OF LOS ANGELES
DEPARTMENT OF HEALTH SERVICES FISCAL YEARS 2009-10 AND 2010-11
ACTUAL I JUL. - AUG. - SEPT. Q!z - NOV. - FEB. MAR. APR. - MAY JUNE Actual
44,065 42,711 43,827 43,958 38.691 41,471 39.663 40,801 48.321 45.775 43,601 45,770 518,654 29,270 27,801 28,249 28,684 25,457 27,553 25.338 26,760 31.351 29.001 26,332 30,771 336,567 6.478 6,548 6,682 6,353 5,688 6,222 6.367 5,797 7,555 6.722 5,969 6.637 77.018
18,879 17,937 18,408 18,295 16,509 17,527 16.593 16,717 19,658 18.868 17,096 18.700 215.187 98,692 94,997 97.166 97.290 86.345 92.773 87.961 90.075 106,885 100.366 92,998 104,878 1,147.426 -
ACTUAL I ESTIMATED 1 M D
JUL. - - AUG. '" SEPT. s!!a - NOV. - JAN. - FEB. - MAR. - MAY JUN. f T h ~ A u a . 1 42,616 44,289 43,783 43.885 38,637 41,458 39.572 40,714 48.142 45,537 42.896 44,797 86,905 28.482 28,995 28,995 28.995 28,995 28,995 28.995 28,995 28,995 28.995 28.995 28.995 57.477 5,737 5,508 6.682 6.353 5.688 6.222 6.367 5,797 7,555 6.722 5,969 6,637 11.245
17,846 18,551 19,253 19,896 19.253 19.896 19,895 19,470 21,556 20.860 21,556 20,860 36.397 -7,343 9 8 . 7 1 3 1 2 9 92,573 96.571 9 4 , 8 2 9 1 1 4 99,416 101,289 3 0 2 4
(1) Per facilitfs June FinalNeritied 2010 wrkload report. (2) Based on current month's PVC Affinity reports. In an effort to standardize Workload vi* reporting among Facilities, only the PVC Affinity reports have been used starting in FY 2WQ-10. This new rerwrtina requirement may result in the low initial visits munt for the current . - . reporting month, due to the rime lag" or backlog of having patients remrded and shDwing up in the Affinity System. The true vlsits count should d l e t o an acwrate level with additional future report updates. Note: LAC+USC provided Augud'svisits as edimates, which is not mnsistent with Ule slandardiiion requirement, in order not to understate visits for the current month.
AMBULATORY CARE VlSlTS REPORT
1 10,000
100,000 -
AMB CARb 000 VlSlTS '
80.000 -
C 2008-09 C2009-10
JULY
98,692 94,681
AUG
94.997 97.343
SEPT
97,166 98,713
OCT 97.290 99,129
NOV
86.345 92.573
DEC
92.773 96.571
JAN
87.961 94,829
FEB
90,075 94,976
MAR
106.885 106.248
APR
100,366 102,114
MAY
92,998 99,416
JUNE
101,878 101,289