Embed Size (px)
Citation preview

4. Environmental Setting and Impacts
Q. MINERAL AND ENERGY RESOURCES
Section 4.Q, Mineral and Energy Resources, analyzes the effects of the Proposed Project related to mineral and energy resources. The Environmental Setting discussion describes existing conditions at the project site in regard to mineral and energy resources. The impacts analysis identifies impacts related to minerals and energy resources associated with development of the Proposed Project and discusses the changes in demand for energy that would occur with implementation of the Proposed Project. Cumulative effects of the Proposed Project in combination with past, present, and reasonably foreseeable future projects are also discussed.
Two additional sections in Chapter 4, Environmental Setting and Impacts, address related issues. The relationship between energy consumption and greenhouse gas emissions is discussed in Section 4.H, Greenhouse Gases. Water demand and water supply is discussed in Section 4.K, Utilities and Service Systems.
Data used in this section include information obtained from the Port of San Francisco (Port), the California Energy Commission (CEC), and other government agencies.
ENVIRONMENTAL SETTING
MINERAL RESOURCES
In accordance with the Surface Mining and Reclamation Act of 1975, the California Department of Conservation, Division of Mines and Geology (CDMG) has mapped non-fuel mineral resources of the State to show where economically significant mineral deposits are either present or likely to occur, based on the best available scientific data. These resources have been mapped using the California Mineral Land Classification System, which uses the following four Mineral Resource Zones (MRZs):
• MRZ-1: Areas where adequate information indicates that no significant mineral deposits are present, or where it is judged that little likelihood exists for their presence;
• MRZ-2: Areas where adequate information indicates that significant mineral deposits are present, or where it is judged that a high likelihood exists for their presence;
• MRZ-3: Areas containing mineral deposits, the significance of which cannot be evaluated; and
• MRZ-4: Areas where available information is inadequate for assignment to any other zone.
December 21, 2016 Pier 70 Mixed-Use District Project Case No. 2014-001272ENV 4.Q.1 Draft EIR
4. Environmental Setting and Impacts Q. Mineral and Energy Resources
All land in the City and County of San Francisco, including the project site, is designated MRZ-4.1 Thus, the site is not a designated area of significant mineral deposits. There are no mining activities on the project site, and no mining activities are known to have occurred there.
ENERGY
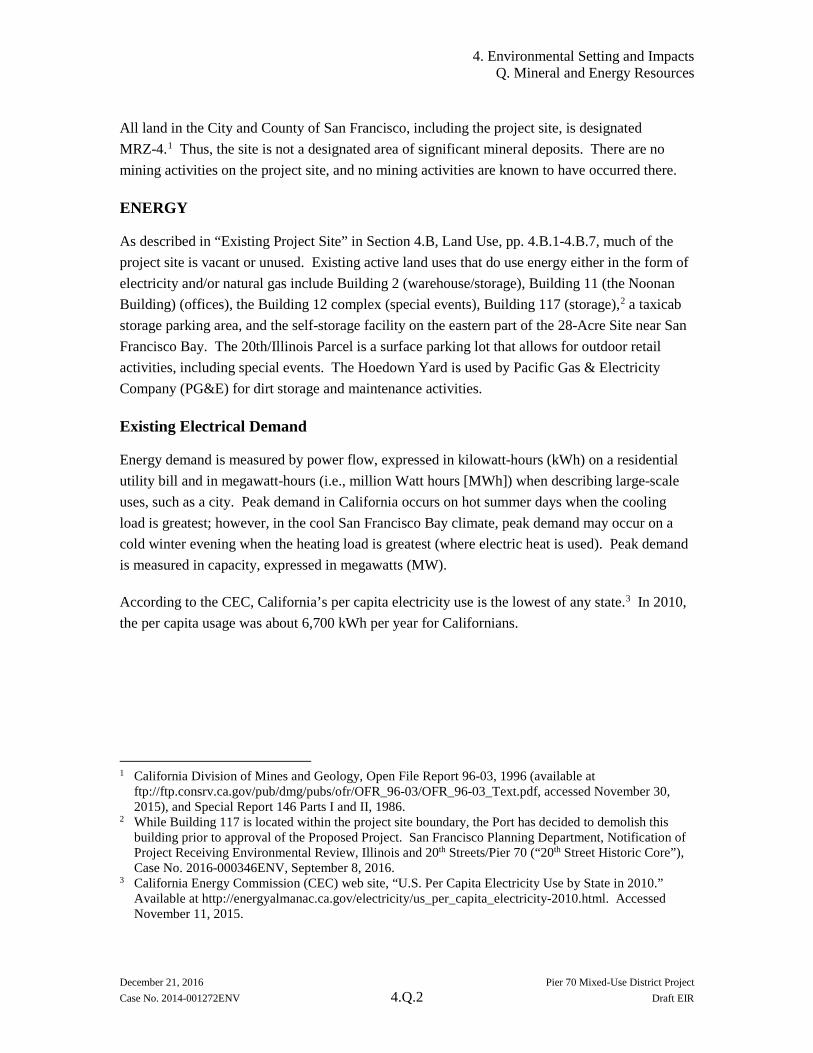
As described in “Existing Project Site” in Section 4.B, Land Use, pp. 4.B.1-4.B.7, much of the project site is vacant or unused. Existing active land uses that do use energy either in the form of electricity and/or natural gas include Building 2 (warehouse/storage), Building 11 (the Noonan Building) (offices), the Building 12 complex (special events), Building 117 (storage),2 a taxicab storage parking area, and the self-storage facility on the eastern part of the 28-Acre Site near San Francisco Bay. The 20th/Illinois Parcel is a surface parking lot that allows for outdoor retail activities, including special events. The Hoedown Yard is used by Pacific Gas & Electricity Company (PG&E) for dirt storage and maintenance activities.
Existing Electrical Demand
Energy demand is measured by power flow, expressed in kilowatt-hours (kWh) on a residential utility bill and in megawatt-hours (i.e., million Watt hours [MWh]) when describing large-scale uses, such as a city. Peak demand in California occurs on hot summer days when the cooling load is greatest; however, in the cool San Francisco Bay climate, peak demand may occur on a cold winter evening when the heating load is greatest (where electric heat is used). Peak demand is measured in capacity, expressed in megawatts (MW).
According to the CEC, California’s per capita electricity use is the lowest of any state.3 In 2010, the per capita usage was about 6,700 kWh per year for Californians.
1 California Division of Mines and Geology, Open File Report 96-03, 1996 (available at ftp://ftp.consrv.ca.gov/pub/dmg/pubs/ofr/OFR_96-03/OFR_96-03_Text.pdf, accessed November 30, 2015), and Special Report 146 Parts I and II, 1986.
2 While Building 117 is located within the project site boundary, the Port has decided to demolish this building prior to approval of the Proposed Project. San Francisco Planning Department, Notification of Project Receiving Environmental Review, Illinois and 20th Streets/Pier 70 (“20th Street Historic Core”), Case No. 2016-000346ENV, September 8, 2016.
3 California Energy Commission (CEC) web site, “U.S. Per Capita Electricity Use by State in 2010.” Available at http://energyalmanac.ca.gov/electricity/us_per_capita_electricity-2010.html. Accessed November 11, 2015.
December 21, 2016 Pier 70 Mixed-Use District Project Case No. 2014-001272ENV 4.Q.2 Draft EIR

4. Environmental Setting and Impacts Q. Mineral and Energy Resources
Existing per capita electricity use in the zip code containing Pier 70 and its vicinity was estimated as 1,778 to 2,112 kWh/year in 2010.4 For comparison, the range of per capita electricity use in San Francisco in 2010 was 1,302 to 3,740 kWh/year.
The existing electric energy demand at the project site is approximately 344 MWh per year.5 The estimated average monthly electrical usage is 29 MWh per month. The estimated existing peak electrical-capacity demand (MW or kW) for the project site is not available.
Existing Electrical Supply
According to CEC data, 68 percent of California’s electricity supply is generated in-State, while about 12 percent comes from the Northwest and 20 percent from the Southwest.6 In 2014, the primary resources used to generate California’s electricity were approximately 45 percent natural gas, 20 percent renewables (wind, solar, etc.), 9 percent nuclear, 6 percent coal, 5 percent large hydroelectric, and 15 percent from unspecified sources.7
San Francisco receives most (over 75 percent) of its electricity from PG&E. PG&E and SFPUC Power supply electricity to the project site and its other customers in San Francisco from a variety of renewable and non-renewable sources both within and outside of the State. In 2015, PG&E’s resource mix was approximately 25 percent natural gas, 23 percent nuclear, 6 percent large hydroelectric, 30 percent renewables, and 17 percent unspecified sources.8 PG&E’s renewable electricity procurement was 23.8 percent of its retail sales for 2013 and is anticipated to be 31.3 percent by 2020.9
4 Sustainable Communities, “Residential Per Capita Electricity Use (2010)” (web page), available at http://www.sustainablecommunitiesindex.org/img/indicators/pdf/Residential_Electricity_Use.pdf. Accessed November 19, 2015. Per capita electricity use for zip code 94107, which includes the project site. Source data from PG&E and complied by the City and County of San Francisco, Department of Public Health, Environmental Health Section. Note: Per capita energy data are often dependent upon U.S. Census data (census taken each decade and intermittent, e.g., a 5-year census update estimates).
5 Port of San Francisco, “Pier 70 Master Meter # 57718R,” estimated based on October 2013 through October 2014 electrical consumption.
6 CEC, Energy Almanac, Energy Almanac, “Total Electricity System Power.” Available at http://energyalmanac.ca.gov/electricity/total_system_power.html. Accessed March 11, 2016.
7 Ibid. 8 Pacific Gas & Electric Co., “Delivering Low-Emission Energy” (web page). Available at
https://www.pge.com/en_US/about-pge/environment/what-we-are-doing/clean-energy-solutions/clean-energy-solutions.page. Accessed October 20, 2016.
9 CPUC, “California Renewables Portfolio Standard (RPS)” (web page). Available at http://www.cpuc.ca.gov/PUC/energy/Renewables/. Accessed November 30, 2015.
December 21, 2016 Pier 70 Mixed-Use District Project Case No. 2014-001272ENV 4.Q.3 Draft EIR

4. Environmental Setting and Impacts Q. Mineral and Energy Resources
San Francisco uses about 6,000 gigawatt-hours of electricity per year,10 and this use is expected to grow at a rate of 1.3 percent per year to about 8,000 gigawatt-hours by 2030. According to the San Francisco Public Utilities Commission’s (SFPUC’s) Updated Electricity Resource Plan, more than 50 percent of this demand is used for commercial purposes; residential use accounts for 23 percent.11 PG&E also supplies natural gas to San Francisco from sources in the western United States.
Existing Natural Gas Demand
Natural gas is measured in cubic feet of gas or by its heat content in British Thermal Units (Btu), or therms.12 According to the CEC, California’s per capita natural gas use was 196 million Btu in 2014.13 According to the CEC, California’s total natural gas consumption in 2012 for industrial, residential, commercial, and electric power generation was 2,313 billion cubic feet per year (Bcf/year), up from 2,196 Bcf/year in 2010.14 PG&E provides natural gas to San Francisco.
There are limited available data on natural gas consumption at the project site. The existing natural gas demand is approximately 1,674 million BTU (MMBtu) per year (which may be for only the Noonan Building).15
Existing Natural Gas Supply
According to the CEC, California’s total natural gas demand in 2012 for industrial, residential, commercial, and electric power generation was 2,313 Bcf/year, up from 2,196 Bcf/year in 2010.16 PG&E provides natural gas to San Francisco.
10 San Francisco Public Utilities Commission (SFPUC), San Francisco’s Updated Electricity Resource Plan, March 2011 (hereinafter referred to as “Updated Electricity Resource Plan”), p. 38. Available online at http://sfwater.org/Modules/ShowDocument.aspx?documentID=40. Accessed November 13, 2015.
11 SFPUC, Updated Electricity Resource Plan, p. 38. 12 A British Thermal Unit is the amount of heat needed to raise the temperature of 1 pound of water
(approximately 8.3 gallons) 1 degree Fahrenheit. A therm is a unit of measurement for natural gas, equivalent to 100,000 Btu’s.
13 U.S. Energy Information Administration, “State Profiles and Energy Estimates, Rankings: Total Energy Consumed per Capita, 2014.” Available online at https://www.eia.gov/state/rankings/. Accessed August 9, 2016.
14 CEC, “Supply and Demand of Natural Gas in California.” Available online at http://energyalmanac.ca.gov/naturalgas/overview.html. Accessed November 14, 2015.
15 Port of San Francisco, “Pier 70 Area, Utilities Usage Based on Available Information,” based on 2013 natural gas consumption.
16 CEC, “Supply and Demand of Natural Gas in California.” Available online at http://energyalmanac.ca.gov/naturalgas/overview.html. Accessed November 14, 2015.
December 21, 2016 Pier 70 Mixed-Use District Project Case No. 2014-001272ENV 4.Q.4 Draft EIR

4. Environmental Setting and Impacts Q. Mineral and Energy Resources
Because of its low density, natural gas is difficult to store.17 After extraction from the earth, natural gas is transported over long distances by pipeline from sources to demand centers. Only a relatively small portion is stored in facilities or underground. Gas is typically supplied on-demand, and California’s reliance on imported natural gas leaves the State vulnerable to price shocks and supply disruptions.
However, natural gas supplies nationwide have increased dramatically in the last several years, due to the technology of hydraulic fracturing (fracking) combined with new techniques for horizontal drilling into gas pockets underground. The natural gas market has experienced sustained low prices, which are expected to continue for the foreseeable future.
Existing Electricity and Natural Gas Infrastructure
As described in “Electricity and Natural Gas” in Chapter 2, Project Description, p. 2.20, electricity is provided to the project site by PG&E and SFPUC Power through three 12-kilovolt (kV) electrical distribution circuits (generally, from 22nd Street, the Potrero Substation, and 20th Street). Two north-south, overhead 12-kV electrical distribution lines traverse Illinois Street and connect to the Potrero Substation located on the eastern side of Illinois Street between 22nd and 23rd streets. (See Figure 4.Q.1: Existing Electrical Infrastructure Serving the Project Site.) The existing 12-kV feeds to the project site (mentioned above or connecting with the above circuits) are underground along 22nd Street (owned by the Port), underground along 20th Street (owned by the Port once inside Building 102), and overhead along Michigan Street.
Natural gas is delivered to the project site through a PG&E-owned east-west natural gas line that runs under 20th and Michigan streets. The Port owns natural gas lines that connect to the PG&E line on 20th Street. From there, several smaller Port-owned natural gas distribution lines circulate natural gas throughout the 28-Acre Site. There are no existing natural gas lines connecting to the Illinois Parcels. (See Figure 4.Q.2: Existing Natural Gas Infrastructure Serving the Project Site.)
REGULATORY FRAMEWORK
The Federal, State, and local laws, regulations, and policies that govern and influence supply and demand for energy are described below. (See also Regulatory Framework in Section 4.H, Greenhouse Gas Emissions, pp. 4.H.3-4.H.8, which addresses Federal, State, and local rules and policies intended to decrease emissions of greenhouse gases. Many of those regulations are intended to reduce energy use and to encourage switching from fossil fuels to renewable sources.)
17 Liquefying natural gas by greatly reducing its temperature reduces the storage volume needed, but this process is expensive.
December 21, 2016 Pier 70 Mixed-Use District Project Case No. 2014-001272ENV 4.Q.5 Draft EIR

20TH
STR
EET
22N
D S
TREE
TTEERTS NAGIHCIM
TEERTS SIONILLI
Sou
rce:
BK
F (2
015)
FIG
UR
E 4
.Q.1
: EX
IST
ING
ELE
CT
RIC
AL
INFR
AST
RU
CT
UR
E SE
RV
ING
TH
E P
RO
JEC
T S
ITE
LEG
END
Exi
stin
gE
lect
rical
Lin
e(P
G&
E a
ndS
FPU
C P
ower
)
Exi
stin
gE
lect
rical
Lin
e(P
ort o
f SF)
Pie
r 70
Mix
ed-U
se
Dis
trict
P
roje
ct S
ite
050
0FT
December 21, 2016 Case No. 2014-001272ENV
4.Q.6
Pier 70 Mixed-Use District Project Draft EIR

Sou
rce:
BK
F (2
015)
FIG
UR
E 4
.Q.2
: EX
IST
ING
NA
TU
RA
L G
AS
INFR
AST
RU
CT
UR
E SE
RV
ING
TH
E P
RO
JEC
T S
ITE
LEG
END
Exi
stin
gG
as L
ine
To R
emai
n(P
G&
E)
Exi
stin
gG
as L
ine
To R
emai
n (P
ort o
f SF)
Exi
stin
gG
as L
ine
To
Be
Rem
oved
(Por
t of S
F)
Exi
stin
gA
band
oned
G
as L
ine
To
Be
Rem
oved
(Por
t of S
F)
Pie
r 70
Mix
ed-U
se
Dis
trict
Pro
ject
050
0FT
December 21, 2016 Case No. 2014-001272ENV
4.Q.7
Pier 70 Mixed-Use District Project Draft EIR

4. Environmental Setting and Impacts Q. Mineral and Energy Resources
FEDERAL
The Energy Independence and Security Act of 2007 was a major, comprehensive energy package at the Federal level. It includes a renewable fuel standard (Section 202), appliance and lighting efficiency standards (Sections 301-325), and building energy efficiency standards (Sections 411-441).
The American Recovery and Reinvestment Act of 2009 (H.R. 1, also known as the “Stimulus Bill”) included a number of provisions to encourage the development and financing of renewable energy, from demonstration project funding to loan guarantees.
STATE
Energy Efficiency
California Code of Regulations Title 24
The California Code of Regulations, Title 24, parts 1 and 6 (referred to below as “Title 24”) regulates energy efficiency and water efficiency in buildings. Title 24 provides construction standards for heating, cooling, ventilation, water heating, and certain types of lighting.18 The CEC also regulates appliance efficiency and has adopted progressively more stringent regulations over the years.19
The California Green Building Standards Code establishes standards including planning and design for sustainable site development, energy efficiency in excess of the California Energy Code requirements, and other matters. This code allows local jurisdictions that had already adopted green building standards to retain them if they are as, or more, stringent than the provisions in the State code.
The California Public Utilities Commission (CPUC) regulates investor-owned utilities operating in California, including PG&E. The CPUC has required utilities to conduct energy efficiency (or “demand-side management”) programs for many years, including, for example, subsidies for installing weatherization (e.g., insulation, weather stripping, hot water heater insulation blankets) in residential buildings.
18 These regulations are available at CEC, “Building Energy Efficiency Program” (web page). Available at http://www.energy.ca.gov/title24/. Accessed November 13, 2015.
19 CEC, “Appliance Efficiency Program” (web page). Available at http://www.energy.ca.gov/appliances/. Accessed November 13, 2015. http://www.energy.ca.gov/appliances/index.html.
December 21, 2016 Pier 70 Mixed-Use District Project Case No. 2014-001272ENV 4.Q.8 Draft EIR

4. Environmental Setting and Impacts Q. Mineral and Energy Resources
Energy Supply
Renewable Portfolio Standard and Senate Bill 350
The Renewable Portfolio Standard (RPS) requires retail sellers of electricity to provide a percentage of their electricity supply from renewable sources by certain years.20 (See Regulatory Framework in Section 4.H, Greenhouse Gas Emissions, pp. 4.H.6-4.H.7, for background information on the RPS.) Eligible renewable sources include geothermal, ocean wave, solar photovoltaic (PV), and wind, but exclude large hydroelectric (30 MW or more). Senate Bill 350 (Chapter 547, Statutes of 2015), signed by Governor Brown in October 2015, dramatically increased the stringency of the RPS. Senate Bill 350 establishes an RPS target of 50 percent by 2030, along with interim targets of 40 percent by 2024 and 45 percent by 2027. The CEC and CPUC also have extensive programs to implement the RPS and otherwise encourage renewable energy.
LOCAL REGULATIONS AND PLANS
San Francisco General Plan
The Environmental Protection Element21 of the San Francisco General Plan contains a section on energy. The following objectives and policies are relevant to the Proposed Project:
Objective 12 Establish the City and County of San Francisco as a Model for Energy Management.
Policy 12.1 Incorporate energy management practices into building, facility, and fleet maintenance and operations.
Policy 12.3 Investigate and implement techniques to reduce municipal energy requirements.
Policy 12.4 Encourage investment in capital projects that will increase municipal energy production in an environmentally responsible manner.
Policy 12.5 Include energy emergency preparedness plans in municipal operations.
Objective 13 Enhance the Energy Efficiency of Housing in San Francisco.
Policy 13.2 Strengthen enforcement of the state’s residential energy conservation building standards.
Policy 13.3 Expand the environmental review process to encourage the use of additional measures to save energy in new housing.
Policy 13.4 Encourage the use of energy conserving appliances and lighting systems.
20 California Public Utilities Commission, RPS Program Overview, June 2015. Available online at http://www.cpuc.ca.gov/PUC/energy/Renewables/overview.htm. Accessed November 2, 2015.
21 The Environmental Protection Element, http://www.sf-planning.org/ftp/general_plan/I6_Environmental_Protection.htm#ENV_EGY. Accessed November 13, 2015.
December 21, 2016 Pier 70 Mixed-Use District Project Case No. 2014-001272ENV 4.Q.9 Draft EIR

4. Environmental Setting and Impacts Q. Mineral and Energy Resources
Objective 14 Promote Effective Energy Management Practices to Maintain the Economic Vitality of Commerce and Industry.
Policy 14.2 Insure adequate local enforcement of California’s non-residential building standards.
Policy 14.3 Commercial case studies and energy research efforts should be undertaken to determine cost-effective energy conservation strategies, e.g. single metering, integrated energy systems, flextime to reduce peak transit use, that should be integrated into EIR procedures.
Policy 14.4 Promote commercial office building design appropriate for local climate conditions.
Policy 14.5 Encourage use of integrated energy systems.
Objective 15 Increase the Energy Efficiency of Transportation and Encourage Land Use Patterns and Methods of Transportation Which Use Less Energy.
Policy 15.1 Increase the use of transportation alternatives to the automobile.
Policy 15.3 Encourage an urban design pattern that will minimize travel requirements among working, shopping, recreation, school and childcare areas.
Policy 15.5 Encourage consideration of energy use issues when making transportation investment decisions.
Objective 16 Promote the Use of Renewable Energy Sources.
Policy 16.1 Develop land use policies that will encourage the use of renewable energy sources.
San Francisco Green Building Requirements
San Francisco’s Green Building Requirements place obligations for energy and water efficiency on the Proposed Project (water efficiency saves energy by reducing the energy needed for collection, conveyance, treatment, and distribution of water). All new buildings and additions to existing buildings under the Proposed Project (including those on Port property) would comply with the San Francisco Green Building Ordinance requirements of the San Francisco Green Building Code. Buildings must comply with Title 24 Part 6 (2013) Energy Standards, and additionally meet energy efficiency prerequisites of the applicable green building rating system (GreenPoint Rated, LEED for Homes or LEED BD+C 2009). New non-residential buildings must conduct design and construction commissioning to verify that energy- and water-using components meet the owner’s or owner representative’s project requirements. San Francisco requires new large commercial projects, new high-rise residential projects, and commercial interior projects to provide designated parking for low-emitting, fuel-efficient, and carpool/van pool vehicles.
December 21, 2016 Pier 70 Mixed-Use District Project Case No. 2014-001272ENV 4.Q.10 Draft EIR

4. Environmental Setting and Impacts Q. Mineral and Energy Resources
The Green Building Code was amended in April 2016 to establish requirements for certain new building construction to include development of renewable energy facilities (Sections 4.201.2 and 5.201.1.2 of the Green Building Code). The requirements include the installation of solar PV systems and/or solar thermal systems in the solar zone (i.e., an allocated space that is unshaded and free of obstructions, usually a roof). The renewable energy requirements are applicable to residential and non-residential new construction projects of 10 occupied floors or less.
San Francisco Electricity Resource Plan
In December 2002, the City adopted the Electricity Resource Plan, which includes implementation steps for the following strategies: maximize energy efficiency; develop renewable power; ensure reliable power; support affordable electric bills; improve air quality and prevent other environmental impacts; support environmental justice; promote opportunities for economic development; and increase local control over energy resources. The Electricity Resource Plan is a broad policy guide that provides a framework for more specific Citywide future programs and actions. In response to the Board of Supervisors’ guidance in their 2009 Ordinance 94-09, SFPUC staff have developed an updated Electricity Resource Plan.22 This update identifies proposed recommendations to work towards achieving the broad policy goals laid out in the 2002 Plan.
The City also has a number of programs to further promote energy conservation among residents and businesses. The San Francisco Energy Watch Program offers free consultation about energy-efficient appliances and installation at a reduced fee, as well as information about rebates, audits, and incentives, to businesses and multi-family property owners. Typical equipment improvements include lighting, domestic hot water heating, heating ventilation and air conditioning units, and washers and dryers.
IMPACTS AND MITIGATION MEASURES
SIGNIFICANCE THRESHOLDS
The thresholds for determining the significance of impacts in this analysis are consistent with the environmental checklist in Appendix G of the State CEQA Guidelines, which has been modified by the San Francisco Planning Department. For the purpose of this analysis, the following applicable thresholds were used to determine whether implementing the Proposed Project would result in a significant impact on mineral and energy resources. Implementation of the Proposed Project would have a significant effect on mineral and energy resources if the project would:
22 San Francisco Public Utilities Commission, “San Francisco’s Electricity Resource Plan,” (web page). Available at http://sfwater.org/index.aspx?page=700. Accessed November 13, 2015.
December 21, 2016 Pier 70 Mixed-Use District Project Case No. 2014-001272ENV 4.Q.11 Draft EIR

4. Environmental Setting and Impacts Q. Mineral and Energy Resources
Q.1 Result in the loss of availability of a known mineral resource that would be of value to the region and the residents of the state;
Q.2 Result in the loss of availability of a locally-important mineral resource recovery site delineated on a local general plan, specific plan or other land use plan; or
Q.3 Encourage activities which result in the use of large amounts of fuel, water, or energy, or use these in a wasteful manner.
APPROACH TO ANALYSIS
A number of factors may be considered in determining whether a project would use a large amount of energy or whether the use of energy would be wasteful. They include (1) the degree to which energy conservation measures would be applied, (2) use of on-site renewable energy, and (3) conformance with policies geared to energy efficiency.23
Most of the Proposed Project’s electrical and natural gas demand was estimated using the CalEEMod model, as further described below under “Energy Demand,” pp. 4.Q.14-4.Q.17. This model was also used in the air quality analysis presented in Section 4.G, Air Quality. Transportation fuel use demand estimates were developed using projected vehicle miles traveled and fuel-efficiency data.
Because the same features and performance standards would apply to the Maximum Residential Scenario, the Maximum Commercial Scenario, and an actual build-out that may lie somewhere between these scenarios, the impact analysis does not need to differentiate between the scenarios, except where forecasted usage is quantified. Similarly, there are no relevant location-specific aspects to meeting energy and water efficiency requirements; therefore, the impact analysis does not need to differentiate between the 28-Acre Parcel and the Illinois Parcels. Nevertheless, quantified forecasted energy estimates have been made distinguishing the 28-Acre Parcel and the Illinois Parcels.
PROJECT FEATURES
The Proposed Project would be a high-density, mixed-use infill development in a transit-oriented district. It would comply with the San Francisco Green Building Requirements related to energy efficiency. The project sponsors or developers of future buildings on the project site shall provide documentation demonstrating that the Title 24 Part 6 (2013) Energy Standards would be met, including the compliance margin required for the certification system chosen by the project sponsors (GreenPoint Rated or Leadership in Energy and Environmental Design [LEED®]
23 State CEQA Guidelines, Appendix F, “Energy Conservation,” provides a list of optional factors that an EIR may consider in analyzing the energy implications of a project.
December 21, 2016 Pier 70 Mixed-Use District Project Case No. 2014-001272ENV 4.Q.12 Draft EIR

4. Environmental Setting and Impacts Q. Mineral and Energy Resources
Gold).24 The Proposed Project’s new buildings would comply with energy efficiency requirements of the San Francisco Green Building Code, and energy-efficient appliances and energy-efficient lighting would be installed in the three rehabilitated historic buildings. Buildings would be heated and cooled individually, independent from the adjacent buildings.
As described in “Renewable Energy” in Chapter 2, Project Description, p. 2.67, the Proposed Project is required to meet the State’s Title 24 and the San Francisco Green Building Requirements for renewable energy.25 Title 24 requires that 15 percent of roof area is to be built as “solar ready”, and the San Francisco Green Building Code further requires that Solar PV systems and/or solar thermal systems be installed. The Proposed Project would include roof-mounted or building-integrated solar PV systems and/or roof-mounted solar thermal hot water systems for all proposed buildings, excluding existing Buildings 2, 12, and 21. The Proposed Project may interconnect these PV systems via a community microgrid that serves as a site-wide distribution network capable of balancing captive supply and demand resources to maintain stable service within the project site.
To reduce potable water demand, high-efficiency fixtures and appliances would be installed in new buildings, and fixtures in existing buildings would be retrofitted, as required by City regulations. Reductions in water use save energy that would otherwise be used to transport and treat the water. (See Table 4.H.2: Regulations Applicable to Private Development Projects, in Section 4.H, Greenhouse Gases, pp. 4.H.13-4.H.28, for additional requirements regarding energy and water conservation and sustainability standards and practices to which the Proposed Project must adhere.)
As described in “Proposed Infrastructure and Utilities,” pp. 2.66-2.67, the Proposed Project would replace overhead electrical distribution with a joint trench distribution system that would follow the roadways. The existing natural gas distribution system would be extended to cover the entire project site, and the piping would be realigned within the proposed roadway network to serve the project site. The new electrical distribution lines would connect to the existing 12-kV electricity lines. The new gas distribution lines would connect to existing gas mains.
Back-up emergency diesel generators are required by the San Francisco Building Code for buildings with occupied floor levels greater than 75 feet in height. There are 10 parcels (all in the 28-Acre Site) that would allow building heights of up to 90 feet: Parcels A, B, C1, C2, D, E1, F, G, H1, and H2. The new buildings on these parcels with occupied floor levels greater than
24 A compliance margin is a percentage (such as 10 or 25 percent) that a builder must achieve in energy savings over the applicable energy efficiency building standard.
25 San Francisco Building Code, Chapter 13C.
December 21, 2016 Pier 70 Mixed-Use District Project Case No. 2014-001272ENV 4.Q.13 Draft EIR

4. Environmental Setting and Impacts Q. Mineral and Energy Resources
75 feet (up to 11 new buildings) would each have a back-up diesel generator with an average size of 400 horsepower (11 generators total).
The anticipated new 20th Street pump station northeast of the project site, adjacent to Building 6 on the BAE Systems Ship Repair site, would augment the Proposed Project’s wastewater and stormwater infrastructure. The new pump station would use electricity.
The Proposed Project would include transportation-related features that would reduce vehicle use such as bike paths, Class I and Class II bicycle parking spaces, and car share parking spaces.
Chapter 6, Variants, discusses the District Energy System Variant, a possible variant under consideration that would reduce energy use (see pp. 6.31-6.45). Two other variants, the Automated Waste Collection System and Reduced Off-Haul Variants (see pp. 6.69-6.86 and pp. 6.1-6.31, respectively), would reduce transportation-related fuel use. The Wastewater Treatment and Reuse System Variant (pp. 6.45-6.69) would use water-saving technology to reduce demand on energy-intensive systems that would deliver and treat water.
IMPACT EVALUATION
Impact ME-1: The Proposed Project would not have a significant adverse impact on the availability of a known mineral resource and/or a locally important mineral resource recovery site. (No Impact)
The project site has historically been developed and is located in an urbanized area of San Francisco. CDMG has designated the project site as MRZ-4 (areas where available information is inadequate for assignment to any other zone). In addition, there are no known mineral resources on the project site or in the vicinity. Therefore, implementation of the Proposed Project would not impact any known mineral resources on the project site. Additionally, there are no designated mineral resource recovery sites in the project vicinity whose operations or accessibility would be affected by the construction or operation of the Proposed Project. Therefore, the Proposed Project would have no impact on known mineral resources or any locally important mineral resource recovery site. No mitigation measures are necessary.
Impact ME-2: The Proposed Project would not have a substantial adverse effect on the use of fuel, water, or energy consumption, and would not encourage activities that could result in the use of large amounts of fuel, water, or energy, or use these in a wasteful manner. (Less than Significant)
Energy Demand
Table 4.Q.1: Estimated Electrical and Natural Gas Demand at Full Build-out for the Maximum Residential Scenario and the Maximum Commercial Scenario, Excluding Solar Photovoltaic and
December 21, 2016 Pier 70 Mixed-Use District Project Case No. 2014-001272ENV 4.Q.14 Draft EIR

4. Environmental Setting and Impacts Q. Mineral and Energy Resources
Solar Thermal, provides a conservative estimate of building-related electricity and natural gas demand for the Proposed Project at full-build out under each scenario, not taking into account energy savings provided by any solar PV or solar thermal systems.
Table 4.Q.1: Estimated Electrical and Natural Gas Demand at Full Build-out for the Maximum Residential Scenario and the Maximum Commercial Scenario, Excluding Solar Photovoltaic and Solar Thermal
Scenario/Area Estimated Electrical Demand (MWh/year)
(excludes solar photovoltaic)
Estimated Natural Gas Demand
(MMBtu/year) (excludes solar thermal)
Maximum Residential Scenario
28-Acre Site 32,772 89,159
Illinois Parcels 4,054 17,399
Total 36, 826 106,558
Maximum Commercial Scenario
28-Acre Site 41,691 81,191
Illinois Parcels 5,719 15,100
Total 47,410 96, 291
Notes: CalEEMod estimates electricity and natural gas usage based on building square footage by type of use. The CalEEMod model is also used in the air quality impact analysis, and is discussed in Section 4.G, Air Quality. MWh = megawatt-hours = 1000 x kWh. A typical residential electric bill is expressed in kilowatt-hours. MMBtu = million Btu. A typical residential natural gas bill is expressed in therms. 1 therm = 100,000 Btu = 0.1 MMBtu.
Source: ESA, CalEEMod model run
The existing electric energy demand at the project site is approximately 344 MWh per year. Thus, under either the Maximum Residential Scenario or the Maximum Commercial Scenario, electricity use would substantially increase under the Proposed Project at build-out.
Based on the limited available data, the existing natural gas demand is approximately 1,674 MMBtu per year (which may be for only the Noonan Building [Building 11]). Thus, under either the Maximum Residential Scenario or the Maximum Commercial Scenario, natural gas consumption would greatly increase under the Proposed Project at build-out.
For both electricity and natural gas, compared to the mix of other existing development in San Francisco and the region, compliance with the latest Title 24 and other requirements would ensure that the Proposed Project would be more efficient than all but recent buildings built to the same requirements, or buildings for which owners decided to exceed efficiency requirements.
December 21, 2016 Pier 70 Mixed-Use District Project Case No. 2014-001272ENV 4.Q.15 Draft EIR

4. Environmental Setting and Impacts Q. Mineral and Energy Resources
The Proposed Project would be required to meet current State and local codes and ordinances concerning energy consumption, including Title 24 and the applicable regulations listed in the San Francisco GHG Checklist; electricity and natural gas usage would therefore not be wasteful. The Proposed Project would include compliance with Sections 4.201.2 and 5.201.1.2 of the San Francisco Green Building Code, as applicable, for solar PV and solar thermal energy development on or near the proposed buildings.26 Generally, these standards are among the strictest in the nation, if not the strictest. Documentation showing Title 24 standards compliance must be submitted by the developer to the San Francisco Department of Building Inspection with the application for building permit. Therefore, the Proposed Project would be required to comply with the energy conservation measures and would be in conformance with policies geared to energy efficiency. (See Chapter 6, Variants, pp. 6.31-6.45, for a discussion of the District Energy System Variant.)
One such assertive energy ordinance was adopted into the San Francisco Green Building Code in April 2016 which builds upon existing Title 24 regulations by requiring that all new buildings with 10 floors or fewer must have either solar PV or solar thermal panels installed. In compliance with Title 24 and the San Francisco Green Building Code, the Proposed Project would dedicate at least 15 percent of available roof area to solar PV and/or solar thermal hot water systems for residential and commercial buildings. The total unshaded roof area of the Proposed Project is estimated to be approximately 600,000 sq. ft.27 The installation of PV on 15 percent of available roof area would cover approximately 90,000 sq. ft. with approximately 1.4 MW of solar PV panel arrays. With an estimated output of 1,540 kWh/kWp, 1.4 MW of solar PV panel arrays could produce up to approximately 2,150 MWH of renewable electricity per year and offset about 5.8 percent of the Proposed Project’s total energy consumption under the Maximum Residential Scenario and 4.5 percent under the Maximum Residential Scenario. By comparison, the maximum possible usage of rooftop area for solar PV is an estimated 6.5 MW of solar PV panel arrays, which could produce up to approximately 10,000 MWh of renewable electricity per year and offset about one-fourth of the electricity demand of the Maximum Residential Scenario and about one-fifth of the electricity demand of the Maximum Commercial Scenario.2829
26 The Better Roof Ordinance’s solar PV and solar thermal energy requirements only apply to buildings that are 10 occupied stories or less.
27 See Memorandum to Kelly Pretzer, Forest City, from Melissa Higbee, AECOM, re: Assumptions for Pier 70 Energy Calculations, November 25, 2015, pp. 5-7.
28 Ibid. 29 This analysis assumes that 70 percent of available unshaded roof area would be devoted to PV due to
maintenance and other rooftop space requirements.
December 21, 2016 Pier 70 Mixed-Use District Project Case No. 2014-001272ENV 4.Q.16 Draft EIR

4. Environmental Setting and Impacts Q. Mineral and Energy Resources
The contribution of solar thermal is limited by the domestic hot water demand of the Proposed Project30. As a hypothetical example, under the Maximum Residential Scenario, 45,000 sq. ft. of solar thermal could offset the equivalent of 1.3 percent of the Proposed Project’s total energy consumption.31 Under the Maximum Commercial Scenario, 30,000 sq. ft. of roof-mounted solar thermal hot water systems could offset the equivalent of 0.8 percent of energy consumption.
The anticipated new 20th Street pump station northeast of the project site would use electricity. The new pump station would have larger wastewater flow capacity than the existing pump station, which was installed in 1993. The flow capacity has yet to be determined; therefore, the expected electricity usage required is not available. However, even if wastewater flow would be larger, present-day electric motors are more efficient than the existing 1993 equipment. For example, substantial advances have been made in using electronic pump controls for variable pumping speed, which reduces electricity use.32 Therefore, there may or may not be an increase in electricity demand corresponding to the increase in pump station flow capacity.
For these reasons, the Proposed Project would have a less-than-significant impact on the use of energy and would not result in the use of large amounts, or in the wasteful use, of energy. No mitigation measures are necessary.
Water Demand
Section 4.K, Utilities and Service Systems, describes the water supply and demand aspects of the Proposed Project. The Proposed Project would include required water conservation practices to reduce the amount of water used. Water-efficient plumbing fixtures would be installed throughout the new and renovated buildings. Landscaping and street trees would be water efficient. Therefore, the Proposed Project would include the application of required water conservation measures and would be in conformance with policies addressing water efficiency. For these reasons, the Proposed Project would have a less-than-significant impact on water use and would not result in the wasteful use of water. No mitigation measures are necessary regarding water use.
30 Pier 70 Draft Sustainability Plan, January 2016, p. 61. 31 See Memorandum to Kelly Pretzer, Forest City, from Melissa Higbee, AECOM, re: Assumptions for
Pier 70 Energy Calculations, November 25, 2015, pp. 5-7. 32 For example, a U.S. Department of Energy study states, “With rotodynamic pump installations, savings
of between 30% and 50% have been achieved in many installations by installing VSDs [Variable Speed Drives]. U.S. Department of Energy, Energy Efficiency and Renewable Energy (office), Industrial Technologies Program, “Variable Speed Pumping: A Guide to Successful Applications: Executive Summary,” p. 10. Available at https://www1.eere.energy.gov/manufacturing/tech_assistance/pdfs/variable_speed_pumping.pdf. Accessed December 16, 2015.
December 21, 2016 Pier 70 Mixed-Use District Project Case No. 2014-001272ENV 4.Q.17 Draft EIR

4. Environmental Setting and Impacts Q. Mineral and Energy Resources
Compared to the mix of other existing development in San Francisco and the region, compliance with the latest Title 24 and other requirements would ensure that the Proposed Project would be more water efficient than all but recent buildings built to the same requirements, or buildings for which owners decided to exceed efficiency requirements.
Transportation Fuel Demand
Comparison of transportation fuel use and efficiency between the Proposed Project and the mix of other existing development in San Francisco or the region is speculative; however, relative to other households and employment uses in the City, the project site is better served by transit than outlying residential neighborhoods of the City, such as the Sunset District, but less well-served by transit than areas in or near Downtown.
Table 4.Q.2: Approximate Transportation Fuel Demand at Full Build-out for the Maximum Residential Scenario and the Maximum Commercial Scenario provides estimated transportation-related gasoline and diesel demand for the Proposed Project at full build-out under each scenario.33
As discussed in Section 4.E, Transportation and Circulation, under “Background Vehicle Miles Traveled in San Francisco and Bay Area,” on pp. 4.E.9-4.E.10, San Francisco has a lower vehicle miles traveled (VMT) ratio than the Bay Area region as a whole. The transportation analysis zone in which the project site is located (TAZ 559) has between 24 and 49 percent fewer daily VMT than the Bay Area regional average. Furthermore, the following transportation-related aspects of the Proposed Project would discourage single-occupancy vehicle trips: proximity to transit, bicycle paths, bicycle storage, bike share shuttles, pedestrian walkways, and a Transportation Demand Management (TDM) Plan with strategies to discourage the use of automobiles and to encourage transit and other modes of transportation. Mitigation Measure M-AQ-1f: Transportation Demand Management, in Section 4.G, Air Quality, pp. 4.G.47-4.G.50, includes further measures that would reduce vehicle trips. Because the Proposed Project is an infill mixed-use development in a transit-rich area, the Proposed Project’s vehicle trips and associated fuel use would not constitute wasteful use of energy and therefore would be is consistent with the Plan Bay Area land use strategy which seeks to reduce per capita VMT.34
33 Diesel fuel would also be used for periodic testing and infrequent running of emergency generators. Testing is generally limited to 50 hours or less per year for each generator under BAAQMD air permits. It is difficult to forecast emergency use, as the events are typically rare.
34 Plan Bay Area is a nine-county long-range plan to meet the requirements of California’s 2008 Senate Bill 375 (SB 375), which call on each of the State’s 18 metropolitan areas to develop a Sustainable Communities Strategy, an integrated transportation, land use, and housing plan that addresses ways to accommodate future population growth and reduce greenhouse gas emissions.
December 21, 2016 Pier 70 Mixed-Use District Project Case No. 2014-001272ENV 4.Q.18 Draft EIR

4. Environmental Setting and Impacts Q. Mineral and Energy Resources
Table 4.Q.2: Approximate Transportation Fuel Demand at Full Build-out for the Maximum Residential Scenario and the Maximum Commercial Scenario
Scenario/Area Estimated Gasoline Demand (1000’s gallons / year)
Estimated Diesel Demand (1000’s gallons / year)
Maximum Residential Scenario
28-Acre Site 2,161 315
Illinois Parcels 242 35
Total1 2,403 350
Maximum Commercial Scenario
28-Acre Site 2,346 342
Illinois Parcels 237 35
Total1 2,584 376
Notes: CalEEMod estimates vehicle miles traveled (VMT) based on building square footage by type of use. Vehicle fuel efficiency figures (gasoline, electric hybrid, electric only, and diesel) are rough approximations based on the EMFAC2014 model run. Assumptions used herein are 31.5 mpg for gasoline-powered vehicles (light-duty) and hybrid-electric, which are an estimated 88.9% of the Pier 70-related trips per CalEEMod; 0 mpg for fully-electric vehicles, which are an estimated 6.4% of the Pier 70-related trips per CalEEMod; and 17.2 mpg for diesel-powered vehicles (medium- and heavy-duty), which are an estimated 4.6% of the Pier 70-related trips per CalEEMod. 1 Totals include rounding from underlying calculations.
Sources: (1) Vehicle Miles Traveled from ESA, CalEEMod model run (split is 88.9% gasoline and hybrid gasoline-electric, 6.4% electric-only, and 4.6% diesel); (2) Composite MPG from ESA, EMFAC2014 (v1.0.7) Emissions Inventory, San Francisco County, Calendar Year 2030 (annual), EMFAC2011 Vehicle Classification Categories
For these reasons, the Proposed Project would have a less-than-significant impact on the use of transportation fuel energy and would not result in the use of large amounts or in the wasteful use of energy. No mitigation measures are necessary regarding transportation-related fuel use.
Energy Demand and Supply
The CEC and local government siting authorities consider applications for the development of new power-generating facilities in San Francisco, the Bay Area, and elsewhere in the State on an ongoing basis. These facilities could supply additional energy to the power supply “grid” within the next few years. The CPUC uses an ongoing series of proceedings (Long Term Procurement Plan, Resource Adequacy, and RPS-related proceedings) to plan for an adequate long-term electricity supply with an increasing proportion of renewable electricity. The demand for electricity generated by the Proposed Project would be negligible in the context of overall demand within San Francisco and the State, and would not in and of itself require a major expansion of power facilities. Therefore, the energy demand associated with the Proposed Project would not result in a significant environmental effect. No mitigation measures are necessary.
December 21, 2016 Pier 70 Mixed-Use District Project Case No. 2014-001272ENV 4.Q.19 Draft EIR

4. Environmental Setting and Impacts Q. Mineral and Energy Resources
Impact ME-3: The Proposed Project would not result in new or expansion of existing electric or natural gas transmission and/or distribution facilities that would cause significant physical environmental effects. (Less than Significant)
As discussed in “Project Features” on pp. 4.Q.12-4.Q.13, the Proposed Project would replace overhead electrical distribution with a joint trench distribution system following the roadways. The existing natural gas distribution system would be extended within the project site to cover the entire project site, as realigned within the proposed roadway network. The new electrical distribution lines would connect to the existing 12-kV electricity distribution grid. The new gas distribution lines would connect to existing gas mains (i.e., a 4-inch gas main under 20th Street, and gas transmission lines under Illinois and 20th streets).
The existing utility-owned 12-kV electricity distribution grid and existing gas mains adjacent to the project boundaries are expected to have adequate capacity to serve the Proposed Project’s demand. If the SFPUC would be the electricity provider, the Proposed Project would need wholesale distribution transformers to convert the power from PG&E to the SFPUC. These transformers could be located on poles, on the sidewalk, or in a building.
For these reasons, the Proposed Project would not cause significant physical environmental effects as a result of new or expansion of existing electric or natural gas transmission and/or distribution facilities, and this impact would be less than significant. No mitigation measures are necessary.
Cumulative Impacts
Impact C-ME-1: The Proposed Project, in combination with other past, present and reasonably foreseeable future projects in the vicinity, would not result in a cumulatively considerable contribution to a significant adverse cumulative impact on mineral and energy resources. (Less than Significant)
There are no known mineral resources or resource recovery sites on the project site or in the vicinity. All land in the City and County of San Francisco, including the project site, is designated MRZ-4. Therefore, none of the projects identified as cumulative development have mineral resources or resource recovery sites. There would be no cumulative impact on minerals.
Reasonably foreseeable development projects listed in the “Approach to Cumulative Impact Analysis” of Section 4.A, Introduction to Chapter 4, pp. 4.A.12-4.A.17, involving newly constructed buildings or alterations to existing buildings would be subject to the energy and conservation standards required by CCR Title 24, San Francisco Building Code, and the numerous other requirements summarized in Section 4.H, Greenhouse Gases (see Table 4.H.2: Regulations Applicable to the Proposed Project, pp. 4.H.13-4.H.28) as applicable for each land use category (residential or non-residential). Because of the energy and water efficiency
December 21, 2016 Pier 70 Mixed-Use District Project Case No. 2014-001272ENV 4.Q.20 Draft EIR

4. Environmental Setting and Impacts Q. Mineral and Energy Resources
requirements under CCR Title 24, San Francisco Building Code, and other regulations listed in Table 4.H.2, and the availability of transportation options, each of the reasonably foreseeable development projects would not use fuel, water, or energy in a wasteful manner.
In summary, the Proposed Project, combined with the reasonably foreseeable cumulative development projects in the vicinity, would not result in any cumulatively considerable contribution to a significant cumulative impact on mineral and energy resources, either directly or indirectly. No mitigation measures are necessary.
December 21, 2016 Pier 70 Mixed-Use District Project Case No. 2014-001272ENV 4.Q.21 Draft EIR

4. Environmental Setting and Impacts Q. Mineral and Energy Resources
This page intentionally blank
December 21, 2016 Pier 70 Mixed-Use District Project Case No. 2014-001272ENV 4.Q.22 Draft EIR