Embed Size (px)
Citation preview

Q

QA Look at College Viewbook Covers
SUNY/CUAD
June 15, 2005© Mark E. Johnson 2005

What is Q?

What is Q?
• Quantitative research - applying meaning to numbers

What is Q?
• Quantitative research - applying meaning to numbers
How likely are you to pick up this viewbook at a college fair?
Not likely
Very likely
What is Q?
• Qualitative research - interpreting meaning from open-ended questions

What is Q?
• Qualitative research - interpreting meaning from open-ended questions
Tell me what you think of this cover?
What is Q?
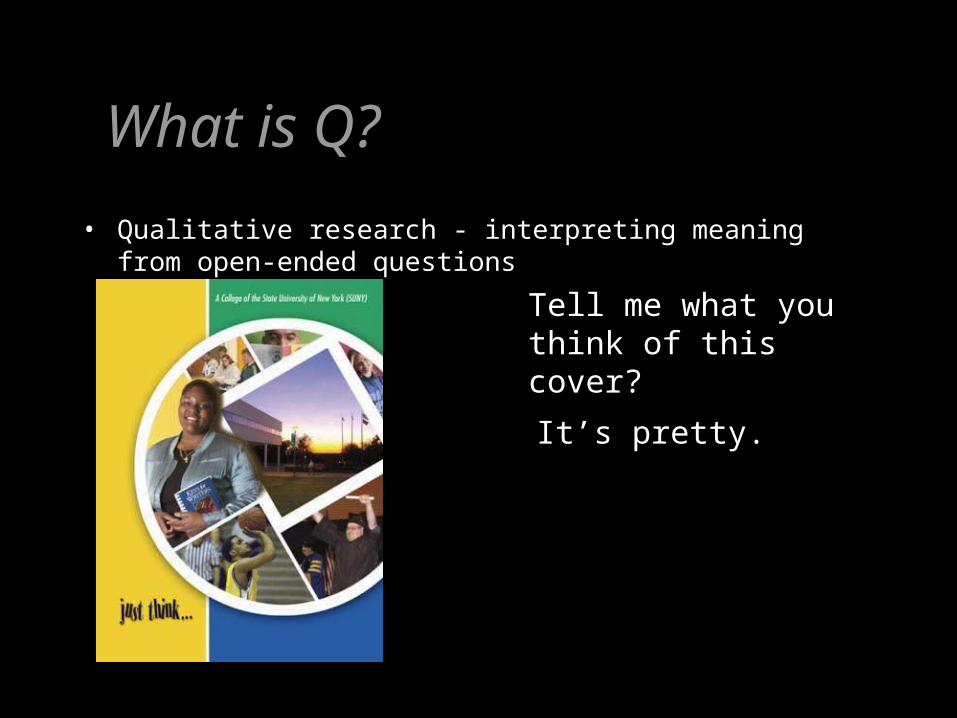
• Qualitative research - interpreting meaning from open-ended questions
Tell me what you think of this cover?
It’s pretty.

What is Q?
• Q Methodology combines the two - giving us a quantitative look at Human Subjectivity
What is Q?
• Sample

What is Q?
• Sample• Condition

What is Q?
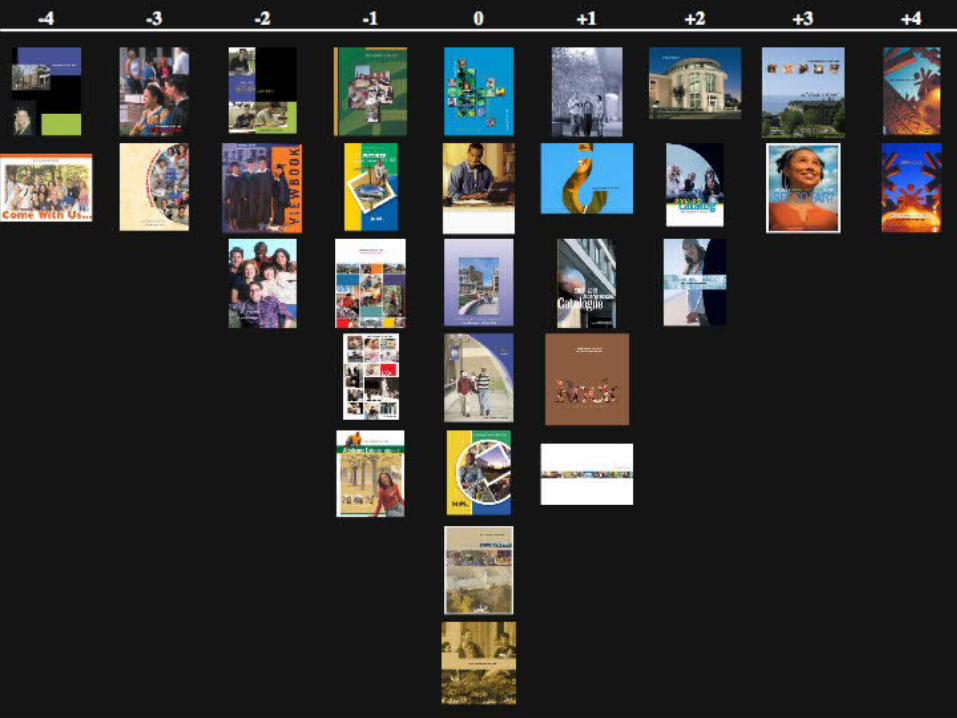
• Sample• Condition
– “Rank them from those that you would be most likely to pick up at a college fair to those that you would be most unlikely to pickup.”

What is Q?
• Sample• Condition
– “Rank them from those that you would be most likely to pick up at a college fair to those that you would be most unlikely to pickup.”
• The Sort

Results
• Three factors emerged after analysis
• Factor A was the largest, covering more than one half of all participants

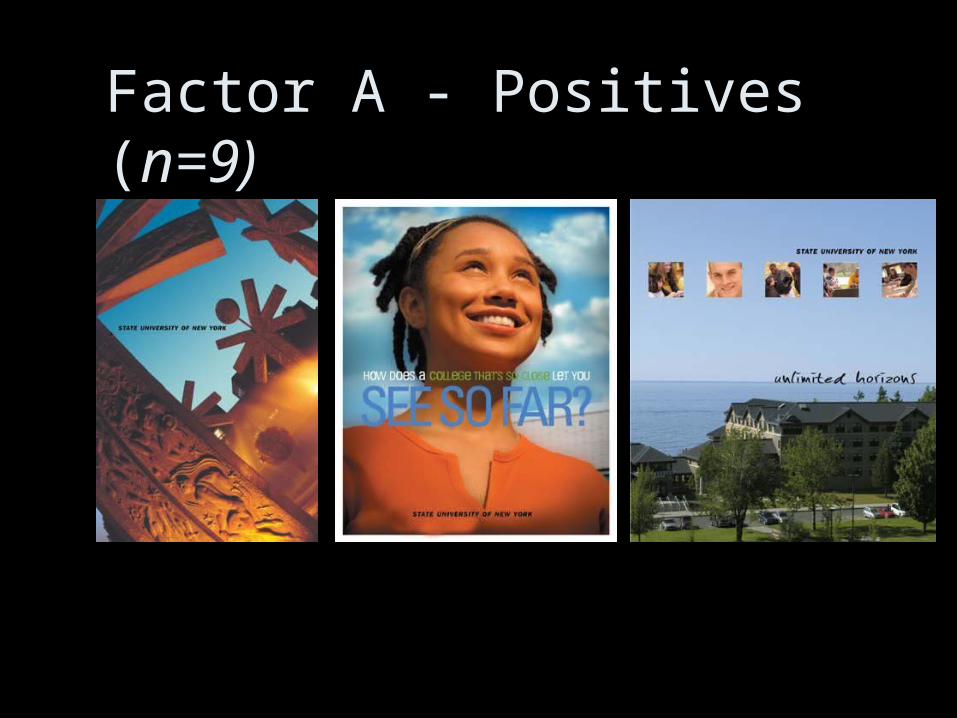
Factor A - Positives (n=9)
• Bold
• Strong use of color
• Strong graphics in images
• Images had a sense of place
• Visual interpretation of the school
Factor A - Positives (n=9)
Factor A - Negatives (n=9)
• Generic imagery
• “Cliché” images of campus life
• Group shots
• Loss of individuals
• No sense of place

Factor A - Negatives (n=9)


Factor B - Positives (n=4)
• Bold
• Dynamic designs
• Strong graphics in images
• Images had a sense of place
• People in realistic settings

Factor B - Positives (n=4)

Factor B - Negatives (n=4)
• Generic imagery
• Heavy use of graphics
• Overwhelming use of images

Factor B - Negatives (n=4)


Factor C - Positives (n=4)
• Visually active designs
• Graphics emphasized over images
• Sense of place

Factor C - Positives (n=4)

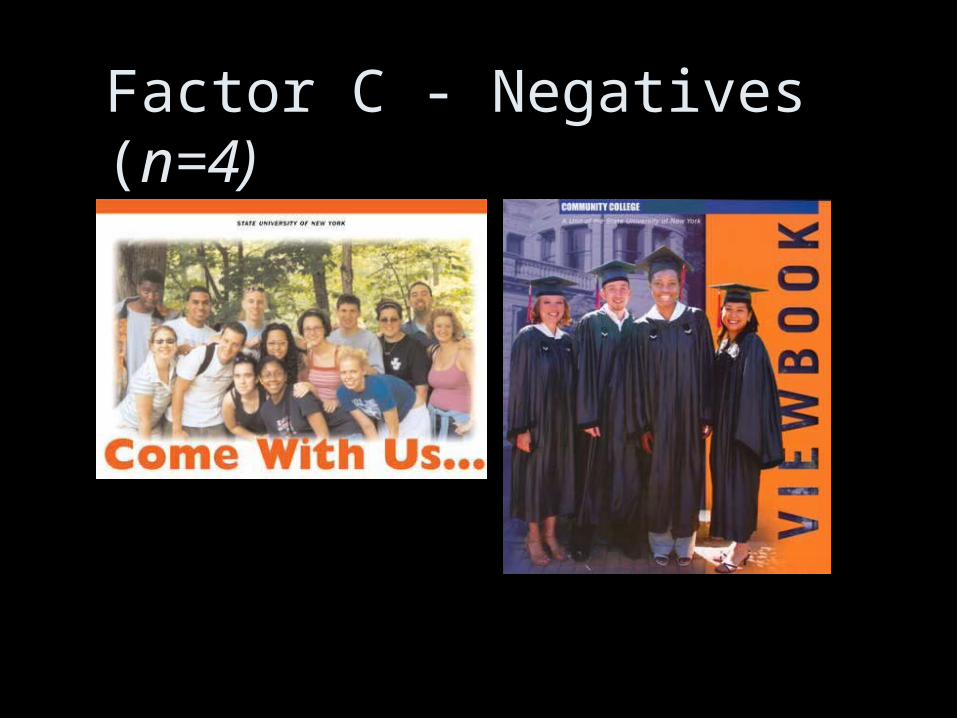
Factor C - Negatives (n=4)
• Generic people
Factor C - Negatives (n=4)

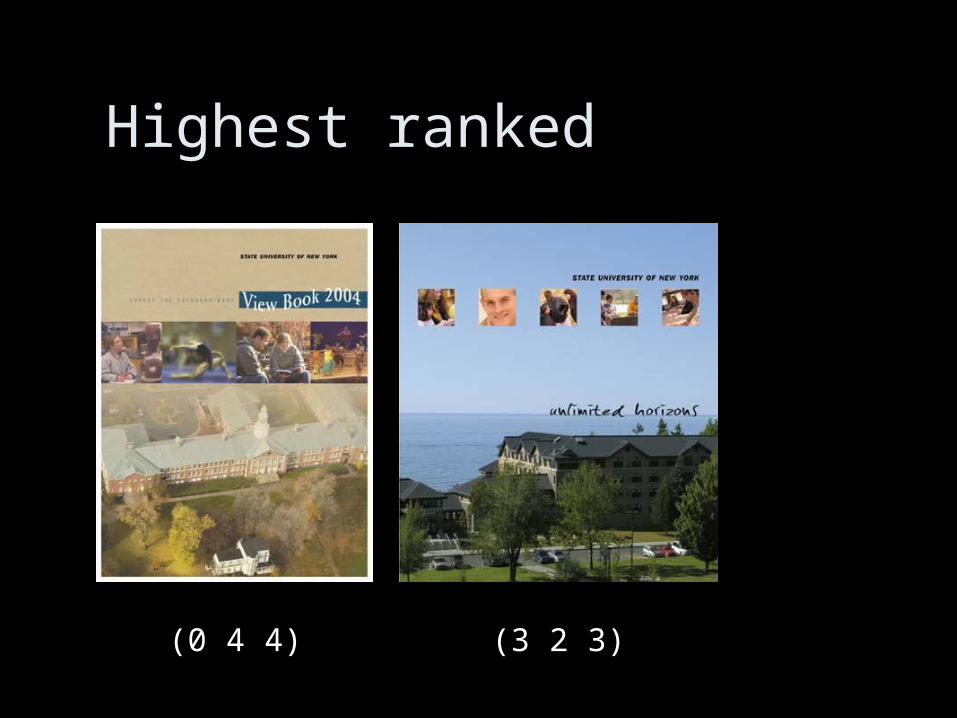
Highest ranked
(0 4 4) (3 2 3)
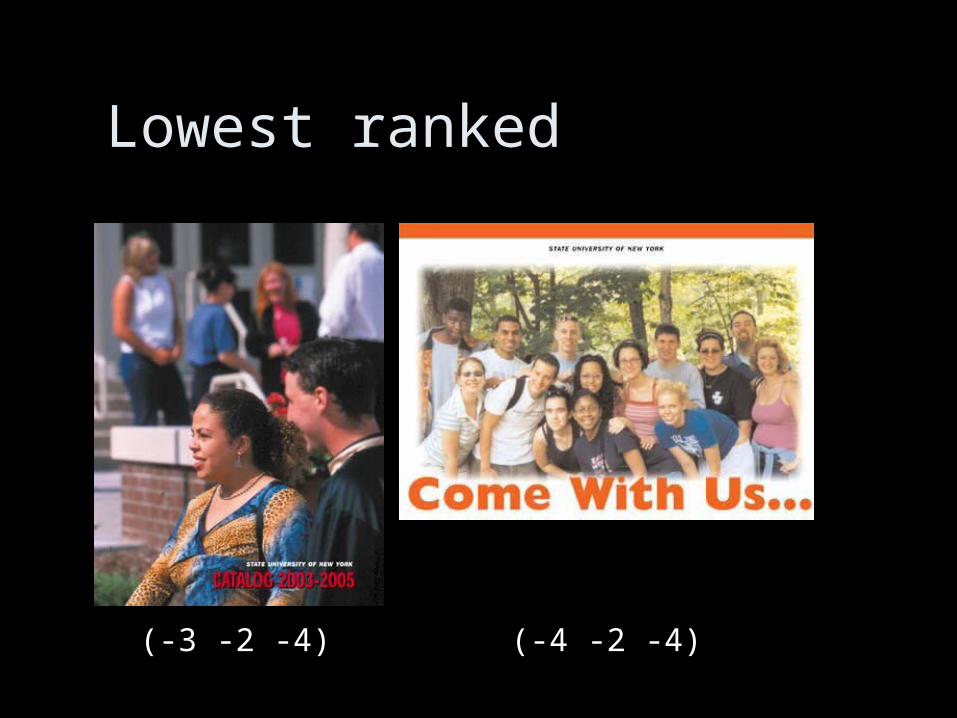
Lowest ranked
(-3 -2 -4) (-4 -2 -4)

Summation
• Sense of place
• Visual interpretation of your school
• Realistic people
• Go bold in images

Summation
• Avoid generic scenes and people
• Let prospective students see themselves
• Be careful with heavy use of graphics

Questions?

This research was done for the 2005 State University of New York College and University Art Directors
meeting, held in Cooperstown, NY. No part of this presentation may be reproduced without
the express written permission of the author, who can be contacted at
© Mark E. Johnson 2005