Embed Size (px)
Citation preview

akamai.com
[Q1 2015 ]
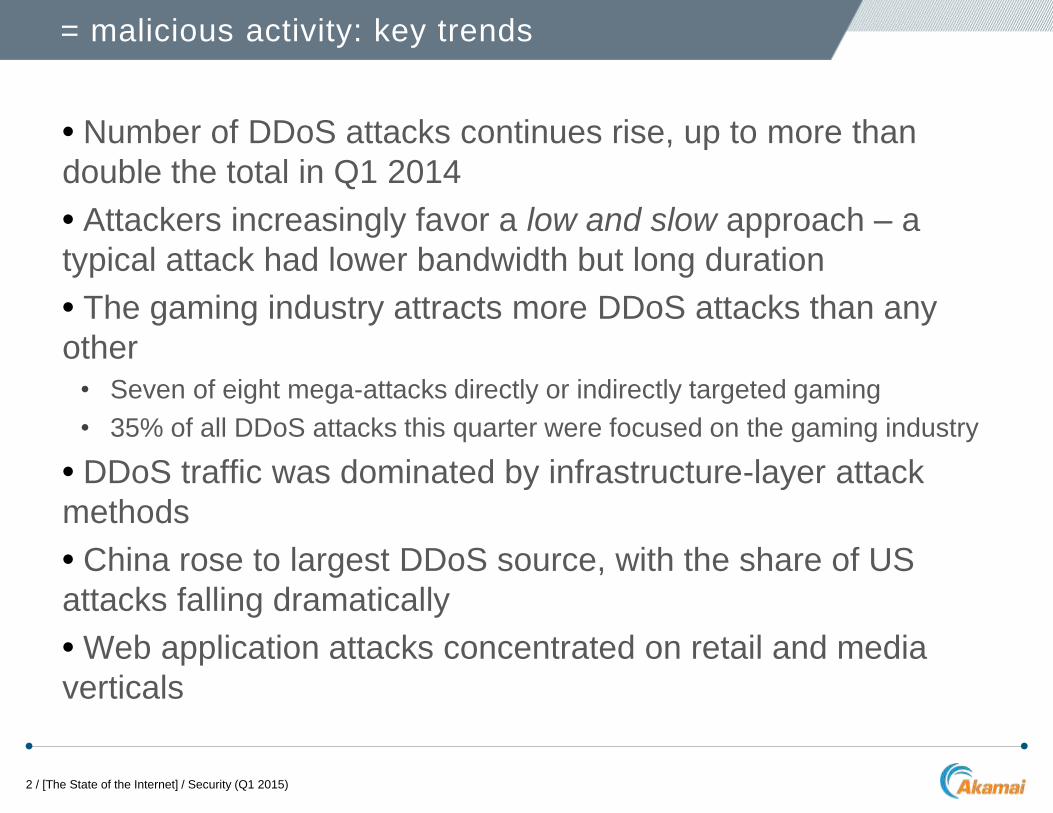
• Number of DDoS attacks continues rise, up to more than
double the total in Q1 2014
• Attackers increasingly favor a low and slow approach – a
typical attack had lower bandwidth but long duration
• The gaming industry attracts more DDoS attacks than any
other
• Seven of eight mega-attacks directly or indirectly targeted gaming
• 35% of all DDoS attacks this quarter were focused on the gaming industry
• DDoS traffic was dominated by infrastructure-layer attack
methods
• China rose to largest DDoS source, with the share of US
attacks falling dramatically
• Web application attacks concentrated on retail and media
verticals
= malicious activity: key trends
2 / [The State of the Internet] / Security (Q1 2015)
= major DDoS statistical trends
3 / [The State of the Internet] / Security (Q1 2015)
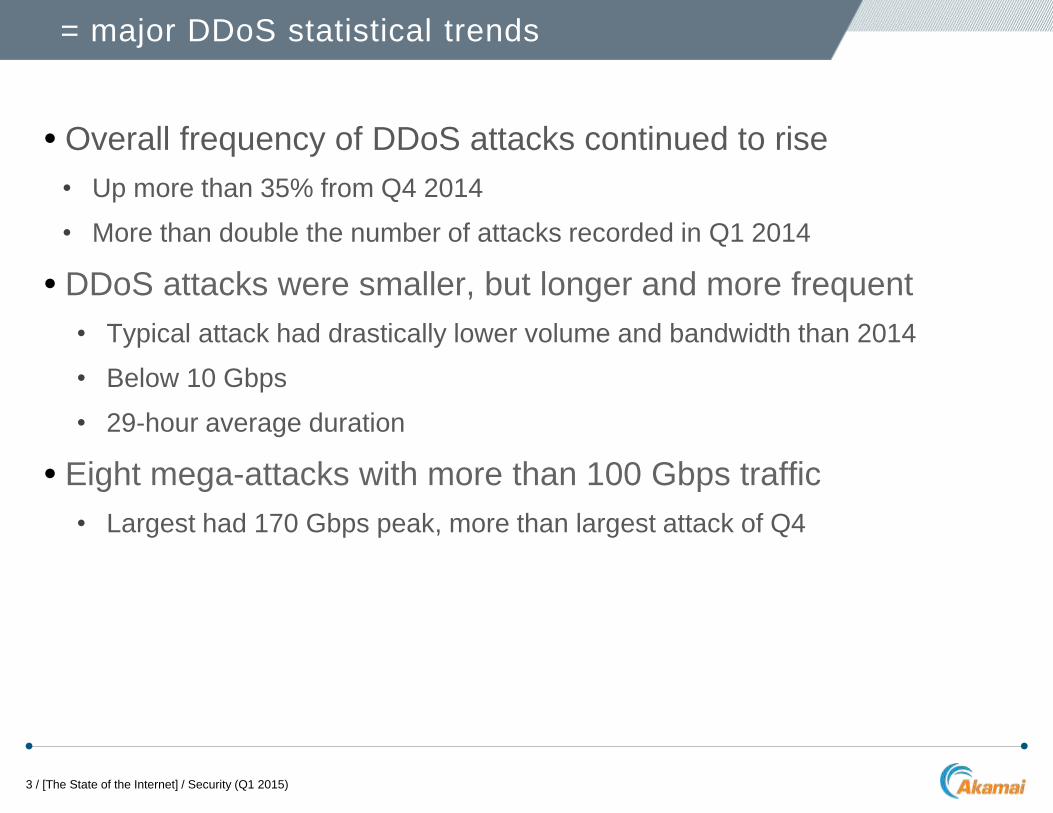
• Overall frequency of DDoS attacks continued to rise
• Up more than 35% from Q4 2014
• More than double the number of attacks recorded in Q1 2014
• DDoS attacks were smaller, but longer and more frequent
• Typical attack had drastically lower volume and bandwidth than 2014
• Below 10 Gbps
• 29-hour average duration
• Eight mega-attacks with more than 100 Gbps traffic
• Largest had 170 Gbps peak, more than largest attack of Q4

= DDoS attack makeup
4 / [The State of the Internet] / Security (Q1 2015)
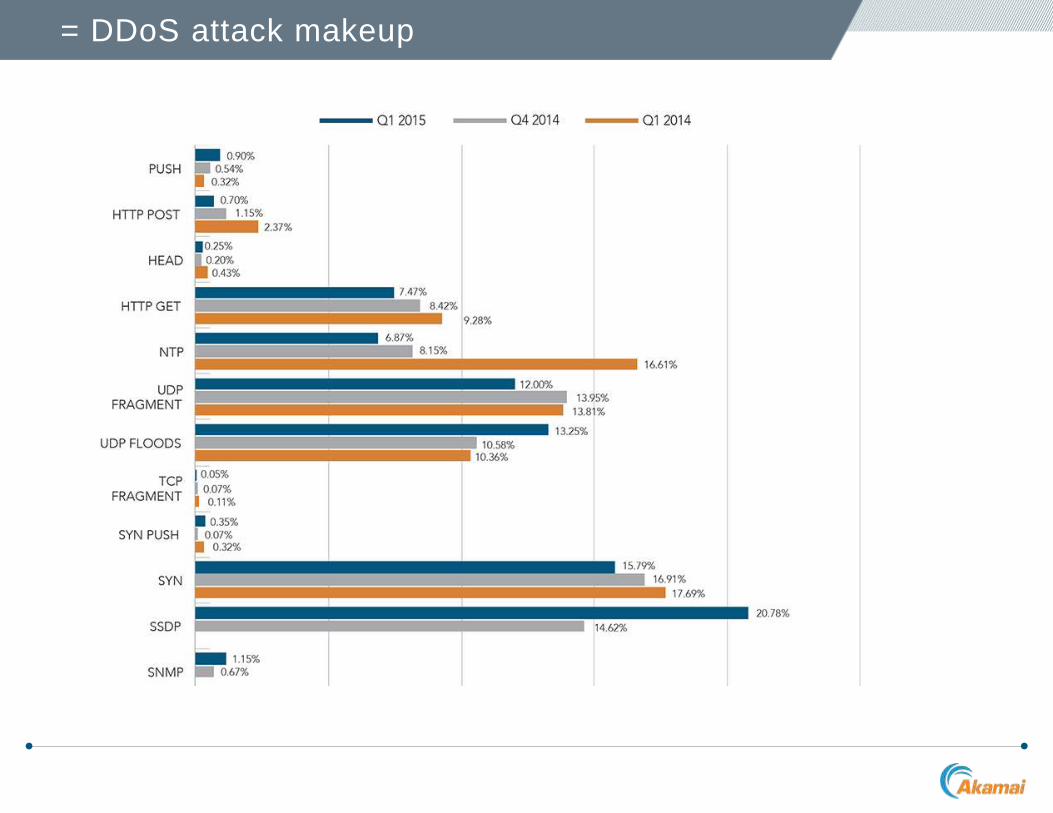
Infrastructure-layer attacks dominated DDoS methodologies,
accounting for 91% of all recorded attacks:
• SSDP attacks were the most exploited infrastructure-layer
vector, representing >20% of attacks
• SSDP attacks are a new vector first observed in Q3 2014
• Uses unsecured home Internet devices such as routers as reflectors
• SYN floods fell to second place with 16% of all attacks
• However, seven of eight mega-attacks involved SYN floods
Application-layer attacks continued to be disfavored due to the
rise of reflection-based attack methods
• Most-common application-layer attack is HTTP GET ,
accounting for 7.5% of DDoS activity
= DDoS attack makeup
= targeted industries
5 / [The State of the Internet] / Security (Q1 2015)
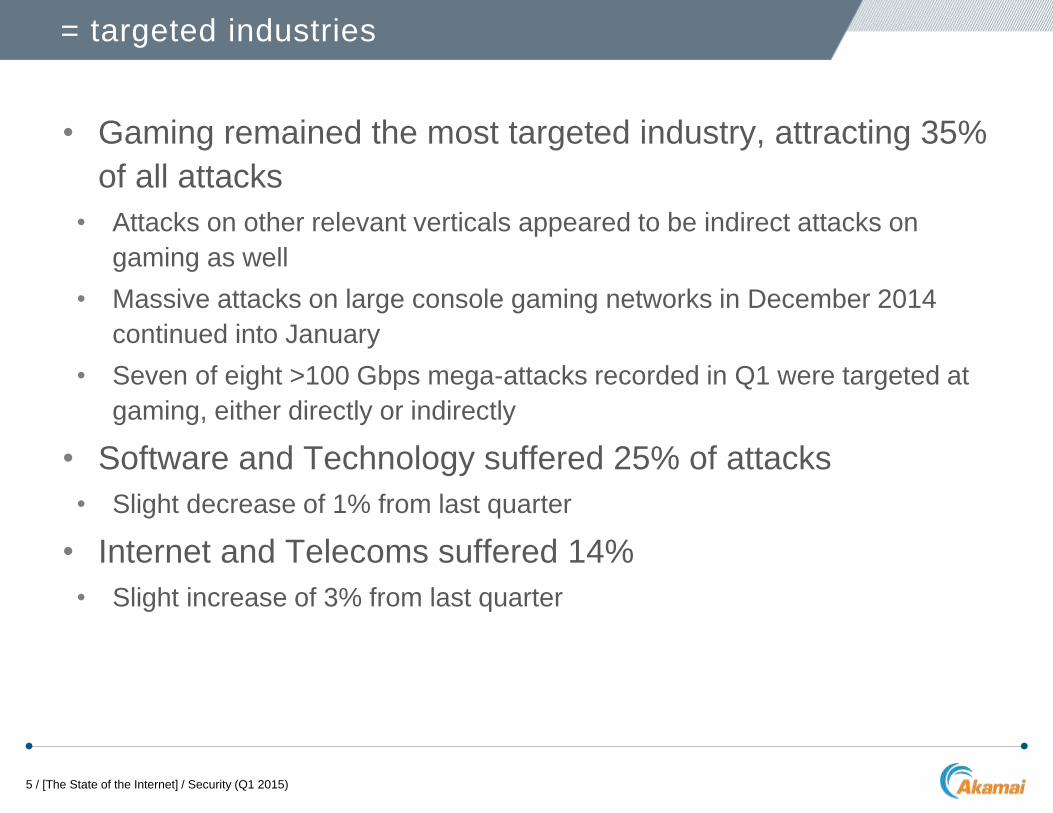
• Gaming remained the most targeted industry, attracting 35%
of all attacks
• Attacks on other relevant verticals appeared to be indirect attacks on
gaming as well
• Massive attacks on large console gaming networks in December 2014
continued into January
• Seven of eight >100 Gbps mega-attacks recorded in Q1 were targeted at
gaming, either directly or indirectly
• Software and Technology suffered 25% of attacks
• Slight decrease of 1% from last quarter
• Internet and Telecoms suffered 14%
• Slight increase of 3% from last quarter
• China continued to top the list of DDoS source countries
• Accounted for 23% of DDoS traffic
• Substantial increase from 18% in Q4
• Germany was the second-largest source of DDoS traffic
• 17% of recorded DDoS traffic originated from Germany
• Substantial increase from 12% last year
• USA fell to third place
• Accounted for just 12% of DDoS traffic in Q1 2015
• Dramatic decrease from 32% in Q4
• Decreases in percentages do not represent a drop in DDoS
traffic from these countries
• DDoS traffic sources have increasingly diversified – other countries are
producing more DDoS traffic, rather than the US producing less
= source countries
6 / [The State of the Internet] / Security (Q1 2015)
= web application (non-DDoS) attacks
7 / [The State of the Internet] / Security (Q1 2015)
Akamai collected and analyzed data from the KONA Web
Application Firewall service. This data focused on web
application attacks and their patterns:
• More than 52 million SQL injection attacks observed, accounting for 29% of
attacks
•Two campaigns against travel and hospitality companies were a main
contributor
• Local File Inclusion (LFI) accounted for 66% of web application attacks
• Primarily resulting from massive volumetric campaign against two
large retailers
• 63% of LFI attacks observed during week 12 alone
• More than 50% of all attack IPs originated from the US
• Retail and Media/Entertainment industries were subjected to
the greatest number of attacks
Download the Q1 2015 State of the Internet Security Report
• The Q1 2015 report covers:
⁄ Analysis of DDoS web application attack trends
⁄ Bandwidth (Gbps) and volume (Mpps) statistics
⁄ Year-over-year and quarter-by-quarter analysis
⁄ Attack frequency, size, types and sources
⁄ Security implications of the transition to IPv6
⁄ Mitigating the risk of website defacement and domain hijacking
⁄ DDoS techniques that maximize bandwidth, including booter/stresser
sites
⁄ Analysis of SQL injection attacks as a persistent and emerging threat
= Q1 2015 State of the Internet –Security Report
9 / [The State of the Internet] / Security (Q1 2015)

• StateoftheInternet.com, brought to you by Akamai,
serves as the home for content and information intended to
provide an informed view into online connectivity and
cybersecurity trends as well as related metrics, including
Internet connection speeds, broadband adoption, mobile
usage, outages, and cyber-attacks and threats.
• Visitors to www.stateoftheinternet.com can find current and
archived versions of Akamai’s State of the Internet
(Connectivity and Security) reports, the company’s data
visualizations, and other resources designed to put context
around the ever-changing Internet landscape.
= about stateoftheinternet.com
10 / [The State of the Internet] / Security (Q1 2015)


![Worm DDos Spam - SecurityCN.net · CNCERT/CC CNCERT/CC CNCERTCC_TR_2005-001(Draft) Worm DDos Spam Phishing Spyware Botnet [1] Bot DDos DDos Bot: ±Robo Bot](https://img.pdfslide.net/doc/110x75/5c040e7609d3f203258dac36/worm-ddos-spam-cncertcc-cncertcc-cncertcctr2005-001draft-worm-ddos-spam.jpg)