Embed Size (px)
Citation preview
MERGERS & ACQUISITIONS REVIEWREUTERS / Lucas Jackson
MERGERS & ACQUISITIONS REVIEWFINANCIAL ADVISORS
First Half 2015
Any New Zealand Involvement Announced (AD39)
Any New Zealand Involvement Completed (AF46)
Japan M&A
Americas Deals Intelligence
M&A Financial Advisory ReviewFirst Half 2015 | Mergers & Acquisitions | Financial Advisors
1
Japan Deals Intelligence
Any European Involvement Announced (AD21) 17
17
18
18
Global M&A
Global Deals Intelligence
Scorecard: Worldwide Announced M&A
Scorecard: Worldwide Completed M&A
Top Fifteen Worldwide Announced Deals
Any German Involvement Announced (AD35)
Americas M&A Any Spanish Involvement Completed (AF41)
Any UK Involvement Announced (AD32)
Any UK Involvement Completed (AF39)
Any European Involvement Completed (AF3) 10
12
12
Any French Involvement Announced (AD33)
Worldwide Completed (AF1)
Top Ten Japanese Involvement Announced Deals
19
Any French Involvement Completed (AF40)
Any Japanese Involvement Completed (AF23)
19
Any Spanish Involvement Announced (AD34)3
3
6
6
11
12
11
Worldwide Announced (AD1)
20
10
18
Any Japanese Involvement Announced (AD19)
2
2
Table of Contents
1
20
2
11
Fairness Opinion Rankings
Worldwide Announced Fairness Opinion
11
Any Americas Involvement Announced (AD49) 7
US Target Completed (AF2)
6
US Target Announced (AD2) 7
Any Americas Involvement Completed (AF55)
13
12
Any Italian Involvement Announced (AD36)
Any Nordic Involvement Announced (AD37)
Any Italian Involvement Completed (AF43)
20
20
Top Ten US Announced Deals20
15
Mergers & Acquisitions Criteria Summary
Any EMEA Involvement Announced (AD47)
European Deals Intelligence
Any Benelux Involvement Announced (AD40)
8
8
7
Any German Involvement Completed (AF42)
16
Any Canadian Involvement Completed (AF49)
Any Australian Involvement Completed (AF31)
10
9
Any Canadian Involvement Announced (AD42)
16
Any Asia (ex-Japan) Involvement Completed (AF32)
Any EMEA Involvement Completed (AF53)
Any Benelux Involvement Completed (AF47)
10
Any US Involvement Completed (AF48)
Top Ten Any Asia (ex-Japan) Involvement Announced Deals 15
7
8
9EMEA M&A
Any US Involvement Announced (AD41)
Any Japanese Announced Fairness Opinion13
Asia Pacific (ex-Japan) M&A
Asia Pacific (ex-Japan) Deals Intelligence
20
21
21
22
21
20
13
13
Regional Contacts
Criteria Summary
Any EMEA Announced Fairness Opinion
14
Any Asia Pacific Announced Fairness Opinion
8
16
16Any Australian Involvement Announced (AD24)
9
Top Ten European Involvement Announced Deals
Thomson Reuters Soultions for the Deal the Deal Making Community
Any Asia (ex-Japan) Involvement Announced (AD25)
20
15
Worldwide Announced Fairness Opinion
Any Americas Announced Fairness Opinion
Any USAnnounced Fairness Opinion
14
Any Nordic Involvement Completed (AF44)
https://www.thomsonone.com
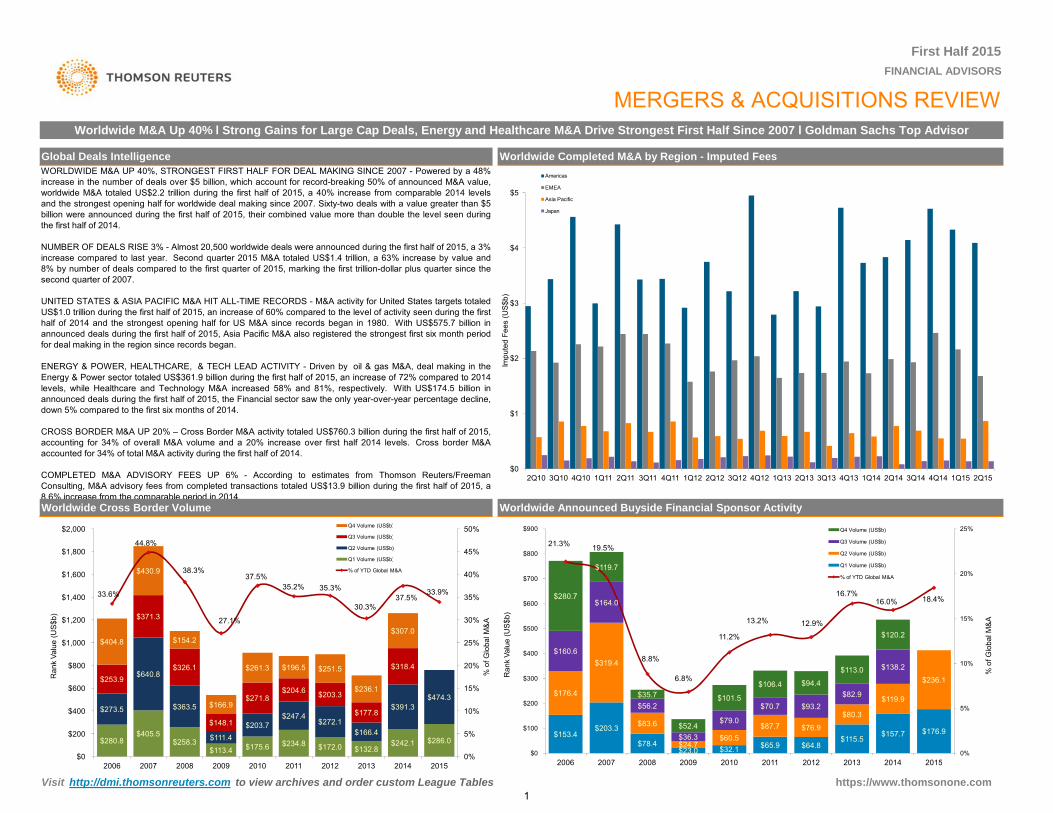
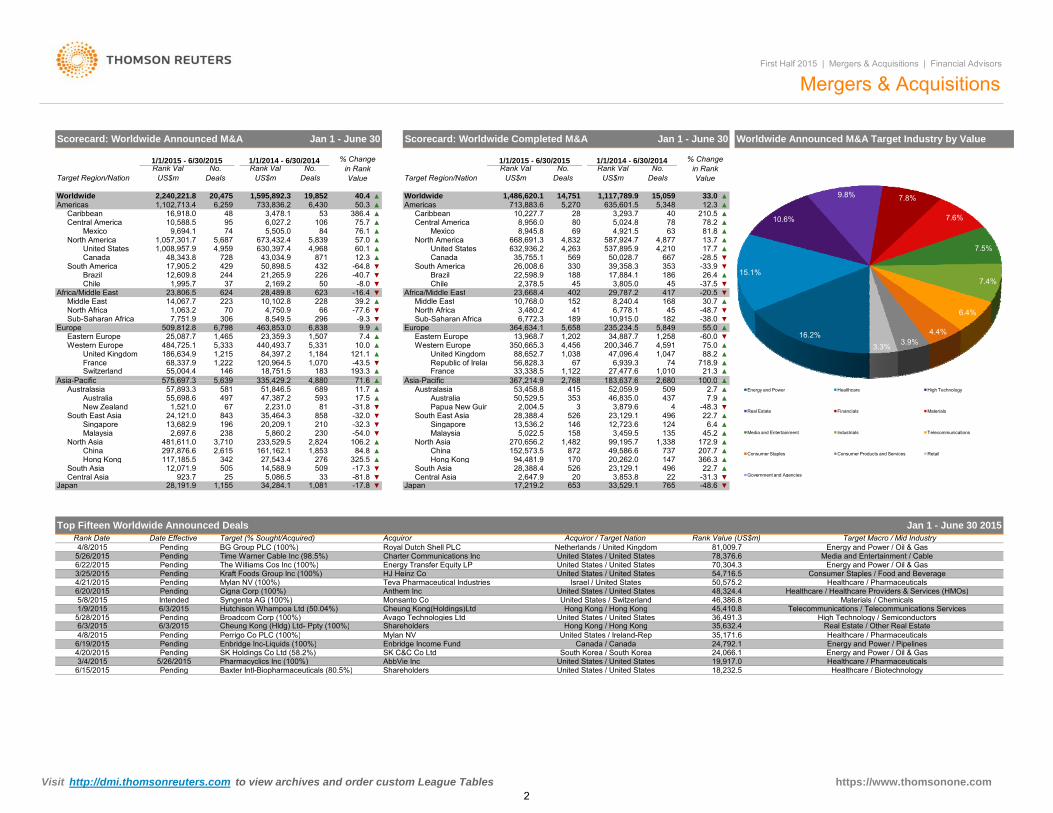
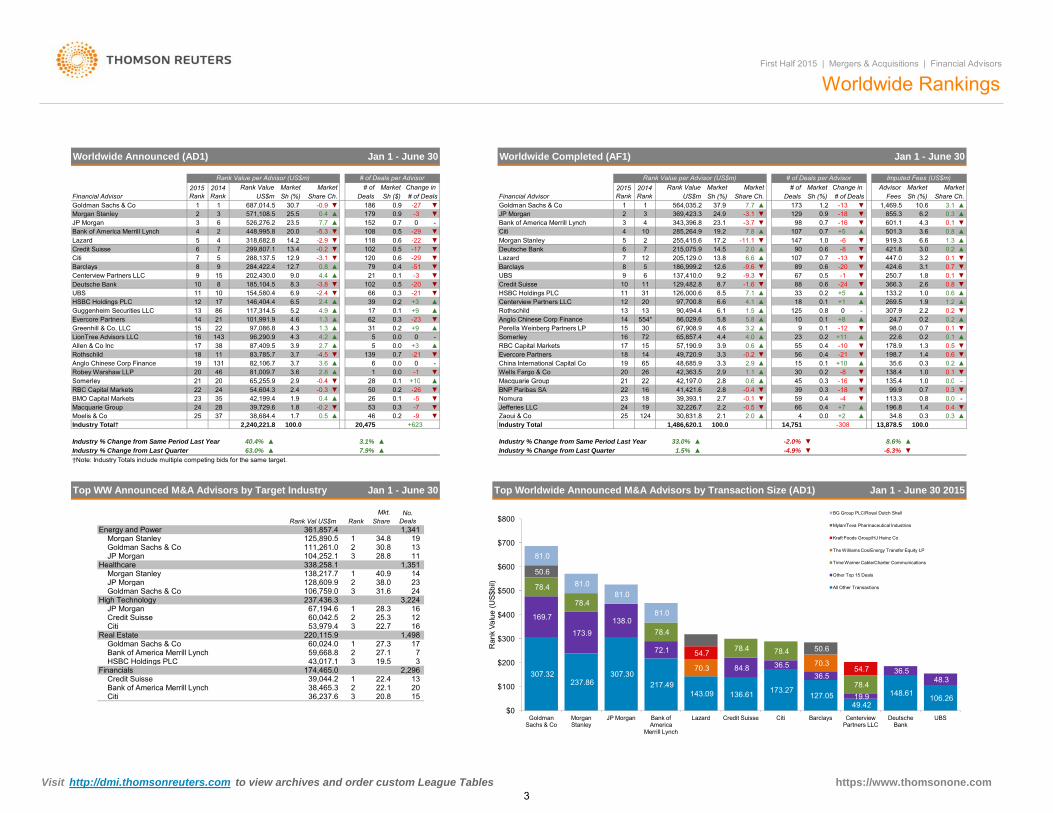
WORLDWIDE M&A UP 40%, STRONGEST FIRST HALF FOR DEAL MAKING SINCE 2007 - Powered by a 48%increase in the number of deals over $5 billion, which account for record-breaking 50% of announced M&A value,worldwide M&A totaled US$2.2 trillion during the first half of 2015, a 40% increase from comparable 2014 levelsand the strongest opening half for worldwide deal making since 2007. Sixty-two deals with a value greater than $5billion were announced during the first half of 2015, their combined value more than double the level seen duringthe first half of 2014.
NUMBER OF DEALS RISE 3% - Almost 20,500 worldwide deals were announced during the first half of 2015, a 3% increase compared to last year. Second quarter 2015 M&A totaled US$1.4 trillion, a 63% increase by value and8% by number of deals compared to the first quarter of 2015, marking the first trillion-dollar plus quarter since thesecond quarter of 2007.
UNITED STATES & ASIA PACIFIC M&A HIT ALL-TIME RECORDS - M&A activity for United States targets totaledUS$1.0 trillion during the first half of 2015, an increase of 60% compared to the level of activity seen during the firsthalf of 2014 and the strongest opening half for US M&A since records began in 1980. With US$575.7 billion inannounced deals during the first half of 2015, Asia Pacific M&A also registered the strongest first six month periodfor deal making in the region since records began.
ENERGY & POWER, HEALTHCARE, & TECH LEAD ACTIVITY - Driven by oil & gas M&A, deal making in theEnergy & Power sector totaled US$361.9 billion during the first half of 2015, an increase of 72% compared to 2014
Worldwide M&A Up 40% l Strong Gains for Large Cap Deals, Energy and Healthcare M&A Drive Strongest First Half Since 2007 l Goldman Sachs Top Advisor
Global Deals Intelligence Worldwide Completed M&A by Region - Imputed Fees
First Half 2015 FINANCIAL ADVISORS
MERGERS & ACQUISITIONS REVIEW
$2
$3
$4
$5
Impu
ted
Fees
(US
$b)
Americas
EMEA
Asia Pacific
Japan
e gy & o e secto tota ed US$36 9 b o du g t e st a o 0 5, a c ease o % co pa ed to 0levels, while Healthcare and Technology M&A increased 58% and 81%, respectively. With US$174.5 billion inannounced deals during the first half of 2015, the Financial sector saw the only year-over-year percentage decline,down 5% compared to the first six months of 2014.
CROSS BORDER M&A UP 20% – Cross Border M&A activity totaled US$760.3 billion during the first half of 2015,accounting for 34% of overall M&A volume and a 20% increase over first half 2014 levels. Cross border M&Aaccounted for 34% of total M&A activity during the first half of 2014.
COMPLETED M&A ADVISORY FEES UP 6% - According to estimates from Thomson Reuters/FreemanConsulting, M&A advisory fees from completed transactions totaled US$13.9 billion during the first half of 2015, a8.6% increase from the comparable period in 2014.Worldwide Cross Border Volume Worldwide Announced Buyside Financial Sponsor Activity
$153.4$203.3
$78.4$23.0 $32.1 $65.9 $64.8
$115.5$157.7 $176.9
$176.4
$319.4
$83.6
$24.7$60.5
$87.7 $76.9
$80.3
$119.9
$236.1
$160.6
$164.0
$56.2
$36.3
$79.0
$70.7 $93.2$82.9
$138.2
$280.7
$119.7
$35.7
$52.4
$101.5
$106.4 $94.4
$113.0
$120.2
21.3% 19.5%
8.8%
6.8%
11.2%
13.2% 12.9%
16.7%16.0% 18.4%
0%
5%
10%
15%
20%
25%
$0
$100
$200
$300
$400
$500
$600
$700
$800
$900
2006 2007 2008 2009 2010 2011 2012 2013 2014 2015
% o
f Glo
bal M
&A
Ran
k Va
lue
(US
$b)
Q4 Volume (US$b)
Q3 Volume (US$b)
Q2 Volume (US$b)
Q1 Volume (US$b)
% of YTD Global M&A
$0
$1
2Q10 3Q10 4Q10 1Q11 2Q11 3Q11 4Q11 1Q12 2Q12 3Q12 4Q12 1Q13 2Q13 3Q13 4Q13 1Q14 2Q14 3Q14 4Q14 1Q15 2Q15
$280.8$405.5
$258.3$113.4 $175.6 $234.8 $172.0 $132.8
$242.1 $286.0
$273.5
$640.8
$363.5
$111.4$203.7
$247.4$272.1
$166.4
$391.3$474.3
$253.9
$371.3
$326.1
$148.1
$271.8$204.6 $203.3
$177.8
$318.4
$404.8
$430.9
$154.2
$166.9
$261.3 $196.5 $251.5
$236.1
$307.0
33.6%
44.8%
38.3%
27.1%
37.5%35.2% 35.3%
30.3%37.5%
33.9%
0%
5%
10%
15%
20%
25%
30%
35%
40%
45%
50%
$0
$200
$400
$600
$800
$1,000
$1,200
$1,400
$1,600
$1,800
$2,000
% o
f Glo
bal M
&A
Ran
k Va
lue
(US
$b)
Q4 Volume (US$b)
Q3 Volume (US$b)
Q2 Volume (US$b)
Q1 Volume (US$b)
% of YTD Global M&A
https://www.thomsonone.com Visit http://dmi.thomsonreuters.com to view archives and order custom League Tables
2006 2007 2008 2009 2010 2011 2012 2013 2014 20152006 2007 2008 2009 2010 2011 2012 2013 2014 2015
1
Western Europe
Mergers & Acquisitions
Jan 1 - June 30 Scorecard: Worldwide Completed M&A Jan 1 - June 30
First Half 2015 | Mergers & Acquisitions | Financial Advisors
1/1/2015 - 6/30/2015
21,265.9
575 697 3
Worldwide6,259
No. Deals
No. Deals
Rank Val US$m
1,117,789.9
1/1/2015 - 6/30/2015 1/1/2014 - 6/30/2014
8410,588.5
5,505.074106
1,102,713.4
6,027.2
733,836.2
Target Region/Nation
Mexico
440,493.7186,634.9
37
14,067.7
2,169.2
630,397.4
50,898.5
673,432.4
Rank Val US$m
43,034.9United States
Caribbean
9,694.1
Brazil
Worldwide 20,4752,240,221.8
1,222Switzerland
North America
484,725.1
France
Chile 1,995.7
Asia Pacific
United Kingdom
728
Middle East
7,751.9Sub-Saharan Africa
Canada
Western Europe25,087.7
509,812.8
23,806.5
429244
68,337.9146
1,215
12,609.8
Americas16,918.0
5 639
95
5,687
Central America
South America48,343.8
1,465
1,008,957.9
48
1,057,301.7
17,905.2
4,959
193.3335 429 2 4 880
18,751.571 6
28,489.8223
Europe
70
Africa/Middle East
4,750.9306
624
463,853.0
North AfricaMiddle East
9.96,798296
10,102.81,063.2
8,549.5 -9.3
183
Eastern Europe
1,070
6,838
84,397.2120,964.5
55,004.4
5,3315,33323,359.3
▲
▲
228
10.0
-77.6
1,507
66
1,184-43.5
▼
▲United Kingdom121.1
▲7.4Europe
56,828.3Republic of Irelan▼
350,665.3
▲France▲
Eastern Europe
88,652.767
Asia Pacific33,338.5
367 214 9
4,591
2 680
1,038
100 0
34,887.7
1,1222 768
5,849
6,939.327,477.6 1,010
1,202200,346.7
▲-60.0
▲
4,456
235,234.5
21.3
5,658▼
1,047
45182
47,096.4
1,258
-38.0
183 637 6
402
364,634.1 55.013,968.7
45
6,778.1
29,787.2
41
417
3,480.28,240.4
▼Sub-Saharan AfricaNorth Africa
30.7
189 10,915.0
168▲ 152
▼
6,772.3
10,768.0623
Chile-16.4 ▼ 23,668.439.2
Africa/Middle East
871
2,378.5226
12.3 Canada 35,755.1▲26,008.6
Brazil 22,598.9
▲
50
5,8394,968
▼-40.7
-8.0▼
▲
432 -64.8
15,05914,751
Caribbean386.4
▲
60.1
50.340.4
635,601.5 12.3
78.27840
33.05,348
5,024.83,293.73,478.1
1,595,892.3
Rank Val US$m
536,430
19,852
No. Deals
28713,883.6▲
80Central America▲
5,270▲
Americas
76.1 Mexico668,691.3
6357.0 4,832
▲4,877
1,486,620.1
Rank Val US$m
% Change in Rank Value
South America
4,263
330
75.769
Target Region/Nation
North America
45
50,028.7
No. Deals
8,956.010,227.7
8,945.8 4,921.5
632,936.2
188
569United States 537,895.9
3,805.0
▼4,210
▼
-48.7▲▼▼
▼▼
17,884.135339,358.3
26.4
-20.5-37.5
186 ▲
81.813.7
-28.5
210.5
-33.9
▲
17.7667
1/1/2014 - 6/30/2014
587,924.7 ▲▲
▲▲
% Change in Rank Value
▲▲
Worldwide Announced M&A Target Industry by ValueScorecard: Worldwide Announced M&A
74▲
718.988.275.0 ▲
▲▲
16.2%
15.1%
10.6%
9.8% 7.8%
7.6%
7.5%
7.4%
6.4%
4.4%3.9%3.3%
South East Asia
South Korea / South Korea 24,066.1
Pending
575,697.3
6/3/2015
5,086.5
Energy Transfer Equity LP
Target (% Sought/Acquired)Rank Date Date Effective
Singapore
581
Pending
Australia
Hong Kong
1,155
55,698.6
24,121.0
4/8/2015
Asia-Pacific
2,697.6
49757,893.3
13,682.9843196
5,639
Pending
-17.3509325.5
Malaysia
2,615
6/3/2015Pending United States / United States
5/8/20156/3/2015
Pending
1/9/2015
Pending
5/26/2015
3/25/2015
Pending6/19/2015
36,491.3
Enbridge Inc-Liquids (100%)35,171.64/8/2015
Hong Kong / Hong KongShareholders
Pending
Mylan NV
SK Holdings Co Ltd (58.2%)24,792.1
Shareholders
SK C&C Co Ltd
Anthem Inc
Avago Technologies Ltd
Enbridge Income FundUnited States / Ireland-Rep
46,386.8United States / Switzerland
The Williams Cos Inc (100%)
45,410.8
48,324.4
Cheung Kong(Holdings)Ltd
United States / United StatesBG Group PLC (100%)
Hong Kong / Hong KongBroadcom Corp (100%)
Perrigo Co PLC (100%)
Kraft Foods Group Inc (100%)
35,632.4
Monsanto Co
50,575.2
▼526
Cheung Kong (Hldg) Ltd- Ppty (100%)
34,284.1
5/28/2015
Time Warner Cable Inc (98.5%)70,304.354,716.5
Netherlands / United Kingdom
HJ Heinz Co
▼
Hutchison Whampoa Ltd (50.04%)
AbbVie Inc
81,009.7Charter Communications Inc
765
United States / United States
Syngenta AG (100%)
United States / United States
United States / United StatesMylan NV (100%)
Pending
12,071.9South AsiaCentral Asia -81.8
Pending
6/22/2015
6/20/2015
28,388.4
▼
Australasia
1,853276
161,162.1
505
2,231.0 Papua New Guin▼
South Asia 28,388.4
-32.3
▼
North Asia
94,481.9ChinaHong Kong
13,536.2
270,656.2
23,129.1
▼
20,262.0872
158
81
230 Malaysia
▼
▼
17.5
210858
20,209.1
-31.867
North AsiaChina 297,876.6
481,611.0
117,185.5
1,081
14,588.9
233,529.5
923.7
2,824238
3,710
25
27,543.4342
▼2,647.9
28,191.9Japan33
▲
Top Fifteen Worldwide Announced Deals
3,853.8Japan
5,860.2
335,429.2 4,880
593
-54.0
-32.0
47,387.2
35,464.3
68971.6
South East Asia
11.750,529.5
▲Australasia
▲53,458.8
52632,004.5
353
Asia-Pacific 367,214.9415▲51,846.5
78,376.6
Central Asia17,219.2
20
Rank Value (US$m)Acquiror
Australia
496
▲
-17.8
▲84.8106.2 ▲
-48.633,529.122
99,195.7
366.322.7
653
146 6.4
170
-31.3
1,3381,482
Singapore5,022.5
124
152,573.5▲
207.749,586.6
12,723.6
147737
45.2172.9
22.723,129.1 496
2,680 100.0
1353,459.5
46,835.0
2,768
43,879.6
2.77.9437
509183,637.6
52,059.9
▲
▲
Jan 1 - June 30 2015
Teva Pharmaceutical Industries
Intended
4/21/2015
4/20/2015Canada / Canada
Royal Dutch Shell PLCAcquiror / Target Nation
Cigna Corp (100%)Israel / United States
Consumer Staples / Food and Beverage
Materials / Chemicals
Healthcare / Pharmaceuticals
Real Estate / Other Real Estate
Telecommunications / Telecommunications Services
Healthcare / Healthcare Providers & Services (HMOs)
High Technology / Semiconductors
Healthcare / Pharmaceuticals
-48.3
▲▲
▲▼▲
▲▲
Target Macro / Mid Industry
1,521.0New Zealand
Baxter Intl-Biopharmaceuticals (80.5%)3/4/2015
6/15/20155/26/2015Pending
Pharmacyclics Inc (100%) United States / United StatesUnited States / United States
19,917.018,232.5 Healthcare / Biotechnology
Energy and Power / Oil & GasMedia and Entertainment / Cable
Energy and Power / Oil & Gas
Healthcare / PharmaceuticalsEnergy and Power / PipelinesEnergy and Power / Oil & Gas
Energy and Power Healthcare High Technology
Real Estate Financials Materials
Media and Entertainment Industrials Telecommunications
Consumer Staples Consumer Products and Services Retail
Government and Agencies
Visit http://dmi.thomsonreuters.com to view archives and order custom League Tables https://www.thomsonone.com 2
Deutsche Bank
Anglo Chinese Corp FinanceRobey Warshaw LLP 20
83,785.787,409.5
3.6
▲97,086.8 4.3
2 965 255 9
3.94.3
3.782,106.781,009.7
5.21.3
8614
117,314.5
1.3
Somerley
131
Centerview Partners LLC9
1711
19
17
Greenhill & Co, LLCEvercore Partners
20
12
15
810
10
11
46
-3
-0.2
2
288,137.5CitiCredit Suisse 6
-290.6
0
▲
Worldwide Announced (AD1)
▲4.9
▼
0.89.0
3Morgan Stanley1
JP MorganGoldman Sachs & Co
▼
2.4
▲▲
-25.5
7.7
6.5
299,807.1 13.47
6
Morgan Stanley318,682.80.5
14.220.0
687,014.5
21 101,991.913
526,276.2
54.2
3.7
2.8
▲
3.61
2.7139
▲
6-21
0.0 00.7
28
▼▲
0 4▲▼
▲-4.5
0.0
0.2-80.230 0.1
45 ▼160 342 197 0 135 4 1 0 0 0▲ Macquarie Group ▲0 6+10-1 ▼1.0138.442,363.5 1.12.9 ▲
-▼
22▼20
-21▲2.9
2 826
57,190.9
3.314
China International Capital Co
21
19 48,685.9Wells Fargo & Co
35.6+100.4
▲0.115
0.2
▲0.3
178.9 ▼1.4 0.6
23▲ 0.4
22.6-10 0.5
▲0.11.3
+11▼
▼▼
▲ 0.2
198.7▲ 3.9 55
5618▼ Evercore Partners 3.349,720.9 ▼
▲0.617
65,857.43.2
RBC Capital Markets
▲16 4.4
15
1386,029.6 5.814
13
▲ 15
Rothschild
Perella Weinberg Partners LPAnglo Chinese Corp Finance 5.8
67,908.9 4.6554*
72Somerley
6.190,494.424.7
307.90.8 -
0.7 ▼10▲
1.5
30▲
0.10.2
90.2
0+8 ▲
0.2 ▼
0.1 ▼
0.61.2
-120.1
▲
98.0
0.218
▲▲
1250.197,700.8
31 8.5
2.2▲
1.01.94.16.6
▲
8.77.1
-1.6▲
0.633
▼ ▼
▲269.5+1+5 133.2
0.8-9.3
▼-1 1.8
366.388 -24
▼447.0424.6 0.7250.7
▼6.612.6
▲
▼-9.6
-13
▼▼ 0.19.2 67▼ Barclays ▼▼ 89
137,410.0▼ 0.5
0.2215,075.96.6▼ -6255,415.6 147
▼1.3▼
3.20.6 -20
▼▲
3.1
-8 421.80.60.1
▲107
9014.57612 205,129.0Lazard
285,264.9▲1.0
0.7 ▲7.8919.3
0.8
0.72.0
13.8
4 343,396.8 ▼
-11.1▲
23.1
17.2501.3601.1
107 +5
▼
▲0.7
-18129 855.3
Sh (%)
# of Deals per Advisor
First Half 2015 | Mergers & Acquisitions | Financial Advisors
-13
Market2014 Rank
24.9
Fees173
US$m
-160.9-3.1
▲564,035.2Sh (%)Share Ch.
2 337.9
369,423.3▼ ▼
7.7
Market Rank Value Market2015 Rank
Rank Value per Advisor (US$m)
▼
MarketSh (%)
# of Deals per Advisor
210
US$m DealsShare Ch.30.7
345
▼▼
0.5 CitiBank of America Merrill Lynch
-0.9
118
186
-5.3
102
-3.8
▼
21
▲108
4.4
-29
102
-2.9 0.6
0.4
0.0
▼
0 1
38Allen & Co Inc
▼
Rothschild
21
8.3
12.9
18
4.6
284,422.4
146,404.4
9
96,290.91622
LionTree Advisors LLC
UBS
Guggenheim Securities LLC
202,430.015185,104.5154,580.4
HSBC Holdings PLC
143
129,482.8
Market
Barclays 8
3
Lazard45
Bank of America Merrill Lynch
# of
19.2
179▲
▼
▼152 0.7
1
-22
12.7
23.5
7 5
4
-3.1
2 448,995.8
Rank ValueFinancial Advisor
98-3.7
1
Change in
Goldman Sachs & Co# of Deals-27
Jan 1 - June 30
0.9571,108.5 0.4 0.9
2015 Rank
Rank Value per Advisor (US$m)
1 ▼Sh ($)
Jan 1 - June 30
Worldwide Rankings
2014 RankFinancial Advisor Deals
Imputed Fees (US$m)
-0.2
JP Morgan
-2.4
65
4.05 0.0+30
6
31 0.2▼0.3
+9
110.1
6639
-
62
20
Credit Suisse
+3 Centerview Partners LLC
▼HSBC Holdings PLC
-20
17
186,999.259-3 UBS
▲12
126,000.610
▲
8
11-21
-17
▼
-51▼▼
7Deutsche Bank
0.10.20.30.5
+9-23
▲3.16.2 ▲
# of DealsMarket Advisor
▼▼
# of
Worldwide Completed (AF1)
Market
2.6
3.0
3.6
0.34.3 0.1
79120
6.9
Market
1,469.5
Change in
1.2Share Ch.Sh (%)
10.6
†Note: Industry Totals include multiple competing bids for the same target.
* tie
Jan 1 - June 30 2015
128,609.9 38.0
16
Morgan Stanley
1
16 22.732
220,115.9
Goldman Sachs & Co
25.3Credit Suisse28.3
JP Morgan
3237,436.3
138,217.7
60,042.5
JP Morgan
Industry Total†25
JP Morgan
RBC Capital Markets 2.4
39,729.6Moelis & Co 38,684.4
1.8BMO Capital MarketsMacquarie Group
1.7
42,199.454,604.3
2.965,255.9Somerley 202422
-5-0.3
1.9-26
26▲0.2
2850
13
1,341
53
Top WW Announced M&A Advisors by Target Industry
40.4%
46
Mkt.
0.5-0.2
-0.4
0.4▼▼
0.1
33.0%
32,226.739,393.1
19
16▼
▼
100.01,486,620.1
-7▼
No. Deals
+6232,240,221.8
63.0% ▲
Rank
232425
361,857.4
▲
▲20,475
Share
Top Worldwide Announced M&A Advisors by Transaction Size (AD1)
1.5%
BNP Paribas SA
▼▼
Industry % Change from Same Period Last Year
Nomura
Industry Total
Jefferies LLC18
22
-4.9%▲
0.2 -9 Zaoui & Co 30,831.8124
▲
4
-2.0%▼
2.1 2.0 ▲-0.5-0.1 ▼
2.2 ▼ 0.4
▲
+2 0.3+7
34.8
▼
▲ 196.8
14,751
8.6%
13,878.5▲
-3080.0 0.3
-▼
100.0
0.81.4
0.0▼▲
0.4113.359
0.339 0.30.7-4 ▼
45
0.4-18
▼-16▼
0.341,421.642,197.0 -135.4 1.0
99.90.0
▼-0.42.8▲ Macquarie Group ▲0.6+10 22 2.821
Goldman Sachs & CoBank of America Merrill Lynch
3
2
3
27.3
174,465.0
1
0.1
Jan 1 - June 30
20 36,237.6 3
13 39,044.238,465.3
Citi
43,017.1Financials
60,024.0
Industry % Change from Same Period Last Year
338,258.1Healthcare
Real Estate
▲
HSBC Holdings PLC
40.9
1
53,979.4
2
Citi
125,890.5
67,194.6
106,759.0
24
104,252.1
Rank Val US$mEnergy and Power
111,261.0Morgan Stanley
21
High Technology
Goldman Sachs & Co
Industry % Change from Last Quarter
37100.0
23 3528
1,351
59,668.8
15
Industry % Change from Last Quarter -6.3%
12
20.8
1,498
7 27.119.5
2,296 22.422.1
14
Credit SuisseBank of America Merrill Lynch
11
3,224
3
17
23
21
28.8
7.9%3.1%
24 31.62
30.8
1
0.3
19 34.8
▲
2.766
▼
307.32 237.86
307.30 217.49
143.09 136.61 173.27 127.05
49.42 148.61
106.26
169.7
173.9 138.0
72.1
84.8 36.5 36.5
19.9
36.5 48.3
78.4
78.4
78.4
78.4 78.4
78.4
70.3 70.3 54.7
54.7
50.6
50.6
81.0
81.0 81.0
81.0
$0
$100
$200
$300
$400
$500
$600
$700
$800
Goldman Sachs & Co
Morgan Stanley
JP Morgan Bank of America
Merrill Lynch
Lazard Credit Suisse Citi Barclays Centerview Partners LLC
Deutsche Bank
UBS
Ran
k Va
lue
(US
$bil)
BG Group PLC/Royal Dutch Shell
Mylan/Teva Pharmaceutical Industries
Kraft Foods Group/HJ Heinz Co
The Williams Cos/Energy Transfer Equity LP
Time Warner Cable/Charter Communications
Other Top 15 Deals
All Other Transactions
Visit http://dmi.thomsonreuters.com to view archives and order custom League Tables https://www.thomsonone.com 3
Jan 1 - June 302015 UP
2015 DOWN 2015EMEAAmericas
Worldwide M&A Matrix
25.0x
Japan
22.9x
Asia ex. JapanEurope
11.6x
8.8x
11.3x
16.7x20.1x
19.7x
12.0x
16.7x
14.8x
Exit Multiple Matrix - Average Rank Value / EBITDA
Canada
First Half 2015 | Mergers & Acquisitions | Financial Advisors
13.7x
11.9x
USA
9.1x
11.5x 12.7x
16.0x
Telecommunications
Real Estate
Media and Entertainment
Retail
12.9x
10.8x
12.3x
8.5x
-
28.6x 25.5x
9.2x
-
5.7x
16.0x
-
18.1x
12.8x
-
-
Industrials 13.4x12.7x
11.8x
18.1x 17.1x
World
13.7x 11.1x
16.8x
8.9x
27.6x
9.2x
12.8x
21.0x
18.3x
12.2x
UK
12.7x
5.7x
35.7x
5.9x8.2x
13.3x20.6x
13.3x 5.8x
8.8x
13.6x
16.7x
-
10.2x
-
3.8x
-6.2x
35.7x
7.8x
25.9x 23.3x24.6x
24.0x17.2x 19.6x
17.8x17.8x
19.6x16.6x 13.6x
14.0x 14.6x
14.2x14.2x19.6x
6.6x
11.4x11.4x 11.7x
12.0x4.6x
11.6x
15.8x14.4x
13.5x 13.5x
10.1x
18.0x
11.6x
12.2x
11.3x
15.0x14.8x
15.5x10.7x 15.0x
12.9x
10.1x
14.6x
7.0x26.2x
15.0x8.2x
13.8x
16.4x 19.4x5.7x
8.2x 12.3x
8.7x10.2x
10.2x 9.0x
11.4x 5.2x
15.4x
13.6x
19.7x12.6x 9.0x
7.7x
25.0x-
9.0x13.8x
9.5x
13.6x
19.8x 14.1x17.3x
19.3x 21.0x
19.8x
11.9x10.6x
9.4x
8.4x
10.5x
15.3x 9.0x
-14.4x10.7x
12.8x
15.6x 16.5x
-13.6x
13.8x
16.9x
12.9x
21.0x -
13.6x
13.5x
15.9x
11.0x
17.2x
14.6x 10.1x
9.3x
-
12.6x
22.4x11.4x10.1x 12.6x 10.9x
-14.2x
33.4x20.5x
7.5x
25.3x
14.2x
10.7x 10.1x
9.0x
12.0x
20.7x
Energy and Power
18.2x
Materials
13.2x
12.2x
12.4x
Healthcare
14.0x
High Technology
12.4x
13.7x
10.4x 9.7x
Consumer Staples
Consumer Products and Services
Bid Premium Matrix - Average Premium to 4 Week Stock Price Jan 1 - June 30
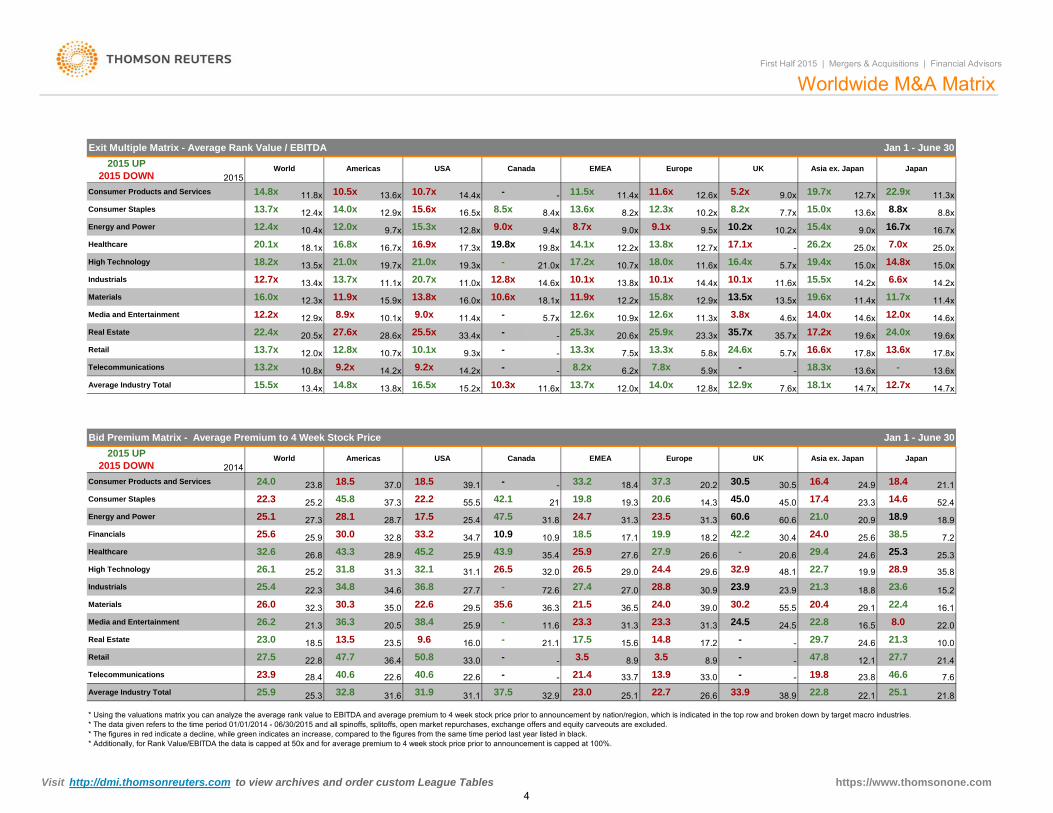
* Using the valuations matrix you can analyze the average rank value to EBITDA and average premium to 4 week stock price prior to announcement by nation/region, which is indicated in the top row and broken down by target macro industries. * The data given refers to the time period 01/01/2014 - 06/30/2015 and all spinoffs, splitoffs, open market repurchases, exchange offers and equity carveouts are excluded. * The figures in red indicate a decline, while green indicates an increase, compared to the figures from the same time period last year listed in black. * Additionally, for Rank Value/EBITDA the data is capped at 50x and for average premium to 4 week stock price prior to announcement is capped at 100%.
Consumer Staples
25.627.3
32.8
World
37.045.8
26.6
7.6
22.138.9 25.1
-19.8
21.8
8.9
23.3
23.8
21.324.6
31.3
21.5
22.824.5
15.6
24.5
33.2
27.0
34.7
35.6
27.6 29.4
24.030.4
20.624.4
30.2 20.4
- -
-8.9
25.9
18.5
31.1 32.0
17.1
29.0
22.733.0
12.1
33.925.1 22.8
21.4
33.7 13.9
-27.747.8
46.6
29.7
Average Industry Total
23.5
31.314.8
27.4
17.217.531.3
9.6
30.9
2015 UP 2015 DOWN
20.521.3
26.8
Financials
24.0
13.8x
Retail
26.0
31.8
8.035.0 36.5
36.3
34.6
31.3
34.8
30.322.325.425.2
40.6
23.0
22.8
13.5
26.1
32.8
Media and Entertainment
32.3
Telecommunications 23.9
Materials
26.2
47.7
25.9
Energy and Power
25.9
Average Industry Total
32.6
18.5
High Technology
Industrials
28.4
27.5
25.3
Canada
22.3
Healthcare
Consumer Products and Services
28.9
23.8
37.325.1
25.2
43.3
28.1
18.5
45.2
30.028.7
Americas
39.1
17.5
42.1
USA
11.6x15.2x 10.3x
-18.5
55.5
31.825.4
43.910.9
47.5
10.9
35.4
12.7x
18.4
25.3
20.9
25.3
38.5
18.9
24.6
7.225.6
18.9
19.3
12.0x 14.0x
30.5
23.3
37.3
14.6
Japan
17.4
Asia ex. Japan
21.0
20.2 24.930.5
60.6
16.4
52.4
EMEA
33.2
25.9
21 20.6
42.218.219.931.3
26.6
60.624.7
45.0
32.9
-
23.514.3
Europe
12.8x
24.0
28.8
39.0
29.6
27.9
31.9
23.3
-
23.9
16.0
22.7
55.5
3.5-
22.622.6
-
37.5
50.836.4
21.3
23.032.9
3.5
23.9
38.4
22.6
36.8
-
11.6
27.7
29.5
21.1
25.9
28.948.126.5
22.4
16.5
32.1
72.6
26.5
-
-
15.2
21.1
16.1
23.6
29.1
40.6 21.4
18.8
36.3
33.0
7.6x12.9x 14.7x18.1x 14.7x
2014
22.2
13.4x
18.419.8
13.7x
Real Estate 10.0
31.6 31.1
- -
19.9
22.0
35.8
16.5x
45.0
UK
-
14.8x15.5x
Visit http://dmi.thomsonreuters.com to view archives and order custom League Tables https://www.thomsonone.com 4
First Half 2015 | Mergers & Acquisitions | Financial Advisors
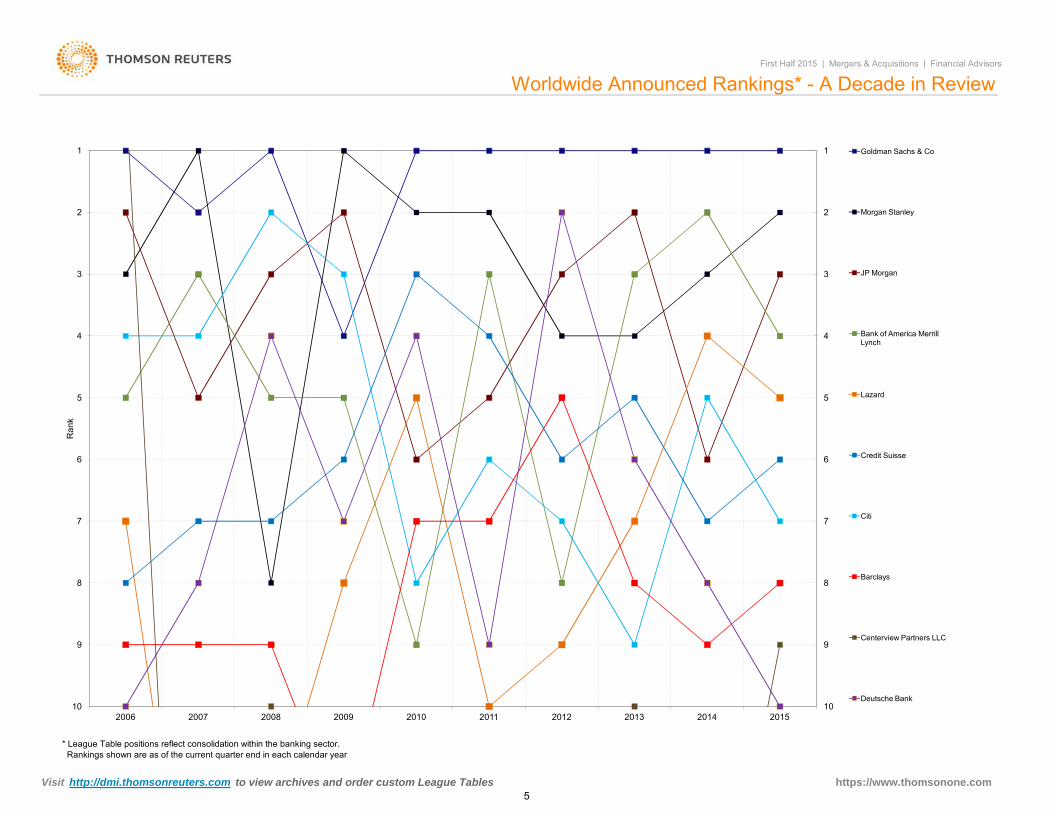
Worldwide Announced Rankings* - A Decade in Review
1
2
3
4
1
2
3
4
Goldman Sachs & Co
Morgan Stanley
JP Morgan
Bank of America Merrill Lynch
* League Table positions reflect consolidation within the banking sector. Rankings shown are as of the current quarter end in each calendar year
5
6
7
8
9
102006 2007 2008 2009 2010 2011 2012 2013 2014 2015
5
6
7
8
9
10
Ran
k
Lazard
Credit Suisse
Citi
Barclays
Centerview Partners LLC
Deutsche Bank
Visit http://dmi.thomsonreuters.com to view archives and order custom League Tables https://www.thomsonone.com 5
Consumer StaplesCenterview Partners LLC 54,716.5 1*
Goldman Sachs & Co 4,699.0 3
66,288.5
US Announced Advisors by Target Industry Jan 1 - June 30 2015Americas Deals Intelligence
Healthcare
Energy and Power
High Technology
Media and Entertainment
Goldman Sachs & Co
LionTree Advisors LLCMorgan Stanley
Rank Val (US$m)253,856.9 103,446.199,304.4Morgan Stanley
JP Morgan
Credit SuisseCiti
BarclaysLazardCiti
JP Morgan
92,755.5155,389.3 100,517.884,988.942,397.2
125,566.3 58,866.756,942.647,404.6
12
1
Rank
123
Mkt.
467
No. Deals
39.115 7
7
900 27.33
29
8 10
83.14
6
76.8
448 8
Share
40.8
37.8345.4
36.5
120,087.8 99,780.492,234.783,398.1
23
1Goldman Sachs & Co
17
334 64.7
Americas M&AFirst Half 2015 | Mergers & Acquisitions | Financial Advisors
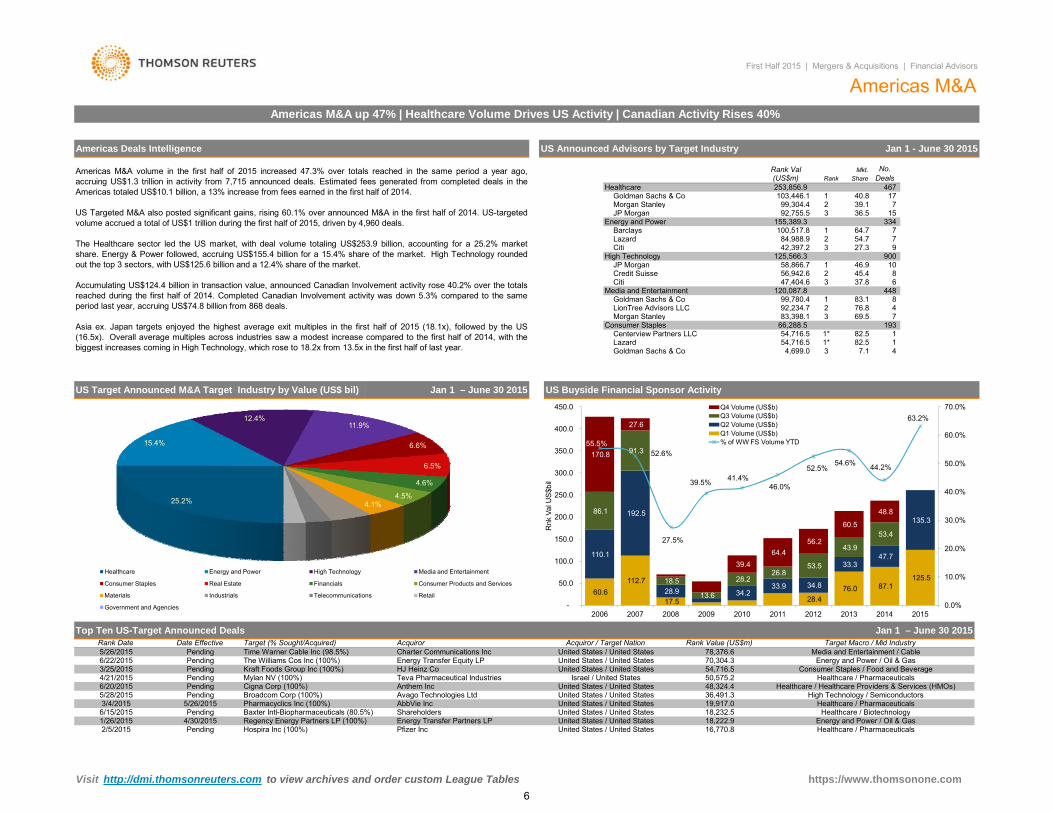
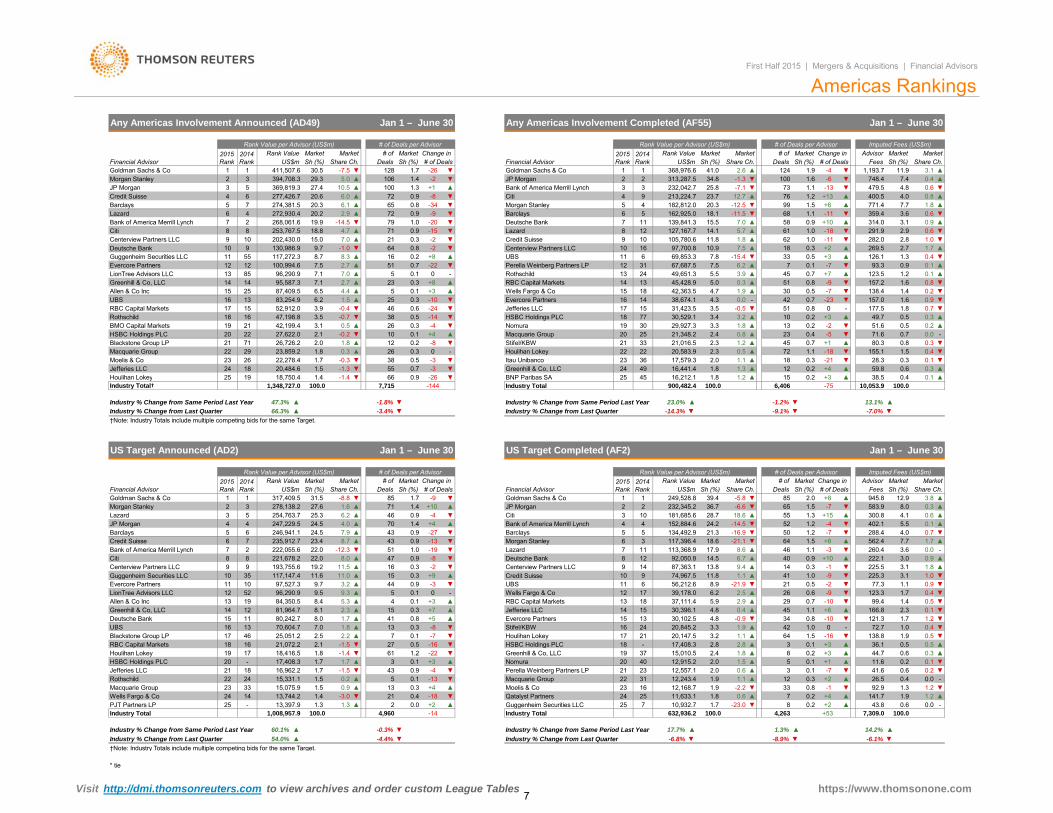
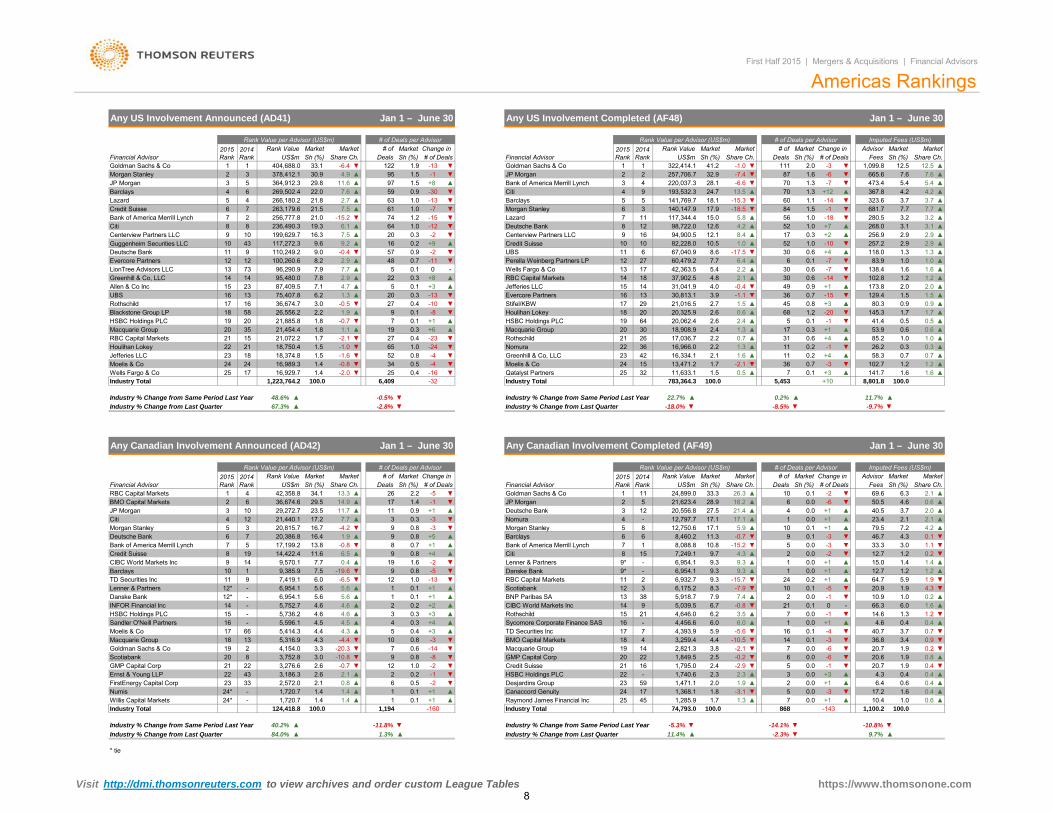
Americas M&A up 47% | Healthcare Volume Drives US Activity | Canadian Activity Rises 40%
7 54.7
Americas M&A volume in the first half of 2015 increased 47.3% over totals reached in the same period a year ago,accruing US$1.3 trillion in activity from 7,715 announced deals. Estimated fees generated from completed deals in theAmericas totaled US$10.1 billion, a 13% increase from fees earned in the first half of 2014.
US Targeted M&A also posted significant gains, rising 60.1% over announced M&A in the first half of 2014. US-targetedvolume accrued a total of US$1 trillion during the first half of 2015, driven by 4,960 deals.
The Healthcare sector led the US market, with deal volume totaling US$253.9 billion, accounting for a 25.2% marketshare. Energy & Power followed, accruing US$155.4 billion for a 15.4% share of the market. High Technology roundedout the top 3 sectors, with US$125.6 billion and a 12.4% share of the market.
Accumulating US$124.4 billion in transaction value, announced Canadian Involvement activity rose 40.2% over the totalsreached during the first half of 2014. Completed Canadian Involvement activity was down 5.3% compared to the sameperiod last year, accruing US$74.8 billion from 868 deals.
Asia ex. Japan targets enjoyed the highest average exit multiples in the first half of 2015 (18.1x), followed by the US (16.5x). Overall average multiples across industries saw a modest increase compared to the first half of 2014, with thebiggest increases coming in High Technology, which rose to 18.2x from 13.5x in the first half of last year.
46.9
7 69.5
1 4 7.1
82.5 1 Lazard 54,716.5 1* 82.5
193
US Target Announced M&A Target Industry by Value (US$ bil) Jan 1 – June 30 2015
Acquiror / Target NationTop Ten US-Target Announced Deals Jan 1 – June 30 2015
Target Macro / Mid IndustryTarget (% Sought/Acquired) Acquiror Rank Value (US$m)
Pending78,376.6
HJ Heinz CoUnited States / United States
1/26/2015
PendingMylan NV (100%)Pending
3/4/2015
Cigna Corp (100%)
Shareholders
Energy Transfer Equity LP
Date Effective
3/25/2015 Kraft Foods Group Inc (100%)
Pending Time Warner Cable Inc (98.5%)5/26/2015Rank Date
6/22/2015 The Williams Cos Inc (100%)
Pharmacyclics Inc (100%)
4/30/2015 Regency Energy Partners LP (100%)
4/21/2015Pending
5/26/2015
Anthem Inc6/20/2015Israel / United StatesTeva Pharmaceutical Industries
United States / United States36,491.348,324.4
United States / United StatesAbbVie Inc
United States / United States18,232.5United States / United States18,222.9
19,917.0
Energy Transfer Partners LP
Pending
Baxter Intl-Biopharmaceuticals (80.5%)
US Buyside Financial Sponsor Activity
Pfizer Inc
6/15/2015
16,770.8
Pending
United States / United States
2/5/2015 Pending Hospira Inc (100%)
United States / United States
United States / United States
United States / United States
5/28/2015
Charter Communications Inc
Avago Technologies LtdBroadcom Corp (100%)
Media and Entertainment / CableEnergy and Power / Oil & Gas
High Technology / Semiconductors
50,575.2Consumer Staples / Food and Beverage
Healthcare / Pharmaceuticals
70,304.354,716.5
Healthcare / Healthcare Providers & Services (HMOs)
Healthcare / Pharmaceuticals
Healthcare / PharmaceuticalsHealthcare / Biotechnology
Energy and Power / Oil & Gas
25.2%
15.4%
12.4%11.9%
6.6%
6.5%
4.6%
4.5%4.1%
Healthcare Energy and Power High Technology Media and Entertainment
Consumer Staples Real Estate Financials Consumer Products and Services
Materials Industrials Telecommunications Retail
Government and Agencies
60.6 112.7
17.5 28.4 76.0 87.1
125.5
110.1
192.5
28.9 34.2 33.9 34.8
33.3 47.7
135.3 86.1
91.3
18.5
13.6
28.2 26.8
53.5
43.9
53.4
170.8
27.6
5.0 39.4
64.4 56.2
60.5
48.8
55.5%52.6%
27.5%
39.5% 41.4%46.0%
52.5%54.6% 44.2%
63.2%
0.0%
10.0%
20.0%
30.0%
40.0%
50.0%
60.0%
70.0%
-
50.0
100.0
150.0
200.0
250.0
300.0
350.0
400.0
450.0
2006 2007 2008 2009 2010 2011 2012 2013 2014 2015
Rnk
Val
US$
bil
Q4 Volume (US$b)Q3 Volume (US$b)Q2 Volume (US$b)Q1 Volume (US$b)% of WW FS Volume YTD
https://www.thomsonone.com Visit http://dmi.thomsonreuters.com to view archives and order custom League Tables6
Deutsche Bank Centerview Partners LLC
# of Deals per Advisor
First Half 2015 | Mergers & Acquisitions | Financial Advisors
MarketMarket Change in Deals
Any Americas Involvement Completed (AF55)
MarketUS$m
# of Deals per Advisor Rank Value per Advisor (US$m)Market
Imputed Fees (US$m)
Americas Rankings
Rank Value per Advisor (US$m)2014 Rank
# ofRank Value Market2015 Rank Share Ch.
▲3.1Sh (%)
AdvisorRank ValueFinancial Advisor Sh (%) Share Ch. DealsUS$m
394,708.3 ▲30.5
Market
Jan 1 – June 30Any Americas Involvement Announced (AD49) Jan 1 – June 30
124
# ofFinancial Advisor
Market
-26 ▼
MarketSh (%) Sh (%)Sh (%) # of Deals Fees
1,193.7 11.9Share Ch.
1.9 -41 ▲41.0 2.61 368,976.6# of Deals
2015 Rank
2014 Rank
Change in
29.3 5.0Goldman Sachs & Co▼128 1.7Goldman Sachs & Co 1 411,507.6 -7.5
3▼1
Morgan Stanley3 5 369,819.3
21.42 -2 ▼ ▲748.4 0.4▼ 100479.5
7.4▼1.1▼
34.8 -1.3Bank of America Merrill Lynch 232,042.7JP Morgan
3-820.6
1.610.5
0.9▲
Citi25.827.4 73
-6106+1 ▲
2100 1.3 -7.13
313,287.5
Credit Suisse 4 6 277,426.7JP Morgan
▲0.8-13
23.7 12.7▼▼ 4.8
▲5 7 274,381.5
0.6
20.3 6.1 ▲▲ 72 ▼ 96.0
▼ Morgan Stanley 54 4.01.2 +13 ▲ 400.5213,224.7 76
1.84 182,812.0 20.3 -12.5 1.5 +6 ▲99▼Lazard 6 4 272,930.4 20.2
652.9 ▲ 72
Barclays0.9
771.4 ▲0.8 -34 7.7-9 ▼ ▼-11.5Barclays 6 5 0.6▼ 359.4
11 139,841.3 ▲ 314.0▲162,925.0
7Bank of America Merrill Lynch 7 2 268,061.6▼68 1.1 -11 3.6
▲-14.5 ▼19.9
18.1-20 ▼79 1.0 Deutsche Bank ▲
Citi 8 8 253,767.5 18.8 2.9 0.6▼4.7 291.915.5 7.0 3.1 0.90.9 +1058
12 127,167.7 14.1 5.7 1.0 -18▼0.3
▲ 6171 0.9 -15 ▼ Lazard 8
10 9 130,986.9 9.7
▼Centerview Partners LLC 9 10 202,430.0 15.0
-1.0 ▼ 6421
10-2 ▼Credit Suisse7.0 ▲ 9
0.8-2 ▼ ▼ 282.0
16 97,700.810 105,780.6 1.0 -11
10.9 7.5▲ 6211.8 1.8 2.8 1.0▲ 18 ▲
Guggenheim Securities LLC 11 55 117,272.3 8.7 UBS 112.7 1.70.3 +2 ▲ 269.5
▼ 33 1.3 0.46 69,853.3 7.8 -15.4 0.5 +3 ▲ 126.1 ▼Evercore Partners 12 12 100,994.6 7.5
16 0.2 +8 ▲2.7 ▲ 51 0.78.3 ▲
Perella Weinberg Partners LP 12-22 ▼ 31 67,687.5 0.9 0.1▼ 93.3▲ 7 0.1 -7 ▲LionTree Advisors LLC 13 85 96,290.9 7.1
7.5 6.20 -5 0.1 24 49,651.3Rothschild 13 ▲
Greenhill & Co, LLC 14 14 95,587.3 7.1 2.7 ▲7.0 ▲ 5.5 3.9 1.2 0.10.7 +7 ▲ 123.5▲ 45
0.8 -9 1.6 0.8▼ 157.2Wells Fargo & Co 15RBC Capital Markets 14
▲ 304.7 1.913 45,428.923 0.3 +8 ▲ ▲ 515.0 0.3 ▼
Allen & Co Inc 15 25 87,409.5 6.5 4.4 ▲ ▼138.425 0.35 0.1
UBS 16 13 83,254.90.5 -7
4.3 0.06.2▼
1.5 ▲+3 ▲-10 ▼ Evercore Partners 16
1.4 0.214 38,674.118 42,363.5
▼RBC Capital Markets 17 15 52,912.0 3.9 -0.4 ▼
- 42Jefferies LLC 17
1.6 0.90.7 -23 ▼ 157.0▼ 51 1.8 0.715 31,423.5 3.5 -0.5 0.8 0 - 177.5 ▼
Rothschild 18 16 47,198.8 3.546 0.6 -24 ▼
-0.7 ▼ 38 0.5 HSBC Holdings PLC 18-14 ▼ 77 30,529.1 0.5 0.3▲ 49.7▲ 10 0.2 +3 ▲BMO Capital Markets 19 21 42,199.4 3.1
3.4 3.2-4 ▼26 0.3 30 29,927.3Nomura 19 ▲
HSBC Holdings PLC 20 22 27,622.0 2.1 -0.2 ▼0.5 ▲ 3.3 1.8 0.5 0.20.2 -2 ▼ 51.6▲ 13
0.4 -5 0.7 0.0▼ 71.6Stifel/KBW 21Macquarie Group 20
▲ 452.3 1.225 21,348.210 0.1 +4 ▲ ▲ 232.4 0.8 -
Blackstone Group LP 21 71 26,726.2 2.0 1.8 ▲ ▼80.326 0.312 0.2
Macquarie Group 22 29 23,859.20.7 +1
2.3 0.51.8▲
0.3 ▲-8 ▼0 - Houlihan Lokey 22
0.8 0.322 20,583.933 21,016.5
▼Moelis & Co 23 26 22,278.4 1.7 -0.3 ▼
▲ 72Itau Unibanco 23
1.5 0.41.1 -18 ▼ 155.1▲ 18 0.3 0.136 17,579.3 2.0 1.1 0.3 -21 ▼ 28.3 ▼
Jefferies LLC 24 18 20,484.6 1.538 0.5 -3 ▼
-1.3 ▼ 55 0.7 Greenhill & Co, LLC 24-3 ▼ 49 16,441.4 0.6 0.3▲ 59.8▲ 12 0.2 +4 ▲Houlihan Lokey 25 19 18,750.4 1.4
1.8 1.3-26 ▼ ▲-1.4 ▼ 66 0.9 45 16,212.1BNP Paribas SA 25 151.8 1.2 0.4 0.10.2 +3 ▲ 38.5▲
†Note: Industry Totals include multiple competing bids for the same Target.
Guggenheim Securities LLC Credit Suisse
†Note: Industry Totals include multiple competing bids for the same Target.
42
51
8.0 ▲
61
▼
+9
1617
-8Houlihan Lokey
8.011.5
4,960
Industry % Change from Same Period Last Year
Perella Weinberg Partners LP
-8
▼+5+7
Wells Fargo & Co
7
+3
▼
13,744.2 0.4+21.3-14
▼
41
0.9
▲
▼-1.5
▲ 0.30.1
▲ 5
2181,685.6
0.3
Stifel/KBW
▼
113,368.9
▼
HSBC Holdings PLC0.5
20,845.2
RBC Capital Markets
4 4
▲13
5.3
13 1.8
-1.5
2.218
Industry % Change from Last Quarter
16 21,072.2
1.5 0.2
27
5
▼18
2
23
17,408.3-16
Nomura
632,936.2
-75
-23.0
▲0.1
Goldman Sachs & Co 1
Market # ofFinancial Advisor US$m Sh (%) Share Ch.
Blackstone Group LP
Lazard 3
UBS 16
7146
462.1
Morgan Stanley 2 3 278,138.2
JP Morgan 4
3.3 1.9
y , ,Industry Total100.0 -1447,715 100.0Industry Total† -75900,482.4 6,4061,348,727.0
▲ -3.4%Industry % Change from Same Period Last Year 47.3% ▲ -1.8% ▼
Rank Value per Advisor (US$m) # of Deals per Advisor
▼ -7.0%
Rank Value per Advisor (US$m) # of Deals per Advisor
Industry % Change from Last Quarter 66.3%▲
100.0
-9.1% ▼▼
Imputed Fees (US$m)
▼
10,053.9
Industry % Change from Same Period Last Year 23.0%
US Target Completed (AF2) Jan 1 – June 30
-1.2% ▼ 13.1% ▲Industry % Change from Last Quarter -14.3%
Sh (%)2014 Rank
Market
US Target Announced (AD2) Jan 1 – June 30
MarketRank Value Market2015 Rank Fees
# of Change in 2015 Rank
2014 Rank
Rank Value Market Change in Market# of Deals
Market
31.5 -8.8 ▼US$mDeals Sh (%) Share Ch.Sh (%)
Advisor
945.81.7 -9 ▼ Goldman Sachs & Co
MarketShare Ch. Deals Sh (%) # of DealsFinancial Advisor
1 317,409.5 3.812.985 2.01 185 ▲27.6 1.6
+8 ▲249,528.8 39.4 -5.8 ▼▲
3JP Morgan+10▲
-45 254,763.7 25.3 6.21.4
4.1▲ 5518.610▲583.9 8.0▲
0.30.6300.8
1.536.7 652 -6.6 ▼232,345.2 ▼
4 247,229.5
-728.7
▲▲ 0.9
▼1.3 +15 ▲Citi
4.0 ▲ 1.4 +470 1.2 -4 ▼24.5 Bank of America Merrill Lynch 152,884.6 24.2 -14.5 52-16.921.3Barclays 5 6 246,941.1 134,492.95 5 50 1.2 -7
▲5.5 0.14.0 0.7 ▼
402.1
8.724.5 7.9 288.4▲ 0.9 Barclays-2743 ▼
43 Morgan Stanley 6▼
0.9Credit Suisse 6 7 235,912.7 23.4 1.73 117,396.4 18.6 -21.1 ▲ 562.4▼ 1.5 ▲Bank of America Merrill Lynch 7 2 222,055.6 22.0 -12.3 ▼
▲ 7.71.0 -19 Lazard 3.6
+8-13 ▼ 6411▼ 0.01.1 -317.9 8.6 ▲ 260.446 -
Citi 8 8 221,678.2 22.0▼7
14.5 6.7 ▲0.9▲ 40 ▲ 222.10.9 +10 3.0Centerview Partners LLC 9 9 193,755.6
1016
▲
92,050.813.8
▲0.319.2 Centerview Partners LLC-2
10 9149
Deutsche Bank 8 12▼▲
47 0.9▼
▲87,363.1 -1 ▼0.314
1.011.8 ▼9.4 ▲ ▲225.5 3.1
▼1.03.1225.3 ▼1.8
-21.9 ▼ 0.921 0.5 -2 77.3 1.1▼74,967.535 -91.1 ▲ 41117,147.4 11.6 11.0 15
11 10 97,527.3 -3 ▼ UBS▲ 8.91.712 17
9.7 3.2 44 56,212.60.1
1196,290.9 0 ▼39,178.0 6.2 2.5 ▲ 0.6269.352 9.5
29
Evercore Partners0.4- Wells Fargo & CoLionTree Advisors LLC 12
6
Allen & Co Inc 13 19 84,350.5 4 ▲0.1 +3▲0.3
-108.4 5.9RBC Capital Markets-9
18▲
▼▼
2.9 ▲+630,396.1
123.399.4
▼15 0.1▲ 14 1513 37,111.4
Deutsche Bank 15 11 80,242.7
1.42.3
0.7▲4.8Jefferies LLC
▲
▼Greenhill & Co, LLC 14 12 81,964.7 8.1 0.4 ▲
0.5
1.734 ▼1.72.3
-0.9 ▼Evercore Partners 150.824
1.120,147.5
166.8450.8 -10 121.31.1
▲642.5 17
▼1.213 30,102.5 4.8▼▼25,051.2▲0.52.8 ▲ ▲
▼ 1.91.53.270,604.7 7.0
0.52.8138.8
- 3 36.1-16▲-7
1.0 0 -▼
0.472.7 1.00.521
HSBC Holdings PLC 20 - 17,408.3
0.1 +319 37 15,010.5 2.4 ▲1.8▼19 17 44.7▲18,416.5 1.8 Greenhill & Co, LLCHoulihan Lokey ▲ 8 0.2-1.4 0.3▼ 1.2 -22 0.620▲ ▲0.11.7 1.7 +33 40 12,915.2 2.0 1.5 0.1 +1 ▼
▼ 0.2 ▼41.611.6▲
0.60.2 0.1
▲12,557.1 2.0▼ -443 0.9 21▼Jefferies LLC 21 18 16,962.2 1.726.5
30.624 15,331.1 0.4
1.5 0.91.1 ▲
1622
Moelis & Co 23▲
Macquarie Group 23 33 15,075.9+2Rothschild 22 Macquarie Group0.1 -13 0.0
1.9▲1.412,168.70.311,633.1 1.8
13-3.0
-33 0.8 -1 ▼ 1.2 ▼1.3
0.392.9-2.2 ▼
▼ 1212,243.4 1.9▲
311.9
25Guggenheim Securities LLC
24Qatalyst Partners21▼ -18 ▼▲ 0.0
1.2 ▲0.6 ▲ 141.77 0.2 +4-▲ 0.6 0.043.8
7,309.0 100.0+2▼1.7+53
17.7% ▲
25 0.2
Industry % Change from Same Period Last Year▼
10,932.7 8
1.3%
7100.0
▼▲14.2%▲
-6.1%-8.9%
4,263
-6.8%
Industry Total
Industry % Change from Last Quarter54.0% -4.4%-0.3%
100.01,008,957.9
24 14
▲
13,397.9
60.1%
25 - ▲
+4
1.3
▲
▲
Industry TotalPJT Partners LP
https://www.thomsonone.com
* tie
Visit http://dmi.thomsonreuters.com to view archives and order custom League Tables7
Guggenheim Securities LLC Credit Suisse
Industry TotalQatalyst Partners
100 0 +10783 364 3 5 453▲ 7 1.6 1.6 ▲
8 801 8 100 025 32 11,633.1 1.5 0.5
1.20.1 +3 ▲ 141.7
36 0.7 -3 ▼ 102.7 1.20.7 ▲
Moelis & Co 24 15 13,471.2 1.7 -2.1 ▼ ▲58.32.1 1.6 ▲ 11 0.723 42 16,334.1 0.2 +4 ▲
▲11 0.2 -1 ▼ 26.2 0.31.0 ▲
Nomura 22 36 16,966.0 2.2 1.3 ▲ 0.30.7 ▲ 31 1.00.6 +4
20Rothschild 21
0.618,908.9 2.42.2
1.3▲ 85.2
▼ 41.45 0.1 -130 ▲
0.50.6 ▲17 0.3 +1 ▲ 53.90.5 ▲
1.7 1.7 ▲HSBC Holdings PLC 19 64 20,062.4 2.6 2.4 ▲
1.5 ▲1.2 -20 ▼ 145.30.6 ▲ 68
0.9 ▲45 0.8 +3 ▲ 80.3 0.91.5 ▲36 0.7 -15 ▼
▲Evercore Partners 16 13 30,813.1 3.9 -1.1 ▼ 129.4 1.5
1.218 37,902.5 4.8 2.1 1.2102.8▲2.0 2.00.9 +1 ▲ 173.8
1.6 ▲17 42,363.5 0.6 -7 ▼ 138.45.4 2.2 ▲ 301.0
▲30 0.6 -14 ▼1.6
▲6 0.1 -7 ▼ 1.083.91.3 1.3 ▲
Perella Weinberg Partners LP 12 27 60,479.2 7.7 6.4 ▲▲ 118.08.6 -17.5 ▼ 306 67,040.9
257.2 2.982,228.0 10.5 1.0 ▲0.6 +4
2.9 ▲52 1.0 -10 ▼256.9 2.9 2.9 ▲17 0.3 +2 ▲
3.1 3.1 ▲Centerview Partners LLC 9 16 94,900.5 12.1 8.4 ▲
3.2 3.2 ▲4.2 ▲ 52 1.0 +7 ▲ 268.0
▼ 280.515.0 5.8 ▲ 5617.9 -18.5
117,344.4 1.011 -18▼3 140,147.9 ▲84 1.5 -1 ▼ 681.7 7.7 7.7
▲367.8 ▲
60+12
Barclays 5 5 141,769.7 18.1
-6.6
3.74.2
-15.3 1.1 -14▼ 3.74 9 193,532.3 70 1.313.5 ▲
12.5111 1,099.82.0
Change in
70 1.3 ▼ 5.4-7
MarketDeals Sh (%) # of Deals Fees Sh (%)
MarketShare Ch.
Market# of
23
32-16
257,706.7
25Moelis & Co 0.5-0.81.4
18,374.8
1.4Wells Fargo & Co
Jefferies LLC-4
0.4
Share Ch.
-6 ▼Goldman Sachs & Co 1 1 322,414.1 -3
▼-1.6
6 409
Advisor
-7.4 ▼ 87 1.6-1.0 ▼
Industry Total 1 223 764 2-2.016,929.7
1.5
24.7
LazardMorgan Stanley 6
▼34
▼RBC Capital Markets -2.1
-1.018,750.4
Macquarie Group 2015
1.51.7
18Houlihan Lokey 22
58
2121,454.421,072.2
35
21
26,556.21.821,885.8
7.8
▲Blackstone Group LP-0.7 ▼19 20
36,674.7 3.0
2.9Greenhill & Co, LLC 14 95,480.0
18
Allen & Co Inc 15
17
87,409.5
16
▲
▲
12 100,260.612
13
7.7
6.223
14
21.521.8
7
▲2.9
263,179.62
6.1
9.0
LionTree Advisors LLC 13 73 96,290.9 7.9 ▲
0.9 -30
Evercore Partners11 9
8.2110,249.2
48-0.4
▲
269,502.45
2
6-15.2 ▼
▲
21.0
6 22.0
7.1
1.9-0.5
2.2
1.316Rothschild
7HSBC Holdings PLC1.8
UBS 75,407.8 0.35
▲
▼
0.8
▲
1.1 ▲0.4
4.7
473.4
▼
▲5.4
665.6
▲ 4.2▲
323.6
7.6▼
2.7▲7.5
▼▲11.6 97
6359
-761 1.0
52
9
-15
▼
-24
7
# of Deals per Advisor
74
-2
19
65
0.7
0.1 -8
▼
+3
Change in
+8
-13
-12
122Deals # of Deals
▲▼
-1 2
# of
1.5
20
-11
Market
1.9Sh (%)
1.0
1.264
Citi
▼
+6▼
Jan 1 – June 30Any US Involvement Announced (AD41)
Rank Value
7.64
4.9 ▲
MarketFinancial AdvisorGoldman Sachs & Co 1
30.9
2014 Rank
29.8Morgan StanleyJP Morgan 3 5 364,912.3
US$m2015 Rank
1 404,688.03 378,412.1
Rank Value per Advisor (US$m)
33.1
Barclays
95 32.9▲
7.6JP Morgan
Rank Value MarketImputed Fees (US$m)
0.1 +10.3 Macquarie Group
Greenhill & Co, LLC▼
25100 0
▼17
24
14 31,041.9 4.0
17
▼
Stifel/KBW▼
Houlihan Lokey
26 17,036.7
0.4
▲
-10
49
20 20,325.9▼▼
Deutsche Bank43
18
579.6
Centerview Partners LLC 910
20 0.310117,272.3199,629.7 16.3
9.2
Lazard
Bank of America Merrill Lynch 7
266,180.2
88
4
256,777.8Credit Suisse
Citi
16▲7.5
UBS
Deutsche Bank▼-2
1.0
+9▼
21,016.5 2.72.6
29
▼-0.4
27
▼
▼
▼
▲
1.0-4
27
Americas Rankings
220 Wells Fargo & Co
14+8
0.2
Sh (%)
# of Deals per Advisor2014 Rank
▼
▲
Jan 1 – June 30
19.3236,490.3
Any US Involvement Completed (AF48)
▼
US$m▼
Share Ch.-6.4
MarketFinancial Advisor
Market
8
10
98,722.0
11
220,037.34
-23
-13
12.6
10
2
▲▲ RBC Capital Markets
15
▲
▼
▼
Jefferies LLC
3
41.2
28.1
Rank Value per Advisor (US$m)
12.5
1.5 Bank of America Merrill Lynch
2015 Rank
-13
First Half 2015 | Mergers & Acquisitions | Financial Advisors
Sh (%)
12▼
13-
0.1
5 0.1
0.9
0.3
24 16,989.3
Barclays Danske Bank
▼
GMP Capital CorpCredit Suisse
-5.3%
Desjardins Group4.33
1.9▼
▲-6
1666
Industry Total
9 -8▼
0.8
2
5,414.3 4.4 4.3
▲1.012
-10.83.0Goldman Sachs & Co
1,194
▲
0.4+359
-16.4
868Industry Total124,418.8
2.1
+1 ▲
▲ 61.4 ▲
0.0 +10.0-3.1
2.0▼
▲ 1.071.30.4
10.4▼ 17.2 1.6
0.6
9.7%▼▲
-14.1%▼
-143 1,100.2
▼ -10.8%-2.3%11.4%
Industry % Change from Same Period Last Year
1.4 0.11
1.3%
▲
100.0
5 -3▲1,285.925▲ ▲
Canaccord Genuity45
100.0
1.81.7
▲0.4▲
0.02.3▲▲ 0.40.0 +1
6
▲5
0.621,471.1▲
1.9
2.42.3
22
1 0.1 1,368.1
HSBC Holdings PLC
24
22 - 1,740.6▼
2.521
1,849.516
-6-2.9-0.2
1,795.020 ▼
▼20.60.0 ▼
0.41.9-10.0
▼
20.70.8▼
19 ▼ 20.77 0.21.90.0▼Macquarie Group
21 22 3,276.6 2.6 ▼-2▼
▼0.1 -314 3.4▼ 36.8 0.914
Macquarie Group 18 13 5,316.95.9
4.37 4,393.94
19 2 4,154.0 3.3 ▼0.6-20.3 -14 -2.1▼ 18▲
BMO Capital Markets3.8
17▲ TD Securities Inc
2,821.3
0.1 3.7 ▼0.0 0.4
▼-4+1
1.3 1.2 ▼0.4
▼
0.740.7▲▲ 4.6
7
US$mAdvisor# of
▲Fees69.6▼0.1
0.0
▼
20,556.8
▲
# of Deals per Advisor
-18.0%
Share Ch.
16.2
▲
▲26.3
100.0
▼11.7% ▲
-8.5% -9.7%
+10783,364.3
▼
5,453
Industry % Change from Same Period Last Year 22.7% 0.2%
8,801.8 100.0
Industry % Change from Same Period Last Year 48.6% ▲
-326,409Industry Total 1,223,764.2
-0.5% ▼
29.5
1
11.7
26
8
Scotiabank
107
-0.7
▲17
9-4.2
7.7
0.71.9
# of
1.4
Industry % Change from Last Quarter
* tie
20 8 3,752.8
▲0.8
Ernst & Young LLPFirstEnergy Capital Corp
1,720.7 1.41,720.7-
2.10.5
▲▲Industry % Change from Same Period Last Year 40.2% -11.8%
14.621 4,646.0Sycomore Corporate Finance SAS
▼
16▲ - 6.0 1
Scotiabank
Sh (%)
▼
Raymond James Financial Inc
84.0%
▲
100.0
▼
4.4
-2.8% ▼
MarketFinancial Advisor
27.5
23+1 17
▼
74,793.0
6.0
0.1
Industry % Change from Last Quarter
-10.5▼-5.6
CIBC World Markets Inc
▼
-1
-7.9+1
+4
3,259.4
Rank Value
4,456.6
0.8
▲
▲
RBC Capital Markets
+3
-3
Sh (%)▼
7.7 311
▲
7 20,386.8
21,440.19
▲20,815.7
Credit Suisse
5Morgan StanleyCiti
2
4JP MorganBMO Capital Markets
3
Deutsche Bank 67Bank of America Merrill Lynch
12
610
3 16.717.2
36,674.623.529,272.7
RBC Capital Markets 42,358.8
+10.9▲14.9▲
41 34.1Share Ch.Sh (%)
2015 Rank
13.3Deals
Market
-5
Market# of Deals
JP Morgan-2-6
33.32.2
▲ Industry % Change from Last Quarter
2014 Rank
Rank Value per Advisor (US$m)
Any Canadian Involvement Announced (AD42) Any Canadian Involvement Completed (AF49)
67.3%
2014 Rank
Jan 1 – June 30
Rank Value
100.0
Industry % Change from Last Quarter
US$m
Rank Value per Advisor (US$m)Market
Financial Advisor Sh (%) Share Ch.
▼
Market# of Deals
Change in MarketImputed Fees (US$m)
50.5
Market
10 2.16.34.6
2.0▲▲
3.70.6
▲40.5
11 24,899.028.9
+1▼▲
DealsMarket
6
2015 Rank
0.0▲12 421.40.0
Sh (%)
Jan 1 – June 30
-3 17.1
Goldman Sachs & Co
34
▼1
Nomura
2-1Deutsche Bank
2.12.123.45.9 ▲
▲17.1▲
110
0.0 +15
-+112,750.6 17.1 79.5 7.2▲0.1
3.0-3 ▼
▲+5
1Bank of America Merrill Lynch 0.00.1
7 8,088.8 10.811.3
▲
43
516.4
TD Securities Inc
17,199.2 13.814,422.4 7,249.1▲ 15Citi
11
0.46.5 9
-2+4
Lenner & Partners0.8
-1.21.4
9*
1▲
Rothschild
▲
1.415.0▲21
8 1.29*
12.76,954.1
Sandler O'Neill Partners 16 -
8
9 7,419.1
9CIBC World Markets Inc 1410
# of Deals per Advisor
8,460.26Barclays▼ Morgan Stanley▲
8
▲
-0.7
▲▲0.0
1.150.1
▼
▲1.2
▲
▲
4.2
▼▼
33.34.3
▲
9.39.7
-15.2
0.0
▼
▲
9
0.2-3
46.7▼
6
21,623.4
12,797.7
9.39.3
▲ ▼
+1▲9.36,954.1▼
- 1
▼
64.70.0
4.3-5 ▼ 20.96,175.21.90.224 5.99.32
1.9
5
12.7+1
6,932.7 -15.7 ▲3
+1
-24.3
▼
▲0.2+1 ▲7.9BNP Paribas SA
12
06.7 -0.89
▼ 10
5,039.53.5 ▲
2
6.2
8.3
1.60.0 1.0
▼ 21 0.1 - 66.3 6.0-1 ▲13 5,918.738 ▼7.4 10.90.1
5,752.7
▲
5,596.15
-30.8+3
▼
▼
1.4
4.5 ▲
5.6
0.44.5 0.3
2▲ 15
11
22-2
Industry Total
12
14
3,186.3 0.22.6
+2
-4.4
▼
4.60.3
24*Willis Capital Markets-160
43
Numis 24*-
2,572.0
GMP Capital Corp
23 33
199,570.1
12*6,954.1
1
6,954.1
9,385.9 ▼
▲6.07.5 0.8
1.6
+1-0.811.6
1.0-5
Change in
0.3▼
-13
19
0.8
0.2▲
▼
5.6
4.6 4.6
-6.5
▼
▼
Moelis & Co 17
▼
0.1
-
5.6
-19.6
15
5.6
HSBC Holdings PLC14
-12*Lenner & PartnersDanske BankINFOR Financial Inc 4.6
-
9
▲
5,736.2-
Visit http://dmi.thomsonreuters.com to view archives and order custom League Tables https://www.thomsonone.com 8
EMEA Targeted Financial Sponsor Investments (Buyside Sponsor Activity)
Healthcare
HSBC Holdings PLC
6
Goldman Sachs & Co
Goldman Sachs & Co
3
12
65,473.2
3
46.8
21,272.0
12
4 64,537.4
49.3
629 47.7
15,038.6
71.25
3
JP Morgan
Morgan StanleyMoelis & Co
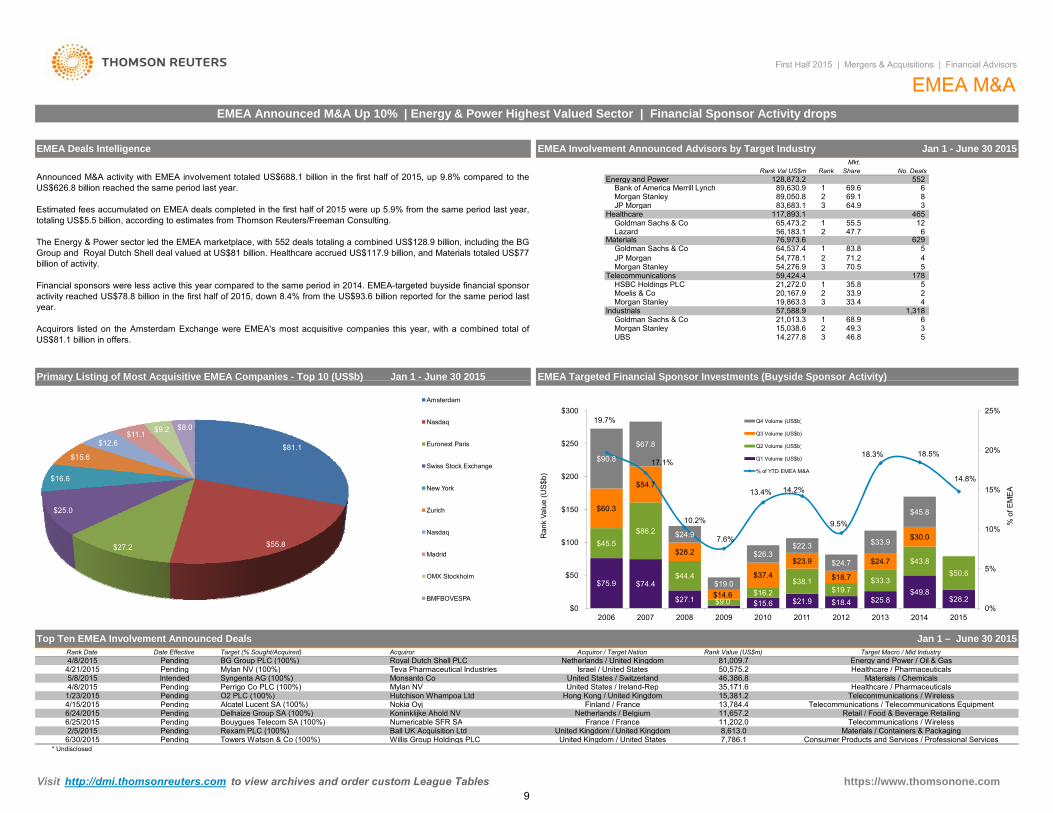
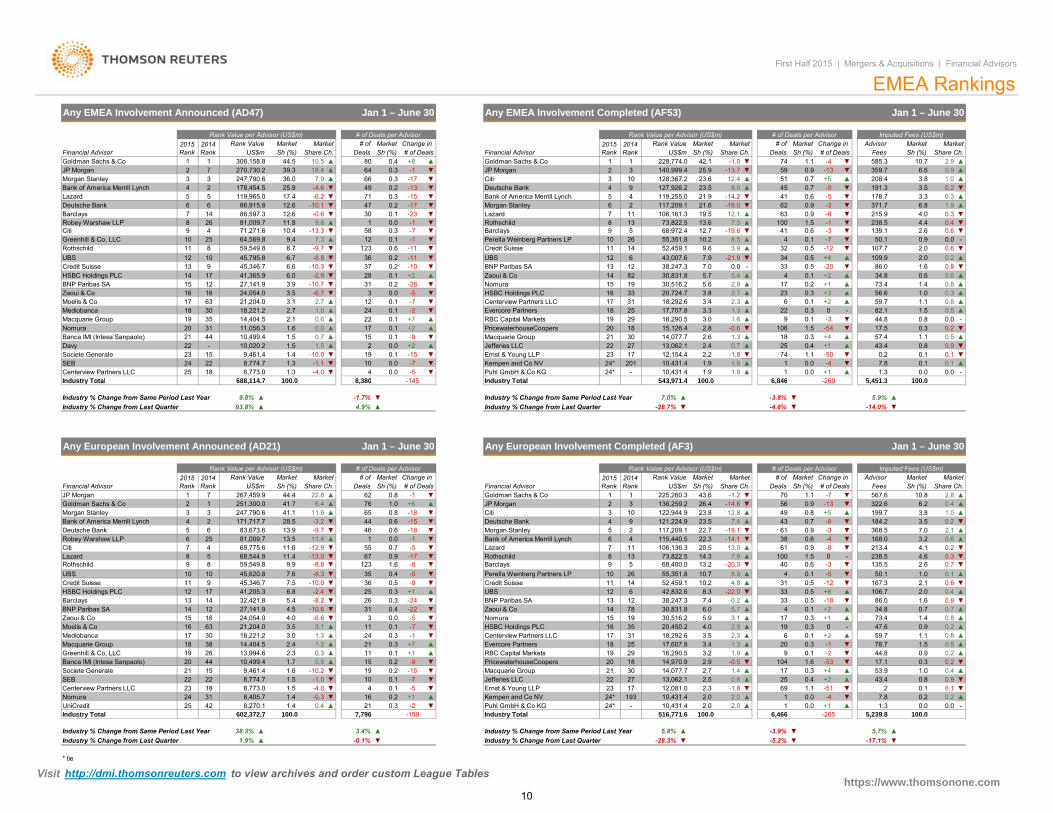
Announced M&A activity with EMEA involvement totaled US$688.1 billion in the first half of 2015, up 9.8% compared to theUS$626.8 billion reached the same period last year.
Estimated fees accumulated on EMEA deals completed in the first half of 2015 were up 5.9% from the same period last year,totaling US$5.5 billion, according to estimates from Thomson Reuters/Freeman Consulting.
The Energy & Power sector led the EMEA marketplace, with 552 deals totaling a combined US$128.9 billion, including the BGGroup and Royal Dutch Shell deal valued at US$81 billion. Healthcare accrued US$117.9 billion, and Materials totaled US$77billion of activity.
Financial sponsors were less active this year compared to the same period in 2014. EMEA-targeted buyside financial sponsoractivity reached US$78.8 billion in the first half of 2015, down 8.4% from the US$93.6 billion reported for the same period lastyear.
Acquirors listed on the Amsterdam Exchange were EMEA's most acquisitive companies this year, with a combined total ofUS$81.1 billion in offers.
Morgan StanleyJP Morgan
Morgan Stanley
Telecommunications
Lazard
Industrials
Primary Listing of Most Acquisitive EMEA Companies - Top 10 (US$b) Jan 1 - June 30 2015
19,863.3
UBS
55.5
Goldman Sachs & Co2
56,183.1
Morgan Stanley
35.8
Materials
14,277.8
5
221,013.3
20,167.9
11,318
6
33.9
57,588.9
465 64.9
552 Share
6 8 3
No. Deals
EMEA Deals Intelligence EMEA Involvement Announced Advisors by Target Industry
117,893.1
5
83,683.1
First Half 2015 | Mergers & Acquisitions | Financial Advisors
EMEA M&AEMEA Announced M&A Up 10% | Energy & Power Highest Valued Sector | Financial Sponsor Activity drops
59,424.4
54,778.1 83.8
178 5
3
Rank Val US$m
89,630.9
Rank
Bank of America Merrill Lynch 69.6
Mkt.
Energy and Power
2
128,873.2
69.189,050.8 1
4 3 33.4
70.5
76,973.6
2
54,276.9
1
1
68.9
2
Jan 1 - June 30 2015
g p ( y p y)
50,575.2 Healthcare / Pharmaceuticals
France / France
Materials / ChemicalsUnited States / Switzerland
Target Macro / Mid Industry
Jan 1 – June 30 2015
6/24/2015
Israel / United States
Pending Hutchison Whampoa Ltd
Intended
Netherlands / Belgium4/15/2015
Netherlands / United KingdomAcquiror
Pending
2/5/2015
Pending
1/23/2015
Royal Dutch Shell PLCDate Effective
11,657.2Pending Bouygues Telecom SA (100%) Numericable SFR SA
Koninklijke Ahold NV6/25/2015
y g q p p ( $ )
4/21/2015
Rank Value (US$m)
Pending81,009.7
Acquiror / Target Nation
Teva Pharmaceutical Industries4/8/2015Rank Date Target (% Sought/Acquired)
Top Ten EMEA Involvement Announced Deals
Mylan NVMonsanto CoSyngenta AG (100%)5/8/2015
4/8/2015
Mylan NV (100%)
O2 PLC (100%)
BG Group PLC (100%)
15,381.2
* UndisclosedUnited Kingdom / United StatesPending
Telecommunications / WirelessHong Kong / United KingdomPending Alcatel Lucent SA (100%) Finland / France
United States / Ireland-Rep Healthcare / Pharmaceuticals
Telecommunications / Telecommunications Equipment
Perrigo Co PLC (100%)Pending
United Kingdom / United Kingdom
46,386.835,171.6
Pending
Delhaize Group SA (100%) Retail / Food & Beverage Retailing13,784.4
6/30/2015Ball UK Acquisition Ltd
Towers Watson & Co (100%)Rexam PLC (100%)
Telecommunications / Wireless
Willis Group Holdings PLC Consumer Products and Services / Professional Services8,613.0 Materials / Containers & Packaging7,786.1
11,202.0
Nokia Oyj
Energy and Power / Oil & Gas
$75.9 $74.4
$27.1 $15.6 $21.9 $18.4 $25.8$49.8
$28.2
$45.5$86.2
$44.4
$9.0$16.2
$38.1$19.7
$33.3
$43.8$50.6
$60.3
$54.7
$28.2
$14.6
$37.4
$23.9
$18.7
$24.7
$30.0
$90.8
$67.8
$24.9
$19.0
$26.3$22.3
$24.7
$33.9
$45.8
19.7%
17.1%
10.2%
7.6%
13.4% 14.2%
9.5%
18.3% 18.5%
14.8%
0%
5%
10%
15%
20%
25%
$0
$50
$100
$150
$200
$250
$300
2006 2007 2008 2009 2010 2011 2012 2013 2014 2015
% o
f EM
EA
Ran
k Va
lue
(US
$b)
Q4 Volume (US$b)
Q3 Volume (US$b)
Q2 Volume (US$b)
Q1 Volume (US$b)
% of YTD EMEA M&A
$81.1
$55.8$27.2
$25.0
$16.6
$15.6
$12.6$11.1 $9.2 $8.0
Amsterdam
Nasdaq
Euronext Paris
Swiss Stock Exchange
New York
Zurich
Nasdaq
Madrid
OMX Stockholm
BMFBOVESPA
Visit http://dmi.thomsonreuters.com to view archives and order custom League Tables https://www.thomsonone.com 9
Greenhill & Co, LLC
▲-
Rank Value per Advisor (US$m)
Financial Advisor
Jan 1 – June 30Any EMEA Involvement Announced (AD47)
2.3
1
0.0
Change in # of 2015 Rank
MarketFinancial Advisor# of Deals
39.31Goldman Sachs & Co
270,730.2 18.4744.5
Sh (%)2015 Rank
1
2014 Rank US$m Sh (%)
# of Deals per Advisor
Jan 1 – June 30
Market
81,009.7
Rank Value Market
306,158.8 10.5
▼
MarketShare Ch.
▲
12.6 -0.6
66-4.6
-10.130
4971
7.9▼
▼
18Moelis & Co
UBS
71,271.6
33
Mediobanca
BNP Paribas SA16Zaoui & Co
Macquarie Group
Credit Suisse 13
15
5
14Robey Warshaw LLP
19
17
9
2
4
HSBC Holdings PLC
12
14
Citi 925
Rothschild 11
-17
47
9.8
-8.8BNP Paribas SA
0.0
7.358
0.2▼
59,549.864,569.8
▼▼
9.4 12
-111238.7
-1
2
8
Deutsche Bank 6Barclays
Morgan StanleyJP Morgan
LazardBank of America Merrill Lynch
726
10
6
10.4
4
10
178,454.55
86,597.3
8
33 2.7
▲▲
5.4▲2.9▲
5.7
1.3
Nomura 19
1718
14
3.820,724.718,292.6
15Zaoui & Co
▲1.6
Jefferies LLC▲
2.816,290.5
3021
▼ 16
3.017,707.8
2918
3.3
14,077.7 2.6
17
1.10.4
Centerview Partners LLC
0.1
RBC Capital Markets 19
5.630,516.2
3125
3.4
2.10.1
▼▲
▲
123
22
0.0
▲
HSBC Holdings PLC▼
Evercore Partners-2+7
24
1.50.7
Kempen and Co NV▼
0.0-9
Ernst & Young LLP▲ ▲
190.0 -7
▲▼▲▲
15+217
▲2 27
1.5
1.41.5
-1.1
-6.72.7
0.00.61.0
24 ▼
1.6Nomura44
Davy 2221
Societe Generale 23 15
Banca IMI (Intesa Sanpaolo)20
SEB
Industry Total
22
3.9 -10.7 ▼ 31
▼▼
0.1
0.2
-9.7
6.0
▲-13.3
+2
▼▲
0.3
-2.9
1
8.5
7.5-7
Rothschild
▼Barclays
10.2
-1 13.673,822.5
41,365.9
6.7373645,795.8
2845,346.7
11.8
▼12-10
12
▲6.6
1385
7.0UBS
38,247.3-10.3
-124
▼ Credit Suisse▲
-21.9
41100
0.511
43,007.652,459.1
26
6
1.5▲▲
30,831.8
32
41
0.1
▼
1382
2 ▼▼▼
0.962
0.60.9
63 215.9▼
-8-3 371.7
-1▼
128,367.210-13
Citi
119,255.0
238.5
-5
+58.0 ▲
80 Goldman Sachs & Co
▼140,999.4 25.9
▲
0.3
1JP Morgan
42.1 585.3
0.70.9▼64 -10.3
+80.4▼ 2
▲Sh (%)Deals
▲
49▼ 4
3 6.6359.712.4
▼
178.7
-13208.451
59
0.723.6
-13.7
127,926.2
Sh (%)US$m
0.2 23.5
Rank Value per Advisor (US$m)
▼228,774.0 ▼ 1.1-1.0 74 -4
# of2014 Rank
MarketMarketDealsShare Ch.
Rank Value
EMEA Rankings
AdvisorMarket
First Half 2015 | Mergers & Acquisitions | Financial Advisors
# of Deals per AdvisorMarket
Imputed Fees (US$m)
▲
2.90.9
Sh (%) # of Deals
Any EMEA Involvement Completed (AF53)
Share Ch.
0.8
0.6
Change in
-3
Fees
2.0
10.7▲
▲
1.0
▼
▲▲
▲
0.6
▼0.0
▲
-9
▼▼
109.9
0.90.6
▲
50.1
0.2
-
3.8
+1
1.9
4
191.3
0.217
33
0.64.4
▲45
3
-14.2
▲
▼Deutsche Bank
100 0 6 84610,431.410,431.4 ▲
▲1.9201
Industry Total1
22
▼▼
2574
+112,154.4
23
▲
6-
1.5
00.19
106
1
18
-1.8 ▼2.20.71.3
▲
-0.6 ▼15,126.4
13,062.1 2.4
543 971 41.9
0.5+4▼▲
+15 451 3
▲-50
0.0 0.0
0.9
0.0100 0
0.1
▼
--4
0.8
▲▼
0.0 0.1
0.2
0.5-
0.5
+30.3 ▲
0.5 ▼
-3
+20.3
▼
0.1 ▲
-540.3
0.1
+2
269
73.456.6
7.8
107.7▼
-20+4
0.3
0.4
0.2▲
0.3 ▼▲
12.16 -19.0
▼
11
3.3
4.0
3.5
6.8
▼▼
19.5-23-17
▼ Lazard 7 106,161.3
21.921.6
▼0.2 ▼
5Morgan Stanley 117,209.1
36.0
86,915.817.425.9
12.6
247,790.6
119,965.0
12.7Perella Weinberg Partners LP
14 9.6
-6.2 0.3
0.1
-15 Bank of America Merrill Lynch
55,351.8910
▼
▼ 34
-19.6
7.93.9
68,972.4 ▼
▲-7
▲
139.1
0.2
57.4
82.1
▼
▲
▲
1.3
34.8
0.1
1.0
0.6
1.1
0.8
1.5
0.30.8
0.8
1.4
17.5
▼
1.686.0
2.0
2.6
▲
59.7
43.4
44.8 0.0
▼0.1
1.10.3
▲
▼
17
-
20PricewaterhouseCoopers
Puhl GmbH & Co KG
Macquarie Group
1.91.9
2322
▼▼
24*24*
0.1
▼4▼10
0.6
+2
-11
0.10.2 -26
0.1
-15
8 380-5
0.1▼
145
-5
0.1
0.0
-7
12
18,221.2 2.7
3.527,141.924,054.016
3.121,204.063
3531
100 0
10,499.4-
3014,404.5
10,020.2
11,056.3
-4.0
9,461.41.38,774.7
688 114 7
-10.0
Centerview Partners LLC 25 18 8,773.0 1.3
UBS Perella Weinberg Partners LP
Fees
+5
-3
24*
1831 -0.3 ▼1.4 0.2
1.5 ▼
Industry % Change from Same Period Last Year
UniCredit 1.44225 8,270.1
73.4
135.5
86.0
-
▲ Kempen and Co NV
▼▼
▼ ▼
213.4
* tie
Industry % Change from Last Quarter ▲
0.424Nomura23
▲2.1
1.6
322.6
368.5
199.7▲
3.2168.0
-
▼ 10.8
▼
6.2
AdvisorSh (%)# of Deals
567.6-7
-4
34.8
106.7
59.7
11.4
13.5
0.3+1
-5
1
-8
76
-15440.6
1.3182.3
4.0
3.4
14
18,292.6
30,516.278
25
126.0
0.2
31
3.15.7
5.9
3.5
1930,831.8
6 42,832.638,247.3
10.2
▲
▲
2.935
▲7.4
▼52,459.114
26Credit Suisse 11
55,351.8▼
41.7
13.9
Any European Involvement Announced (AD21)
28.5 0.6
9
0.1
0.3▲ Evercore Partners
68,400.013▼
Barclays
7Rothschild
106,136.3
▼ 5
114
▼
73,822.58
-1
Deutsche Bank▼5 2▼
▼69,775.6 11.6
83,673.6▲▼-9.7
-12.9 ▼11.4
171,717.73
▼5 6
▲
4
Goldman Sachs & Co
4 -3.211.9
6.441.1
Bank of America Merrill Lynch 2
81,009.7
Morgan Stanley▲
22.8
2014 Rank
1247,790.6
MarketUS$m
251,300.0
2015 Rank
7
93.8%
267,459.92
Rank Value per Advisor (US$m)
▲Share Ch.
Rank Value
▲
1
9.8%Industry % Change from Last Quarter
JP Morgan
Industry Total
Industry % Change from Same Period Last Year
Financial Advisor
Citi
Societe Generale
Greenhill & Co, LLC
BNP Paribas SAZaoui & CoMoelis & Co
BarclaysHSBC Holdings PLC
Banca IMI (Intesa Sanpaolo)
Macquarie GroupMediobanca
10
Lazard 8
12
17
15
2.52.714,077.7
22 8,774.7 1.5 270.11.6
Jefferies LLC
18
24* 193 10,431.412,081.0
30
Industry % Change from Same Period Last Year
Industry Total
PricewaterhouseCoopers21
Ernst & Young LLP
5.8%
25
1110
57
9
Industry % Change from Last Quarter
100.0
-3.8%
25
115,440.5
121,224.9
▲
43.6225,260.3
Rank Value
16,290.5
13,062.1-10.2
19
100.0516,771.6
2.9
6,846
Sh (%)
17,607.8
2.3
-
23
1.9
-1.8
3.229
2.010,431.4
17
14,970.9
-0.1%
Puhl GmbH & Co KG
▼0.2
-2
-5-7
+1
Industry % Change from Last Quarter
Industry Total 7,796
9.9
SEB
19
0.0
0.5
10,499.4
Centerview Partners LLC
602,372.7
38.3%
26
8
17
35123▼
25-10.0
▼
-10.6
▼
▼▼
0.4
▼ 67
0.13
26
1.6-13.0
36
-1
-24
10
7.0%
# of Deals per Advisor
▼
47.6
Any European Involvement Completed (AF3)
-4.6%▼
Industry Total
-28.7% ▼
543,971.4 5,451.3
▲
MarketImputed Fees (US$m)
100.0
▲
▲
▲0.6
0.3
0.6
17.1 0.20.3
▼
▼
0.8
238.5
50.1
44.8
1.1
0.7
▲0.2
0.578.7
▲
▼▼
2.0 0.4
0.90.8
2.6 0.71.0
4.64.1 0.2
0.1
▲2.8
1.0
▼
Share Ch.
2.1
0.4
Market
▼7.0
0.23.8 ▲3.5
Jan 1 – June 30
▲
▲
0.2-4
-5.2%▼ ▼▼
6,466
-3.9%▼ -17.1%
▲-28.3%▼
0.317
6911
1.1
4
0
+8
0.3
0.5
-18
-5
60.3
0.9
1.6
0.7
20
+1
0.8
+2
0.5
0.1
0.1
+2
-8
-1.226.4
70
31
61
23.8▼
4.8
▼
▼
14.3
22.7
20.522.3
7.4122,944.9
-14.6
Market
▲
136,259.2
US$mMarket
0.10.640
-14.113.0
0.3
▼
104
▲
▲
19
MarketShare Ch.
▲
56
Deals# of
▲
9
12.823.5
-19.19
▲
38
▲
▲
2.0
-0.5
117,209.1
8.3
2.0
10.7
7.9
1.4
13.2
0.8
▲100
▲
61▼
49
▼
4
33
43
▲
0.1
17
33
1.5
0.9
2.0 ▲▲
-20.3
-22.0
8.9▲▼
0.4
▼
▼
▲
▲▲
+10.0 ▼
Sh (%)
0.6 ▼
▼
▲▲
+2
▼
-1
0.9
-51
1.1
-269
Change in
5.9%-14.0%
107.3
▼
▼
▼
-12
-13
Industry % Change from Same Period Last Year
12
33
6
▲
▼
21
1.0
0.0
-22
62
0.7
0.3
2014 Rank
1+6-18
Rank Value per Advisor (US$m)2015 Rank
▲
# of Deals Financial Advisor
2-1 ▼
Centerview Partners LLC
Nomura
JP MorganCiti
Goldman Sachs & Co
15Zaoui & Co
Morgan Stanley
16▼
LazardBank of America Merrill Lynch
22
1
4
13
Macquarie Group
17
RBC Capital Markets
-5
0.0
UBS
10
▼
▲
▼
BNP Paribas SA
HSBC Holdings PLC▼
55
0.8
19-9
0.3
+1
0.9
-7
65
4.9%
-17-5
31
-18
▼
-90.4
46
▲
-1.7%
# of
▼
Jan 1 – June 30
# of Deals per Advisor
Deals
8,380 -145
0.8
Change in
▲
Sh (%)
0.1
▲
▼
5.7%
0.8
0.0 -
▲
1.3
▼
7.8 ▲
0.9▼0.10.1
43.4.2
▲0.41.0
▼
▲0.8
▼
0.7 ▲
1.50.2
▲
▲
-8
▼
1.4
0.9
-3
20,450.2
▼
▲0
0.5
184.2
-53-2
15 9,461.422
2.4
1.7
10
+7
21100.0 -265 5,239.8 100.0
0.2
0.2-15
-159
20
0.0
53.9+4
▼
▼
4.0 -6.6
5.4
▼
▼
13,994.6
3.1
27,141.9-8.2
7.67.56.8 -2.4
-8.3
▲20
▼
▼
1.3
8,773.0
21,204.0
8,405.7
442.3
1.9%
24,054.0
▲
▲
32,421.8
6318,221.2 3.0
18
14
38
14 4.5
16
150.8
▲
-1.0
16
21
4
0.3
Market
-4.0
11
3.4%
14,404.5
3.516
100.0
59,549.8
3
-8.8
12
41,205.345,346.745,620.8
9
44.4Sh (%)
688,114.7
Market
▲
Credit Suisse
Deutsche Bank6
13
Robey Warshaw LLP
Rothschild68,544.8
1.2
▲24▲
110.3
30
t e
Visit http://dmi.thomsonreuters.com to view archives and order custom League Tableshttps://www.thomsonone.com
10
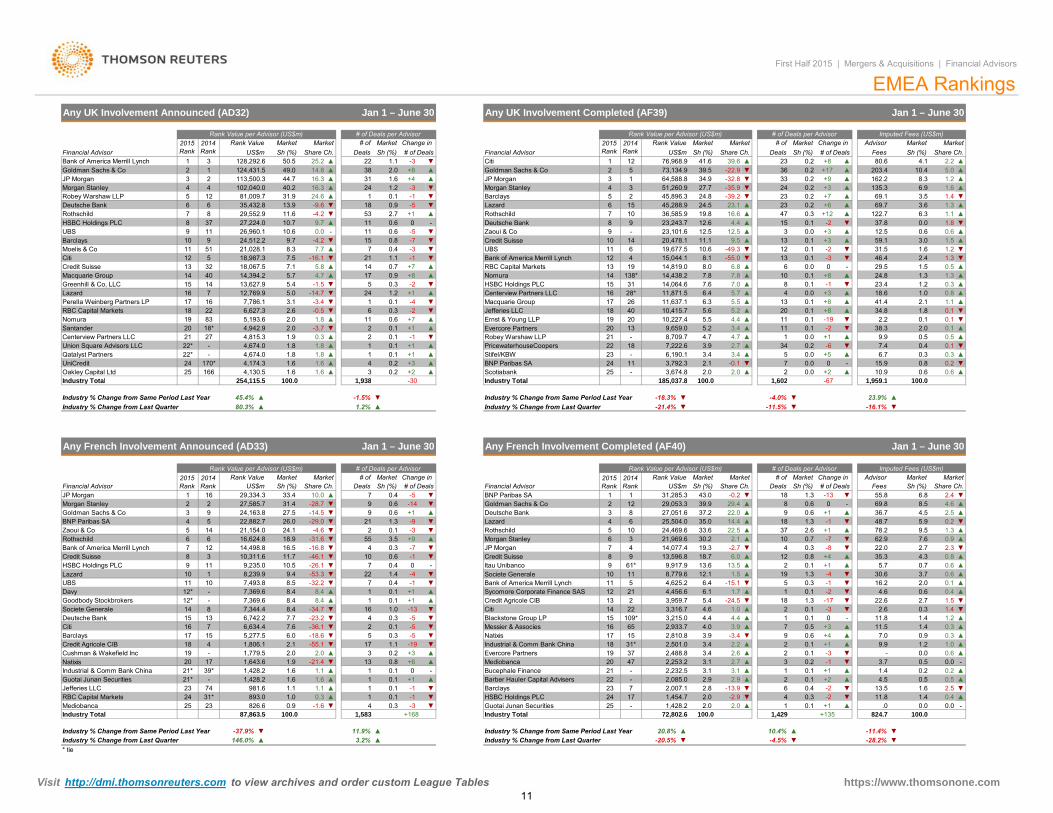
Barclays Credit Suisse
Evercore Partners
40
5.711,637.1
3Morgan Stanley
73,134.9
16
1Goldman Sachs & Co 2 5
3
Financial AdvisorMarketSh (%) US$m
45,288.9
23,101.6
51,260.94
41.6
▼
JP Morgan
Citi 12
Barclays15
9
28* 11,871.5
8,709.7 4.7
2.0
PricewaterhouseCoopers
▼
Bank of America Merrill Lynch 1
25
4,815.3
1.6 ▲▲
Market
30
+1
Santander
▲1
+1
0.3
1.2-4
10
0.2
Macquarie GroupCenterview Partners LLC
-2
Stifel/KBWBNP Paribas SA
+1 ▲
36,585.9
24.845,896.324.5
39.5
Rank Value per Advisor (US$m)
▲+2
4.4
1
▲
Jan 1 – June 30
Market
▲
0.1
1.31.5
▲1.2
1.8
▲
▲
0.5
0.6
▲
▲
0.80.6
2.00.1
1.1
▲
▲
0.4
15.910.9
0.0▲ 5
1 602
64,588.8 34.9
19.8
12.5
14,819.0
3.4
12.6
2.7
6.8
7.0
0.2 ▲33
# of Deals
▼3623
0.2 +9▼
First Half 2015 | Mergers & Acquisitions | Financial Advisors
2015 RankFinancial Advisor
Rank Value2015 Rank
2014 Rank
# of Deals per Advisor
Sh (%)# ofMarket Market
76,968.9Sh (%)
▲ 0.2DealsShare Ch.
MarketRank Value
Any UK Involvement Completed (AF39)
EMEA Rankings
39.6-22.9
27.7
5.2
0.223
▲
0.0
0.1
7.8
5.5
0.2-35.9-32.8
0.2
3.4
24
23.1
3▲▲
▼-39.2
▲
12.54.4
16.6▲
▼
-1
0.1
+80.1
23
15 0.1+120.347
0.1
0.0
+3+3
-30
-20.1
-2
# of Deals per Advisor
▲+8+17
▲+7
▲▲
+2 ▲
0.3
▲
▼
0.5
41.4 2.134.8
+5
0.667
18.6
7.4
▼ 38.3
100 025
-
Ernst & Young LLPJefferies LLC
▲
▲
1 938
▼▼
▲
▲
# of
24
0.1
0.6
4 +3
6
Deals1.1
Sh (%) # of Deals
+7
0.3
Change in
0.1
-3
21
▼
▼
▼
0.1
-1+1
▼
0.1 ▲
0.2
0.1
▲
0.1
▼0.1▲
▲▼
▼
1.3
▲1.5
▲
▲ 1.0▼▲
0.3
1.6
▼
0.8
▼
0.20.3
▲0.50.1 ▲
1.3 ▼▼
3.01.2
2.4
1.8
1.36.3
▲3.63.5
0.0 ▼1.1
1.4
1.26.9
▼▲1.6▲8.3
203.4 5.0
Jan 1 – June 30
Share Ch.4.1
Imputed Fees (US$m)Market
▲3
69.1
Change in
69.7
135.3+3▲
▲
+6
Advisor
80.6
31.5
▲37.812.5
-
▼
▼
▲▼
23.424.8
46.4
59.1
2.2
29.5
122.7
162.210.4
0.6
-69.9
-22.2
1 959 1
6.7-0
▲100 0
2.0
26
Scotiabank
6,190.1
10,227.4 5.5
17
7,222.6
2.1
Industry Total
10,415.7
4.713
219,659.0
20
7Deutsche BankRothschild
20
24
8
19
22Robey Warshaw LLP
15
56
18
18
-11
-
14
23
2
2014 Rank Share Ch.Sh (%)Fees
128,292.6US$m
102,040.0
24,512.2
Rank Value per Advisor (US$m)
Any UK Involvement Announced (AD32)
-3.4
0.3
22
1.8
1.8
11
3
2
1.61.6254 115 5
Centerview Partners LLC
Nomura
Qatalyst Partners 22*170*UniCredit
Industry Total
24Oakley Capital Ltd
Credit Suisse
15
1314
518,067.5
12
Macquarie Group 14,394.2Greenhill & Co, LLC
Citi 18,987.3
4032
166
22*-
▼
3.15.0
-1.5
18
13,627.914
17▼
22 2.6
Union Square Advisors LLC
RBC Capital Markets
Lazard 16
83
Perella Weinberg Partners LP7
19
16 7,786.112,769.9
5,193.6
21
5.4
20 2.0
6,627.32.0
18*
4,674.01.927
11.8
4,942.9 -3.7
-2
▼
1.8
▲▲1.6▲
4,174.34,130.5
100 0
Market
2.7
1
▲7.1
-16.1
4.7
14.8 ▲▲
-14.7
-
1.638
9
6
31
▼
49.0Goldman Sachs & Co
HSBC Holdings PLC
124,431.512
8
2
Morgan Stanley 4
Rothschild
51
3
Moelis & Co 11
Robey Warshaw LLPDeutsche Bank
10
JP Morgan
UBS
7
16.3
8
113,500.34
44.7
6
1127,224.0
16.3
11.6-9.6-4.2
3729,552.9
0.0
▲-324
2.0 ▲
5
+8
24.612
+4
0.9
25.2
▲1.2
81,009.7 31.940.2
50.5
13.935,432.8
▲+1
▼
▼-5▲
▼-1
▼
▲
Zaoui & Co 90
0.11Lazard
-53
0.6
18
-7
9.726,960.1
0.815▼
10.71110.611
9 1321,028.1
23,243.7▼ --5
0.4
0.620,478.110
10.619,677.59.511.1
11 -49.367 UBS-3 ▼4Bank of America Merrill Lynch-1
121312 -55.08.1
6▼▲8.0
▼1.1
▲▼
14,438.2+8RBC Capital Markets
15,044.1
31
1417
19Nomura 14
+7▲ 10
5 14,064.6-27.8
0.70.9
HSBC Holdings PLC
13138*
135.2 ▲
6.484▲
▲7.6
6.30.0
5.6
▲
+3
▲ 0.1
+820+8
0.1
+1
0.1
0.011
1
▲ -1911
0.23.4
27
0.1▲
▼-0.10.0
▲▲
34
3,792.3
185 037 83,674.8
3.9
7.5 ▼
9.77.7
-4.2
5.8 ▲
▲1.8
-0.5
▲
4,674.0
5.7
8.3
0.0
* tie
Lazard Societe Generale
Natixis
-2
▲
109*3,316.7
11
3,959.7
25,504.0
7
10
US$m
▼
MarketShare Ch.
3 8
13,596.8
4,456.6
27,051.6
33.6
▲
-3
0.1
0.1-17
+1
2
▲
▼
0.1
0.6
+2
-3
9
0.2
0.5
20.1
21
▲▼▼
0+3
▲
▼-1
0.1▼
-11.4%
-2-2
29,334.3 ▼Sh (%)
Change in US$m
Jan 1 – June 30
-30
92
▲80.3% ▲
1 16
2015 Rank # of Deals
7.6
55.8-▲
9.5
6.8
+1 78.2▲
0▼
5.936.7
0.2
2.4
▲
▼35.3
▼
▲
48.7
62.922.0
▼
30.65.7
3.70.7
16.2
▲▼
2.74.3
824.7
1.4
0.0
▼
2.04.6
2.6
▼
▲
1.211.8-
▲0.9
0.5
9.97.0
0.0
▼
▼
▲
22.6
.0▲
13.5
3.71.4
▼
▼
11.5+4
+1 ▲
0.3
0.3
-
-Barber Hauler Capital AdvisersBucephale Finance
▲0.1
0.4
2,253.23.13.1
-▲
100.0
-28.2%
11.8-0.0 0.0
▲-19
+60
2,501.0
▲
+168
1.1+30.2
0.80.1
0.10.3
▼-5 15▼ Natixis 17
Messier & Associes
1.7
1
▲Citi
▲5.4
▲222
4.6
▲
18▲
▲
0.80.1
0.3
37 2.6
0.3
# of
▼-4.0%
1,602
▼
Jan 1 – June 30
Market
+1
1
Rank Value
100.0
6.4
Evercore Partners
▲
-5
Industrial & Comm Bank China
-20.5%146.0%Industry % Change from Last Quarter* tie
▲ 3.2% ▲ ▼ ▼-4.5%
4▼
11.9%
-1893.0
Industry Total +135
24
1,583▼
100.0 1,4294 ▲
0.1
1.0-1
826.6
1
▲ 1 0.10.1
1,428.2+1
0.9
1,428.2
-1.6 ▼
1.1981.6
1.1
0.3
1,643.6
-18.6
8,239.9
8.4
6.01,806.1
-23.2
8.4
-26.1
7,369.6
9,235.0
2.0
5,277.52.12.0
7.7
-55.11,779.5
12*
▼▼
-31.6614,498.8
11.710.5
-32.2
-46.1
Zaoui & Co
31.424,163.8
26.0 -29.0
16.5
27.5
Bank of America Merrill Lynch
22,882.7BNP Paribas SA
-16.8
-4.6▼
-67
# of Deals per Advisor
100.0
2015 Rank Deals Fees
BNP Paribas SA-5Financial Advisor
# of Deals per Advisor
2.1Morgan Stanley
6▼24,469.6
12.14,625.2
9,917.9
14,077.418.713.6
8,779.6
19.3
Deutsche Bank
21,969.6 30.2
9 61*
5
4
Rothschild 104
1.4 -40
▼7
9
8.4
▼-53.38.59.4
8.4
Citi
12*
7.6 -36.1
14 87,369.67,344.4
6,634.4
8.4
Barclays
Goodbody Stockbrokers
15
-
4
71613
Societe Generale
Credit Agricole CIB-19Cushman & Wakefield Inc
1.6
1.11.6
Jefferies LLC
20Industrial & Comm Bank China
1.9
-
24
21*7431*
39*17
23Mediobanca
21*
23
25
Guotai Junan Securities
RBC Capital Markets
Industry % Change from Same Period Last Year
87,863.5
▼
38
10
21,154.018.9
5 24.16 16,624.8
127
1
6,742.2
Rothschild
Credit Suisse
11
18
UBS
17
9
Davy
HSBC Holdings PLC
Deutsche Bank
10,311.6
-
11
7,493.810
15
▲
0.3
▼
▼
17
▲▼
1▲
13
-34.7
1.6
▼
-21.4
▼
▲
1
4▼2
▼
16
▲
▲▲
# of
1,938
7
4
Sh (%)0.4
0.3
▼
1.30.6
Market
-90.1 ▼-3
-
▼-14
3.5
-1
0.4▼
# of Deals
0.6
▼
▲
-7▲
▲+1+1
Barclays
-3 -
2,007.12.0
Guotai Junan SecuritiesIndustry Total
Industry % Change from Same Period Last Year 20.8%
2,232.52.9
2.8
21
1,454.72.0
6.1
-
2,933.7
6.0 ▲
5
4.4
0.11.3
13.5
-15.11.31.5
-8+4
10
+1▲12
2
-1
22.514.4
▲22.0 ▲
-7
-4
▲ 0.7
Share Ch.
2.5 ▲-1▲
+118
0.691.3
▼4.6
4.5
1.30.6
-1369.8 8.5 ▲
23.9%
AdvisorImputed Fees (US$m)
Market
▲▼
Sh (%)
1,959.1
Change in
▼
▼
▲1.30.9
0.82.3
▲
▲0.6
0.3 ▼1.5
▲0.40.6
▲
▲
0.6
2.7
▲1.4
▼
0.1
1.4
▲
▲0.3
1.2
▼0.52.5
0.61.0
▲-
0.1
4.5 0.5
▲
▲0.20.2▲
1.41.6
▲
HSBC Holdings PLC1,428.2
▼
125
▼
▼
+172,802.6
3.1
-3.4
-24.5
3.9
▼
18829.4
▲
▼
2
1.0
4
19
1
35.0
-21.4%
31,285.3Sh (%)
43.0
▼
29,053.3
100.0
Market
37.239.9
-0.2
Industry % Change from Same Period Last Year
Industry Total
-14.5
▲-28.7 ▼
7
▼▼ 2
Market
▼ 9
55
9
▼
JP Morgan
▼
12
Blackstone Group LP▼
Credit Agricole CIB
Credit Suisse
11
8
-5
Industry % Change from Last Quarter
10.1
+9
0.6 -1
Sycomore Corporate Finance SAS
Itau Unibanco
▼▲ 19
18
▼▼
2.2
21
3.4
7
2.0
-13.92,085.0
17
3.9
2.7
2,810.8
2.9
4 5 21
▼
1.2%
14
10.0Deals
Industry % Change from Same Period Last Year
33.4
-1.5%
10
1
Market
7
5
22
3
Rank Value per Advisor (US$m)
254,115.5
45.4%
3
Share Ch.
27,585.7
Rank Value
Any French Involvement Announced (AD33)
-37.9%
0.3-13
Goldman Sachs & CoMorgan Stanley
Industry % Change from Last Quarter
2
Industry Total
Financial AdvisorJP Morgan
2014 Rank
▲
100.0
1
0.4
1.00.1
23
Mediobanca 20
6
15
Bank of America Merrill Lynch
Lazard
Goldman Sachs & Co 12
31*
16
22
3
65
14
5
4.0
2,488.8
-2.9
-18.3%-11.5%
185,037.8
-16.1%
Rank Value per Advisor (US$m)
Any French Involvement Completed (AF40)
Industry % Change from Last Quarter
2014 Rank Sh (%)
3
2
3.42.6
13
-2.7
4737
4.43,215.0
60.4
10.4%
Market
https://www.thomsonone.com Visit http://dmi.thomsonreuters.com to view archives and order custom League Tables11
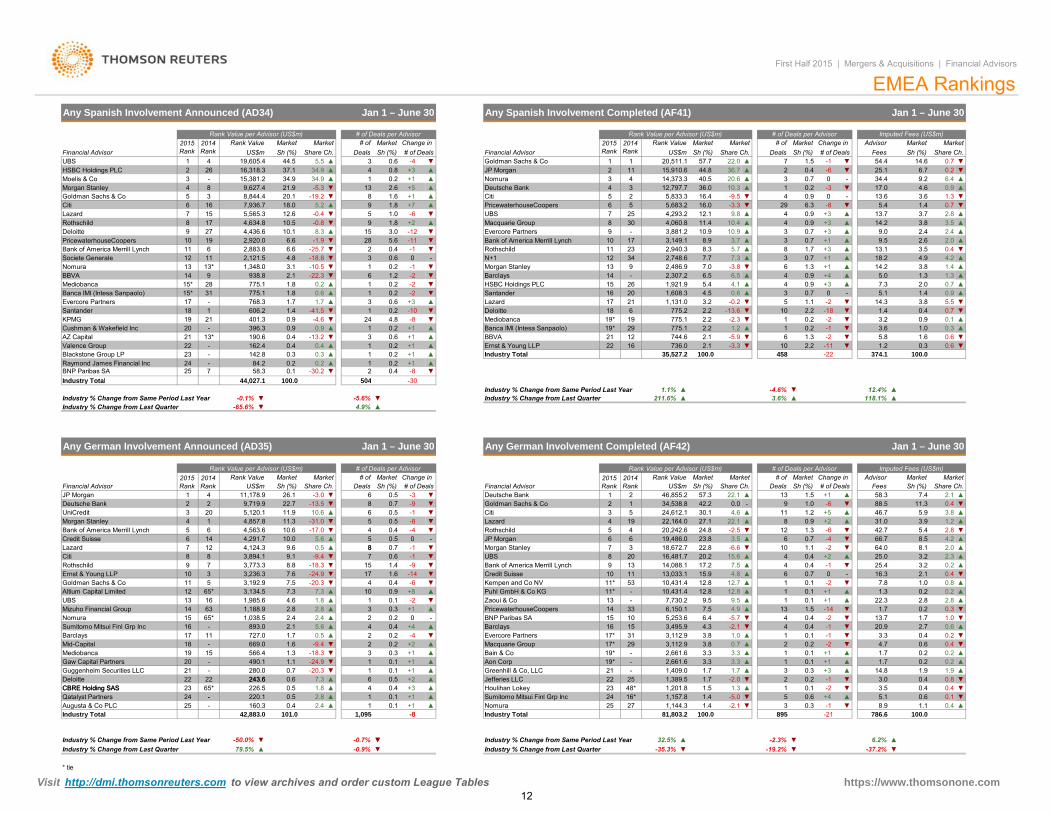
PricewaterhouseCoopers Bank of America Merrill Lynch
100.035,527.2
Change in
▼▼
# of Deals▼
MarketSh (%)
0.7Share Ch.
1.317.0
Advisor
▼ 4.6 0.9
Imputed Fees (US$m)
3.6
MarketSh (%)
▲▼
54.40.2
▲6.4-3
▼-1
10
0.7 -00.41.5
-84
0.96.3
4 ▲▲▼
▼
34.4▲
6.725.1
2.8
▲
▲
▲
5.15.5
▲3.8
1.43.8
EMEA Rankings
FeesMarket
Jan 1 – June 30
3.7
14.6
9.2
5.4 1.413.7
13.60.7
0.7
▲▼
4.9
▲
2.4
1.41.3
▲
0.3
▲0.30.1
1.0
0.70.4▼▼
▼1.60.6
▲
▼0.6
100.0
0.9▼-1
5.8▼ 1.2
-22 374.12.1
3,149.1
3.63.2
-2
4.1
14.3
+1▼▲
-2
+1▲
3
▼
▼
▲
9
8.3 5.7
5
3,881.2
2,486.9 7.0
11.4
-3.8
10.9
3
-9.5
12.1
2,748.6
429
▲
36.0
2,940.3
3
-3.34,293.2
▲
▼
40.5
9.8
12,797.7
36.715,910.6
Rank ValueSh (%)
14,373.3 20.644.857.7
Market
▲2
▼
2014 RankSh (%)
6.6
27
16
▼
▲
▲
03
28
0.62,883.8
▼
4.8
5.6-1
Goldman Sachs & Co
5,833.3
0.8
# of
5,683.2
2▼
# of DealsChange in
15▼
Morgan Stanley
▼14
N+1 12-
▲775.1 0.6
1,348.0 3.1
HSBC Holdings PLCBarclays
15*775.1 -2
Evercore Partners 17 -Banca IMI (Intesa Sanpaolo)
115*
1.7Santander
-2
Deloitte
31
606.2
1.8
0.6-2
9
1.7
111213
BBVA28
Societe Generale6
8.31.8
21.9Morgan Stanley
Mediobanca14
Nomura
Deloitte 910
Market
0.65.5
Bank of America Merrill Lynch
10.5-12
+5
9 1.8
Deals3
Sh (%) DealsUBS
Rank Value per Advisor (US$m)# of Deals per Advisor # of Deals per Advisor
Share Ch.22.0
First Half 2015 | Mergers & Acquisitions | Financial Advisors
Financial Advisor
Any Spanish Involvement Announced (AD34)
US$mMarket
2-3
HSBC Holdings PLC19,605.4
2015 Rank
Moelis & Co
41
6
4
7CitiGoldman Sachs & Co
15
5 3 20.1
4,436.64,634.8
8 9,627.4
7,936.75,565.3
Rothschild
8,844.4
2,920.0
17Lazard
-0.812.6
8
▼0.2
▼▲
-10+3
-1
▼
+1+1
30
▲
0.2
0.60.24.8 -8
▲
0.213
21
▼3.0
BBVA
0.4
19*
6
3
0.2
1-4.6
1
1
24
1.6 +1
+2
504
-11
0.21.2
18.0-19.2
37.1 34.9
-5.3
41
13▼▼
▲34.9 ▲34.9
26
Rank Value2014 Rank
16,318.315,381.2
91.0
Share Ch.Market
▲
▲
▲
Jan 1 – June 30
5.2
23
-
34
+3
7▼
736.0Industry Total
2425
Raymond James Financial IncBNP Paribas SA
100 044 027 1
142.8
Industry Total
0.3Blackstone Group LP
190.9
1.418
Valence Group 22 162.4
SantanderKPMG
121
2.1
19
2,121.5
▲
-22.3
0.3
-401.3 0.9
▼
▼
768.3 ▲-41.5
1.80.2
938.8
-1.9
▼
▼▼
▼
-18.8-25.7
-0.4▼
▲
▼11-10.5
10.1
UBS
▲+7
Evercore Partners15
13*
6.6
1
4,060.8
1
93025
85
20,511.1JP Morgan
-6
16.416.0
4Deutsche Bank
▲ 114
Financial Advisor
2
2
17
2015 Rank
33
Macquarie Group
56
10
-6
-10.3
Any Spanish Involvement Completed (AF41)
0.2
▲
Rank Value per Advisor (US$m)
44.5 1
+1
Citi
▼
11Rothschild
2.6
PricewaterhouseCoopers
13
Nomura▲
8
0.2 ▲
2.22.112
10.98.9
Mediobanca
1,131.0
▼
▲
3.7
7.3
0.9
0.9
▲
0.7
▲
2.2
2.2
6.5
1.3
1 0.2
-11-2
-3.3-5.9
775.1
10.4
7.7
16
+3
744.61.2
▲
US$mMarket
-4
16
21
▲▼
19* 1929
▲0.6
5.4
2.2
▼
775.1
22
16
Ernst & Young LLP
Banca IMI (Intesa Sanpaolo)
+3+3
▲▲9.0 2.4
3.8
▲
3.5
1.3
14.2
4.2
# of
7
▲+32.00.7
0.9
0.7
0.7
1.7 ▲+1
0.49.5
3.518.213.1
2.0▲
2.6
▲
83
7.36.5
▲
5.014.26
▲
0
▲
10▼
34
0.9-
1.3+4
1.43.2
+34-
1,921.9
775.2
2,307.2 0.9
▼-13.6
1,608.3
1817
-2.3 ▼
4.5
6-0.2
20
2.2
26
210.9
-23
190.613* 0.4396.3
Lazard
+10.21 ▲
▲+1
0.4+10.2 ▲
▲Cushman & Wakefield Inc▼
20
0.40.4-13.2
0.284.2--
AZ Capital
▼
0.2
45810
▼
1.15-18
158.3 -30.20.1 2
0.2▼7 ▼-8
▲
Ernst & Young LLP Credit Suisse
Aon Corp
Industry % Change from Same Period Last Year
5
2122
13
8
-
10,431.4
0.4
33
2,661.6
▲0
16
+20.3
0.5
+80.9
+1
▲
15
Houlihan Lokey
4 0.4
0.1▲ 14 6,150.1
Zaoui & CoPricewaterhouseCoopers
▼-
Share Ch.# of
Deals
Any German Involvement Completed (AF42)
934,538.8
Rank ValueRank Value per Advisor (US$m)
-0.0
211.6%
Market
Industry % Change from Last Quarter▲1.1%Industry % Change from Same Period Last Year
Jan 1 – June 30
Industry % Change from Same Period Last Year
Share Ch.
▲
▼0.4
Imputed Fees (US$m)
7.4Sh (%)
MarketMarket
3.9
2.1
▲▲
▲
8.5
5.9
▲
4.22.81.2
58.3+1
▲
2.0
0.4 ▼
▲▲0.2
2.3
-6
118.1%
FeesAdvisor
12.4%
▼
88.53.8
▲▼
▲-4.6% ▼
10
▼17
10
15
1153
910
BNP Paribas SA
0.5
-9
11*▲▲
10.3
+4
-2
4▲
5
2
0.23
Evercore PartnersBarclays
17*
-
0.2 -4
▲Macquarie Group
+3
▲+1
Industry Total
+1
▲+2▲
▲
Nomura
▲
Sumitomo Mitsui Finl Grp Inc2.4
81,803.225
48* 1,201.81,157.8▲0.5
▲ 1,144.316*0.1
▲1▲
-8+1
24
-0.9%
▼▼1.0▲
▲
0.2
0.3
▼▼
▲0.2
0.4
8.9
0.4
2.7
▲0.10.4
0.2▲
▼
0.2
▼
0.60.4
100.0
3.5
786.6
5.1-2
6.2%-37.2%
32.5%Industry % Change from Last Quarter ▼
▼-50.0%-35.3%
-1101.0
▲▼
1,095
2
1
▼-0.7%
4
1.8
# of
-17.0 4
Sh (%)
▼
MarketShare Ch.
6
6
1.8
70.780.6
6
1
2
# of Deals per Advisor
1.4UBS
-14-6
▼1.6
▼
8
Kempen and Co NV
-30
▲
504
▼-5.6%
10.6
Jan 1 – June 30
-1 ▼
▼
1,038.5
3,134.5
▲
4.9%
1.3
63
2.1
7.31,985.6
-
1,188.9
22
566.415
7.3Guggenheim Securities LLC 21
160.3Industry Total
Deloitte
▲
CBRE Holding SAS 226.52322
CBRE Holding SAS243.6
--Qatalyst Partners
42,883.0
79.5%
243.665* 0.5
-25220.124
0.6
0.4-8
0.5-9.4
490.1
▼
280.0
1.6
▲
1920
0.7
▼
-20.3-
▼
-18.3Mid-Capital 18 669.0
Altium Capital Limited
Sumitomo Mitsui Finl Grp Inc 1615Nomura
-
65*
Gaw Capital PartnersMediobanca
+1
Barclays 17-
11 727.0893.0
2.8Mizuho Financial GroupUBS
1465*
▼9.54.9
2.4
0.12.8
▲0.21.30.1
▲+1 ▲
22.3
10.0
3,894.18
4,291.7
▲
2.80.2 ▲
0.8
2.8
-31.0 ▼
Lazard
64,857.8
▼Bank of America Merrill Lynch
▲146
Citi
4.6
9.112 4,124.37
Rothschild 798
7.557.3
13
3Goldman Sachs & Co 11 -20.3
1.75.6
-24.9
2.4
10
1216
3,192.97.63,236.3
-24.9 ▼1.1
▼
0.50.4
Greenhill & Co, LLC0.1
0.1
▲
0.5
Market
0.7▼▼-3
# of DealsDeals
-13.5 ▼
▲
-3.0Financial Advisor
17*
▲
Rothschild
11*
Industry % Change from Last Quarter
22.1
17.2
3,112.9
12.8
15.9
5,253.6
Change in
-9 21 2
-4
Puhl GmbH & Co KG
-8▼
0.3
0.1
14,088.113,033.1
JP Morgan
20.2
▼
▲▲
12.8
▼12.8
Augusta & Co PLC1.4
1.1895
▼
▼
6
16,481.7▼▼
5 08
▲
Bank of America Merrill Lynch
0.5
13
-1-
Morgan Stanley-1 20
67
158.8 -18.3
4,563.6
-9.49.6
3,773.3
5.610.6
0.5Credit Suisse
2Deutsche Bank
5
11,178.922.7
5,120.143 11.9UniCredit2
Rank Value per Advisor (US$m)
Industry % Change from Same Period Last Year
209,719.9
1Financial AdvisorJP Morgan
Sh (%)
Morgan Stanley 1 11.3
100.044,027.1
Rank Value
▼
Any German Involvement Announced (AD35)
▼Industry % Change from Last Quarter -65.6%
2015 Rank
Market
26.1
2014 Rank US$m
-0.1%
4
Industry Total
▼
▼
3.0
1.7
▼
▲+3-1
+1+1
+4
1.9
-21
0.1
▼ 3.23.2
2.1
64.0
1.0
8.1
25.4
11.3
42.7
25.0
3.3
1.7
31.0
0.420.9
0.2
5.4
1.713.7
0.8
4.71.7 0.2
1.9
0.6
0.6
0.4
-4
16.3
-2
▲-2
-1▼
▼▼
-1
46.7
66.7▼
-2 7.8▼
+5+2-6
+2
▲
▲
▼▲
11
1.5
▼
▲
▼
▲
0.4
Market# of Deals
Change in
-00.7
0.9
1.4
2014 Rank
27
2,661.6
▼
▼
Bain & Co
46,855.2US$m
42.2Deutsche Bank
Sh (%)2015 Rank
57.3
CitiGoldman Sachs & Co
1951
34Lazard
422.1
4.6
20,242.6
▲
▲22,164.0
3.53
▼
30.1
23.818,672.7
27.1▲
-6.622.819,486.0
24.8
24,612.1
▼
12.8
-2.5
6▲
11
▲
15.6
▲
29
23
▲ 31
Jefferies LLC 25
30.2
+10.1
▼
▲
3.3
0.4▲
+1 -19*19*
3,112.9
▲
0.7▲
9.5
3,495.9
-3.8
7.56.4
7,730.2
14.3
2
44
1.0-2.1-5.7
▲3.8
3.3 3.3
▲1.7
1.51.7
1.3▼
5
-
10,431.4
1,389.5
▲1,409.0 1.7
3.33
▲
▼-5.0
-2.01
▼-2.1
▼
▲▲
1
3
14.8▲2 0.2
0.30.6
1
▼-19.2%-2.3%
100.0
▼
1
0.413
0.4
1.0
81.2
4
-14
1.1
1.36
12
0.1
1.5
410 -2
13
▲
Sh (%)Market
0.7
0.4
12.74.87.5
# of Deals per Advisor
3.6%
-1
▼
0.20.1
0.1
* tie
https://www.thomsonone.com Visit http://dmi.thomsonreuters.com to view archives and order custom League Tables12
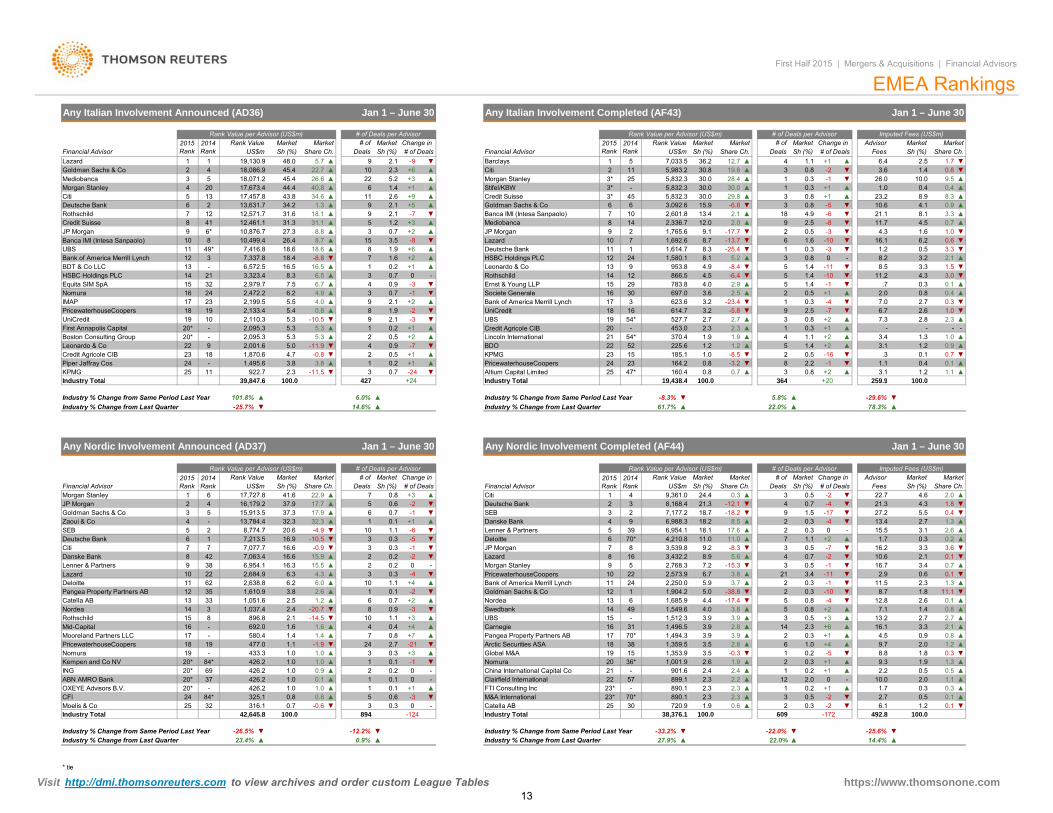
Banca IMI (Intesa Sanpaolo) Lazard
Credit Agricole CIB
2014 Rank
5
Equita SIM SpA
# of Deals per Advisor
Sh (%)Market
2.1
▲
# of Deals
▲
Change in
111.42.6
9
40.8
1022
Rank Value per Advisor (US$m)
25
4530.0
Rank Value
-9Share Ch.Sh (%)
3*+1
6.4+1▲ 11 5,983.2 19.82
36.2Citi
1
9
0.3
4
▲29.8
2.0
30.8
▲3
-
12.7 ▲30.8
-11
-10▼▼1.6
0.3
-2
Fees
Any Italian Involvement Completed (AF43)
0.3
-3
MarketMarket
▲30.0 28.4
-7
▲30.0
-6.813.4
▲-
▲
▲▲
▼
# of
▲0.930.0
14
+55,832.3
▲ 15.9Goldman Sachs & Co 6▼
▼
15
0
0.7
9
8
+2
0.9
17
+2
+2+6
1.98
-1
0.7
5.35.3
1,495.6922.7
4.71,870.6
+2439 847 6 100 0
-11.9
▼
▼▼
▲-11.5
3.8
▲21.1
1.6
▲
▲0.8
5.3-10.5
-2
4
▲
3.6
▼▼ 1.0
0.73.3
10.6▲
18
1.0
0.810.0 9.5
1.4▼
0.4
500.8
3
2.5
8.9
-8▼
4.5-6
1,692.6
4.03.6
▲
0.8
-3
▼
▼
-1
-5
8.3
26
35.2
-13.7 ▼▼-25.4
2.7
4.9
8.7
2.1
▼3
1
9.1
8.11.4
-7
1
427
▼
3.2
-8.4
▲-5.8
30783.8
527.73.2 9UniCredit 614.718 162.719UBS
PricewaterhouseCoopersAltium Capital Limited
1.9
25
212.3
▲
2347*
24160.4
Industry Total
370.4Lincoln International+2
▲
▼▲
-24
+1-32.1
▲
+1
12
▼
2.1
0.2
▲
▲
▲
0.2
9
9
3
0.5
▲ 3
8.8 ▲
▲
31.1 518.1
Share Ch.Sh (%)
13
6.7
10,499.4
20* -
UniCredit
18
16.5
31.6
2,095.3
2,001.6 5.0
6.5
2.311KPMG-24Piper Jaffray Cos +1
▼
0.5
4.9
5.3
- 16.5
6.24.0
6,572.5
24
2,110.310
-0.83.8
22
25
23
Industry Total
Leonardo & Co
First Annapolis CapitalBoston Consulting Group
9Credit Agricole CIB
-20*
HSBC Holdings PLC7.58.3
5.4
2,095.3 5.3
23 5.5Nomura
19
IMAP 2,199.518PricewaterhouseCoopers 2,133.417
19
11
2,472.2162,979.715 32
21 3,323.4
7,337.8
Rothschild
13
JP Morgan
3
14BDT & Co LLC
UBS
9 6*10
6
12
7
Bank of America Merrill Lynch
12,461.1
849*
8 41
7,416.8
17,673.45
10,876.7Credit Suisse
Morgan Stanley
2
Rank Value
▲1
Market2015 Rank
Market2014 Rank
19,130.9
Rank Value per Advisor (US$m)
MediobancaGoldman Sachs & Co
Financial Advisor
4Lazard
Any Italian Involvement Announced (AD36)
Deutsche Bank
20Citi
13,631.7
4
US$m
3 18,071.2
12,571.7
5
▲▼▲
18.6
17,457.8
122
1
0.9
0.224
3 0.7
Jan 1 – June 30
Barclays
▲
Financial Advisor2015 Rank
10
2
First Half 2015 | Mergers & Acquisitions | Financial Advisors
0.8
Jan 1 – June 30
1 ▼18,086.9
7,033.5 1.7Deals
0.8
4
364
0.5
2.5
▲
8.21.2
+1
26.0
▼8.3
4.1
+1
▼
259 9
2.0
1.0
0.4
▲
1.5
▲
0.1
8.1
▲
+201.1
100 0
6.7
-▲
-
▼0.5
▲0.3
+1
-11
0.3
-
▲
3.1
▼
2.7
6.2
0.4▼
23.2
11.7
▼3.0
-2.8
▲
2.62.3
▼1.0▼
▲0.9
▼0.10.4
▲
1.2
3.3
3.4
8.5
0.8
4.3.7
11.2
7.3
1.3
7.0
Sh (%)
Imputed Fees (US$m)
# of DealsAdvisor
3.3 ▼
4.30.6
▲
▼
3.2 2.1
16.1
Share Ch.
# of Deals per Advisor
1
US$m Sh (%)Market
1,765.612.0
+6
6
Market
1
MarketDeals
1.1
# of
5,832.3
11
+3
▲+93*
43.8 34.6
18.6
26.6
91.3
▲▲
45.4
48.045.4
44.4
22.75.7
2.1
1.2
▲
MediobancaJP Morgan
▲
+32.1
▼▼
4.5
▼2.5
26.4 8.7 3.51.91.6
9
3
13
17
14
▼
1.4 ▼
4.9-10
+10.5
866.5
623.6
15 ▲
1
52
1.4
+2-7
▲
0.3
0.3
▼-4
453.0
19 438 4
225.6
▲
185.1
▲
164.2
5
1.2
0.8
697.0 2.5
2054*
-
29
1.1▲
+2
▲
100 0
Morgan Stanley
-6.42.9
-23.4
12Ernst & Young LLPSociete Generale 16
▲
7
7
2.31.9
Leonardo & Co 953.8
22BDO
▲1,580.11,614.7
5,832.3
2.3
12
31.327.3
18.4 -8.8+1
5.2
0.73
34.2
▲
3,092.6
EMEA Rankings
▼-17.7▲2,336.7
2,601.8
Change in
Credit SuisseStifel/KBW
Rothschild
3*
▲
▲
-8
-3
▼▲
▼ 54*
6▲
▲
24
10Deutsche BankHSBC Holdings PLC
23
9
Banca IMI (Intesa Sanpaolo)
▼
▼
Bank of America Merrill Lynch
52KPMG▲
▲
-
8
152.2
528
1.4▼▼
0.8
+20.51.0
0.8
1.2-8.5-3.2
▼0.7-1
+2
3.1.3
1.10.1
1.20.7
▲
3▲
-16▼▲
▲
Lazard PricewaterhouseCoopers
5
+1
3
-11
0.3
-15.3 ▼0.7
1531
0.5
0.3
3.9
3
0.825
▲
4.0
-8.3 0.5
▼
12
11.0
▼
▼
609
Morgan Stanley
11.0
5.6
0.4
▲-
China International Capital Co 21Clairfield International
Goldman Sachs & Co 12 1 1,904.2
8.9
M&A InternationalCatella AB
UBS
FTI Consulting Inc
Global M&A
2223*23*
27.9%
38,376.1
16
25
+4
▲
0.6720.9
-21
-
+3
00
▼
100.0
▲22.0%
Industry Total
-33.2%▲▼
1.9▲
-172
-22.0%
▼2
▲0
-2+1
-2.0
2.6
▲▲
0.3
▲
2.3
0.32.3
1.9
2.2899.1 2.32.4
30.2
890.1 0.52.32.3 1
+1▲ 0.2 2.2▲ 2 9.3
+1▲▲
1,353.9 -0.3 8.81▲
0.2 -5▼ ▼9.7
2.7
4.5
▲
3.5
Carnegie 2.31,512.3-
19 151.0 ▲
0.57.1
▲0.816.1 2.1
0.9
13.21,496.5
▲3.9▲
▲
▲0.33.9 +6
2
1,549.6 ▲+20.83.9
2.8 61,494.3
2.8
+4
-10-17.4
▲+3
-38.8 ▼▼
3.8 ▲
14
▼
0.3
2
▲0.70.5
▲1.5
3-12.1
1,001.9
3.5
901.6
30
1,359.5
36*2.4
890.170*
-
▼▲
Change in
+24
101.8% 6.0%
Market
39,847.6 100.0 427
2014 Rank Share Ch.
Rank Value per Advisor (US$m)
▲
Market
Industry Total
MarketMarketFeesDeals
Change in 2015 Rank
▼
Market
▲
▲▲
Rank Value per Advisor (US$m)Rank Value
# of Deals per Advisor
14.6%-25.7%
▼
Nordea
Pangea Property Partners AB
▲-3 ▼
0
Swedbank+3
▲
Arctic Securities ASA
5
0.7
Bank of America Merrill Lynch▼
-1
▲
+20.9
Lenner & PartnersDeloitte
0.2
20
9
13
-1
10
+7
0.3▲
4.4
18 3817
49
70*
146
3.9
1,685.9
16
70*87
18.7
9.2
2
6,954.16
4
426.2Nomura
▲
0.1-
0.2
68
433.3
1.1
▲
0.3
-2
6
3
1.10.1
3
+4-4
-2
▼
0.8
23.4%-12.2% ▼
Industry % Change from Last Quarter0.9%-26.5%
0.1
▼0.2
32
-25.6%
100.0
-57
11
477.0
US$m
32.3-4.9
-14.5
20.6
17,727.8
MarketFinancial Advisor
Industry % Change from Last Quarter
2015 Rank
Any Nordic Involvement Announced (AD37)
Industry % Change from Same Period Last Year
Industry Total
Share Ch.# of
Jan 1 – June 30
Deals
32.3
37.9
Sh (%)22.9 ▲
▲
41.6▲
17.917.7
13,784.437.3
▼
7
-0.9▲8
8,774.7
16.6
10 2,684.922
16.6
7,213.5
11
15.5
▼-20.72.4
▲1.2 ▲2.6
2.5
▲ 0.3
7 0.824 2.7
3
1
▼▼
▲
-2
+1-610
10
10
▲
+3
▲
0.1
1.0
1▼
1.0
16.93
0.3
0.60.8
SEB 3
9,361.0Sh (%)
1.0
1.1
Industry % Change from Same Period Last Year
▼
Lazard
20.7
Deutsche Bank5
▼
1.0
0.91.0
-0.6
▲
▲
-1.9
▼
▲
0.60.8
2
1.00.1
0.70.5
1.7
▼
2.7 ▲1.2-2 6.1
100.0492.8▼
▲14.4%
27.2
23.7
▲
▲
▲
▼-4
-1
-1
2.3
▲8.5
3.8
3▲ 10.6
15.5
12.88.7 ▼
3.4
11.52.9
▲
2.6
1.30.1
1.7
▲▼
0.23.3
16.7
0.30.3
5.5
▼
16.2
-▲▼
0.3 ▲
-4
21
▲
-2
+2
3.4
1.1-7
02
▼
5
▼
18.14,210.8
2,250.02,573.92,768.33,432.2
17.6
-2
4
▼
13.4
4US$m
▲
8,168.4
24
Industry % Change from Last Quarter
Financial AdvisorSh (%) # of Deals▼24.4
-8.3%Industry % Change from Same Period Last Year
Citi 1
# of
364
Market
259.9
▼
# of Deals per Advisor
+20
-17
7
0.5
22.0%-29.6%
# of Deals
10.0
4.6
▲
100.0
Imputed Fees (US$m)
2.7
Sh (%)
0.31.1
2.0
1.9
▲
0.5▲
▼
▲
0.1▼0.1
▲
▲0.81.4
▲1.8
1.3
1.20.3
3.3
3.1
▲
11.10.1
1.8
0.1
▲
0.60.7
2.1
▼
Share Ch.▲
1.8
▼
▼0.41.3
3.6
2.6
Market
2.022.7
Advisor
Jan 1 – June 30
▼4▼
7,177.2 9
19,438.4
5.9
8
6.77.2
-18.23
▲
0.1-3
▲
0.3
0.3
3Moelis & Co-124
0
426.2
325.184*316.1
42,645.82524
Industry Total
Industry % Change from Last Quarter
ING20* 84*
894
OXEYE Advisors B.V.ABN AMRO Bank
CFI
NomuraKempen and Co NV
15Mid-Capital
20*
20*
Rothschild
PricewaterhouseCoopers
-
38
-
14
19580.4
6,954.1 16.3
1.6896.8 2.1
1,610.96.2
692.0
1,037.4
2014 Rank
7
-
3.81,051.6
3533
62
16,179.215,913.5
1 6
65 2
42
1
Morgan Stanley
7Deutsche Bank
1.4 1.4
3JP Morgan
Industry % Change from Same Period Last Year
2,638.8
9
Catella ABNordea
Pangea Property Partners AB
426.269
19
37426.2-
20*
SEB
Lenner & Partners
Deloitte
16
-
1213
Mooreland Partners LLC 1718
Goldman Sachs & CoZaoui & Co
7,077.77,063.442
Citi
45
Danske Bank38
4.3
2.7
-4 ▼
▼
2.0
▼
78.3%
4
18.2
▼
21.3
Any Nordic Involvement Completed (AF44)
5.8%
6.04.36.3
1.1
▲
Sh (%)
Danske Bank
-
-1
5.0
1.6
6,988.3
11
2
22
1.0
▲
1.0
▲▲
21.3
▲
15.9
100.0
3,539.8-10.5
Rank Value
9
▼61.7%
JP Morgan▼
39-5
▼▼
11
▼5
▲
▲ +1
2
* tie
https://www.thomsonone.com Visit http://dmi.thomsonreuters.com to view archives and order custom League Tables13
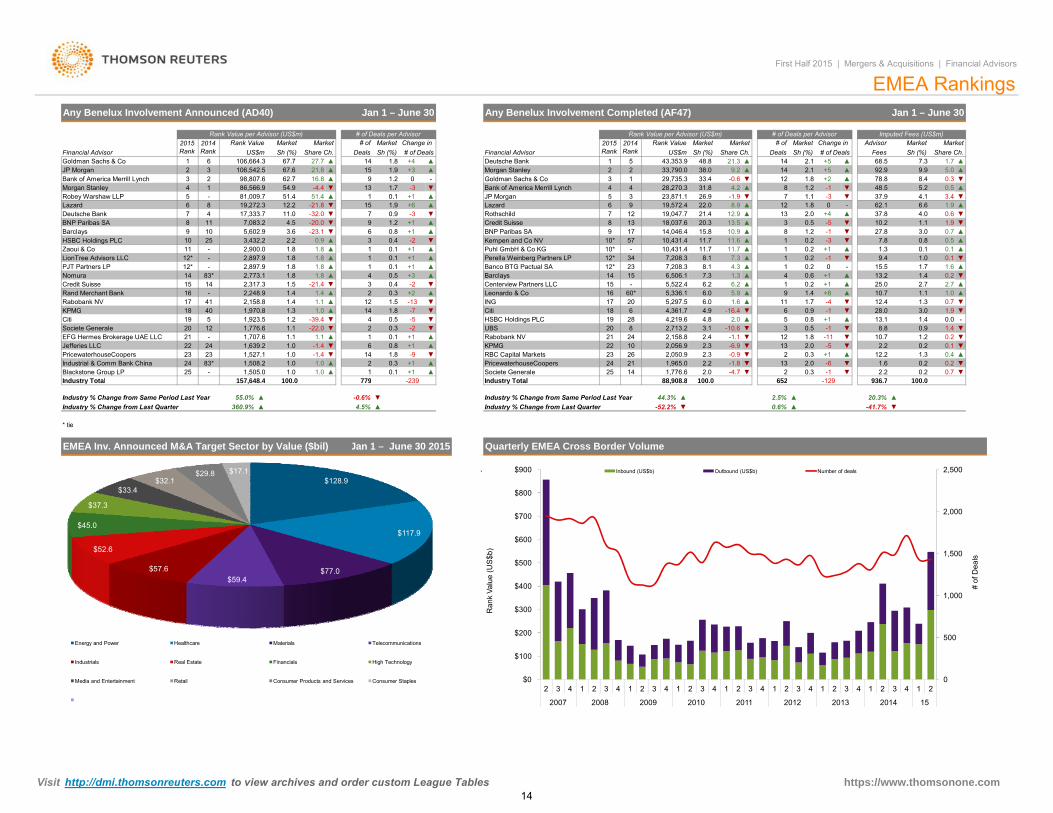
HSBC Holdings PLC Kempen and Co NV11.7
-16.4▲
▲4
0.96
6.2 ▲
2,050.9
2.2
1.6
2.0
11
▼
-6.9
12
2.1-0.6
1.45,522.4
▲
0.2+8
▼
5.9
7.3
# of
10.9
1▲
▲
▼
14Deals
▲▲
Share Ch.
74.2 -1
+5
10.2
+5
3
8+2
0.2
14
+1
▲
1313.5
0
▲
▲
11.68 ▼
-1.9▲
21.3
▼
8.9
38.02
2015 Rank
1
Rank Value per Advisor (US$m)Change in
+6
-3
▼-3
ING
Barclays▲
14,046.4
10* 10,431.4
▼
Goldman Sachs & Co▲ Morgan Stanley 2
12* 34
10,431.4 11.711.7-
▼
100 0
6.0
8.1Perella Weinberg Partners LP
142312*
-22.0 3.1▼0.5
Banco BTG Pactual SA
▲▲
+1
UBS
0.8
▼
0.1
▼▼12.2
1,776.6936 7 100 0129100 0
Societe Generale 2.0 -1▼▲ 14
2
6522
13▼-0.9
2.2▲2.3
88 908 8-4.7
▼ -5 ▼
▼0.2 0.7
0.4 ▲0.2
1.30.2
0.213 2.02.3
2.00.3
2.2 -1.8
120.1
▼ 10.7 ▼
0.3
+10.2
-6 1.6
▼
▼
-110.50.8
3 -15 +1
1.8
1312.9
129.2
26.9
20.3
33.4
21.4
15.8
31.8
33,790.0
28,270.323,871.1
2.1US$m
MarketImputed Fees (US$m)
Any Benelux Involvement Completed (AF47)
Change in Sh (%)
▲
43,353.9 48.8# of DealsSh (%)
Rank Value Market
1.8
68.592.9
▲
0.3▲5.0▼
1.79.9▲
Market# of Deals per Advisor
Financial Advisor
239
1.1
2
Any Benelux Involvement Announced (AD40)
JP Morgan
2015 Rank
106,664.321.8
▲
Rank ValueUS$m
EMEA Rankings
Sh (%)1427.7 +4
2014 Rank
# of Deals per Advisor
Jan 1 – June 30
Market
61
33
Rank Value per Advisor (US$m)
67.6
Share Ch.Market
▲▲62.7
-4.4
67.7
▼
12.251.4
▼
54.916.8
-21.811.0
51.4
4.5
DealsSh (%)
9
Market
4.9
0.9
+1
-▼
-32.0
0.1
0.8▼
Centerview Partners LLC0.4+3
▼0.5 ▲
57
15 -34
1828
26
7,208.3
-20.0 1.2179
60*
7,208.3
▼-10.6
4.8▼
Citi
8.17.36,506.1
4,219.6
24
201617
-1.12.42120
619
4,361.7HSBC Holdings PLC
KPMG2,158.8
PricewaterhouseCoopers
2,713.2
2,056.910
1,965.0RBC Capital Markets
24 212322
8
Industry Total25
Rabobank NV▼
12 -13-7
2 +2
-20.3
0.1
1.8
-51.8
4
+1
-9▲
▲ 11.01.0
0.3▲+1+1
6
779157 648 4
1,508.214
▼
21.0 ▼
1
1,527.1
▼
▲
1,505.0
1.1▲
2▼
14
▲
▲
6.2 +1
-41.5▼
▲5,297.5 6.05,336.1
▲
0.2▲
▲▲
1.42.7
0.1▲
▼-
0.7
▼
▲1.7
▲
0.2
27.810.2
10.2
0.11.3
▲1.6
0.6
0.1
13.21.7
-3+1
-2
▲▼
0.5
1
▲
+1 Puhl GmbH & Co KG
4.3
19
1.3
8 22.0
-20.3 Leonardo & Co
15
Jan 1 – June 30
-19,572.4
13 ▼▲9
5Deutsche Bank15
▲1.9
1.2
7.3
AdvisorFees Sh (%)
1.2
▼
▼
1.4
▼
▲1.9
10.7
4.1
Market
78.8
3.4
▲
62.1 6.637.948.5
Share Ch.
▼
0.7▼
▼
0.0
▼
28.0
25.0▲
1.015.5
2.7
-1
▲
-1
13.1 1.41.9
1.012.4
1.11.3
▼
-
▲▲
▼
9.4
8.8
3.0
0.9
▼
▲3.0 ▲
0.5
4.0▼1.1
First Half 2015 | Mergers & Acquisitions | Financial Advisors
▼
8.4
Market
5.2
1.937.8 0.6
1
▼
Credit Suisse
▲
BNP Paribas SA▲
12
10*
8Rothschild
3
3
18,037.6
JP Morgan6
19,047.79
4429,735.3
1.8 ▲
0.9
▲ +1
7▲
5
▼
0.1
▲1.9
1.701.2
Bank of America Merrill Lynch
Lazard
+3
# of Deals1.8
-
0.1
0.4
81,009.71
1.8+1
▲
▲
+1
Lazard
8 11 7,083.2
19,272.3
Goldman Sachs & Co
86,566.92Bank of America Merrill Lynch
106,542.5
Morgan Stanley 498,807.6
10
6 15
-23.1 63
5
4
Financial Advisor2014 Rank
▲
17,333.7BNP Paribas SADeutsche Bank
-
12* 2,897.92,897.9
259
7
11
Barclays
Robey Warshaw LLP
1.8
2,900.0LionTree Advisors LLC
14
3,432.210
23
20
PricewaterhouseCoopers
19
Zaoui & Co
83*
17
Citi
15
22
18
EFG Hermes Brokerage UAE LLC
Industry Total
23
21
-
NomuraCredit Suisse
Rabobank NV-16Rand Merchant Bank
-12*
14
12
24
2,317.3
2,158.8
PJT Partners LP
Societe Generale
1.8
1.11,776.6
41
24 1.01.1
2,773.1
-
1,970.85
2,248.9
1.0
Blackstone Group LP
1.5
-83*
25
40
Industrial & Comm Bank China
KPMG
1.0
-1.41.0
Jefferies LLC
1.21,923.5
2.2
-39.4
-1.4
1.8
1.8
1,639.2
1.81.8
1.4-21.4
3.6
1.4
0.81.2
1.1 -30
+4-5
1.82.00.5
-17.8
1,707.6
5,602.9
1.31.4
▲ 1▲ 1
1
+11
▲
7▼
# of
0.1
Quarterly EMEA Cross Border Volume
100.0 936.7
▲▼▲
▼ 0.6%
100.0
20.3%▲
-129100.0
2.5%Industry % Change from Same Period Last Year 44.3%
Jan 1 – June 30 2015
▲ Industry % Change from Last Quarter▼
652
▲
88,908.8-239
▲
* tie
Industry % Change from Same Period Last Year ▲ -0.6%Industry % Change from Last Quarter 360.9% 4.5% -41.7%-52.2%
55.0%
Industry Total779157,648.4Industry Total
EMEA Inv. Announced M&A Target Sector by Value ($bil)
$128.9
$117.9
$77.0$59.4
$57.6
$52.6
$45.0
$37.3
$33.4$32.1
$29.8 $17.1
Energy and Power Healthcare Materials Telecommunications
Industrials Real Estate Financials High Technology
Media and Entertainment Retail Consumer Products and Services Consumer Staples
`
0
500
1,000
1,500
2,000
2,500
$0
$100
$200
$300
$400
$500
$600
$700
$800
$900
2 3 4 1 2 3 4 1 2 3 4 1 2 3 4 1 2 3 4 1 2 3 4 1 2 3 4 1 2 3 4 1 2
2007 2008 2009 2010 2011 2012 2013 2014 15
# of
Dea
ls
Ran
k Va
lue
(US
$b)
Inbound (US$b) Outbound (US$b) Number of deals
https://www.thomsonone.com Visit http://dmi.thomsonreuters.com to view archives and order custom League Tables14
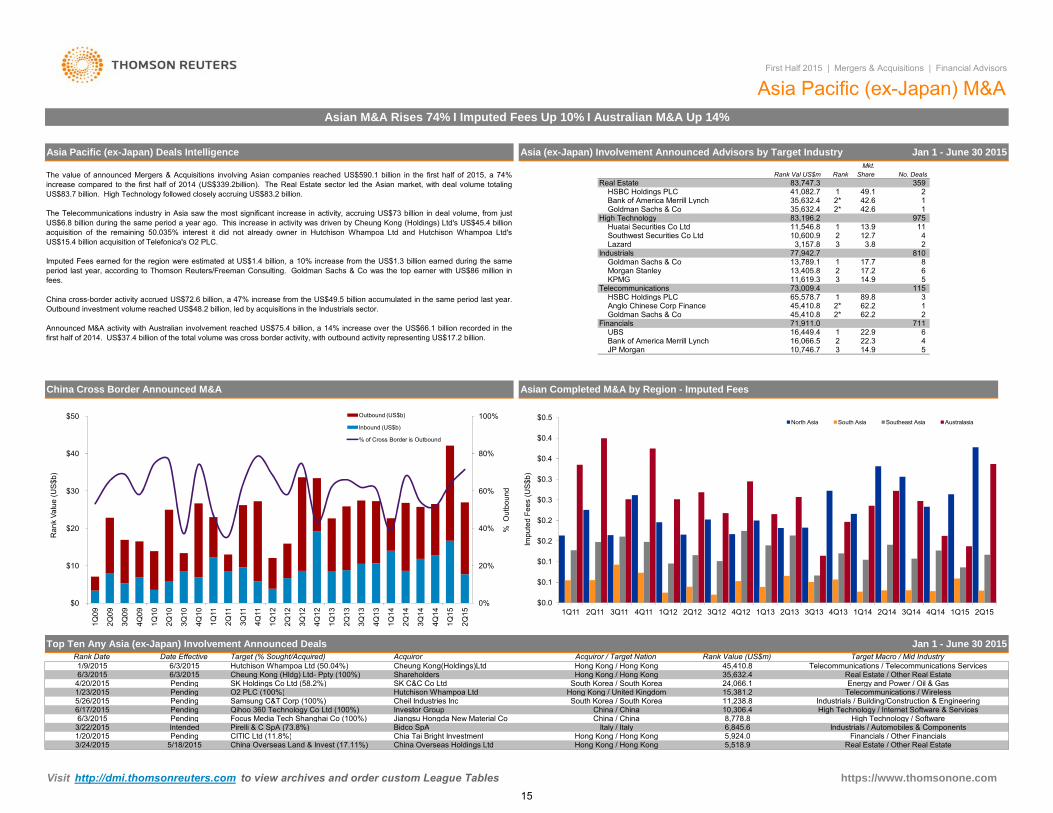
62.2 1Anglo Chinese Corp Finance
22.922.3
First Half 2015 | Mergers & Acquisitions | Financial Advisors
Asia Pacific (ex-Japan) M&AAsian M&A Rises 74% I Imputed Fees Up 10% I Australian M&A Up 14%
13,789.1
10,746.7 4
Morgan Stanley
1 616,449.4 71,911.0
516,066.5
Goldman Sachs & Co 1
KPMG
1
2*
High Technology2*Goldman Sachs & Co
13,405.8
Southwest Securities Co Ltd
77,942.7 Industrials3
1
Rank Val US$m83,747.3
ShareMkt.
Rank
49.1
183,196.2 35,632.4 35,632.4 Bank of America Merrill Lynch
HSBC Holdings PLCReal Estate 359
No. Deals
Asia Pacific (ex-Japan) Deals Intelligence
HSBC Holdings PLC45,410.8
Telecommunications
41,082.7
73,009.4 65,578.7
Asia (ex-Japan) Involvement Announced Advisors by Target Industry
14.9
3,157.8 Lazard810
115
The value of announced Mergers & Acquisitions involving Asian companies reached US$590.1 billion in the first half of 2015, a 74%increase compared to the first half of 2014 (US$339.2billion). The Real Estate sector led the Asian market, with deal volume totalingUS$83.7 billion. High Technology followed closely accruing US$83.2 billion.
The Telecommunications industry in Asia saw the most significant increase in activity, accruing US$73 billion in deal volume, from justUS$6.8 billion during the same period a year ago. This increase in activity was driven by Cheung Kong (Holdings) Ltd's US$45.4 billionacquisition of the remaining 50.035% interest it did not already owner in Hutchison Whampoa Ltd and Hutchison Whampoa Ltd'sUS$15.4 billion acquisition of Telefonica's O2 PLC.
Imputed Fees earned for the region were estimated at US$1.4 billion, a 10% increase from the US$1.3 billion earned during the sameperiod last year, according to Thomson Reuters/Freeman Consulting. Goldman Sachs & Co was the top earner with US$86 million infees.
China cross-border activity accrued US$72.6 billion, a 47% increase from the US$49.5 billion accumulated in the same period last year.Outbound investment volume reached US$48.2 billion, led by acquisitions in the Industrials sector.
Announced M&A activity with Australian involvement reached US$75.4 billion, a 14% increase over the US$66.1 billion recorded in thefirst half of 2014. US$37.4 billion of the total volume was cross border activity, with outbound activity representing US$17.2 billion.
42.6
11,619.3 2
975 1
2
711
12.711
2*3
14.9
62.2
8
53
4
Jan 1 - June 30 2015
6
3.8
2
42.61
2
Financials
11,546.8 13.9
17.7
Huatai Securities Co Ltd10,600.9
89.8
17.2
2
45,410.8 2*
3Bank of America Merrill Lynch
2
JP Morgan
UBS
Goldman Sachs & Co
3/24/2015CITIC Ltd (11.8%) Chia Tai Bright InvestmentPending Hong Kong / Hong Kong 5,924.0
5/18/2015 China Overseas Land & Invest (17.11%) China Overseas Holdings Ltd Hong Kong / Hong Kong 5,518.91/20/2015
High Technology / Software6,845.6
Jiangsu Hongda New Material Co
Hutchison Whampoa Ltd Hong Kong / United Kingdom
Shareholders
8,778.8
35,632.4
Investor GroupChina / ChinaFocus Media Tech Shanghai Co (100%)
Telecommunications / Telecommunications ServicesRank Date Date Effective Target (% Sought/Acquired) Target Macro / Mid IndustryRank Value (US$m)1/9/2015
China Cross Border Announced M&A
Cheung Kong(Holdings)LtdCheung Kong (Hldg) Ltd- Ppty (100%) Hong Kong / Hong Kong6/3/2015
4/20/2015 Pending
45,410.86/3/2015
SK C&C Co LtdSK Holdings Co Ltd (58.2%)
5/26/2015 Pending Samsung C&T Corp (100%)1/23/2015 O2 PLC (100%)Pending
3/22/2015
6/17/2015
Intended Pirelli & C SpA (73.8%) Bidco SpA Industrials / Automobiles & Components
Asian Completed M&A by Region - Imputed Fees
15,381.2South Korea / South KoreaCheil Industries Inc
South Korea / South Korea 24,066.1
11,238.8Telecommunications / Wireless
Acquiror / Target Nation
Industrials / Building/Construction & Engineering
Top Ten Any Asia (ex-Japan) Involvement Announced Deals
Hutchison Whampoa Ltd (50.04%)Acquiror
6/3/2015Real Estate / Other Real Estate
China / China
Italy / Italy
Jan 1 - June 30 2015
Hong Kong / Hong Kong
Energy and Power / Oil & Gas
Real Estate / Other Real EstateFinancials / Other Financials
High Technology / Internet Software & ServicesPending Qihoo 360 Technology Co Ltd (100%)6/3/2015
10,306.4Pending
0%
20%
40%
60%
80%
100%
$0
$10
$20
$30
$40
$50
1Q09
2Q09
3Q09
4Q09
1Q10
2Q10
3Q10
4Q10
1Q11
2Q11
3Q11
4Q11
1Q12
2Q12
3Q12
4Q12
1Q13
2Q13
3Q13
4Q13
1Q14
2Q14
3Q14
4Q14
1Q15
2Q15
% O
utbo
und
Ran
k Va
lue
(US
$b)
Outbound (US$b)
Inbound (US$b)
% of Cross Border is Outbound
$0.0
$0.1
$0.1
$0.2
$0.2
$0.3
$0.3
$0.4
$0.4
$0.5
1Q11 2Q11 3Q11 4Q11 1Q12 2Q12 3Q12 4Q12 1Q13 2Q13 3Q13 4Q13 1Q14 2Q14 3Q14 4Q14 1Q15 2Q15
Impu
ted
Fees
(US
$b)
North Asia South Asia Southeast Asia Australasia
Visit http://dmi.thomsonreuters.com to view archives and order custom League Tables https://www.thomsonone.com 15
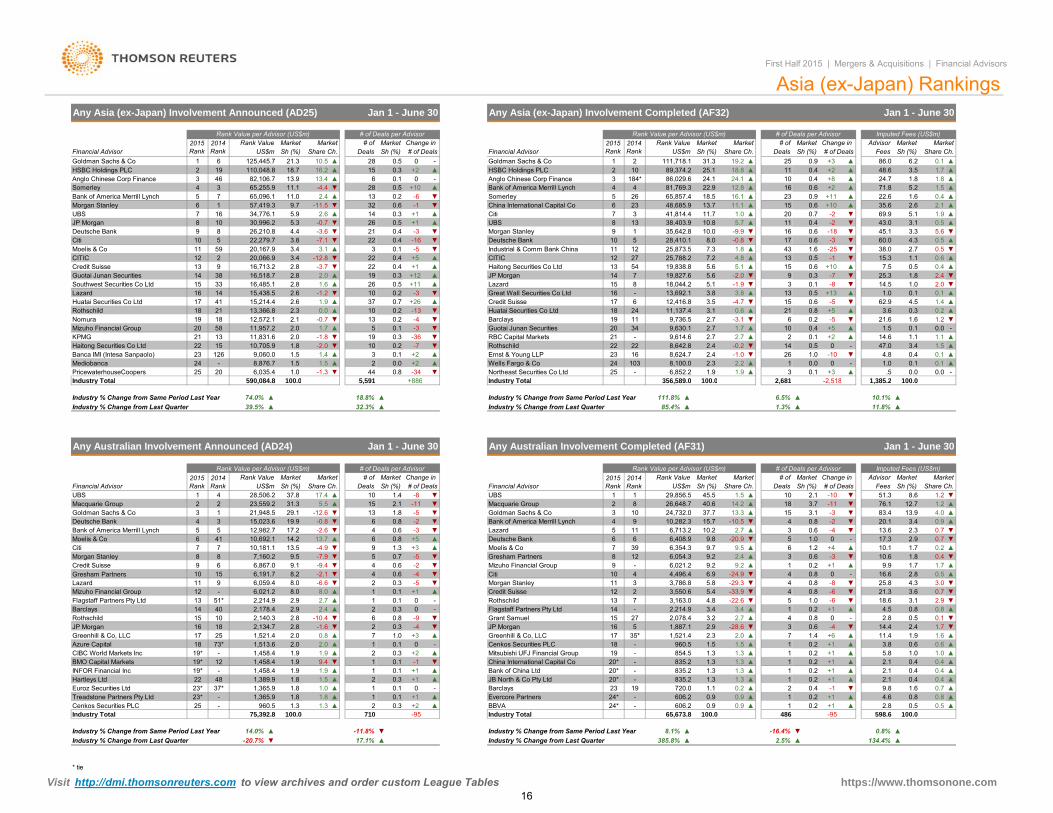
Citi Deutsche Bank
100 0Industry Total 2 681 1 385 25 591
- 1.114.6
▼2.4
7
356 589 0
8,100.0
9,736.5
15
2223
▲
2021
▼
▼
+11
4.4
▲
-1.2
1.8
▼
5.3
▲
▼-0.7
▼
-34590 084 8
▲
41
21 13
22
+886100 00.8▼
1.7
-2.011,831.6 2.0 -1.8 ▼
0.1
44
2.4▼
13
0.10.5
-6Bank of America Merrill LynchSomerley▼
0+10
Anglo Chinese Corp Finance
-3
5
-7
0.1
22
▲
-0.71.7
10
2.7-3
▼ -0.20.219
9,630.1
Any Asia (ex-Japan) Involvement Completed (AF32) Jan 1 - June 30
# of Deals per Advisor
1
Somerley 4 3
2
KPMG
Credit Suisse +12.8▲
Morgan Stanley7UBS 16
0.3
110,048.8 +2
-3.7
▲
11.1
16.2
0.2
34,776.1 5.9
▲6
65,255.9
20,167.9
Rank Value per Advisor (US$m)2015 Rank
2014 Rank
Rank Value
-
00.3
Goldman Sachs & Co
Imputed Fees (US$m)
Sh (%)-
Anglo Chinese Corp Finance 3 46 82,106.7
▲
5.126
13
0.3 14LazardJP Morgan
0.737 6
5.6
15
9.72.6 14
3.1 ▲
19,827.6
-11.5 ▼
Change in # of Deals
# of
18,044.2
10
19
13,692.1Credit Suisse▲
618.7 ▲
Rank Value per Advisor (US$m)Market
Share Ch.
HSBC Holdings PLC21.3Goldman Sachs & Co
19
MarketFinancial Advisor
1 6 125,445.7 +3Share Ch.Sh (%)Financial Advisor
0.9▲2US$m
MarketMarket Market# of Deals FeesDeals Sh (%)
11▲
MarketChange in Advisor
▲6.2 0.186.0
Market
2531.3111,718.11
# ofRank ValueShare Ch.
2014 Rank Sh (%)
10.5 0.52810
19.2▲ 2HSBC Holdings PLC 25.1 18.8
24.189,374.2
0.4 1.81086,029.6 24.1▲
24.7▲ 1.8▲1.70.4 +2 ▲ 48.6 3.5
▲12.8 1.5▲ 22.9▲▲
5.271.8+8
▲▲184*13.9 ▲
2813.4-4.4 4
3
Bank of America Merrill Lynch 5 7 65,096.1 11.0+216 0.64 81,769.3
13.75 65,857.4 18.5
China International Capital Co 2326
48,685.96-132 0.6+1
▼57,419.3▲0.9 +11
2.6 2.11.6 0.4
▲+1011.7
▲▲11.1 35.622.623 ▲▲16.1
1.0 ▲15 0.6
0.72041,814.4Citi 713
0.380.5 +1 ▲
3 ▲-2 ▼ 69.9 1.95.10.5
▼0.4 -2 ▼ 43.010.838,403.9
▼21 1▲5.7 ▲ 11 3.1JP Morgan 8
Deutsche Bank 9 8 16UBS26
▼-3.6-16
10 30,996.226,210.8
0.4-9.9
28,410.1▼ 10 8.0 -0.810.035,642.8 3.30.6 -18 ▼
▼ 0.6▼
17 -345.1
5Industrial & Comm Bank China3.4 ▼ ▲ 1.6 -25
10 5 22,279.7 3.8 -7.10.13 43Moelis & Co 11 1.81259 7.311-5 25,873.5 38.0
▲4.3▼ 60.02.7
0.5
▲-1 ▼ 15.3▼
+10 ▲1.1
0.5 ▼
13 ▲ 7.5▲
5.60.522-12.8
19,838.813
▲
12 2 20,066.95.1 ▲5413
+1238 16,518.7
▼9 16,713.2
2.8 2.0
3.4CITIC▼ 22 0.4 15 0.6
0.4 +5 ▲ CITIC
Guotai Junan Securities 140.4 ▲
12 27 25,788.2 7.2 4.80.5
Southwest Securities Co Ltd 15 33 16,485.1 1.6 ▲2.8▼9
14.5-80.1 ▲
3▲
▼▼-2.0 ▼ 25.3-70.3 1.8
Lazard 16 14 15,438.5 2.6 1316 ▲▼1015
1.0+130.5 8
-0.2 3.8▼
0.5▲▼
3.83.5 -4.7
0.1▼ 62.9 1.44.50.6+26▲▲ 21
17 -512,416.8▼ 18
Huatai Securities Co Ltd 173.6+518Rothschild
15,214.4 2.6 1.921
▼21.6 1.2▲0.80.2 24
-3.1▼-13 3.111,137.4 0.6
Barclays 11-4 2.7190.20.3
1.6-519 1813,366.8 Huatai Securities Co Ltd2.3 0.0
Mizuho Financial Group 20 58 11,957.2 2.00.2Nomura 12,572.1 ▼2.1
0.110▼ 6▲ 0.4
0.2 ▼+5▼ Guotai Junan Securities▲
RBC Capital Markets34
▲9,614.6-36 ▼-1.5
2.7 ▲▲ 2 0.1 +2▲
1.1
8,624.7 1.0▼
2.70.5
26▲0 - 47.0 3.48,642.8 2.4 14 1.5▲0.4-10Banca IMI (Intesa Sanpaolo) 23 126 0.1▼ 4.89,060.0 Ernst & Young LLP
1033▲1.5 1.4 16+2 ▲
▲1.51.5Mediobanca 24 - 8,876.7 24+22-1.0
Wells Fargo & Co
Haitong Securities Co Ltd 22 15 10,705.9
0.0 ▲+325
0.02.31.9 .5▲1.9
0.1-0.1
2 518100 0
▲ 1 02.2-0.0 0.03 ▲6,852.2-1.0 -1.3
Jan 1 - June 30Any Asia (ex-Japan) Involvement Announced (AD25)
25PricewaterhouseCoopers 20 6,035.4
Asia (ex-Japan) Rankings
0.1
Rothschild
0.0
Great Wall Securities Co Ltd
1.0
2.02.4
Haitong Securities Co Ltd0.6
Industry TotalNortheast Securities Co Ltd
-1.9 ▼ 1.00.1
Deals Sh (%)Market
US$m2015 Rank
5.6Morgan Stanley 90.4 -3
First Half 2015 | Mergers & Acquisitions | Financial Advisors
# of Deals per Advisor
Gresham Partners Citi
Treadstone Partners Pty Ltd 1.8
+1
-
▲ ▲
2
+1
+3
6,021.2
2.0
100.0
1.9+6
Industry Total
▲8.1%
486
0.1
Industry % Change from Same Period Last Year
BBVAIndustry Total-95
606.265,673.8
24* 0.9 ▲ +1-▲606.2
0 -
+2
Barclays
1-95
134.4%
2,681 1,385.2
▲
0.45.8
▲
▲
2.1▲
▼-1▲+1 2.1
9.8
+1 2.1
12
-16.4%
0.4
-11.8% ▼
▲- 0.8
0.5
2.5%▼
0.2
598.6▲
▲
4.60.2
▲
100.0
▲ ▲
1
-28.6
0.1
0.3
1
11
2.7
1
▼
▼
2.8
1.6
100.0
0.31
▼
0.60.6
2.40.1
▲0.4
▼▲
0.2 0.4
▲
▲
▲
0.2
0.71.6
▲
+1
▲1.0
▲
1.7
0.40.40.4
▲
▲-40.6
1.43.8▲ 0.2 ▲+1
7
▲
48.0
3.4
Credit Suisse1 12Rothschild 13 5
8.0
Flagstaff Partners Pty Ltd-2.7
02,214.9 0.1
+1
2,178.4
+1 24*Evercore Partners▲ -
▲ 0Mitsubishi UFJ Financial Group
Bank of China Ltd11.9▲▲
-1
1923
1
▲-▲
▲▼
1.9
0.32710
22
-▲ 190.3
4819*19*
1.5
1.9INFOR Financial IncBMO Capital Markets
▲1.973*
1219*18
9.4-
25
-
1,513.61,458.41,458.4
2.02.01.9
1,458.40.1
0.1
JP Morgan 2.82.81015
16 182,140.32,134.7
40 2.4▼ 15-9
14--10.4 0.8
▲
-
Grant Samuel
17 35*960.5-
51,521.41,521.4 2.0
1
-4
1
2.92.9
▲1.3
1.3▲
▲-
271,887.1
▲
2,078.4
20*
Cenkos Securities PLC
▼ 20*China International Capital Co▲
1.51.3
▲1.3
0.6▼
▼ 16
▼
Greenhill & Co, LLCJP Morgan
-50.3
1.10.9
1.3
-
720.0
-835.2 1.3
9
2.3
1.3
3.42,214.94.8
4
18854.5
1.5
11
7 -22.63,163.03,550.6
▲▼
5.8 ▼
-2
3
4
▼
2
129.2
3.2
0
2.9
-2 ▼ 20.1
5,591
14.2 ▲1.5
Lazard
13.3-10.5
1 29,856.5 45.51
10,282.337.715.7
Macquarie Group 2 26,648.7 40.6824,732.03
-20.95
6
10
6,713.2 10.29
2.79.8
4
67 6,354.3
6,054.3Gresham Partners 8
6,408.939
Deutsche BankMoelis & Co
▲0.9
20.1
JB North & Co Pty Ltd
0.9
1.320* 835.2
835.2
▲-20.7% 385.8%17.1% Industry % Change from Last Quarter
▼
0.2
+1
0.8
0.8 -8
-
▼
0 2.8▼
0.5
-6
0.2+10.2
14.4
1.0
▲ 11.4
+1
-
▲ 1▲▲
-3
5 0
▼
6.9
0.2
0.6
4
▲
3
1
9.2 2.4
▼ 0.8 0
1.00.8
-6
2.3
0.7
0.4
25.83.6
18.6
10.1 1.7
+116.6
1.7
0.8
▲
+4▼▲
3.1▲
▼
0.2
▼
1.7
▲
3.0
▼
0.90.7
▲
▲
▼
13.9
4.3
4.0
21.3
9.910.6
0.82.9
▲
▼▲ 13.6▼
15
-40.8
▼17.3 0.7
0.5
▼
▲▲
1.8▲
2.9
3.4
-40.2
2.8
85.4%
356,589.0
6
UBS
▼-2
# of Deals per Advisor
6,191.7
▼▼
-4.913.7 6 ▲
▲+5
-11 ▼▼
Bank of America Merrill Lynch
15
# of Deals
▼4 -3
-5
-12.6
0.6
13
1.3 +3
29.123,559.2
13.5
-0.8
Financial Advisor
Goldman Sachs & Co-5
14.29
▼0.8
0.8
0.79.5
-2.6
56,867.0
10,181.1
▲
21,948.5
12,982.715,023.6
9.1
▲▼
17.2
8
51*
7
10Credit Suisse
7,160.27
6Morgan Stanley 8
Lazard 11
Bank of America Merrill Lynch
-7.9
19.9
10,692.1
1.8
Deals
▲
10
2015 Rank
2014 Rank
Market
Any Australian Involvement Announced (AD24)
Market
Industry % Change from Same Period Last Year
590,084.8
MarketSh (%) Share Ch.
17.4
Change in
31.337.8 ▼
# of
+886
32.3%
100.0
5.5 ▲1.42.1
18.8%
23*1,389.9
100.0
Euroz Securities Ltd 37*
960.5
1.8
Industry % Change from Same Period Last Year
75,392.8
23* 1,365.9Cenkos Securities PLC
▼
14BarclaysFlagstaff Partners Pty Ltd
Hartleys Ltd
Rothschild
Azure CapitalGreenhill & Co, LLC 17
CIBC World Markets Inc
13
6,059.4
10.1
25
14.0%Industry % Change from Last Quarter
Industry Total
▲
1.31.8 ▲
1,365.9 1.8
1.3
1.0
Sh (%)
Jan 1 - June 30
-2,518100.0
▲10.1%6.5%
▲1.2▼1.28.6
Market
12.7
Share Ch.Market
▼83.43.1
-11 76.13.7▼-3
Jan 1 - June 30
11.8%▲
Any Australian Involvement Completed (AF31)
▲▲
Industry % Change from Last Quarter
MarketMarket2014 Rank
111.8% ▲
Sh (%)
▲
# of Deals per Advisor
1.3%
Share Ch.
Imputed Fees (US$m)
DealsMarketSh (%)
2015 Rank
Change in
▼Fees# of Deals Sh (%)51.3
Advisor
-10
31.0
2.1
0.6
6
18
1.2
40.6 9.2
106,021.24,496.4
Mizuho Financial Group▼-4
4
8.0
-9.4▼
▼
▼-2.1-6.6
8.2▼
2
0.8 70.3
▲▼
1.0
26
-1.6
Macquarie Group 2
-
2
5
1
41
9Mizuho Financial Group 12
Goldman Sachs & Co4
Moelis & Co
9
-33.9
-24.9
5.43,786.8
9.5
-
▲
Rank Value per Advisor (US$m)
US$m
39.5% ▲
9.7
Rank Value per Advisor (US$m)
3
UBS 1 4US$m
Rank Value
Industry % Change from Last Quarter
Financial Advisor
15
Citi
3
6
Deutsche Bank5
+2
▲74.0%
-828,506.2
4.5
0.50.8
0.8%
Morgan Stanley▼▼
3 -29.32
Industry % Change from Same Period Last Year
Industry Total
11
▲
Rank Value # of
10
4
https://www.thomsonone.com * tie
Visit http://dmi.thomsonreuters.com to view archives and order custom League Tables16
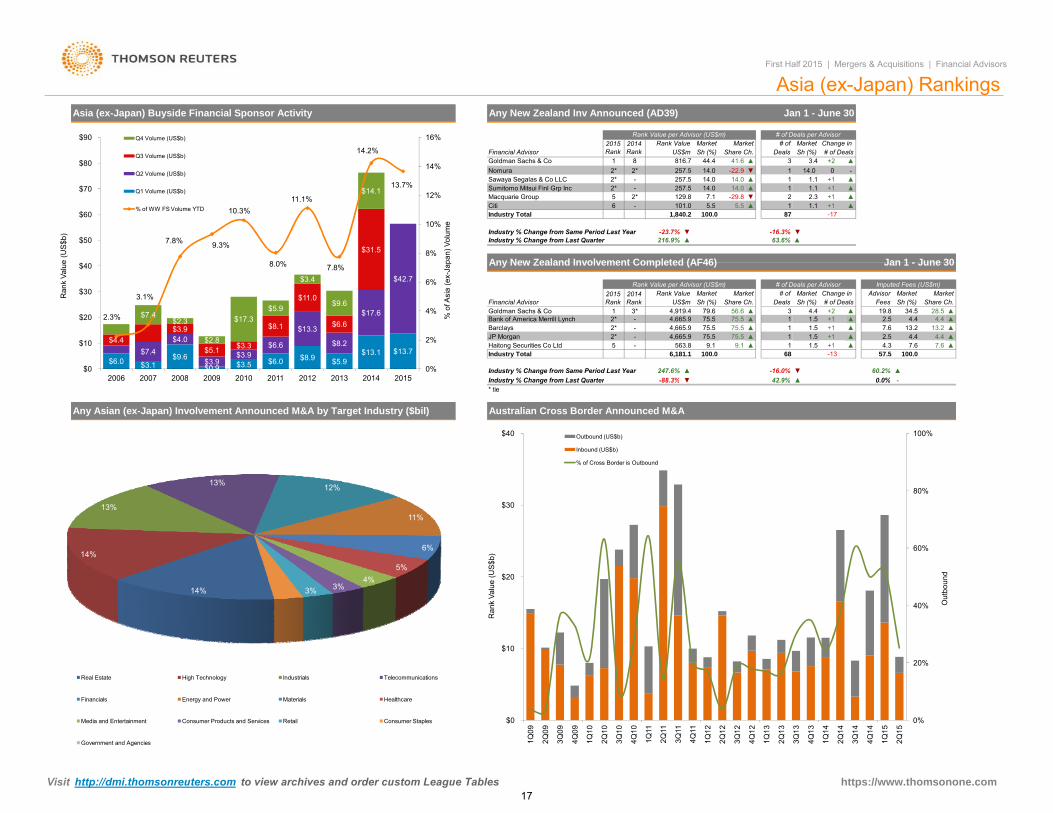
▲
Rank Value
1
▲
100.0
816.7
-
6,181.1
4,919.4
▲
2*
Market
1.5
▼
2.5▲
0 0%
57.5
-23.7%
▲+2
▲4.3
-▲
# of Deals per Advisor
3.4
-16.0%
68
▼
-13
60.2%42 9%
1.51
14.0
▲75.5
Sh (%)
+11.1
+2Sh (%)
+1
Asia (ex-Japan) Rankings
1 3*-- 13.2
34.5+1
▲2*
28.5
Imputed Fees (US$m)
+1▲
Change in
▲
+119.1 7.6 ▲
1 +1 13.27.6+1
Share Ch.▲4.4
MarketAdvisor
19.8
MarketFees# of Deals
▲
100.0
-
5.5101.0 5.51,840.2
MarketSh (%)US$m
Market
14.02*
2015 Rank
257.5Goldman Sachs & Co
▲
Jan 1 - June 30
Rank Value per Advisor (US$m)
First Half 2015 | Mergers & Acquisitions | Financial Advisors
Sh (%)Rank Value
1.5
3
Market # of
75.5 1.5
Sh (%)DealsShare Ch.
75.5 ▲▲
56.6
Industry % Change from Last Quarter
2014 Rank
Any New Zealand Inv Announced (AD39)
2*
4,665.9
JP Morgan
14.0
Industry Total
257.5
79.6
75.5
Any New Zealand Involvement Completed (AF46)
14.0
4.4▲
▲
7.64.4
100.0
1 4.475.5
# of Deals per Advisor
187 -17
2.5 4.4 ▲
Jan 1 - June 30
▲1
1.1
63.6%-16.3%
1
2 2.3
Change in
# of Deals
5
▲+1
0
1.1
Market
Asia (ex-Japan) Buyside Financial Sponsor Activity
Industry % Change from Same Period Last Year
Goldman Sachs & CoFinancial Advisor
2*4,665.9
2014 Rank
4,665.9
-
US$m2015 Rank
75.5
▼
563.8
247.6%
Barclays
▲9.1-
Citi
Bank of America Merrill Lynch
▲-88 3%
Haitong Securities Co LtdIndustry Total
Rank Value per Advisor (US$m)
▲
▼216.9%Industry % Change from Last Quarter
▼▲
Industry % Change from Same Period Last Year
6 -
▲▲
257.5
-29.8Sumitomo Mitsui Finl Grp Inc
514.0
7.1
Nomura
129.8
2*
Financial Advisor
Macquarie Group 2*
8
2*Sawaya Segalas & Co LLC
1▼▲44.4
14.03
-22.941.6
# ofDeals
MarketShare Ch.
$6.0 $3.1$9.6
$0.9 $3.5 $6.0 $8.9 $5.9$13.1 $13.7$7.4
$4.0
$3.9$3.9
$6.6
$13.3
$8.2
$17.6
$42.7
$4.4$3.9
$5.1 $3.3
$8.1
$11.0
$6.6
$31.5
$7.4$2.3
$2.8
$17.3$5.9
$3.4
$9.6
$14.1
2.3%
3.1%
7.8% 9.3%
10.3%
8.0%
11.1%
7.8%
14.2%
13.7%
0%
2%
4%
6%
8%
10%
12%
14%
16%
$0
$10
$20
$30
$40
$50
$60
$70
$80
$90
2006 2007 2008 2009 2010 2011 2012 2013 2014 2015
% o
f Asi
a (e
x-Ja
pan)
Vol
ume
Ran
k Va
lue
(US
$b)
Q4 Volume (US$b)
Q3 Volume (US$b)
Q2 Volume (US$b)
Q1 Volume (US$b)
% of WW FS Volume YTD
0.0%42.9%
Australian Cross Border Announced M&A
▲
Any Asian (ex-Japan) Involvement Announced M&A by Target Industry ($bil)
Industry % Change from Last Quarter -* tie
▼-88.3%
14%
14%
13%
13% 12%
11%
6%
5%4%
3%3%
Real Estate High Technology Industrials Telecommunications
Financials Energy and Power Materials Healthcare
Media and Entertainment Consumer Products and Services Retail Consumer Staples
Government and Agencies
0%
20%
40%
60%
80%
100%
$0
$10
$20
$30
$40
1Q09
2Q09
3Q09
4Q09
1Q10
2Q10
3Q10
4Q10
1Q11
2Q11
3Q11
4Q11
1Q12
2Q12
3Q12
4Q12
1Q13
2Q13
3Q13
4Q13
1Q14
2Q14
3Q14
4Q14
1Q15
2Q15
Out
boun
d
Ran
k Va
lue
(US
$b)
Outbound (US$b)
Inbound (US$b)
% of Cross Border is Outbound
2006 2007 2008 2009 2010 2011 2012 2013 2014 2015
https://www.thomsonone.com Visit http://dmi.thomsonreuters.com to view archives and order custom League Tables17
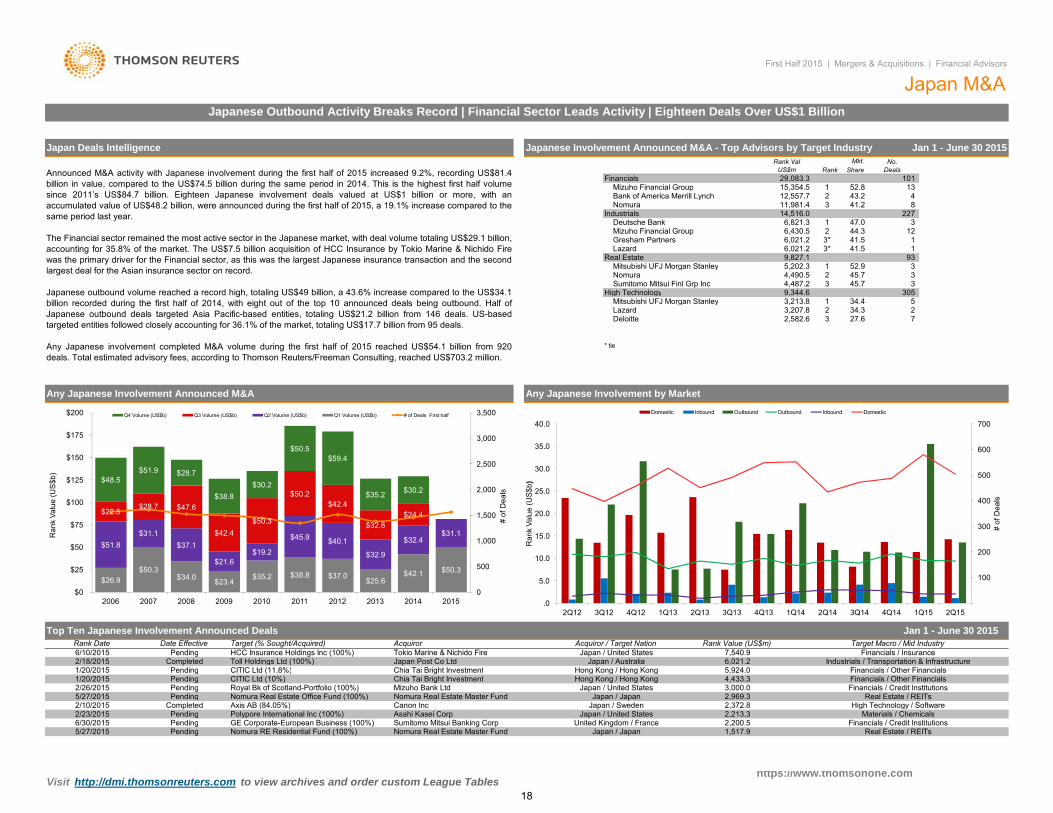
Sumitomo Mitsui Finl Grp Inc
* tie
Mitsubishi UFJ Morgan StanleyLazardDeloitte 2,582.6 27.6 7
52.9
34.3
3305
323,207.8 1
9,344.6
3
5 34.4
9,827.1 Real Estate
4,490.5 5,202.3
2
3,213.8
41.5
227
2
1
3
8
101 13
4
3
3 93
1
Japanese Involvement Announced M&A - Top Advisors by Target Industry Jan 1 - June 30 2015Mkt.
Bank of America Merrill Lynch
12 44.3
Japan Deals Intelligence
11,981.4 12,557.7
29,083.3 1
Nomura
FinancialsMizuho Financial Group
Announced M&A activity with Japanese involvement during the first half of 2015 increased 9.2%, recording US$81.4billion in value, compared to the US$74.5 billion during the same period in 2014. This is the highest first half volumesince 2011’s US$84.7 billion. Eighteen Japanese involvement deals valued at US$1 billion or more, with anaccumulated value of US$48.2 billion, were announced during the first half of 2015, a 19.1% increase compared to thesame period last year.
The Financial sector remained the most active sector in the Japanese market, with deal volume totaling US$29.1 billion,accounting for 35.8% of the market. The US$7.5 billion acquisition of HCC Insurance by Tokio Marine & Nichido Firewas the primary driver for the Financial sector, as this was the largest Japanese insurance transaction and the secondlargest deal for the Asian insurance sector on record.
Japanese outbound volume reached a record high, totaling US$49 billion, a 43.6% increase compared to the US$34.1billion recorded during the first half of 2014, with eight out of the top 10 announced deals being outbound. Half ofJapanese outbound deals targeted Asia Pacific-based entities, totaling US$21.2 billion from 146 deals. US-basedtargeted entities followed closely accounting for 36.1% of the market, totaling US$17.7 billion from 95 deals.
Any Japanese involvement completed M&A volume during the first half of 2015 reached US$54.1 billion from 920deals. Total estimated advisory fees, according to Thomson Reuters/Freeman Consulting, reached US$703.2 million.
41.243.2
No. DealsRank
15,354.5 23
Share
Deutsche BankIndustrials
Nomura
Gresham Partners
47.0
45.745.7
6,021.2 3* 41.5
6,430.5 3*
Mitsubishi UFJ Morgan Stanley
High Technology
Lazard
First Half 2015 | Mergers & Acquisitions | Financial Advisors
Japan M&AJapanese Outbound Activity Breaks Record | Financial Sector Leads Activity | Eighteen Deals Over US$1 Billion
6,021.2
6,821.3 1
52.8
Rank Val US$m
Mizuho Financial Group 2
1
4,487.2
14,516.0
CITIC Ltd (11.8%)CITIC Ltd (10%)Royal Bk of Scotland-Portfolio (100%)
HCC Insurance Holdings Inc (100%) 7,540.9Tokio Marine & Nichido Fire
Chia Tai Bright Investment Financials / Other FinancialsFinancials / Other Financials
Jan 1 - June 30 2015
Nomura Real Estate Office Fund (100%)Mizuho Bank LtdNomura Real Estate Master Fund
5,924.0Hong Kong / Hong Kong
Rank Value (US$m)
Nomura Real Estate Master Fund
Polypore International Inc (100%) 2,213.3
Hong Kong / Hong Kong
1,517.9United Kingdom / France
Japan / Japan
2,969.3Japan / United States
Japan / Sweden
3,000.0
2,372.8
Financials / Insurance
Any Japanese Involvement by Market
Sumitomo Mitsui Banking Corp
Real Estate / REITsHigh Technology / Software
Japan / Japan
Asahi Kasei Corp Japan / United StatesFinancials / Credit Institutions2,200.5
Real Estate / REITsGE Corporate-European Business (100%)
Materials / Chemicals
Financials / Credit Institutions
Acquiror / Target Nation
Industrials / Transportation & Infrastructure
Pending
Completed
6/30/2015
2/10/20155/27/2015 Pending
PendingPending
5/27/2015
2/23/2015
Chia Tai Bright Investment
Japan / United StatesDate Effective
Top Ten Japanese Involvement Announced Deals
Toll Holdings Ltd (100%) Japan Post Co LtdPending
2/18/2015 Japan / Australia1/20/2015
Axis AB (84.05%) Canon Inc
Any Japanese Involvement Announced M&A
AcquirorTarget (% Sought/Acquired)Rank Date
4,433.32/26/2015
Completed
PendingPending
1/20/2015
6/10/2015
Pending
Nomura RE Residential Fund (100%)
Target Macro / Mid Industry
6,021.2
$26.9$50.3
$34.0 $23.4$35.2 $38.8 $37.0
$25.6$42.1 $50.3
$51.8$31.1
$37.1
$21.6$19.2
$45.9 $40.1
$32.9
$32.4$31.1
$22.5$28.7 $47.6
$42.4$50.3
$50.2$42.4
$32.8$24.4
$48.5$51.9 $28.7
$38.8$30.2
$50.5$59.4
$35.2 $30.2
0
500
1,000
1,500
2,000
2,500
3,000
3,500
$0
$25
$50
$75
$100
$125
$150
$175
$200
2006 2007 2008 2009 2010 2011 2012 2013 2014 2015
# of
Dea
ls
Ran
k Va
lue
(US
$b)
Q4 Volume (US$b) Q3 Volume (US$b) Q2 Volume (US$b) Q1 Volume (US$b) # of Deals First half
100
200
300
400
500
600
700
.0
5.0
10.0
15.0
20.0
25.0
30.0
35.0
40.0
2Q12 3Q12 4Q12 1Q13 2Q13 3Q13 4Q13 1Q14 2Q14 3Q14 4Q14 1Q15 2Q15
# of
Dea
ls
Ran
k Va
lue
(US
$b)
Domestic Inbound Outbound Outbound Inbound Domestic
https://www.thomsonone.com Visit http://dmi.thomsonreuters.com to view archives and order custom League Tables
18
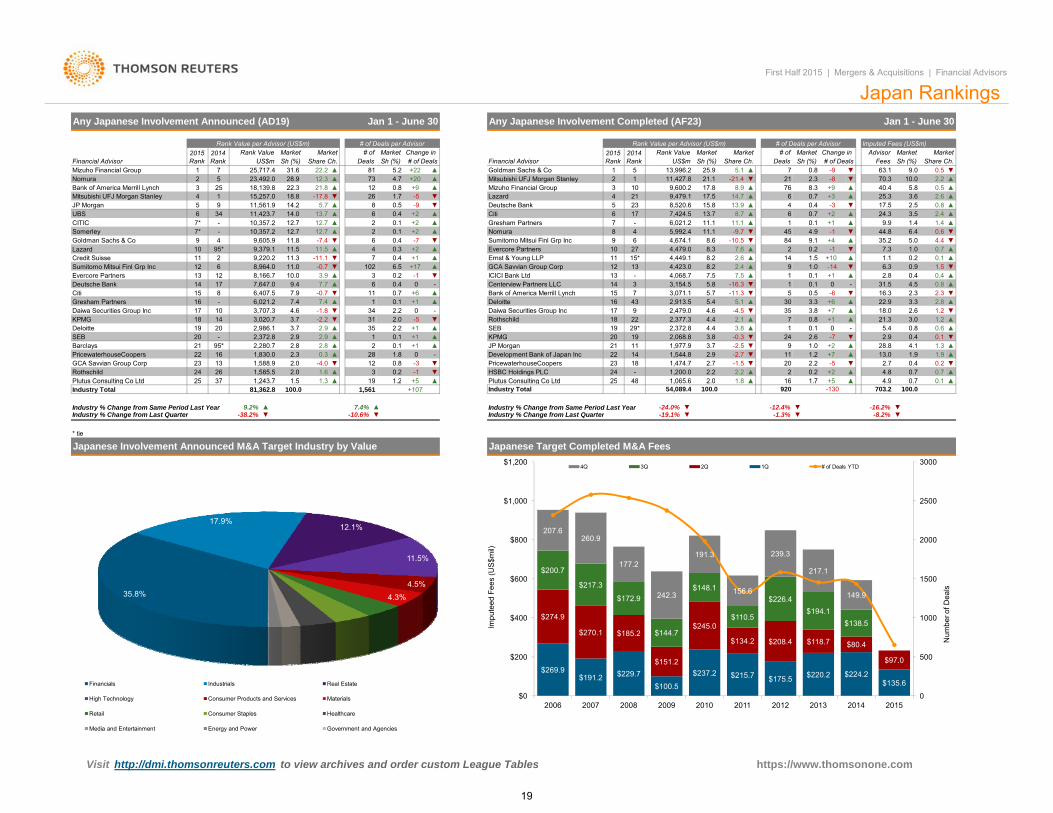
Imputed Fees (US$m)
Financial Advisor
Lazard
First Half 2015 | Mergers & Acquisitions | Financial Advisors
2015 Rank
Jan 1 - June 30
# of Deals# of 2015
Rank
Any Japanese Involvement Announced (AD19)
Rank Value per Advisor (US$m)Market
21.8 12
31.6+20
Deals2014 RankSh (%)
Change in Rank Value per Advisor (US$m)
Sh (%)
18.818,139.8
7312.381
▲▲28.9
261
Market2014 Rank
▼
25,717.423,492.0
US$m
15,257.0
Rank ValueSh (%)
▲▲
▲
22.3
7
5.7-17.8
14.0
22.2
25
-
13
CITIC
Mitsubishi UFJ Morgan Stanley
UBS 6 34
Credit Suisse
7*
12
7.4
-
104
9.4
11.0
17
15
7*10,357.2
5
11,561.911,423.7
12
6,021.216
3
Goldman Sachs & Co
14Deutsche BankEvercore PartnersSumitomo Mitsui Finl Grp Inc
Gresham Partners
8,964.0
2.2KPMG ▼Daiwa Securities Group Inc
11.5-7.4
Evercore Partners611.8 ▼ -74
Financial Advisor Share Ch.
# of Deals per Advisor
Japan Rankings
Share Ch.Market MarketAdvisor
Sh (%)MarketMarketMarket
Fees# of Deals# of
Share Ch.
# of Deals per Advisor
US$mRank Value
DealsMarket Change in
Sh (%)
1 11,427.8 21.113,996.2
70.3▲
2.35.1 ▼25.9+22 ▲
+9 ▲▲
0.8
12
5.2
76▼▲ 8.3
7▼-8▲
-90.8
-3
▲
▲
+1
-1
18.0
2.8
+4
▲
▲
3.6
1.1
3.5
▼
1.4
8.9
6.4
17.5
7.3
425.3
▼
▲
▲
35.2
9.9
▼ ▲
1.4
5.0
0.2
2.5
2.3
1.0
▲
▲
▲
1.2
4.5
+10
-6-
▲
▲
3.0
▼
1.2
0.4
0.8
0.7
+2
31.5
24.3
▼
2.4
0.4-14
3.8 0.1
▲
7
▲35
▲▲
0.83.8
18
2,068.8
2.843▼
11
3.3
0.723
▲2.7
2418 ▼ 20
▲
2.7▲
-5
+5 4 9
13.0
4.82.2 ▼
+22.2-1.5
0.22
▼0.9▲▲
1 7
1.2 +7
110.3
▼
19 29*
0 7
▲
17
16
▼2.2
63.1 9.0
▲▲10.0
0.5
40.4 5.8 0.52.6
1.5
4.4
▲
0.6
▲0.8
▼▼
▼
44.8
6.3
▲0.7
16.3 2.3
▲
2.6
0.2
▲▲
▲▼
1.31.9
▲
1.9
▲
▼
0.1
0 1
0.4
3.3
0.4
0.6
8.2 2.6 ▲▲
13 9
13.712.712.7
8.38.66
▲
+2Gresham Partners
0.4
▼10
4,449.14,479.0
15*0.4 Ernst & Young LLP+127+2
8,166.77,647.0
10.0
12.710,357.2
17
9,379.19,605.9
6
95*
6,407.5
1023.9 ▲ 3
14.2
7.9
▲12.7
11.5
Somerley
7-0.7
11.39,220.2 -11.111
▲
▲
2
45
9,479.19
Mitsubishi UFJ Morgan StanleyMizuho Financial Group
4.7103
8,520.6 15.8
Citi
9
-
21
2
JP Morgan
11
▼
8
Goldman Sachs & Co21
Mizuho Financial Group
Bank of America Merrill Lynch
8
▲7
4
5
14.7 0.7+9
Nomura9,600.2
2
6
-21.4
-517.8
+3
1
-8.7
57,424.5
▲17.5
13.923▲1.7
8+2 ▲
Lazard▼Deutsche Bank▼Citi
-90.5
▲▲
60.1 +22
66,021.2
84
0.4
0.11
-10.54 ▼
9
0.711.1 +111.1 0.1▲
617 13.7
▼4.9
7.6
2.414
▲
2 0.29.1
-9.7 -111.15,992.4
▲
45
1.0
4,674.1
4,423.01.5
0.2 ▼1
8.27.5
0.1-1
+17 12
00.1
▼-16.30.5
1314
+15.8
-
305
-4.52,913.5
▼
7.53,154.5
1
2.1 ▲
22.97.4 0.1 +1
21.334-1.8
+6
2,986.12,372.8
4.618 14 3,020.7 3.7
3.7SEB 20 -Deloitte 19 20 2.2
2.935
-0.3+1▲ SEB
▲ 3.82.9
▲▲ 0.1 +1
0.1 ▼1,977.919 ▼
BarclaysPricewaterhouseCoopers
210.3
▼KPMGJP Morgan -2.5
2.92
GCA Savvian Group Corp 23 13 1,588.9 2.0▲2.3
-4.022 16
▲1 3Plutus Consulting Co Ltd 25 37 1 5-
1 065 6▲ 48Plutus Consulting Co Ltd1 2 1 82 0+5 25 ▲
95* 2,280.7 2.8 ▲Development Bank of Japan Inc-1,830.0 0
2.8 +1
2,377.3
0.4
31 2.0 -5 4.4
Deloitte15 7
-
Any Japanese Involvement Completed (AF23)
▼
9-2.2
10 3,707.35.1
▼
-0.7 -11.3
112.9
249
+7▼
241,474.712 0.8
▲ -1 1,200.0-3
26▼
6.54,068.7
▲
Daiwa Securities Group Inc-
0.7Centerview Partners LLC0 3ICICI Bank Ltd
▼-2.71,544.8
1
0.2▼
22
1,585.5 ▼2.0
▲▲
22
▲
28 1.8PricewaterhouseCoopers
4.4
HSBC Holdings PLC
16
14
2,372.8
5.4
2.2
Rothschild4.62,479.0
▲ 1
1 243 731.6Rothschild
19
5.42.6
0 -
1.0
0.8-7 0.1
+23.72.9
2120
28.80.44.1▲
▲Bank of America Merrill Lynch
▼
6+6
01
Jan 1 - June 30
3,071.1
NomuraSumitomo Mitsui Finl Grp Inc
5.7
GCA Savvian Group Corp
7.7
Industry % Change from Same Period Last Year Industry % Change from Same Period Last YearIndustry % Change from Last Quarter Industry % Change from Last Quarter ▼▼-1.3%
▲+5 4.9
-16.2%
Industry Total
Japanese Target Completed M&A Fees
Vi it htt //d i th t t i hi d d t L T bl
-12.4%
1.7
-8.2%
0.716920
▲
▼
100.0
▼
-130
htt // th
703.20.1▲
100.0 1,56181,362.81.3
Industry Total +107Plutus Consulting Co Ltd 25 37 1.5
* tie
-38.2%9.2%
▼
1,065.6▲ 48
-24.0%▼
▼▲ 7.4%-10.6%
▲▼-19.1%
Plutus Consulting Co Ltd1.2 1.82.0+5 25100.0
▲54,089.4
Japanese Involvement Announced M&A Target Industry by Value
1,243.7 19
35.8%
17.9%12.1%
11.5%
4.5%4.3%
Financials Industrials Real Estate
High Technology Consumer Products and Services Materials
Retail Consumer Staples Healthcare
Media and Entertainment Energy and Power Government and Agencies
$269.9$191.2 $229.7
$100.5
$237.2 $215.7 $175.5 $220.2 $224.2$135.6
$274.9
$270.1 $185.2
$151.2
$245.0
$134.2 $208.4 $118.7 $80.4
$97.0
$200.7
$217.3
$172.9
$144.7
$148.1
$110.5
$226.4$194.1
$138.5
207.6260.9
177.2
242.3
191.3
156.6
239.3
217.1
149.9
0
500
1000
1500
2000
2500
3000
$0
$200
$400
$600
$800
$1,000
$1,200
2006 2007 2008 2009 2010 2011 2012 2013 2014 2015
Num
ber o
f Dea
ls
Impu
teed
Fee
s (U
S$m
il)
4Q 3Q 2Q 1Q # of Deals YTD
Visit http://dmi.thomsonreuters.com to view archives and order custom League Tables https://www.thomsonone.com
19
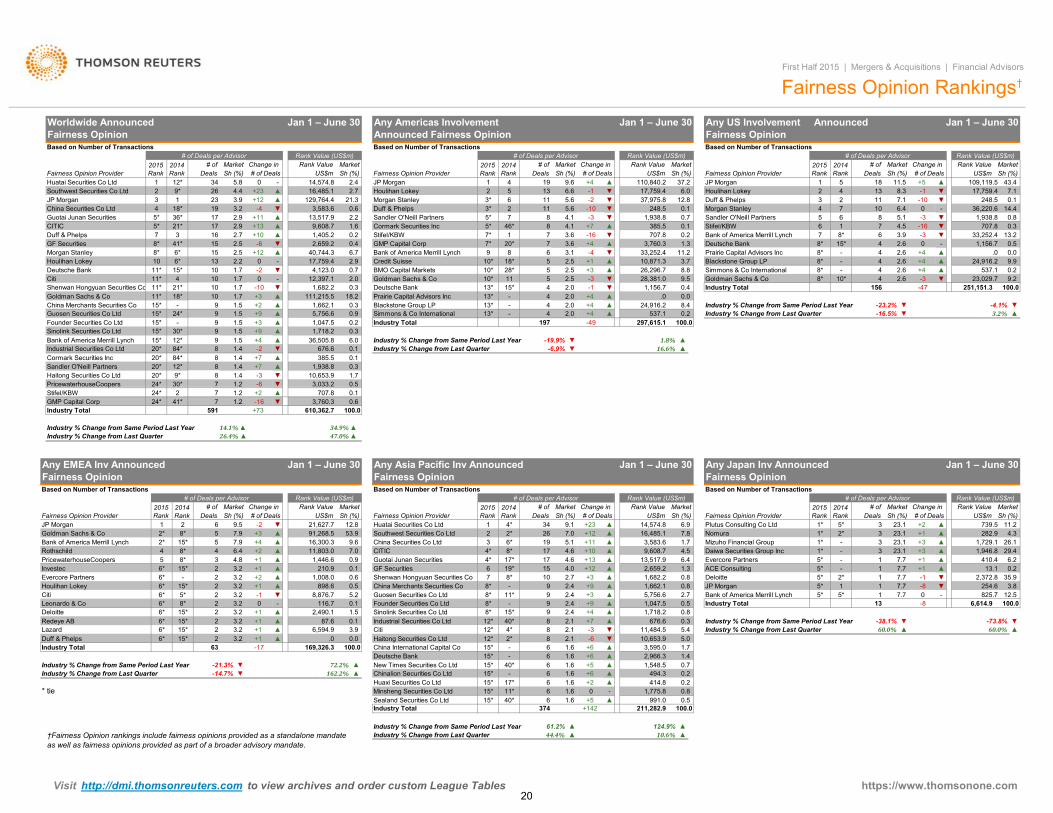
Industry Total
0.10.31.70.5
0.3
▲▲▼▼
385.51,938.8
10,653.93,033.2
1.41.41.41.2
+7+7-3-6
20*20*20*24*
Fairness Opinion Rankings†
▼
156
▼
15* 12* 9 1.5 +4
0.3
36,505.8 6.0
0.333,252.4 13.2
▲
14.41,938.8 0.8
36,220.6
707.8
3.2%
First Half 2015 | Mergers & Acquisitions | Financial Advisors
109,119.5 43.417,759.4 7.1
248.5 0.1129,764.4 21.323
1,405.2
US$m14,574.8
2.23,583.6
▲9,608.7
▲
0.6▼Sandler O'Neill Partners
0-20
Bank of America Merrill Lynch
12,397.1
101.711*
18.2
▲
+3
-
15*
Cormark Securities Inc
5,756.6
10 1.7
16,485.1
2.2
-
4.4
▼
13,517.9
9*
▲
+23
84*
-
888
▲
1.7 -10
12*9*30*
1.7
+123.2193.9
2.9 +1317 2.9 +11
4 18*3 1
-4
+1215 2.5
5*175* 21*
6* 138* 6* 158*7 3
41* 2,659.2
5*0.2
0.1
0.4 ▲707.8
1.6
20* 3,760.3
Duff & Phelps
Sandler O'Neill Partners
Bank of America Merrill LynchDeutsche Bank
1,938.8385.5
12.80.10.7
Morgan Stanley
Stifel/KBW
1.30.2
6
111,215.51,682.2
4,123.0 0.717,759.440,744.3
2.9
1,047.5
0.3
6.718*28*11
Blackstone Group LPPrairie Capital Advisors Inc11.2
-6
10
2.53.6GMP Capital Corp
7*
2.52.5
2.7
▲
+3
+2
▼
▲9
Shenwan Hongyuan Securities CoGoldman Sachs & Co
24*9
1.5- 1.5
▲▲
+91,662.1China Merchants Securities Co
11*
1.530*1.5
9
Citi
15*
21*
15*
3.1
197+9
11*
15*
Morgan Stanley
Deutsche Bank
15*
11*
9
4
Houlihan Lokey
18* ▲
7*
Deutsche Bank1010
2.0
▼GF Securities
+7
China Securities Co LtdGuotai Junan Securities
46*CITIC
7Stifel/KBWCormark Securities Inc
+4
37,975.8248.5
▼
▼▲
Duff & Phelps 116 ▲+10 ▼
4.1
7 -163.64.1
37.22 5 13 6.6
11
17,759.4-1 ▼
▼
Sh (%)
6.09.6 +4 ▲
3* 6 11 5.6 -2Morgan Stanley
# of Market Change in
1 4# of Deals
-2.7
MarketDeals
05.8
2015 Rank
Huatai Securities Co Ltd
Rank Value
110,840.219US$mSh (%)
2014 Rank
2.4
Rank Value
JP MorganSh (%)
Houlihan Lokey
# of Deals
21 12* 34
Fairness Opinion Provider2014 Rank
# ofDeals Sh (%)
Duff & Phelps -105* 7
8
5.63* 2-38
Industry Total 251,151.3
▼
-49
Industry % Change from Same Period Last Year
100.0
Industry % Change from Same Period Last Year▲▲
4
297,615.1
100.0-47
-23.2%
2.6▼2.6
24,916.2-▲
-3
0 -.0 0.0
1,156.7 0.5▲+4▲
-10*
537.1 0.244 +4
23,029.7
5.1
▼
2.69.9
4.53.9
▼
2.66
9.2
Industry % Change from Last Quarter
▼7.1
2.6
-
▼-38*
-44
7 0
8.3+5
+4
4
-161-3
-1
15*
8
Sh (%) # of Deals11.518
4
2015 Rank
2014 Rank
1 5
7
11
7
10
▼
6.4-10
▲
Goldman Sachs & Co 8*
2
8*8*
Simmons & Co International
3
8*8*
5
-4.1%
▼ 16.6%
Sinolink Securities Co Ltd
7
Industry % Change from Last Quarter
▼
8
-19.9%
Rank Value (US$m)
Worldwide Announced Fairness Opinion
Rank Value (US$m)MarketRank ValueChange in
# of Deals per Advisor# of Deals per AdvisorBased on Number of Transactions
Change in # of Market# of Deals per Advisor
Market2015 Rank
Jan 1 – June 30 Jan 1 – June 30Any Americas Involvement Announced Fairness Opinion
Jan 1 – June 30Any US Involvement Announced Fairness Opinion
Rank Value (US$m)Based on Number of TransactionsBased on Number of Transactions
26
DealsMarket
13JP MorganFairness Opinion Provider
Houlihan Lokey
36*
Southwest Securities Co Ltd
Fairness Opinion Provider US$m Sh (%)
JP Morgan
6
2
6
Founder Securities Co LtdGuosen Securities Co Ltd -16.5%
-6.9%▲1.8%▲
15*
Bank of America Merrill LynchCredit SuisseBMO Capital MarketsGoldman Sachs & Co
910*10*10*13*
▼▼
0.1
Prairie Capital Advisors IncBlackstone Group LP
5554
2.52.0
3.78.89.50.4
-4+1+3-3-1
1.4
Sandler O'Neill Partners
33,252.410,871.326,296.728,381.0
1,156.7
▼▲▲
Haitong Securities Co LtdPricewaterhouseCoopers
-2 ▼ 676.6Industrial Securities Co Ltd 20* 84* 8
Simmons & Co International
▲ 1,718.2
13*13*13*0.9
0.2
---
444
2.02.02.0
+4+4+4
0.08.40.2▲
.024,916.2
537.1
Industry Total
Industry % Change from Same Period Last Year ▲ ▲Industry % Change from Last Quarter ▲ ▲
▼ 3,760.3 0.6GMP Capital Corp 24* 41* 7 1.2 -16
Any Japan Inv Announced Fairness Opinion
2*
Deloitte 5* 2* 1
3
JP MorganBank of America Merrill Lynch
5*5*
15*
11
7.77.7
-1-80
7.7 ▼▼-
2,372.8254.6825.7
0.1▲,707.81.2 +224* 2
†Fairness Opinion rankings include fairness opinions provided as a standalone mandate as well as fairness opinions provided as part of a broader advisory mandate.
991.0 0.5
0.7
6 1.6Minsheng Securities Co Ltd 15* 11* 6 1.6
6 +2 ▲
+5 ▲
414.8 0.26
Huaxi Securities Co Ltd
New Times Securities Co Ltd 15* 40* 6
35.93.8
12.5
6*6*
15*2
▼0
6,594.9LazardDuff & Phelps
16,300.3
3.2
▲
15*
0.2▲
ACE Consulting 5*Evercore Partners 5* - 7.7
+1+1
1,729.1 26.11,946.8 29.4
410.4
Rank Value (US$m)
▲6.2
282.9 4.3
3.2 +1
9.6
+1 ▲ 1,446.6
898.6 0.5+1
▲
0.1
6+1
Nomura
+92.710
▲8*
2.75,756.6▲
19*
4.6
+3
Any Asia Pacific Inv Announced Fairness Opinion
-1*
15
8*17
Market
7.0Plutus Consulting Co Ltd 1*
1*
2015 Rank
34 +239.1+12
# of
60.0%
0.80.5 13 6,614.9 100.0
▼
Industry Total
Industry % Change from Same Period Last Year -38.1%
8*
4*
7
8*
Mizuho Financial Group
+9
1,662.1
8*
5.1
▲
+4
211,282.9
▲
▲
1.60
1.61.6 ▲
▲
0.8
124.9%▲
+142
494.3 0.2
- 1,775.8 0.8
5.4
1*Daiwa Securities Group Inc
1.30.8
Industry % Change from Last Quarter
1
60.0%
7.71
-73.8%
-8
- 3 23.1 +3 ▲
13.1-
▼
23.1▲
US$m
3 23.1 +3+1 ▲
▲3 23.1 +2Deals
2014 Rank
# of Market# of DealsSh (%)
5*
Change in Market
▲
1,718.2▲ 1,047.5
Industry % Change from Last Quarter 44.4% ▲ 10.6%
Industry Total 100.0
▲
374
Industry % Change from Same Period Last Year 61.2%
Sinolink Securities Co Ltd
12*15*
+5
15* 9 2.4
2.4- 2.4
11* 9- 9 2.4
91,682.2+3 ▲2,659.2
▲
▲+13
9,608.7
4.04.6
+12
3,583.6
Sh (%)Sh (%)
+11
6.4
7.8
▲ 13,517.917
6.914,574.8▲
+10 4.51.7
Industry % Change from Last Quarter -14.7% ▼ 162.2%Industry % Change from Same Period Last Year
Industry Total
▼
169,326.3
Huatai Securities Co Ltd
-21.3%
100.0-1763
▲
▲72.2% ▲
-15*
15* 17*Chinalion Securities Co Ltd 15* -
Sealand Securities Co Ltd 15* 40*
▲ 1.7+6
1,548.52,966.33,595.0
+6
3.9▼ 5.0
8▲
1.4
8 2.1.0 0.0
26* -1
▲ 87.6 0.1
116.7+1
15* +1▲ 2,490.1
- +26*
5* 3.2-6*
15* 3.22
210.9 0.1▲ 1,008.0 0.6
3.22
8,876.7
4 8*2*
48*
515*
3
2015 Rank
8*
Jan 1 – June 30Any EMEA Inv Announced Fairness Opinion
MarketUS$m
Rank Value
27.9 +39.5
2*
Market2014 Rank
Change in Deals
6Sh (%) # of Deals
▼5
Sh (%)Fairness Opinion Provider # of DealsRank Value
Jan 1 – June 30
Rank Value (US$m)
739.5 11.2
# of Deals per AdvisorBased on Number of Transactions
14.1%
Citi
CITIC
26
0.9
Sh (%)
53.9
7.06*
4*
5.2
7.9
-291,268.5
6.4
4*21,627.72
+4
3.2
▲
▲
34.9%26.4% 47.0%
Founder Securities Co Ltd
8*Shenwan Hongyuan Securities Co
Deals
2* ▲
Change in
4*
3
17*
▲19
* tie
- 6 1.6 +6▲
China International Capital Co6 1.6Deutsche Bank
6*-3 ▼ 11,484.5
6* 15* 3.2 1.5Industrial Securities Co Ltd 12*Redeye AB
Deloitte
26*
8*
Fairness Opinion ProviderJP MorganGoldman Sachs & Co
Rothschild
2
Bank of America Merrill Lynch
2015 Rank
1
Guosen Securities Co LtdChina Merchants Securities Co
GF SecuritiesInvestec
1
Guotai Junan Securities
China Securities Co Ltd
# of Deals per Advisor
+73591
# of
Based on Number of Transactions
7
▲
12.8
+2 11,803.0
2014 Rank
Southwest Securities Co Ltd
12*
# of Deals per Advisor
16,485.1
40*
15*
Haitong Securities Co Ltd
Rank Value (US$m)
2 3.2 +1 -6
2
Fairness Opinion ProviderRank Value
+7
2*
US$mMarket
10,653.92.1
Based on Number of Transactions
Jan 1 – June 30
▲ 676.6 0.38 2.1
4.8
CitiHoulihan Lokey
6*
Leonardo & Co
Evercore Partners
PricewaterhouseCoopers
23.2
5
610,362.7 100.0
pStifel/KBW
https://www.thomsonone.com Visit http://dmi.thomsonreuters.com to view archives and order custom League Tables20
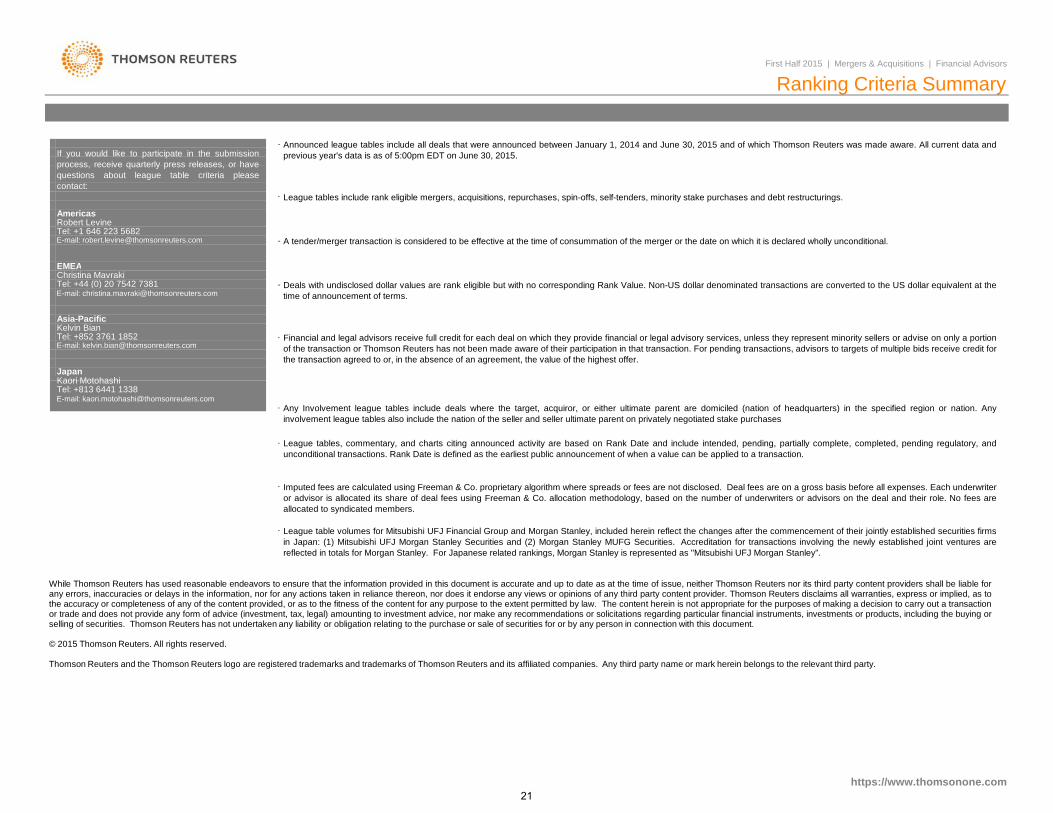
-
-
-
-
-
Christina Mavraki
Financial and legal advisors receive full credit for each deal on which they provide financial or legal advisory services, unless they represent minority sellers or advise on only a portionof the transaction or Thomson Reuters has not been made aware of their participation in that transaction. For pending transactions, advisors to targets of multiple bids receive credit forthe transaction agreed to or, in the absence of an agreement, the value of the highest offer.
E-mail: [email protected]
E-mail: [email protected]
Asia-PacificKelvin Bian
Kaori Motohashi
EMEA
Tel: +44 (0) 20 7542 7381
E-mail: [email protected]
Japan
Deals with undisclosed dollar values are rank eligible but with no corresponding Rank Value. Non-US dollar denominated transactions are converted to the US dollar equivalent at thetime of announcement of terms.
Tel: +852 3761 1852
First Half 2015 | Mergers & Acquisitions | Financial Advisors
Ranking Criteria Summary
If you would like to participate in the submissionprocess, receive quarterly press releases, or havequestions about league table criteria pleasecontact:
League tables include rank eligible mergers, acquisitions, repurchases, spin-offs, self-tenders, minority stake purchases and debt restructurings.
A tender/merger transaction is considered to be effective at the time of consummation of the merger or the date on which it is declared wholly unconditional.
AmericasRobert LevineTel: +1 646 223 5682
Announced league tables include all deals that were announced between January 1, 2014 and June 30, 2015 and of which Thomson Reuters was made aware. All current data andprevious year's data is as of 5:00pm EDT on June 30, 2015.
-
-
-
-
League tables, commentary, and charts citing announced activity are based on Rank Date and include intended, pending, partially complete, completed, pending regulatory, andunconditional transactions. Rank Date is defined as the earliest public announcement of when a value can be applied to a transaction.
League table volumes for Mitsubishi UFJ Financial Group and Morgan Stanley, included herein reflect the changes after the commencement of their jointly established securities firmsin Japan: (1) Mitsubishi UFJ Morgan Stanley Securities and (2) Morgan Stanley MUFG Securities. Accreditation for transactions involving the newly established joint ventures arereflected in totals for Morgan Stanley. For Japanese related rankings, Morgan Stanley is represented as "Mitsubishi UFJ Morgan Stanley”.
Any Involvement league tables include deals where the target, acquiror, or either ultimate parent are domiciled (nation of headquarters) in the specified region or nation. Anyinvolvement league tables also include the nation of the seller and seller ultimate parent on privately negotiated stake purchases
Kaori Motohashi
Imputed fees are calculated using Freeman & Co. proprietary algorithm where spreads or fees are not disclosed. Deal fees are on a gross basis before all expenses. Each underwriteror advisor is allocated its share of deal fees using Freeman & Co. allocation methodology, based on the number of underwriters or advisors on the deal and their role. No fees areallocated to syndicated members.
E-mail: [email protected]: +813 6441 1338
While Thomson Reuters has used reasonable endeavors to ensure that the information provided in this document is accurate and up to date as at the time of issue, neither Thomson Reuters nor its third party content providers shall be liable forany errors, inaccuracies or delays in the information, nor for any actions taken in reliance thereon, nor does it endorse any views or opinions of any third party content provider. Thomson Reuters disclaims all warranties, express or implied, as tothe accuracy or completeness of any of the content provided, or as to the fitness of the content for any purpose to the extent permitted by law. The content herein is not appropriate for the purposes of making a decision to carry out a transactionor trade and does not provide any form of advice (investment, tax, legal) amounting to investment advice, nor make any recommendations or solicitations regarding particular financial instruments, investments or products, including the buying orselling of securities. Thomson Reuters has not undertaken any liability or obligation relating to the purchase or sale of securities for or by any person in connection with this document.
© 2015 Thomson Reuters. All rights reserved.
Thomson Reuters and the Thomson Reuters logo are registered trademarks and trademarks of Thomson Reuters and its affiliated companies. Any third party name or mark herein belongs to the relevant third party.
https://www.thomsonone.com 21
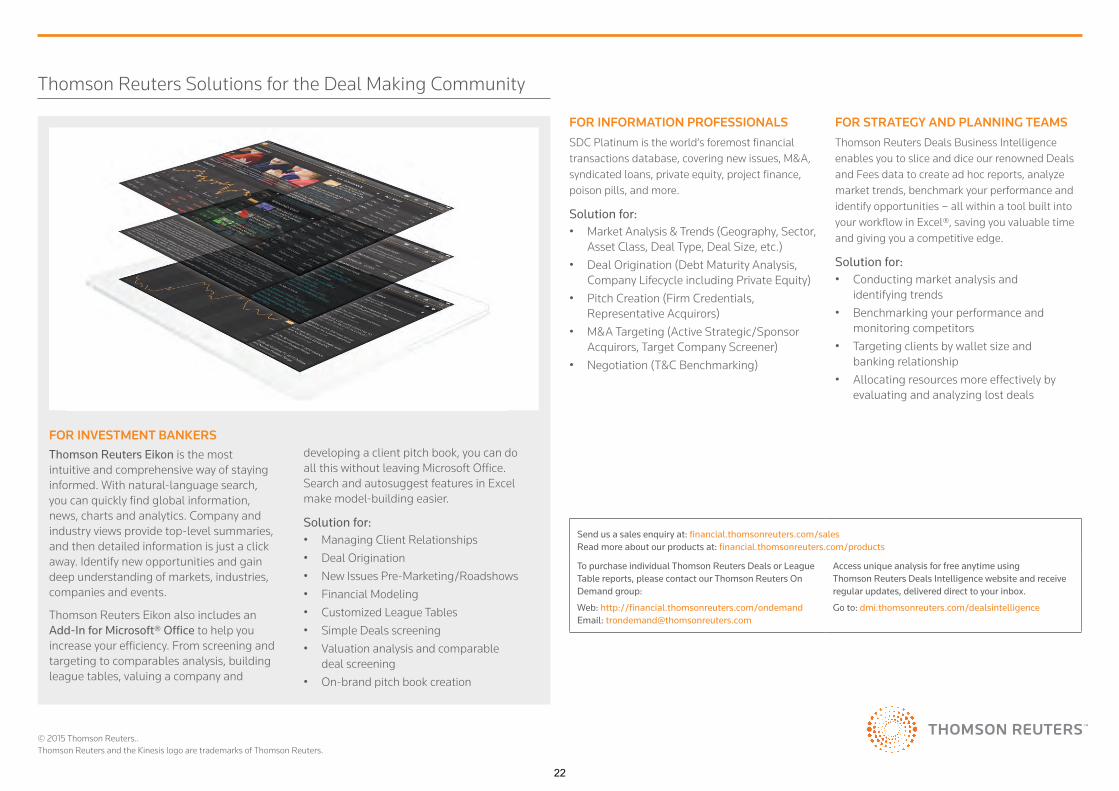
© 2015 Thomson Reuters..Thomson Reuters and the Kinesis logo are trademarks of Thomson Reuters.
FOR INFORMATION PROFESSIONALSSDC Platinum is the world’s foremost financial transactions database, covering new issues, M&A, syndicated loans, private equity, project finance, poison pills, and more.
Solution for:• Market Analysis & Trends (Geography, Sector,
Asset Class, Deal Type, Deal Size, etc.)• Deal Origination (Debt Maturity Analysis,
Company Lifecycle including Private Equity)• Pitch Creation (Firm Credentials,
Representative Acquirors)• M&A Targeting (Active Strategic/Sponsor
Acquirors, Target Company Screener)• Negotiation (T&C Benchmarking)
FOR INVESTMENT BANKERSThomson Reuters Eikon is the most intuitive and comprehensive way of staying informed. With natural-language search, you can quickly find global information, news, charts and analytics. Company and industry views provide top-level summaries, and then detailed information is just a click away. Identify new opportunities and gain deep understanding of markets, industries, companies and events.
Thomson Reuters Eikon also includes an Add-In for Microsoft® Office to help you increase your efficiency. From screening and targeting to comparables analysis, building league tables, valuing a company and
developing a client pitch book, you can do all this without leaving Microsoft Office. Search and autosuggest features in Excel make model-building easier.
Solution for:• Managing Client Relationships• Deal Origination• New Issues Pre-Marketing/Roadshows• Financial Modeling• Customized League Tables• Simple Deals screening• Valuation analysis and comparable
deal screening• On-brand pitch book creation
FOR STRATEGY AND PLANNING TEAMSThomson Reuters Deals Business Intelligence enables you to slice and dice our renowned Deals and Fees data to create ad hoc reports, analyze market trends, benchmark your performance and identify opportunities – all within a tool built into your workflow in Excel®, saving you valuable time and giving you a competitive edge.
Solution for:• Conducting market analysis and
identifying trends• Benchmarking your performance and
monitoring competitors• Targeting clients by wallet size and
banking relationship• Allocating resources more effectively by
evaluating and analyzing lost deals
Send us a sales enquiry at: financial.thomsonreuters.com/salesRead more about our products at: financial.thomsonreuters.com/products
To purchase individual Thomson Reuters Deals or League Table reports, please contact our Thomson Reuters On Demand group:
Web: http://financial.thomsonreuters.com/ondemandEmail: [email protected]
Access unique analysis for free anytime using Thomson Reuters Deals Intelligence website and receive regular updates, delivered direct to your inbox.
Go to: dmi.thomsonreuters.com/dealsintelligence
Thomson Reuters Solutions for the Deal Making Community
22