Embed Size (px)
Citation preview

Q1 2018 Analyst & investor presentation
23 January 2018

Strong start in 2018
2
Customer
Balance Sheet
Network
Cost
Digital and data
Strengthening our market positions across the network Q1 RPS @ CC up 6.6% - positive underlying revenue trend
Underlying cost performance is strong and in line with full year guidance
Strong balance sheet maintained - net cash at 31 December £357 million
Continuous development of differentiated proposition New website driving increased conversion and ancillary revenue
Investment in resilience delivered improvements in On Time Performance

q1 - Key Financial Information
3
Q1 ’18 Q1 ’17 Change*
Passengers (m) 18.8 17.4 8.0%
Load factor (%) 92.1 90.0 2.1ppts
Seats flown (m) 20.4 19.3 5.5%
Passenger revenue (£m) 913.8 808.9 13.0%
Ancillary revenue (£m) 226.3 188.0 20.4%
Total revenue (£m) 1,140.1 996.9 14.4%
Total revenue per seat (£) 55.99 51.64 8.4%
Total revenue per seat @ constant currency (£) 55.03 51.64 6.6%
Total headline cost (£m) 1,106.6 1,065.8 (3.8%)
Total headline CPS (£) 54.34 55.21 1.6%
Total headline CPS @ constant currency (£) 53.40 55.21 3.3%
Total headline CPS, ex-fuel @ constant currency (£) 42.53 42.12 (1.0%)
* Favourable/(adverse)

H1 capacity – excluding tegel
4
Location easyJet growth
UK 4.8%
Switzerland 9.6%
France 6.3%
Amsterdam 5.0%
Venice 11.1%
Lisbon 7.6%
Porto 4.2%
easyJet growth across the network
H2 expectations: Growth on easyJet markets to be higher than level seen in H1:
• C.50% of Monarch slots at LGW filled by BA
• Ryanair to reinstate decreased capacity
5.7%
7.6%
8.7% 8.3%
6.0%
2.4%
3.5%
5.1%
Capacity changetotal SH Market
Competitors oneasyJet markets
Capacity ChangeeasyJet markets
easyJet capacitychange
H1 FY17
H1 FY18
Short haul market growth

RPS - Strong start to 2018
5
Headline Q1 2018
Reported Q1 2018
Constant currency
Passenger revenue per seat 7.1%
Increase 5.3%
Increase
Ancillary revenue per seat 14.1%
Increase 12.3%
Increase
Total revenue per seat 8.4%
Increase 6.6%
Increase
Increases driven by:
• Improved trading environment due to capacity reductions and lower growth in easyJet markets from:
• Monarch (LGW, LTN, MAN, LPL) and Air Berlin (SXF) bankruptcies
• Ryanair cancellations (UK Domestic)
• Ancillary revenue increases due to bag proposition, allocated seating and higher load factor

Headline costs in line with expectations
6
Headline Q1 2018
Reported Q1 2018
Constant currency
Cost per seat including fuel 1.6%
Decrease 3.3%
Decrease
Cost per seat excluding fuel 1.7%
Increase 1.0%
Increase
Increases driven by:
• +2.1ppts year on year load
• Adverse weather:
• De-icing
• Disruption
• Inflation
• Regulated airport charges
• Agreed crew and pilot pay
Offset by:
• Robust management action on costs:
• Airport deals
• Up-gauging of fleet
• Navigation charge reductions primarily in France and Germany
• easyJet Lean has delivered £28m in savings for the quarter

Strong operational performance
7
• Investment in resilience delivering
returns:
• Q1 Network OTP - 81%
• Maintenance response aircraft helping
control 3hr delays
• Solid Gatwick operation:
• Strong improvement in OTP
• Smooth transition to DHL ground handling
services
o Already delivering results
Improved operational / customer statistics
Q1 2018 vs Q1 2017
Total Sectors +3.4%
Network OTP +2ppts
LGW OTP +7ppts
81%
Network OTP
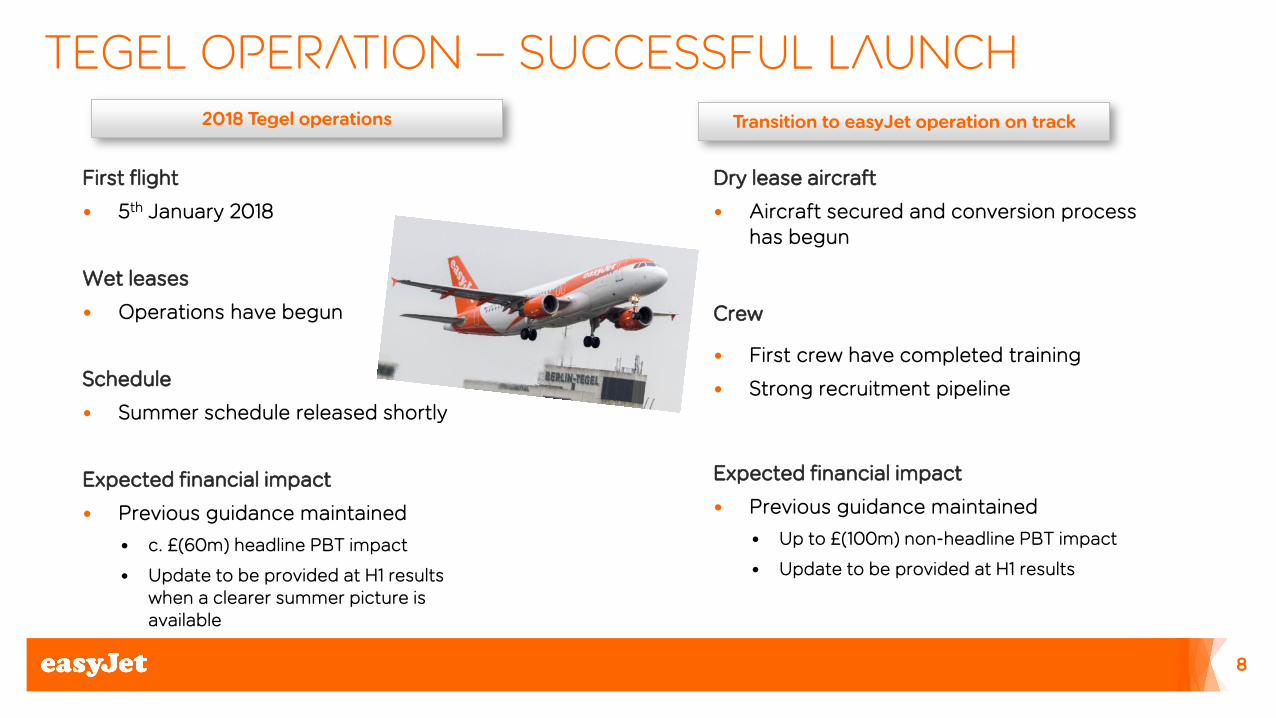
tegel operation – Successful launch
8
Transition to easyJet operation on track
Dry lease aircraft
• Aircraft secured and conversion process has begun
Crew
• First crew have completed training
• Strong recruitment pipeline
Expected financial impact
• Previous guidance maintained
• Up to £(100m) non-headline PBT impact
• Update to be provided at H1 results
2018 Tegel operations
First flight
• 5th January 2018
Wet leases
• Operations have begun
Schedule
• Summer schedule released shortly
Expected financial impact
• Previous guidance maintained
• c. £(60m) headline PBT impact
• Update to be provided at H1 results when a clearer summer picture is available

Positive Underlying trading
9
FY 2018 Headline PBT (as @ FY’17 results)*
(pre Tegel operation)
£505m
H1 Net trading improvement (reflected in updated guidance)
c. +£35m Includes one off benefits from capacity decreases post Monarch / Air Berlin administration and operational issues at Ryanair
Fuel & FX update (£5)m Fuel at $650 per metric tonne
Consensus post H1 trading upside* £535m
Headline PBT impact from 2018 Tegel operations
c.(£60m) No change to previous guidance
Updated Headline PBT consensus (Including 2018 Tegel operation)
£475m
* Starting point based on internally sourced consensus as @ 21 November 2017

Forward bookings
10
90%
81%
55%
35%
55%
73%
16%
92%
86%
58%
40%
60%
77%
20%
Q1 Jan Feb Mar Q2 H1 H2
Last Year This Year
As at 19th January 2018
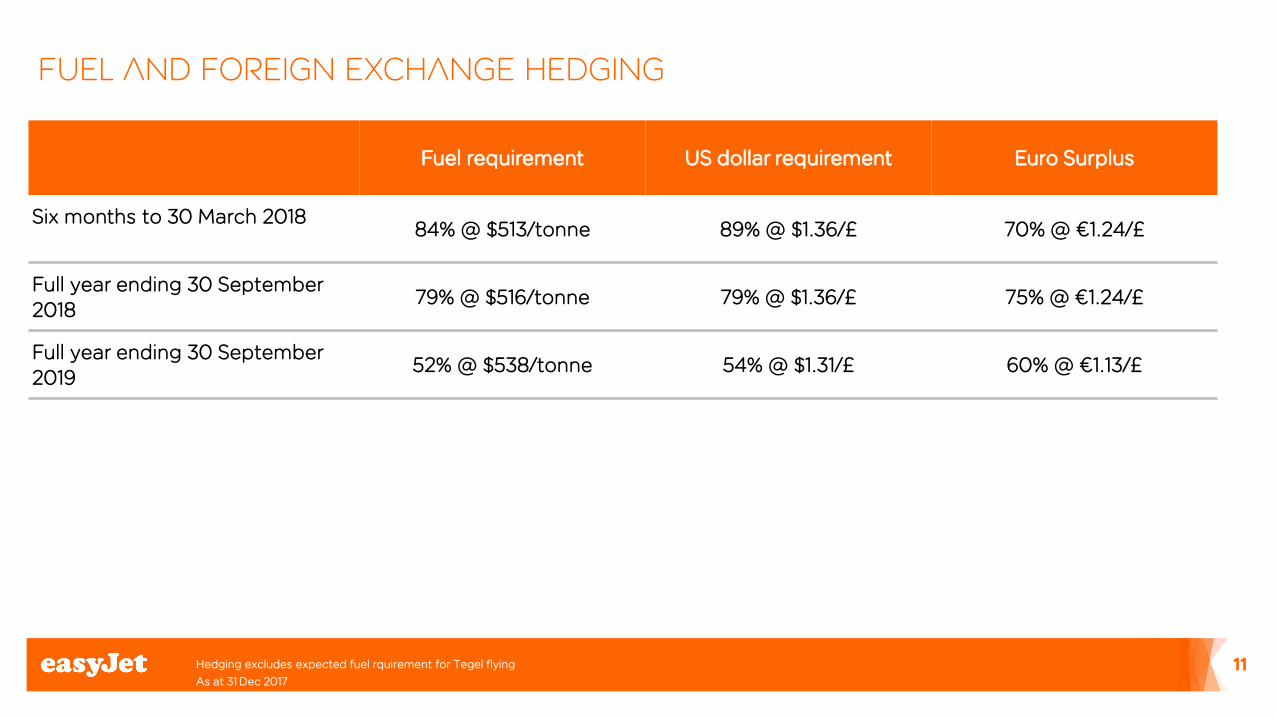
Fuel and foreign exchange hedging
Fuel requirement US dollar requirement Euro Surplus
Six months to 30 March 2018
84% @ $513/tonne 89% @ $1.36/£ 70% @ €1.24/£
Full year ending 30 September 2018
79% @ $516/tonne 79% @ $1.36/£ 75% @ €1.24/£
Full year ending 30 September 2019
52% @ $538/tonne 54% @ $1.31/£ 60% @ €1.13/£
Hedging excludes expected fuel rquirement for Tegel flying
As at 31 Dec 2017
11
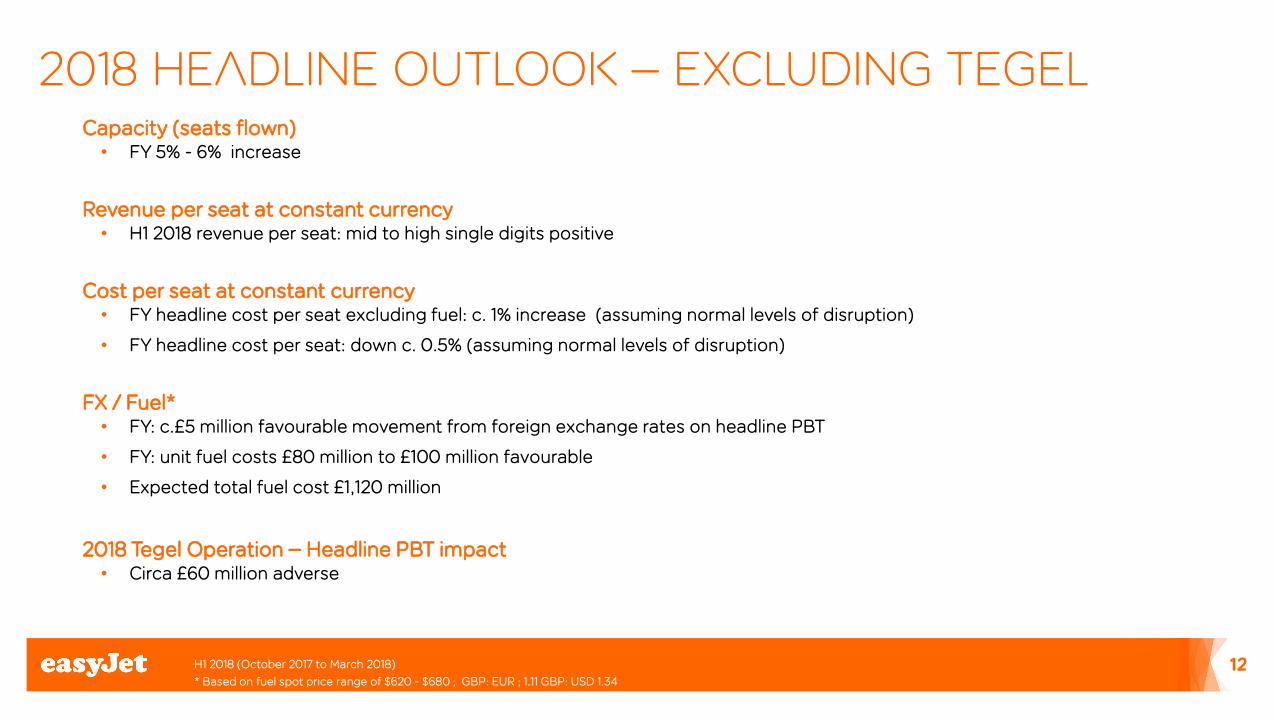
2018 headline Outlook – excluding tegel
H1 2018 (October 2017 to March 2018)
* Based on fuel spot price range of $620 - $680 ; GBP: EUR ; 1.11 GBP: USD 1.34
12
Capacity (seats flown) • FY 5% - 6% increase
Revenue per seat at constant currency • H1 2018 revenue per seat: mid to high single digits positive
Cost per seat at constant currency • FY headline cost per seat excluding fuel: c. 1% increase (assuming normal levels of disruption)
• FY headline cost per seat: down c. 0.5% (assuming normal levels of disruption)
FX / Fuel* • FY: c.£5 million favourable movement from foreign exchange rates on headline PBT
• FY: unit fuel costs £80 million to £100 million favourable
• Expected total fuel cost £1,120 million
2018 Tegel Operation – Headline PBT impact • Circa £60 million adverse

Summary
• Leading customer proposition driving loyalty and ancillary revenue
• Positive revenue per seat momentum - easyJet is winning in the market
• Strong cost performance delivered
• Continued focus to improve On Time Performance and CSAT which are delivering results
• Strong balance sheet and cash position
• Smooth launch of operations at Tegel airport
• New role of Chief Data Officer
13

Q & A