Embed Size (px)
Citation preview

Q1 2019 EarningsMay 1, 2019

Safe Harbor Statement
2
These materials include projections and other forward-looking statements. These statements are based on the current expectations of Garmin Ltd. and are naturally subject to uncertainty and changes in circumstances. Forward-looking statements include, without limitation, statements containing words such as "proposed" and “intends” or “intended” and "expects" or "expected." Any statements regarding Garmin’s revenue, operating earnings, pro forma tax rate and pro forma EPS for fiscal 2019, Garmin’s expected segment revenue growth rates, margins, currency movements, expenses, pricing, new products to be introduced in 2019 and Garmin’s plans and objectives are forward-looking statements. By their nature, forward-looking statements involve risk and uncertainty because they relate to events and depend on circumstances that will occur in the future. There are a number of factors that could cause actual results and developments to differ materially from those expressed or implied by such forward-looking statements. Other unknown or unpredictable factors could cause actual results to differ materially from those in the forward-looking statements. These factors include those discussed or identified in the filing by Garmin Ltd. with the U.S. Securities and Exchange Commission in its Annual Report on Form 10-K. Garmin Ltd. does not undertake any obligation to update publicly or revise forward-looking statements, whether as a result of new information, future events or otherwise, except to the extent legally required.

Business Update
Cliff PemblePresident and CEO
3

1st Quarter Financial Review
• Record consolidated revenue of $766 million, up 8%
• Marine, aviation, fitness and outdoor segments on a combined basis grew 12%
• Gross and operating margins of 59.0% and 19.8%, respectively
• Operating income of $151 million, up 6%
• GAAP EPS of $0.74 and pro forma EPS of $0.73
• Maintaining 2019 guidance
• Ranked one of America’s Top 5 Best Employers by Forbes
4

Marine
5
1st Quarter Business Review• Revenue growth of 18%, driven by
strong chartplotter and sonar sales• Gross and operating margins of 58%
and 19%, respectively
Market/Product Update• Introduced new ECHOMAP Ultra series
with built-in Panoptix LiveScope support• Supplier of the year award from
Independent Boat Builders, Inc. in our first year of partnership
Aviation
6
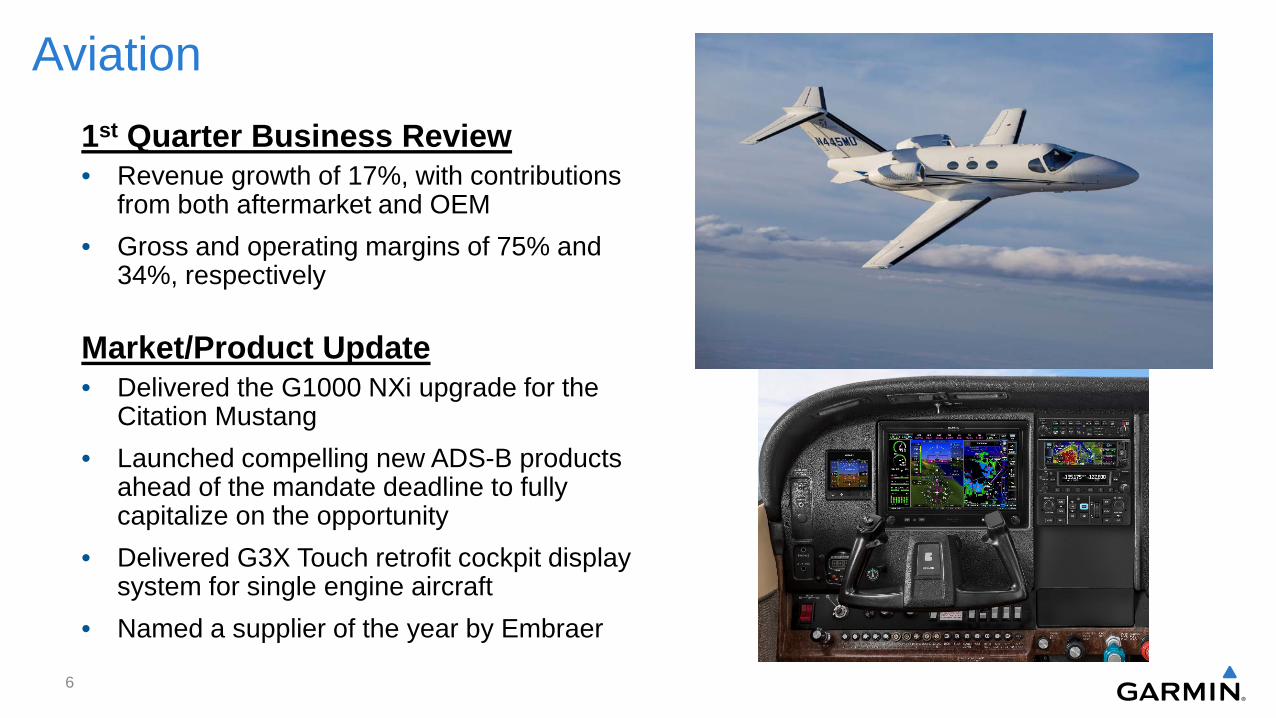
1st Quarter Business Review• Revenue growth of 17%, with contributions
from both aftermarket and OEM• Gross and operating margins of 75% and
34%, respectively
Market/Product Update• Delivered the G1000 NXi upgrade for the
Citation Mustang• Launched compelling new ADS-B products
ahead of the mandate deadline to fully capitalize on the opportunity
• Delivered G3X Touch retrofit cockpit display system for single engine aircraft
• Named a supplier of the year by Embraer

Fitness
7
1st Quarter Business Review• Revenue growth of 9%, driven by strong
wearable sales• Gross and operating margins of 50%
and 10%, respectively
Market/Product Update• Completed the acquisition of Tacx,
adding indoor cycling and training to our product portfolio
• Fully refreshed the Forerunner line of running watches
• Introduced new Garmin Connect app and a new menstrual cycle tracking feature

Outdoor
8
1st Quarter Business Review• Revenue growth of 7%, with growth
across multiple product categories• Gross and operating margins of
63% and 27%, respectively
Market/Product Update• Introduced MARQ series, a new
line of authentic smart tool watches• Launched the S40 stylish golf watch
combining high quality golf functionality with smart features

Auto
9
1st Quarter Business Review• Revenue decline of 10%• Gross and operating margins of 45%
and 6%, respectively
Market/Product Update• Global PND market share remains
strong• Launched the new BC 40 back up
camera• Named the lead design and
manufacturing partner of the BMW AG for next generation vehicle computing systems

Financial Update
Doug BoessenCFO and Treasurer
10

Q1 Income Statement
11
($ Millions) Q1 2019 Q1 2018 ChangeRevenue $766 $711 8%Gross Profit 452 427 6%
Gross Margin % 59.0% 60.0% (100 bps)
Total Operating Expense 300 284 6%Operating Income 151 142 6%
Operating Margin % 19.8% 20.0% (20 bps)
Other Income 15 12 Income Tax Expense (26) (25)
Net Income (GAAP) 140 129 8%Net Income (Pro-Forma) 140 129 9%
EPS (GAAP) $0.74 $0.68 9%EPS (Pro-Forma) $0.73 $0.68 7%

Q1 Revenue
12
($ M) 2019 2018 ChangeMarine $134 $114 18%Aviation 171 146 17%Fitness 180 166 9%Outdoor 154 144 7%Auto 127 141 (10%)Total $766 $711 8%
Q1 Revenue by Segment

Q1 Revenue & Operating Income
13

Operating Expenses
14
142 142 139 145 146
-
25
50
75
100
125
150
175
Q118
Q218
Q318
Q418
Q119
R&D ($M)
25 44
31
55
28
-
25
50
75
100
125
150
175
Q118
Q218
Q318
Q418
Q119
Advertising ($M)
117 121 115 126 127
-
25
50
75
100
125
150
175
Q118
Q218
Q318
Q418
Q119
SG&A ($M)

Balance Sheet• Ended quarter with approximately $2.7 billion of cash and marketable securities• Accounts receivable declined sequentially, as expected, following the seasonally
strong fourth quarter• Inventory balance increased on both a sequential and year-over-year basis in
preparation for the seasonally strong second quarter
Cash Flow• Generated $134 million of free cash flow in Q1 2019
• Paid both the December 31, 2018 and the March 29, 2019 dividends in Q1 2019
Taxes• Q1 2019 effective tax rate of 15.7% compared to 16.0% in Q1 2018
Balance Sheet / Cash Flow / Taxes
15

Q1 2019 EarningsMay 1, 2019

AppendixMay 1, 2019
17

Outdoor Fitness Marine Auto Aviation Total(in thousands)13-Weeks Ended March 30, 2019
Net sales 154,051$ 180,256$ 133,968$ 126,999$ 170,776$ 766,050$ Gross profit 97,488 90,835 78,055 57,337 127,983 451,698 Operating income 41,953 18,126 25,473 8,213 57,618 151,383
13-Weeks Ended March 31, 2018
Net sales 144,258$ 166,035$ 113,554$ 141,312$ 145,713$ 710,872$ Gross profit 93,285 96,601 66,683 61,012 108,954 426,535 Operating income 43,822 33,374 13,131 3,468 48,407 142,202
18
Segment Information
In the first quarter of fiscal 2019, the methodology used to allocate certain selling, general, and administrative expenses to the segments was refined. The Company’s composition of segments did not change. Prior year amounts are presented above as they were originally reported. For comparative purposes, we estimate segment operating income for the 13 weeks ended March 31, 2018 would have been approximately $4 million less for the aviation segment, approximately $4 million more for the marine segment, and not significantly different for the outdoor, fitness, and auto segments. Also, we estimate segment operating income for the 52 weeks ended December 29, 2018 would have been approximately $18 million less for the aviation segment, approximately $11 more for the marine segment, approximately $7 million more for the outdoor segment, and not significantly different for the fitness and auto segments.

19
Non-GAAP Financial Information
To supplement our financial results presented in accordance with GAAP, this release includes the following measures defined by the Securities and Exchange Commission as non-GAAP financial measures: pro forma net income (earnings) per share, pro forma effective tax rate and free cash flow. These non-GAAP measures are not based on any comprehensive set of accounting rules or principles and should not be considered a substitute for, or superior to, financial measures calculated in accordance with GAAP, and may be different from non-GAAP measures used by other companies, limiting the usefulness of the measures for comparison with other companies. Management believes providing investors with an operating view consistent with how it manages the Company provides enhanced transparency into the operating results of the Company, as described in more detail by category below.
The tables below provide reconciliations between the GAAP and non-GAAP measures.
Pro forma effective tax rate
The Company’s income tax expense is periodically impacted by discrete tax items that are not reflective of income tax expense incurred as a result of current period earnings. Therefore, management believes disclosure of the effective tax rateand income tax provision before the effect of certain discrete tax items are important measures to permit investors' consistent comparison between periods. In the first quarter 2019 and 2018, there were no such discrete tax items identified. The net release of uncertain tax position reserves, amounting to approximately $4.4 million and $3.5 million in the first quarter 2019 and 2018, respectively, have not been included as pro forma adjustments in the above presentation of pro forma income tax provision as such items tend to be more recurring in nature.

March 30, March 31,2019 2018
Net income (GAAP) 140,173$ 129,374$ Foreign currency gains / losses(1) (314) (816) Tax effect of foreign currency gains / losses(2) 49 130 Net income (Pro Forma) 139,908$ 128,688$
Net income per share (GAAP): Basic 0.74$ 0.69$ Diluted 0.74$ 0.68$
Net income per share (Pro Forma): Basic 0.74$ 0.68$ Diluted 0.73$ 0.68$
Weighted average common shares outstanding: Basic 189,601 188,322 Diluted 190,599 189,292
13-Weeks Ended
(in thousands, except per share information)
20
Pro forma net income (earnings) per share
Management believes that net income (earnings) per share before the impact of foreign currency gains or losses and certain discrete income tax items, as discussed above, is an important measure in order to permit a consistent comparison of the Company’s performance between periods.
(1) The majority of the Company’s consolidated foreign currency gains and losses are driven by movements in the Taiwan Dollar, Euro, and British Pound Sterling in relation to the U.S. Dollar and the related exchange rate impact on the significant cash, receivables, and payables held in a currency other than the functional currency at one of the Company’s subsidiaries. However, there is minimal cash impact from such foreign currency gains and losses.(2) The tax effect of foreign currency gains and losses was calculated using the effective tax rate of 15.7% and 16.0% for the first quarter ended March 30, 2019 and March 31, 2018, respectively.
March 30, March 31,2019 2018
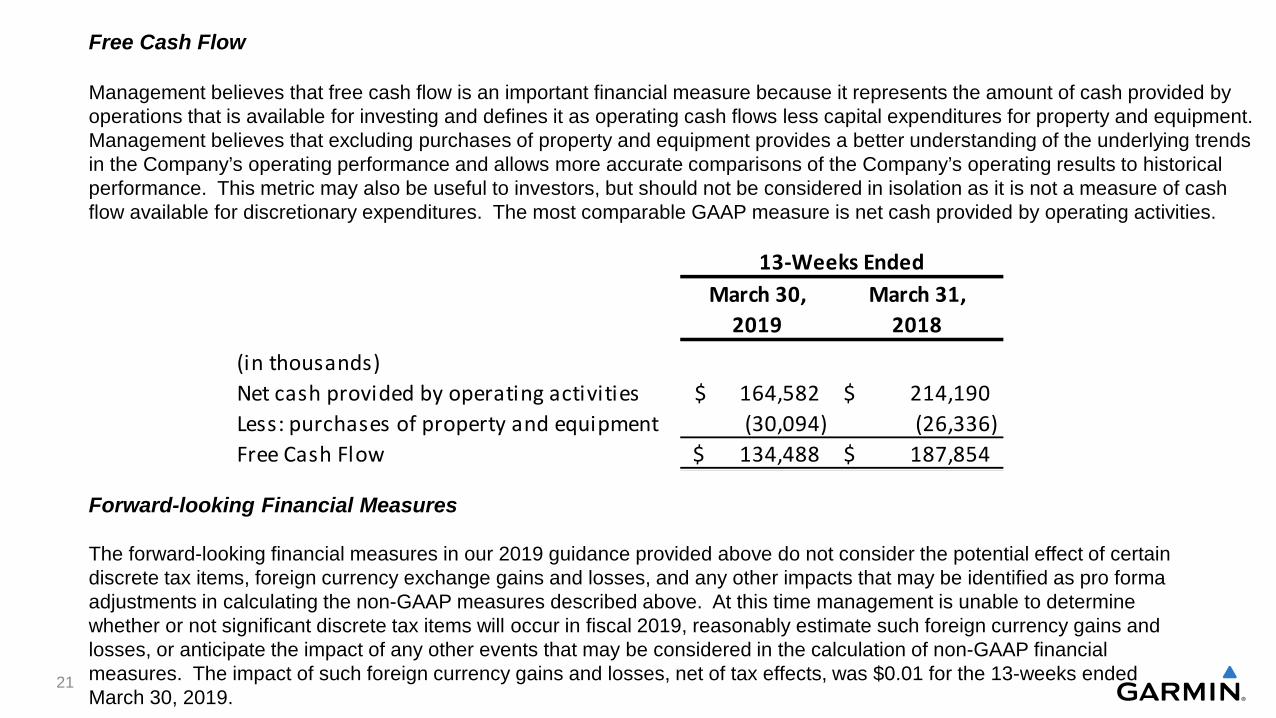
Net cash provided by operating activities 164,582$ 214,190$ Less: purchases of property and equipment (30,094) (26,336) Free Cash Flow 134,488$ 187,854$
(in thousands)
13-Weeks Ended
21
Free Cash Flow
Management believes that free cash flow is an important financial measure because it represents the amount of cash provided by operations that is available for investing and defines it as operating cash flows less capital expenditures for property and equipment. Management believes that excluding purchases of property and equipment provides a better understanding of the underlying trends in the Company’s operating performance and allows more accurate comparisons of the Company’s operating results to historical performance. This metric may also be useful to investors, but should not be considered in isolation as it is not a measure of cash flow available for discretionary expenditures. The most comparable GAAP measure is net cash provided by operating activities.
Forward-looking Financial Measures
The forward-looking financial measures in our 2019 guidance provided above do not consider the potential effect of certain discrete tax items, foreign currency exchange gains and losses, and any other impacts that may be identified as pro forma adjustments in calculating the non-GAAP measures described above. At this time management is unable to determine whether or not significant discrete tax items will occur in fiscal 2019, reasonably estimate such foreign currency gains and losses, or anticipate the impact of any other events that may be considered in the calculation of non-GAAP financial measures. The impact of such foreign currency gains and losses, net of tax effects, was $0.01 for the 13-weeks ended March 30, 2019.