Embed Size (px)
Citation preview
Q1 CYBERCRIME REPORT
160 W Santa Clara StSan Jose, CA, 95113United States
threatmetrix.comTelephone: +1 408 200 5755Fax: +1 408 200 [email protected]
2threatmetrix.com2
Cybercrime Report Q1 2017Alisdair FaulknerChief Products Officer
2 Foreword
3 Overview
11 Transactions & Attacks
29 Top Attack Methods
35 Mobile
40 Conclusion
It sometimes feels like we are engaged in a similar battleground with cybercrime.
Fraudsters start every attack with the clear intention of outsmarting businesses,
running faster, playing cleverer to evade detection and capture. Organizations,
meanwhile face each day knowing that one chink in their security defenses could
mean the difference between success and failure. It’s a perilous path to tread.
Perhaps some businesses even feel more like the gazelle than the lion, trying hard
to escape the clutches of the fraudster and not always succeeding. This complex
interplay of the chase is a very real battle for survival and the businesses that
survive will be those with a single-minded vision to secure their defenses from the
threat of fraud.
The chief risk officer of one of our customers summarized the current landscape
thus: “fraud prevention is not a competitive advantage”; it’s a core business
function in our digital-first economy, intricately intertwined not only with profit
and loss but with net promoter scores and customer lifetime value. Quite simply,
it’s a business imperative.
Meanwhile, businesses must continue to prioritize digital first strategies. The
pilgrimage to digital transformation is an interesting one; the last year has
shown us that it is a journey that doesn’t seem to grow any shorter. We reach
key destinations along the way - assimilation of mobile, detection of new attack
methods - but new horizons promise greater change. Evolving cybercrime tactics,
the growth of a global digital economy, new technologies disrupting current
modus operandi. Every conversation that I have with heads of business currently
revolves around this fast pace of change; organizations must continually adapt or
be subsumed by the ever more nimble challengers.
There’s an old folklore that says:
“Every morning in Africa, a gazelle wakes up, it knows it must outrun the fastest
lion or it will be killed. Every morning in Africa, a lion wakes up. It knows it must
run faster than the slowest gazelle, or it will starve….”
At the same time we are facing a maelstrom of regulatory change, as countries
and regions attempt to drive innovation, promote competition and push for
safer and safer transaction methods. Europe is on the cliff face of PSD2; with
established financial institutions keen to tread a path between compliance and
maintaining the slick and risk-based authentication strategies they’ve worked so
hard to prioritize over more cumbersome token-based ones. FinTechs are bracing
themselves for the inevitable emergence of new players looking to capitalize on
this new open API ecosystem. Real-time payments are coming to Australia (NPP)
bringing it in line with several other global countries, along with the additional
risk this creates from removing the safety net of manual reviews and time-lags in
transaction processing.
As we hone our product roadmap for the year, we focus on continuing to deliver
capabilities that enable our customers to successfully navigate the evolving
regulatory landscape, changing customer behavior and the increasing pace of
cybercrime. At the heart of this strategy remains the power of Digital Identity
Intelligence to effectively distinguish between trusted users and potential threats.
It is only in the intricacies of these unique digital identities that stolen identities
and fraudulent tactics are revealed for what they truly are. And by combining with
behavioral analytics and machine learning, businesses can tailor their strategies to
individual user behavior, improving their capabilities to detect complex fraud with
a greater degree of accuracy.
3threatmetrix.com3
Cybercrime Report Q1 2017Alisdair FaulknerChief Products Officer
2 Foreword
3 Overview
11 Transactions & Attacks
29 Top Attack Methods
35 Mobile
40 Conclusion
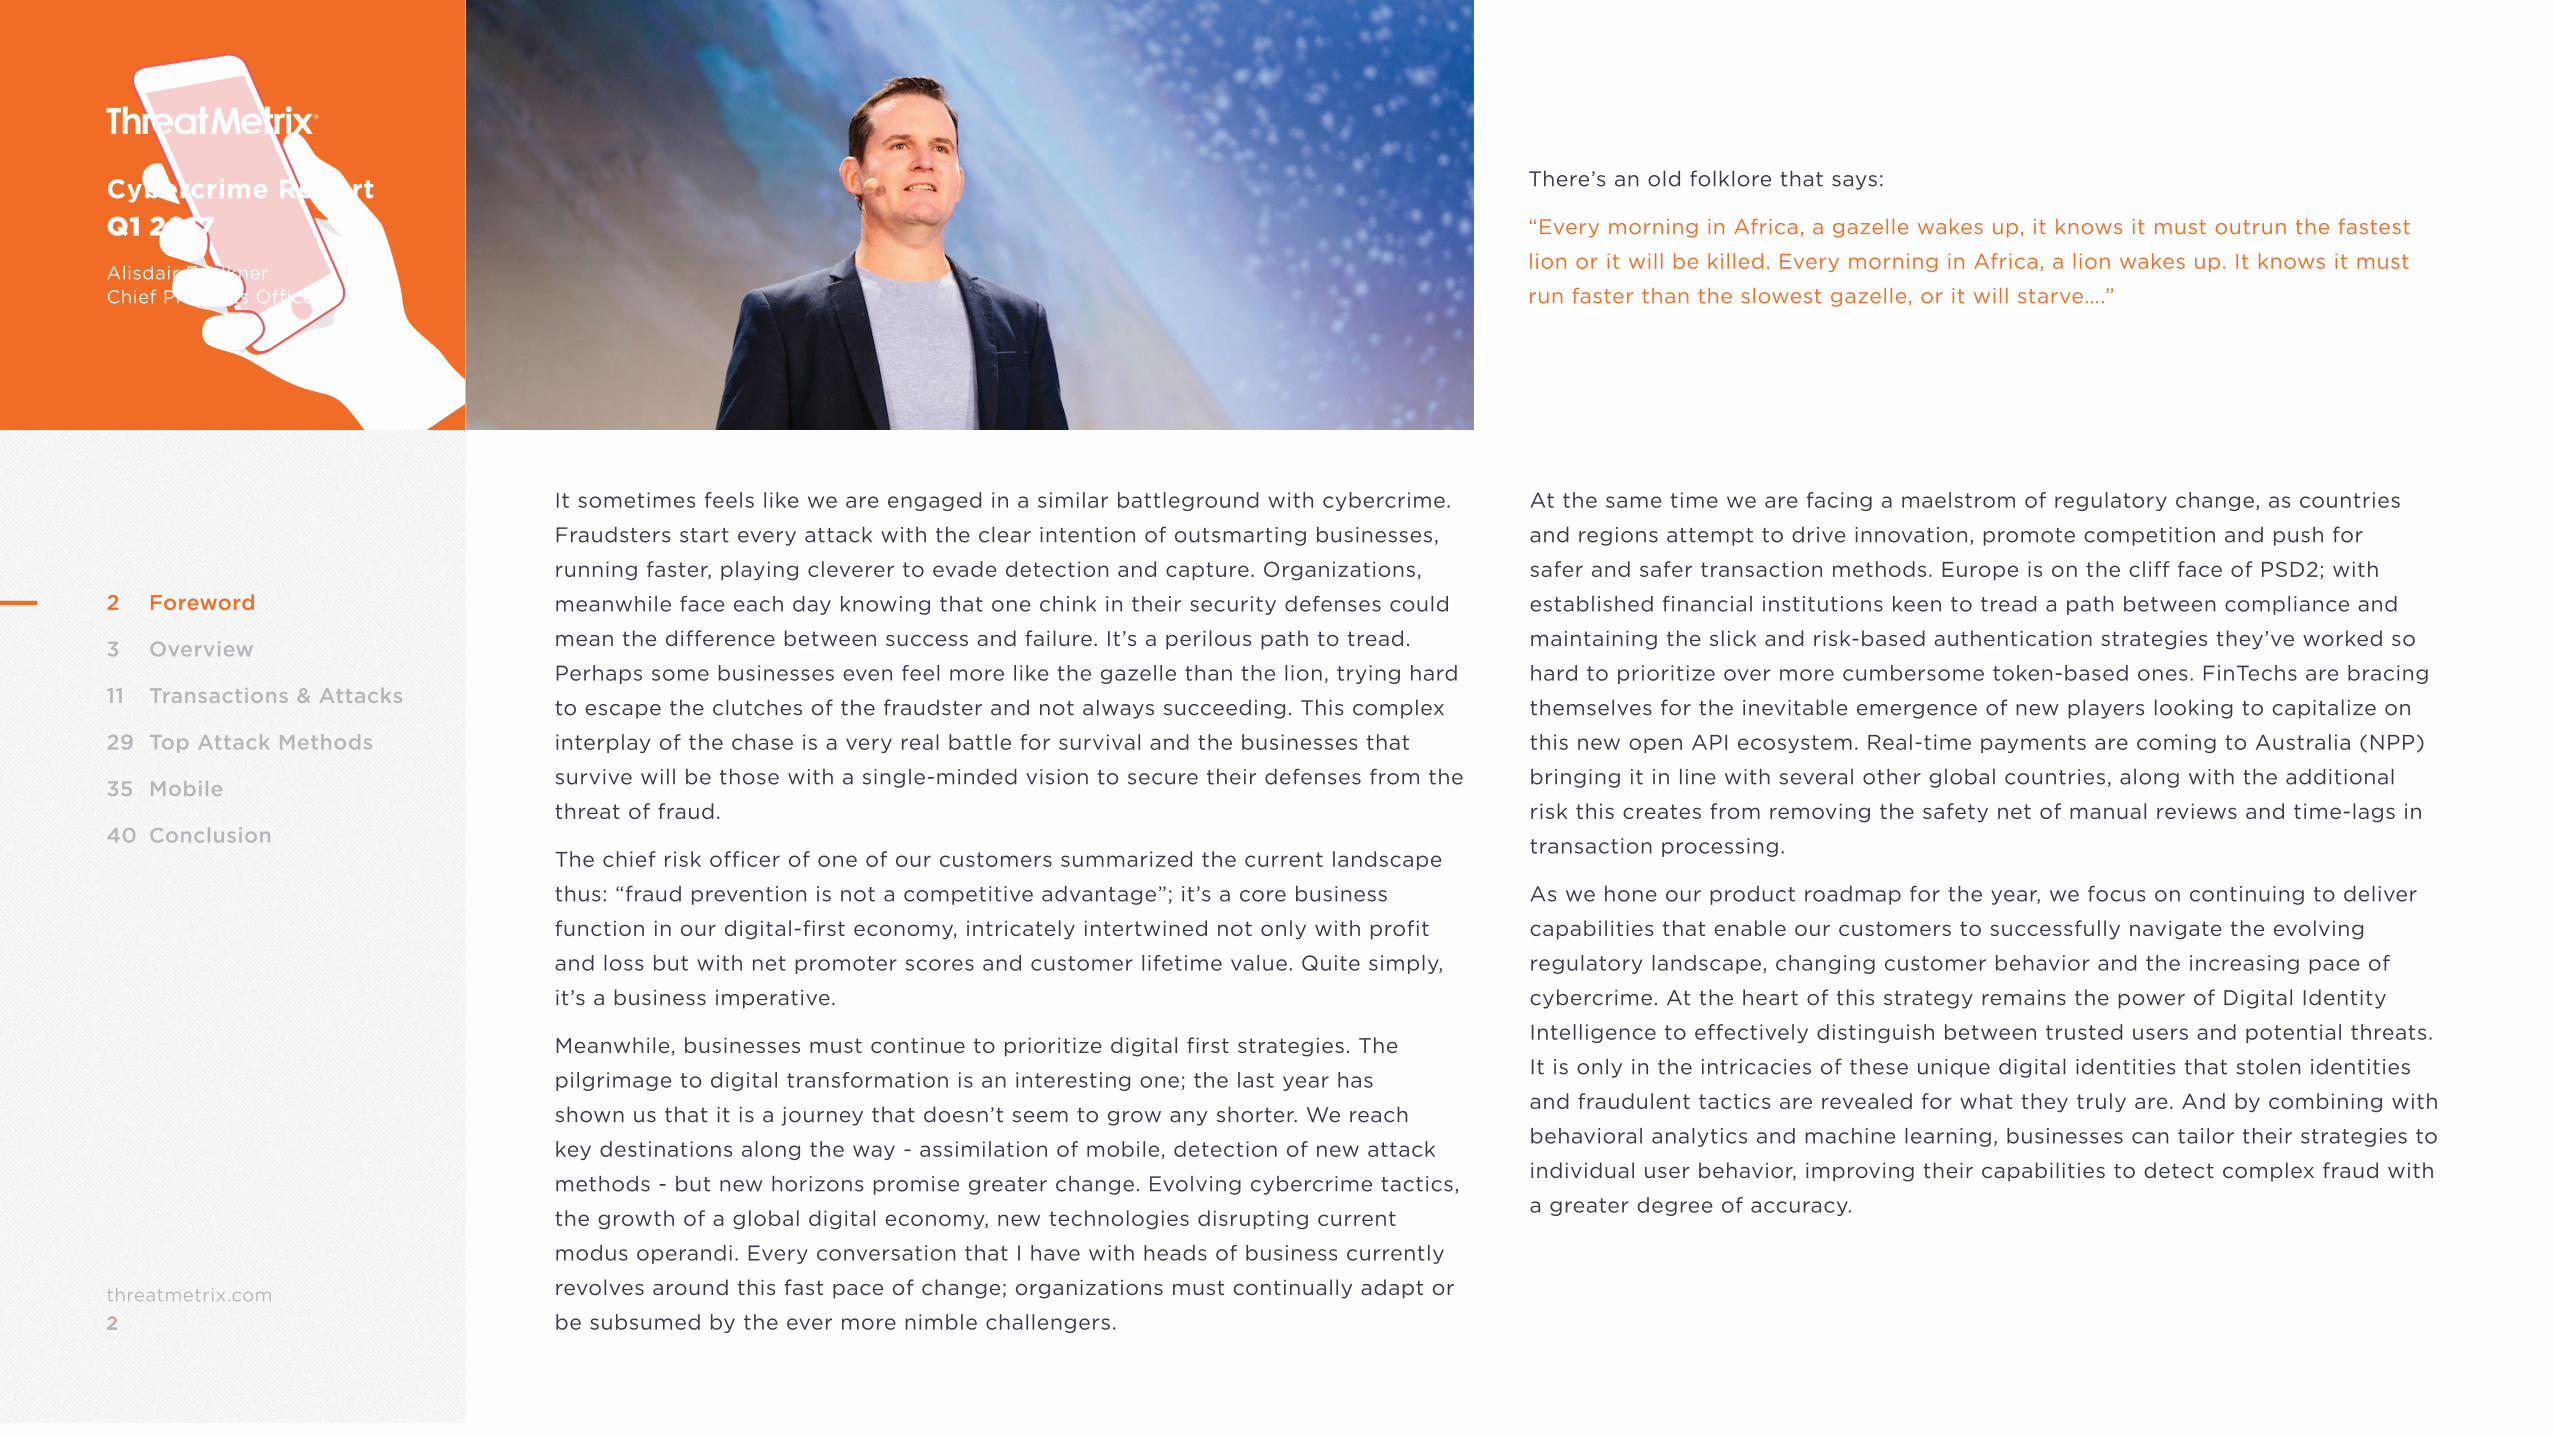
In the ever-evolving world of cybercrime, authentication continues to be a
mainstay of global digital businesses; accurately recognizing trusted returning
users and promoting a frictionless online environment builds a loyal customer base
and reduces attrition.
However, cybercrime is becoming an increasingly global phenomenon, operating
across borders in well organized criminal gangs, with knowledge sharing and
centralized intelligence. Attacks continue to evolve quicker than the tools and
techniques used to detect them.
Some key attack trends analyzed this quarter include:
The multifarious attack methods used in a 2017 cybercrime attack
The evolution of attacks from single to multi-vector approaches
Identity theft is a key issue for all industry sectors as they continue to
see attacks involving stolen and synthetic credentials, harvested from
omnipresent data breaches
The proliferation of RATs in the financial services sector
The sophistication of bot attacks
The only effective armor is to genuinely understand who your real
customers are and how they transact, by collecting and processing all the
information you know about them and using this to make informed risk
decisions.
2017: The Current Threat Environment
4threatmetrix.com4
Cybercrime Report Q1 2017
Alisdair FaulknerChief Products Officer
2 Foreword
3 Overview
11 Transactions & Attacks
29 Top Attack Methods
35 Mobile
40 Conclusion
The ThreatMetrix Cybercrime Report: Q1 2017 is based on actual cybercrime
attacks from January – March 2017 that were detected by the ThreatMetrix Digital
Identity Network (The Network) during real-time analysis and interdiction of
fraudulent online payments, logins and new account applications.
The Network provides visibility and insight into traffic patterns and emerging
threats. The Network analyzes close to two billion transactions per month, over
45% of which originate from mobile devices.
These transactions are analyzed for legitimacy based on hundreds of attributes,
including device identification, geolocation, previous history and behavioral
analytics.
The Network and its real-time policy engine provide unique insight into users’
digital identities, even as they move between applications, devices, and networks.
ThreatMetrix customers benefit from a global view of risks, based on these
attributes and rules that are custom-tuned specifically for their businesses.
Attacks discussed are from “high-risk” transactions scored by ThreatMetrix
customers.
Report Overview
5threatmetrix.com5
Cybercrime Report Q1 2017
Alisdair FaulknerChief Products Officer
2 Foreword
3 Overview
11 Transactions & Attacks
29 Top Attack Methods
35 Mobile
40 Conclusion
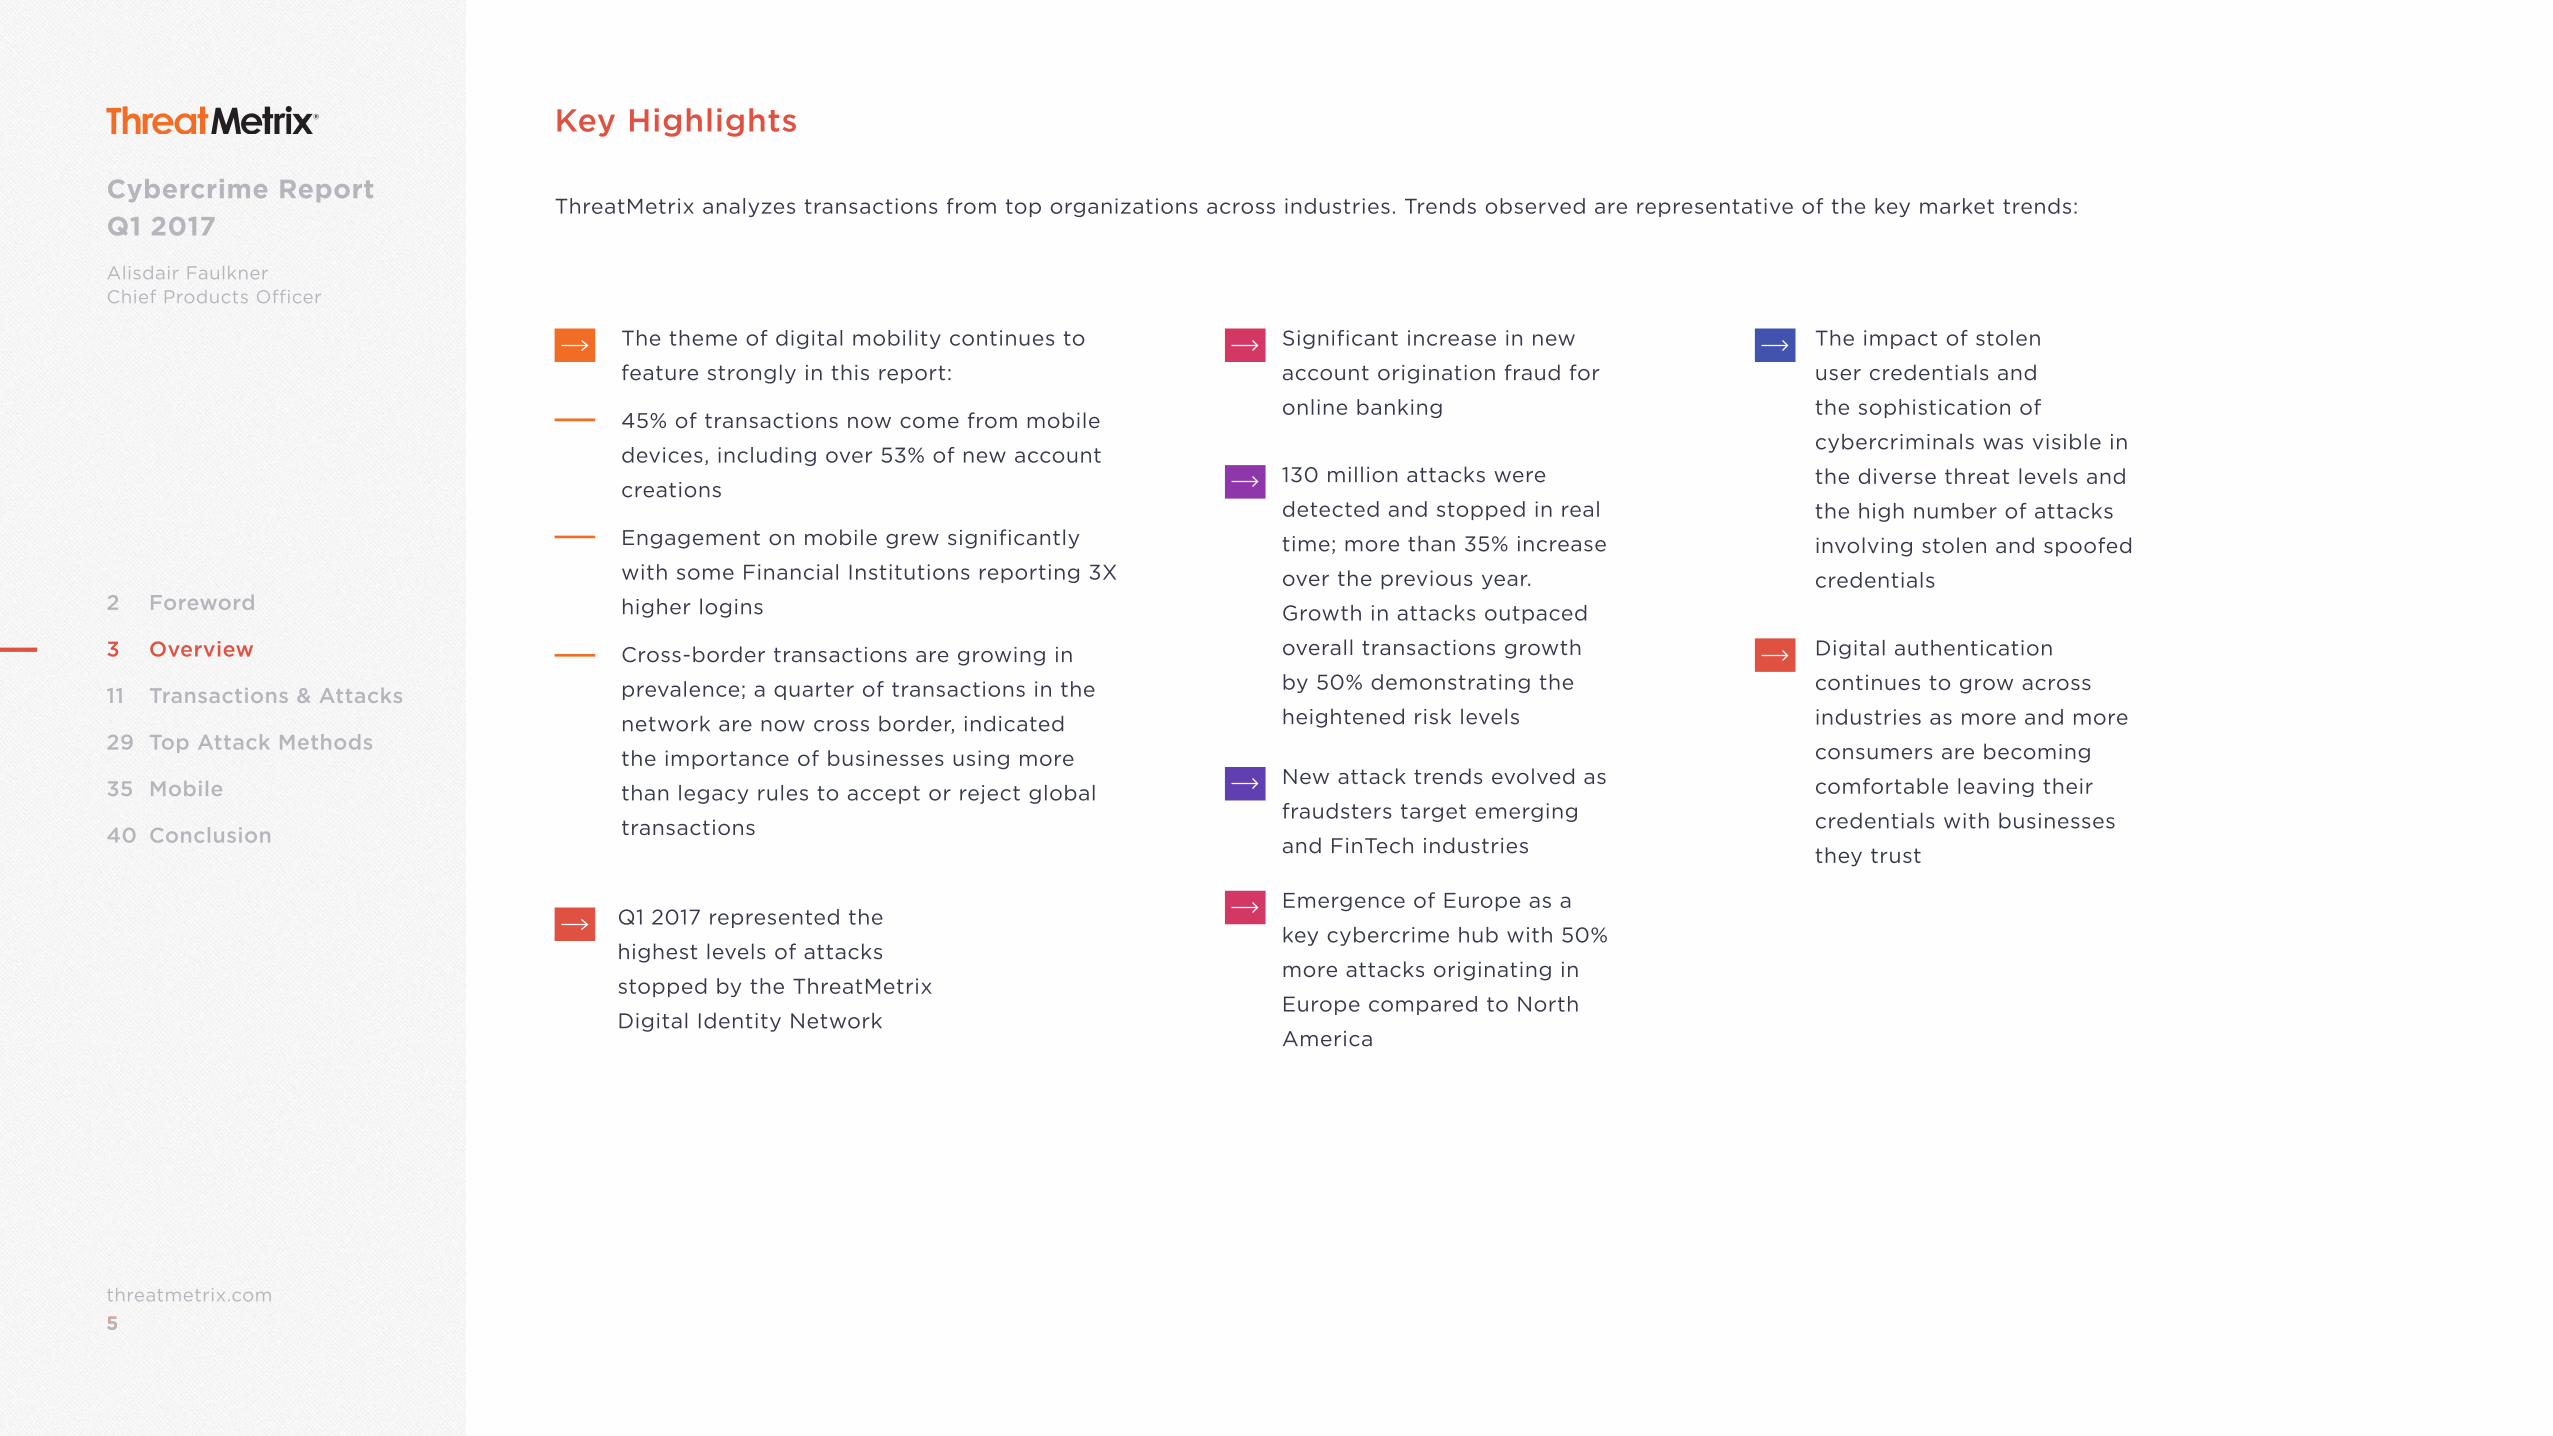
Q1 2017 represented the
highest levels of attacks
stopped by the ThreatMetrix
Digital Identity Network
Significant increase in new
account origination fraud for
online banking
Emergence of Europe as a
key cybercrime hub with 50%
more attacks originating in
Europe compared to North
America
Digital authentication
continues to grow across
industries as more and more
consumers are becoming
comfortable leaving their
credentials with businesses
they trust
130 million attacks were
detected and stopped in real
time; more than 35% increase
over the previous year.
Growth in attacks outpaced
overall transactions growth
by 50% demonstrating the
heightened risk levels
The impact of stolen
user credentials and
the sophistication of
cybercriminals was visible in
the diverse threat levels and
the high number of attacks
involving stolen and spoofed
credentials
New attack trends evolved as
fraudsters target emerging
and FinTech industries
ThreatMetrix analyzes transactions from top organizations across industries. Trends observed are representative of the key market trends:
Key Highlights
The theme of digital mobility continues to
feature strongly in this report:
45% of transactions now come from mobile
devices, including over 53% of new account
creations
Engagement on mobile grew significantly
with some Financial Institutions reporting 3X
higher logins
Cross-border transactions are growing in
prevalence; a quarter of transactions in the
network are now cross border, indicated
the importance of businesses using more
than legacy rules to accept or reject global
transactions
6threatmetrix.com6
Cybercrime Report Q1 2017
Alisdair FaulknerChief Products Officer
2 Foreword
3 Overview
11 Transactions & Attacks
29 Top Attack Methods
35 Mobile
40 Conclusion
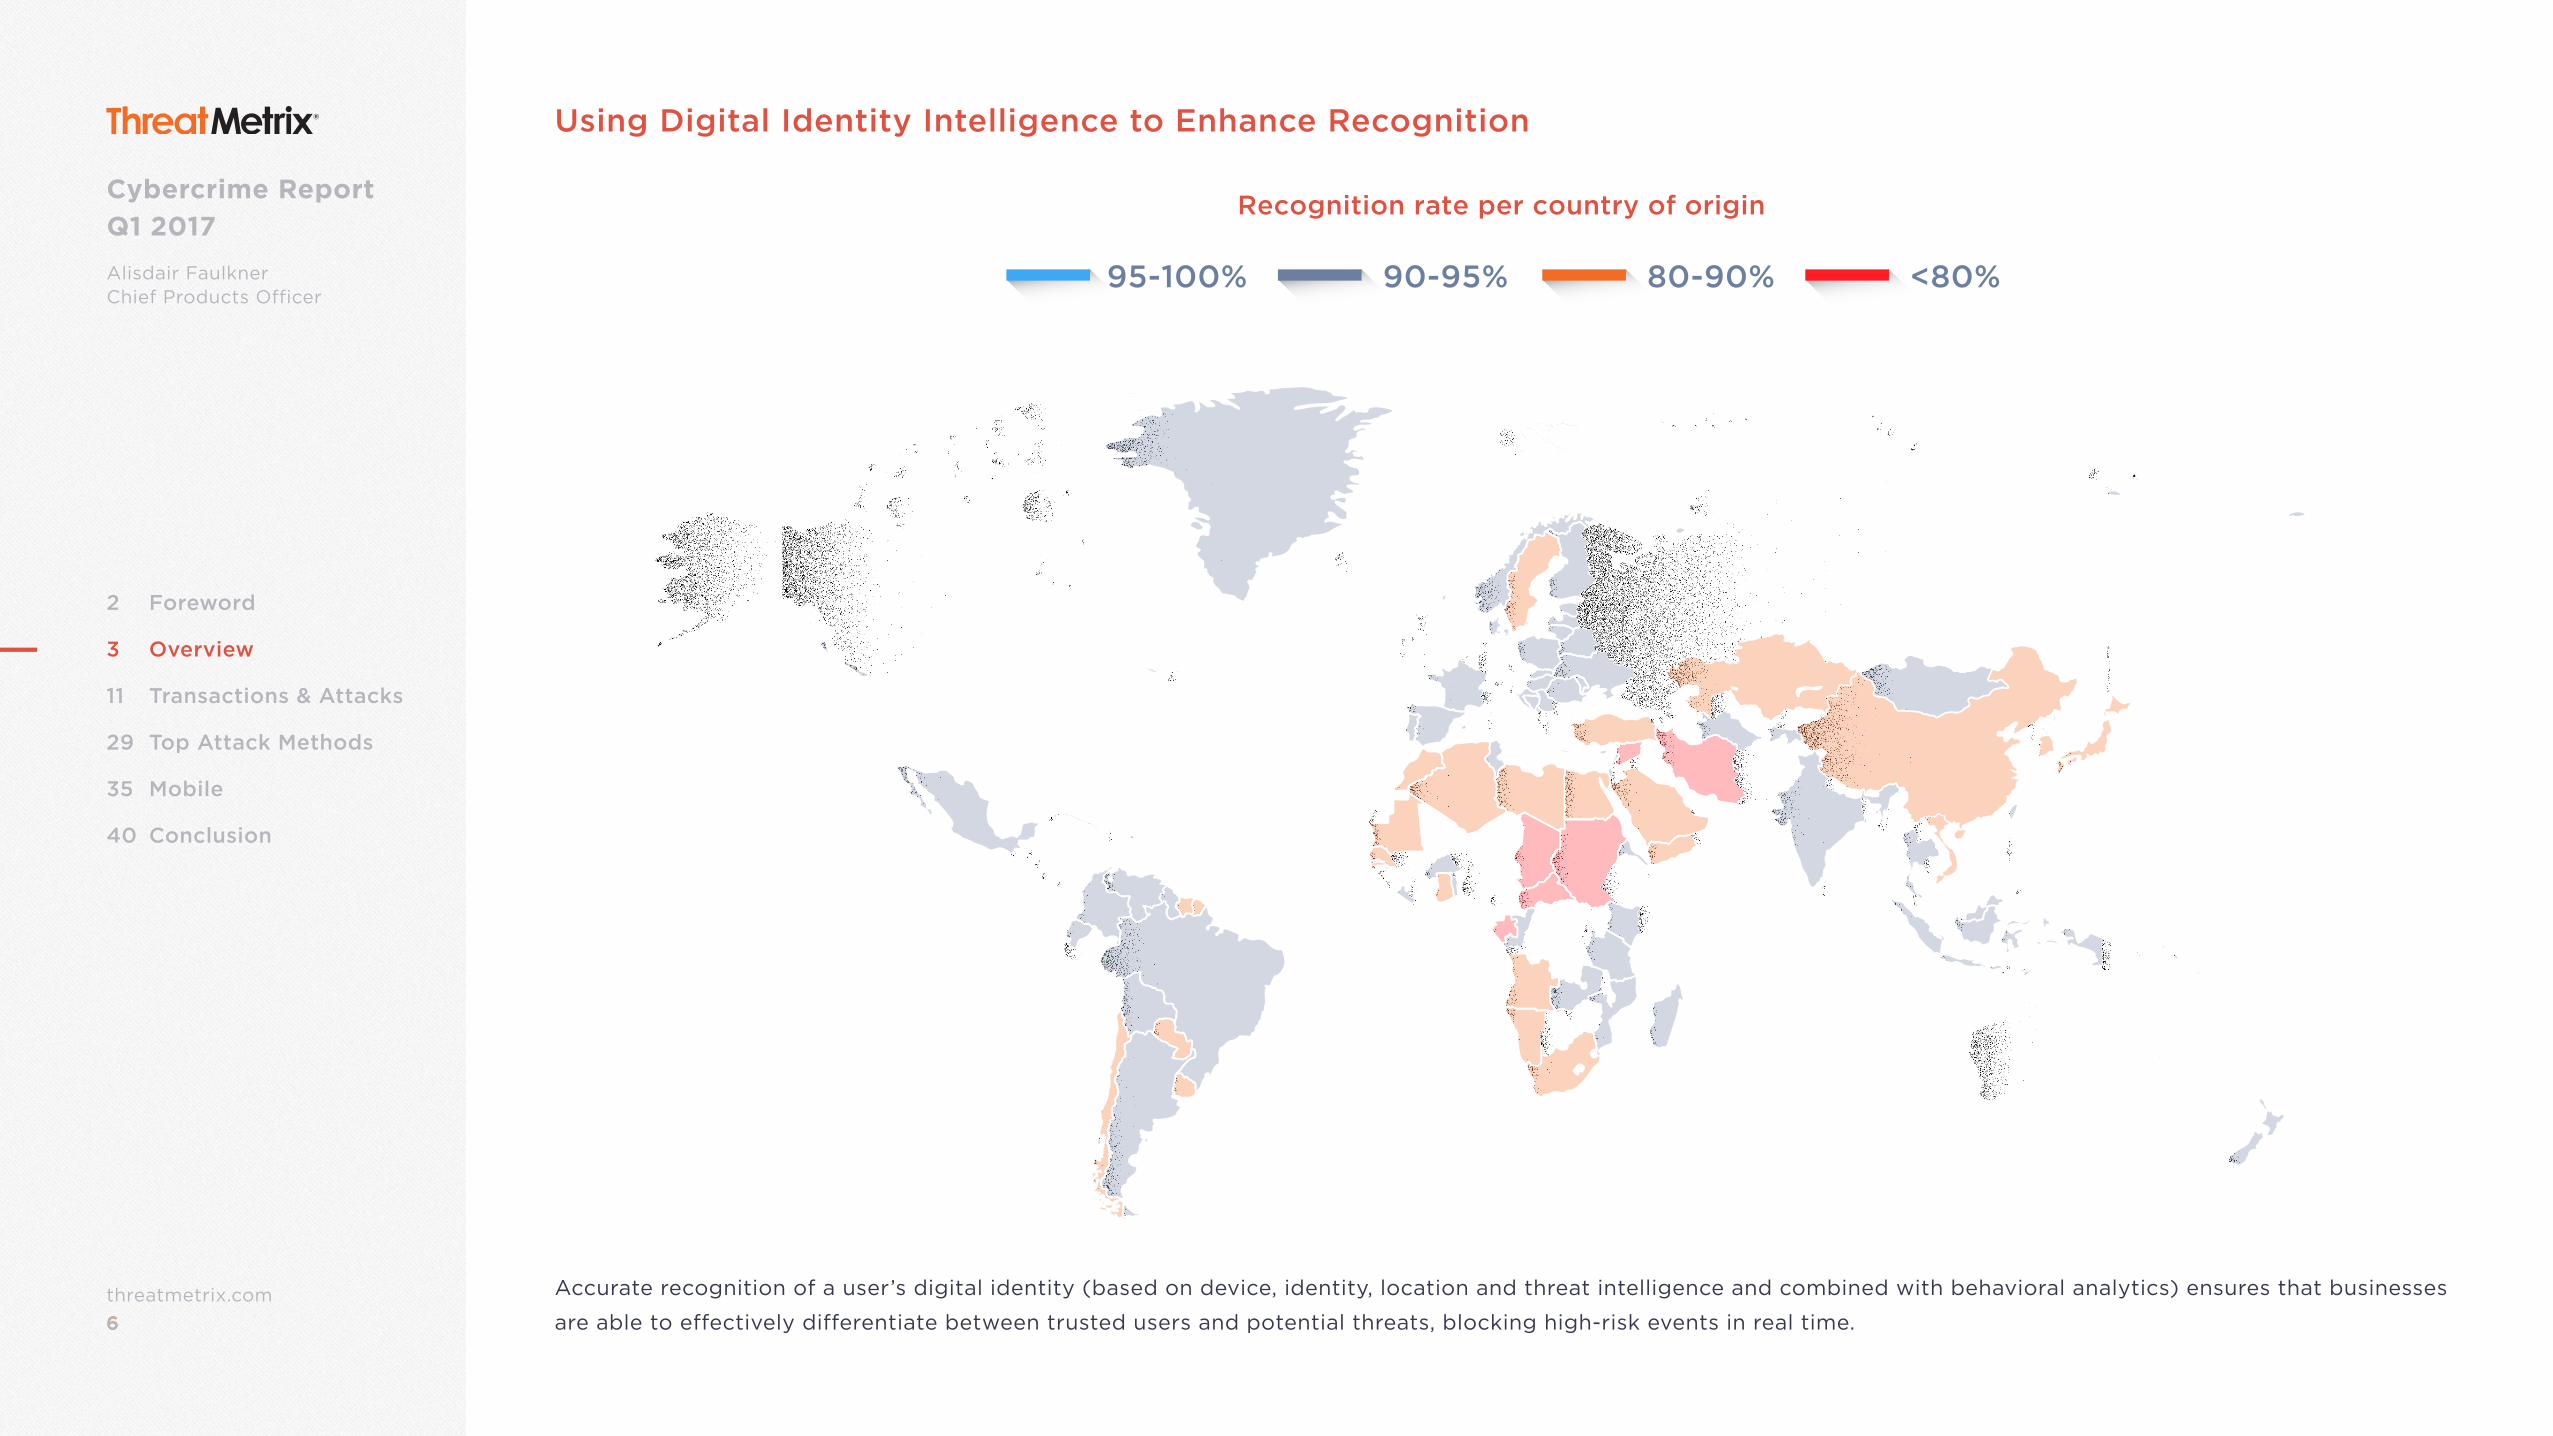
Accurate recognition of a user’s digital identity (based on device, identity, location and threat intelligence and combined with behavioral analytics) ensures that businesses
are able to effectively differentiate between trusted users and potential threats, blocking high-risk events in real time.
Using Digital Identity Intelligence to Enhance Recognition
Recognition rate per country of origin
95-100% 90-95% 80-90% <80%
7threatmetrix.com7
Cybercrime Report Q1 2017
Alisdair FaulknerChief Products Officer
2 Foreword
3 Overview
11 Transactions & Attacks
29 Top Attack Methods
35 Mobile
40 Conclusion
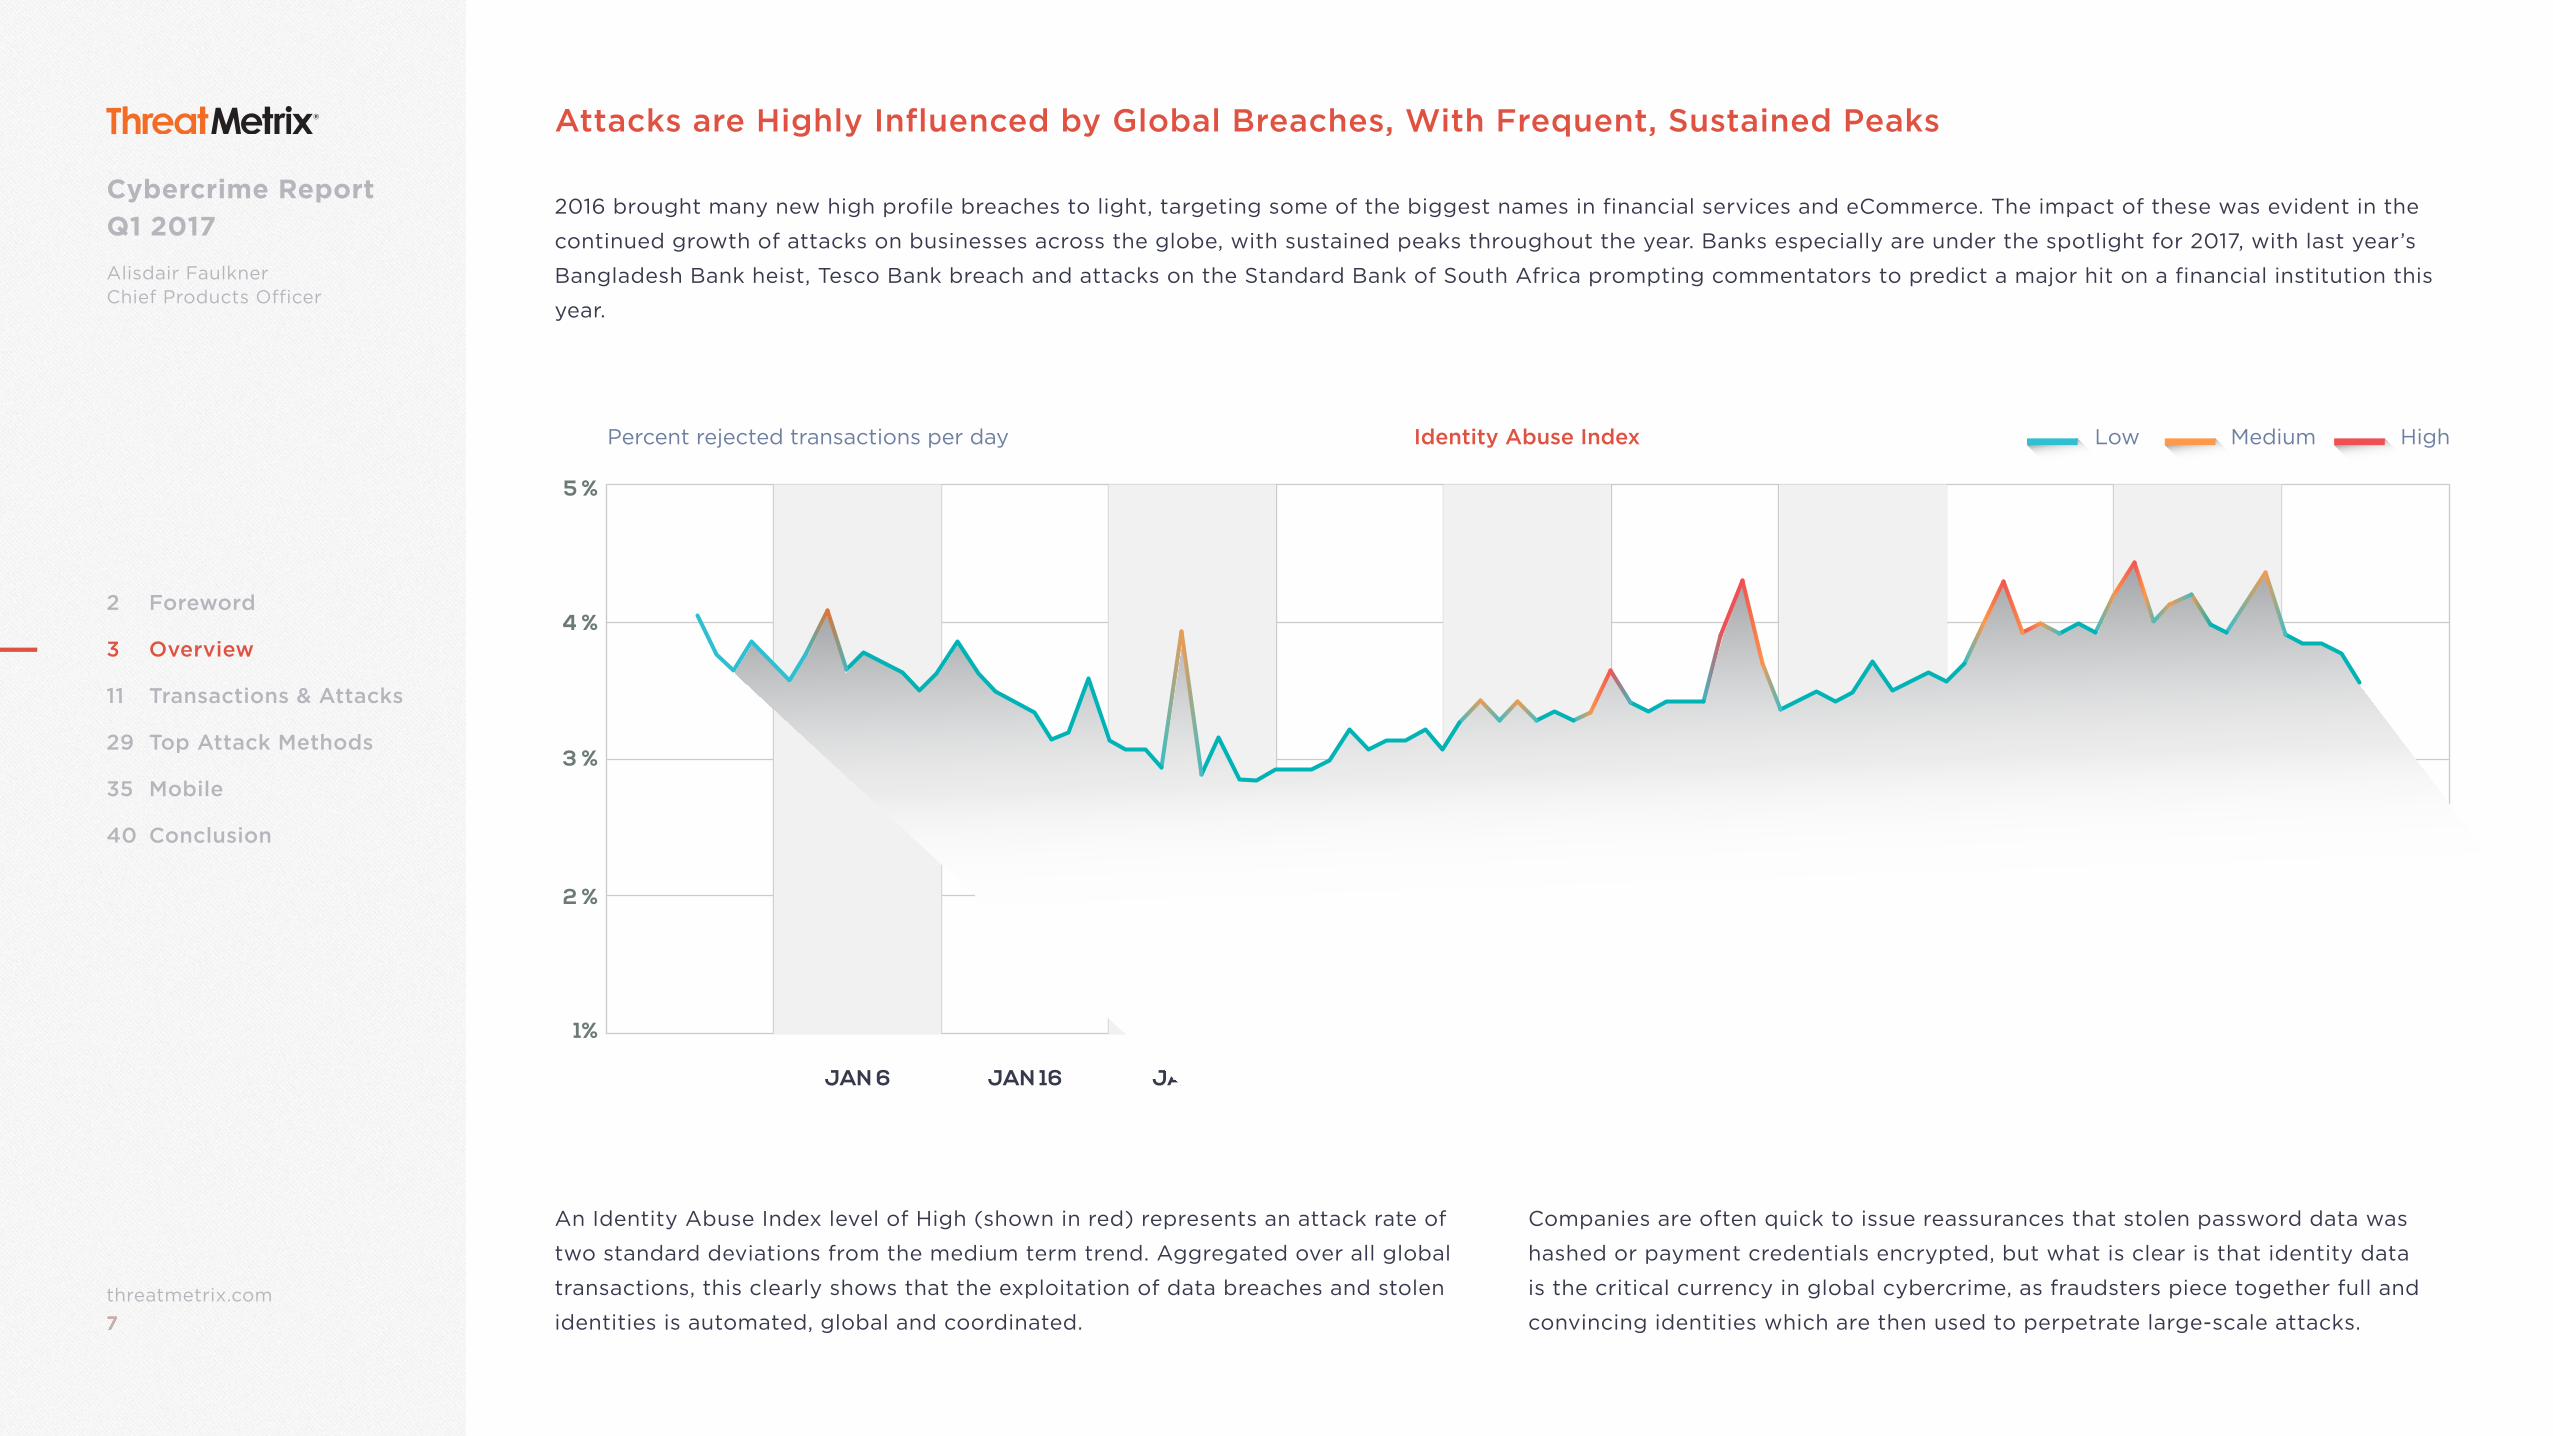
2016 brought many new high profile breaches to light, targeting some of the biggest names in financial services and eCommerce. The impact of these was evident in the
continued growth of attacks on businesses across the globe, with sustained peaks throughout the year. Banks especially are under the spotlight for 2017, with last year’s
Bangladesh Bank heist, Tesco Bank breach and attacks on the Standard Bank of South Africa prompting commentators to predict a major hit on a financial institution this
year.
Companies are often quick to issue reassurances that stolen password data was
hashed or payment credentials encrypted, but what is clear is that identity data
is the critical currency in global cybercrime, as fraudsters piece together full and
convincing identities which are then used to perpetrate large-scale attacks.
An Identity Abuse Index level of High (shown in red) represents an attack rate of
two standard deviations from the medium term trend. Aggregated over all global
transactions, this clearly shows that the exploitation of data breaches and stolen
identities is automated, global and coordinated.
Attacks are Highly Influenced by Global Breaches, With Frequent, Sustained Peaks
JAN 6 JAN 16 JAN 26 FEB 5 FEB 15 FEB 25 MAR 7 MAR 17 MAR 27
1%
2 %
5 %
3 %
4 %
Percent rejected transactions per day Low Medium HighIdentity Abuse Index
8threatmetrix.com8
Cybercrime Report Q1 2017
Alisdair FaulknerChief Products Officer
2 Foreword
3 Overview
11 Transactions & Attacks
29 Top Attack Methods
35 Mobile
40 Conclusion
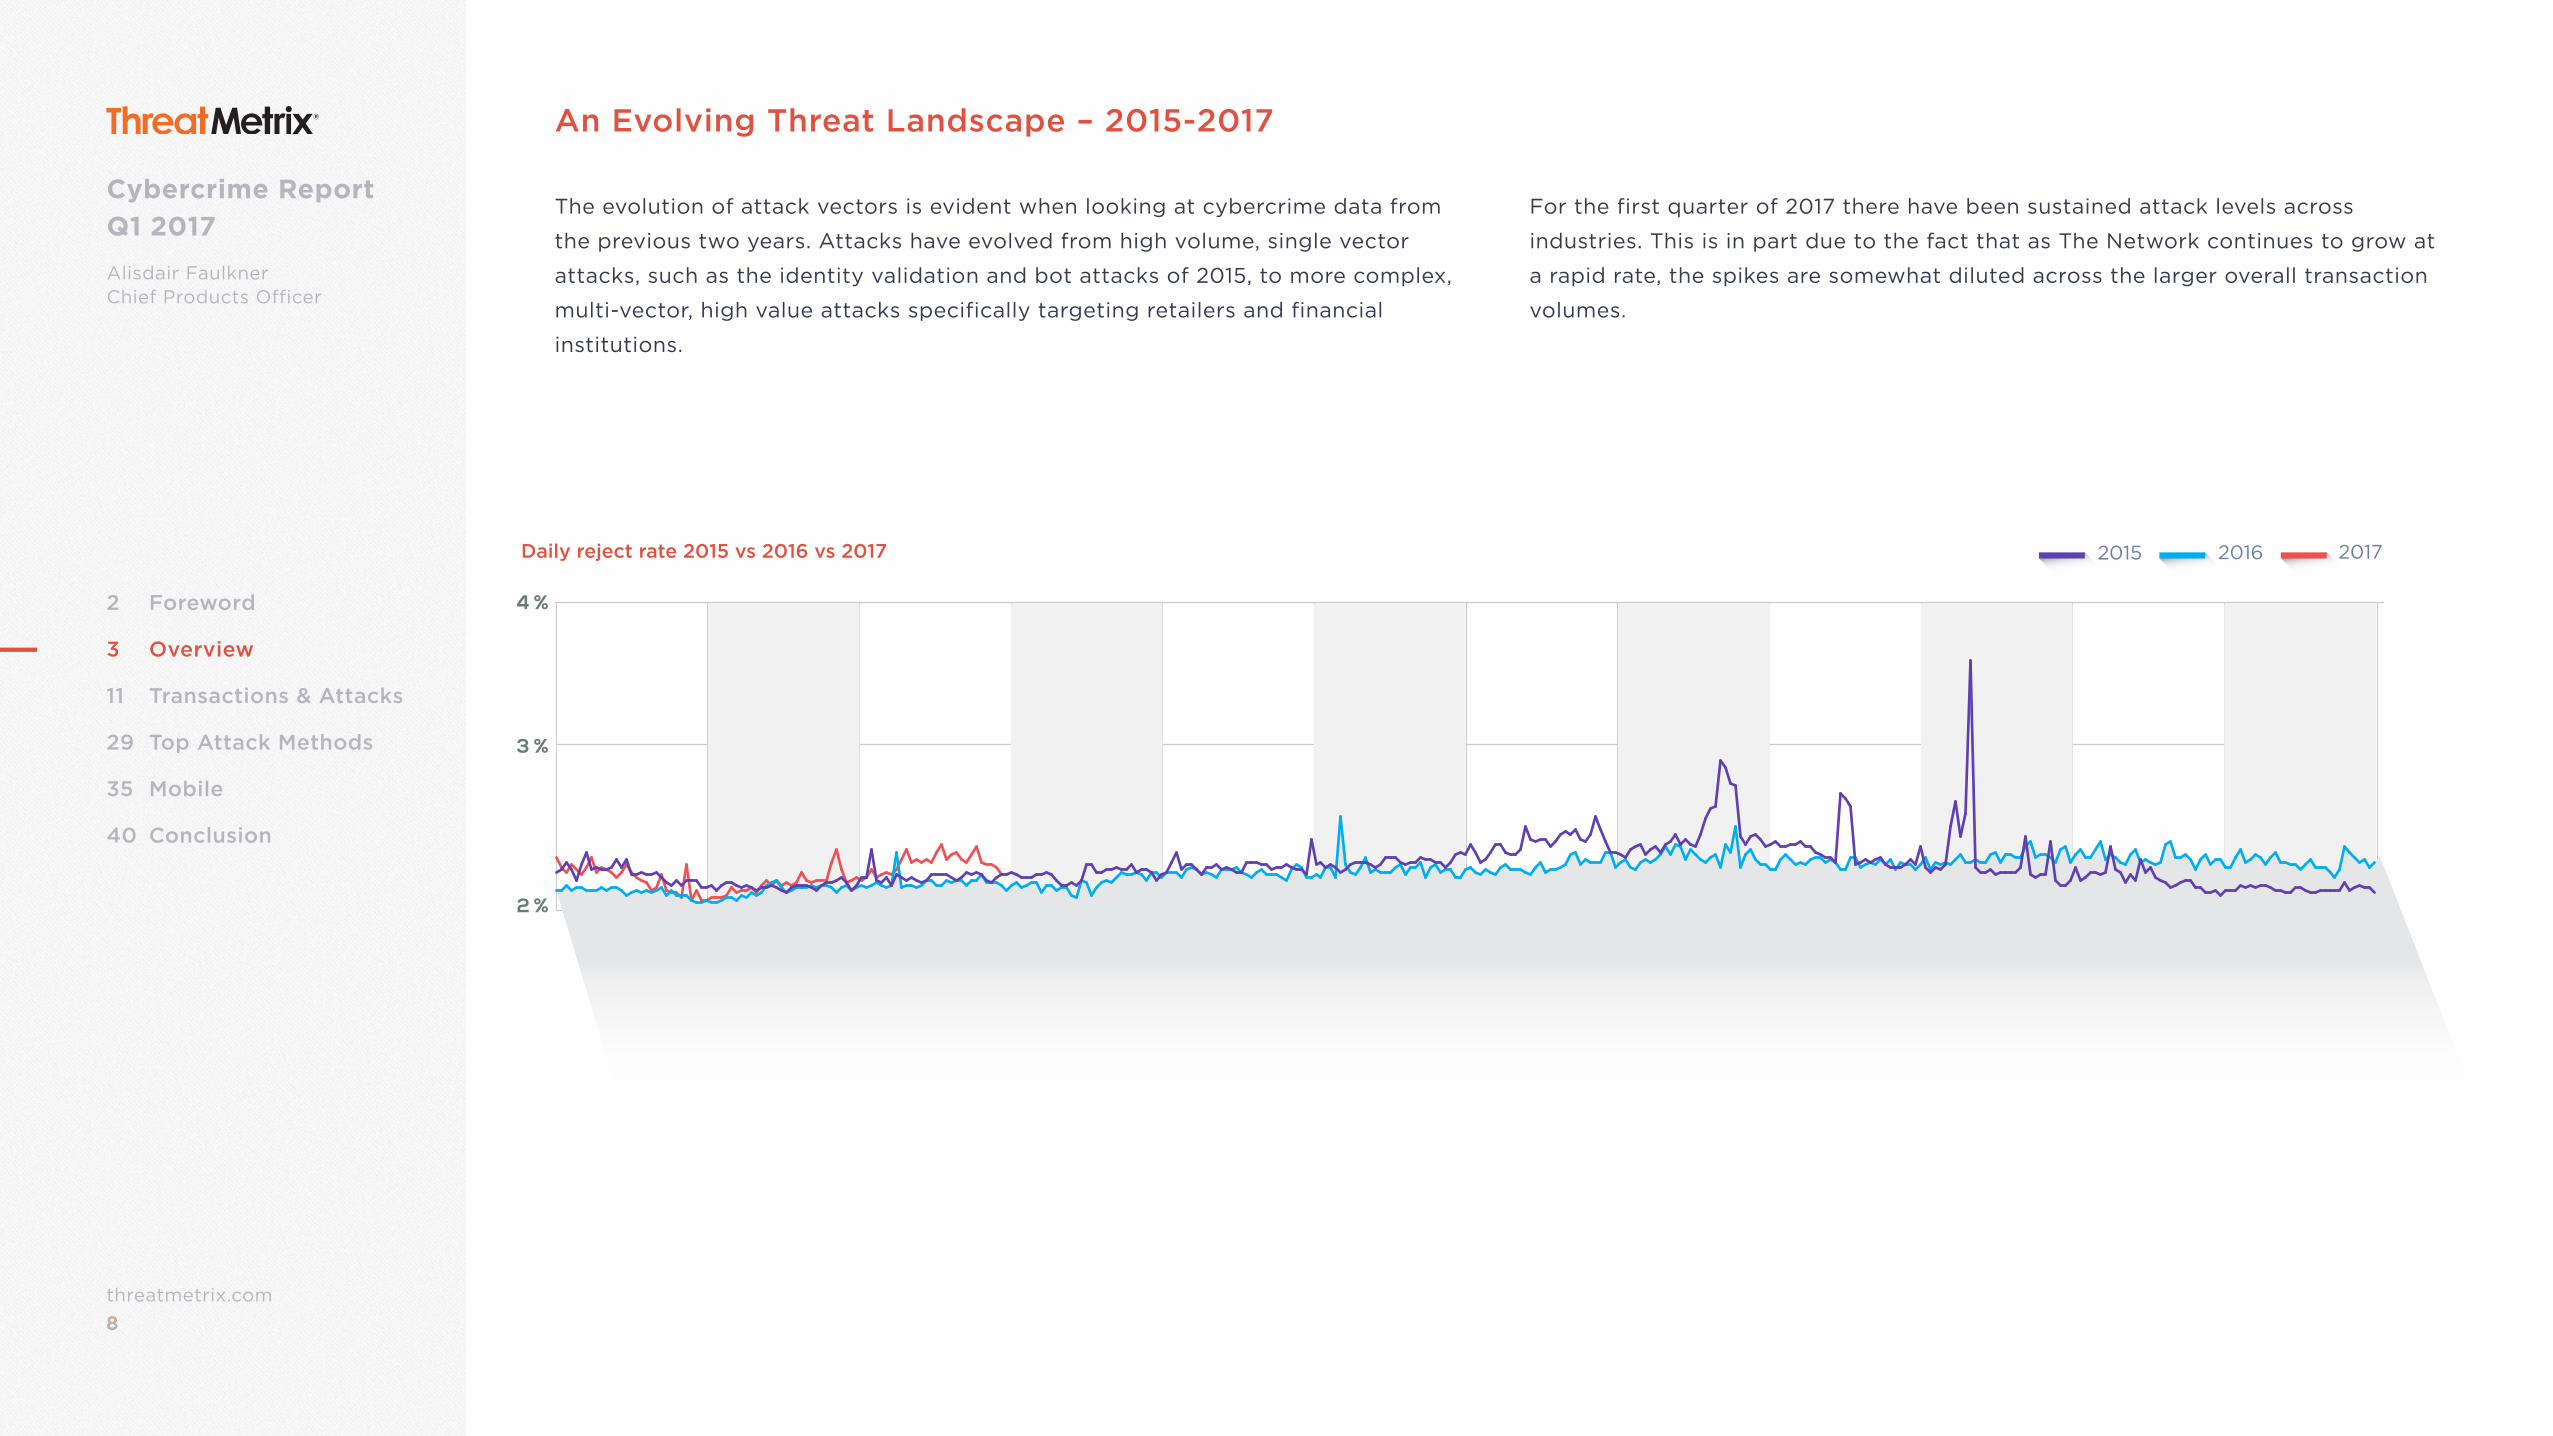
For the first quarter of 2017 there have been sustained attack levels across
industries. This is in part due to the fact that as The Network continues to grow at
a rapid rate, the spikes are somewhat diluted across the larger overall transaction
volumes.
The evolution of attack vectors is evident when looking at cybercrime data from
the previous two years. Attacks have evolved from high volume, single vector
attacks, such as the identity validation and bot attacks of 2015, to more complex,
multi-vector, high value attacks specifically targeting retailers and financial
institutions.
An Evolving Threat Landscape – 2015-2017
JAN FEB MAR APR MAY JUN JUL AUG SEP OCT NOV DEC
2 %
3 %
4 %
Daily reject rate 2015 vs 2016 vs 2017
9threatmetrix.com9
Cybercrime Report Q1 2017
Alisdair FaulknerChief Products Officer
2 Foreword
3 Overview
11 Transactions & Attacks
29 Top Attack Methods
35 Mobile
40 Conclusion
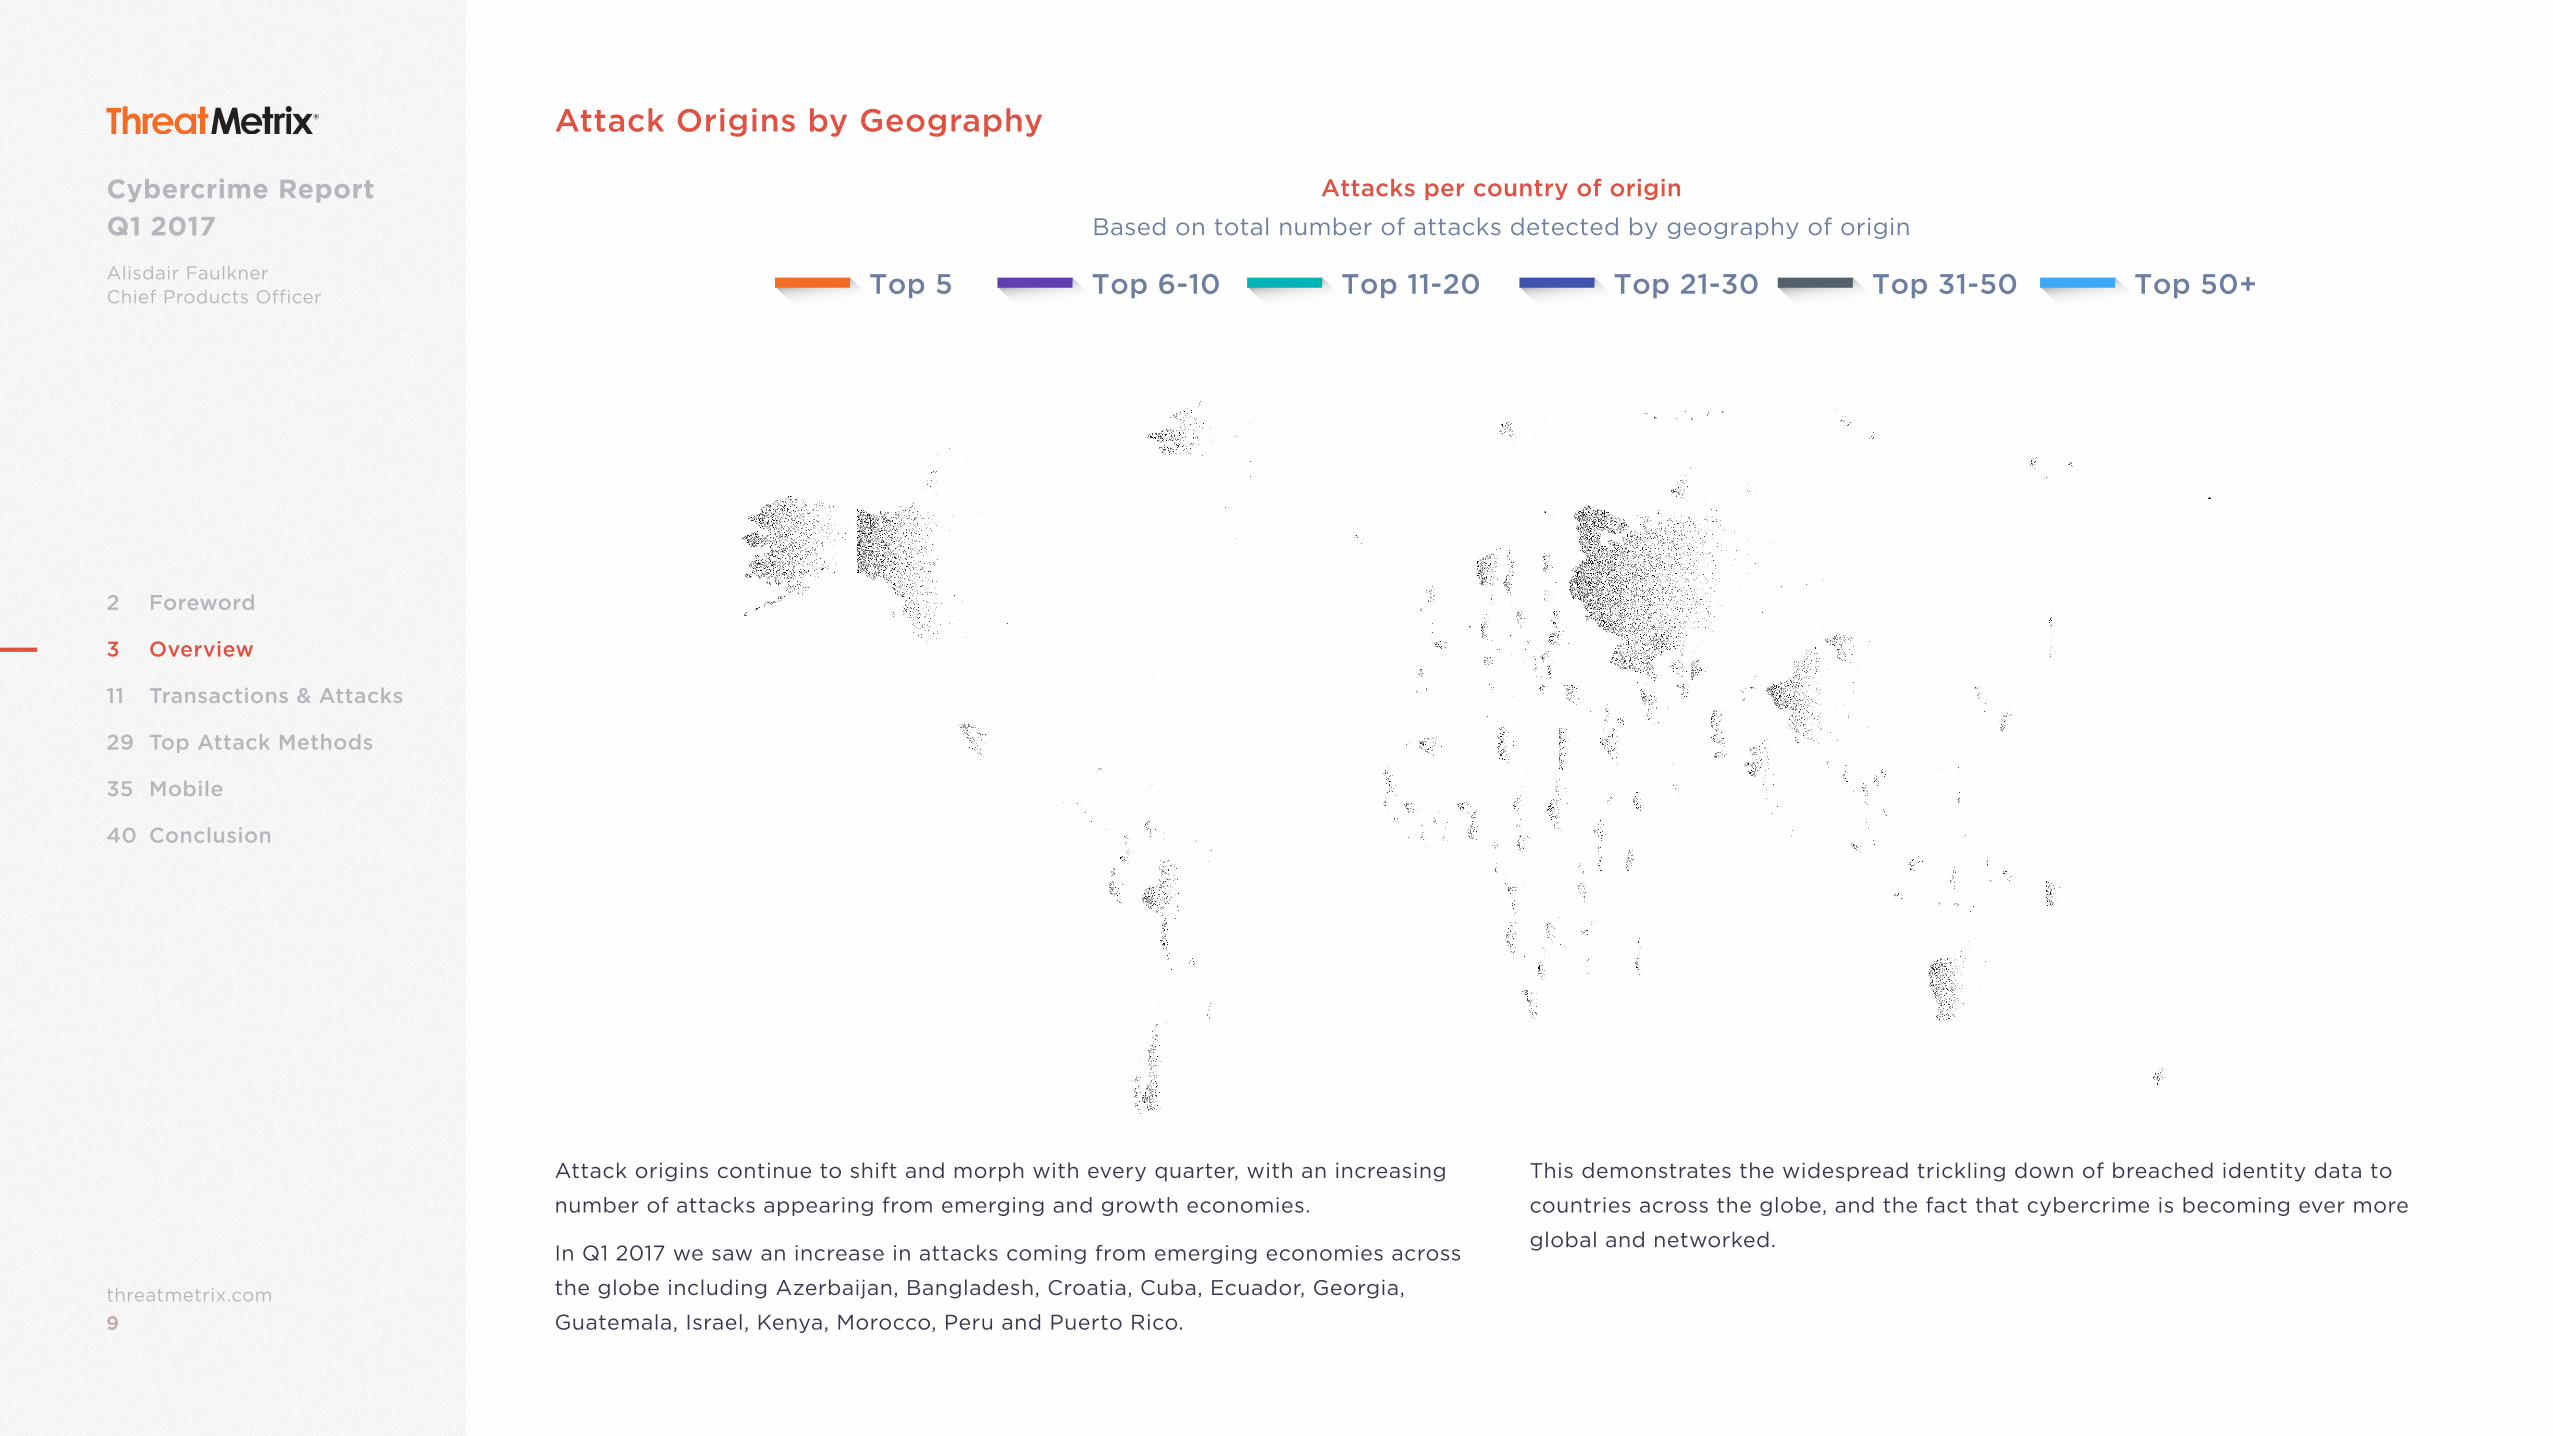
Attack Origins by Geography
This demonstrates the widespread trickling down of breached identity data to
countries across the globe, and the fact that cybercrime is becoming ever more
global and networked.
Attack origins continue to shift and morph with every quarter, with an increasing
number of attacks appearing from emerging and growth economies.
In Q1 2017 we saw an increase in attacks coming from emerging economies across
the globe including Azerbaijan, Bangladesh, Croatia, Cuba, Ecuador, Georgia,
Guatemala, Israel, Kenya, Morocco, Peru and Puerto Rico.
Attacks per country of origin
Based on total number of attacks detected by geography of origin
Top 5 Top 6-10 Top 11-20 Top 21-30 Top 31-50 Top 50+
10threatmetrix.com10
Cybercrime Report Q1 2017
Alisdair FaulknerChief Products Officer
2 Foreword
3 Overview
11 Transactions & Attacks
29 Top Attack Methods
35 Mobile
40 Conclusion
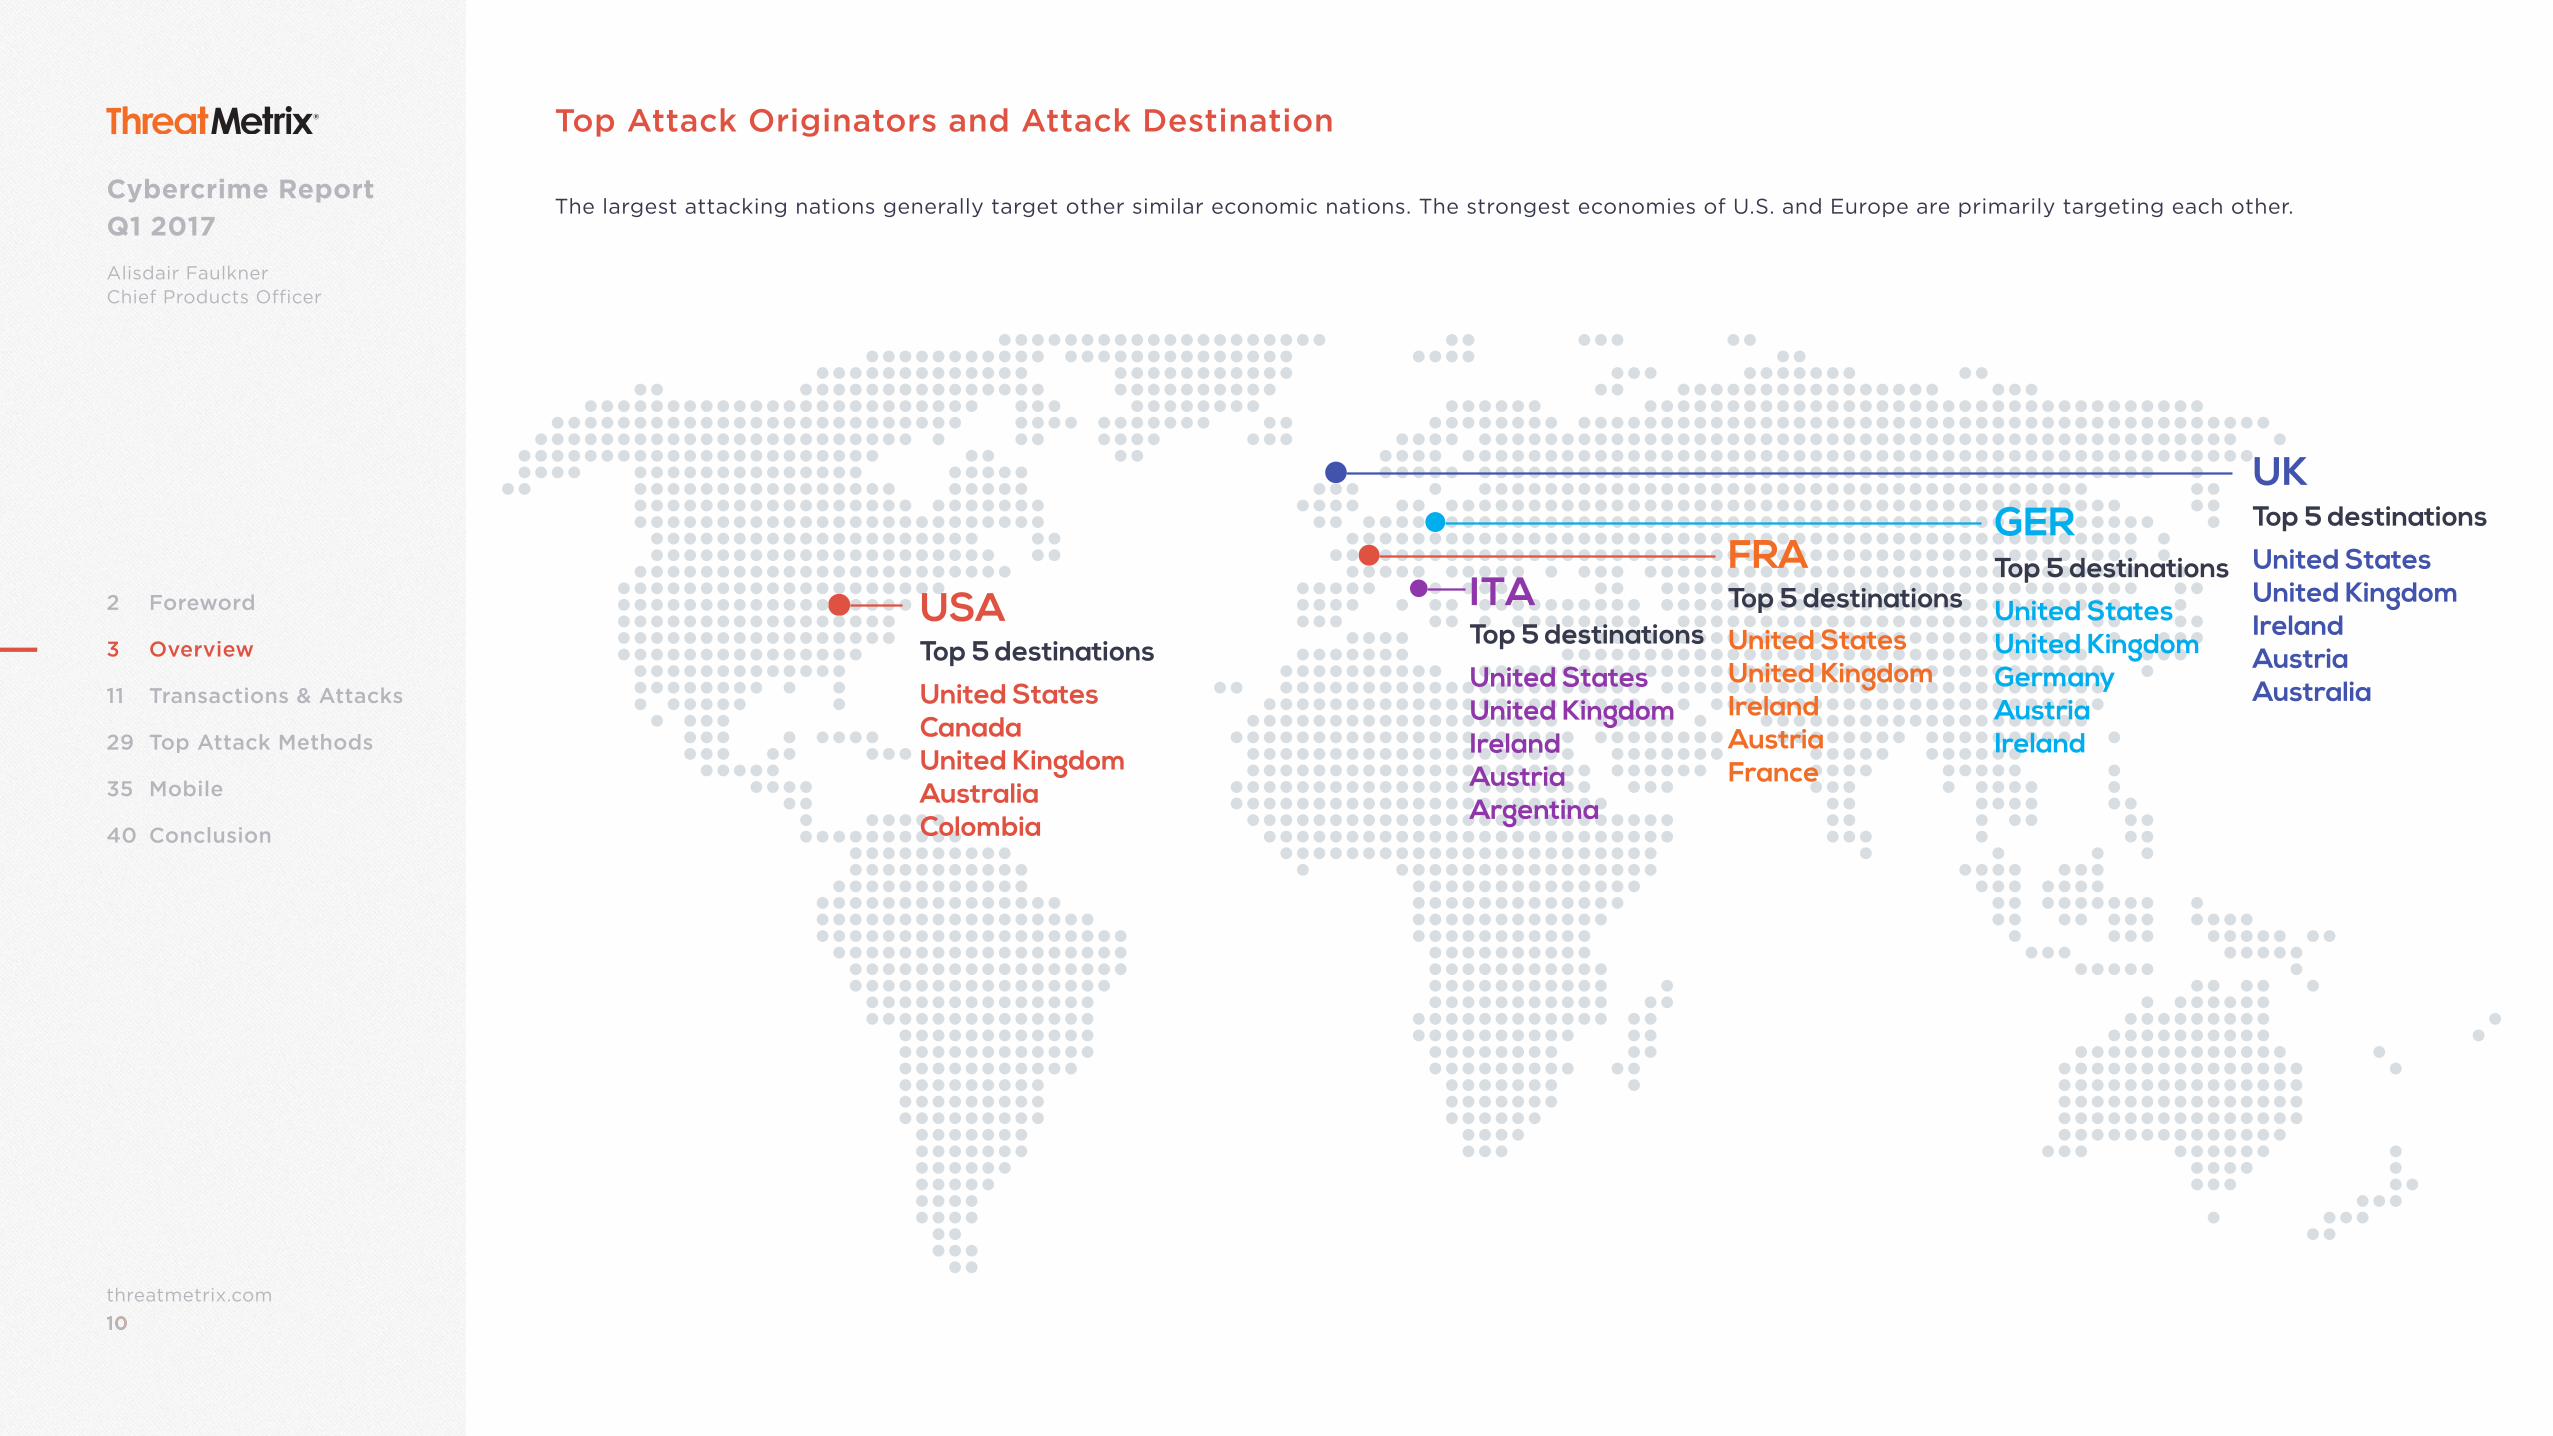
Top Attack Originators and Attack Destination
The largest attacking nations generally target other similar economic nations. The strongest economies of U.S. and Europe are primarily targeting each other.
USATop 5 destinations
United StatesCanadaUnited KingdomAustraliaColombia
UKTop 5 destinations
United StatesUnited KingdomIrelandAustriaAustralia
ITATop 5 destinations
United StatesUnited KingdomIrelandAustriaArgentina
GERTop 5 destinations
United StatesUnited KingdomGermanyAustriaIreland
FRATop 5 destinationsUnited StatesUnited KingdomIrelandAustriaFrance
11threatmetrix.com11
Cybercrime Report Q1 2017Alisdair FaulknerChief Products Officer
2 Foreword
3 Overview
11 Transactions & Attacks
29 Top Attack Methods
35 Mobile
40 Conclusion
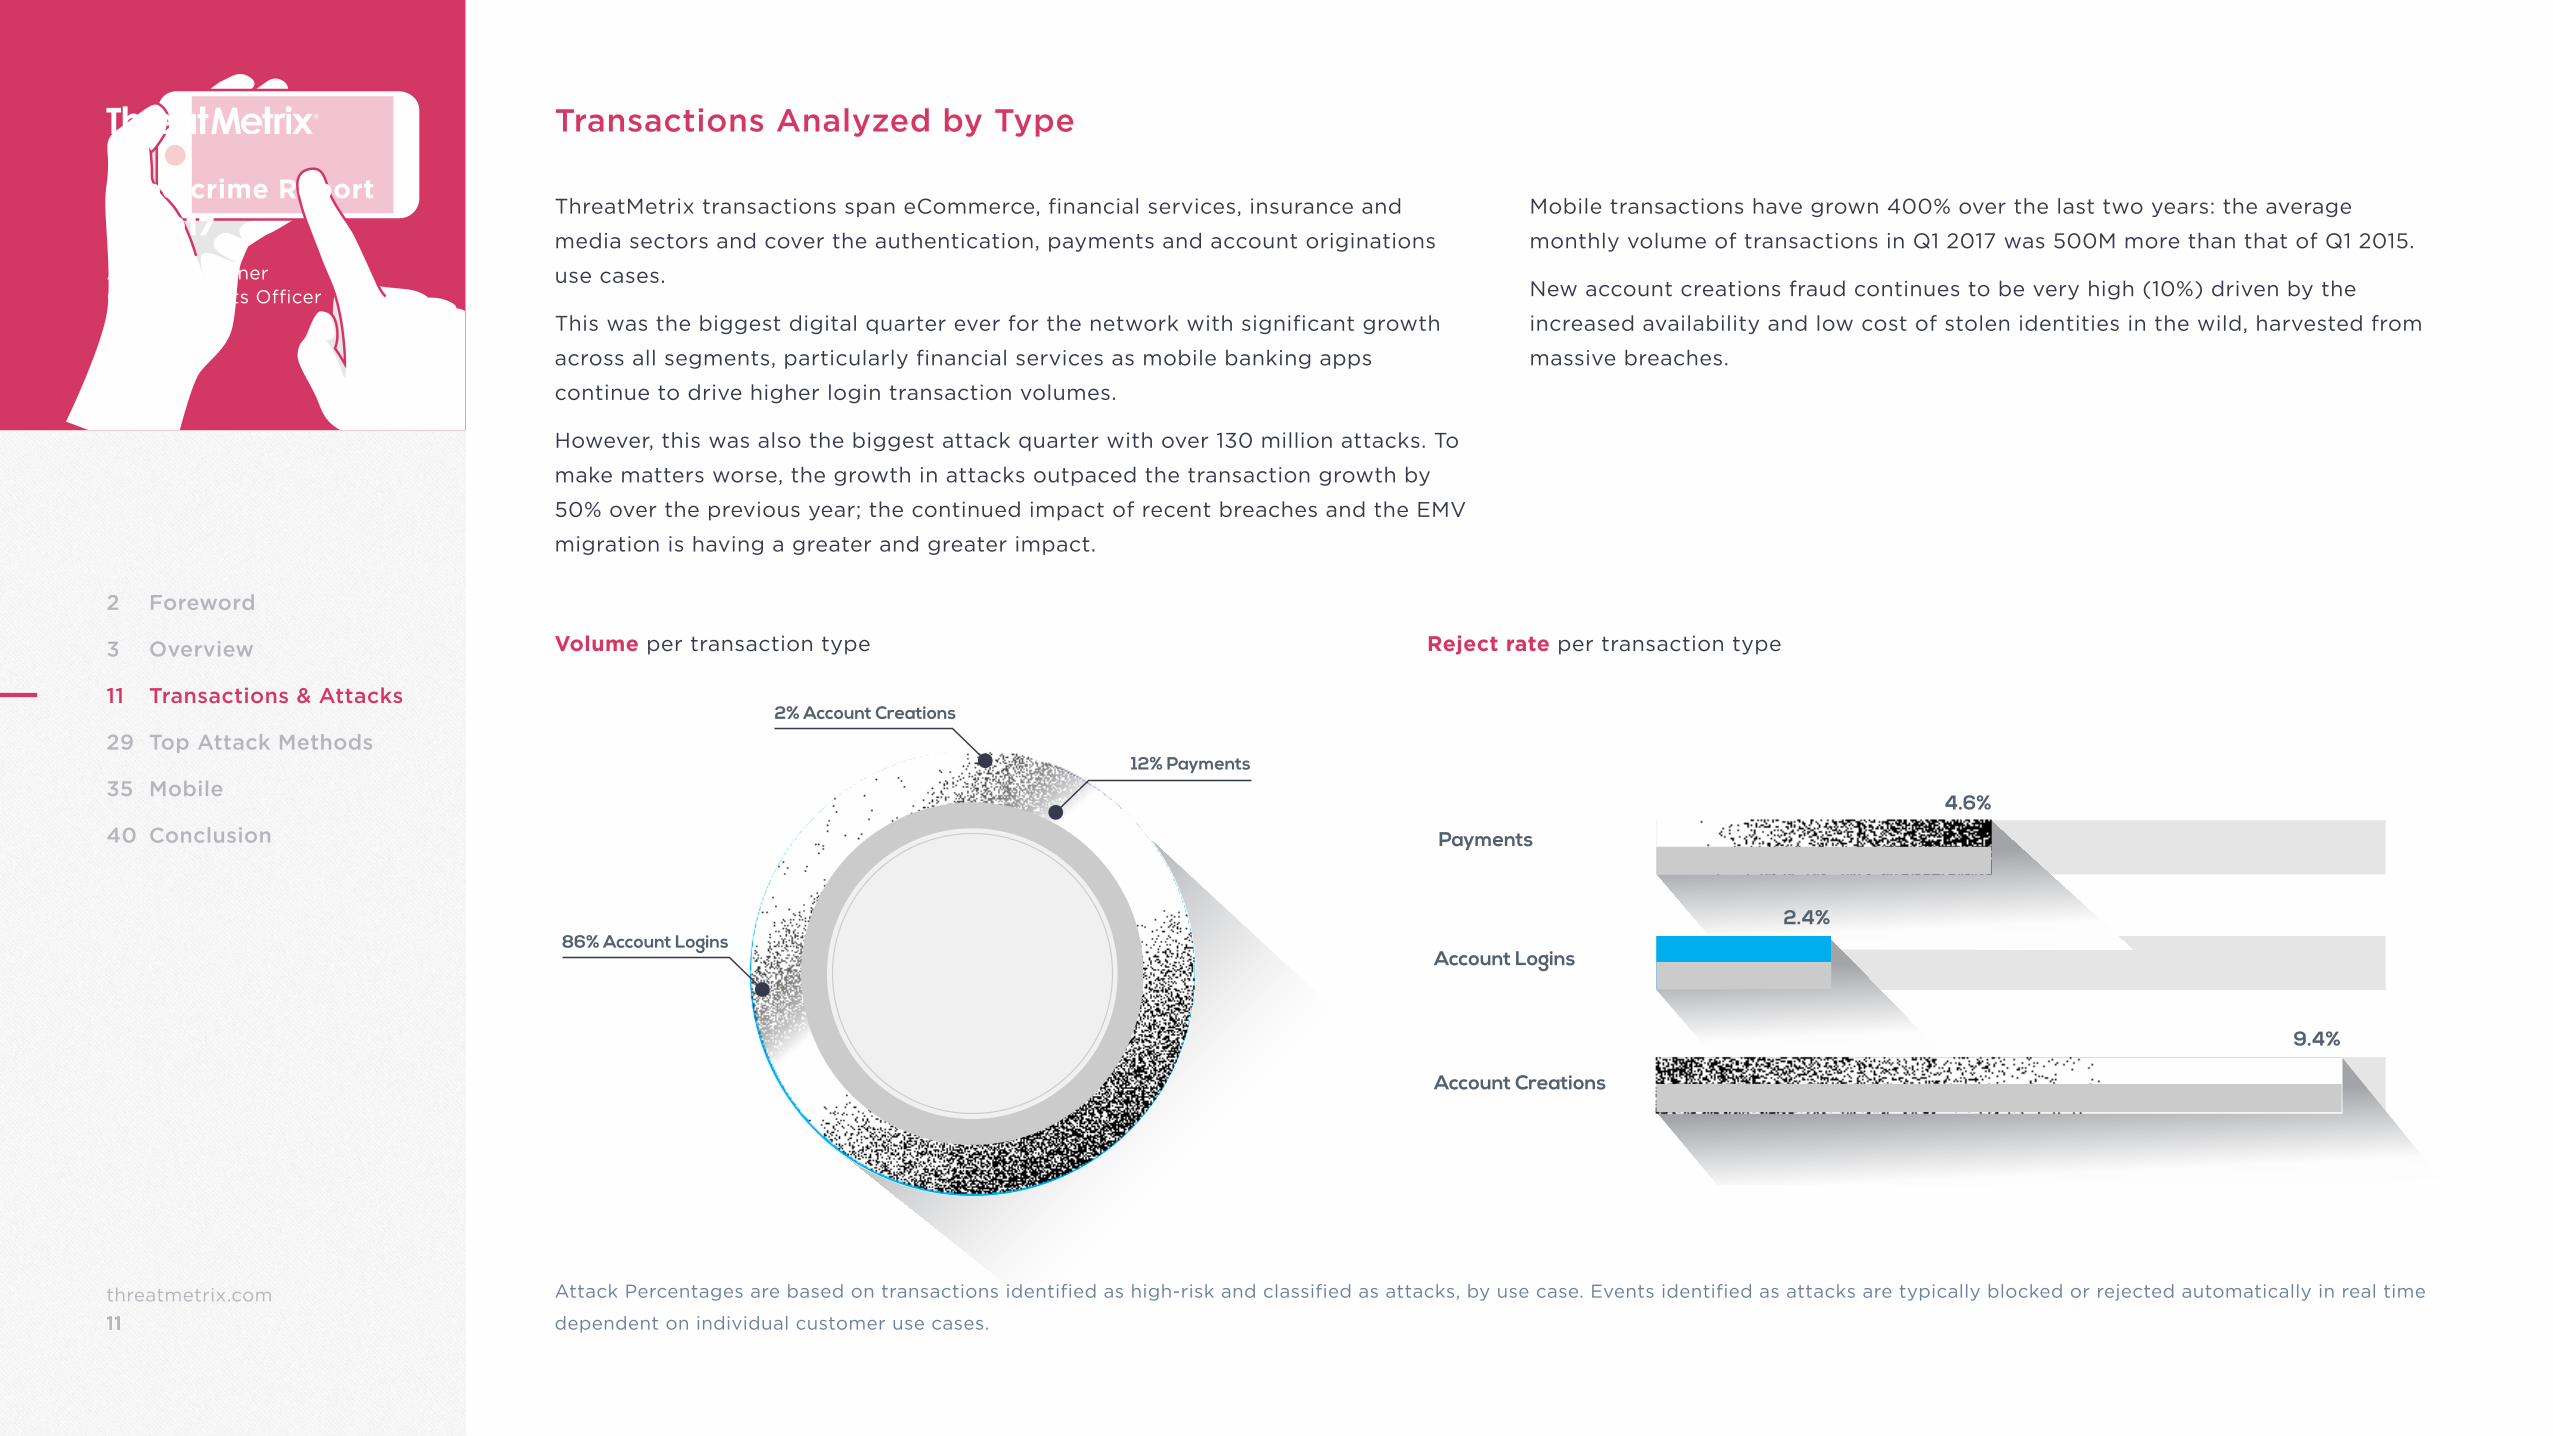
Transactions Analyzed by Type
Mobile transactions have grown 400% over the last two years: the average
monthly volume of transactions in Q1 2017 was 500M more than that of Q1 2015.
New account creations fraud continues to be very high (10%) driven by the
increased availability and low cost of stolen identities in the wild, harvested from
massive breaches.
ThreatMetrix transactions span eCommerce, financial services, insurance and
media sectors and cover the authentication, payments and account originations
use cases.
This was the biggest digital quarter ever for the network with significant growth
across all segments, particularly financial services as mobile banking apps
continue to drive higher login transaction volumes.
However, this was also the biggest attack quarter with over 130 million attacks. To
make matters worse, the growth in attacks outpaced the transaction growth by
50% over the previous year; the continued impact of recent breaches and the EMV
migration is having a greater and greater impact.
Volume per transaction type Reject rate per transaction type
Payments
Account Logins
Account Creations
4.6%
2.4%
9.4%
2% Account Creations
12% Payments
86% Account Logins
Attack Percentages are based on transactions identified as high-risk and classified as attacks, by use case. Events identified as attacks are typically blocked or rejected automatically in real time
dependent on individual customer use cases.
12threatmetrix.com12
Cybercrime Report Q1 2017
Alisdair FaulknerChief Products Officer
2 Foreword
3 Overview
11 Transactions & Attacks
29 Top Attack Methods
35 Mobile
40 Conclusion
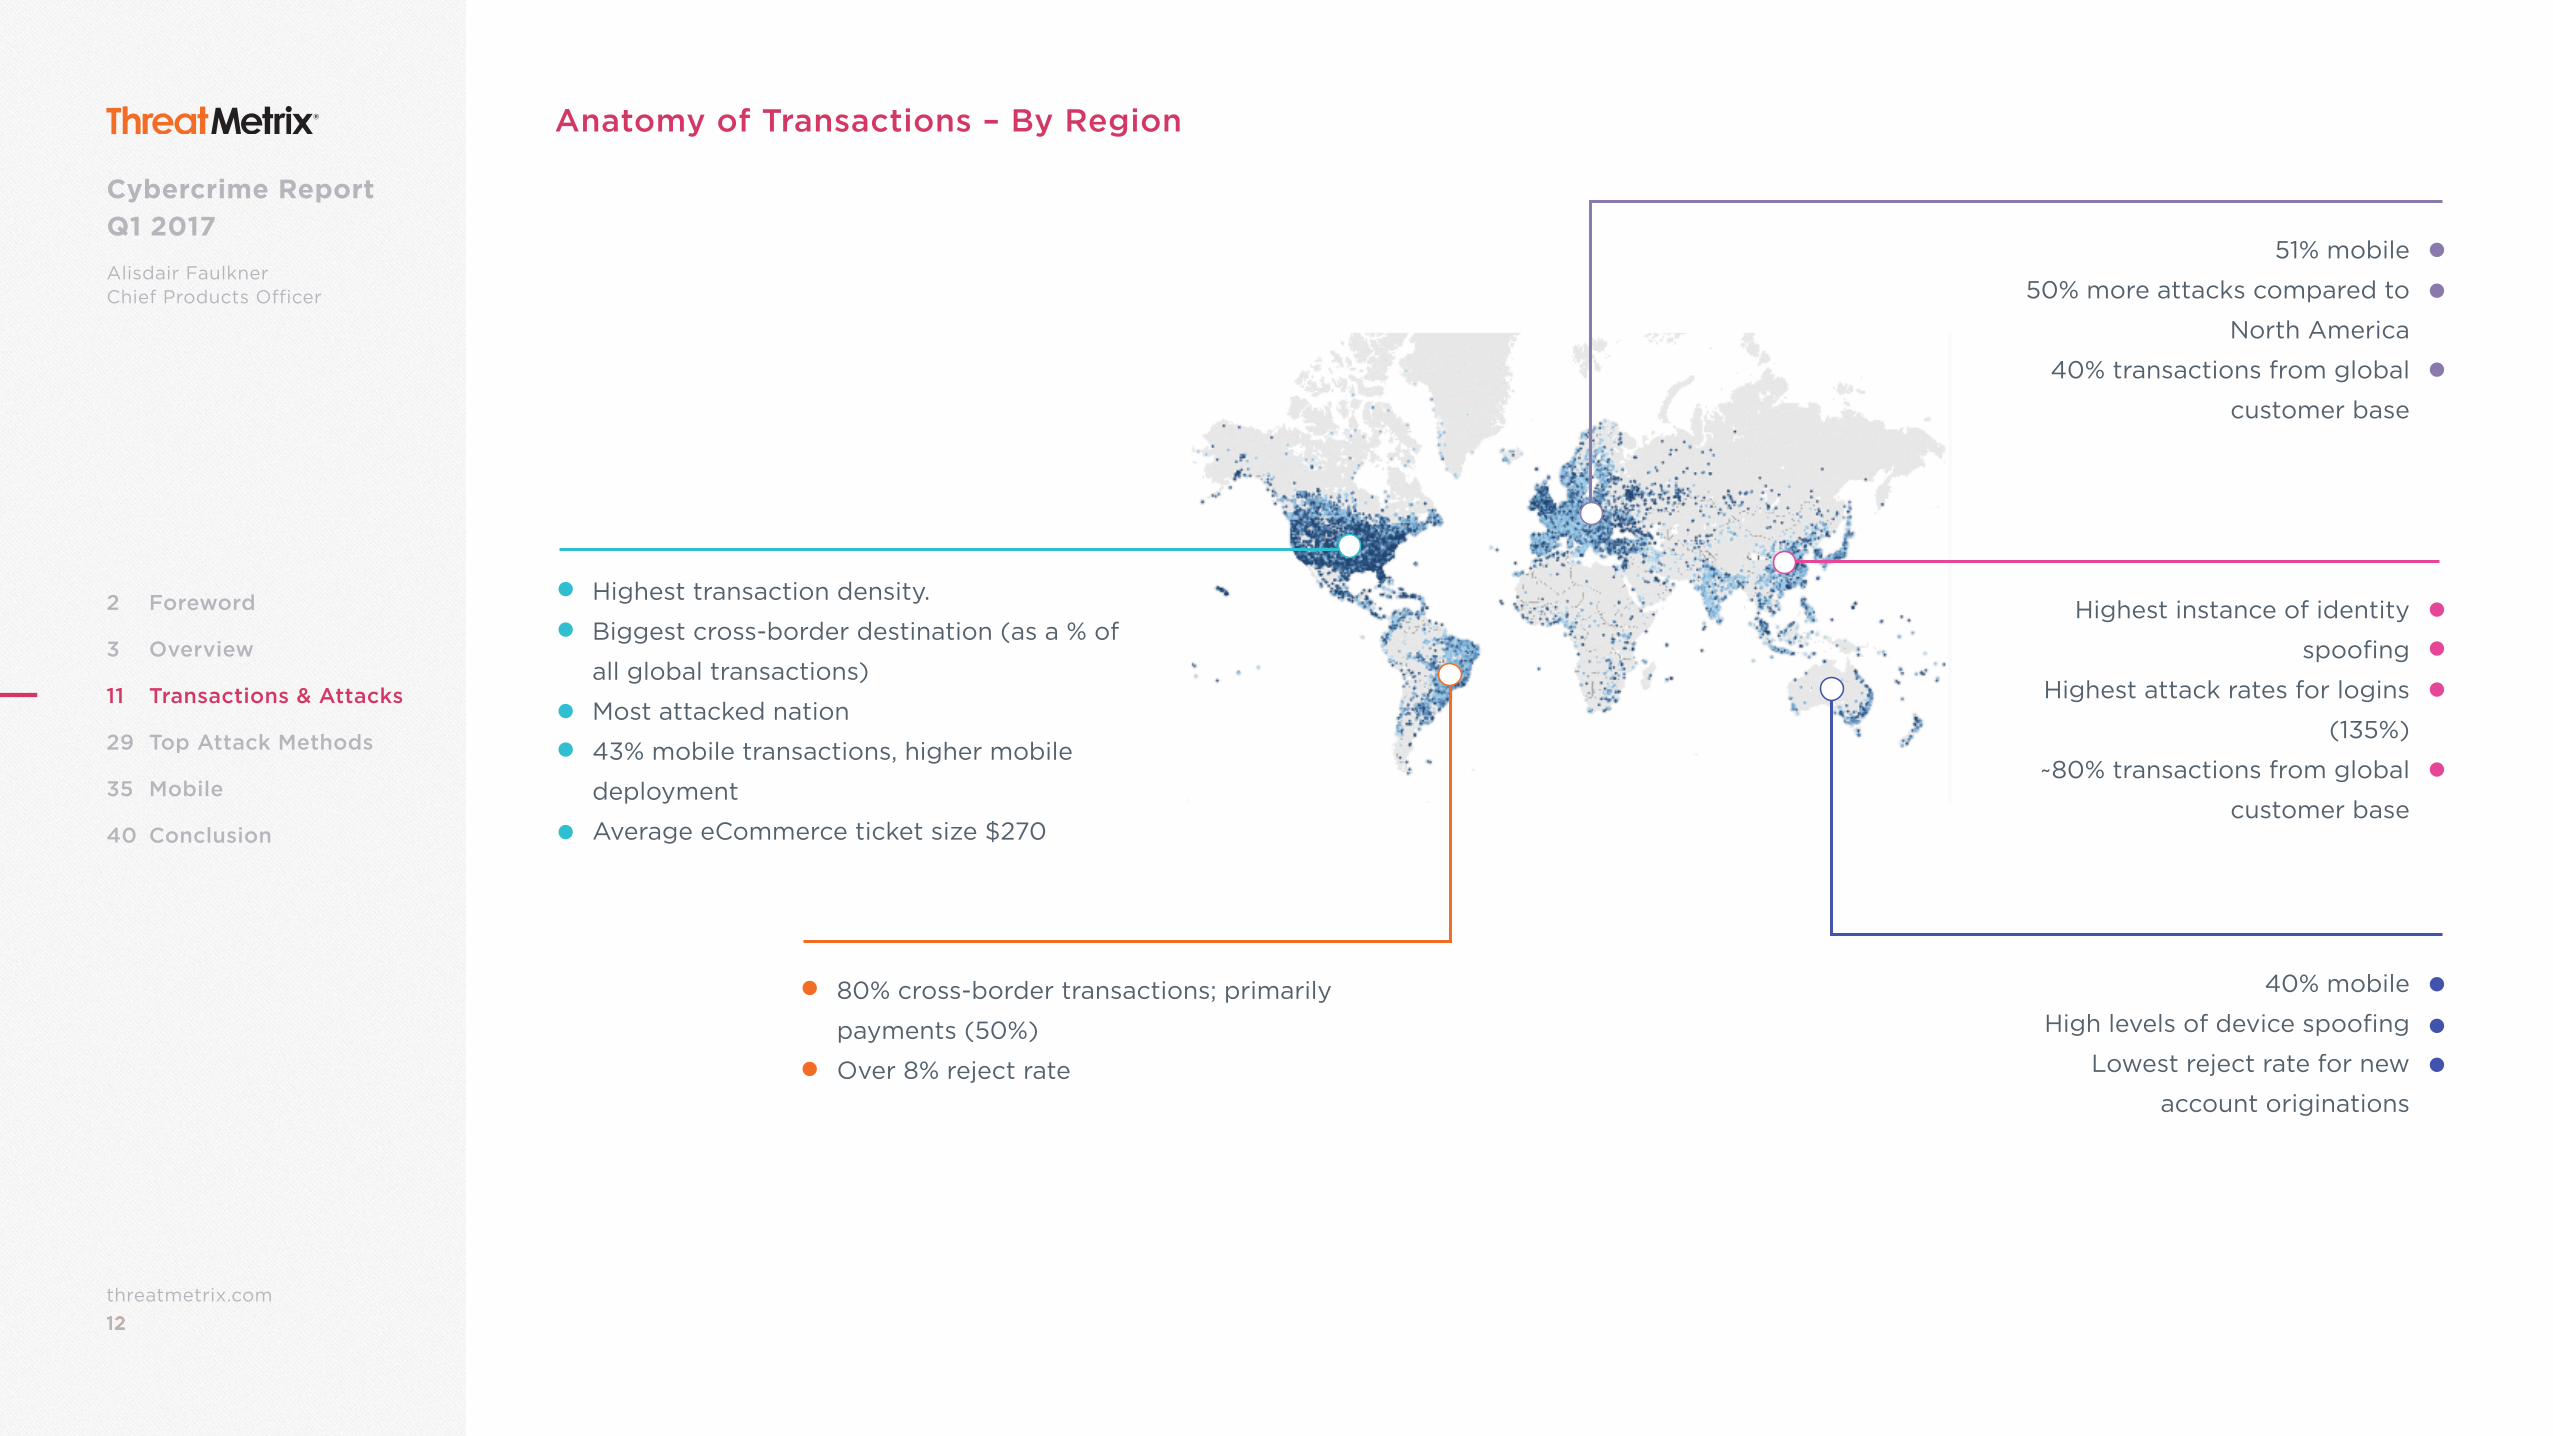
80% cross-border transactions; primarily
payments (50%)
Over 8% reject rate
Highest transaction density.
Biggest cross-border destination (as a % of
all global transactions)
Most attacked nation
43% mobile transactions, higher mobile
deployment
Average eCommerce ticket size $270
51% mobile
50% more attacks compared to
North America
40% transactions from global
customer base
40% mobile
High levels of device spoofing
Lowest reject rate for new
account originations
Highest instance of identity
spoofing
Highest attack rates for logins
(135%)
~80% transactions from global
customer base
Anatomy of Transactions – By Region
13threatmetrix.com13
Cybercrime Report Q1 2017
Alisdair FaulknerChief Products Officer
2 Foreword
3 Overview
11 Transactions & Attacks
29 Top Attack Methods
35 Mobile
40 Conclusion
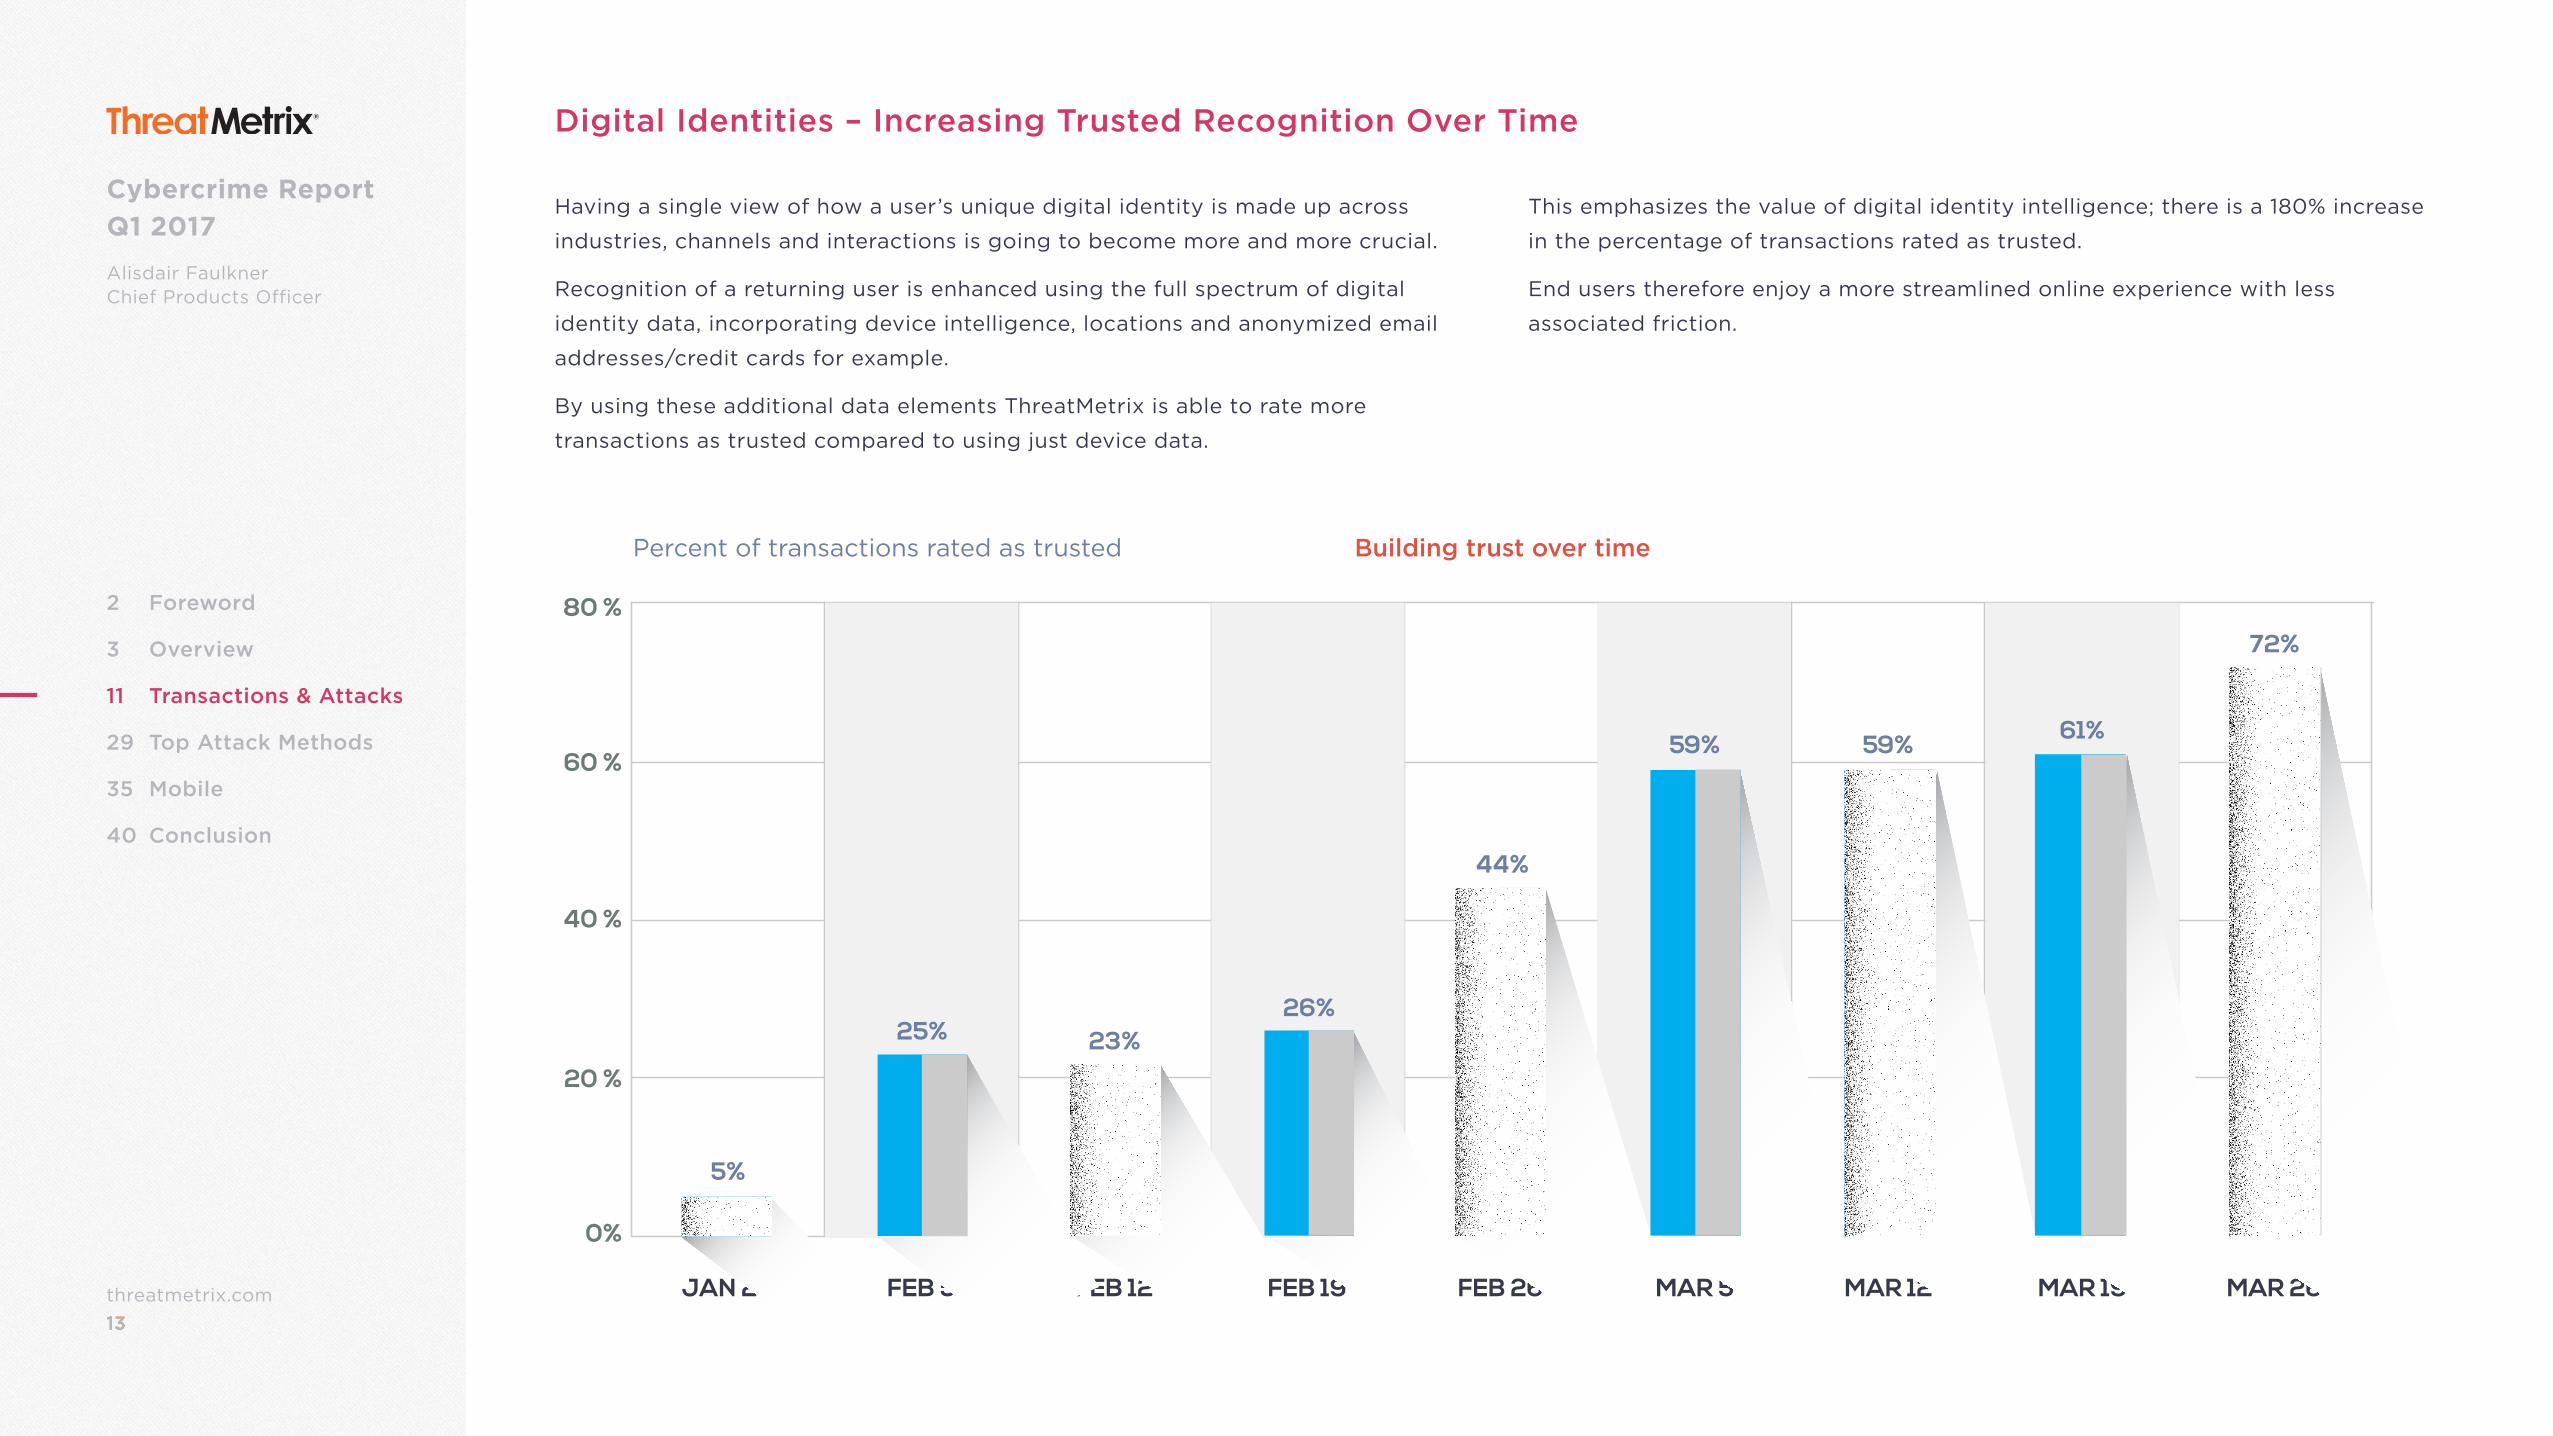
Digital Identities – Increasing Trusted Recognition Over Time
This emphasizes the value of digital identity intelligence; there is a 180% increase
in the percentage of transactions rated as trusted.
End users therefore enjoy a more streamlined online experience with less
associated friction.
Having a single view of how a user’s unique digital identity is made up across
industries, channels and interactions is going to become more and more crucial.
Recognition of a returning user is enhanced using the full spectrum of digital
identity data, incorporating device intelligence, locations and anonymized email
addresses/credit cards for example.
By using these additional data elements ThreatMetrix is able to rate more
transactions as trusted compared to using just device data.
JAN 29 FEB 5 FEB 12 FEB 19 FEB 26 MAR 5 MAR 12 MAR 19 MAR 26
0%
20 %
80 %
40 %
60 %
5%
25% 23%26%
44%
59% 59% 61%
72%
Percent of transactions rated as trusted Building trust over time
14threatmetrix.com14
Cybercrime Report Q1 2017
Alisdair FaulknerChief Products Officer
2 Foreword
3 Overview
11 Transactions & Attacks
29 Top Attack Methods
35 Mobile
40 Conclusion
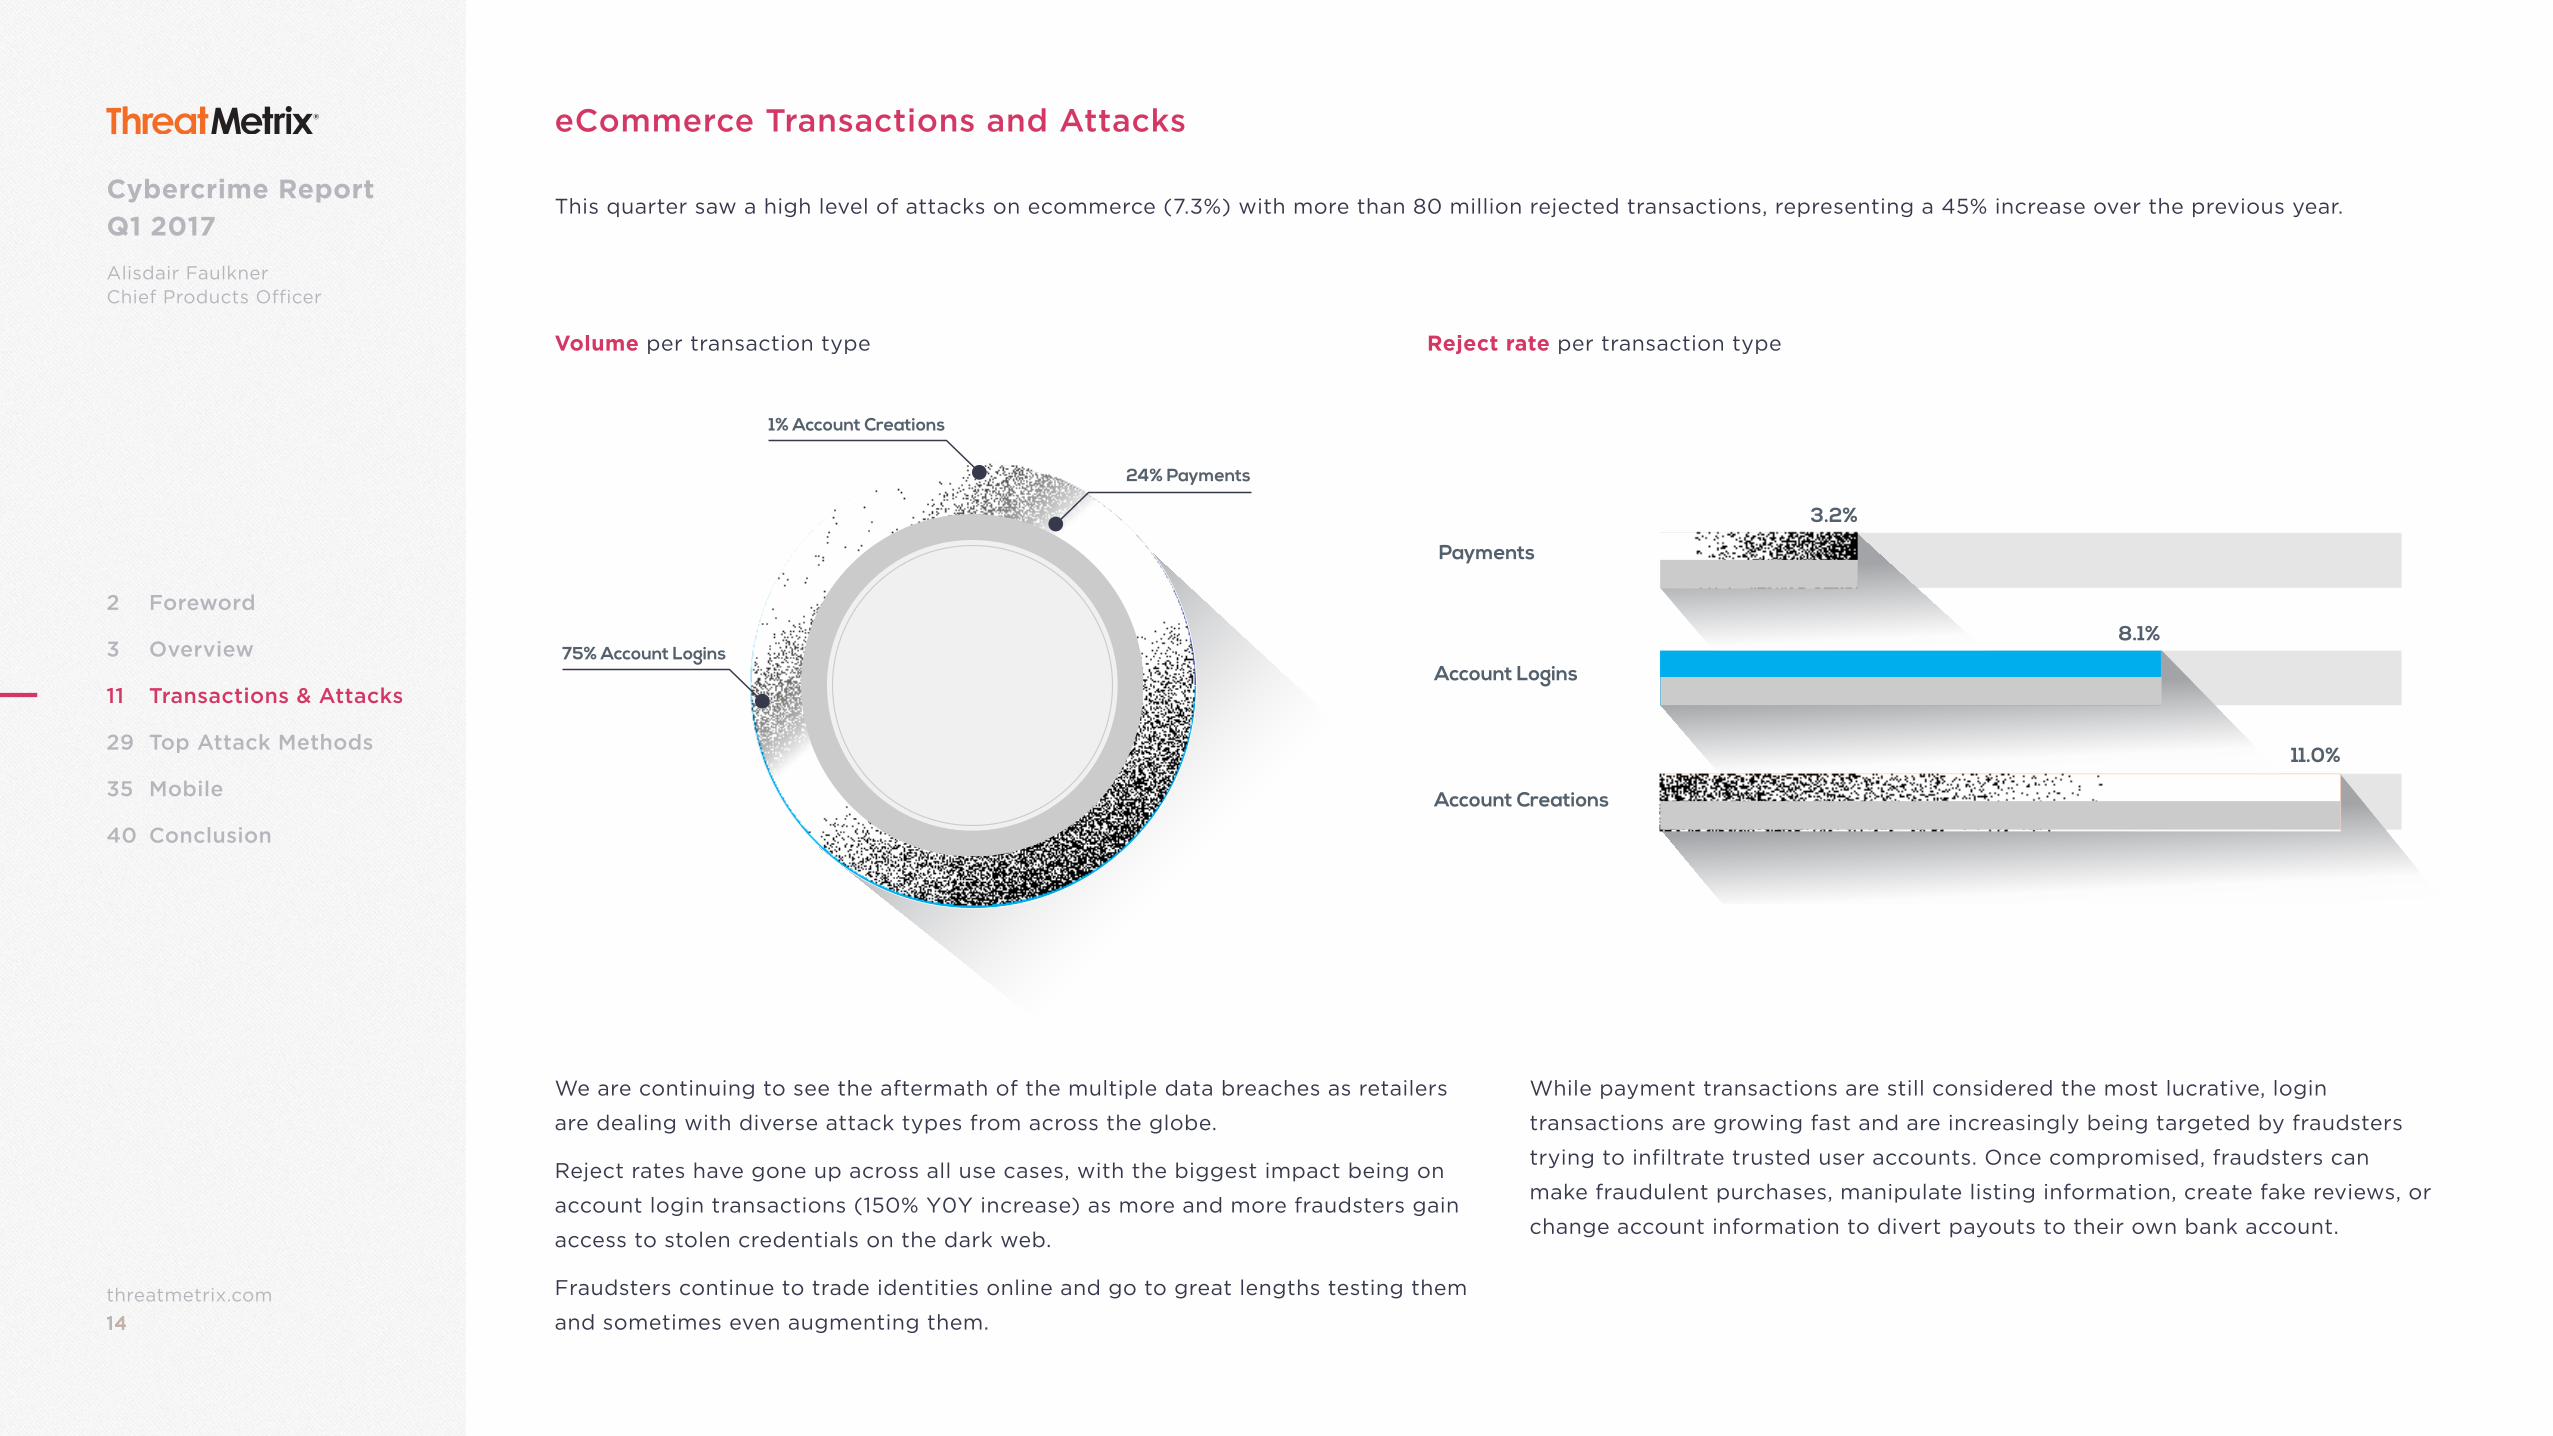
eCommerce Transactions and Attacks
While payment transactions are still considered the most lucrative, login
transactions are growing fast and are increasingly being targeted by fraudsters
trying to infiltrate trusted user accounts. Once compromised, fraudsters can
make fraudulent purchases, manipulate listing information, create fake reviews, or
change account information to divert payouts to their own bank account.
We are continuing to see the aftermath of the multiple data breaches as retailers
are dealing with diverse attack types from across the globe.
Reject rates have gone up across all use cases, with the biggest impact being on
account login transactions (150% Y0Y increase) as more and more fraudsters gain
access to stolen credentials on the dark web.
Fraudsters continue to trade identities online and go to great lengths testing them
and sometimes even augmenting them.
This quarter saw a high level of attacks on ecommerce (7.3%) with more than 80 million rejected transactions, representing a 45% increase over the previous year.
Payments
Account Logins
Account Creations
3.2%
8.1%
11.0%
1% Account Creations
24% Payments
75% Account Logins
Volume per transaction type Reject rate per transaction type
15threatmetrix.com15
Cybercrime Report Q1 2017
Alisdair FaulknerChief Products Officer
2 Foreword
3 Overview
11 Transactions & Attacks
29 Top Attack Methods
35 Mobile
40 Conclusion
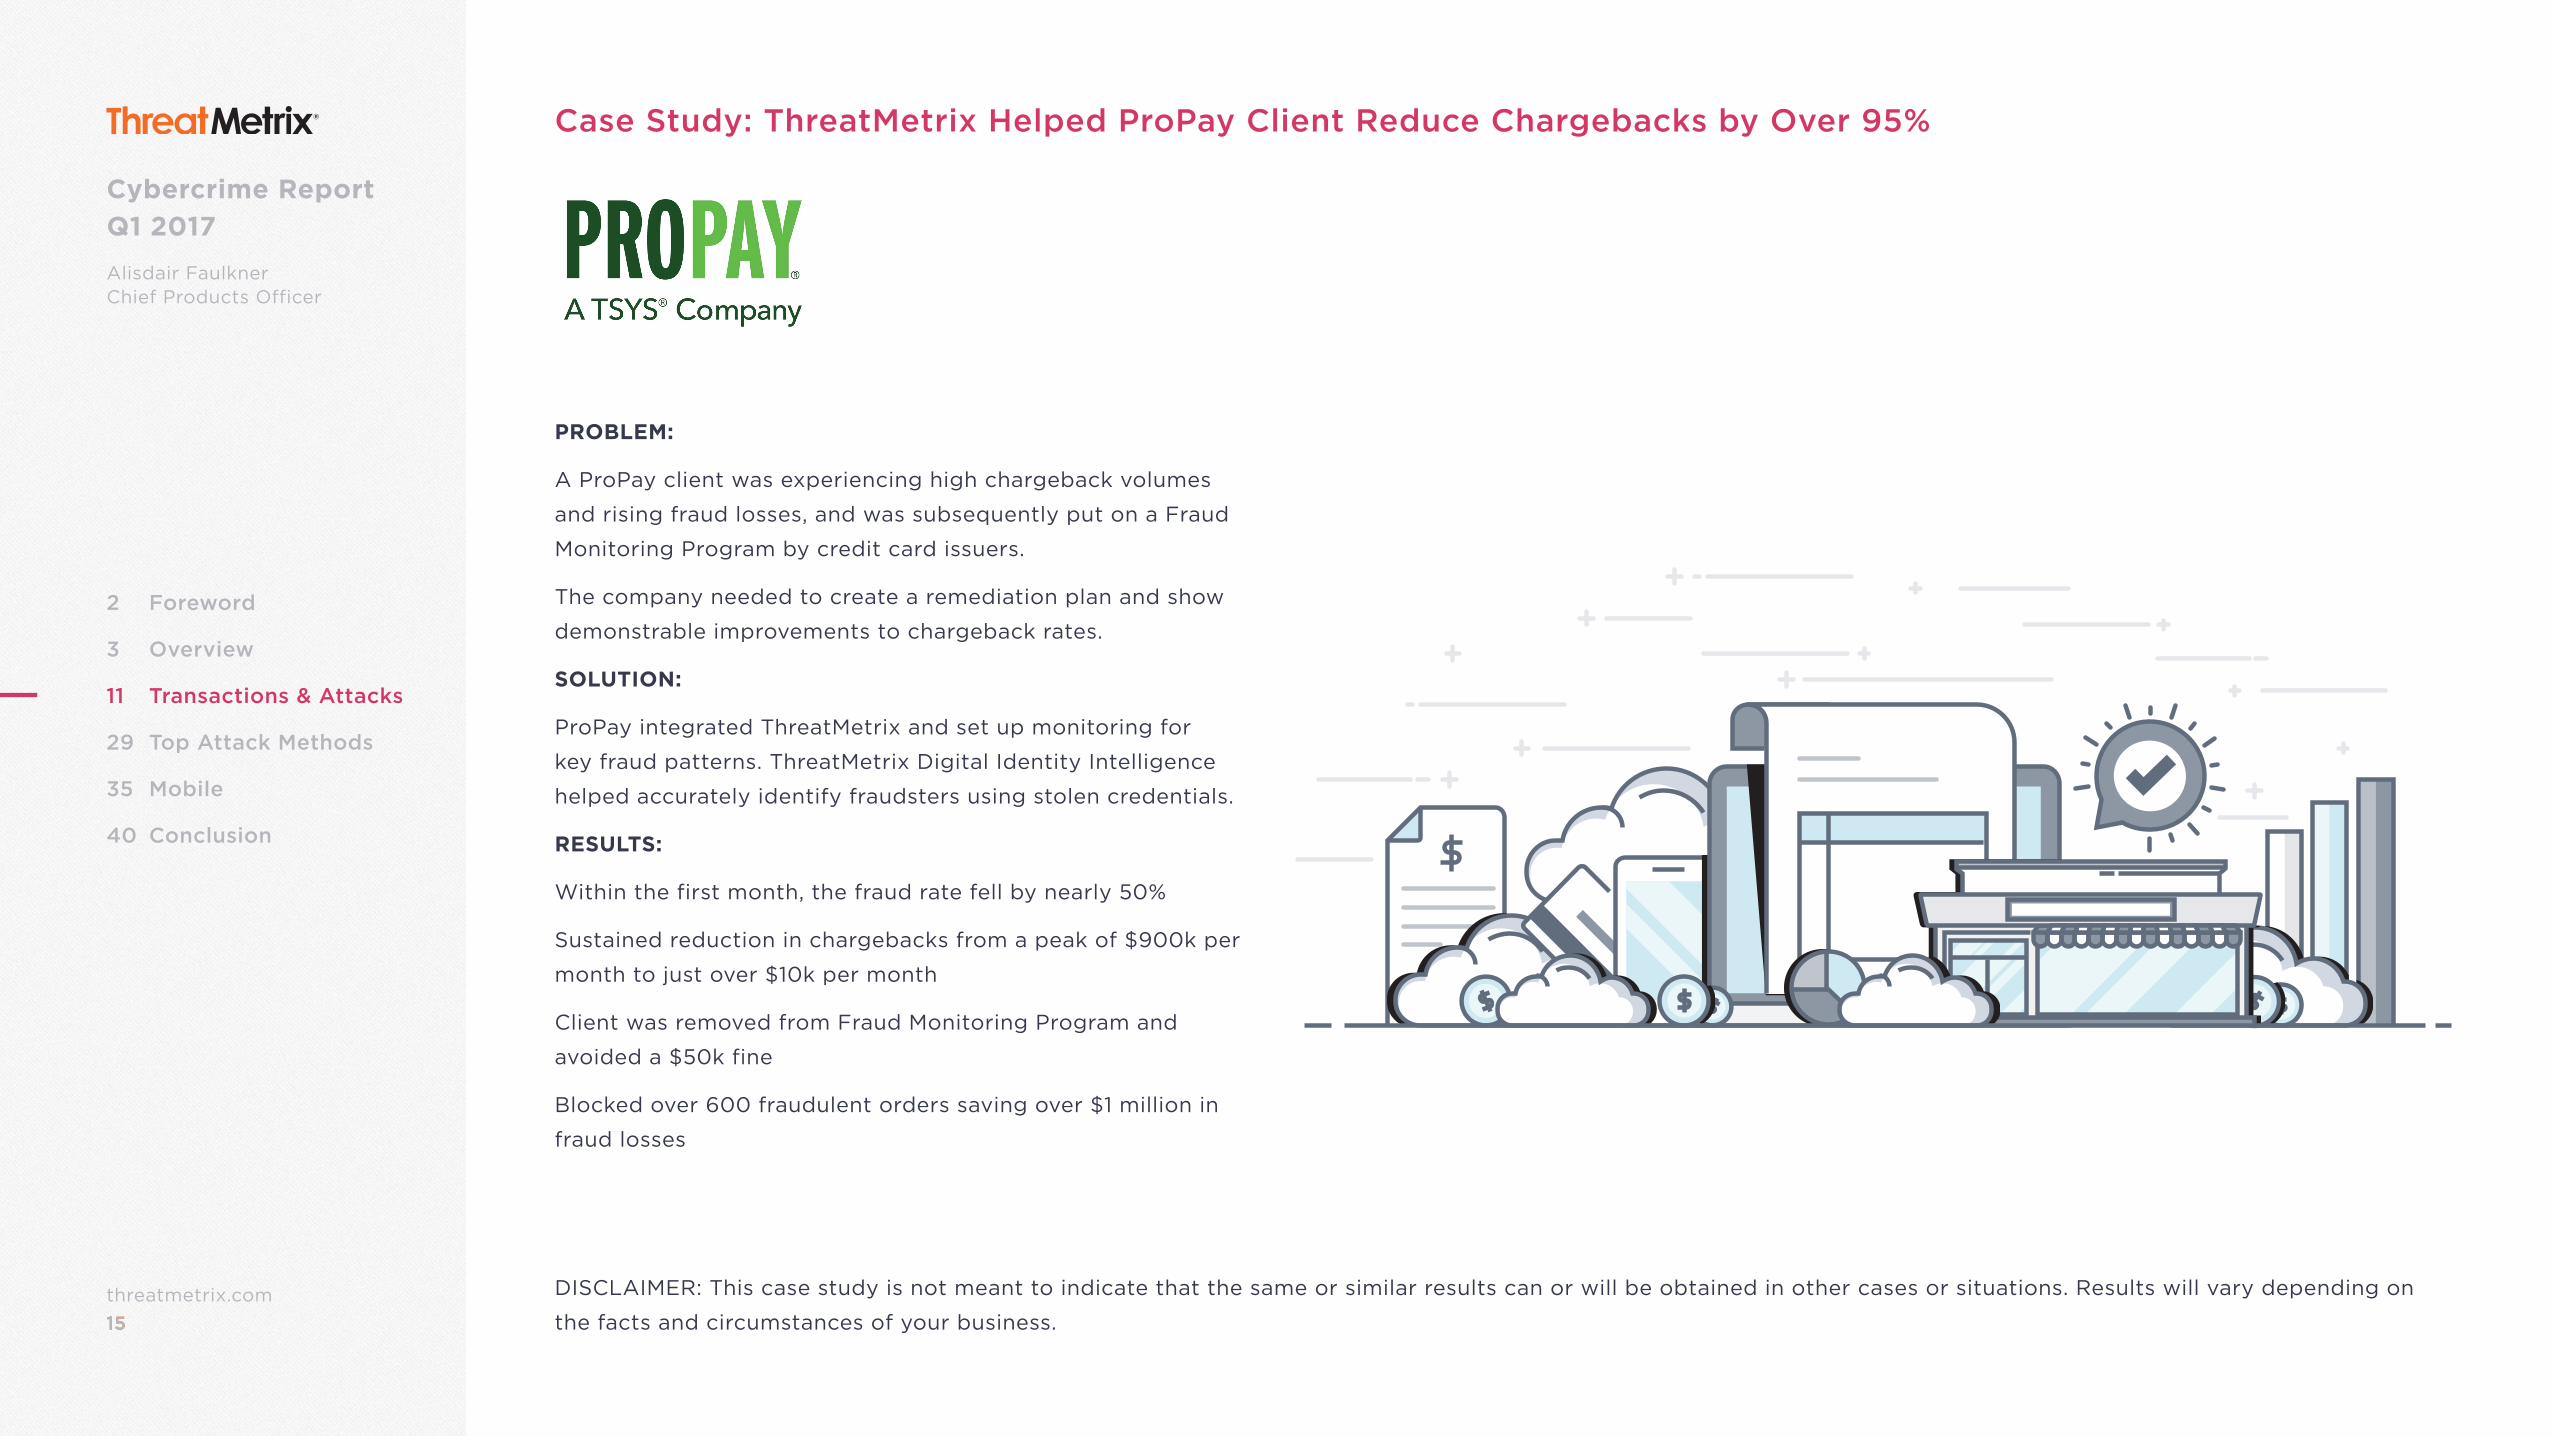
Case Study: ThreatMetrix Helped ProPay Client Reduce Chargebacks by Over 95%
PROBLEM:
A ProPay client was experiencing high chargeback volumes
and rising fraud losses, and was subsequently put on a Fraud
Monitoring Program by credit card issuers.
The company needed to create a remediation plan and show
demonstrable improvements to chargeback rates.
SOLUTION:
ProPay integrated ThreatMetrix and set up monitoring for
key fraud patterns. ThreatMetrix Digital Identity Intelligence
helped accurately identify fraudsters using stolen credentials.
RESULTS:
Within the first month, the fraud rate fell by nearly 50%
Sustained reduction in chargebacks from a peak of $900k per
month to just over $10k per month
Client was removed from Fraud Monitoring Program and
avoided a $50k fine
Blocked over 600 fraudulent orders saving over $1 million in
fraud losses
DISCLAIMER: This case study is not meant to indicate that the same or similar results can or will be obtained in other cases or situations. Results will vary depending on
the facts and circumstances of your business.
16threatmetrix.com16
Cybercrime Report Q1 2017
Alisdair FaulknerChief Products Officer
2 Foreword
3 Overview
11 Transactions & Attacks
29 Top Attack Methods
35 Mobile
40 Conclusion
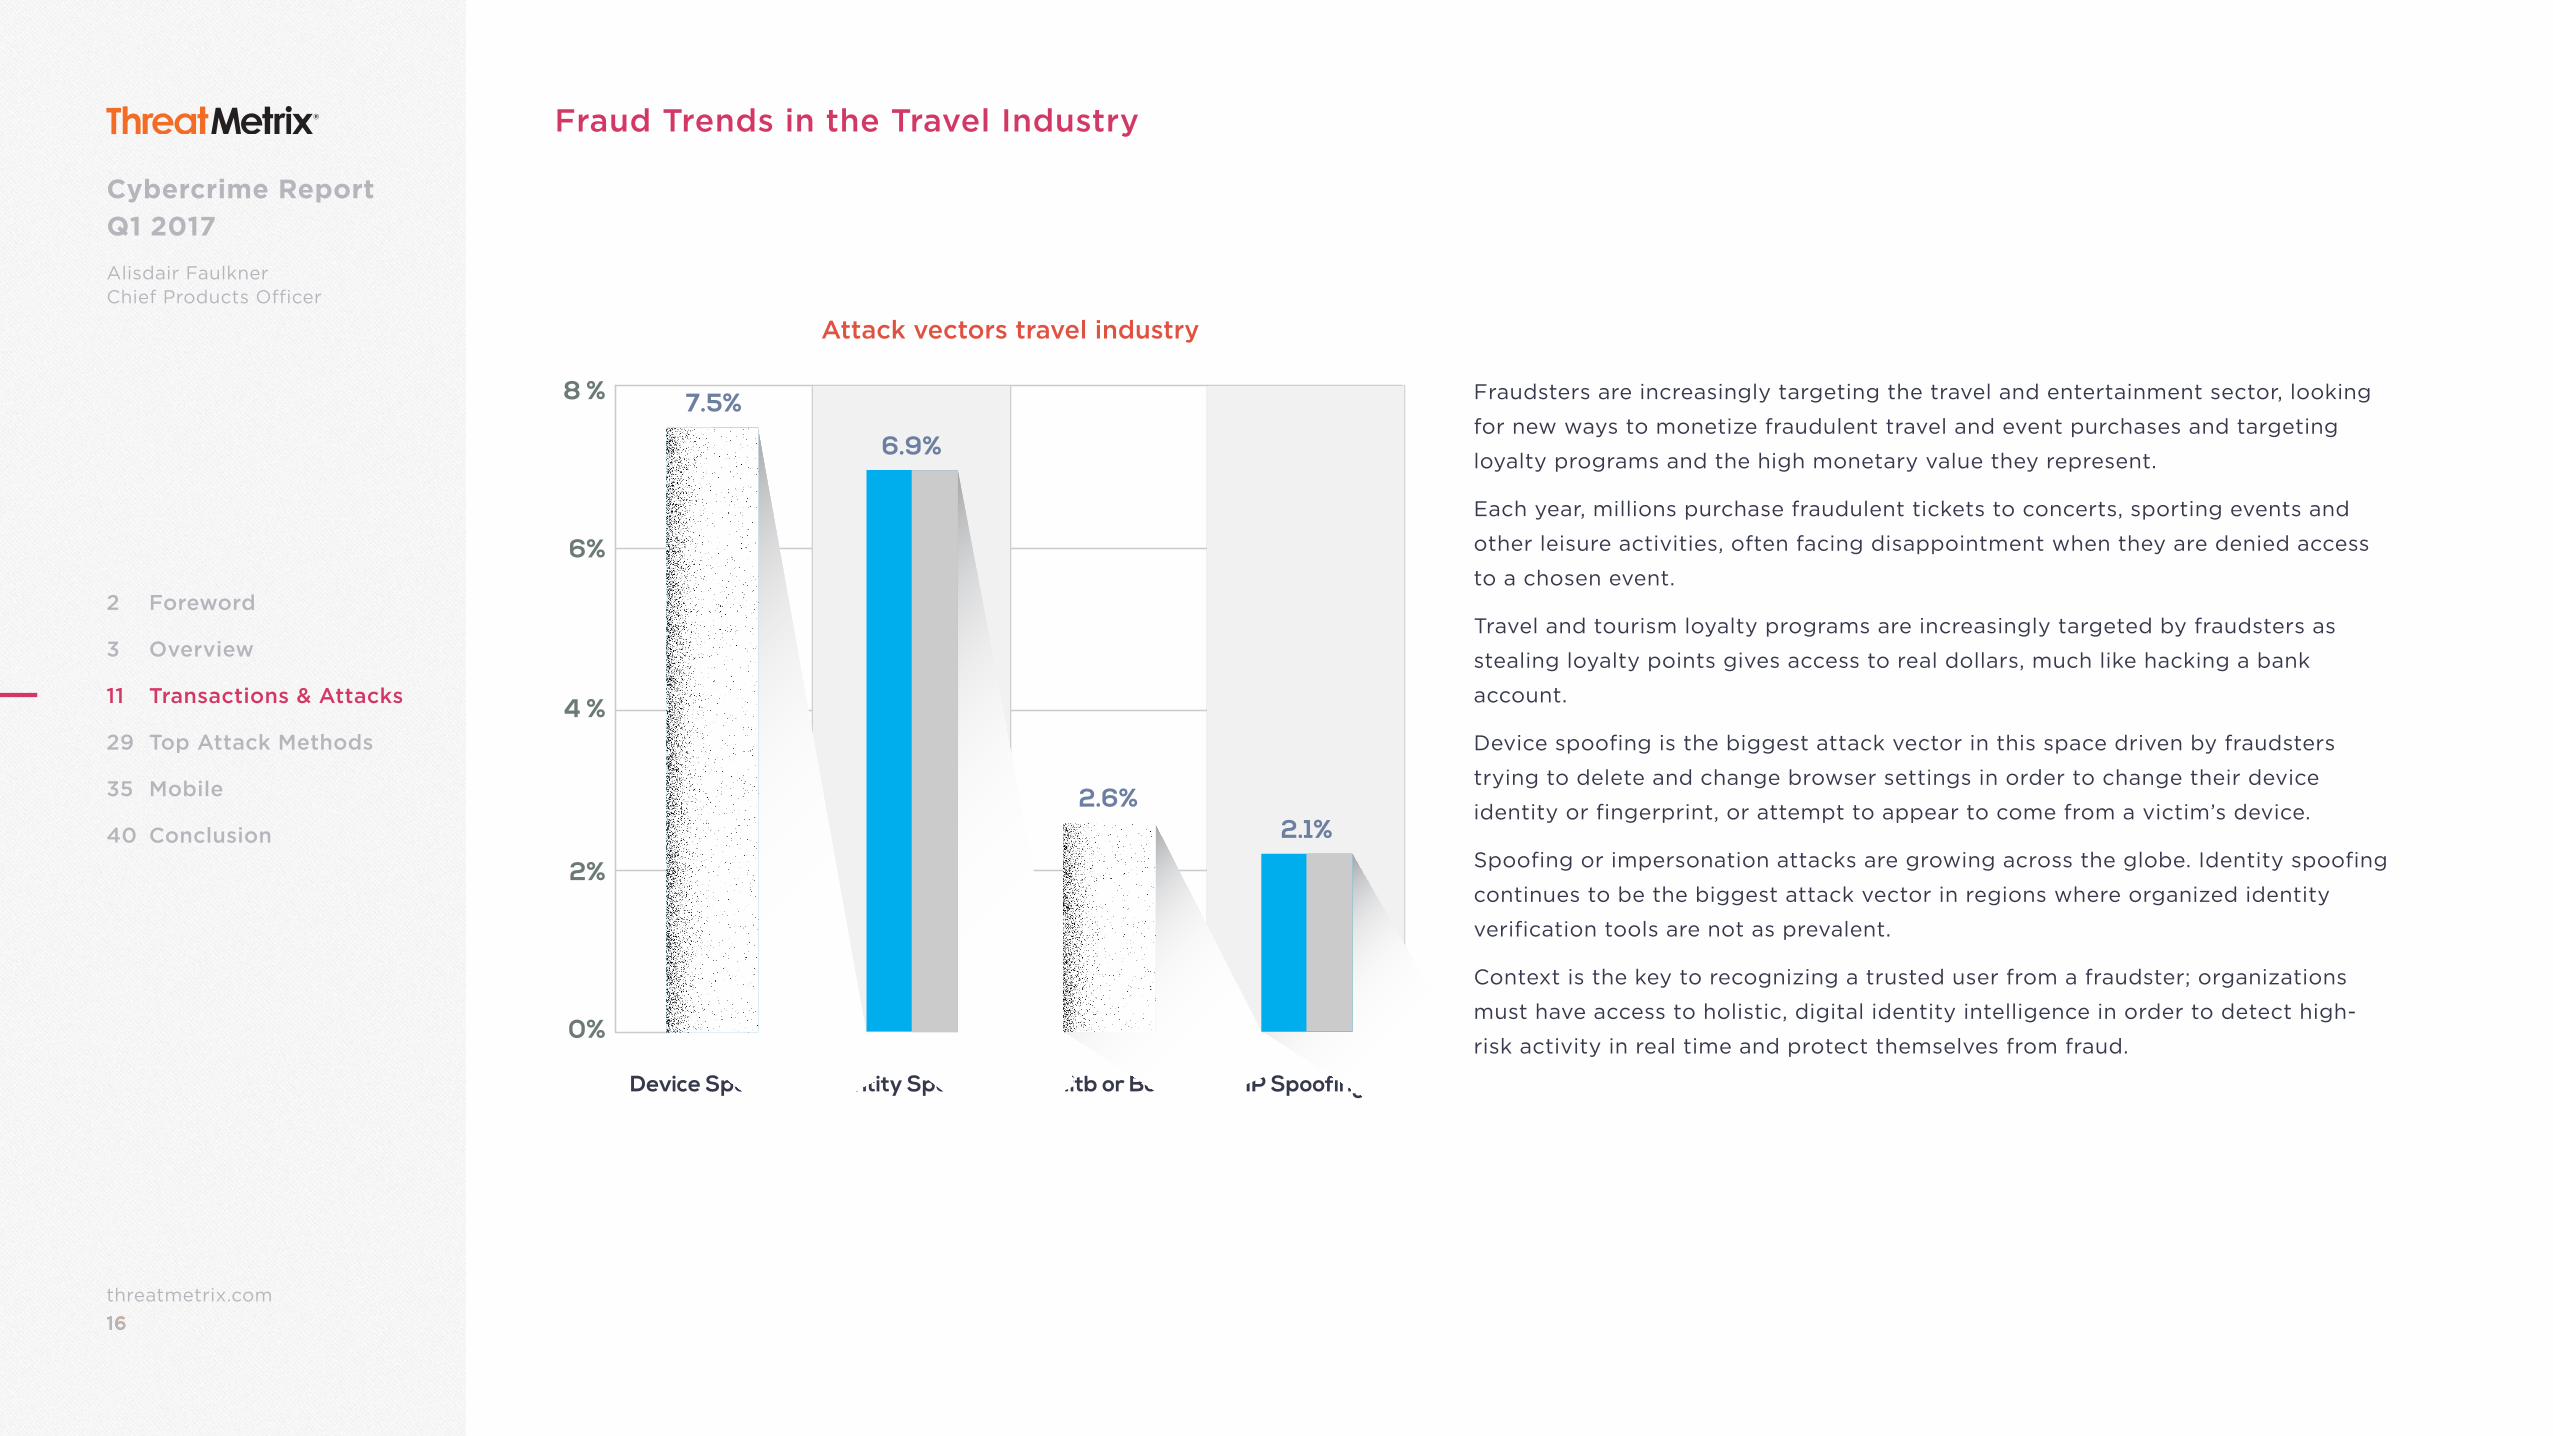
Fraud Trends in the Travel Industry
Fraudsters are increasingly targeting the travel and entertainment sector, looking
for new ways to monetize fraudulent travel and event purchases and targeting
loyalty programs and the high monetary value they represent.
Each year, millions purchase fraudulent tickets to concerts, sporting events and
other leisure activities, often facing disappointment when they are denied access
to a chosen event.
Travel and tourism loyalty programs are increasingly targeted by fraudsters as
stealing loyalty points gives access to real dollars, much like hacking a bank
account.
Device spoofing is the biggest attack vector in this space driven by fraudsters
trying to delete and change browser settings in order to change their device
identity or fingerprint, or attempt to appear to come from a victim’s device.
Spoofing or impersonation attacks are growing across the globe. Identity spoofing
continues to be the biggest attack vector in regions where organized identity
verification tools are not as prevalent.
Context is the key to recognizing a trusted user from a fraudster; organizations
must have access to holistic, digital identity intelligence in order to detect high-
risk activity in real time and protect themselves from fraud.
Device Spoofing Identity Spoofing Mitb or Bot IP Spoofing
0%
2%
8 %
4 %
6%
7.5%
6.9%
2.6%2.1%
Attack vectors travel industry
17threatmetrix.com17
Cybercrime Report Q1 2017
Alisdair FaulknerChief Products Officer
2 Foreword
3 Overview
11 Transactions & Attacks
29 Top Attack Methods
35 Mobile
40 Conclusion
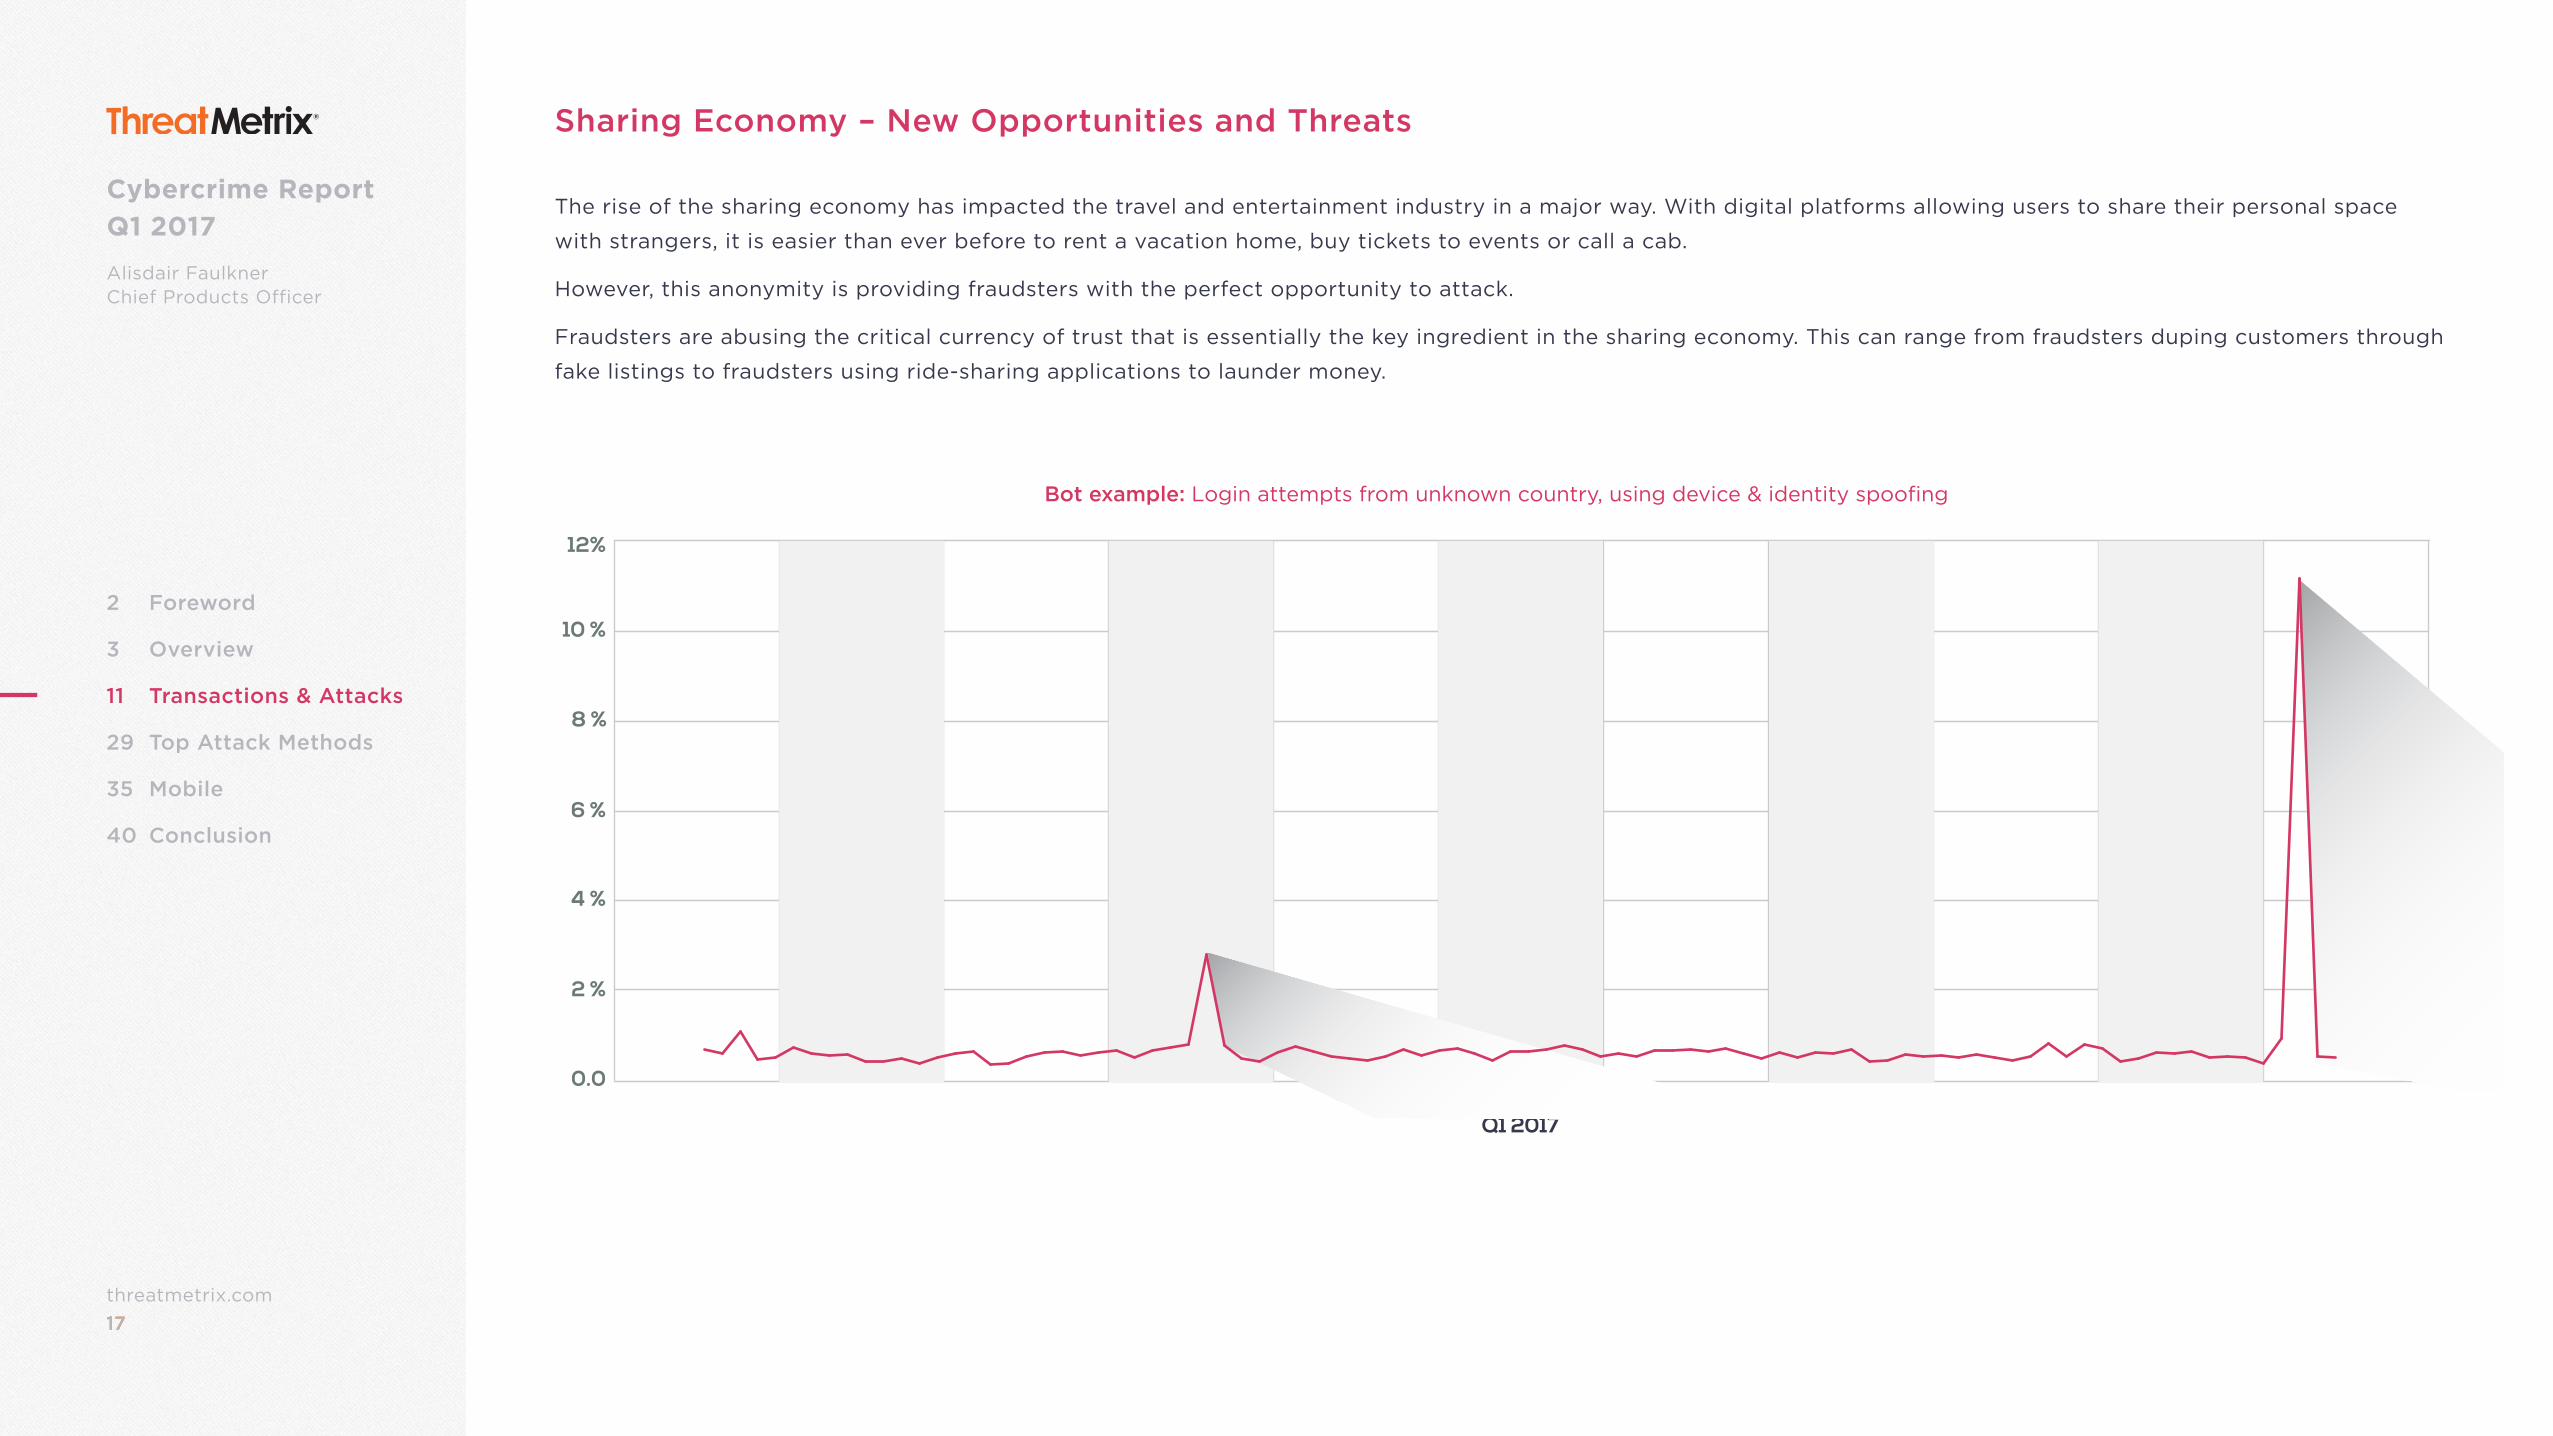
Sharing Economy – New Opportunities and Threats
The rise of the sharing economy has impacted the travel and entertainment industry in a major way. With digital platforms allowing users to share their personal space
with strangers, it is easier than ever before to rent a vacation home, buy tickets to events or call a cab.
However, this anonymity is providing fraudsters with the perfect opportunity to attack.
Fraudsters are abusing the critical currency of trust that is essentially the key ingredient in the sharing economy. This can range from fraudsters duping customers through
fake listings to fraudsters using ride-sharing applications to launder money.
Q1 2017
0.0
6 %
4 %
2 %
12%
8 %
10 %
Bot example: Login attempts from unknown country, using device & identity spoofing
18threatmetrix.com18
Cybercrime Report Q1 2017
Alisdair FaulknerChief Products Officer
2 Foreword
3 Overview
11 Transactions & Attacks
29 Top Attack Methods
35 Mobile
40 Conclusion
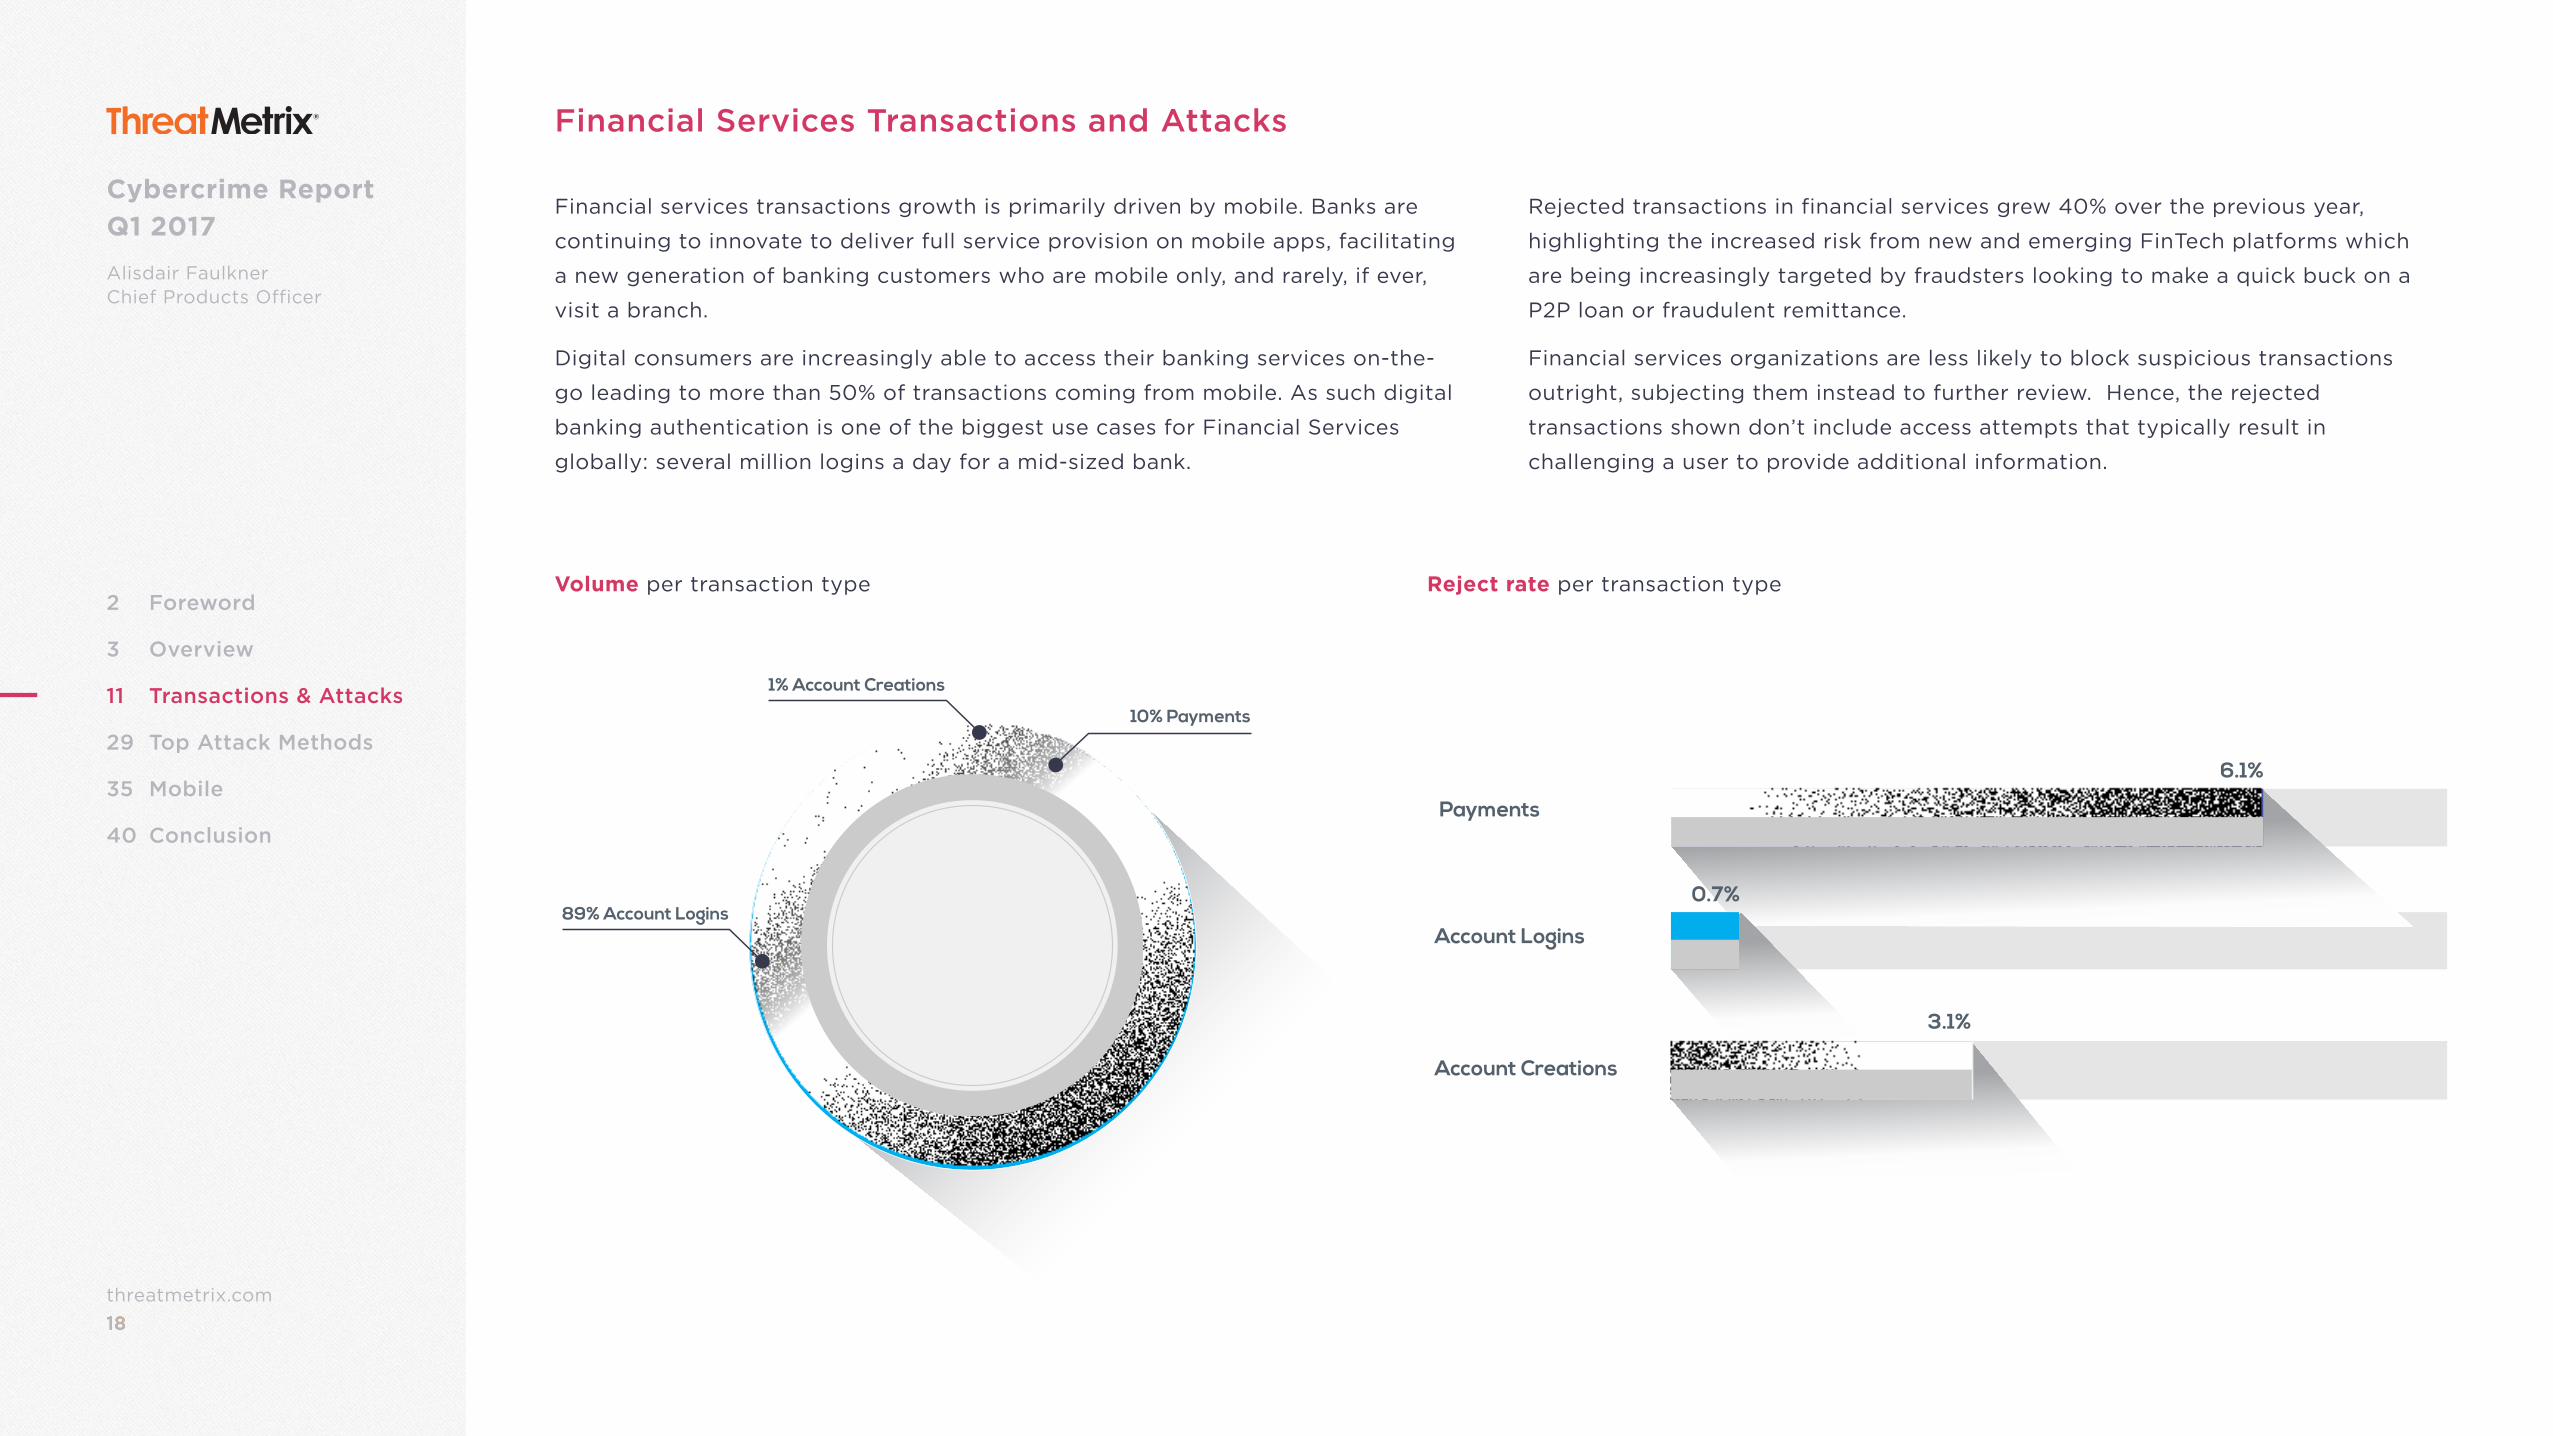
Financial Services Transactions and Attacks
Financial services transactions growth is primarily driven by mobile. Banks are
continuing to innovate to deliver full service provision on mobile apps, facilitating
a new generation of banking customers who are mobile only, and rarely, if ever,
visit a branch.
Digital consumers are increasingly able to access their banking services on-the-
go leading to more than 50% of transactions coming from mobile. As such digital
banking authentication is one of the biggest use cases for Financial Services
globally: several million logins a day for a mid-sized bank.
Rejected transactions in financial services grew 40% over the previous year,
highlighting the increased risk from new and emerging FinTech platforms which
are being increasingly targeted by fraudsters looking to make a quick buck on a
P2P loan or fraudulent remittance.
Financial services organizations are less likely to block suspicious transactions
outright, subjecting them instead to further review. Hence, the rejected
transactions shown don’t include access attempts that typically result in
challenging a user to provide additional information.
Volume per transaction type Reject rate per transaction type
Payments
Account Logins
Account Creations
6.1%
0.7%
3.1%
1% Account Creations
10% Payments
89% Account Logins
19threatmetrix.com19
Cybercrime Report Q1 2017
Alisdair FaulknerChief Products Officer
2 Foreword
3 Overview
11 Transactions & Attacks
29 Top Attack Methods
35 Mobile
40 Conclusion
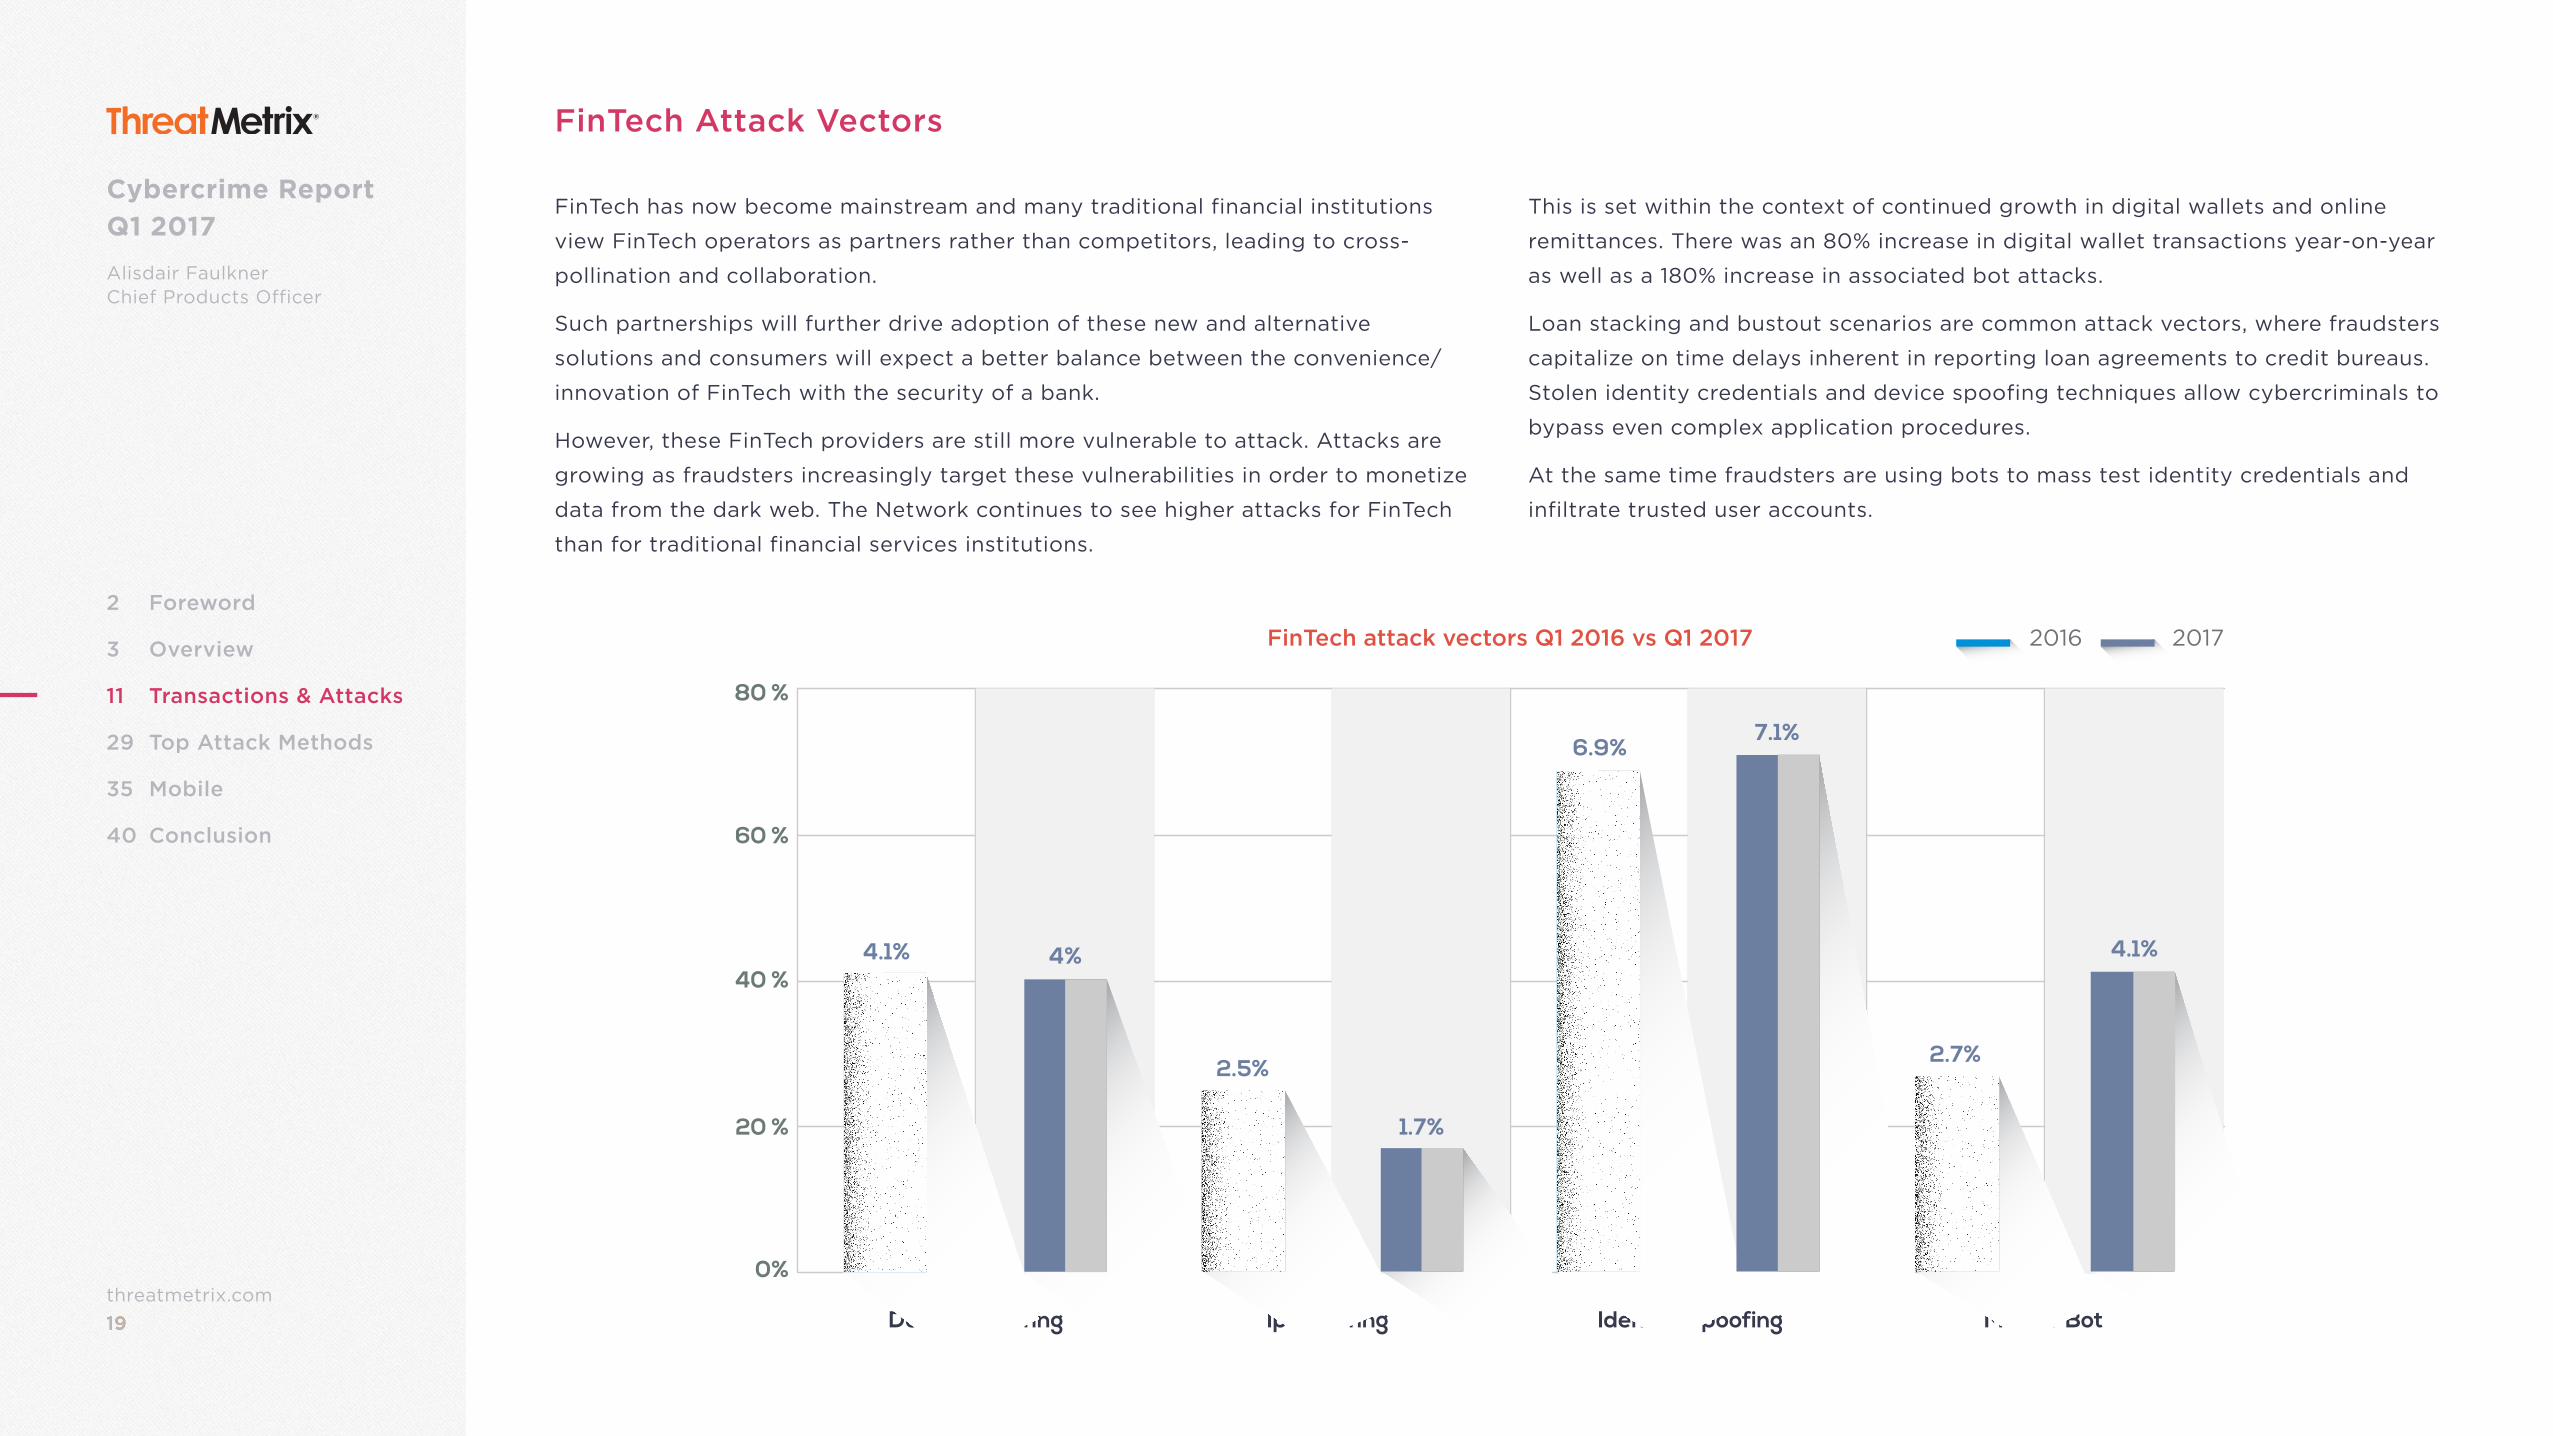
FinTech Attack Vectors
This is set within the context of continued growth in digital wallets and online
remittances. There was an 80% increase in digital wallet transactions year-on-year
as well as a 180% increase in associated bot attacks.
Loan stacking and bustout scenarios are common attack vectors, where fraudsters
capitalize on time delays inherent in reporting loan agreements to credit bureaus.
Stolen identity credentials and device spoofing techniques allow cybercriminals to
bypass even complex application procedures.
At the same time fraudsters are using bots to mass test identity credentials and
infiltrate trusted user accounts.
FinTech has now become mainstream and many traditional financial institutions
view FinTech operators as partners rather than competitors, leading to cross-
pollination and collaboration.
Such partnerships will further drive adoption of these new and alternative
solutions and consumers will expect a better balance between the convenience/
innovation of FinTech with the security of a bank.
However, these FinTech providers are still more vulnerable to attack. Attacks are
growing as fraudsters increasingly target these vulnerabilities in order to monetize
data from the dark web. The Network continues to see higher attacks for FinTech
than for traditional financial services institutions.
Device Spoofing Ip Spoofing Identity Spoofing Mitb or Bot
0%
20 %
80 %
40 %
60 %
4.1% 4%
2.5%
1.7%
6.9%7.1%
2.7%
4.1%
FinTech attack vectors Q1 2016 vs Q1 2017 2016 2017
20threatmetrix.com20
Cybercrime Report Q1 2017
Alisdair FaulknerChief Products Officer
2 Foreword
3 Overview
11 Transactions & Attacks
29 Top Attack Methods
35 Mobile
40 Conclusion
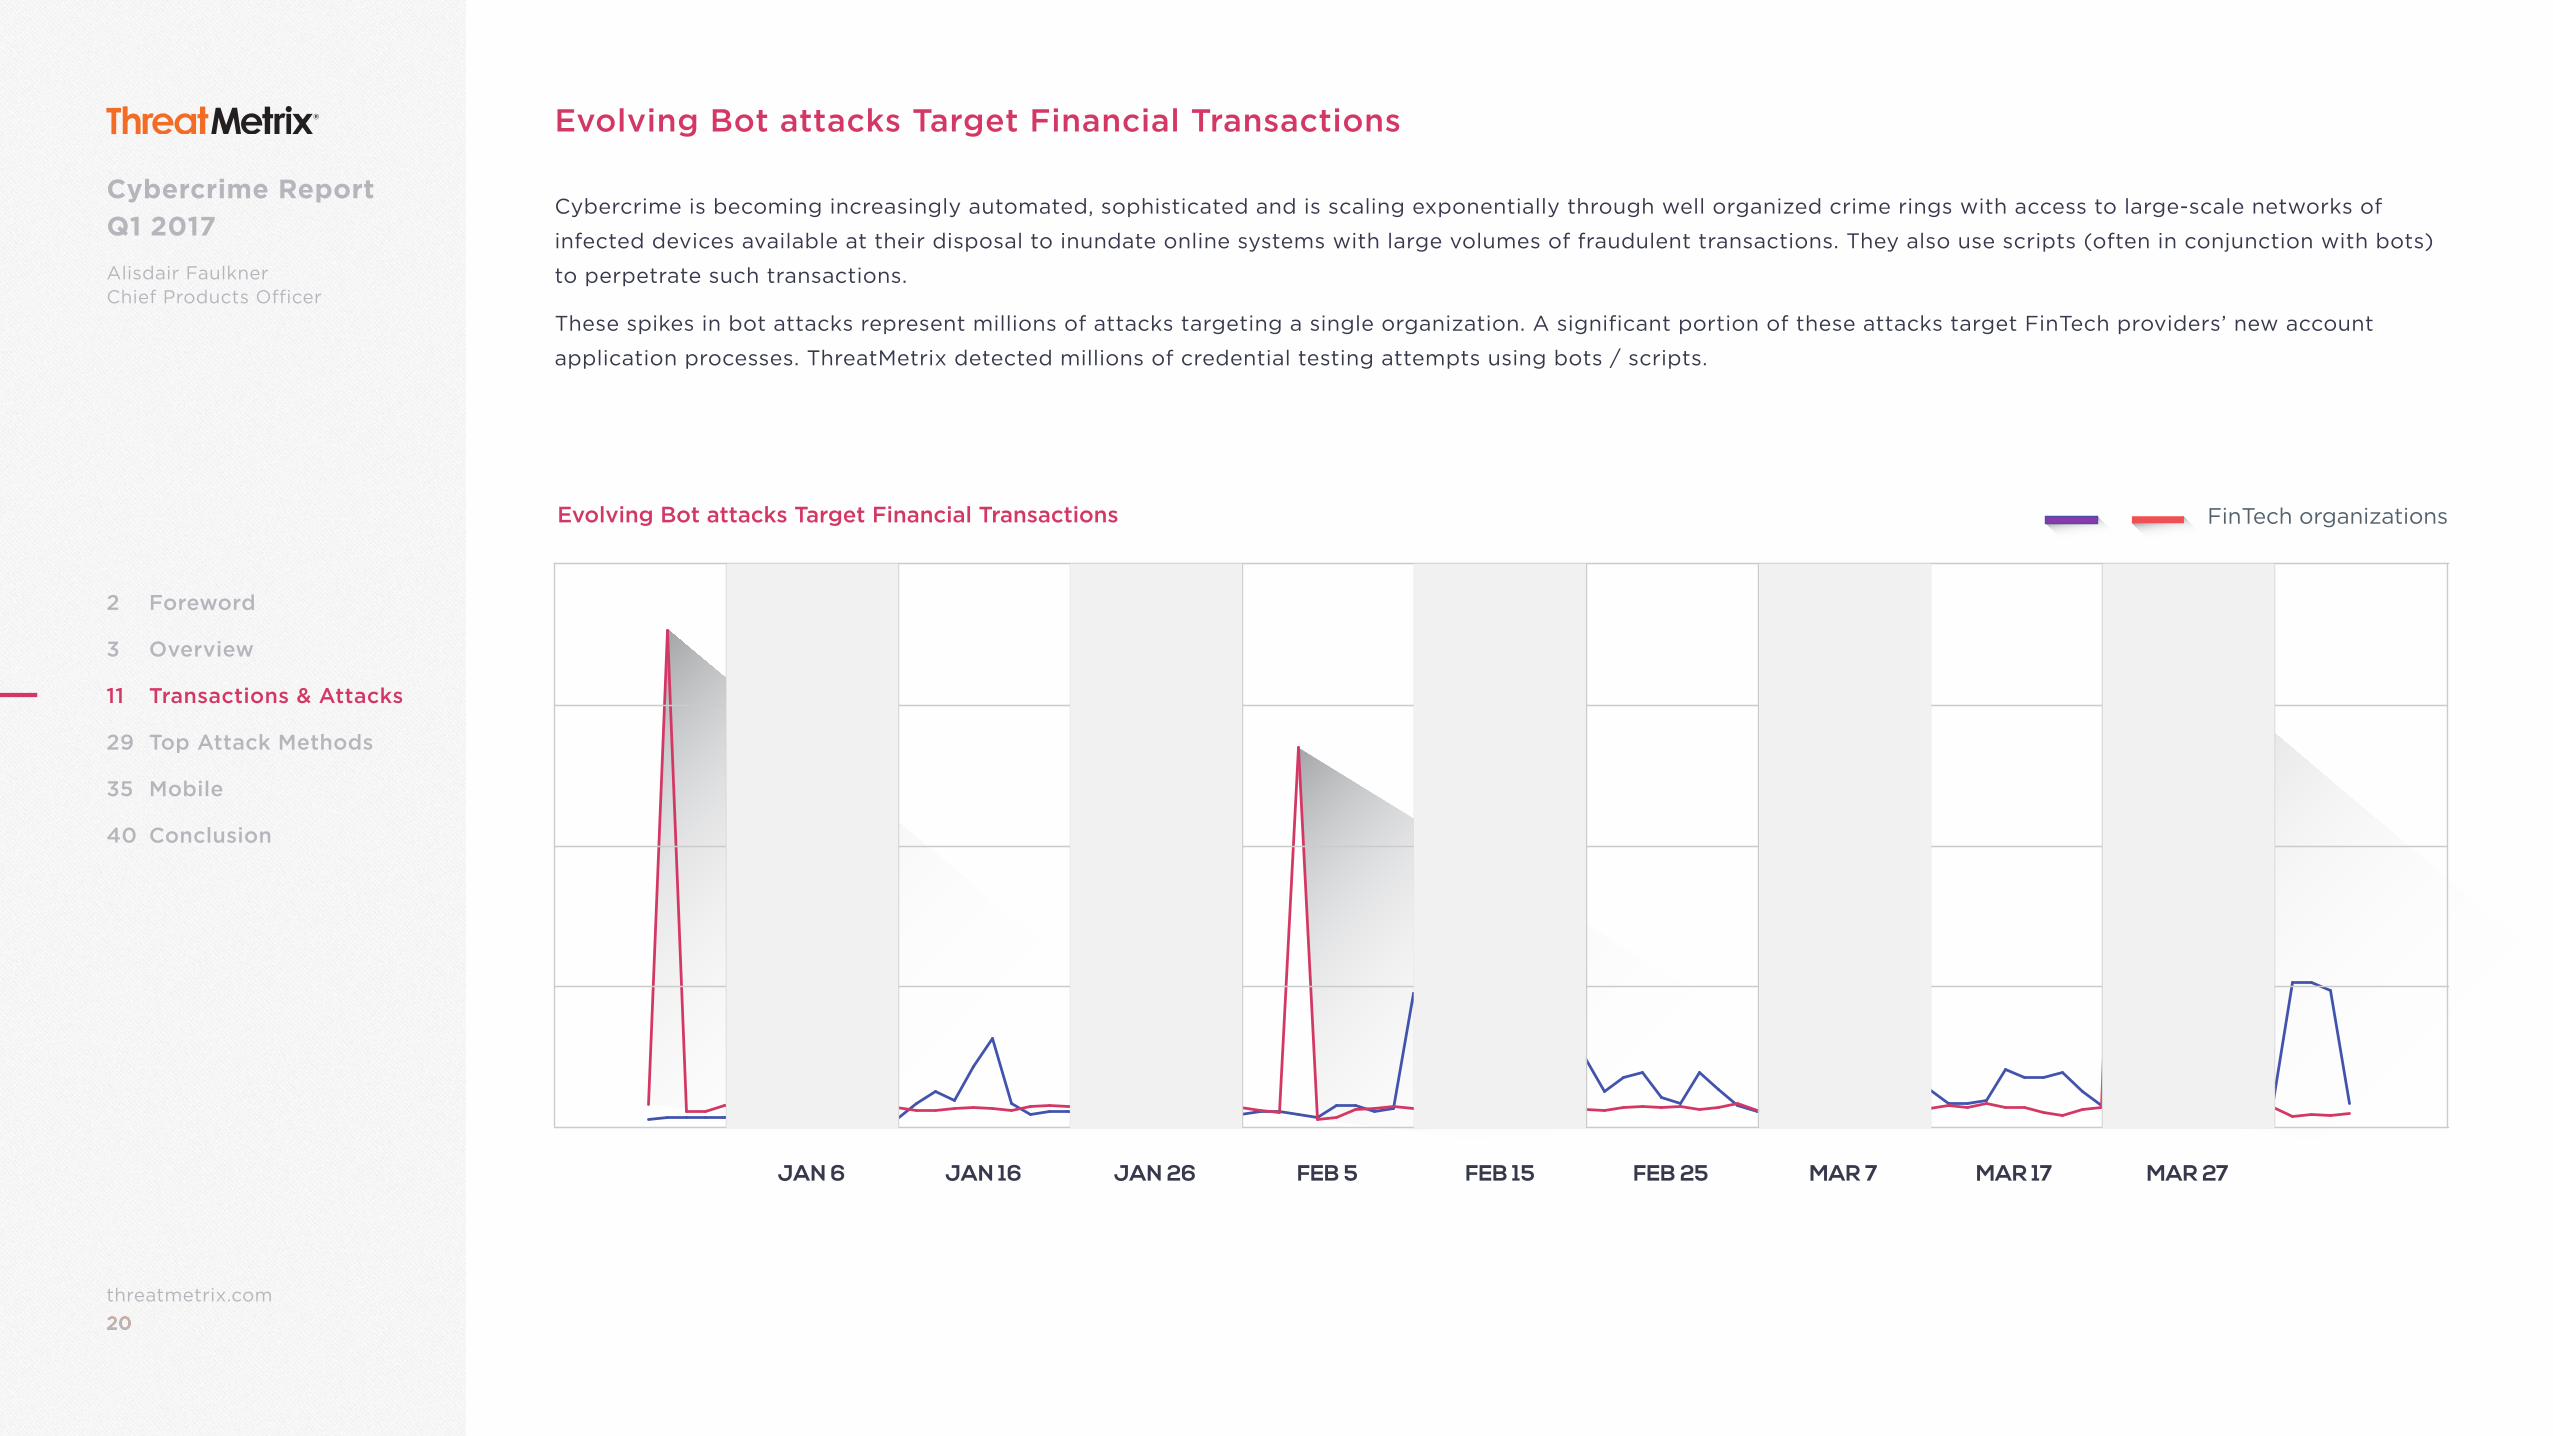
Evolving Bot attacks Target Financial Transactions
Cybercrime is becoming increasingly automated, sophisticated and is scaling exponentially through well organized crime rings with access to large-scale networks of
infected devices available at their disposal to inundate online systems with large volumes of fraudulent transactions. They also use scripts (often in conjunction with bots)
to perpetrate such transactions.
These spikes in bot attacks represent millions of attacks targeting a single organization. A significant portion of these attacks target FinTech providers’ new account
application processes. ThreatMetrix detected millions of credential testing attempts using bots / scripts.
JAN 6 JAN 16 JAN 26 FEB 5 FEB 15 FEB 25 MAR 7 MAR 17 MAR 27
Evolving Bot attacks Target Financial Transactions FinTech organizations
21threatmetrix.com21
Cybercrime Report Q1 2017
Alisdair FaulknerChief Products Officer
2 Foreword
3 Overview
11 Transactions & Attacks
29 Top Attack Methods
35 Mobile
40 Conclusion
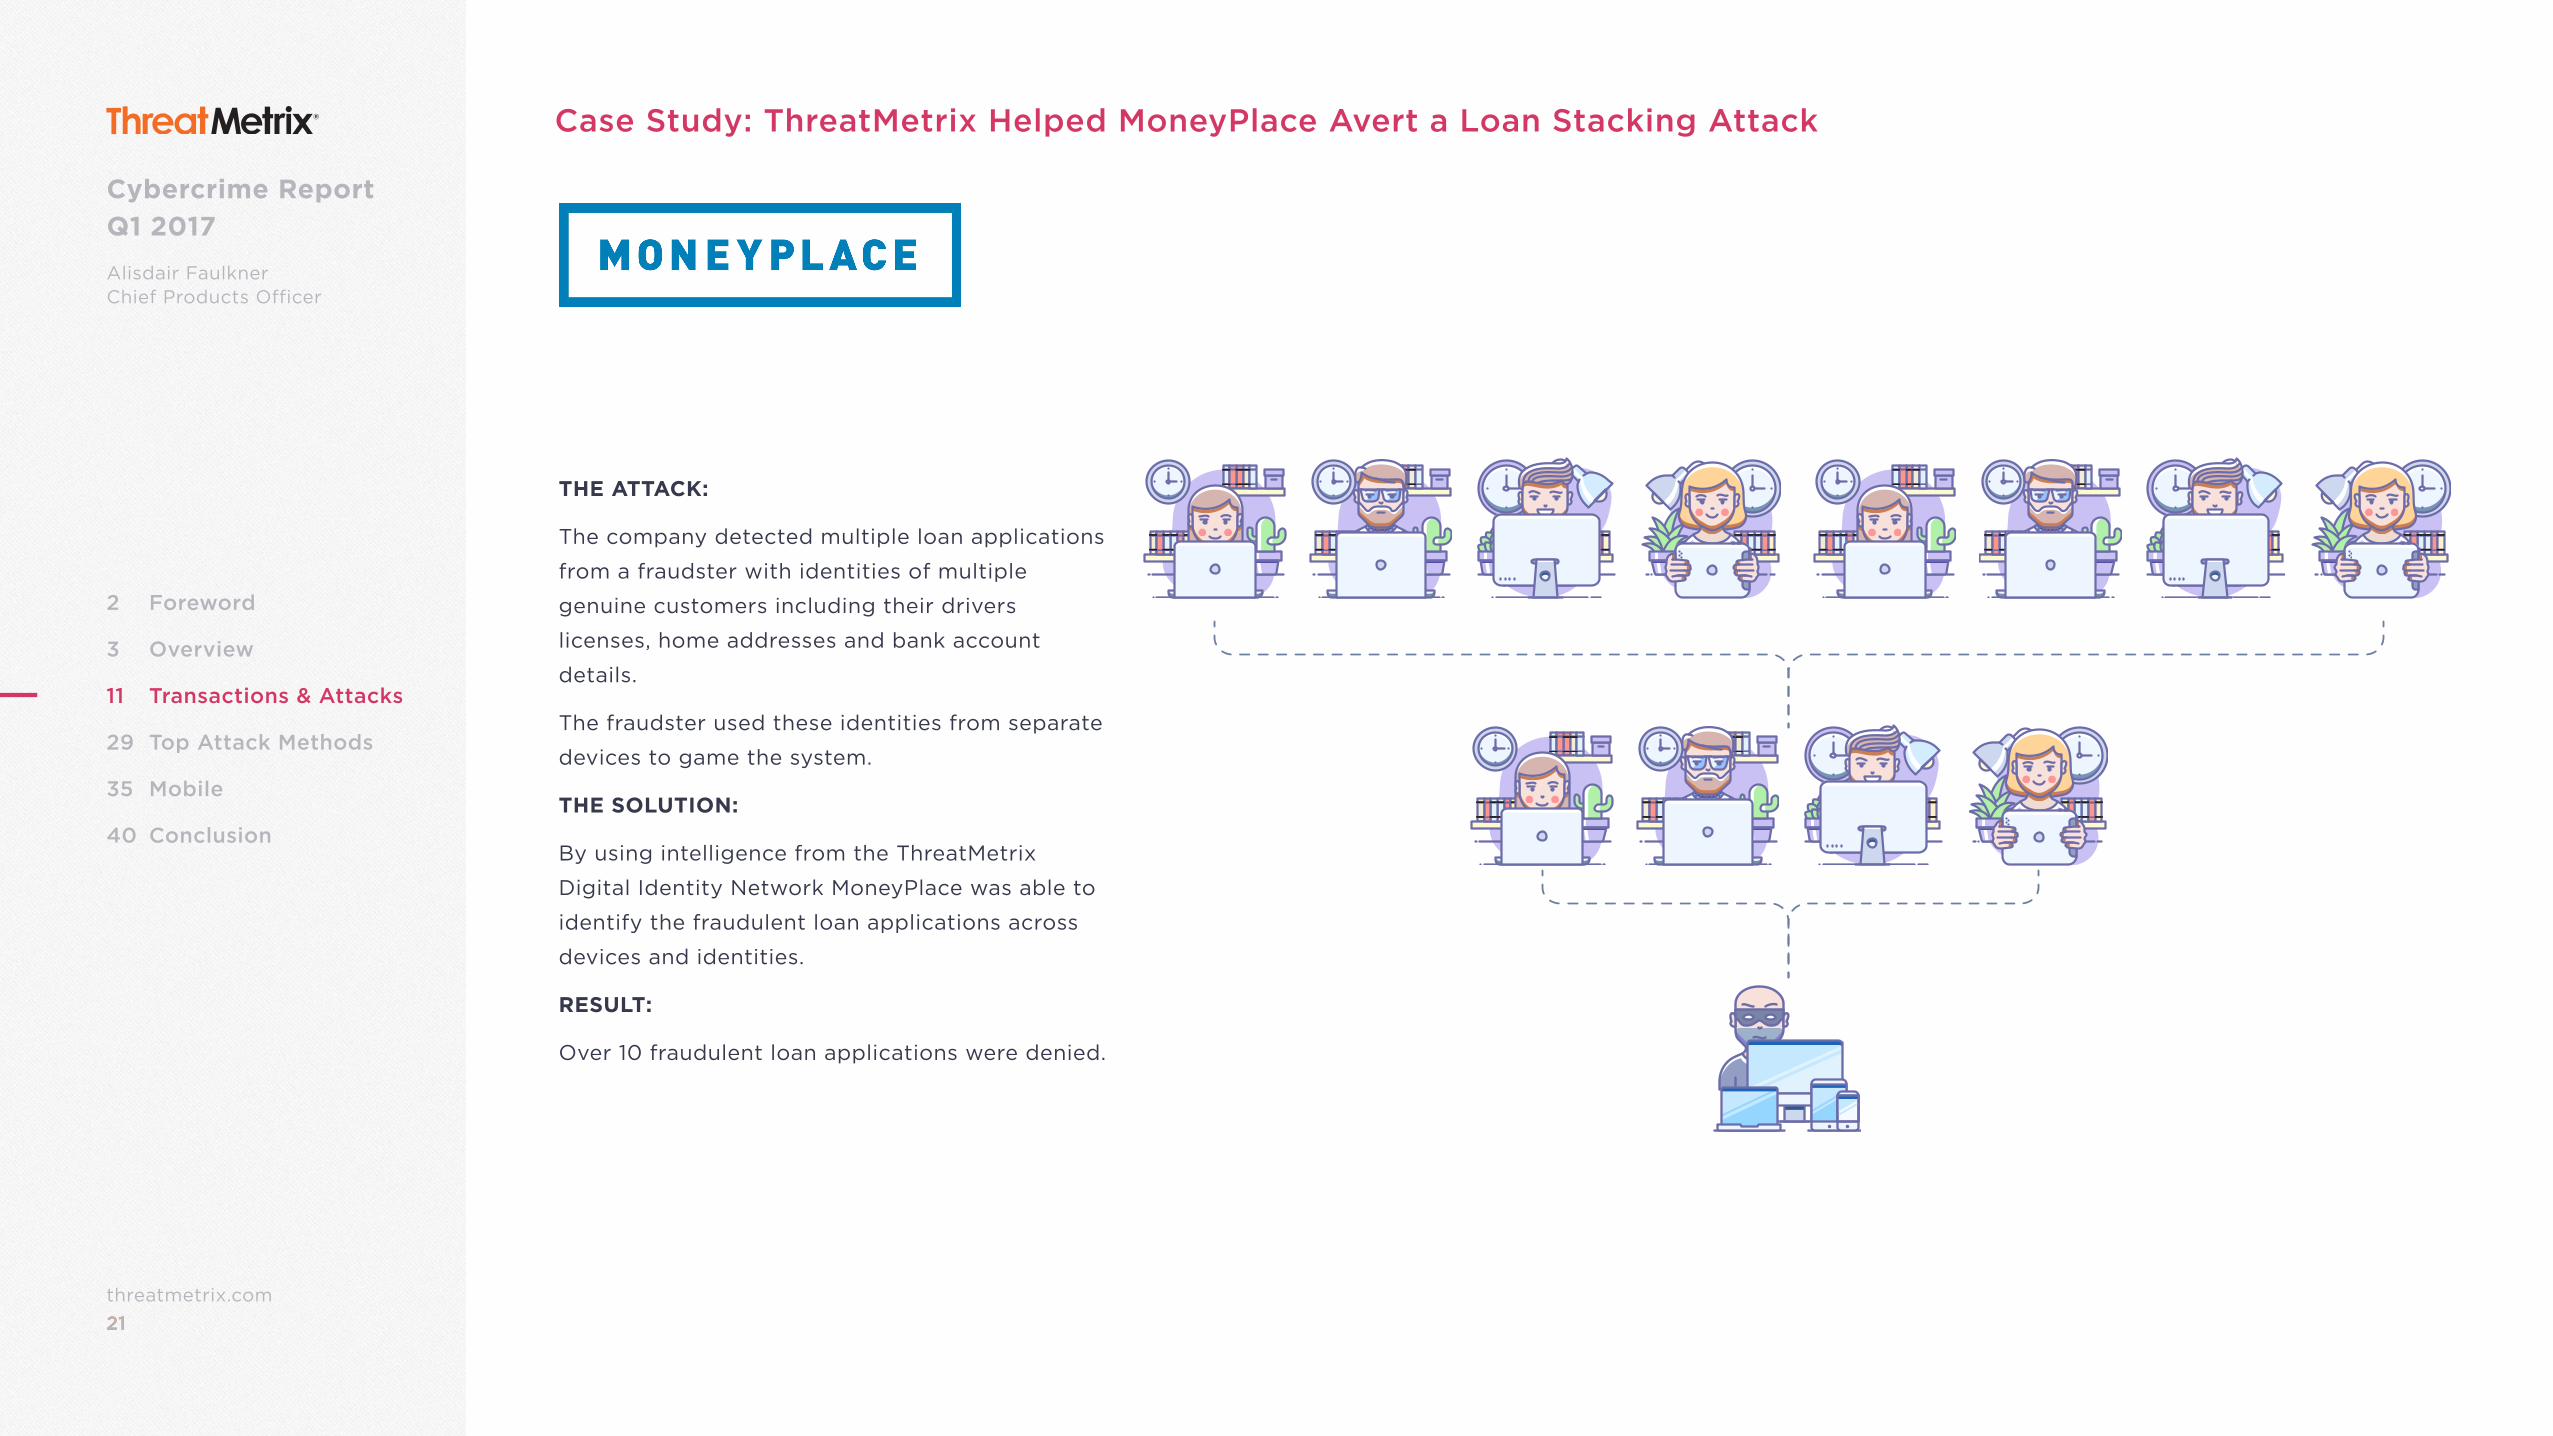
Case Study: ThreatMetrix Helped MoneyPlace Avert a Loan Stacking Attack
THE ATTACK:
The company detected multiple loan applications
from a fraudster with identities of multiple
genuine customers including their drivers
licenses, home addresses and bank account
details.
The fraudster used these identities from separate
devices to game the system.
THE SOLUTION:
By using intelligence from the ThreatMetrix
Digital Identity Network MoneyPlace was able to
identify the fraudulent loan applications across
devices and identities.
RESULT:
Over 10 fraudulent loan applications were denied.
22threatmetrix.com22
Cybercrime Report Q1 2017
Alisdair FaulknerChief Products Officer
2 Foreword
3 Overview
11 Transactions & Attacks
29 Top Attack Methods
35 Mobile
40 Conclusion
Insurance Transactions in the Digital Identity Network
Later than other industries, insurance is being coerced down a path of digital transformation, in part due to the rise of the Insuretech challengers. One of the key
challenges for established insurers is that they often have very little direct contact with their customers, so in the age of digital, with real-time decisioning, tailored
products and services, it is becoming more of a challenge to stay relevant.
Insuretechs are entering the playing field with a simpler, more transparent and customer centric view of the market, and with these new business models comes more of an
opportunity to engage with customers. Consider for example, short-term car insurance, use of fitness trackers to define insurance policies, insurance for renters and peer-
to-peer insurance. These new business models work because they are leveraging all the benefits that digitization has to offer – real-time decisioning, mobile application
processes, digital identity intelligence to verify identities and improve speed to quote.
While the traditional carriers are looking to deliver new digital solutions, fraudsters are quickly finding avenues to exploit in their quest to steal personal data or monetize
identities obtained through the dark web.
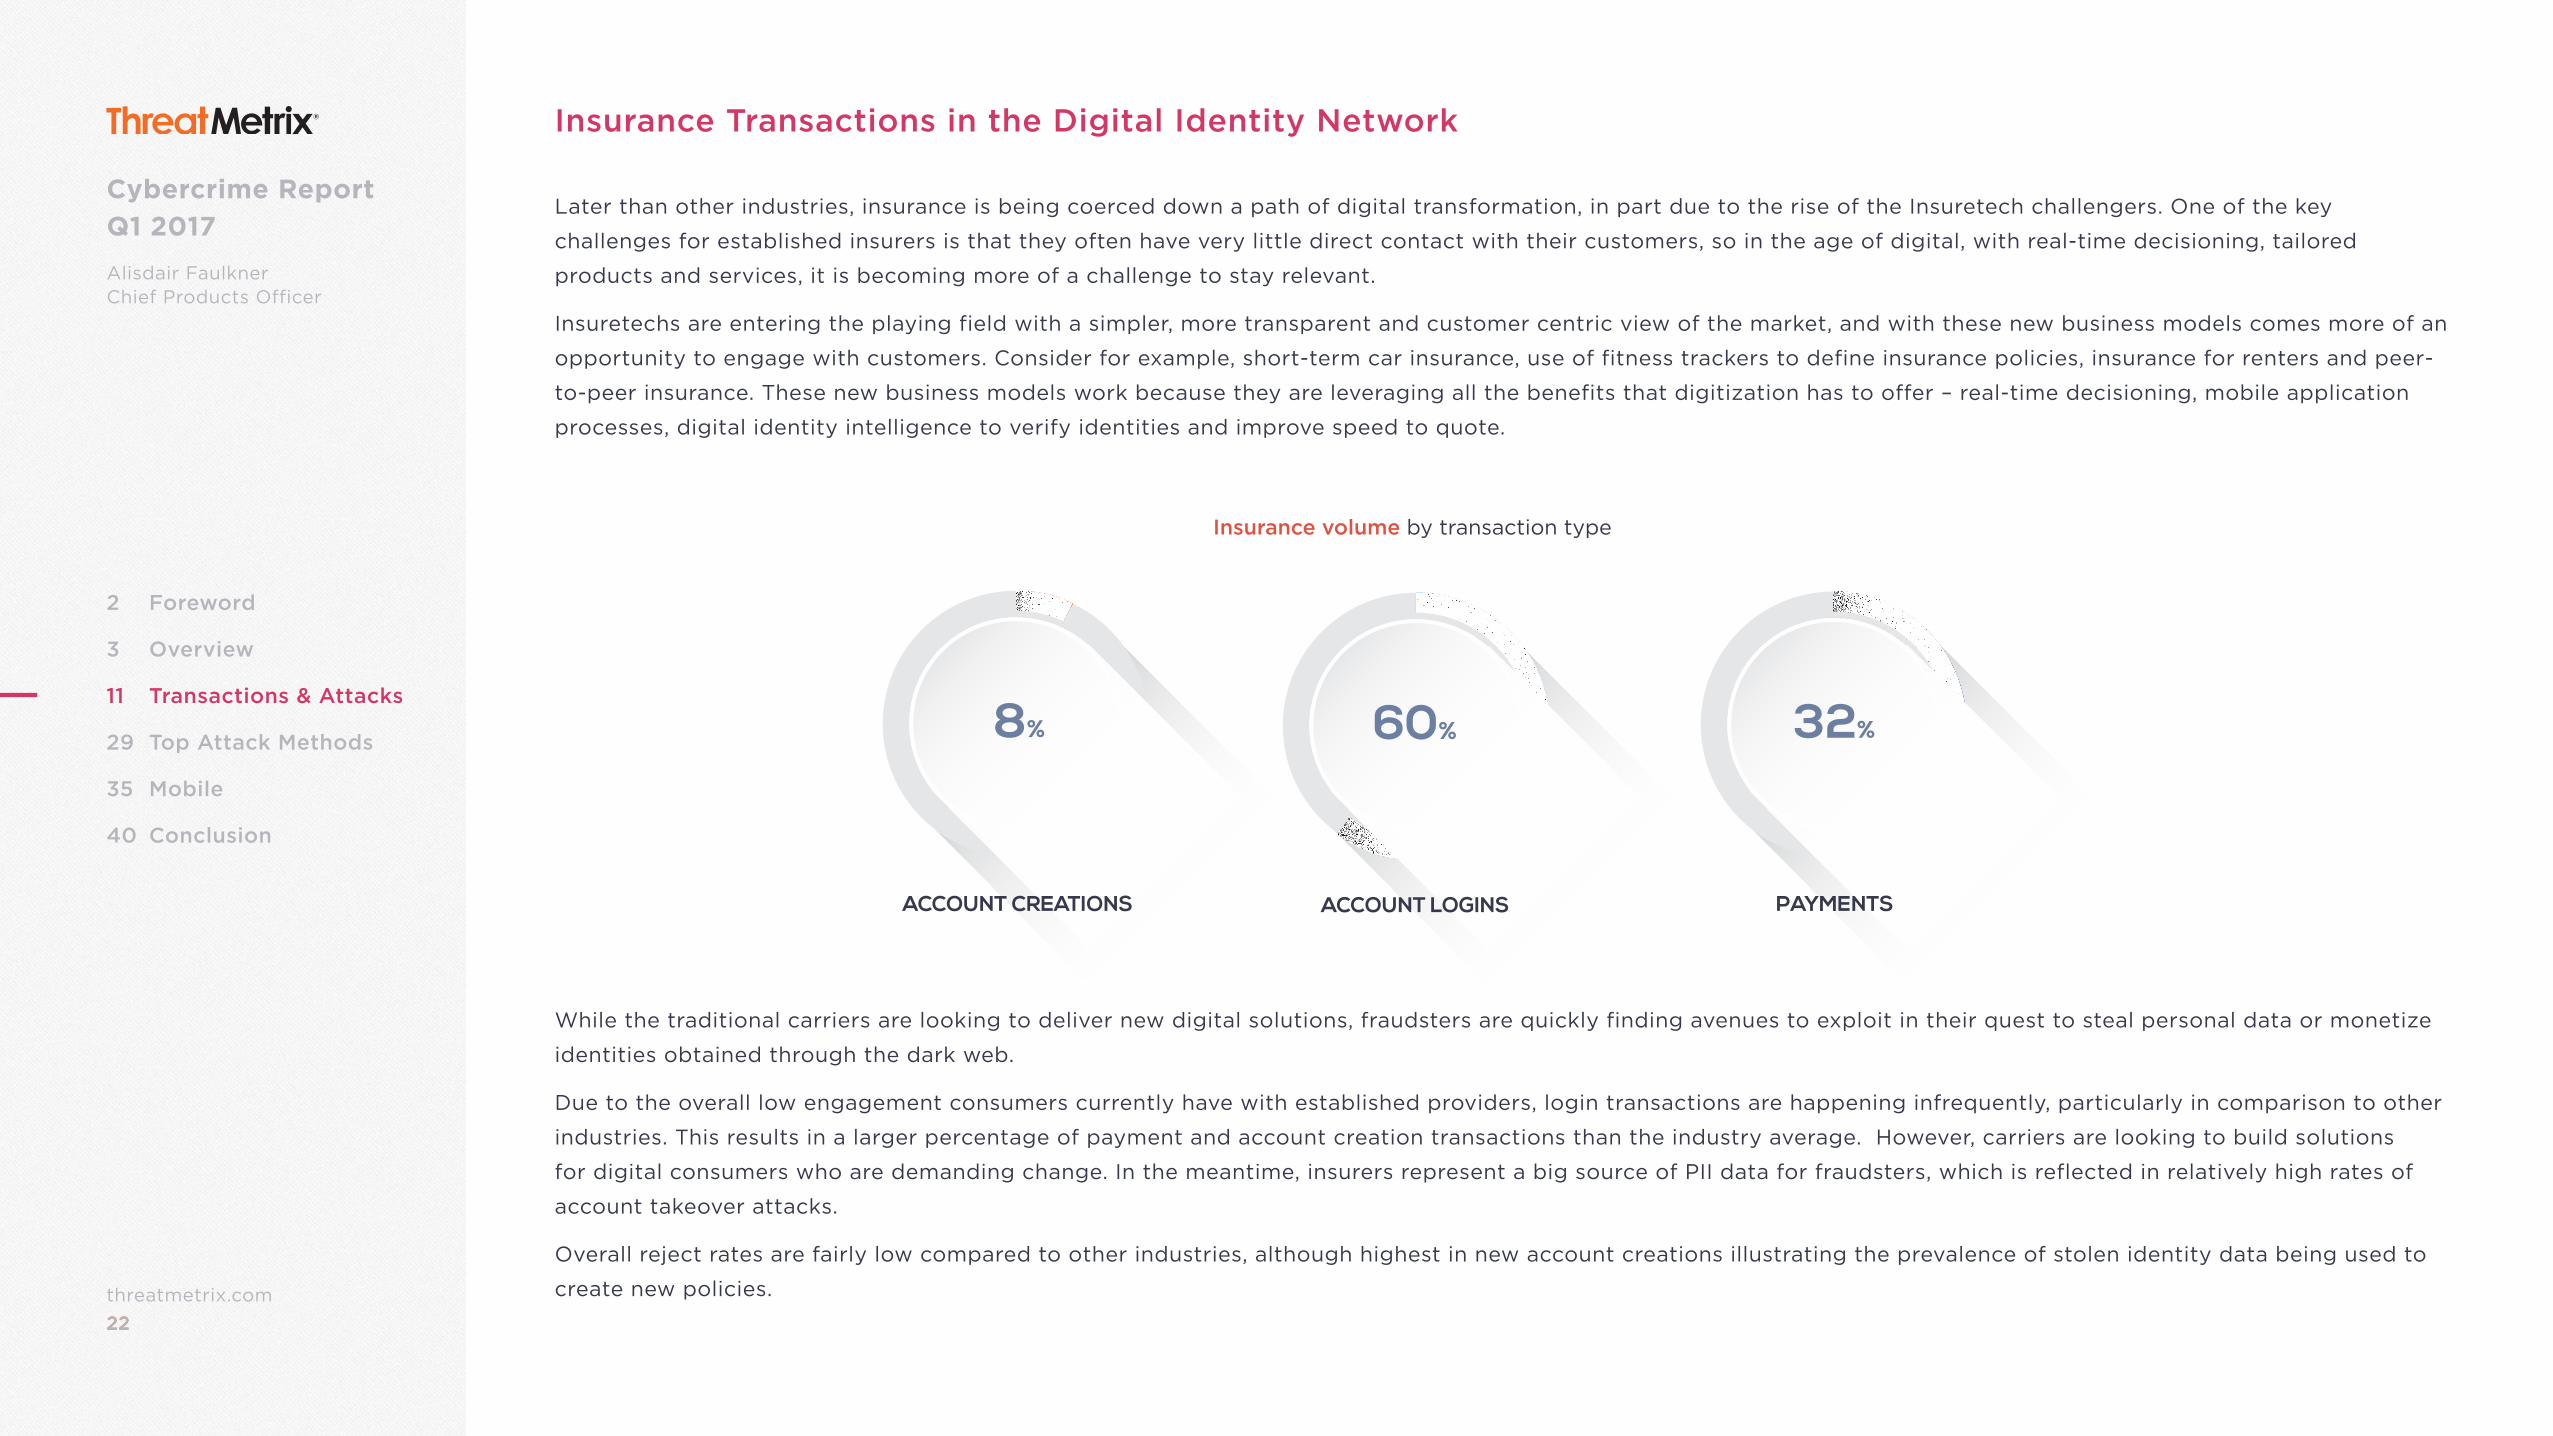
Due to the overall low engagement consumers currently have with established providers, login transactions are happening infrequently, particularly in comparison to other
industries. This results in a larger percentage of payment and account creation transactions than the industry average. However, carriers are looking to build solutions
for digital consumers who are demanding change. In the meantime, insurers represent a big source of PII data for fraudsters, which is reflected in relatively high rates of
account takeover attacks.
Overall reject rates are fairly low compared to other industries, although highest in new account creations illustrating the prevalence of stolen identity data being used to
create new policies.
8% 32%60%
ACCOUNT CREATIONS ACCOUNT LOGINS PAYMENTS
Insurance volume by transaction type
23threatmetrix.com23
Cybercrime Report Q1 2017
Alisdair FaulknerChief Products Officer
2 Foreword
3 Overview
11 Transactions & Attacks
29 Top Attack Methods
35 Mobile
40 Conclusion
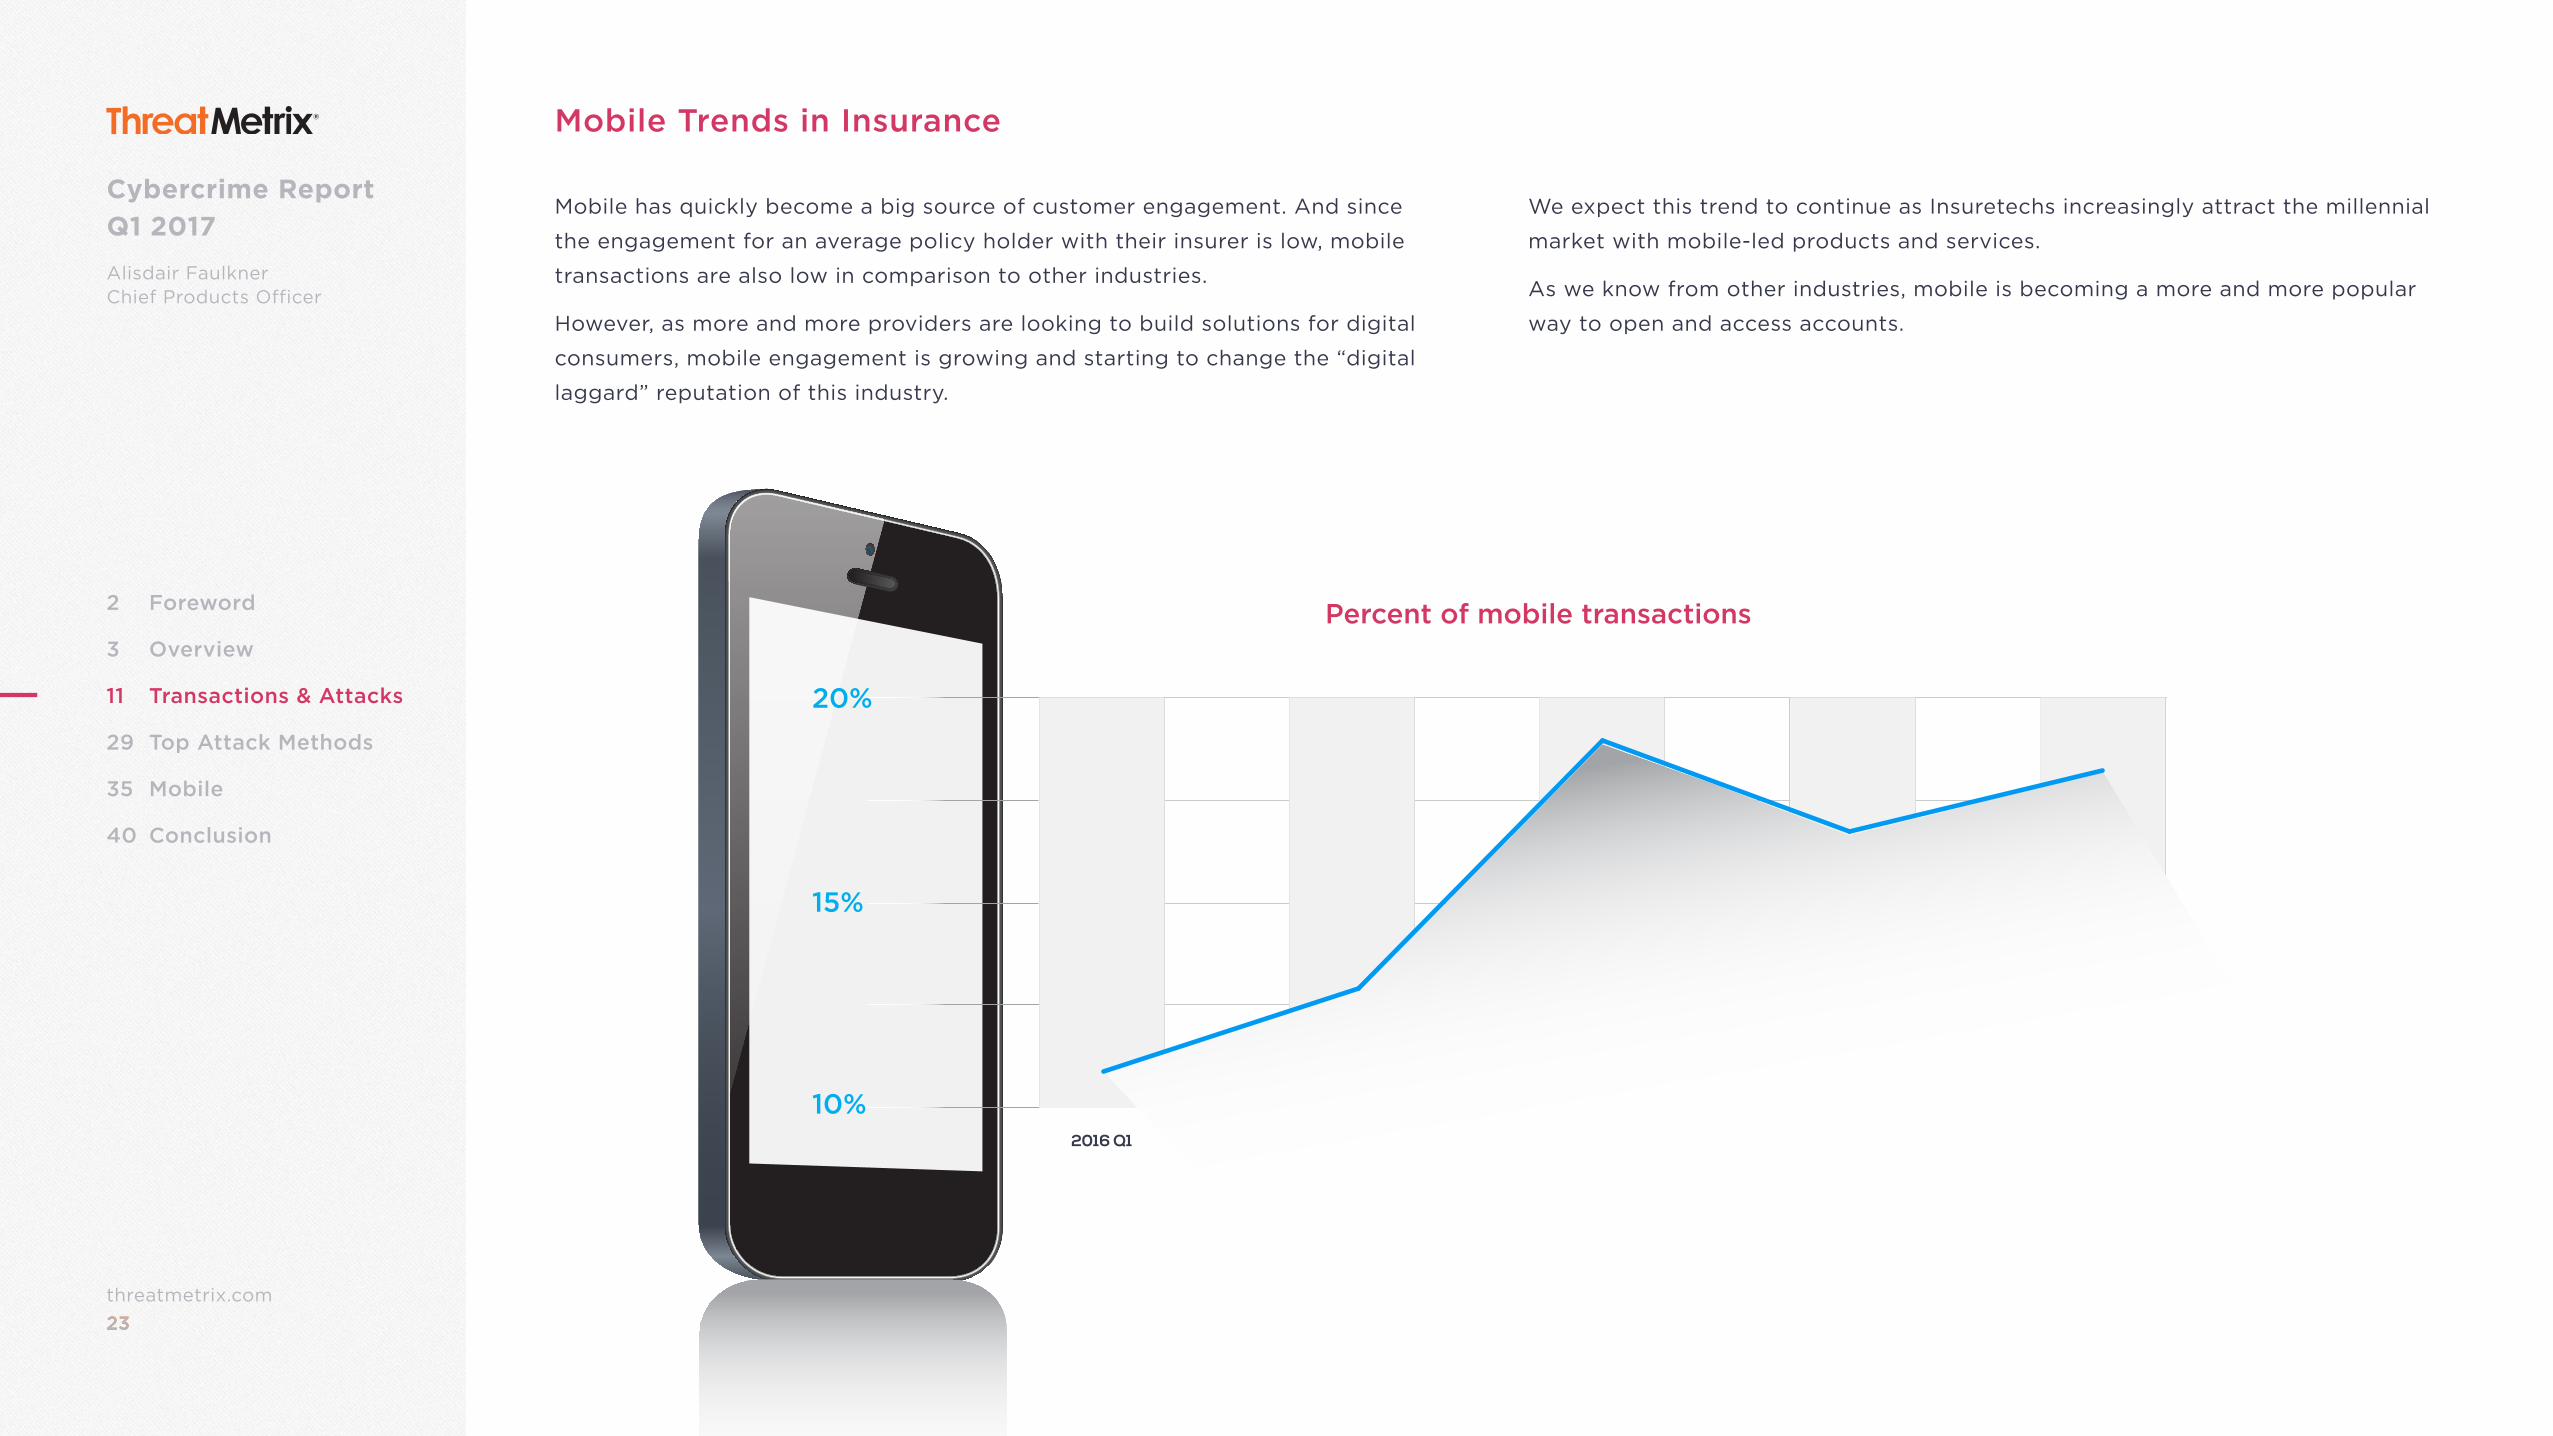
Mobile Trends in Insurance
Mobile has quickly become a big source of customer engagement. And since
the engagement for an average policy holder with their insurer is low, mobile
transactions are also low in comparison to other industries.
However, as more and more providers are looking to build solutions for digital
consumers, mobile engagement is growing and starting to change the “digital
laggard” reputation of this industry.
We expect this trend to continue as Insuretechs increasingly attract the millennial
market with mobile-led products and services.
As we know from other industries, mobile is becoming a more and more popular
way to open and access accounts.
2016 Q1 2016 Q2 2016 Q3 2016 Q4 2017 Q1
Percent of mobile transactions
20%
15%
10%
24threatmetrix.com24
Cybercrime Report Q1 2017
Alisdair FaulknerChief Products Officer
2 Foreword
3 Overview
11 Transactions & Attacks
29 Top Attack Methods
35 Mobile
40 Conclusion
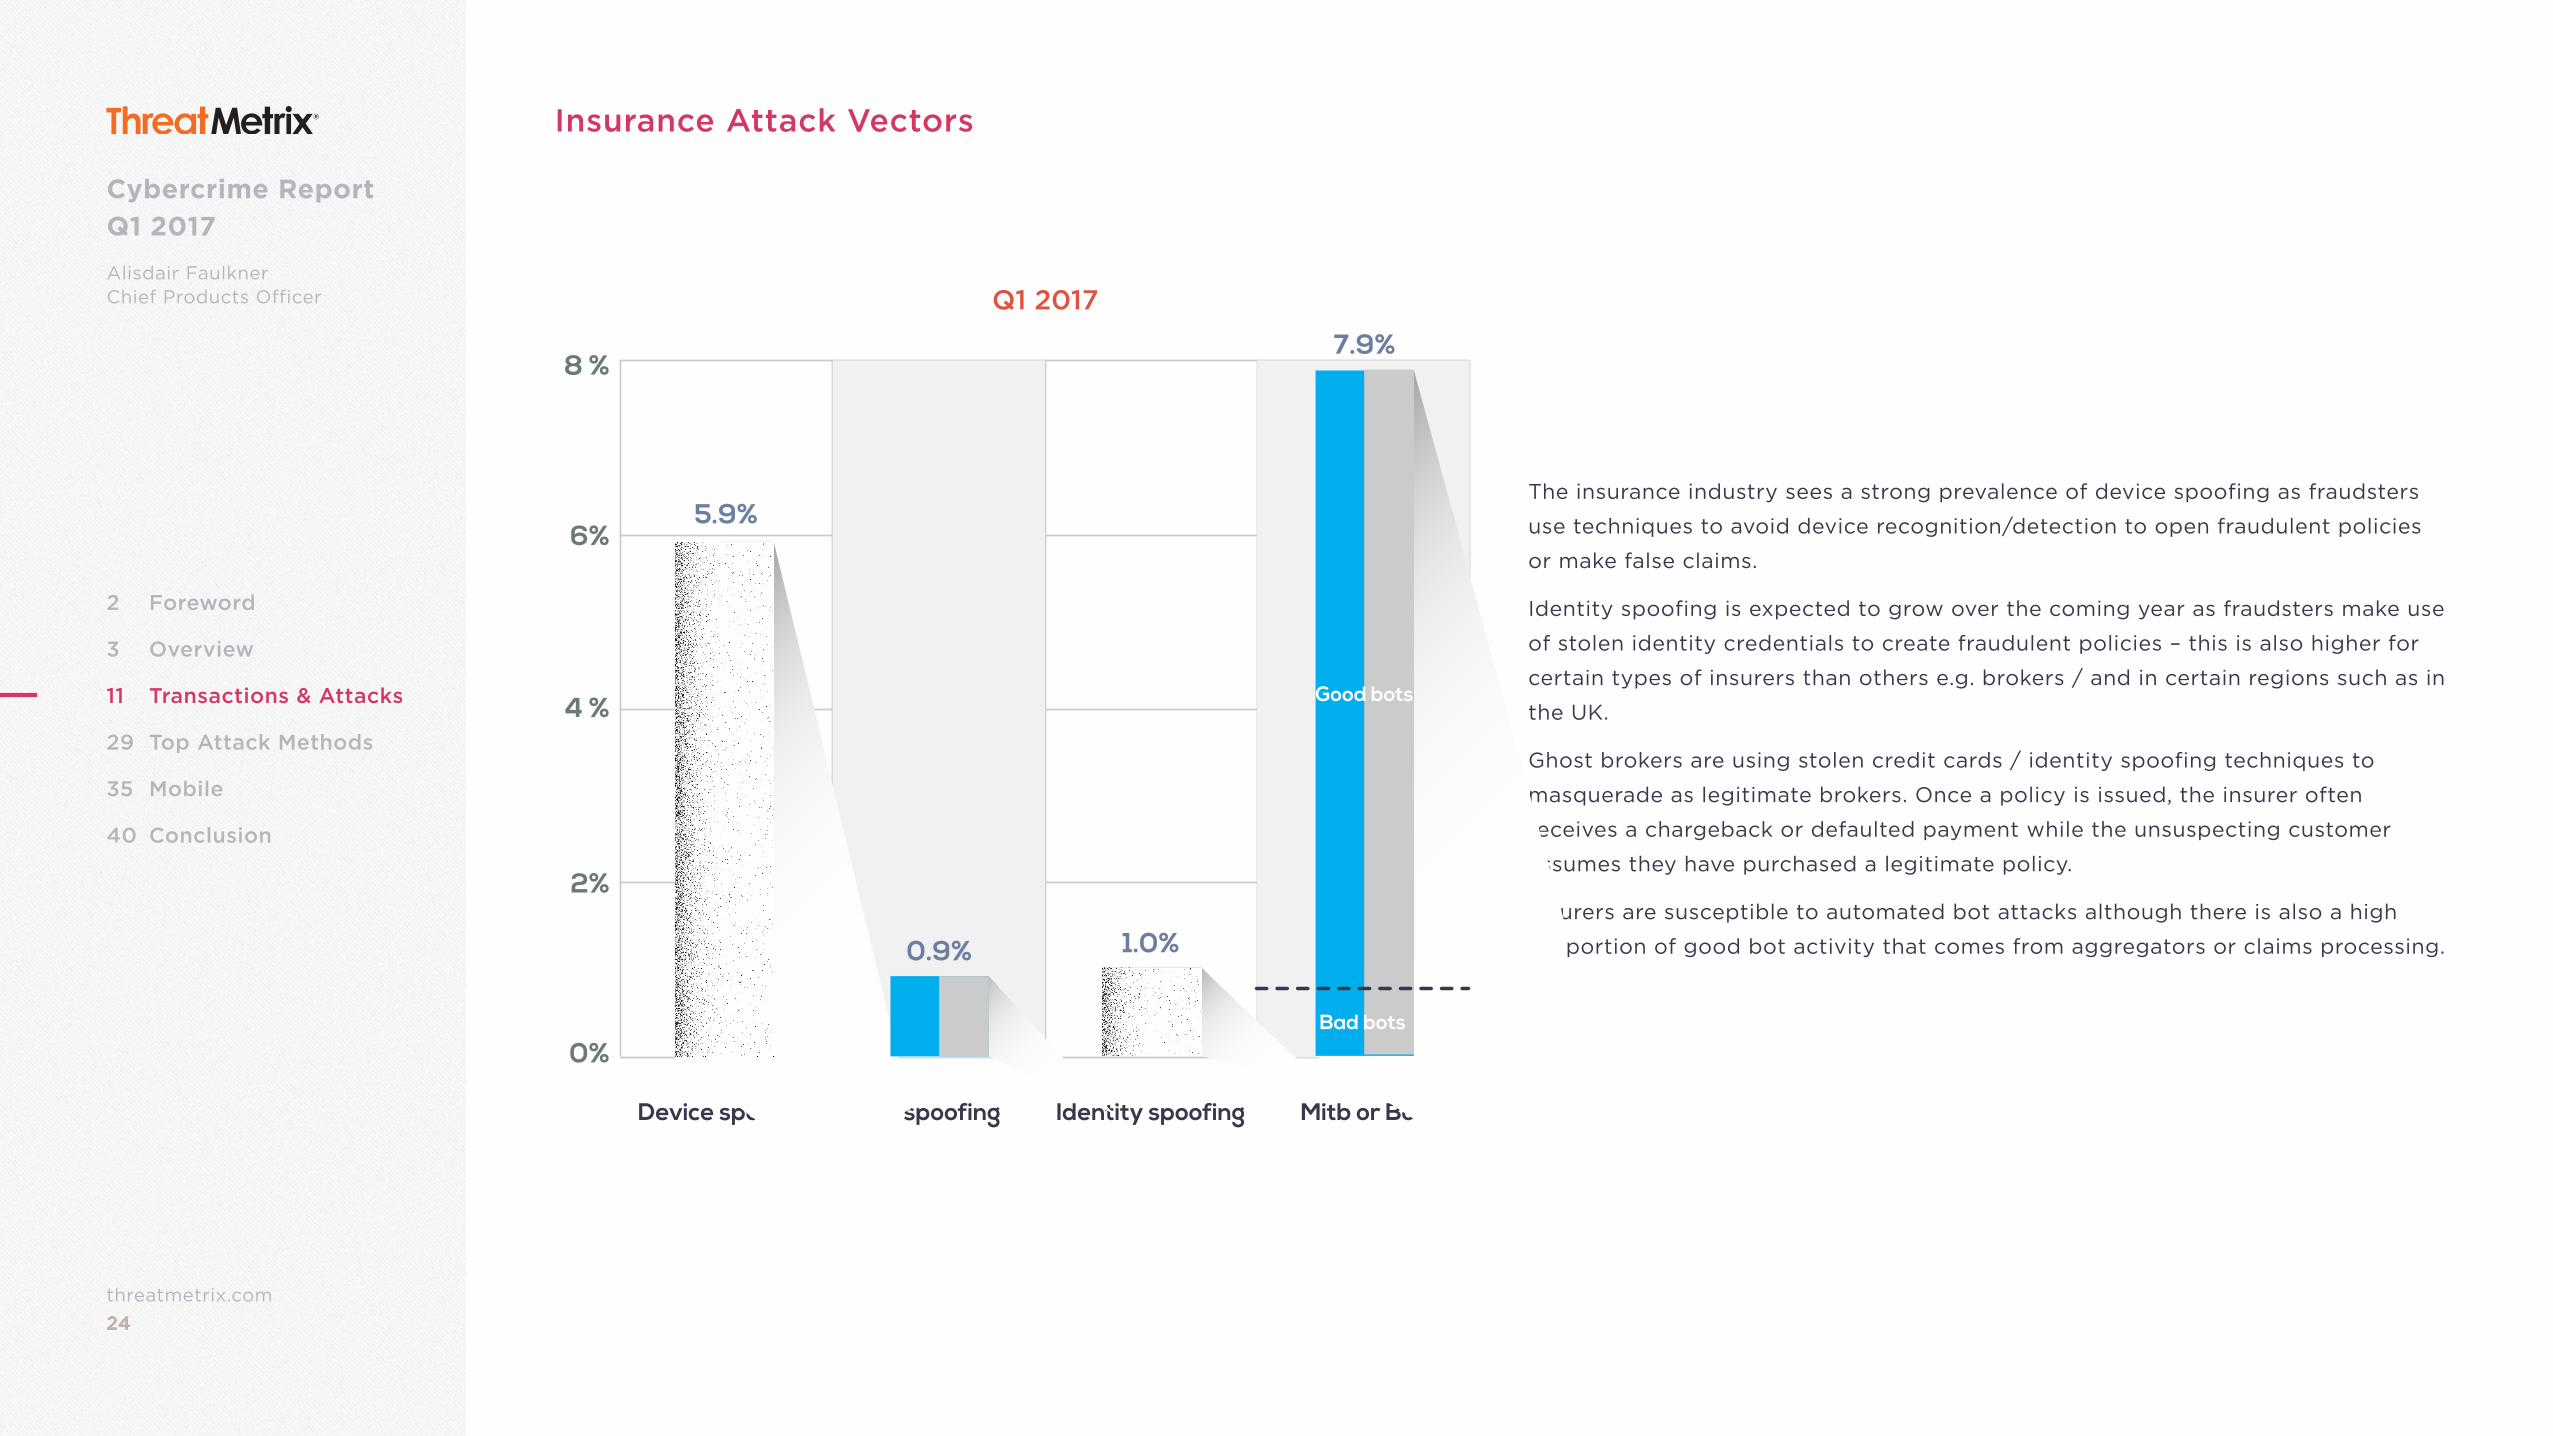
Insurance Attack Vectors
The insurance industry sees a strong prevalence of device spoofing as fraudsters
use techniques to avoid device recognition/detection to open fraudulent policies
or make false claims.
Identity spoofing is expected to grow over the coming year as fraudsters make use
of stolen identity credentials to create fraudulent policies – this is also higher for
certain types of insurers than others e.g. brokers / and in certain regions such as in
the UK.
Ghost brokers are using stolen credit cards / identity spoofing techniques to
masquerade as legitimate brokers. Once a policy is issued, the insurer often
receives a chargeback or defaulted payment while the unsuspecting customer
assumes they have purchased a legitimate policy.
Insurers are susceptible to automated bot attacks although there is also a high
proportion of good bot activity that comes from aggregators or claims processing.
Device spoofing IP spoofing Identity spoofing Mitb or Bot
0%
2%
8 %
4 %
6%5.9%
0.9% 1.0%
7.9%
Bad bots
Good bots
Q1 2017
25threatmetrix.com25
Cybercrime Report Q1 2017
Alisdair FaulknerChief Products Officer
2 Foreword
3 Overview
11 Transactions & Attacks
29 Top Attack Methods
35 Mobile
40 Conclusion
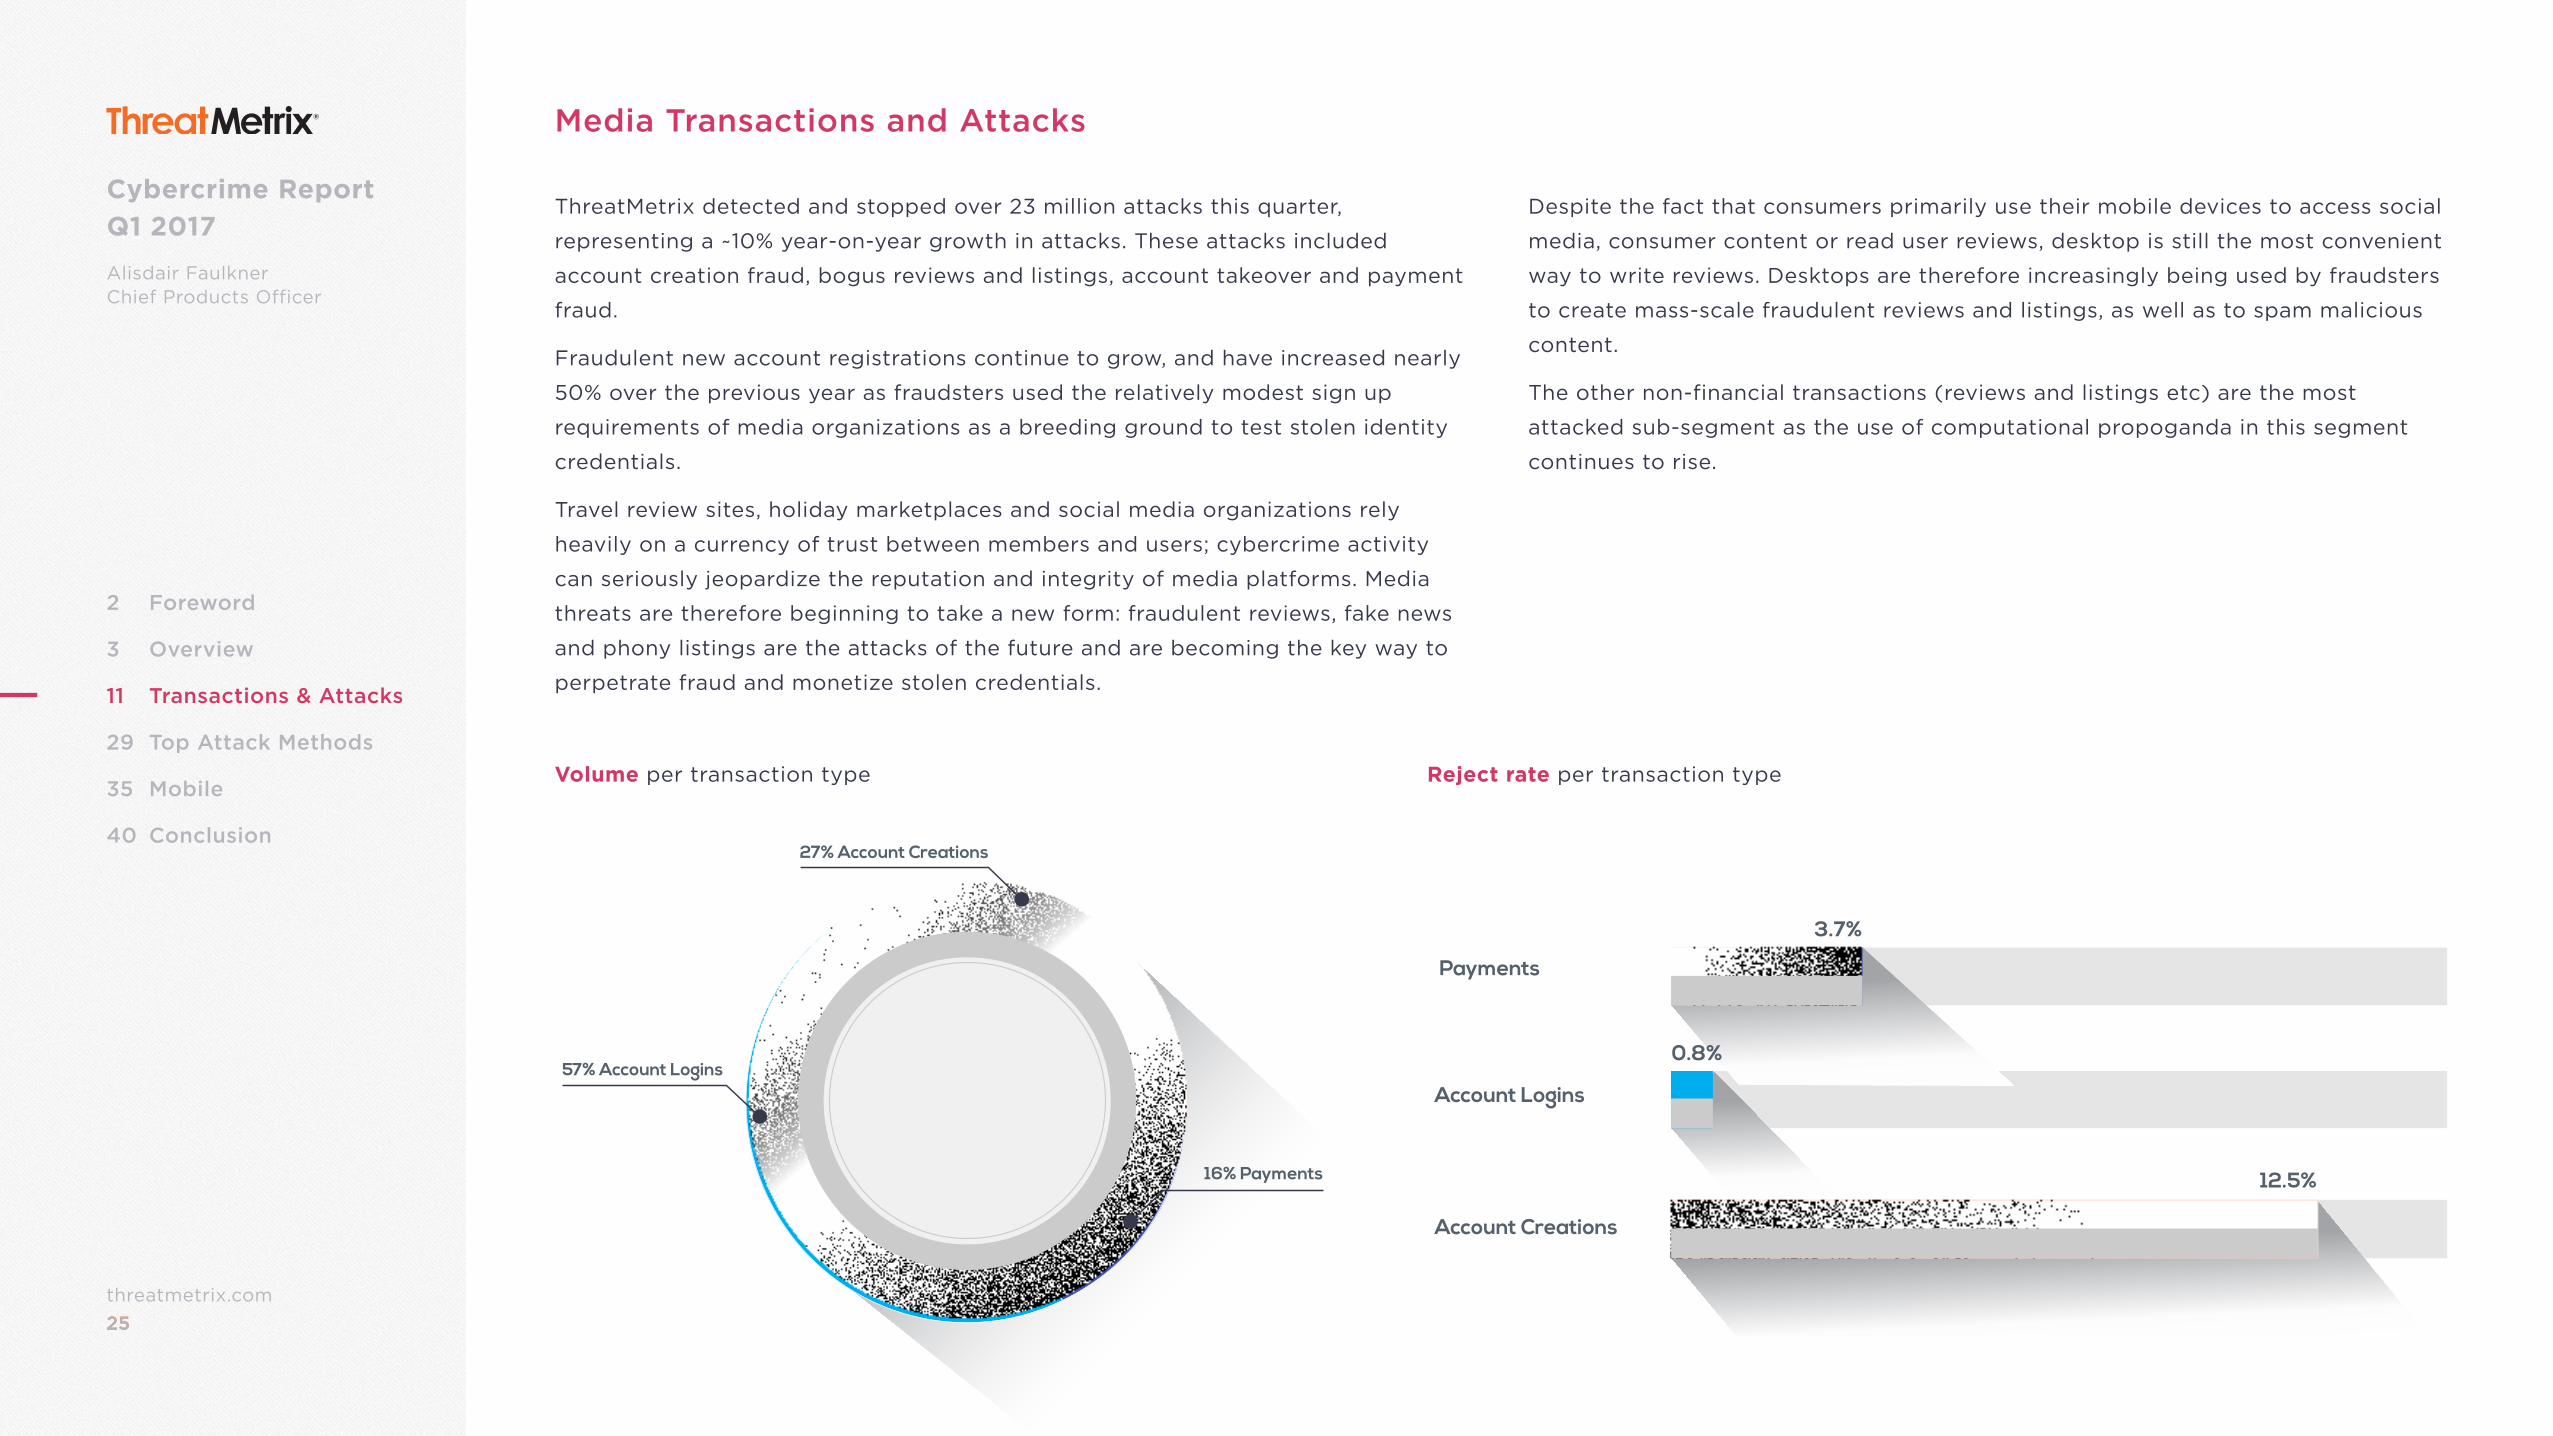
Media Transactions and Attacks
ThreatMetrix detected and stopped over 23 million attacks this quarter,
representing a ~10% year-on-year growth in attacks. These attacks included
account creation fraud, bogus reviews and listings, account takeover and payment
fraud.
Fraudulent new account registrations continue to grow, and have increased nearly
50% over the previous year as fraudsters used the relatively modest sign up
requirements of media organizations as a breeding ground to test stolen identity
credentials.
Travel review sites, holiday marketplaces and social media organizations rely
heavily on a currency of trust between members and users; cybercrime activity
can seriously jeopardize the reputation and integrity of media platforms. Media
threats are therefore beginning to take a new form: fraudulent reviews, fake news
and phony listings are the attacks of the future and are becoming the key way to
perpetrate fraud and monetize stolen credentials.
Despite the fact that consumers primarily use their mobile devices to access social
media, consumer content or read user reviews, desktop is still the most convenient
way to write reviews. Desktops are therefore increasingly being used by fraudsters
to create mass-scale fraudulent reviews and listings, as well as to spam malicious
content.
The other non-financial transactions (reviews and listings etc) are the most
attacked sub-segment as the use of computational propoganda in this segment
continues to rise.
Volume per transaction type Reject rate per transaction type
3.7%
0.8%
12.5%
Payments
Account Logins
Account Creations
27% Account Creations
16% Payments
57% Account Logins
26threatmetrix.com26
Cybercrime Report Q1 2017
Alisdair FaulknerChief Products Officer
2 Foreword
3 Overview
11 Transactions & Attacks
29 Top Attack Methods
35 Mobile
40 Conclusion
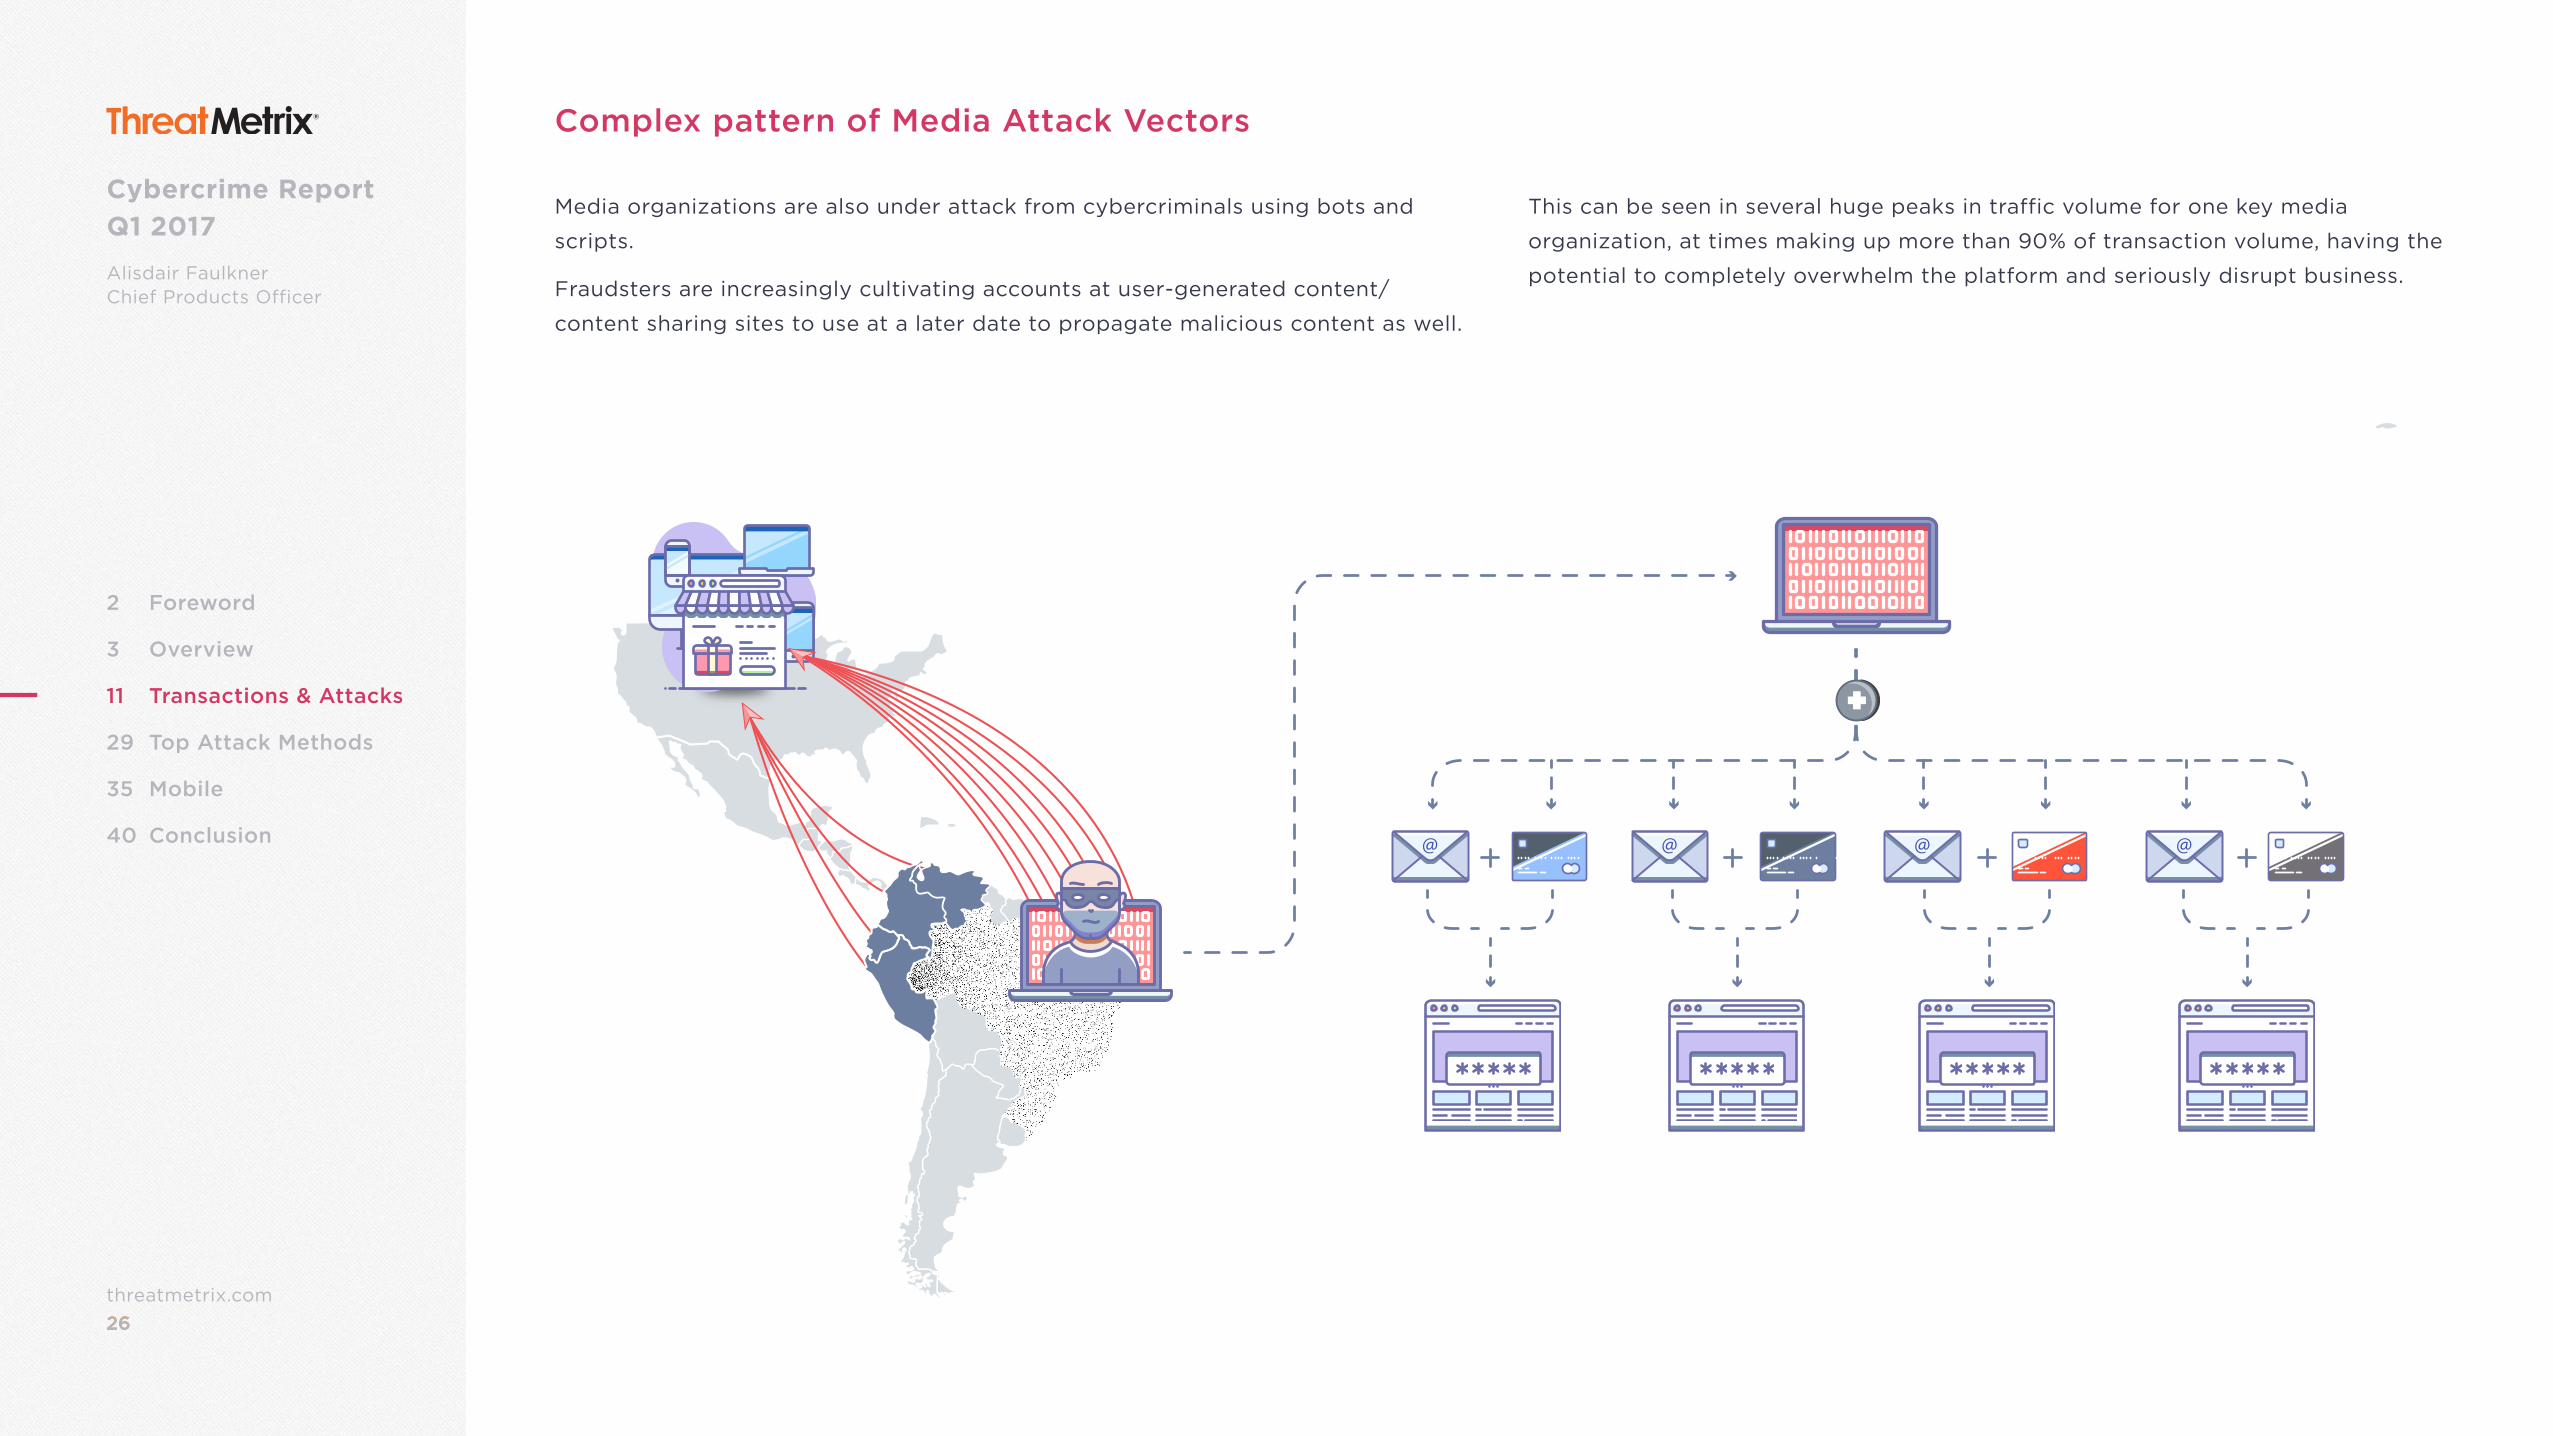
Complex pattern of Media Attack Vectors
Media organizations are also under attack from cybercriminals using bots and
scripts.
Fraudsters are increasingly cultivating accounts at user-generated content/
content sharing sites to use at a later date to propagate malicious content as well.
This can be seen in several huge peaks in traffic volume for one key media
organization, at times making up more than 90% of transaction volume, having the
potential to completely overwhelm the platform and seriously disrupt business.
27threatmetrix.com27
Cybercrime Report Q1 2017
Alisdair FaulknerChief Products Officer
2 Foreword
3 Overview
11 Transactions & Attacks
29 Top Attack Methods
35 Mobile
40 Conclusion
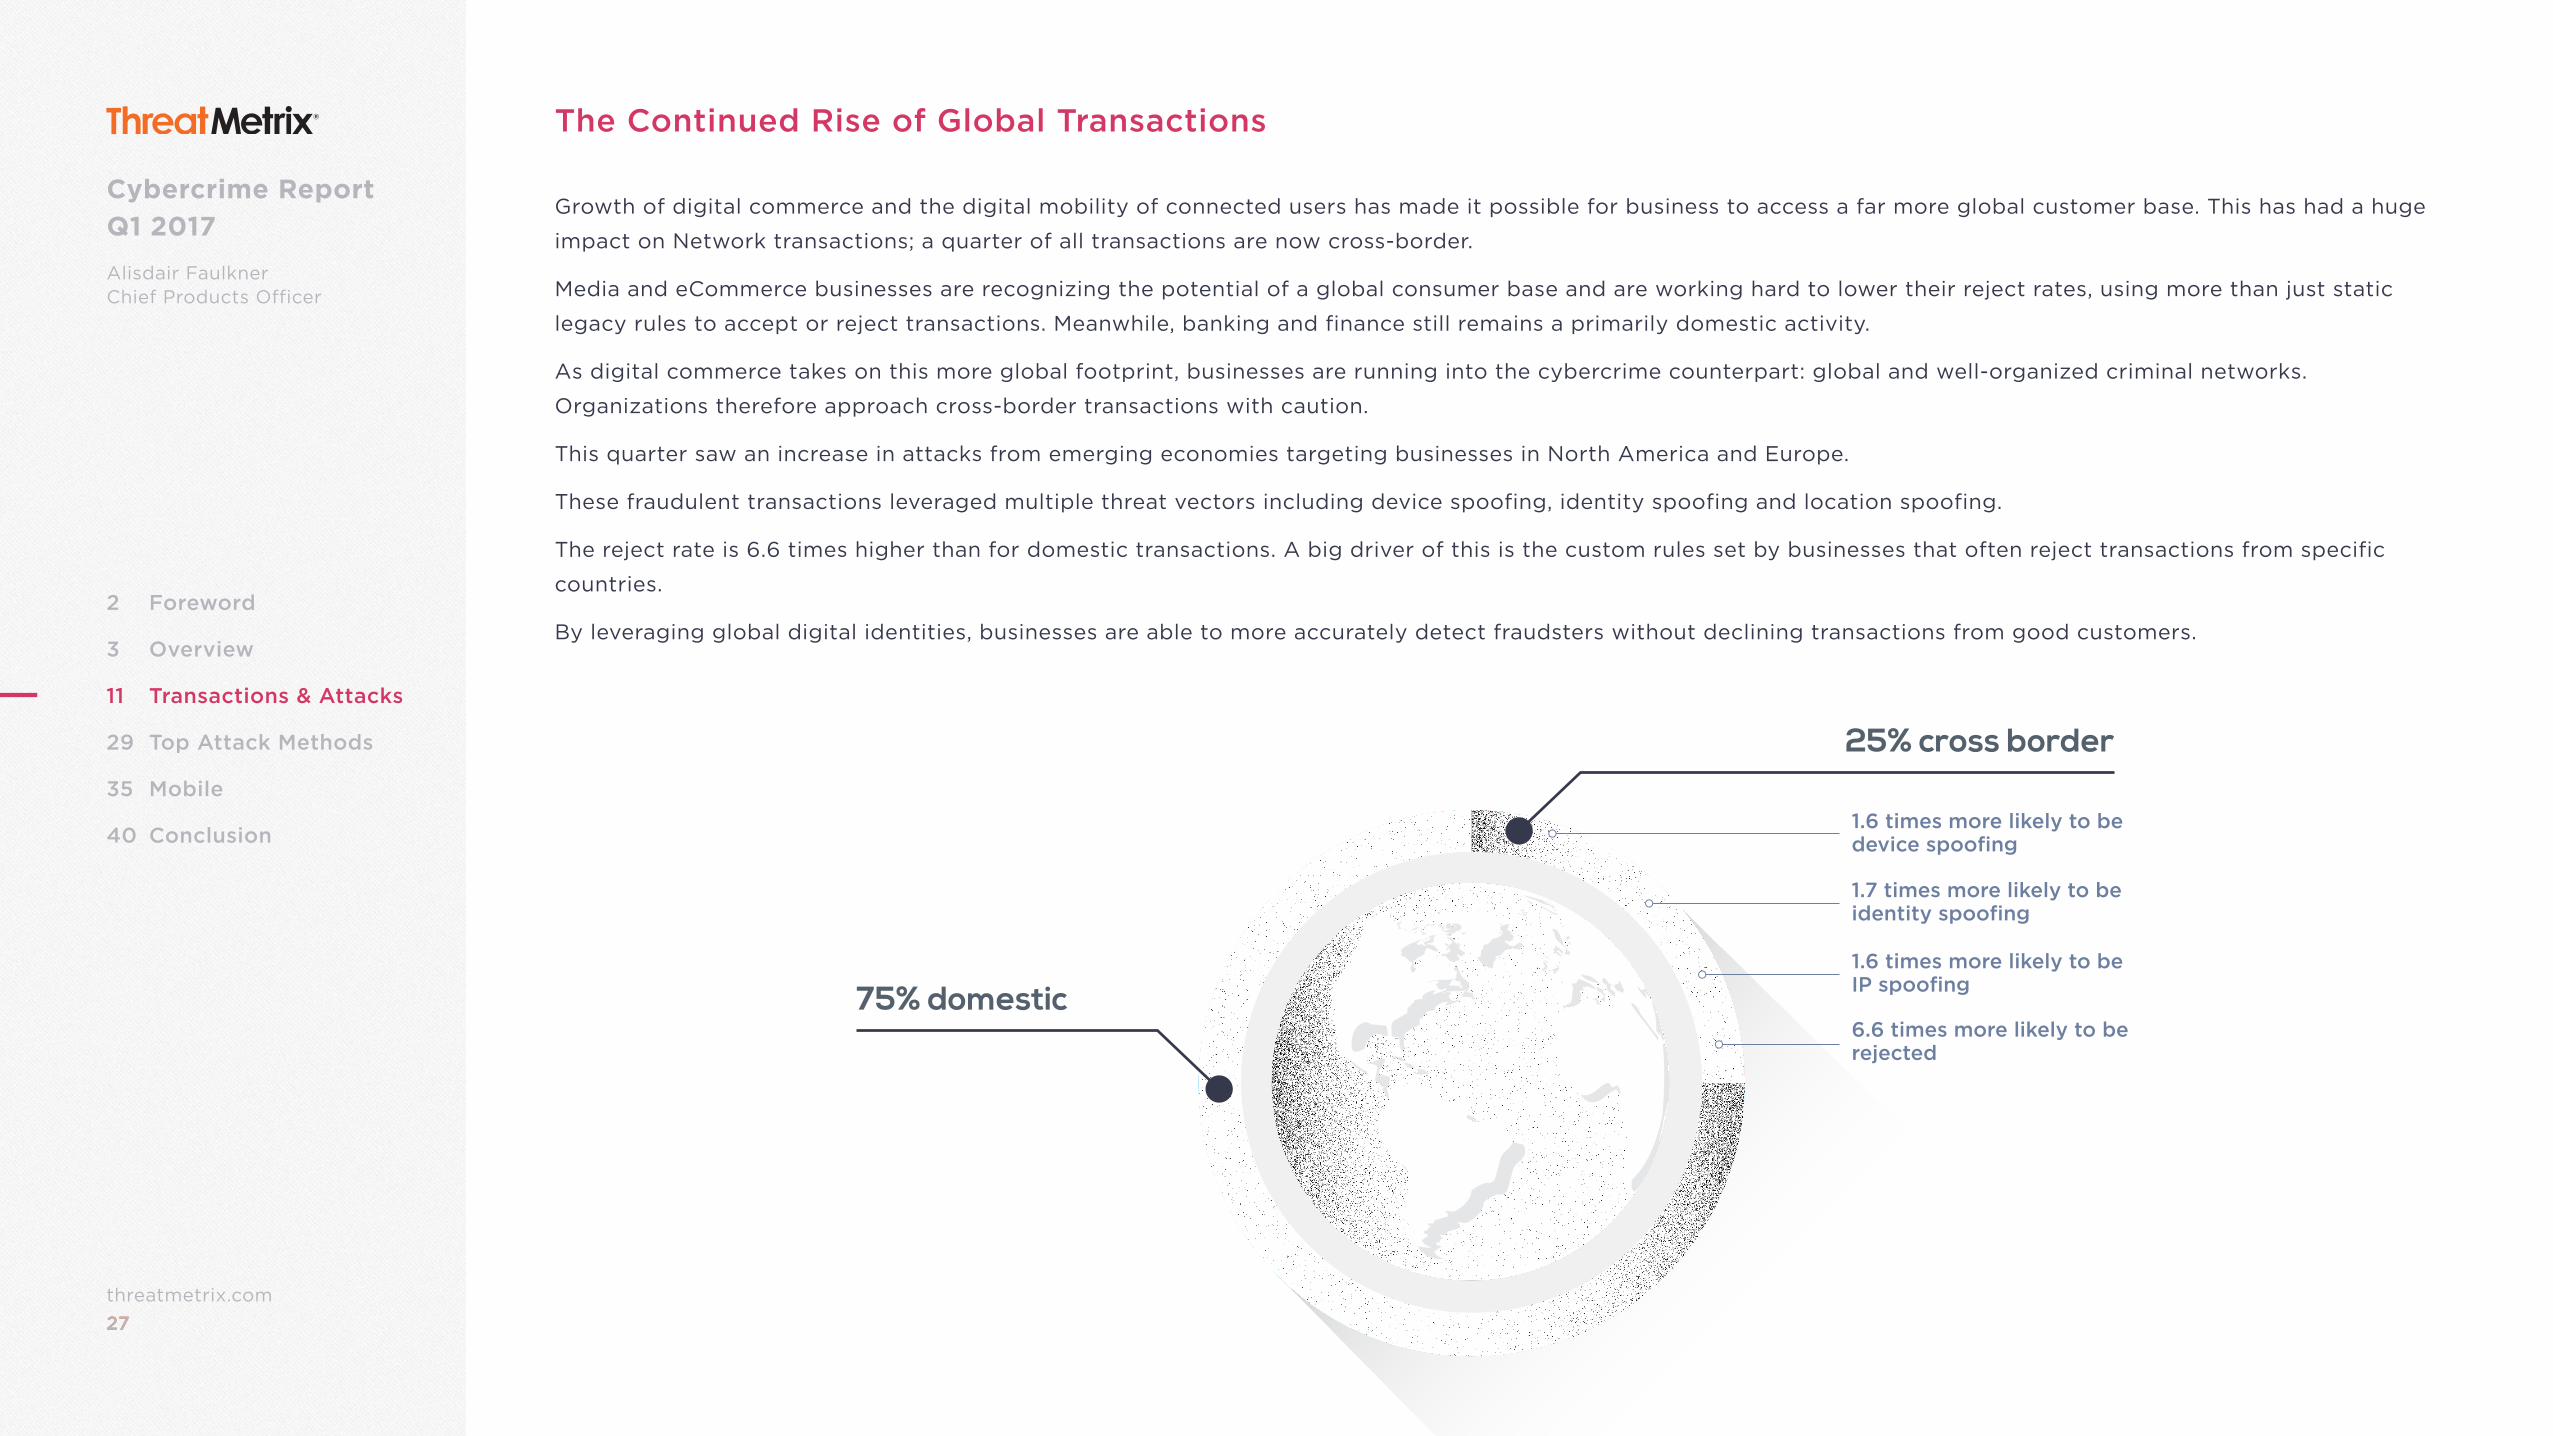
The Continued Rise of Global Transactions
Growth of digital commerce and the digital mobility of connected users has made it possible for business to access a far more global customer base. This has had a huge
impact on Network transactions; a quarter of all transactions are now cross-border.
Media and eCommerce businesses are recognizing the potential of a global consumer base and are working hard to lower their reject rates, using more than just static
legacy rules to accept or reject transactions. Meanwhile, banking and finance still remains a primarily domestic activity.
As digital commerce takes on this more global footprint, businesses are running into the cybercrime counterpart: global and well-organized criminal networks.
Organizations therefore approach cross-border transactions with caution.
This quarter saw an increase in attacks from emerging economies targeting businesses in North America and Europe.
These fraudulent transactions leveraged multiple threat vectors including device spoofing, identity spoofing and location spoofing.
The reject rate is 6.6 times higher than for domestic transactions. A big driver of this is the custom rules set by businesses that often reject transactions from specific
countries.
By leveraging global digital identities, businesses are able to more accurately detect fraudsters without declining transactions from good customers.
1.6 times more likely to be device spoofing
1.7 times more likely to be identity spoofing
1.6 times more likely to be IP spoofing
6.6 times more likely to be rejected
25% cross border
75% domestic
28threatmetrix.com28
Cybercrime Report Q1 2017
Alisdair FaulknerChief Products Officer
2 Foreword
3 Overview
11 Transactions & Attacks
29 Top Attack Methods
35 Mobile
40 Conclusion
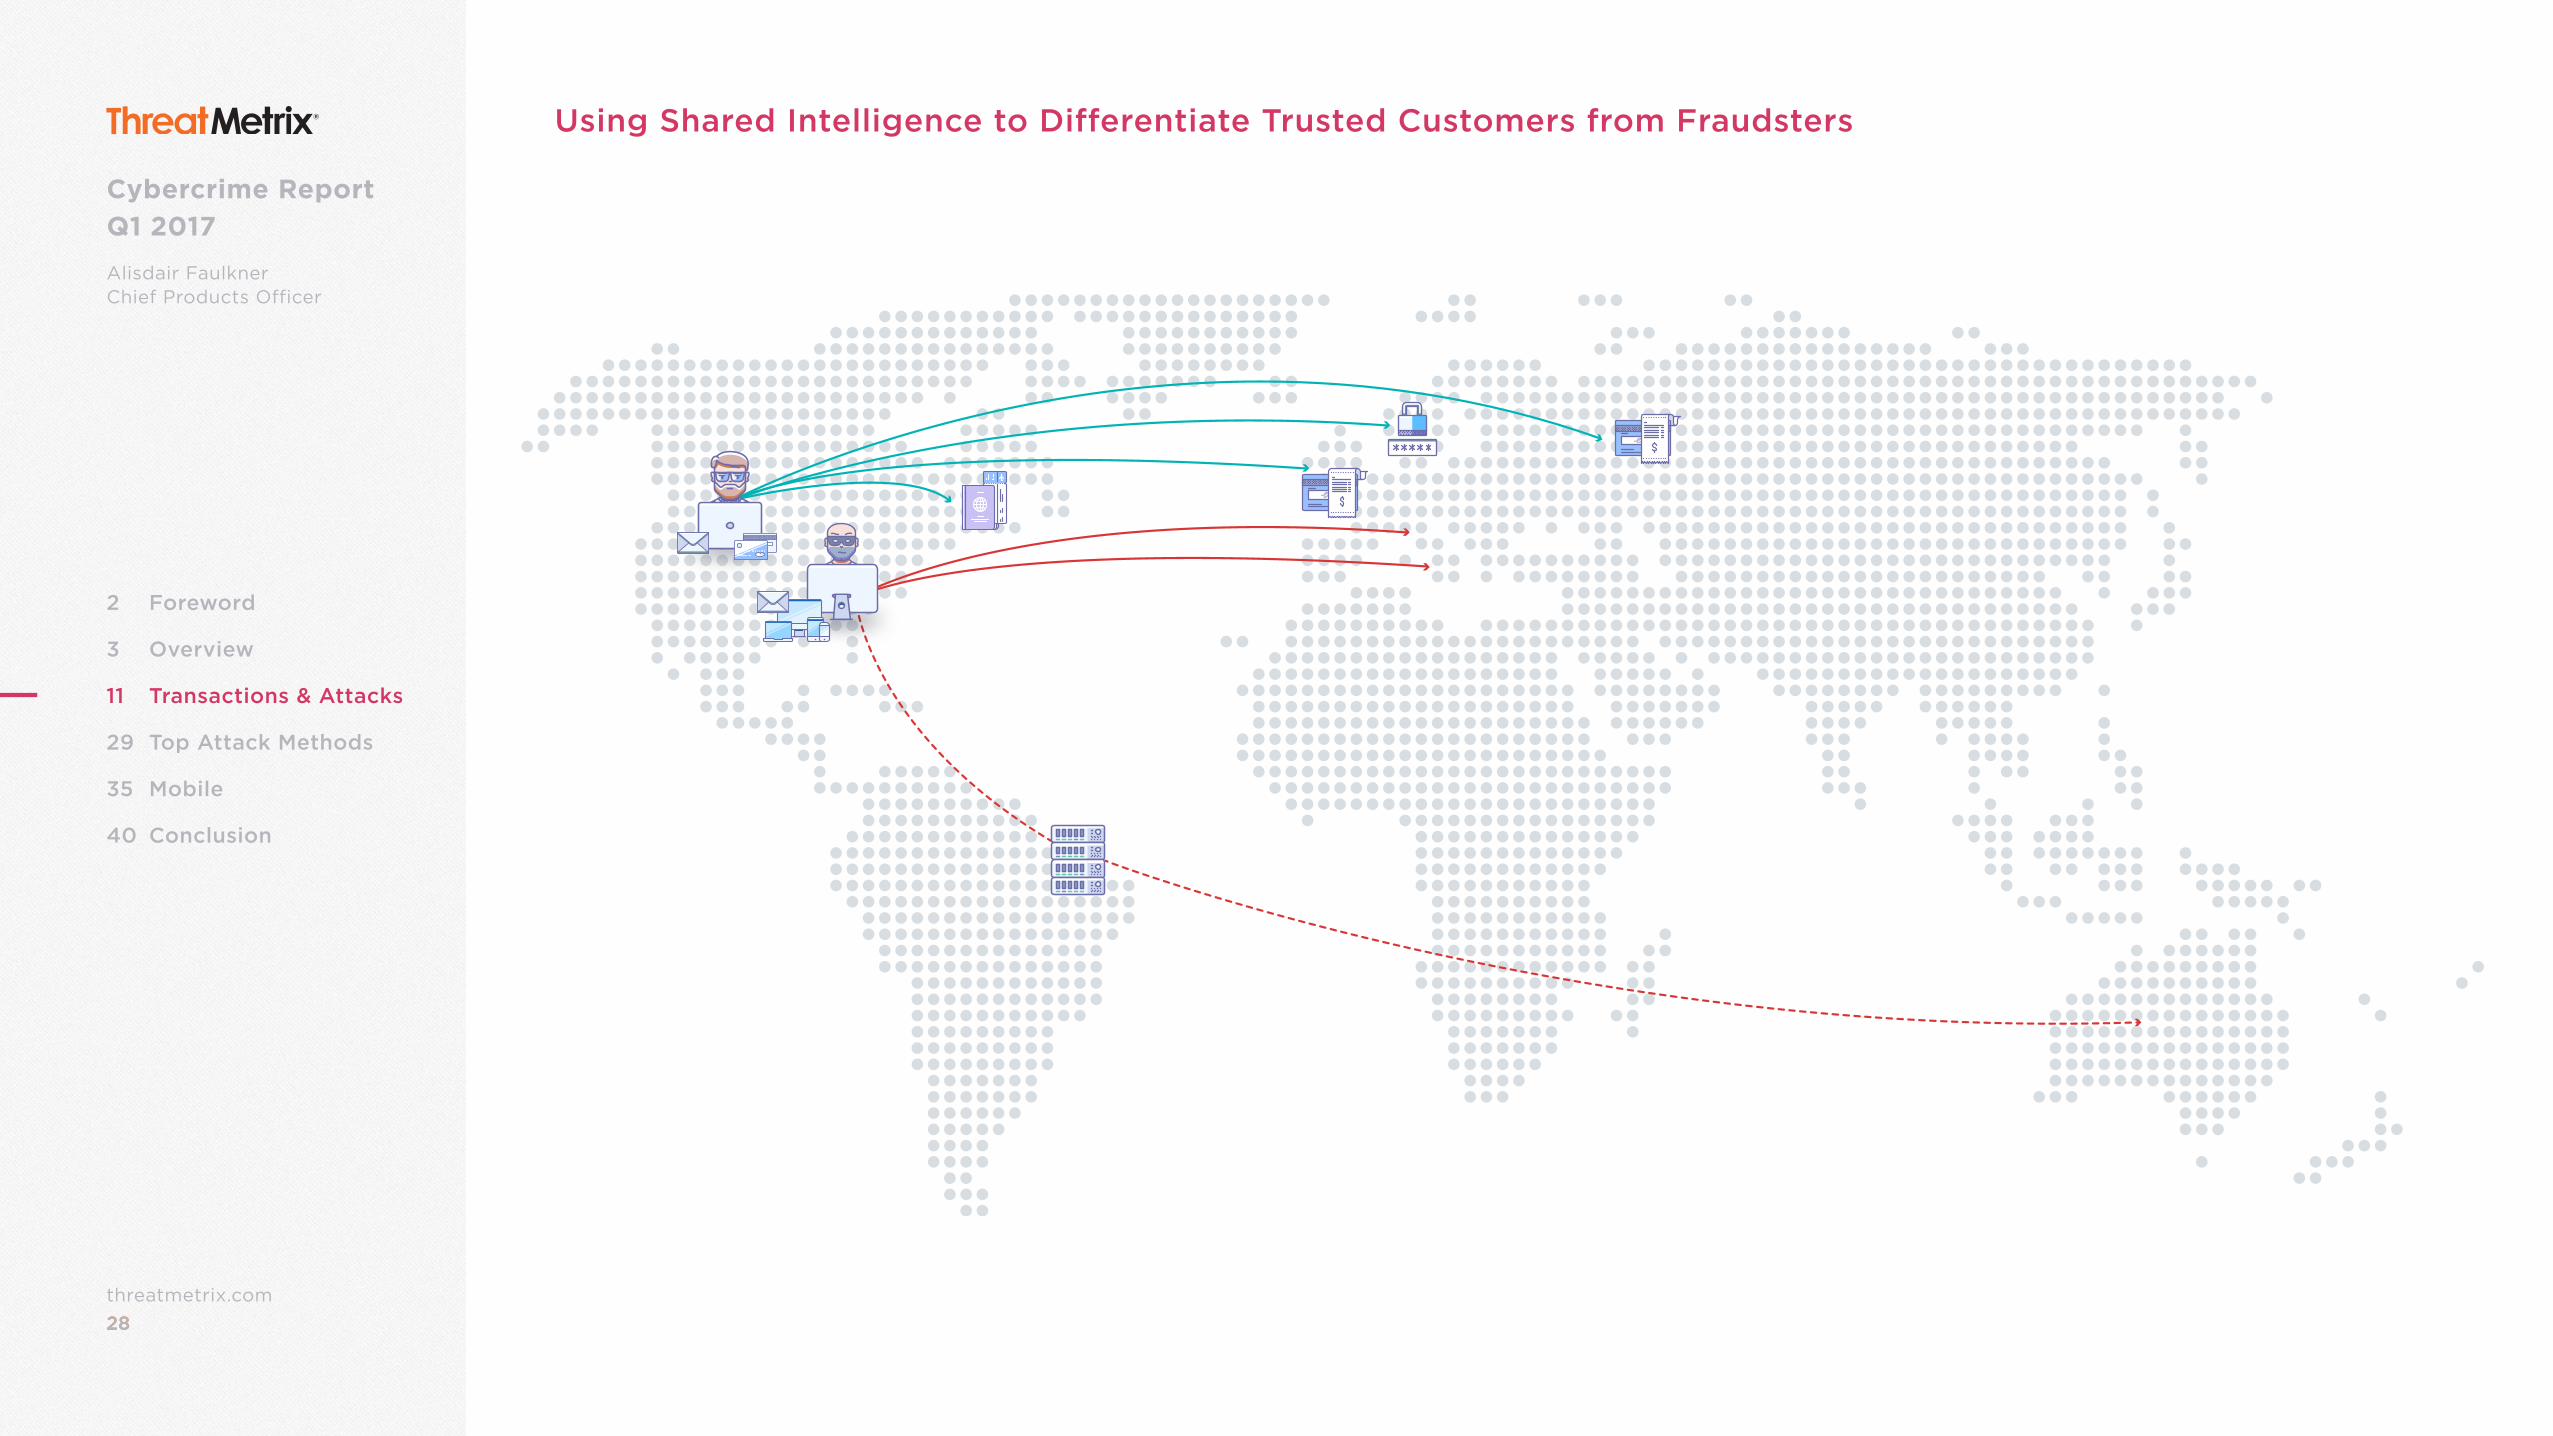
Using Shared Intelligence to Differentiate Trusted Customers from Fraudsters
29threatmetrix.com29
Cybercrime Report Q1 2017Alisdair FaulknerChief Products Officer
2 Foreword
3 Overview
11 Transactions & Attacks
29 Top Attack Methods
35 Mobile
40 Conclusion
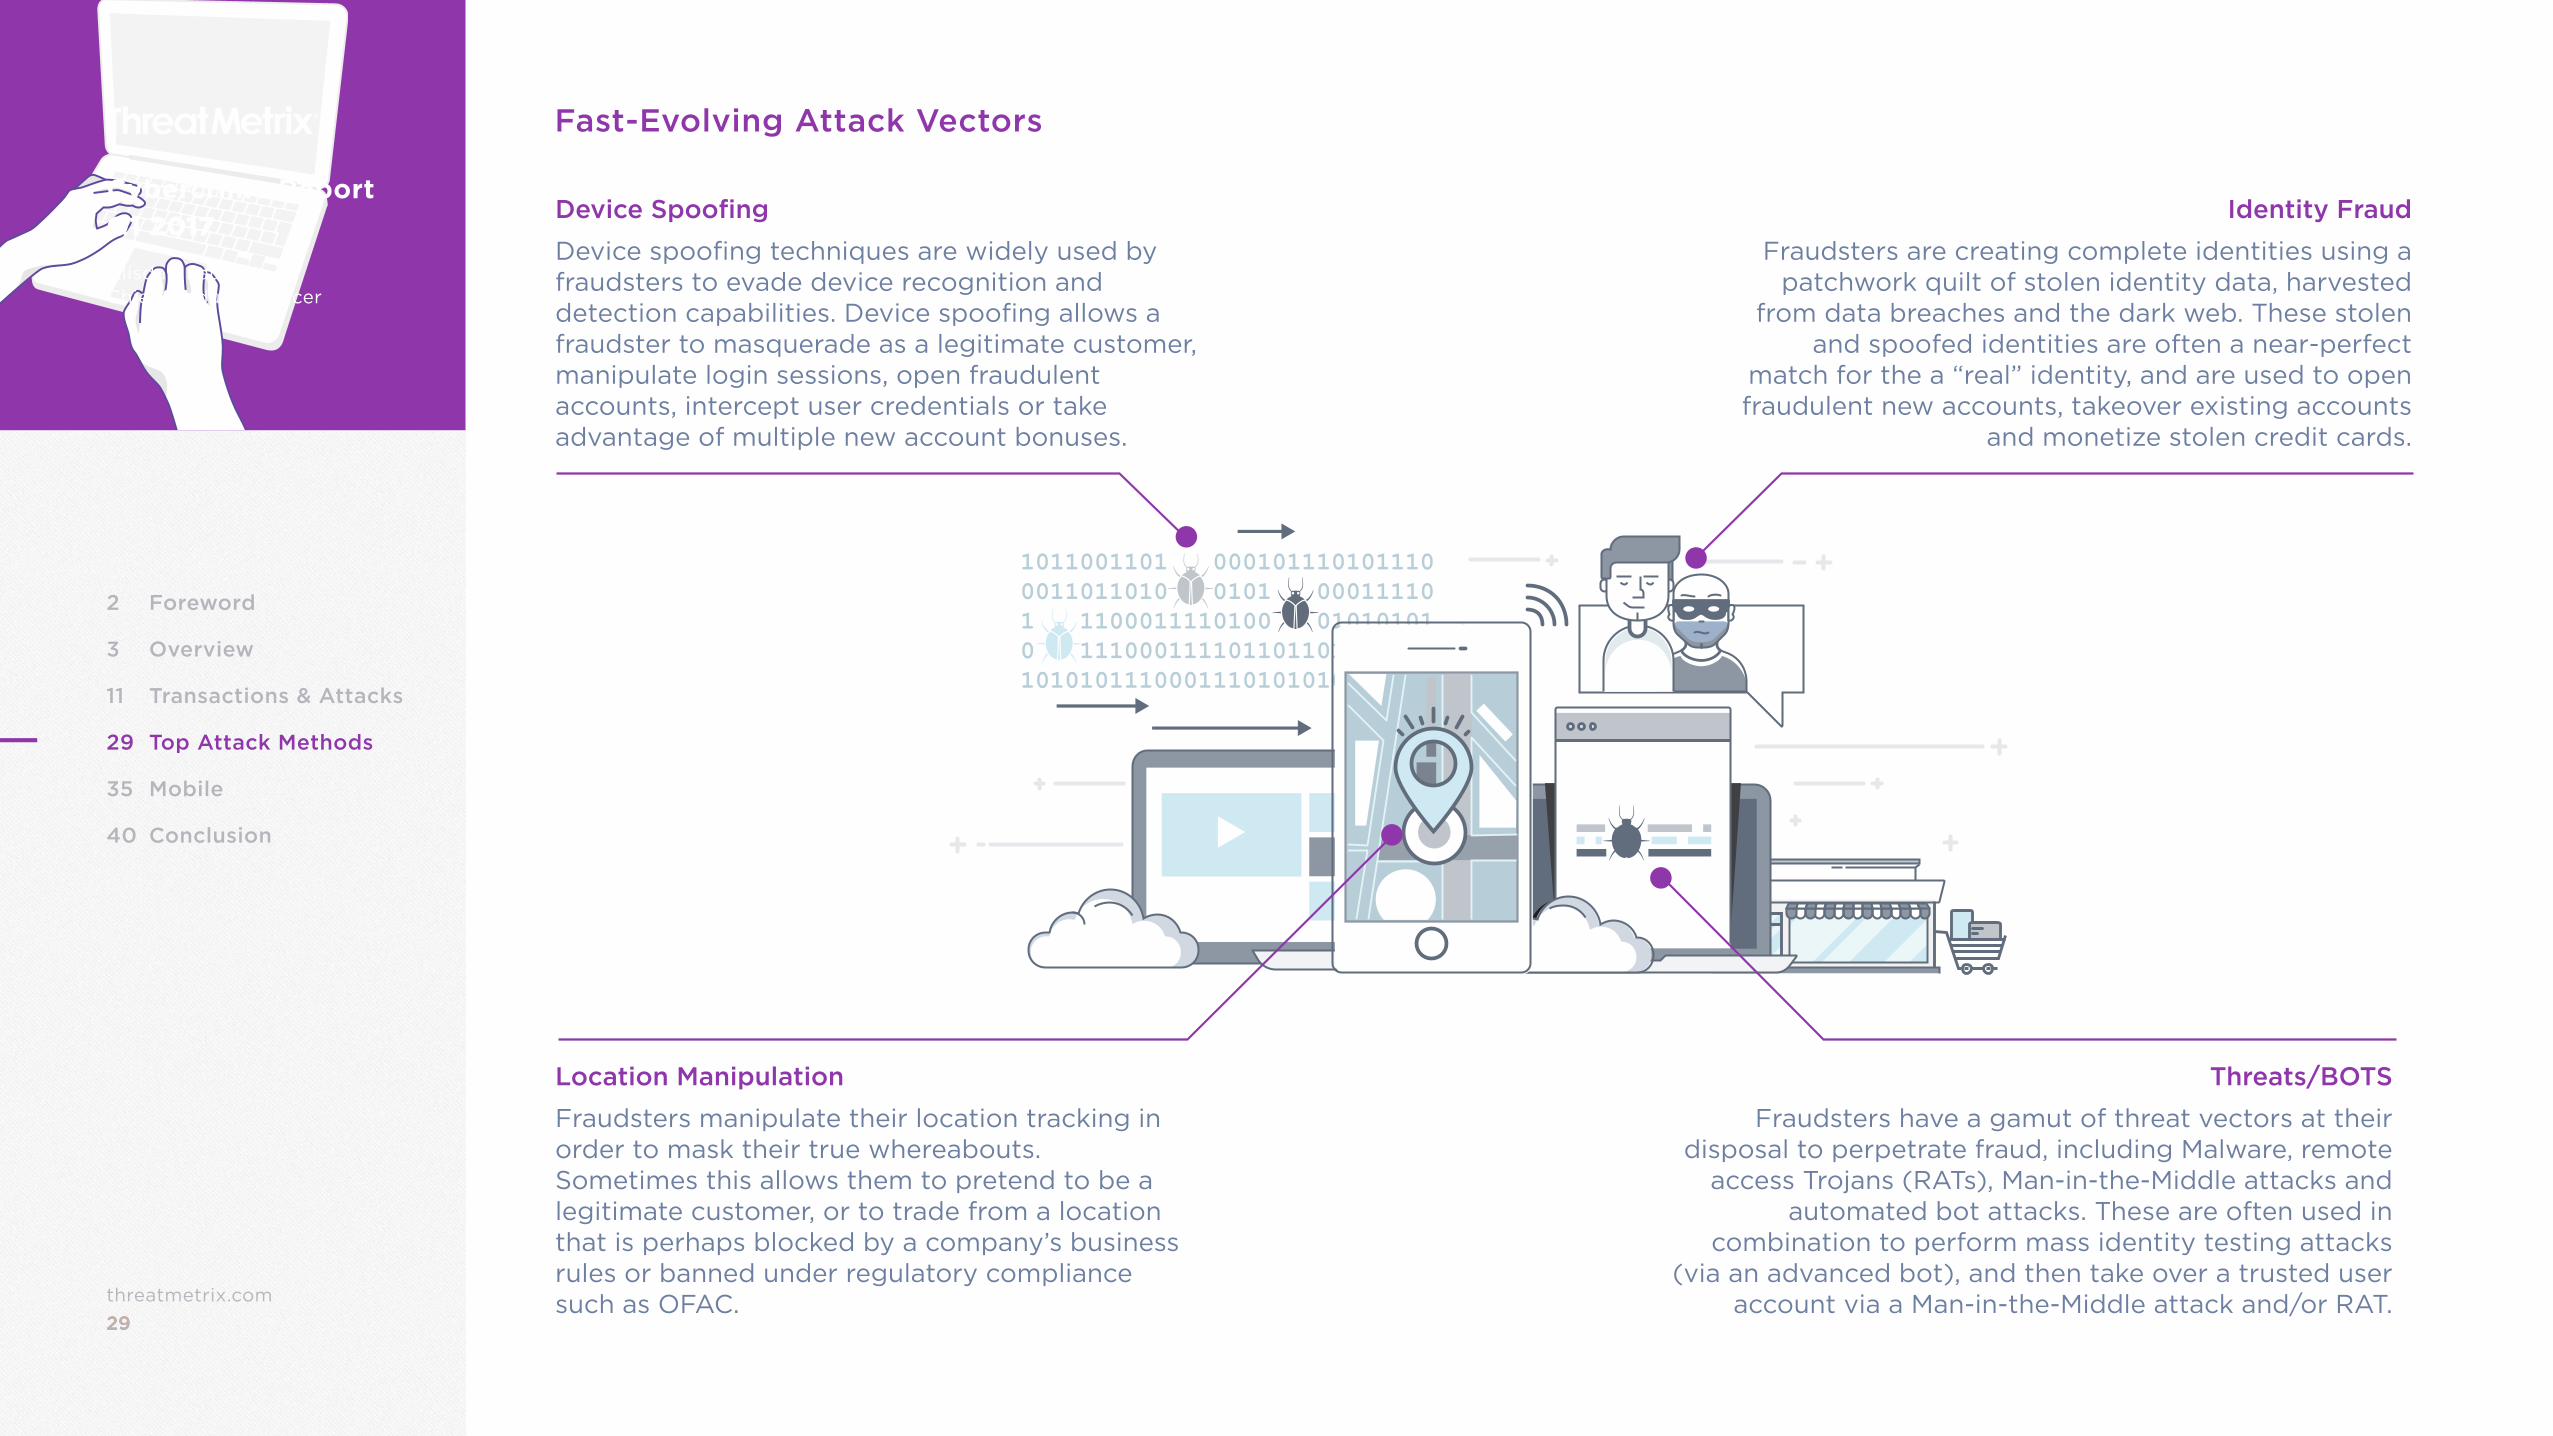
Fast-Evolving Attack Vectors
Device Spoofing
Device spoofing techniques are widely used by fraudsters to evade device recognition and detection capabilities. Device spoofing allows a fraudster to masquerade as a legitimate customer, manipulate login sessions, open fraudulent accounts, intercept user credentials or take advantage of multiple new account bonuses.
Location Manipulation
Fraudsters manipulate their location tracking in order to mask their true whereabouts. Sometimes this allows them to pretend to be a legitimate customer, or to trade from a location that is perhaps blocked by a company’s business rules or banned under regulatory compliance such as OFAC.
Threats/BOTS
Fraudsters have a gamut of threat vectors at their disposal to perpetrate fraud, including Malware, remote
access Trojans (RATs), Man-in-the-Middle attacks and automated bot attacks. These are often used in
combination to perform mass identity testing attacks (via an advanced bot), and then take over a trusted user
account via a Man-in-the-Middle attack and/or RAT.
Identity Fraud
Fraudsters are creating complete identities using a patchwork quilt of stolen identity data, harvested
from data breaches and the dark web. These stolen and spoofed identities are often a near-perfect
match for the a “real” identity, and are used to open fraudulent new accounts, takeover existing accounts
and monetize stolen credit cards.
30threatmetrix.com30
Cybercrime Report Q1 2017
Alisdair FaulknerChief Products Officer
2 Foreword
3 Overview
11 Transactions & Attacks
29 Top Attack Methods
35 Mobile
40 Conclusion
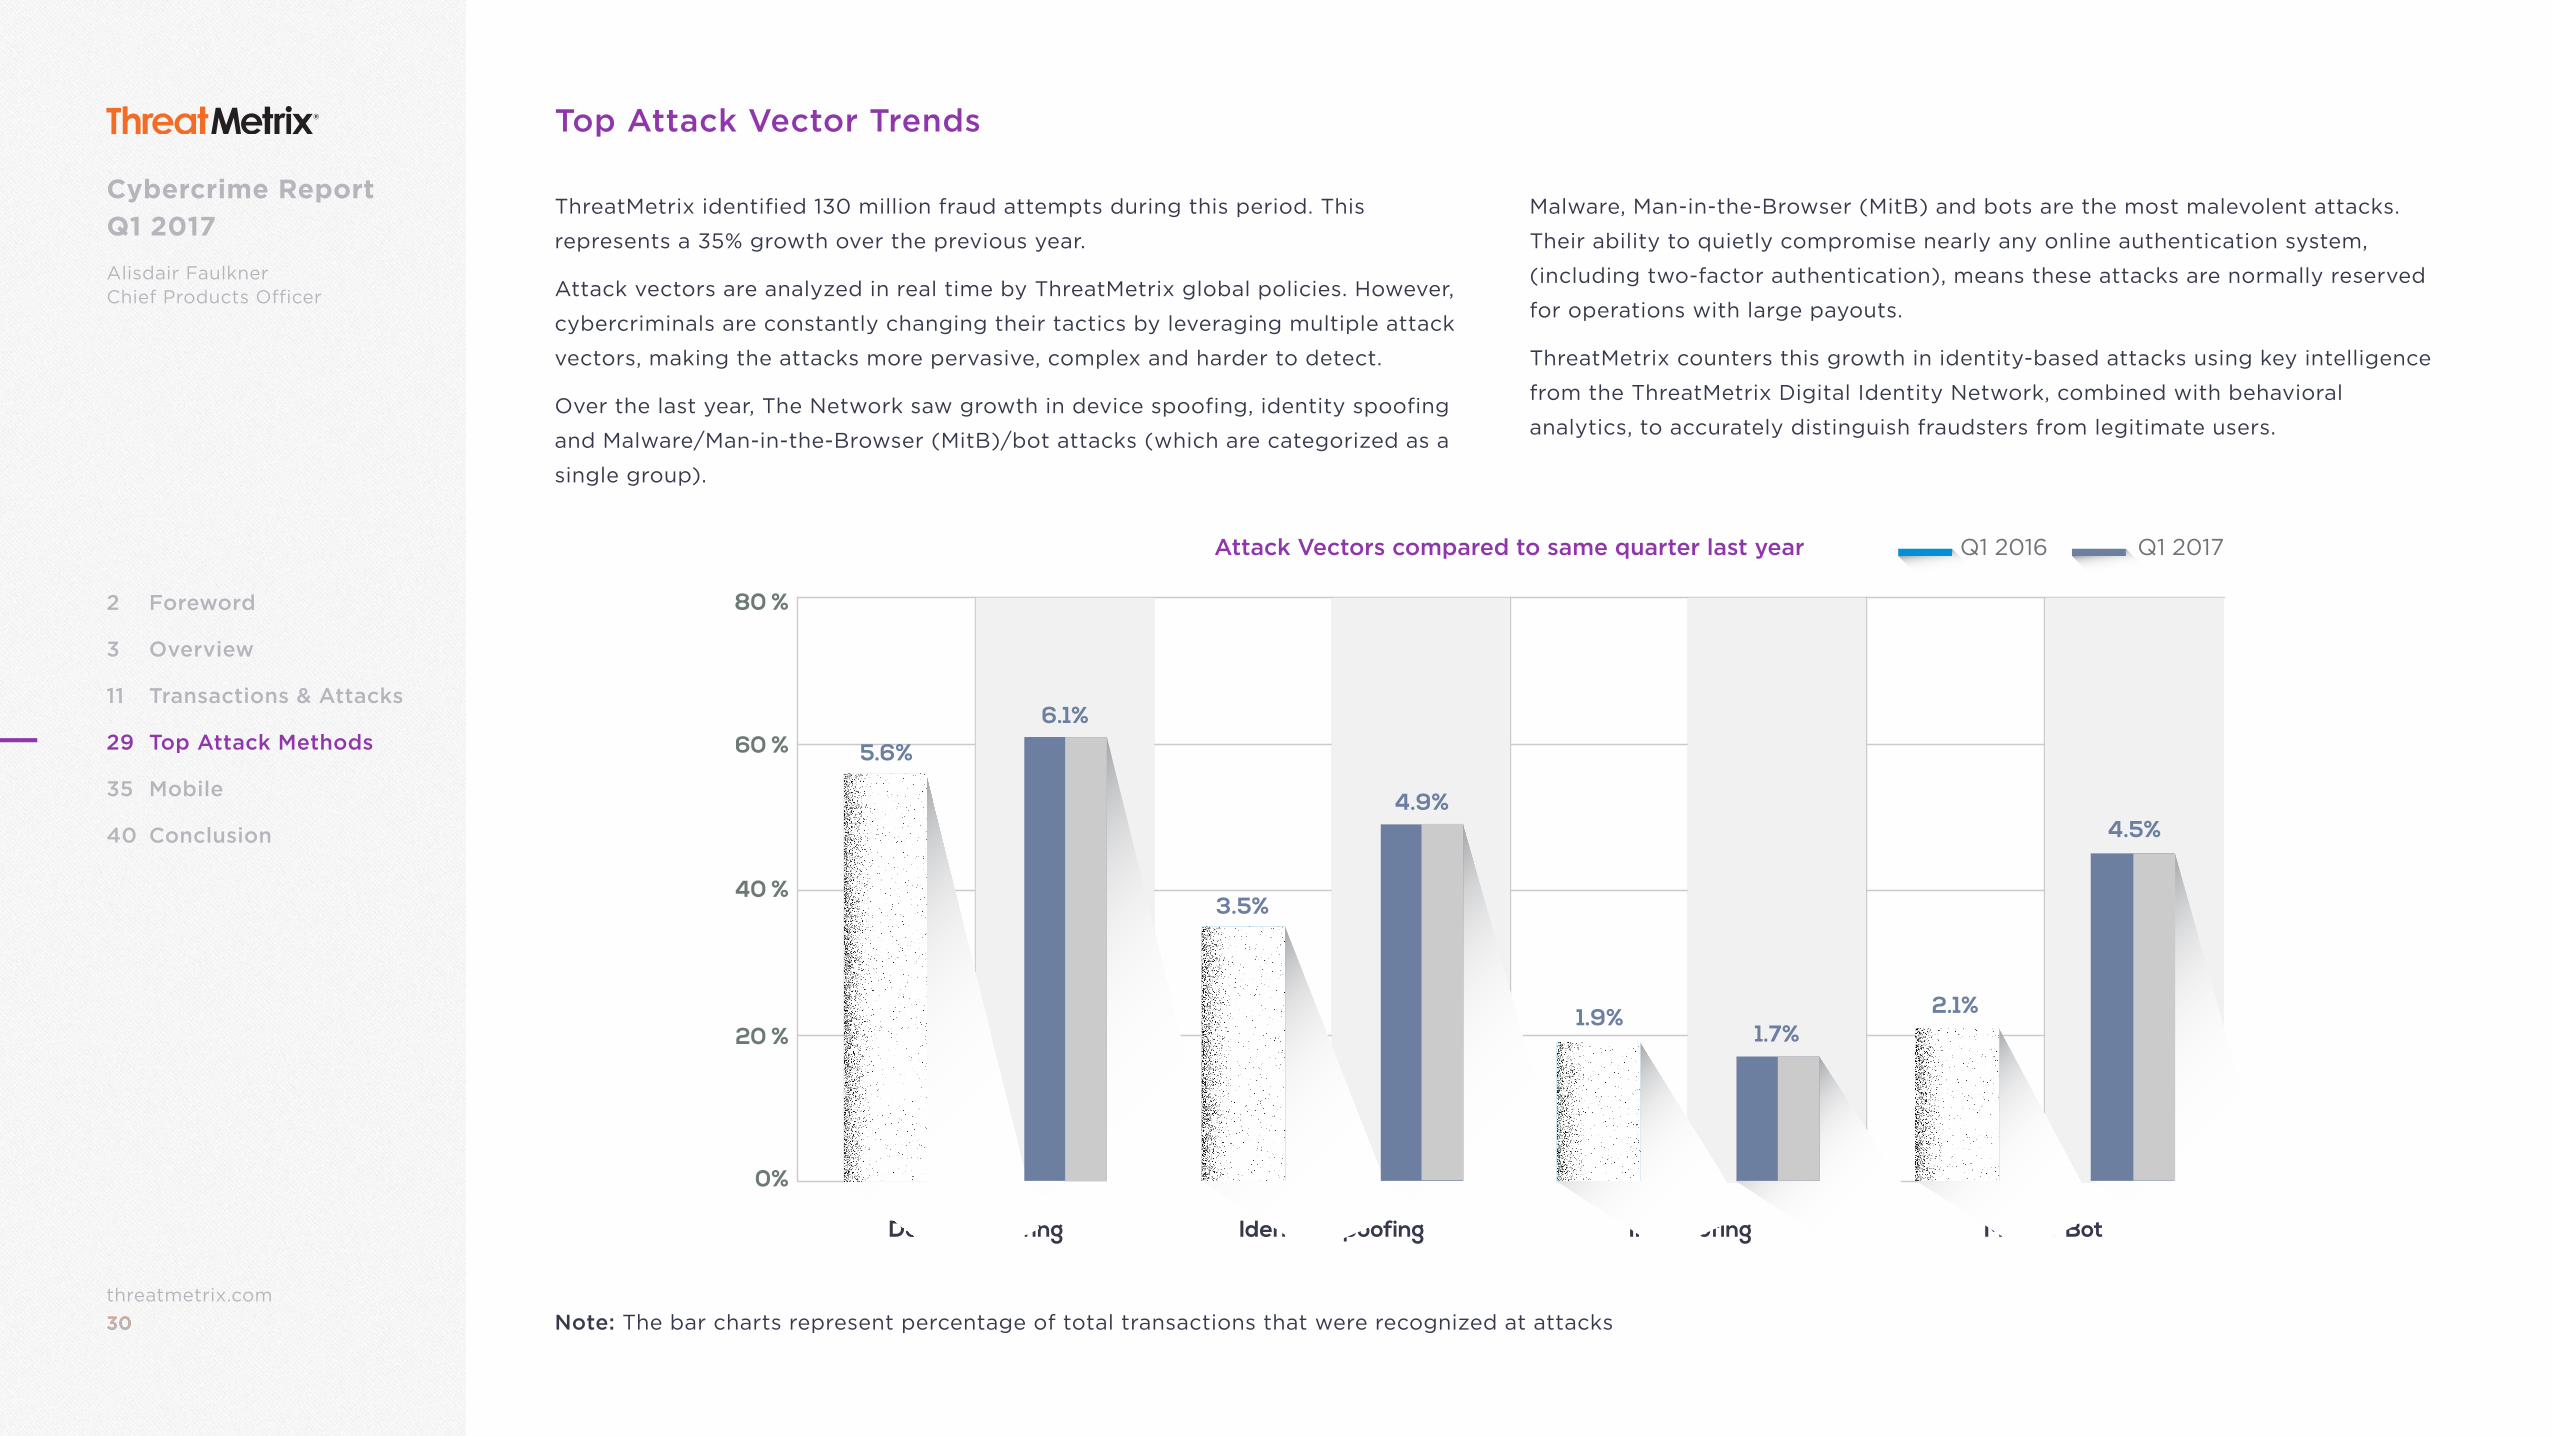
Top Attack Vector Trends
ThreatMetrix identified 130 million fraud attempts during this period. This
represents a 35% growth over the previous year.
Attack vectors are analyzed in real time by ThreatMetrix global policies. However,
cybercriminals are constantly changing their tactics by leveraging multiple attack
vectors, making the attacks more pervasive, complex and harder to detect.
Over the last year, The Network saw growth in device spoofing, identity spoofing
and Malware/Man-in-the-Browser (MitB)/bot attacks (which are categorized as a
single group).
Note: The bar charts represent percentage of total transactions that were recognized at attacks
Malware, Man-in-the-Browser (MitB) and bots are the most malevolent attacks.
Their ability to quietly compromise nearly any online authentication system,
(including two-factor authentication), means these attacks are normally reserved
for operations with large payouts.
ThreatMetrix counters this growth in identity-based attacks using key intelligence
from the ThreatMetrix Digital Identity Network, combined with behavioral
analytics, to accurately distinguish fraudsters from legitimate users.
Device Spoofing Identity Spoofing IP Spoofing Mitb or Bot
0%
20 %
80 %
40 %
60 % 5.6%
6.1%
3.5%
4.9%
1.9%1.7%
2.1%
4.5%
Attack Vectors compared to same quarter last year Q1 2016 Q1 2017
31threatmetrix.com31
Cybercrime Report Q1 2017
Alisdair FaulknerChief Products Officer
2 Foreword
3 Overview
11 Transactions & Attacks
29 Top Attack Methods
35 Mobile
40 Conclusion
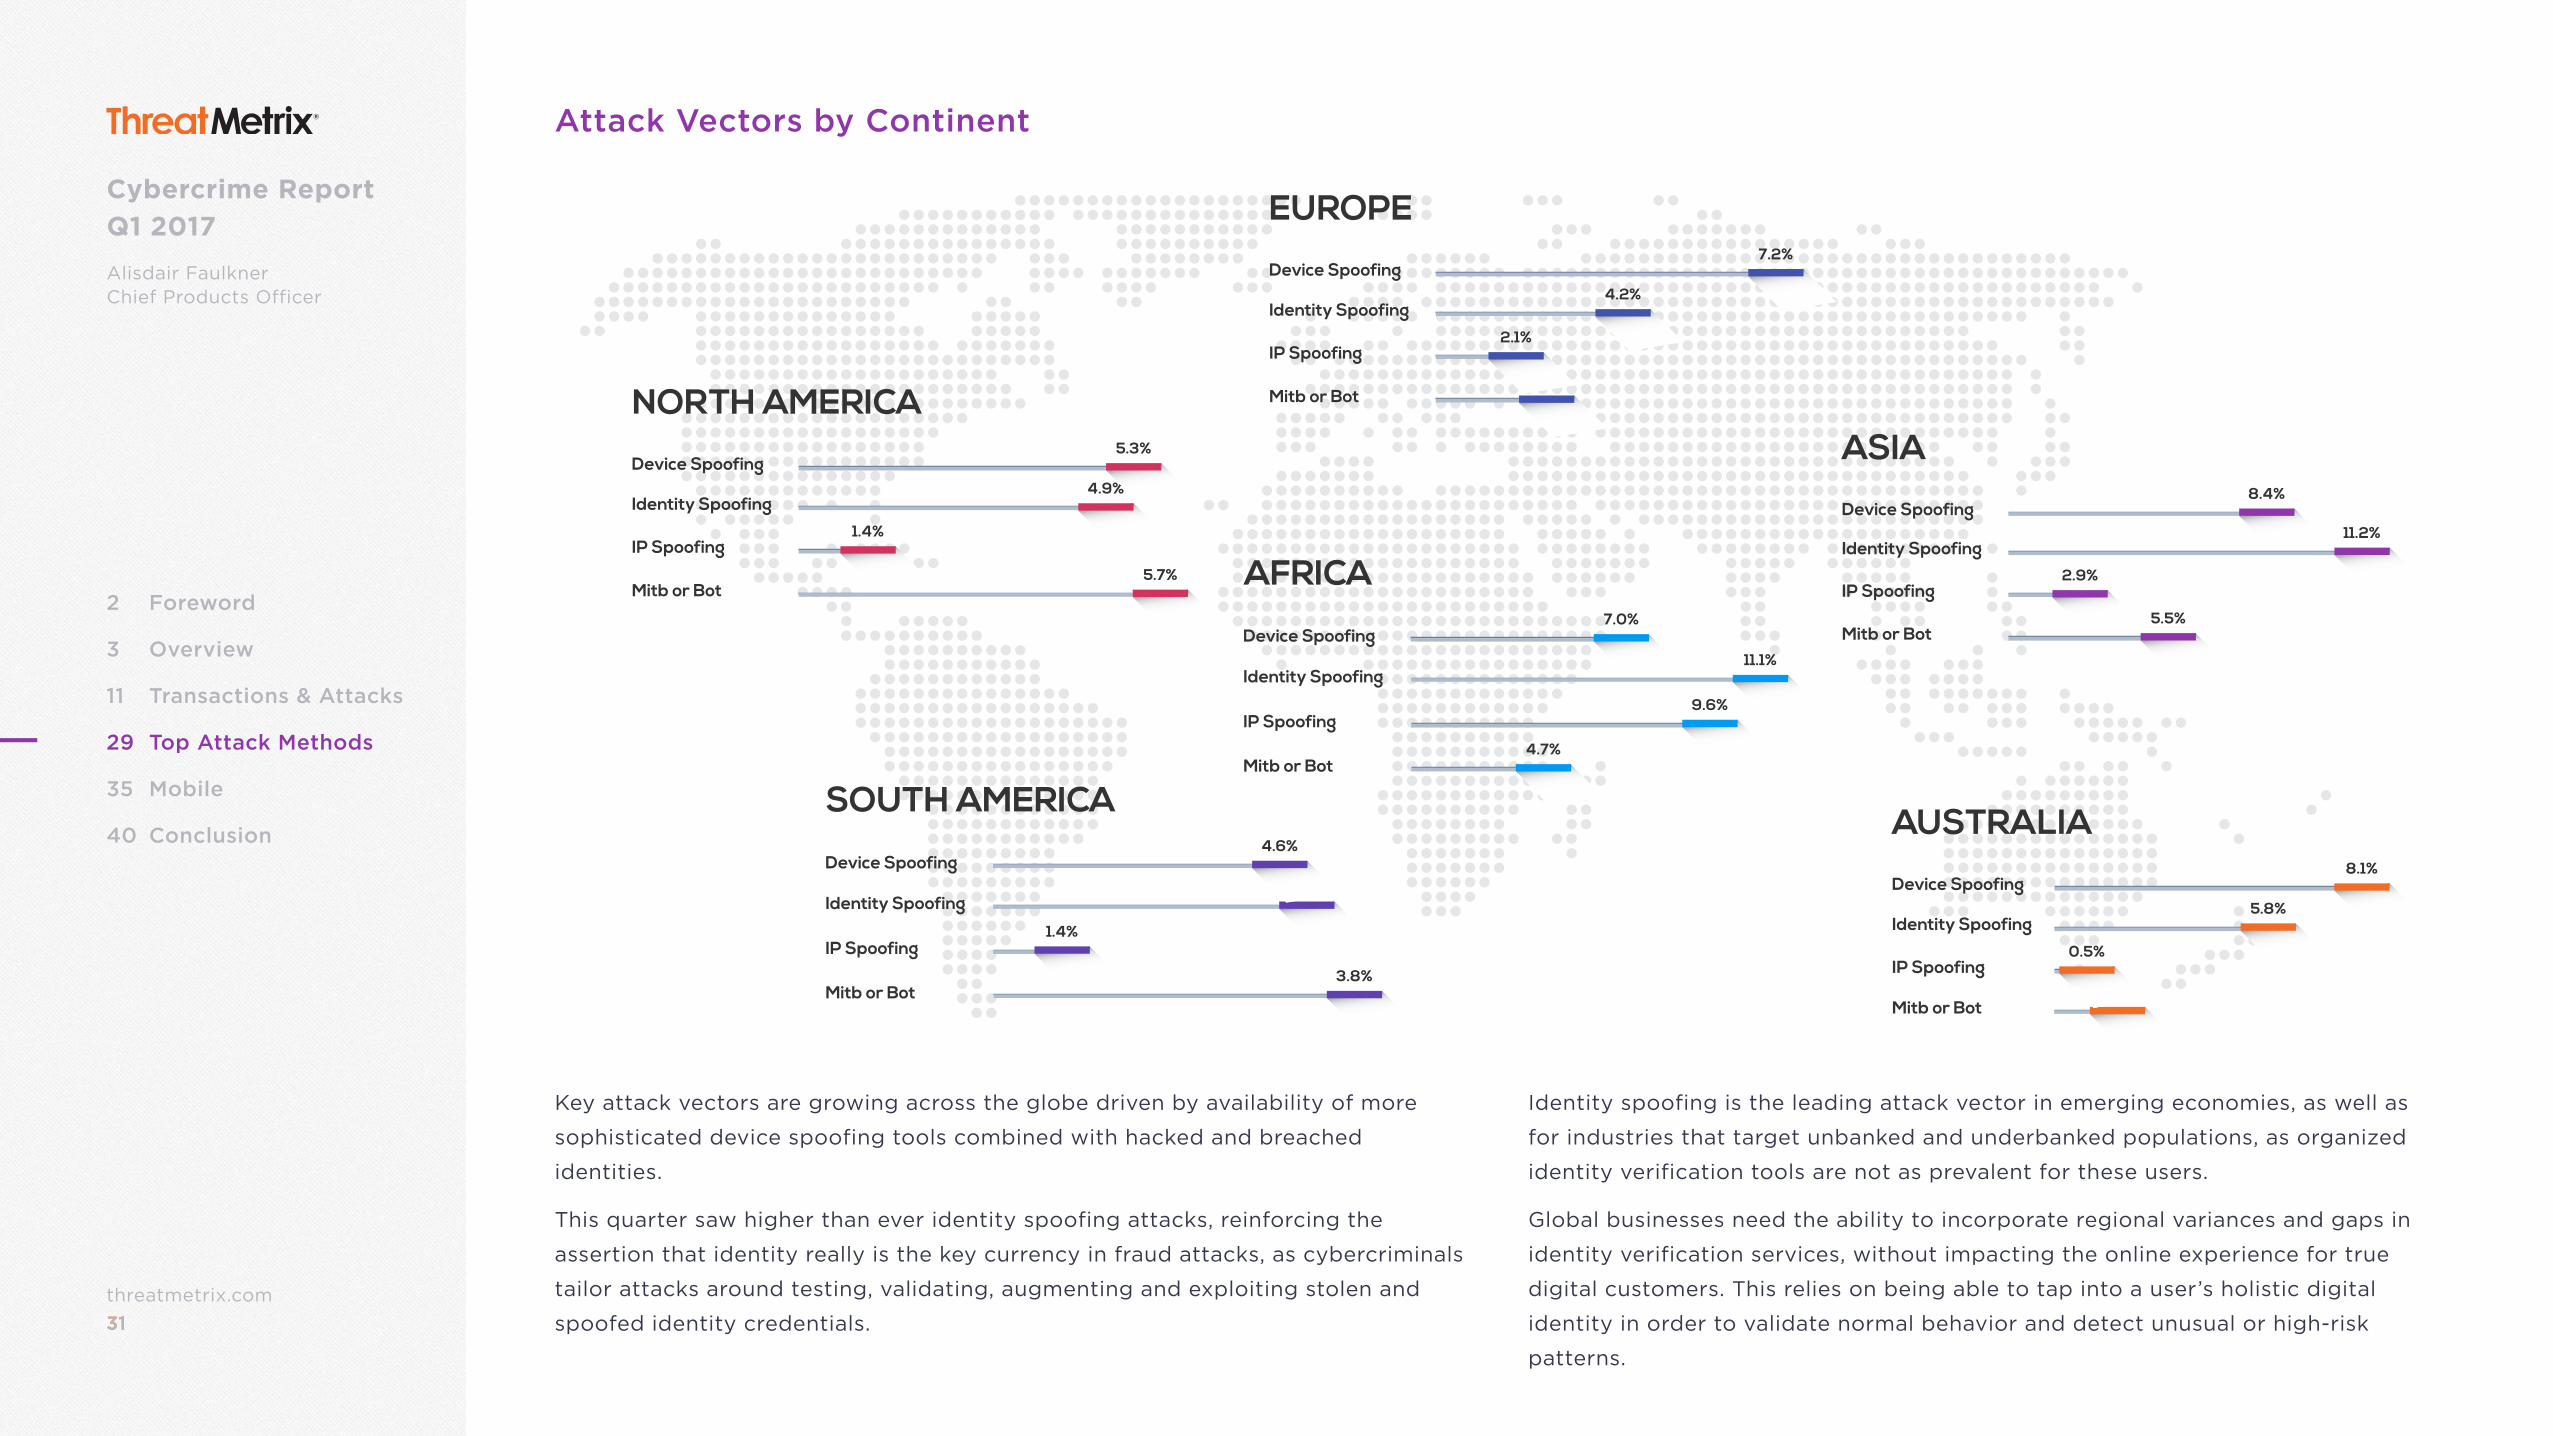
Attack Vectors by Continent
Key attack vectors are growing across the globe driven by availability of more
sophisticated device spoofing tools combined with hacked and breached
identities.
This quarter saw higher than ever identity spoofing attacks, reinforcing the
assertion that identity really is the key currency in fraud attacks, as cybercriminals
tailor attacks around testing, validating, augmenting and exploiting stolen and
spoofed identity credentials.
Identity spoofing is the leading attack vector in emerging economies, as well as
for industries that target unbanked and underbanked populations, as organized
identity verification tools are not as prevalent for these users.
Global businesses need the ability to incorporate regional variances and gaps in
identity verification services, without impacting the online experience for true
digital customers. This relies on being able to tap into a user’s holistic digital
identity in order to validate normal behavior and detect unusual or high-risk
patterns.
4.7%Mitb or Bot
9.6%IP Spoofing
11.1%Identity Spoofing
7.0%Device Spoofing
AFRICA
3.8%Mitb or Bot
1.4%IP Spoofing
5.0%Identity Spoofing
4.6%Device Spoofing
SOUTH AMERICA
5.5%Mitb or Bot
2.9%IP Spoofing
11.2%Identity Spoofing
8.4%Device Spoofing
ASIA
2.7%Mitb or Bot
2.1%IP Spoofing
4.2%Identity Spoofing
7.2%Device Spoofing
EUROPE
5.7%Mitb or Bot
1.4%IP Spoofing
4.9%Identity Spoofing
5.3%Device Spoofing
NORTH AMERICA
2.1%Mitb or Bot
0.5%IP Spoofing
5.8%Identity Spoofing
8.1%Device Spoofing
AUSTRALIA
32threatmetrix.com32
Cybercrime Report Q1 2017
Alisdair FaulknerChief Products Officer
2 Foreword
3 Overview
11 Transactions & Attacks
29 Top Attack Methods
35 Mobile
40 Conclusion
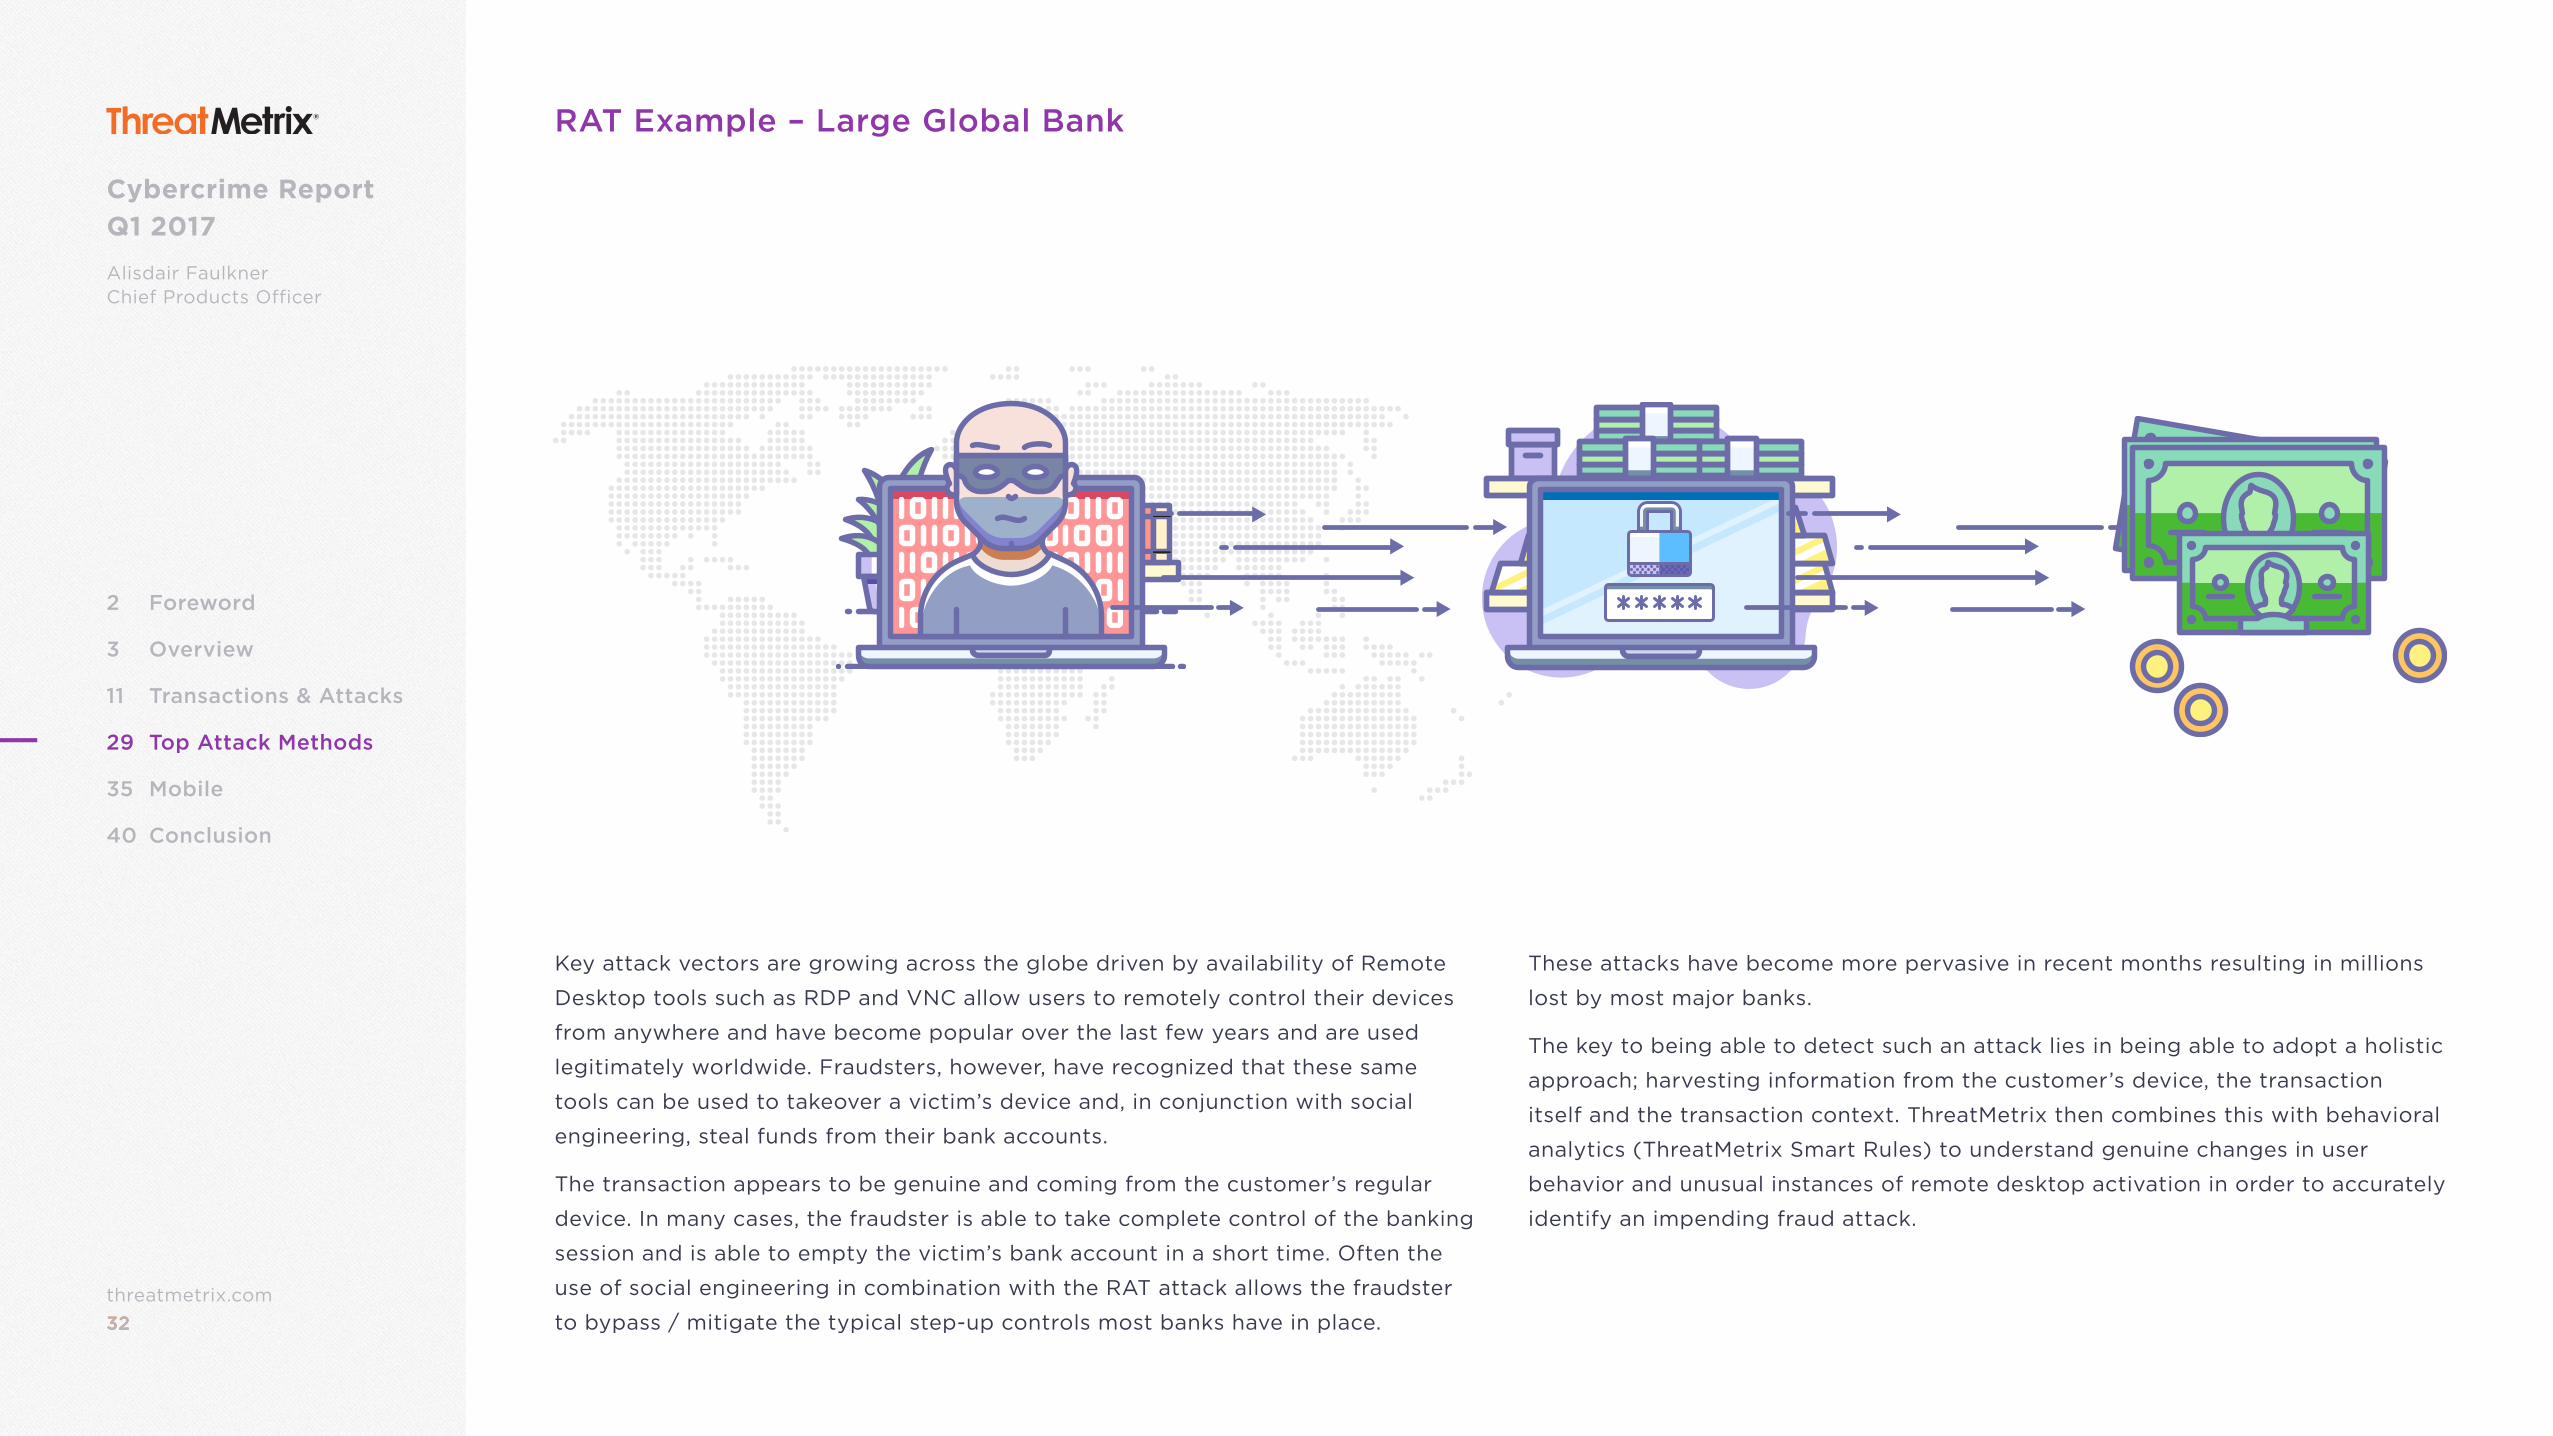
RAT Example – Large Global Bank
Key attack vectors are growing across the globe driven by availability of Remote
Desktop tools such as RDP and VNC allow users to remotely control their devices
from anywhere and have become popular over the last few years and are used
legitimately worldwide. Fraudsters, however, have recognized that these same
tools can be used to takeover a victim’s device and, in conjunction with social
engineering, steal funds from their bank accounts.
The transaction appears to be genuine and coming from the customer’s regular
device. In many cases, the fraudster is able to take complete control of the banking
session and is able to empty the victim’s bank account in a short time. Often the
use of social engineering in combination with the RAT attack allows the fraudster
to bypass / mitigate the typical step-up controls most banks have in place.
These attacks have become more pervasive in recent months resulting in millions
lost by most major banks.
The key to being able to detect such an attack lies in being able to adopt a holistic
approach; harvesting information from the customer’s device, the transaction
itself and the transaction context. ThreatMetrix then combines this with behavioral
analytics (ThreatMetrix Smart Rules) to understand genuine changes in user
behavior and unusual instances of remote desktop activation in order to accurately
identify an impending fraud attack.
33threatmetrix.com33
Cybercrime Report Q1 2017
Alisdair FaulknerChief Products Officer
2 Foreword
3 Overview
11 Transactions & Attacks
29 Top Attack Methods
35 Mobile
40 Conclusion
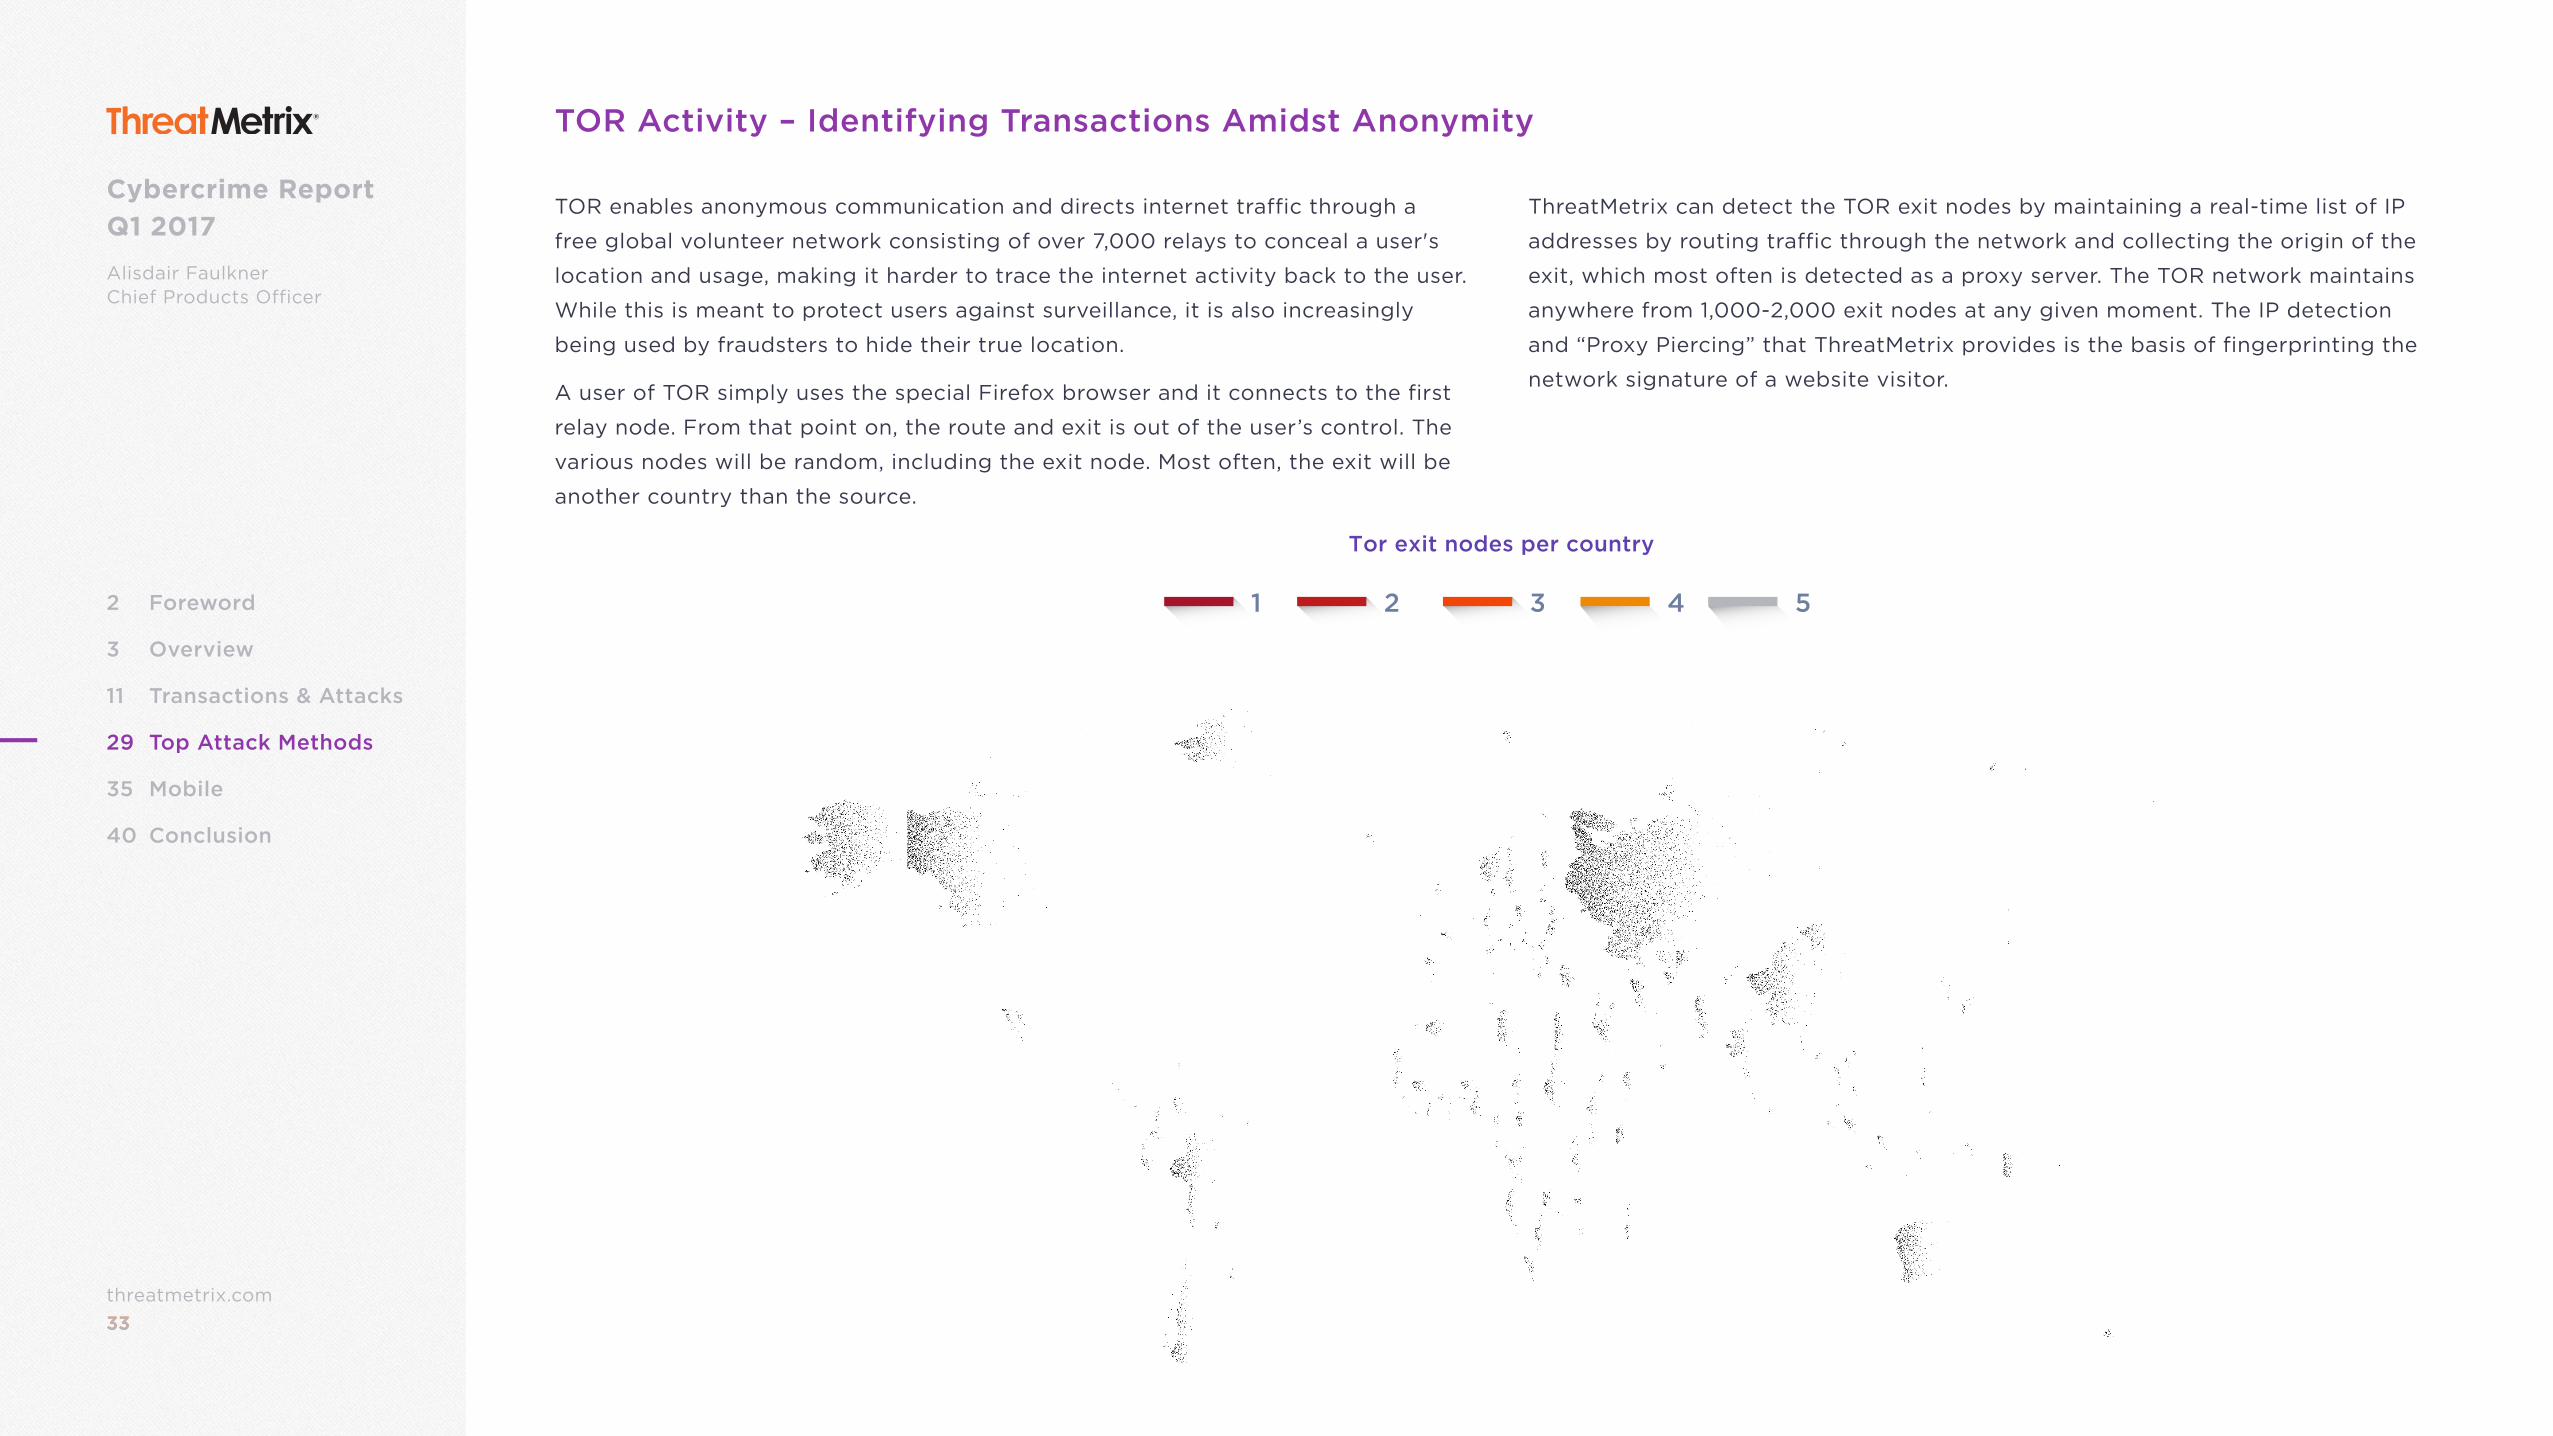
TOR Activity – Identifying Transactions Amidst Anonymity
TOR enables anonymous communication and directs internet traffic through a
free global volunteer network consisting of over 7,000 relays to conceal a user's
location and usage, making it harder to trace the internet activity back to the user.
While this is meant to protect users against surveillance, it is also increasingly
being used by fraudsters to hide their true location.
A user of TOR simply uses the special Firefox browser and it connects to the first
relay node. From that point on, the route and exit is out of the user’s control. The
various nodes will be random, including the exit node. Most often, the exit will be
another country than the source.
ThreatMetrix can detect the TOR exit nodes by maintaining a real-time list of IP
addresses by routing traffic through the network and collecting the origin of the
exit, which most often is detected as a proxy server. The TOR network maintains
anywhere from 1,000-2,000 exit nodes at any given moment. The IP detection
and “Proxy Piercing” that ThreatMetrix provides is the basis of fingerprinting the
network signature of a website visitor.
1 2 3 4 5
Tor exit nodes per country
34threatmetrix.com34
Cybercrime Report Q1 2017
Alisdair FaulknerChief Products Officer
2 Foreword
3 Overview
11 Transactions & Attacks
29 Top Attack Methods
35 Mobile
40 Conclusion
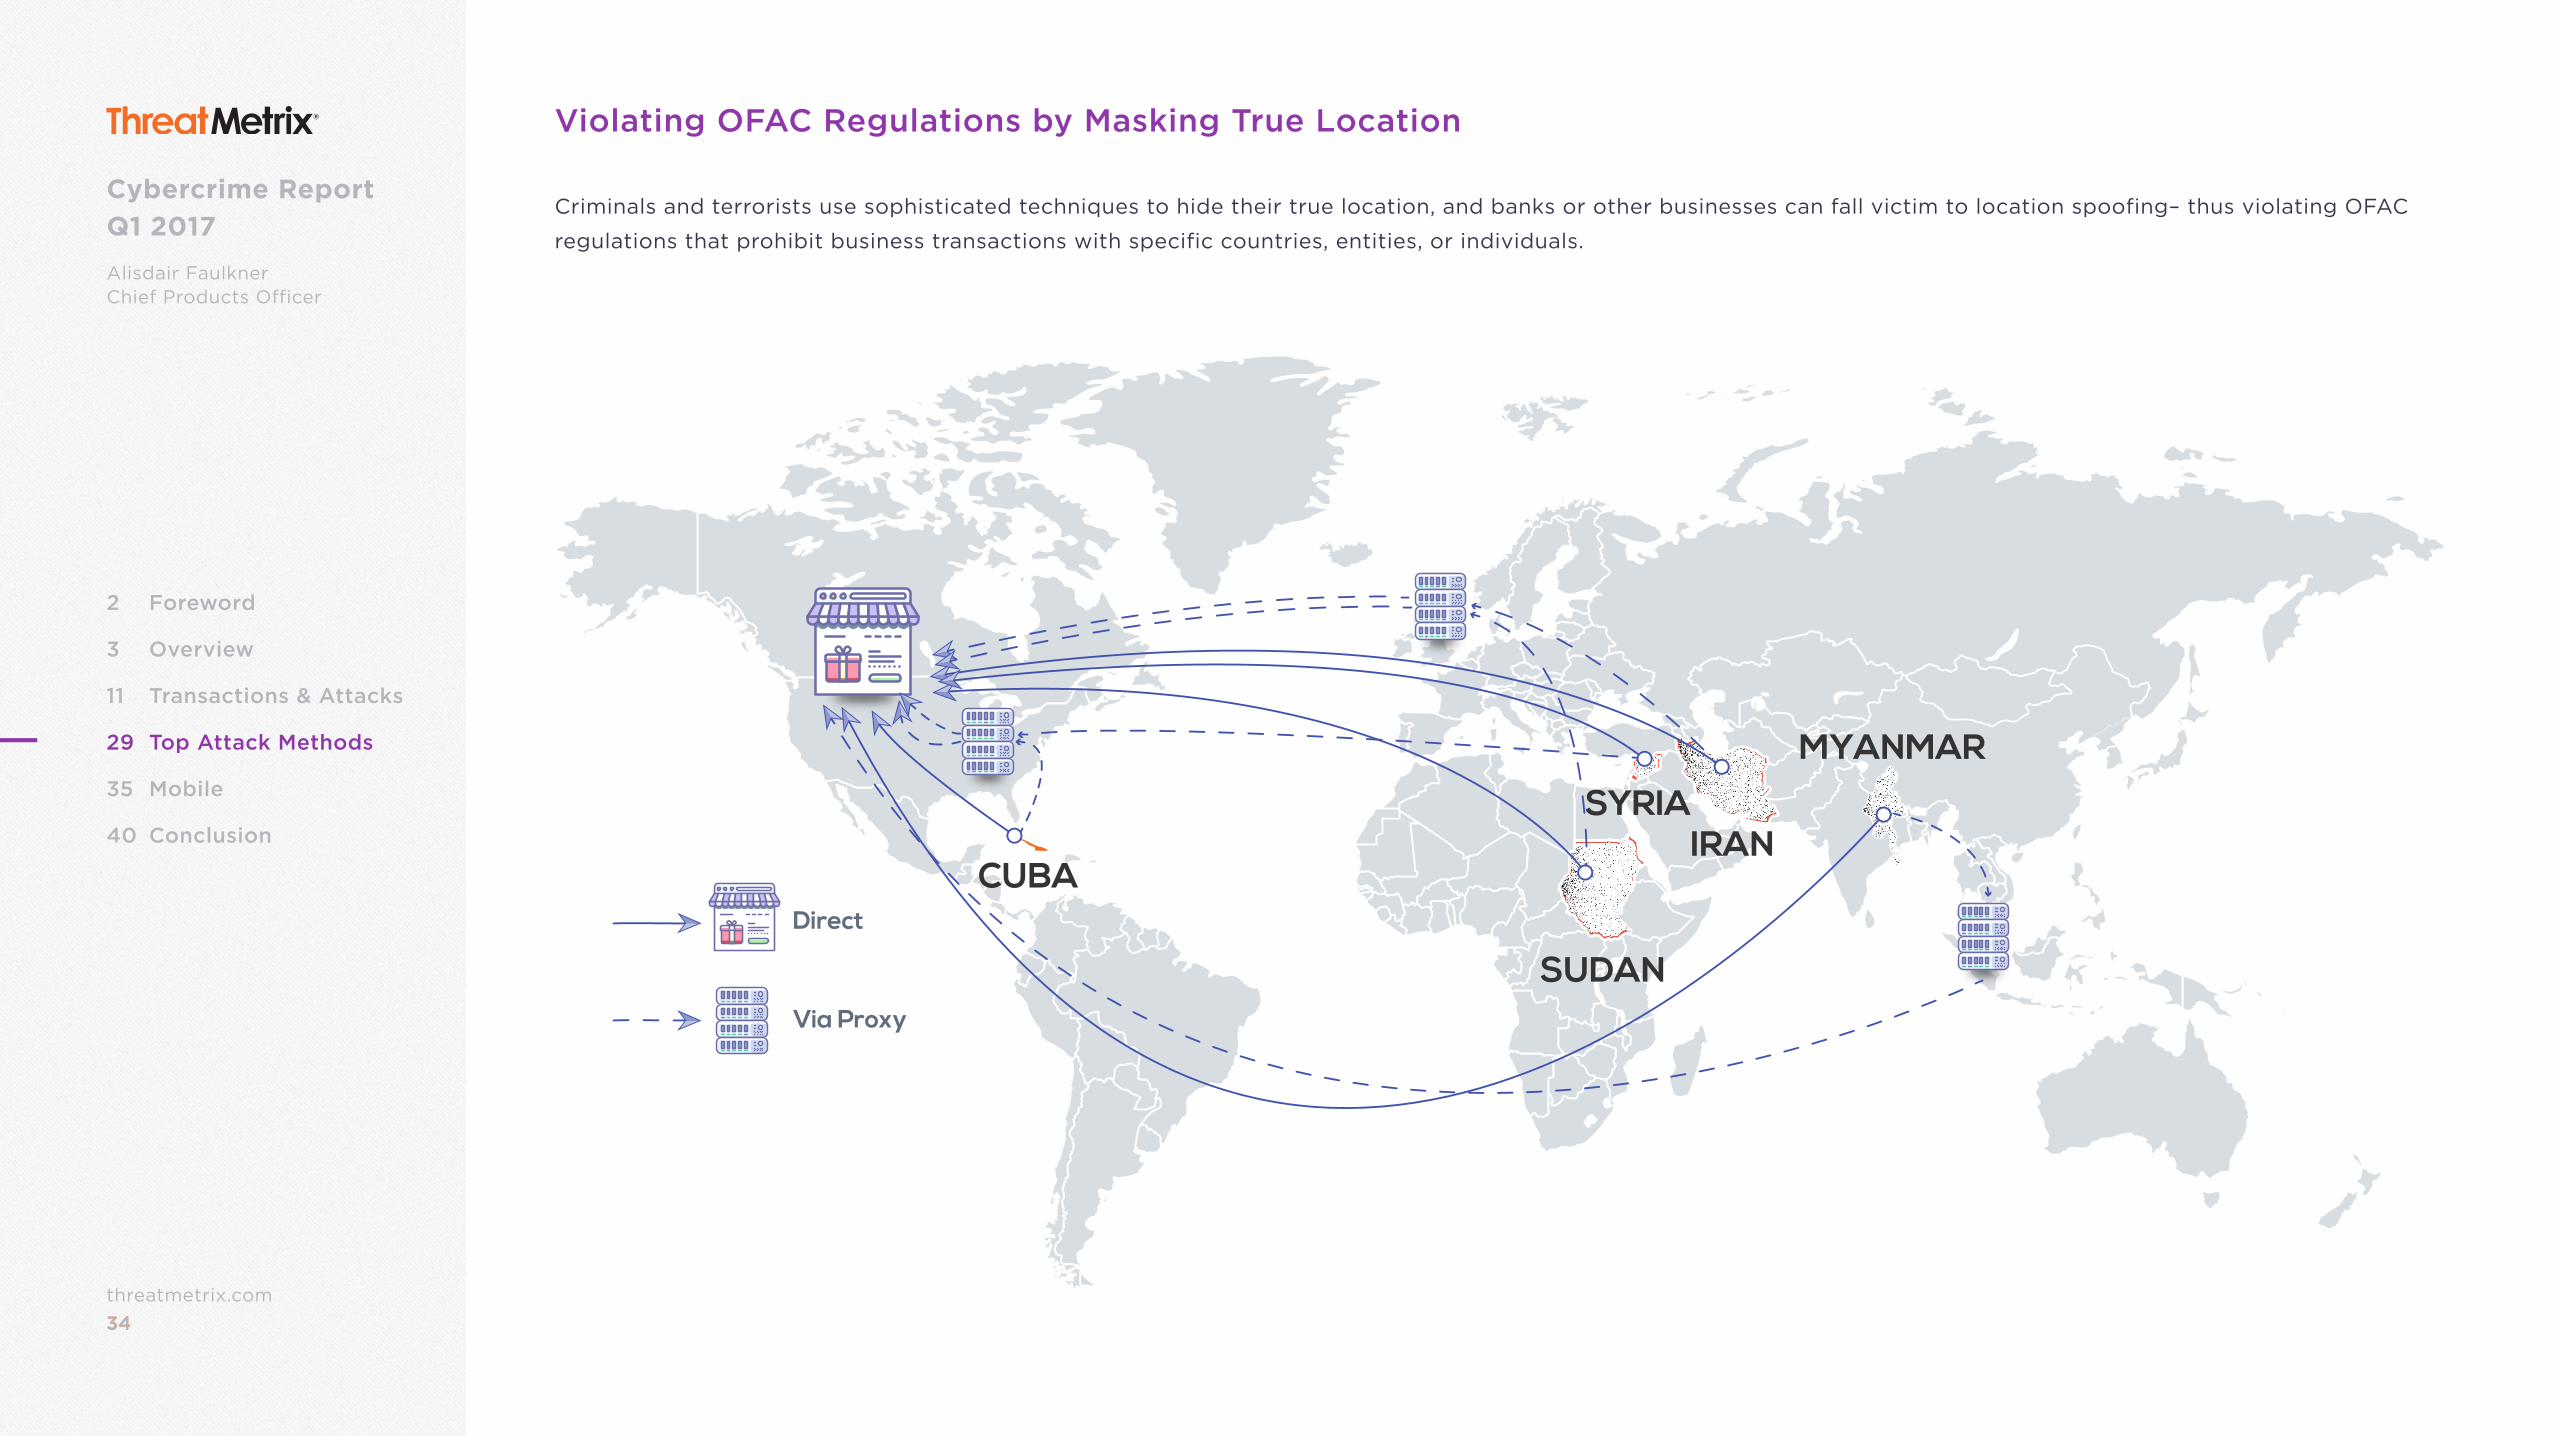
Violating OFAC Regulations by Masking True Location
Criminals and terrorists use sophisticated techniques to hide their true location, and banks or other businesses can fall victim to location spoofing– thus violating OFAC
regulations that prohibit business transactions with specific countries, entities, or individuals.
CUBAIRAN
MYANMAR
SUDAN
SYRIA
Via Proxy
Direct
35threatmetrix.com35
Cybercrime Report Q1 2017Alisdair FaulknerChief Products Officer
2 Foreword
3 Overview
11 Transactions & Attacks
29 Top Attack Methods
35 Mobile
40 Conclusion
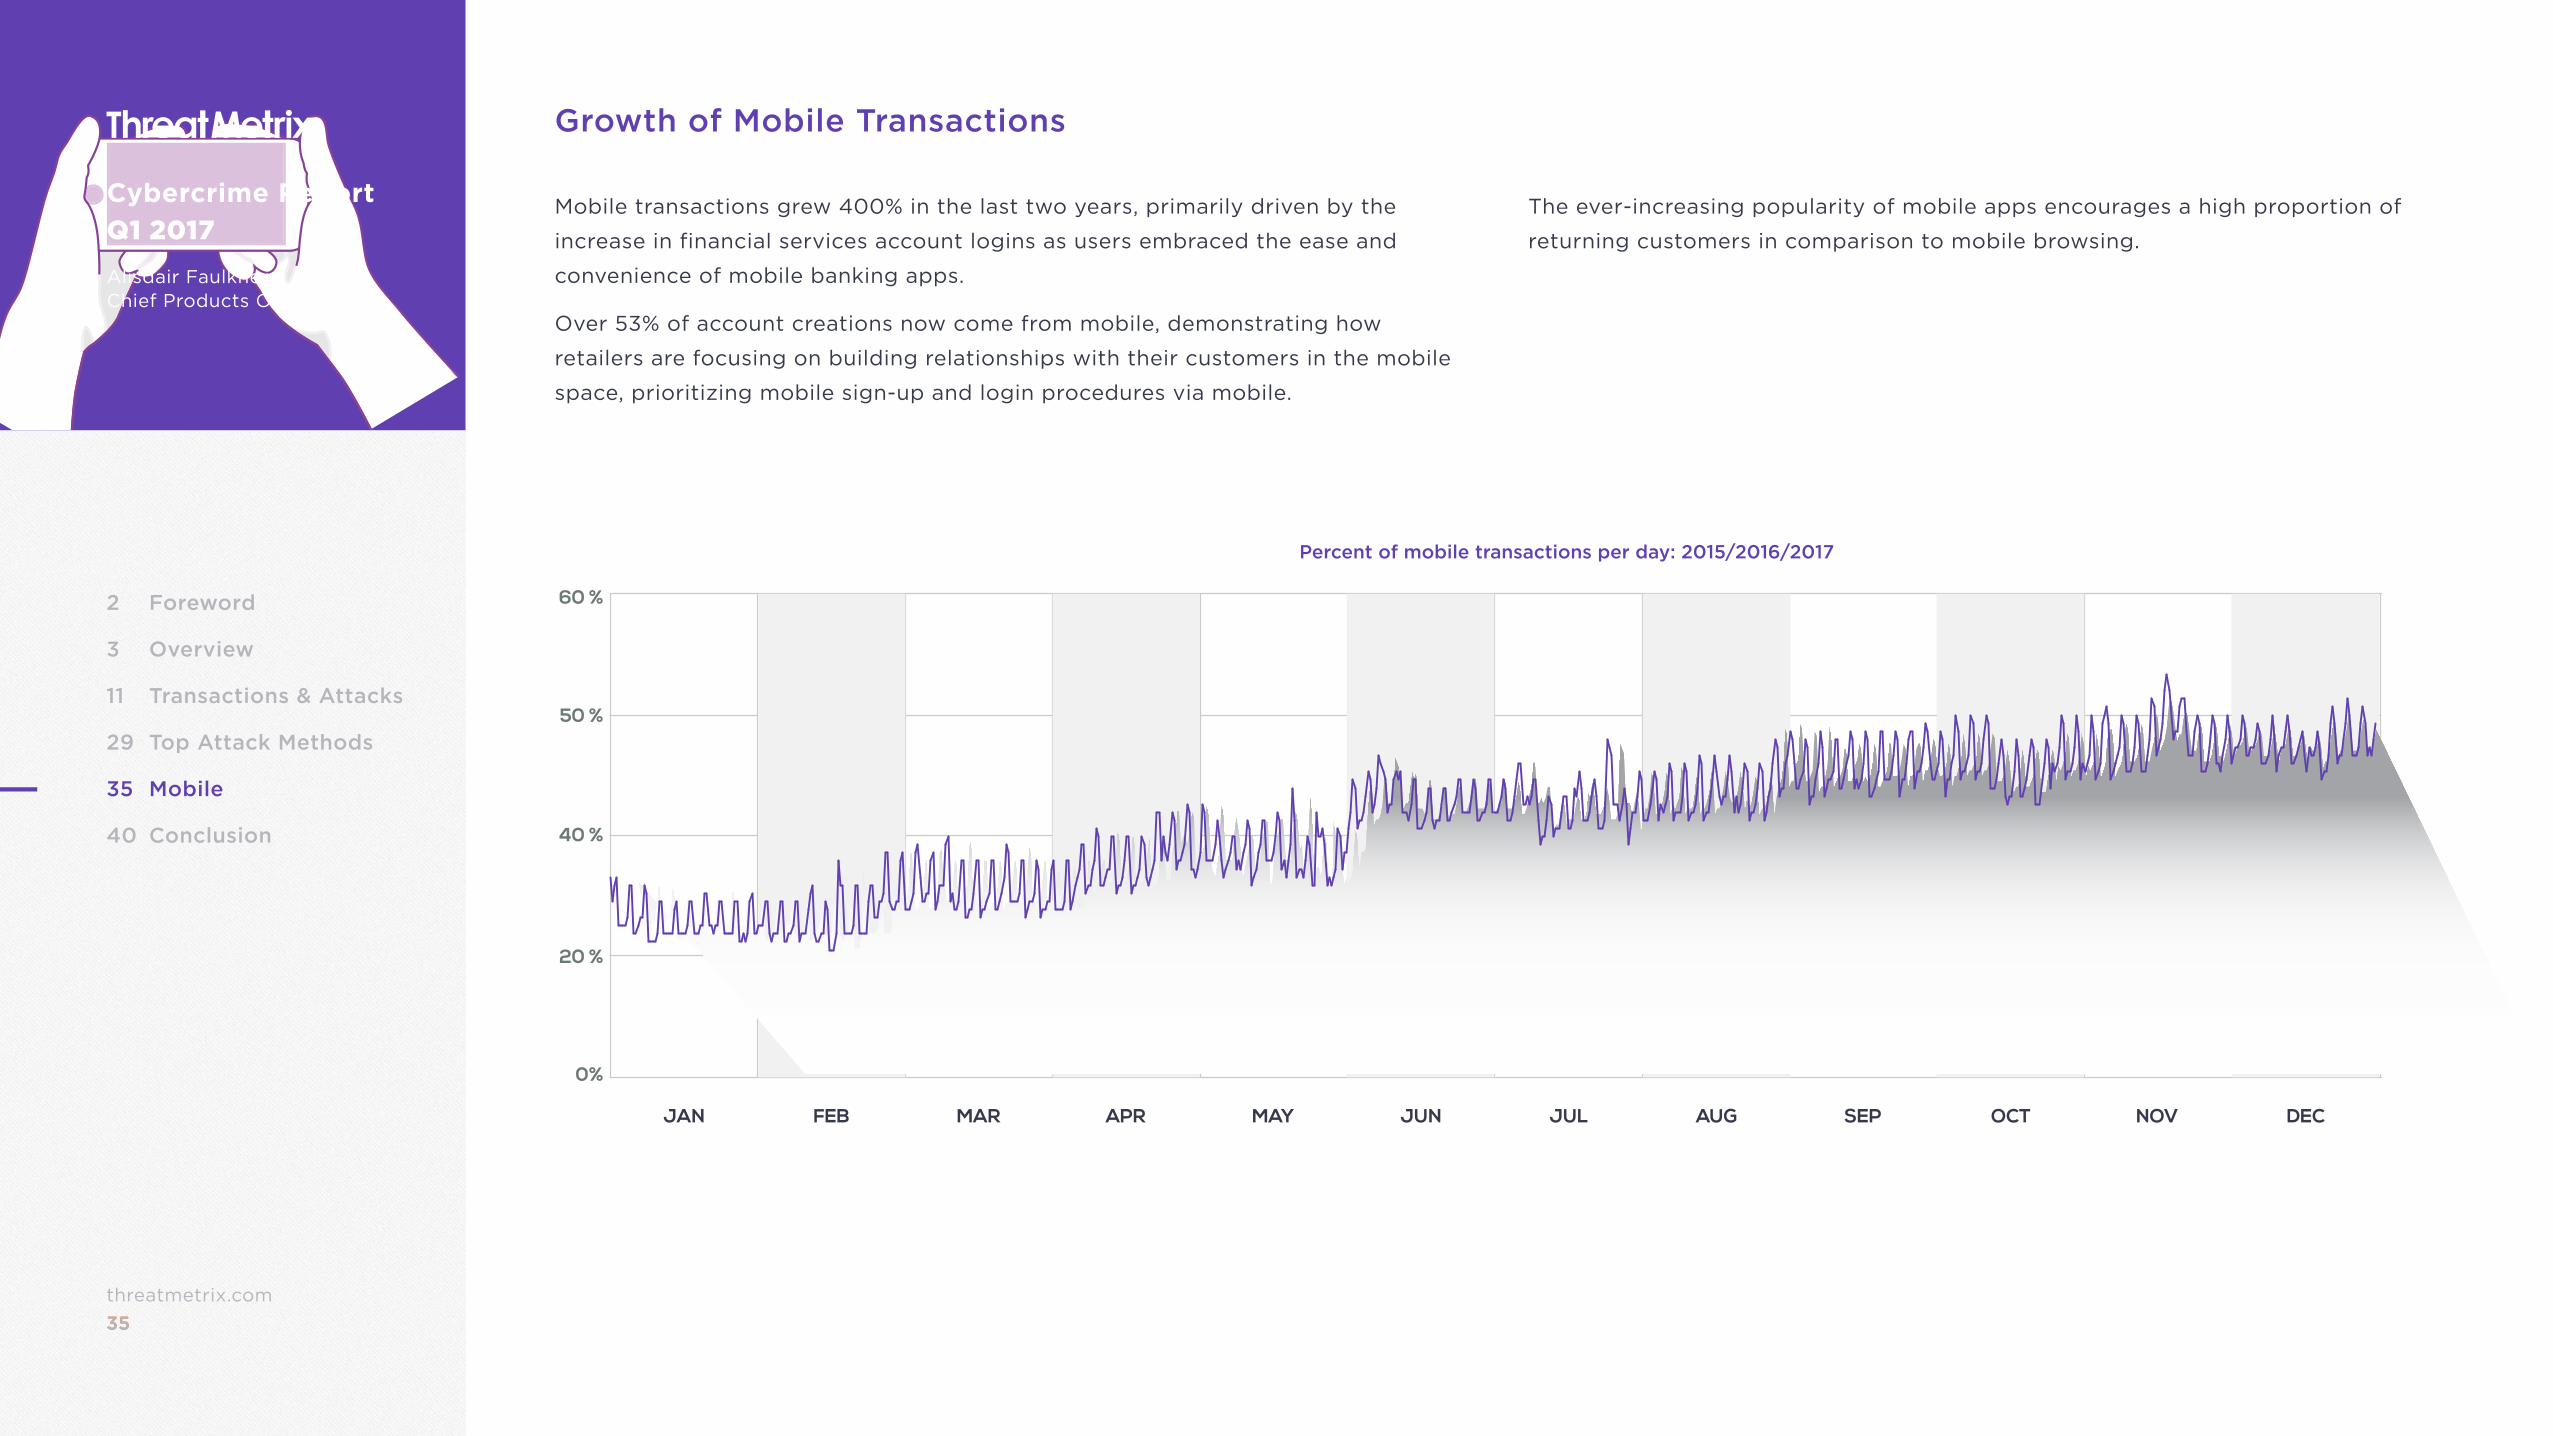
Growth of Mobile Transactions
Mobile transactions grew 400% in the last two years, primarily driven by the
increase in financial services account logins as users embraced the ease and
convenience of mobile banking apps.
Over 53% of account creations now come from mobile, demonstrating how
retailers are focusing on building relationships with their customers in the mobile
space, prioritizing mobile sign-up and login procedures via mobile.
The ever-increasing popularity of mobile apps encourages a high proportion of
returning customers in comparison to mobile browsing.
JAN FEB MAR APR MAY JUN JUL AUG SEP OCT NOV DEC
0%
20 %
60 %
40 %
50 %
Percent of mobile transactions per day: 2015/2016/2017
36threatmetrix.com36
Cybercrime Report Q1 2017
Alisdair FaulknerChief Products Officer
2 Foreword
3 Overview
11 Transactions & Attacks
29 Top Attack Methods
35 Mobile
40 Conclusion
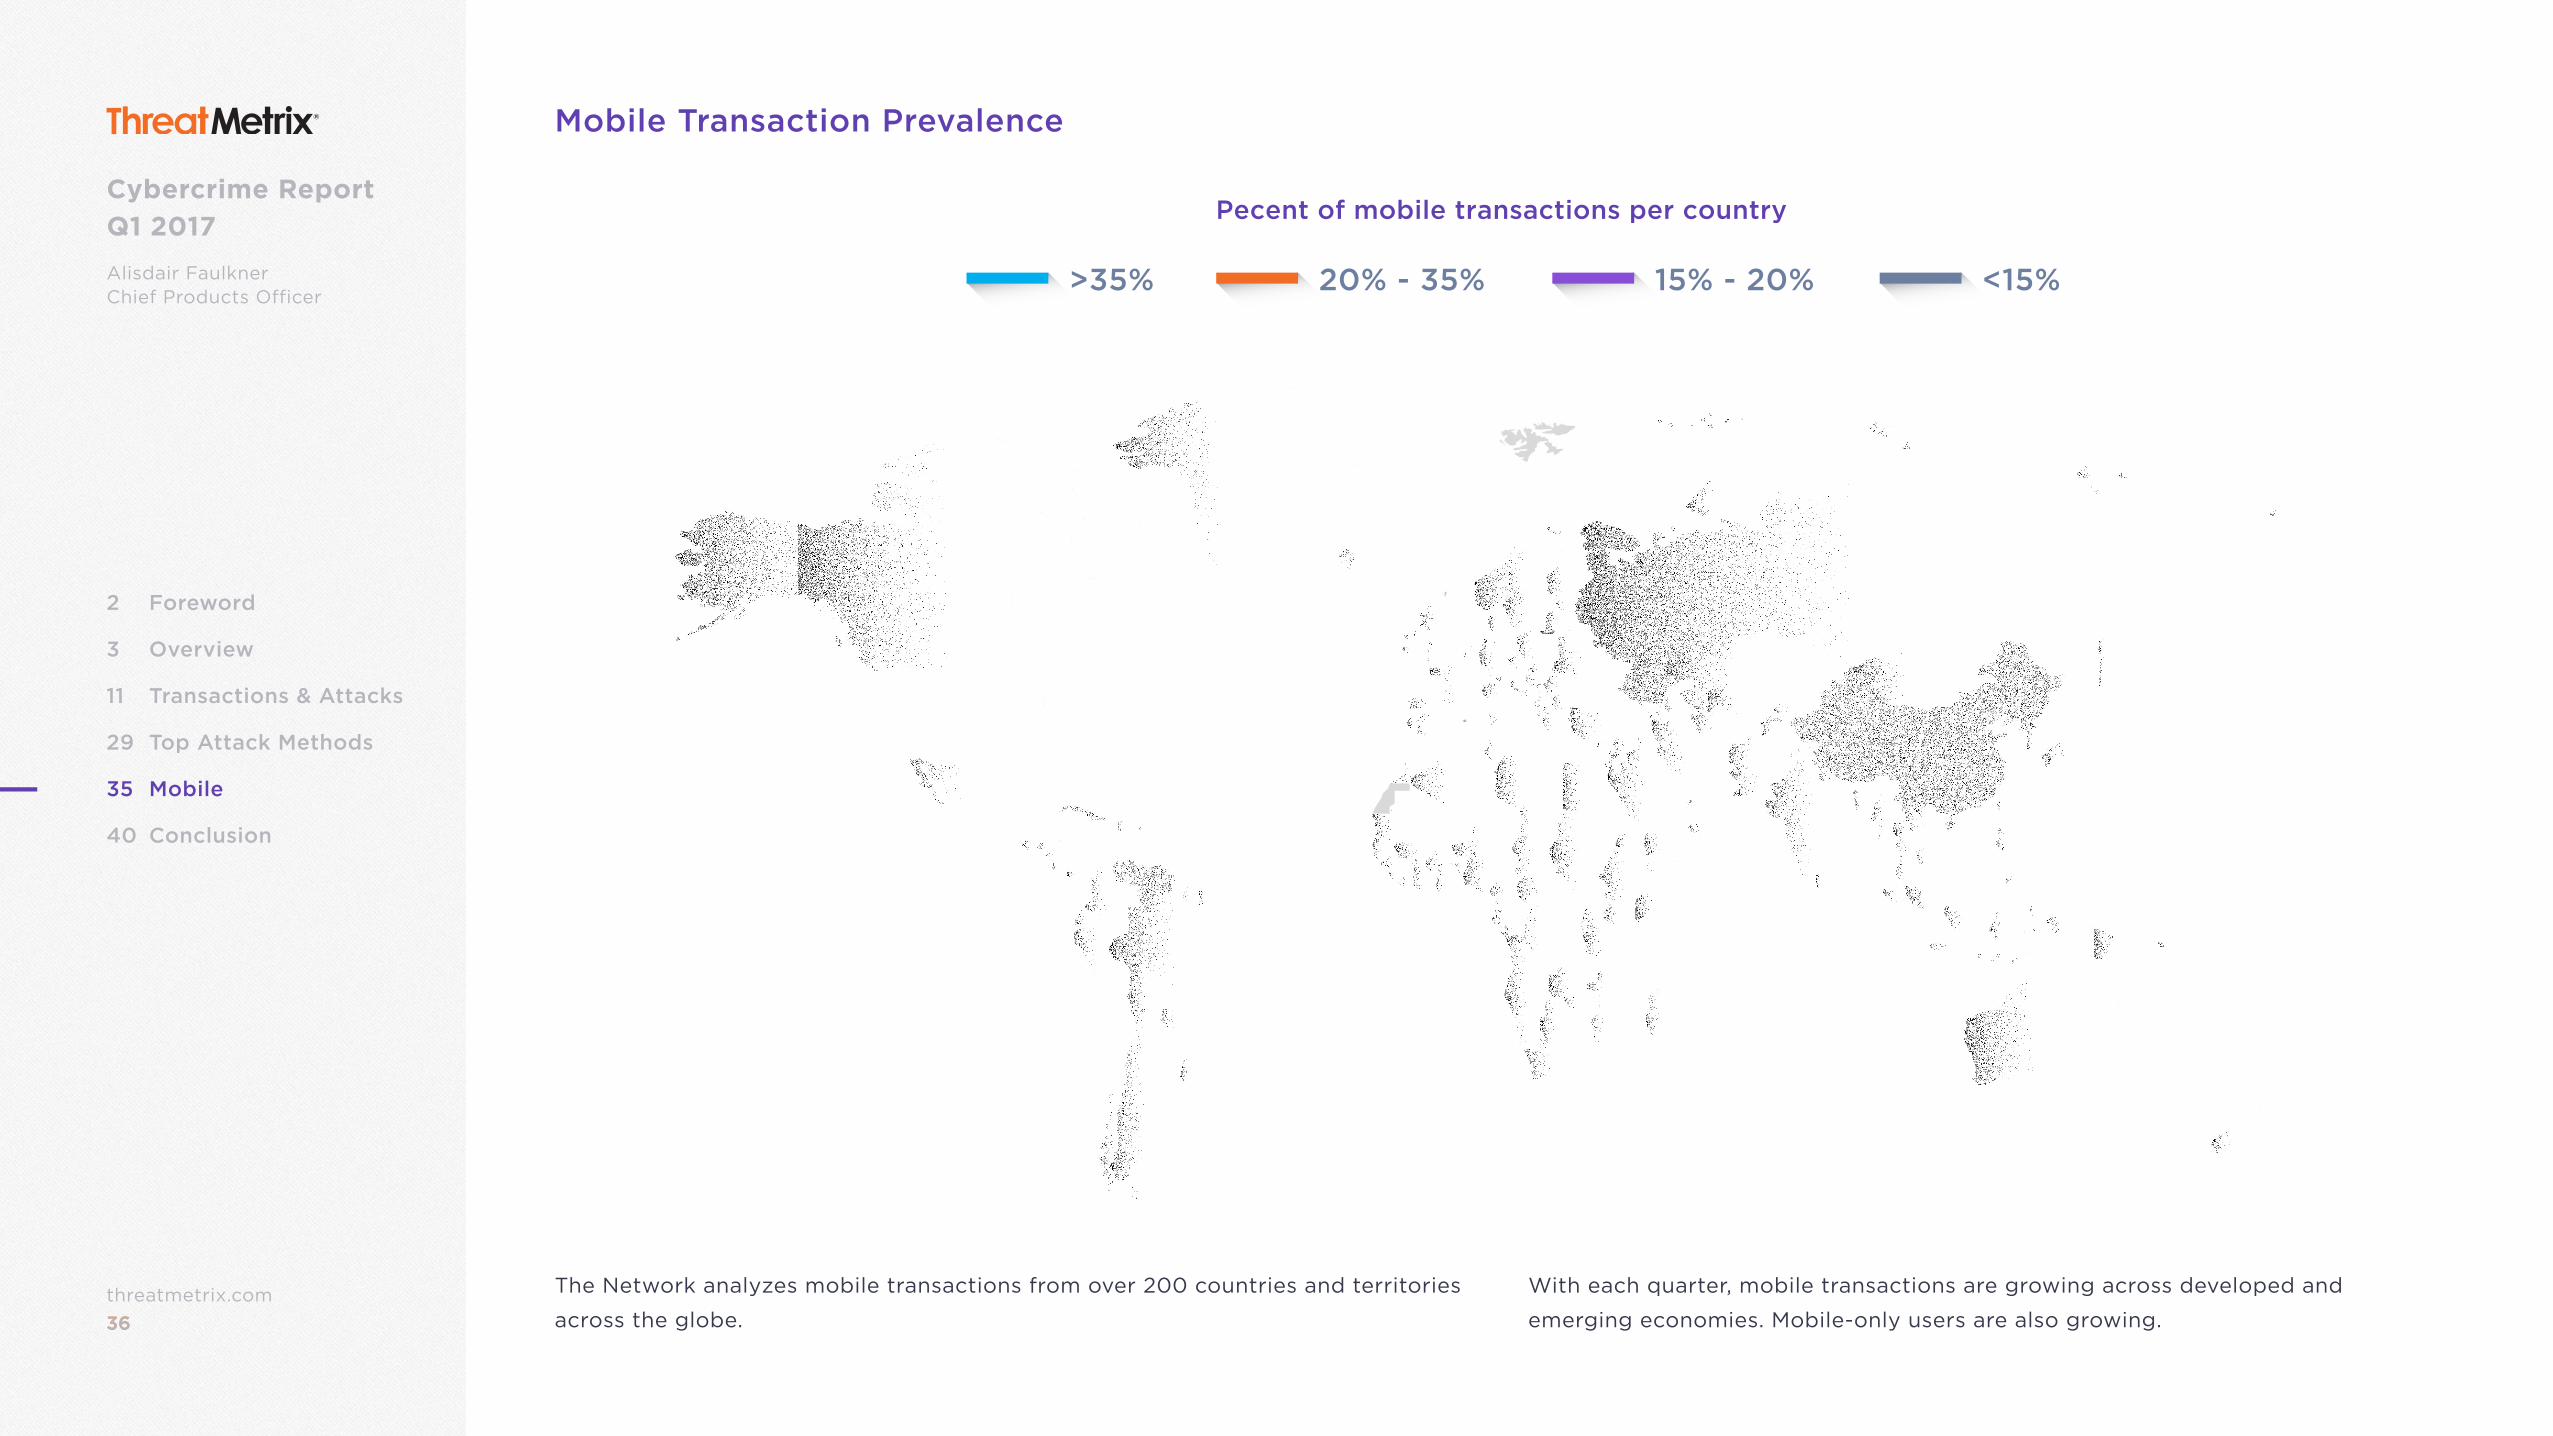
Mobile Transaction Prevalence
The Network analyzes mobile transactions from over 200 countries and territories
across the globe.
With each quarter, mobile transactions are growing across developed and
emerging economies. Mobile-only users are also growing.
Pecent of mobile transactions per country
>35% 20% - 35% 15% - 20% <15%
37threatmetrix.com37
Cybercrime Report Q1 2017
Alisdair FaulknerChief Products Officer
2 Foreword
3 Overview
11 Transactions & Attacks
29 Top Attack Methods
35 Mobile
40 Conclusion
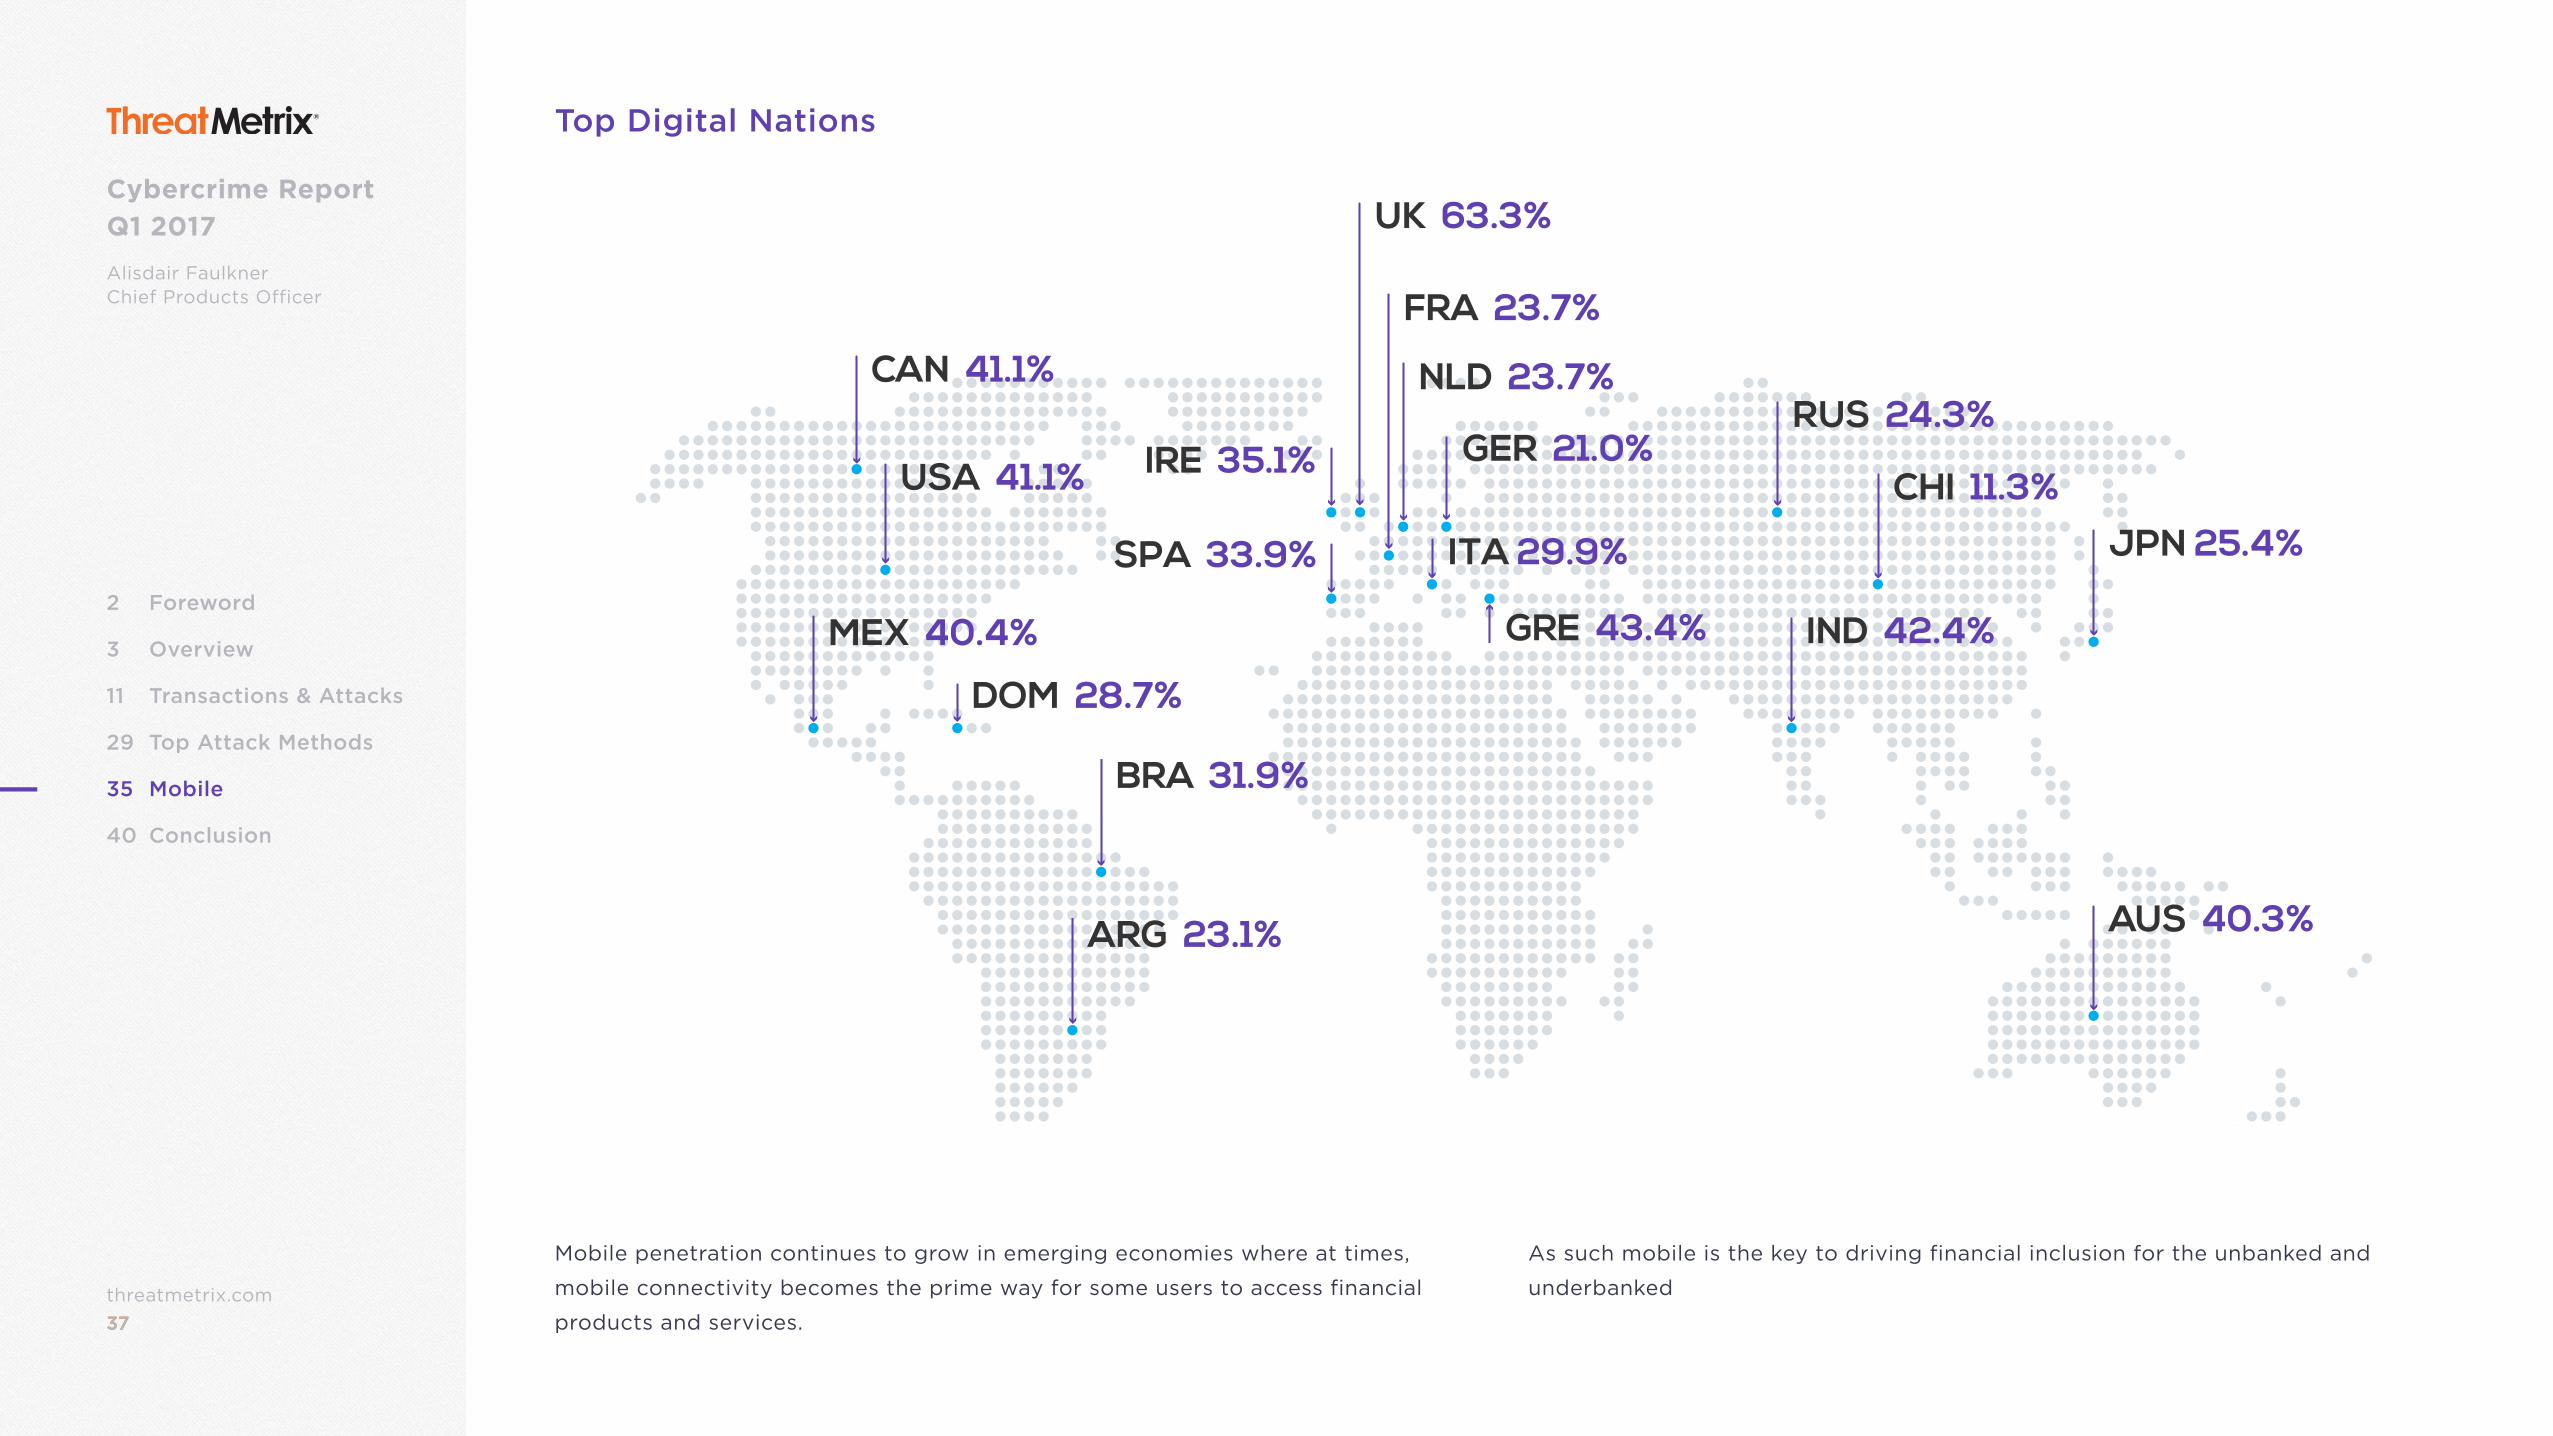
Top Digital Nations
Mobile penetration continues to grow in emerging economies where at times,
mobile connectivity becomes the prime way for some users to access financial
products and services.
As such mobile is the key to driving financial inclusion for the unbanked and
underbanked
USA 41.1%
BRA 31.9%
DOM 28.7%
ARG 23.1%
MEX 40.4%
CAN 41.1%
FRA 23.7%
NLD 23.7%RUS 24.3%
IND 42.4%
AUS 40.3%
CHI 11.3%JPN 25.4%
UK 63.3%
IRE 35.1% GER 21.0%
ITA 29.9%
GRE 43.4%
SPA 33.9%
38threatmetrix.com38
Cybercrime Report Q1 2017
Alisdair FaulknerChief Products Officer
2 Foreword
3 Overview
11 Transactions & Attacks
29 Top Attack Methods
35 Mobile
40 Conclusion
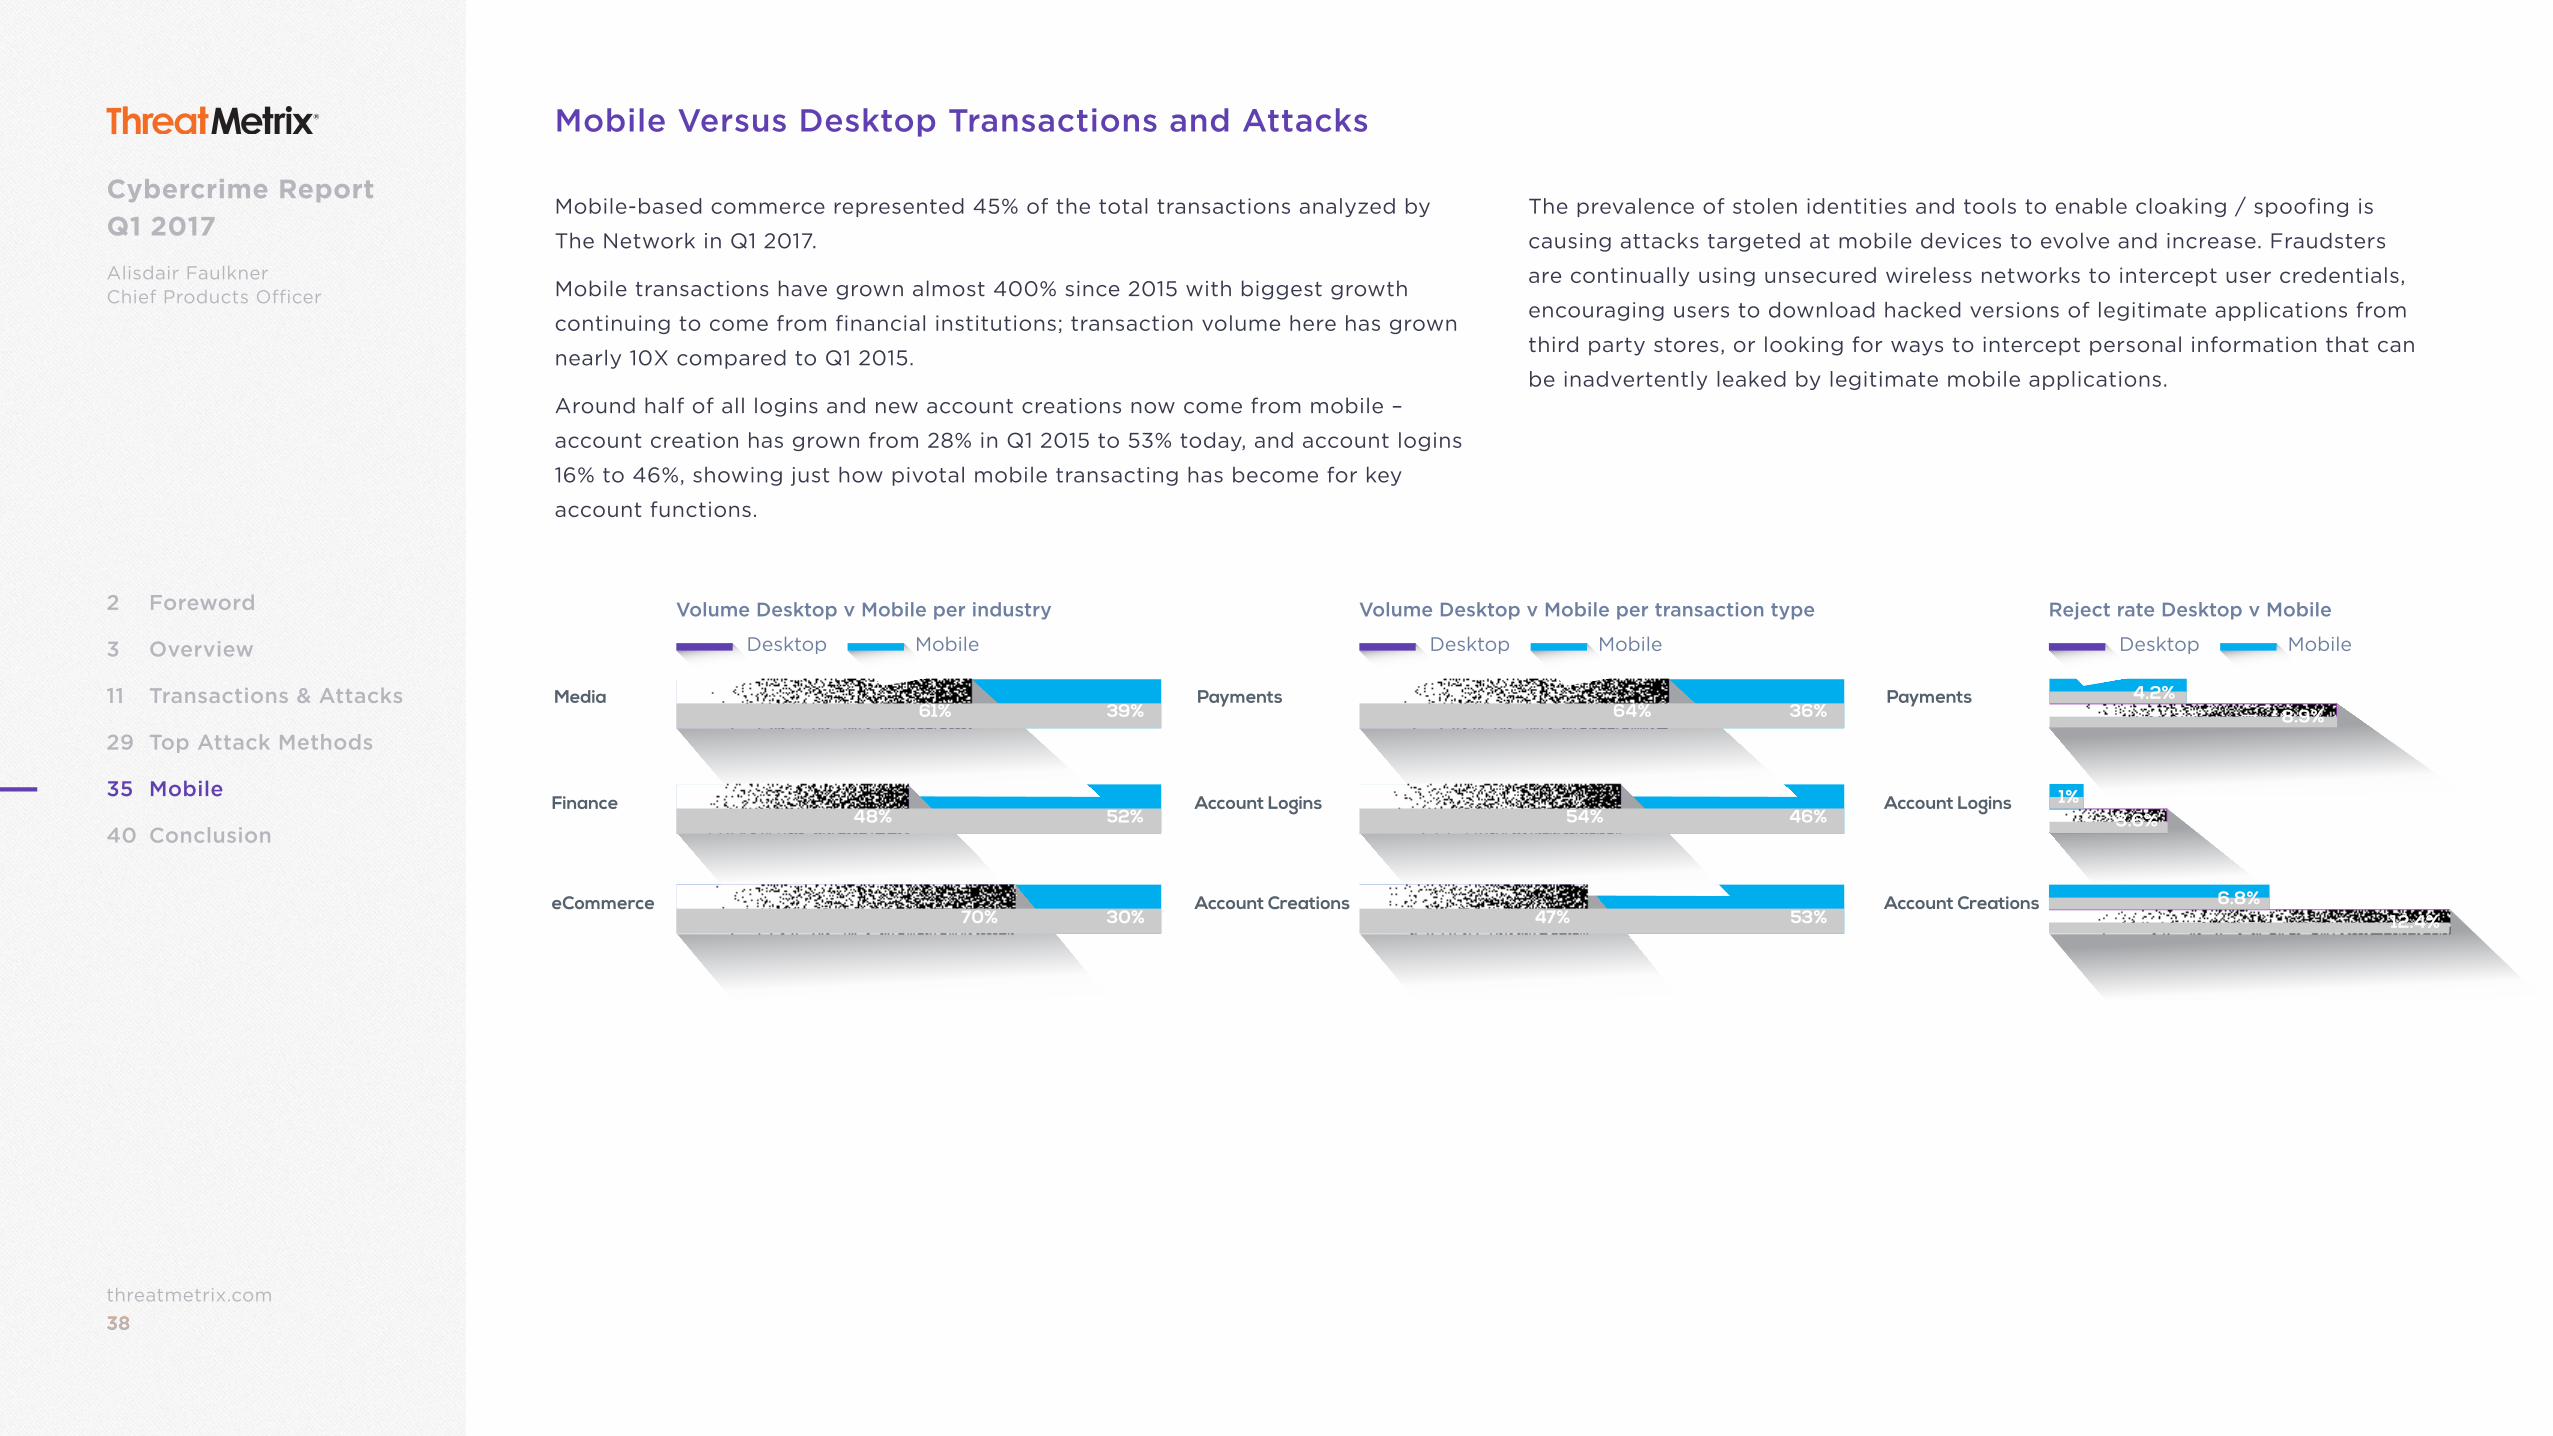
Mobile Versus Desktop Transactions and Attacks
Mobile-based commerce represented 45% of the total transactions analyzed by
The Network in Q1 2017.
Mobile transactions have grown almost 400% since 2015 with biggest growth
continuing to come from financial institutions; transaction volume here has grown
nearly 10X compared to Q1 2015.
Around half of all logins and new account creations now come from mobile –
account creation has grown from 28% in Q1 2015 to 53% today, and account logins
16% to 46%, showing just how pivotal mobile transacting has become for key
account functions.
The prevalence of stolen identities and tools to enable cloaking / spoofing is
causing attacks targeted at mobile devices to evolve and increase. Fraudsters
are continually using unsecured wireless networks to intercept user credentials,
encouraging users to download hacked versions of legitimate applications from
third party stores, or looking for ways to intercept personal information that can
be inadvertently leaked by legitimate mobile applications.
Media
Finance
eCommerce70% 30%
48% 52%
61% 39%
MobileDesktop
Volume Desktop v Mobile per industry
Payments
Account Logins
Account Creations47% 53%
54% 46%
64% 36%
MobileDesktop
Volume Desktop v Mobile per transaction type
4.2%8.9%
1%3.6%
6.8%12.4%
Payments
Account Logins
Account Creations
MobileDesktop
Reject rate Desktop v Mobile
39threatmetrix.com39
Cybercrime Report Q1 2017
Alisdair FaulknerChief Products Officer
2 Foreword
3 Overview
11 Transactions & Attacks
29 Top Attack Methods
35 Mobile
40 Conclusion
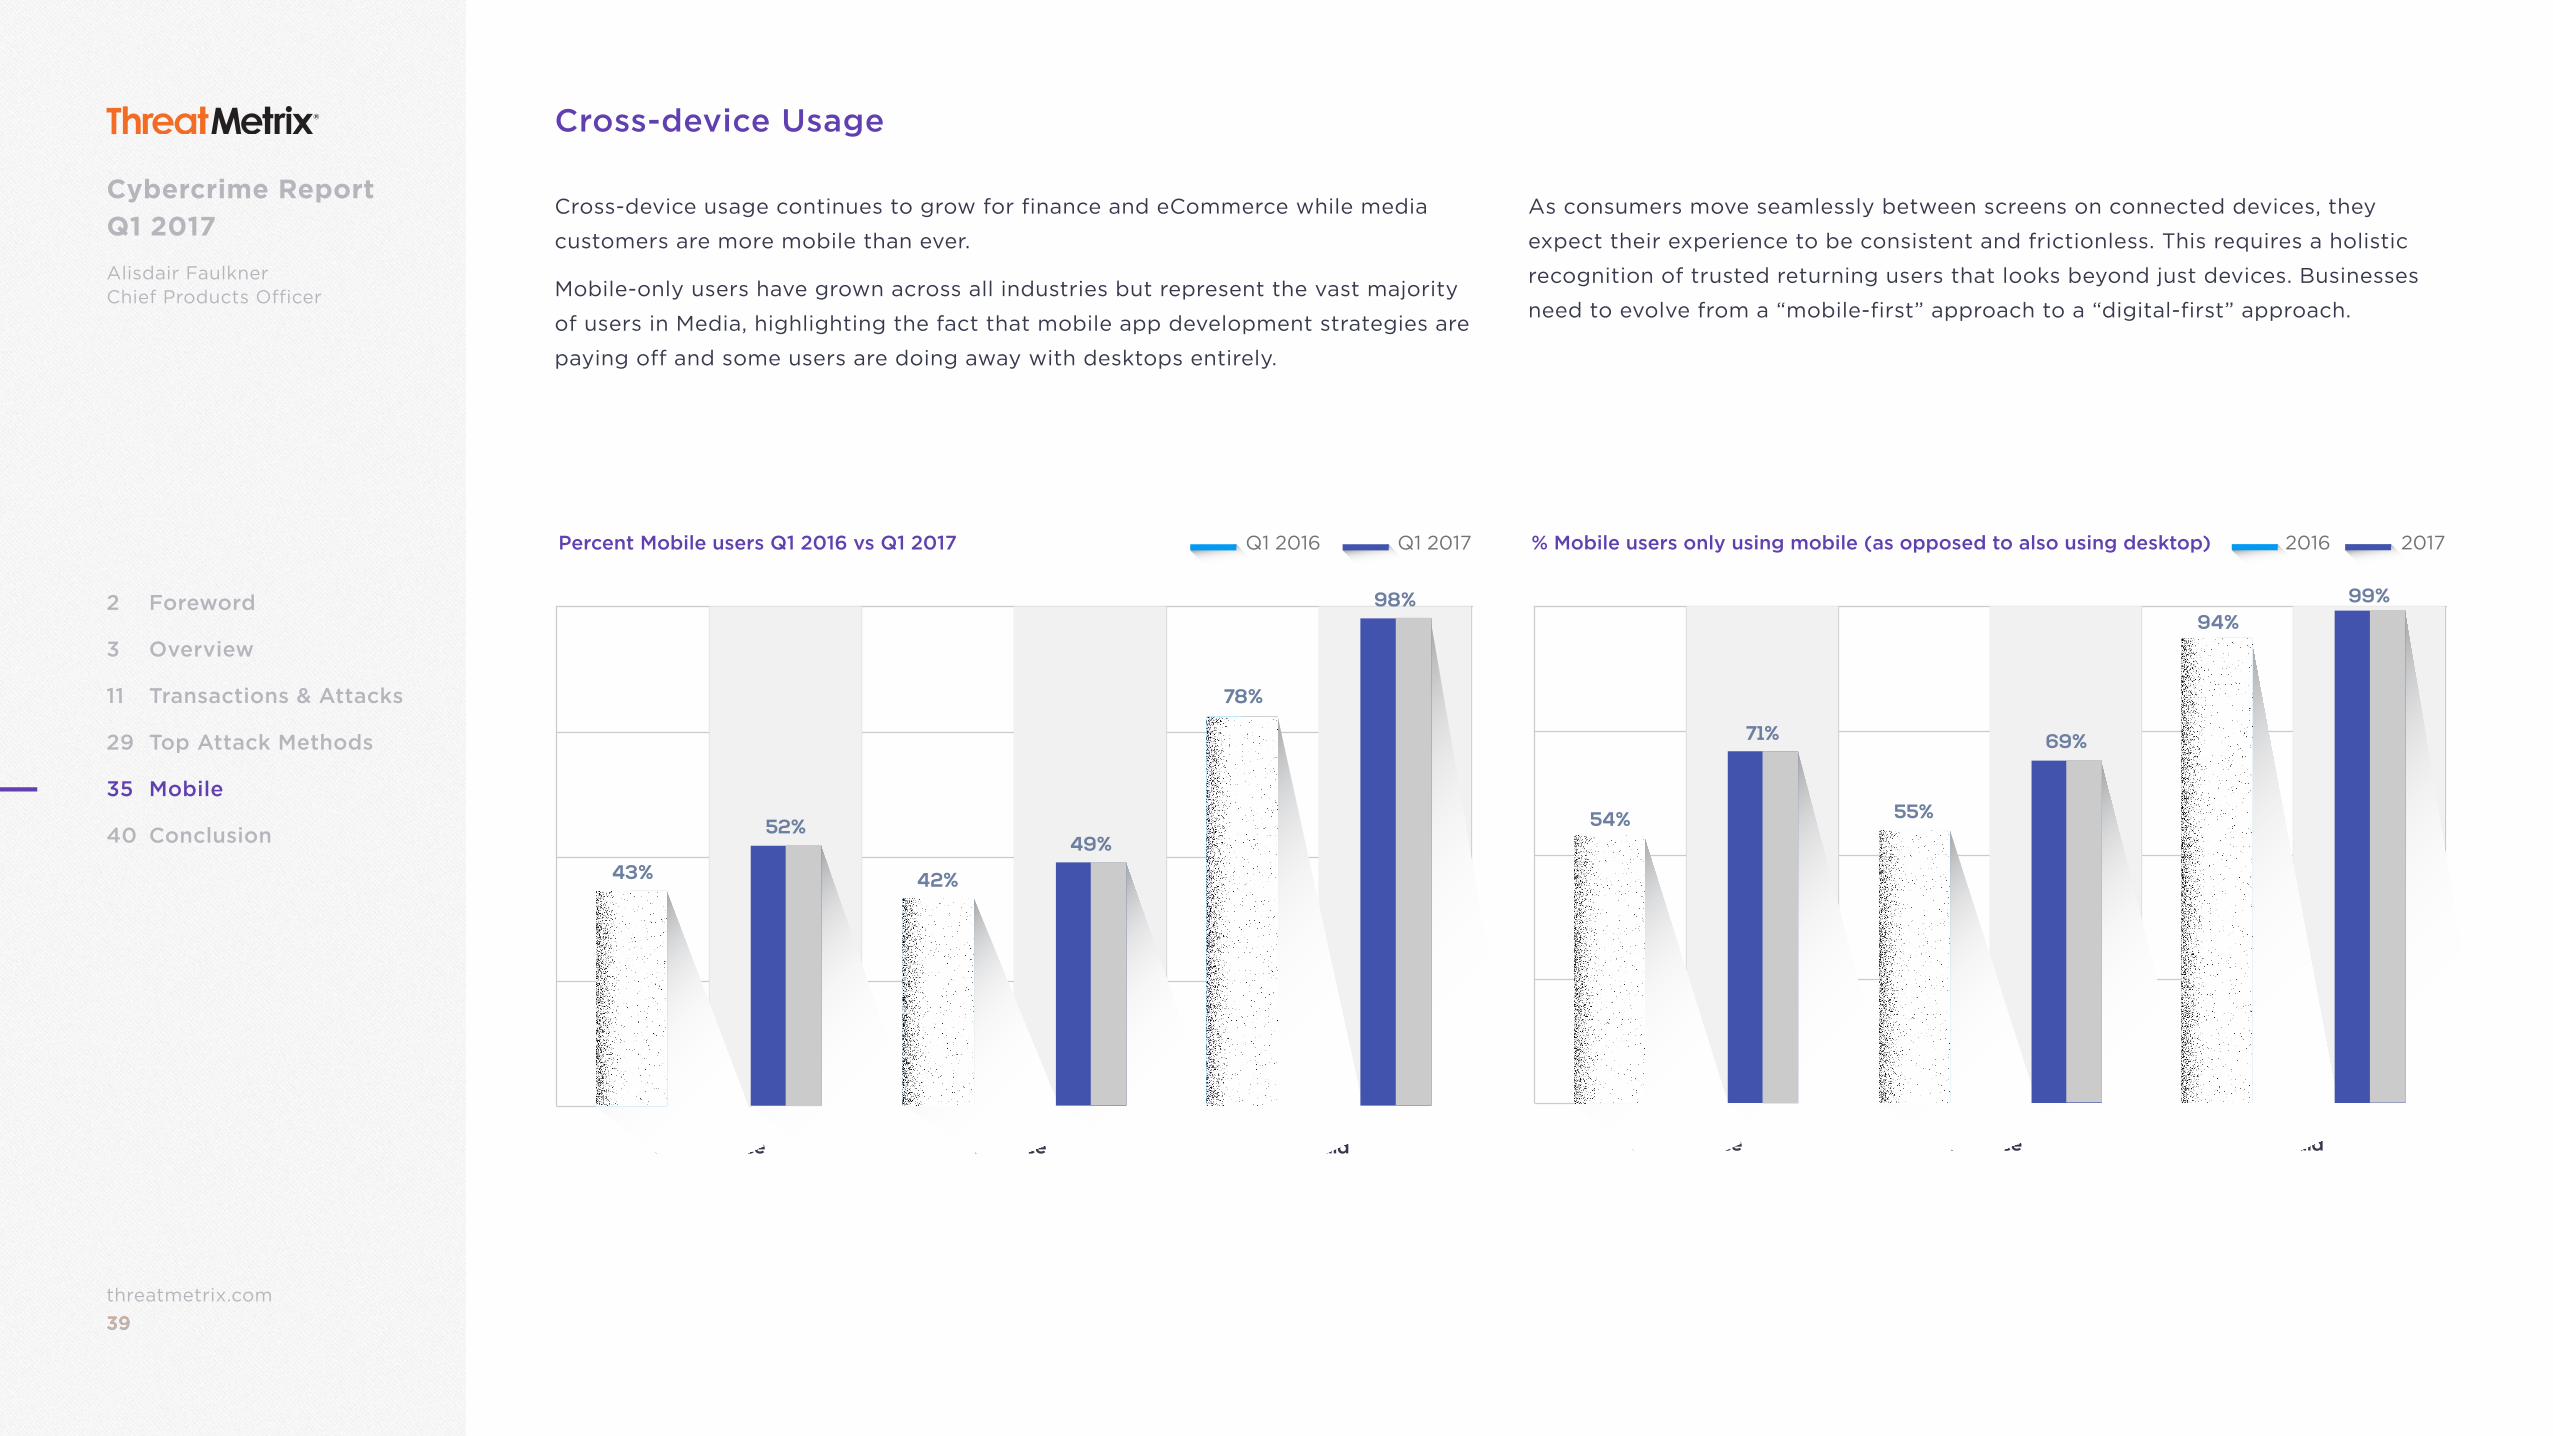
Cross-device Usage
Cross-device usage continues to grow for finance and eCommerce while media
customers are more mobile than ever.
Mobile-only users have grown across all industries but represent the vast majority
of users in Media, highlighting the fact that mobile app development strategies are
paying off and some users are doing away with desktops entirely.
As consumers move seamlessly between screens on connected devices, they
expect their experience to be consistent and frictionless. This requires a holistic
recognition of trusted returning users that looks beyond just devices. Businesses
need to evolve from a “mobile-first” approach to a “digital-first” approach.
eCommerce Finance Media
43%
52%
42%
49%
78%
98%
Percent Mobile users Q1 2016 vs Q1 2017 Q1 2016 Q1 2017
eCommerce Finance Media
54%
71%
55%
69%
94%99%
% Mobile users only using mobile (as opposed to also using desktop) 2016 2017
40threatmetrix.com40
Cybercrime Report Q1 2017Alisdair FaulknerChief Products Officer
2 Foreword
3 Overview
11 Transactions & Attacks
29 Top Attack Methods
35 Mobile
40 Conclusion
Conclusion
The rapid digitization of banking and commerce has made it easier than ever for customers to switch providers or try out competitor sites at the touch of a button.
Loyalty is hard fought and highly coveted. Customers defect to competitors for a variety of reasons, from poor online experiences and unnecessary friction to a
devastating account hack; businesses must continue to focus on an end-to-end view of their users across the entire customer lifecycle in order to nurture loyalty and
protect lifetime value.
Perversely, this same landscape has fostered a loyal cybercriminal base that keeps returning to digital businesses with the aim to steal credentials, gain access to
customer accounts or make purchases using stolen payment credentials. Fraudsters have access to more advanced tools than ever and are able to quickly evolve their
attack patterns by leveraging new combinations of attack vectors. Businesses must not rest on their laurels; they have to be alert to new social engineering attacks
that are more convincing than ever, more complex bots attacks that might well appear like legitimate customer traffic, and remote access attacks that to all intents and
purposes appear to be from the real customer.
Let’s return our focus to these highly coveted loyal customers: digital businesses must target their efforts on prioritizing digital transformation strategies that nurture
and develop the customer experience. This is underpinned by the provision of solutions that can effectively provide end-to-end fraud and security management,
and more accurate risk decisioning based on dynamic and global data. In an ever evolving digital world, decisions need to be instant with the underlying assessment
invisible (passive) to end users. The best form of strong authentication will surely be the forms that are virtually invisible to the end user, removing step-up barriers
and unnecessary friction.
The ThreatMetrix solution is predicated on the power of Digital Identities. A digital identity is built using the unique online footprint that a user creates as they transact
online; analyzing the almost infinite connections between a user’s devices, locations, identity information and threat intelligence. Integrating this dynamic intelligence
into business processes and workflows relies on an intuitive and highly adaptable decision platform. The ThreatMetrix Dynamic Decision Platform operationalizes
Digital Identity Intelligence using Smart Analytics for advanced behavioral analytics and machine learning, an Integration Hub to facilitate pre-packaged and
customized third party services and Case Management for visualization, data correlation and exception handling.
41threatmetrix.com41
2 Foreword
3 Overview
11 Transactions & Attacks
29 Top Attack Methods
35 Mobile
40 Conclusion
Cybercrime Report Q1 2017
Alisdair FaulknerChief Products Officer
Glossary
Industry Types
Financial Services includes mobile banking, online banking, online money transfer,
lending, brokerage, alternative payments and credit card issuance.
FinTech includes companies that use technology to make financial services
more efficient with a purpose of disrupting incumbent financial systems and
corporations that rely less on software.
ecommerce includes retail, airlines, travel, marketplaces, ticketing and digital
goods businesses.
Media includes social networks, content streaming, gambling, gaming and online
dating sites.
Common Attacks
Account Creation Fraud: Using stolen, compromised or synthetic identities,
typically through a spoofed location, to create a new account to access online
services or obtain lines of credit.
Account Login Fraud: Attacks targeted at taking over user accounts using
previously stolen credentials available in the wild or credentials compromised by
malware or Man-in-the-Middle attacks.
Payments Fraud: Using stolen payment credentials to conduct illegal money
transfers or online payments via alternative online payment methods such as
direct deposit.
Percentages
Transaction Type Percentages are based on the number of transactions (account
creation, account login and payments) from mobile devices and computers
received and processed by the ThreatMetrix Digital Identity Network.
Attack Percentages are based on transactions identified as high-risk and classified
as attacks, by use case. Events identified as attacks are typically blocked or
rejected automatically, in real time dependent on individual customer use cases.
42threatmetrix.com42
2 Foreword
3 Overview
11 Transactions & Attacks
29 Top Attack Methods
35 Mobile
40 Conclusion
Cybercrime Report Q1 2017
Alisdair FaulknerChief Products Officer
Glossary
Attack Explanations
Device Spoofing: Hackers delete and change browser settings in order to change
their device identity or fingerprint, or attempt to appear to come from a victim’s
device. ThreatMetrix-patented cookieless device identification is able to detect
returning visitors even when cookies are deleted or changes are made to browser
settings. To differentiate between cybercriminals and legitimate customers who
occasionally clear cookies, only high risk / high velocity cookie deletions (such as
a high number of repeat visits per hour / day) are included in the analysis.
Identity Spoofing: Using a stolen identity, credit card or compromised username
/ password combination to attempt fraud or account takeover. Typically, identity
spoofing is detected based on high velocity of identity usage for a given device,
detecting the same device accessing multiple unrelated user accounts or unusual
identity linkages and usage.
IP Address Spoofing: Cybercriminals use proxies to bypass traditional IP
geolocation filters, and use IP spoofing techniques to evade velocity filters and
blacklists. ThreatMetrix directly detects IP spoofing via both active and passive
browser and network packet fingerprinting techniques.
Man-in-the-Browser (MitB) and Bot Detection: Man-in-the-browser attacks use
sophisticated Trojans to steal login information and one-time-passwords (such
as SMS out-of-band authentication messages) from a user’s browser. Bots are
automated scripts that attempt to gain access to accounts with stolen credentials
or create fake accounts and transactions.
Crimeware Tools: Crimeware refers to malware specifically designed to automate
cybercrime. These tools help fraudsters create, customize and distribute malware
to perpetrate identity theft through social engineering or technical stealth.
Low and Slow Bots: Refers to low frequency botnet attacks designed to evade rate
and security control measures, and thus evade detection. These attacks use slow
traffic that not only appears legitimate but also bypasses any triggers set around
protocols and rules.
43threatmetrix.com43
2 Foreword
3 Overview
11 Transactions & Attacks
29 Top Attack Methods
35 Mobile
40 Conclusion
Cybercrime Report Q1 2017
Alisdair FaulknerChief Products Officer
Contact
San Jose (Corporate Headquarters)
160 W Santa Clara St, Suite 1400San Jose, CA 95113 Telephone: +1 408 200 5755Fax: +1 408 200 5799
Amsterdam
The Base, Tower CEvert van de Beekstraat 11118 CL SchipholThe NetherlandsTelephone: +31 (0) 20 800 0637
Japan
Otemachi Bldg. 4F FINOLAB1-6-1 Otemachi, Chiyoda-ku,Tokyo 100-0004 JapanPhone: +81-(0)3-4530-9576
Hong Kong
Telephone: +852 36 698 341
Sydney
Suite 1202, Level 12, Tower B799 Pacific HighwayChatswood NSW 2067 AustraliaTelephone: +61 2 9411 4499
SALES
Telephone: +1 408 200 5700Email: [email protected]
SUPPORT
Telephone: +1 408 200 5754 / +1 888 341 9377Email: [email protected]
PARTNERS
Email: [email protected]
PUBLIC RELATIONS
Paris
13 Rue Camille Desmoulins92130 Issy-les-MoulineauxFrance Telephone: +33 (0) 1 58 04 24 03
New York
5 Penn Plaza, 23rd FloorNew York, NY 10001Telephone: +1 212 896 3987
London
201 Borough High StreetLondon, SE1 1JA, United KingdomTelephone: +44 (0) 20 3239 2601