Embed Size (px)
Citation preview

Digital Advertising Report Adobe Digital Index | Q1 2015
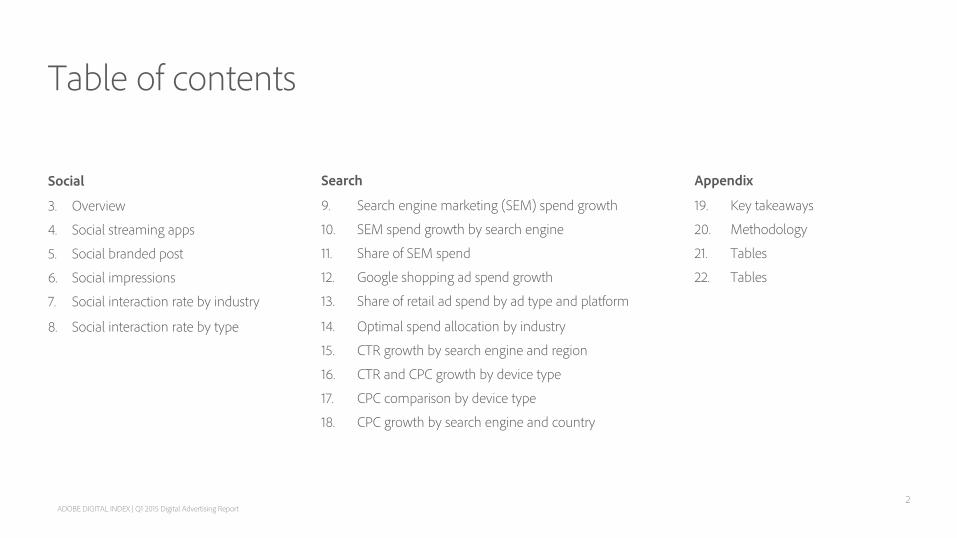
Table of contents
Social
3. Overview
4. Social streaming apps
5. Social branded post
6. Social impressions
7. Social interaction rate by industry
8. Social interaction rate by type
ADOBE DIGITAL INDEX | Q1 2015 Digital Advertising Report
Search
9. Search engine marketing (SEM) spend growth
10. SEM spend growth by search engine
11. Share of SEM spend
12. Google shopping ad spend growth
13. Share of retail ad spend by ad type and platform
14. Optimal spend allocation by industry
15. CTR growth by search engine and region
16. CTR and CPC growth by device type
17. CPC comparison by device type
18. CPC growth by search engine and country
Appendix
19. Key takeaways
20. Methodology
21. Tables
22. Tables
2
This report covers a broad range of the digital advertising industry with insights coming from both social media marketing as well as search engine marketing. Topics include:
• Emerging social media apps
• Facebook ad impression growth and interaction rates
• Search engine spend, click-through-rates (CTR), and cost-per-click (CPC) across different regions and devices
• Emerging search engine products like shopping ads and product ads
• Habits and behaviors of effective digital advertisers
ADOBE DIGITAL INDEX | Q1 2015 Digital Advertising Report
ADOBE DIGITAL INDEX
Overview
3
ADOBE DIGITAL INDEX | Q1 2015 Digital Advertising Report
SOCIAL
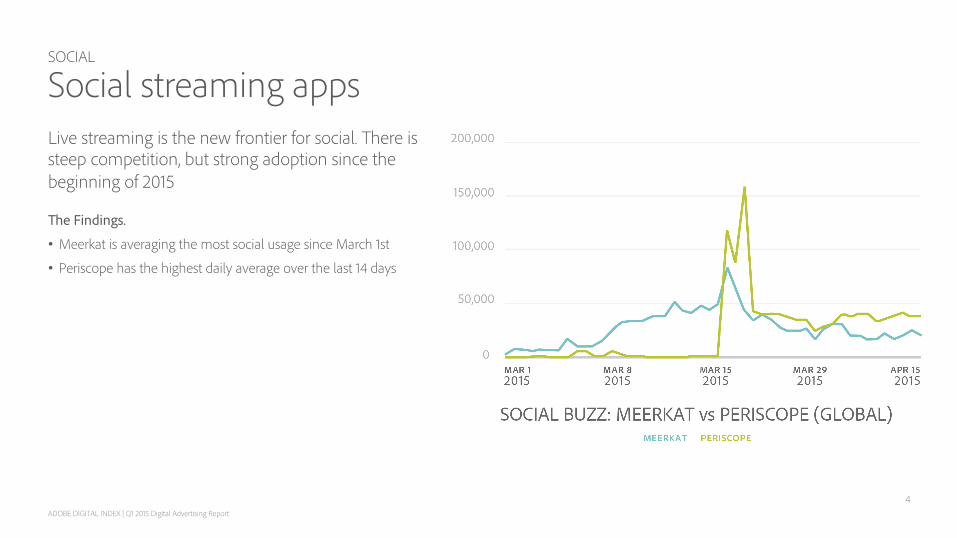
Social streaming apps Live streaming is the new frontier for social. There is steep competition, but strong adoption since the beginning of 2015
The Findings.
• Meerkat is averaging the most social usage since March 1st
• Periscope has the highest daily average over the last 14 days
4
ADOBE DIGITAL INDEX | Q1 2015 Digital Advertising Report
SOCIAL
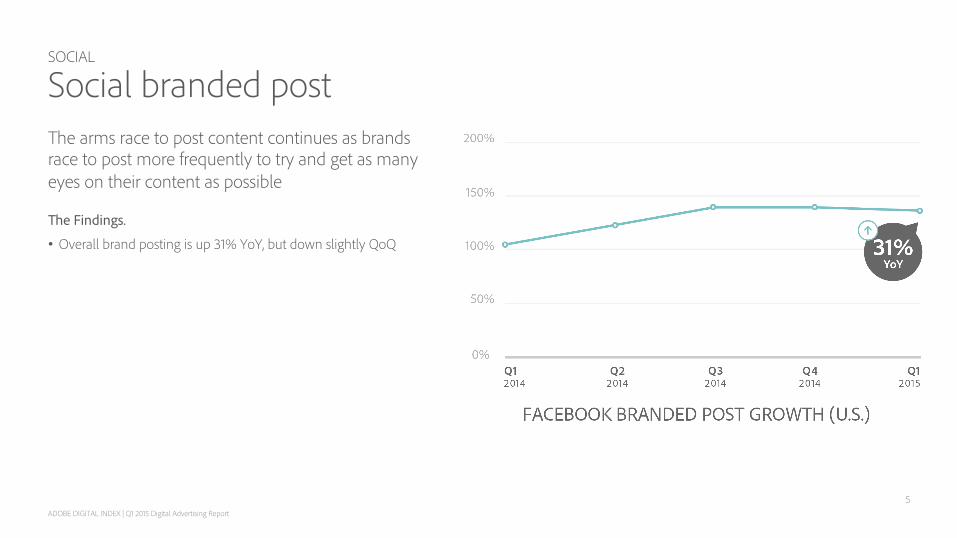
Social branded post The arms race to post content continues as brands race to post more frequently to try and get as many eyes on their content as possible
The Findings.
• Overall brand posting is up 31% YoY, but down slightly QoQ
5
ADOBE DIGITAL INDEX | Q1 2015 Digital Advertising Report
SOCIAL
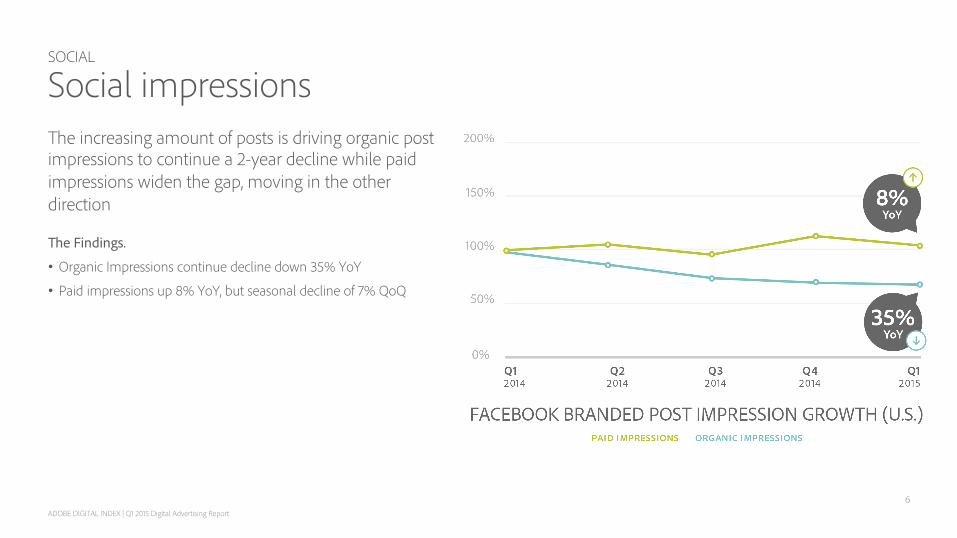
Social impressions The increasing amount of posts is driving organic post impressions to continue a 2-year decline while paid impressions widen the gap, moving in the other direction
The Findings.
• Organic Impressions continue decline down 35% YoY
• Paid impressions up 8% YoY, but seasonal decline of 7% QoQ
6
ADOBE DIGITAL INDEX | Q1 2015 Digital Advertising Report
SOCIAL
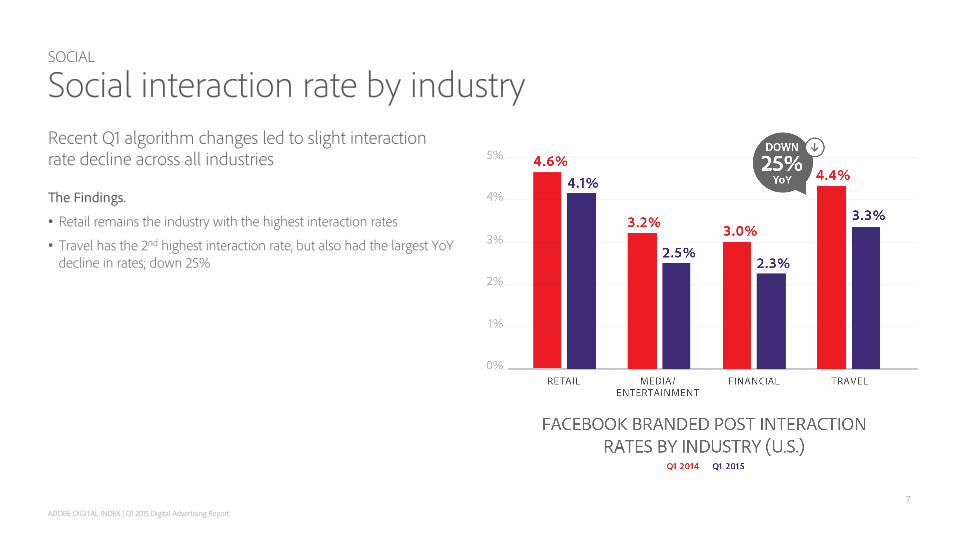
Social interaction rate by industry Recent Q1 algorithm changes led to slight interaction rate decline across all industries
The Findings.
• Retail remains the industry with the highest interaction rates
• Travel has the 2nd highest interaction rate, but also had the largest YoY decline in rates; down 25%
7
ADOBE DIGITAL INDEX | Q1 2015 Digital Advertising Report
SOCIAL
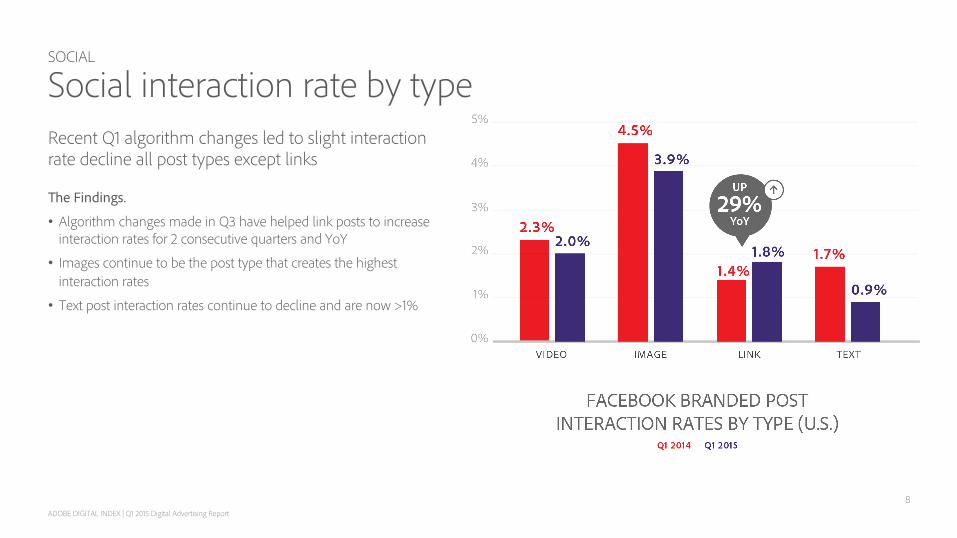
Social interaction rate by type Recent Q1 algorithm changes led to slight interaction rate decline all post types except links
The Findings.
• Algorithm changes made in Q3 have helped link posts to increase interaction rates for 2 consecutive quarters and YoY
• Images continue to be the post type that creates the highest interaction rates
• Text post interaction rates continue to decline and are now >1%
8
ADOBE DIGITAL INDEX | Q1 2015 Digital Advertising Report
SEARCH
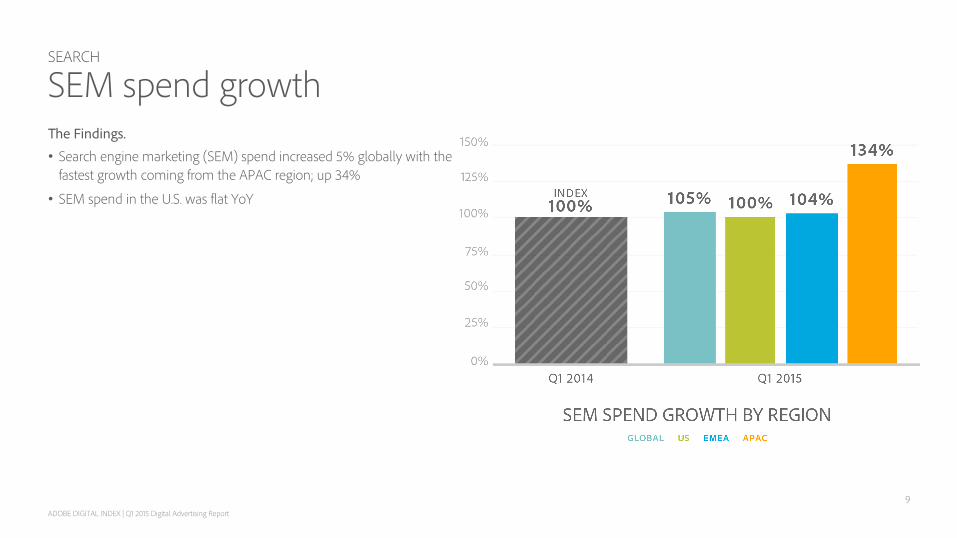
SEM spend growth The Findings. • Search engine marketing (SEM) spend increased 5% globally with the
fastest growth coming from the APAC region; up 34%
• SEM spend in the U.S. was flat YoY
9
ADOBE DIGITAL INDEX | Q1 2015 Digital Advertising Report
SEARCH
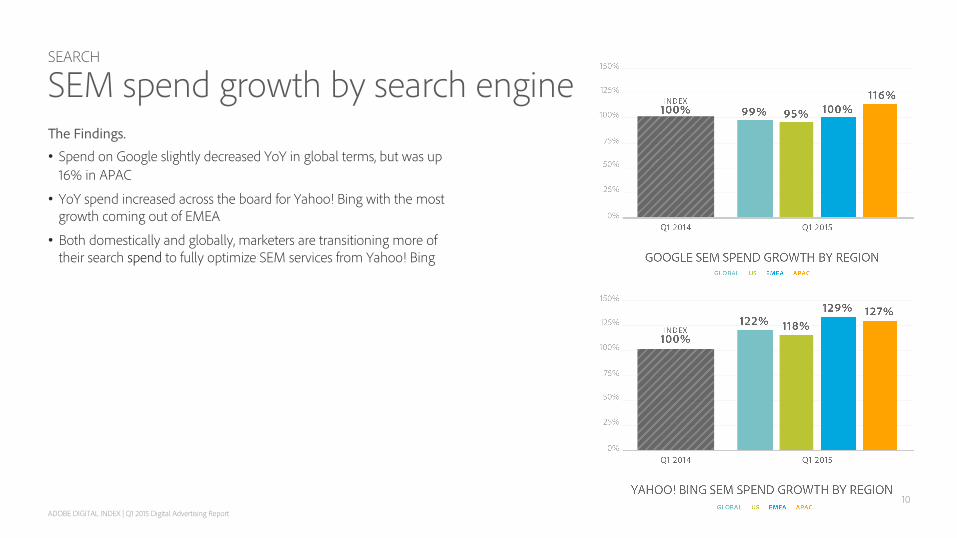
SEM spend growth by search engine The Findings. • Spend on Google slightly decreased YoY in global terms, but was up
16% in APAC
• YoY spend increased across the board for Yahoo! Bing with the most growth coming out of EMEA
• Both domestically and globally, marketers are transitioning more of their search spend to fully optimize SEM services from Yahoo! Bing
10
ADOBE DIGITAL INDEX | Q1 2015 Digital Advertising Report
SEARCH
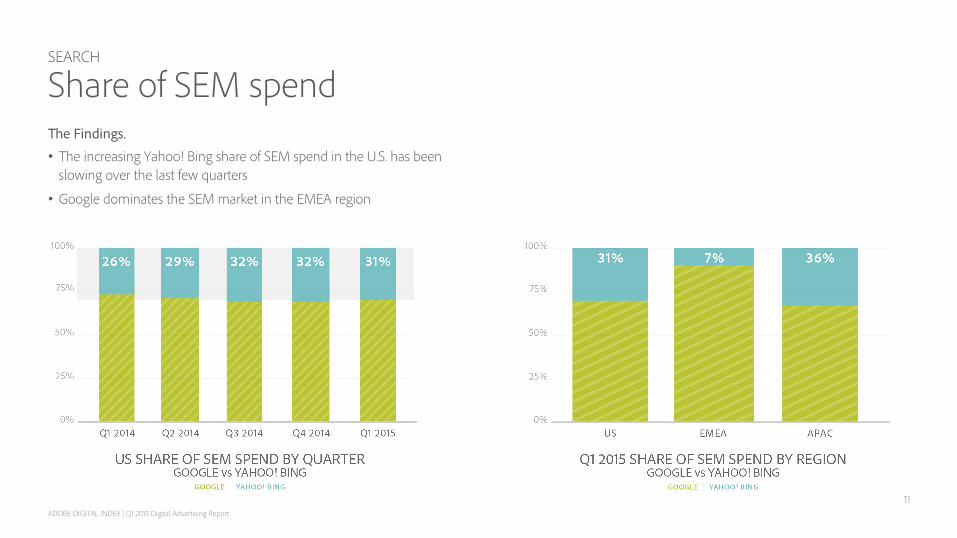
Share of SEM spend The Findings. • The increasing Yahoo! Bing share of SEM spend in the U.S. has been
slowing over the last few quarters
• Google dominates the SEM market in the EMEA region
11
ADOBE DIGITAL INDEX | Q1 2015 Digital Advertising Report
SEARCH
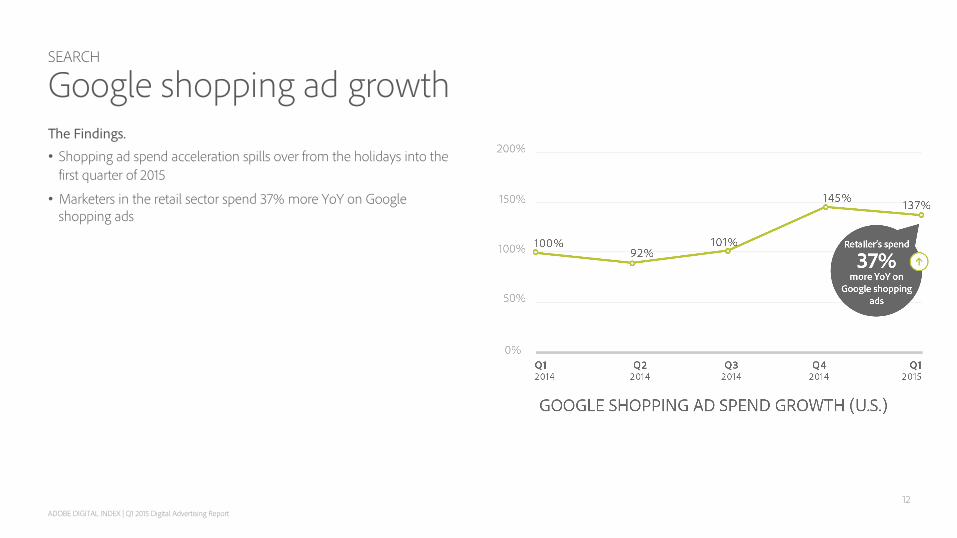
Google shopping ad growth The Findings. • Shopping ad spend acceleration spills over from the holidays into the first quarter of 2015
• Marketers in the retail sector spend 37% more YoY on Google shopping ads
12
ADOBE DIGITAL INDEX | Q1 2015 Digital Advertising Report
SEARCH
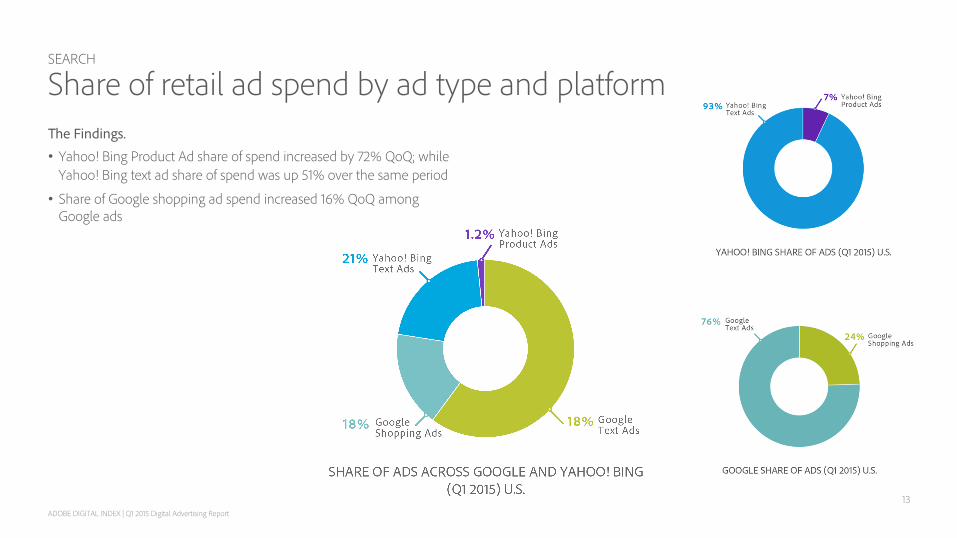
Share of retail ad spend by ad type and platform The Findings. • Yahoo! Bing Product Ad share of spend increased by 72% QoQ; while
Yahoo! Bing text ad share of spend was up 51% over the same period
• Share of Google shopping ad spend increased 16% QoQ among Google ads
13
ADOBE DIGITAL INDEX | Q1 2015 Digital Advertising Report
SEARCH
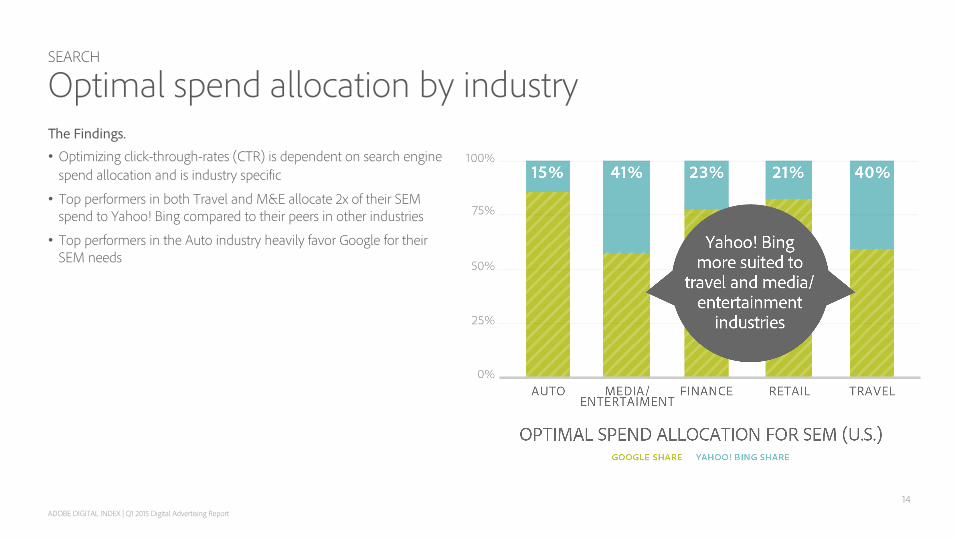
Optimal spend allocation by industry The Findings. • Optimizing click-through-rates (CTR) is dependent on search engine
spend allocation and is industry specific
• Top performers in both Travel and M&E allocate 2x of their SEM spend to Yahoo! Bing compared to their peers in other industries
• Top performers in the Auto industry heavily favor Google for their SEM needs
14
ADOBE DIGITAL INDEX | Q1 2015 Digital Advertising Report
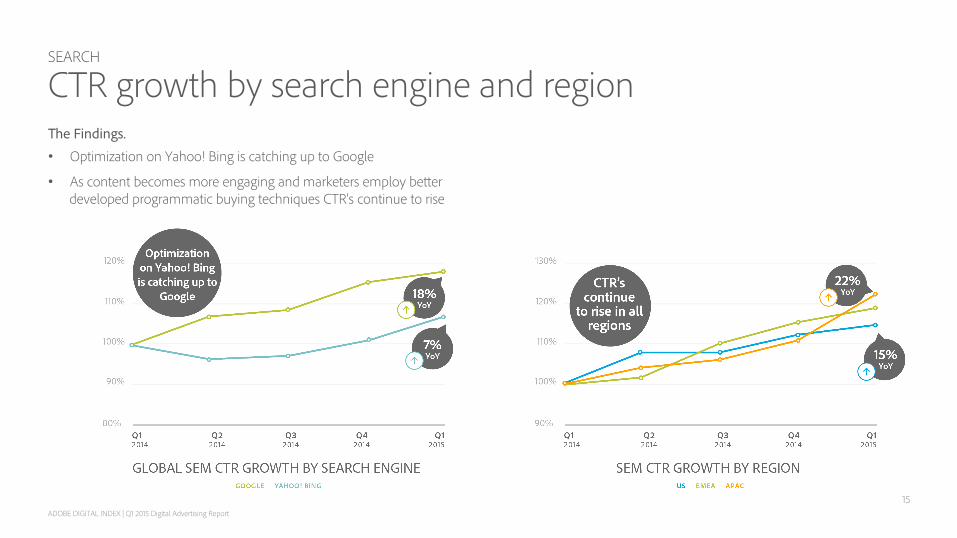
SEARCH
CTR growth by search engine and region The Findings. • Optimization on Yahoo! Bing is catching up to Google
• As content becomes more engaging and marketers employ better developed programmatic buying techniques CTR’s continue to rise
15
ADOBE DIGITAL INDEX | Q1 2015 Digital Advertising Report
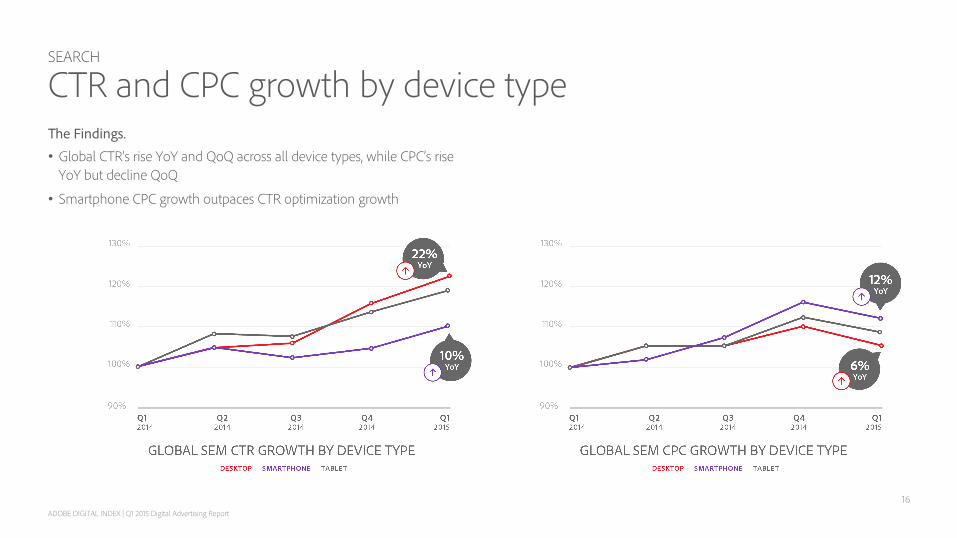
SEARCH
CTR and CPC growth by device type The Findings. • Global CTR’s rise YoY and QoQ across all device types, while CPC’s rise
YoY but decline QoQ
• Smartphone CPC growth outpaces CTR optimization growth
16
ADOBE DIGITAL INDEX | Q1 2015 Digital Advertising Report
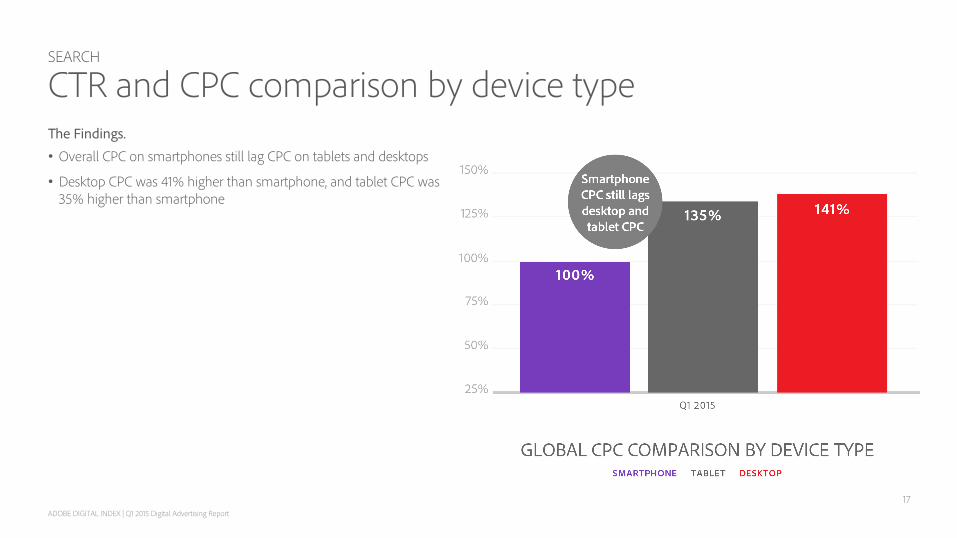
SEARCH
CTR and CPC comparison by device type The Findings. • Overall CPC on smartphones still lag CPC on tablets and desktops
• Desktop CPC was 41% higher than smartphone, and tablet CPC was 35% higher than smartphone
17
ADOBE DIGITAL INDEX | Q1 2015 Digital Advertising Report
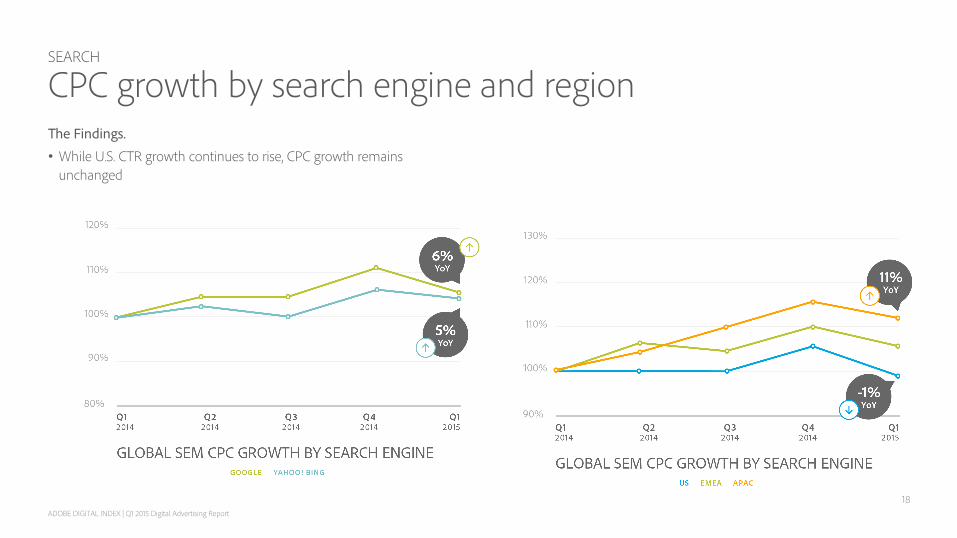
SEARCH
CPC growth by search engine and region The Findings. • While U.S. CTR growth continues to rise, CPC growth remains
unchanged
18
ADOBE DIGITAL INDEX | Q1 2015 Digital Advertising Report
ADOBE DIGITAL INDEX
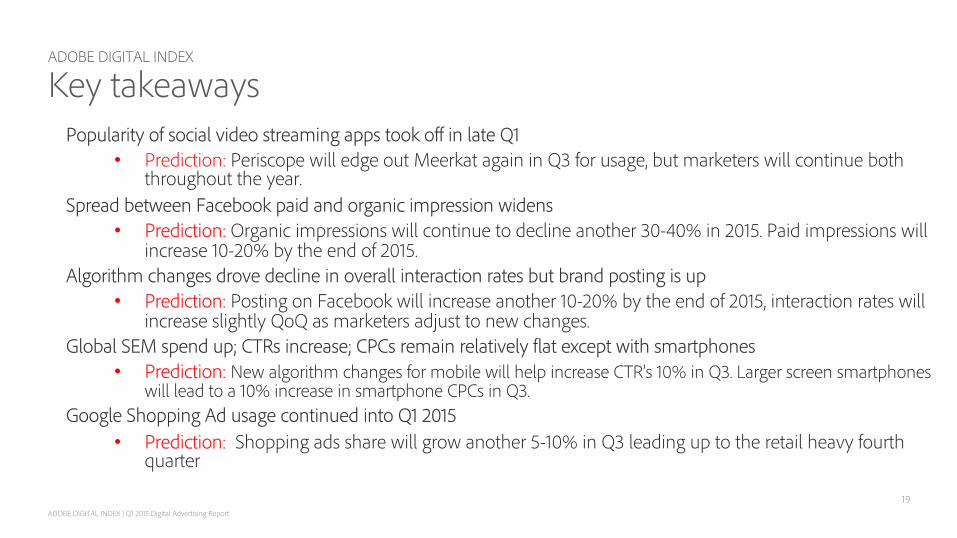
Key takeaways Popularity of social video streaming apps took off in late Q1
• Prediction: Periscope will edge out Meerkat again in Q3 for usage, but marketers will continue both throughout the year.
Spread between Facebook paid and organic impression widens • Prediction: Organic impressions will continue to decline another 30-40% in 2015. Paid impressions will
increase 10-20% by the end of 2015. Algorithm changes drove decline in overall interaction rates but brand posting is up
• Prediction: Posting on Facebook will increase another 10-20% by the end of 2015, interaction rates will increase slightly QoQ as marketers adjust to new changes.
Global SEM spend up; CTRs increase; CPCs remain relatively flat except with smartphones • Prediction: New algorithm changes for mobile will help increase CTR’s 10% in Q3. Larger screen smartphones
will lead to a 10% increase in smartphone CPCs in Q3. Google Shopping Ad usage continued into Q1 2015
• Prediction: Shopping ads share will grow another 5-10% in Q3 leading up to the retail heavy fourth quarter
19
ADOBE DIGITAL INDEX | Q1 2015 Digital Advertising Report
Based on consumer data to brand sites during 2014 and 2015.
• + 490 billion Facebook post impressions • +525 billion Google and Yahoo! Bing ad impressions • +2 million social streaming app mentions
Composed of aggregated and anonymous data from visits to websites in multiple industries and segments.
Data captured via Adobe Marketing Cloud—Adobe Media Optimizer, and Adobe Social.
Visit our website: adobe.ly/digitalindex
Read our blog: adobe.ly/digitalindex
Follow us: @adobeindex and @adobeprimetime
Ask a question or make a suggestion: [email protected]
20
ADOBE DIGITAL INDEX
Methodology
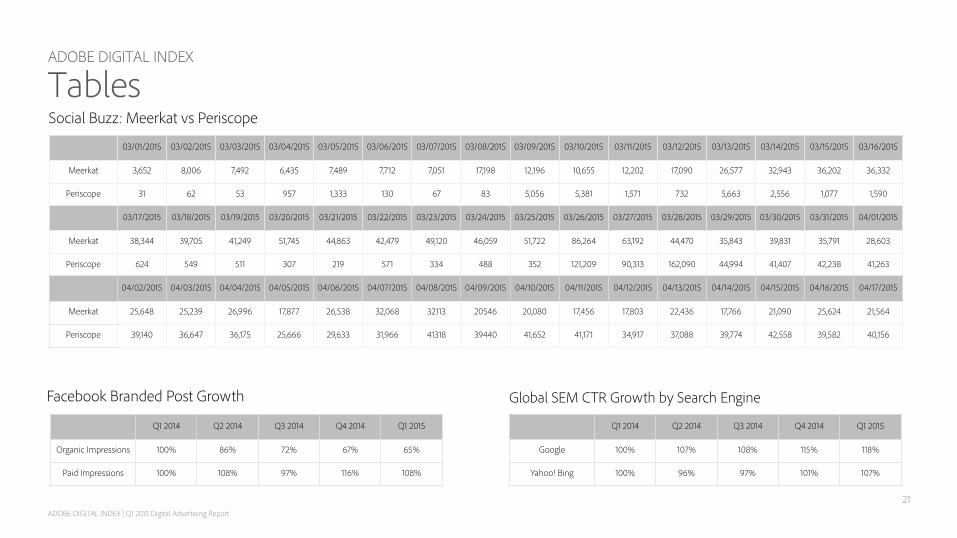
03/01/2015 03/02/2015 03/03/2015 03/04/2015 03/05/2015 03/06/2015 03/07/2015 03/08/2015 03/09/2015 03/10/2015 03/11/2015 03/12/2015 03/13/2015 03/14/2015 03/15/2015 03/16/2015
Meerkat 3,652 8,006 7,492 6,435 7,489 7,712 7,051 17,198 12,196 10,655 12,202 17,090 26,577 32,943 36,202 36,332
Periscope 31 62 53 957 1,333 130 67 83 5,056 5,381 1,571 732 5,663 2,556 1,077 1,590
Social Buzz: Meerkat vs Periscope
03/17/2015 03/18/2015 03/19/2015 03/20/2015 03/21/2015 03/22/2015 03/23/2015 03/24/2015 03/25/2015 03/26/2015 03/27/2015 03/28/2015 03/29/2015 03/30/2015 03/31/2015 04/01/2015
Meerkat 38,344 39,705 41,249 51,745 44,863 42,479 49,120 46,059 51,722 86,264 63,192 44,470 35,843 39,831 35,791 28,603
Periscope 624 549 511 307 219 571 334 488 352 121,209 90,313 162,090 44,994 41,407 42,238 41,263
04/02/2015 04/03/2015 04/04/2015 04/05/2015 04/06/2015 04/07/2015 04/08/2015 04/09/2015 04/10/2015 04/11/2015 04/12/2015 04/13/2015 04/14/2015 04/15/2015 04/16/2015 04/17/2015
Meerkat 25,648 25,239 26,996 17,877 26,538 32,068 32113 20546 20,080 17,456 17,803 22,436 17,766 21,090 25,624 21,564
Periscope 39,140 36,647 36,175 25,666 29,633 31,966 41318 39440 41,652 41,171 34,917 37,088 39,774 42,558 39,582 40,156
Q1 2014 Q2 2014 Q3 2014 Q4 2014 Q1 2015
Google 100% 107% 108% 115% 118%
Yahoo! Bing 100% 96% 97% 101% 107%
Global SEM CTR Growth by Search Engine
Q1 2014 Q2 2014 Q3 2014 Q4 2014 Q1 2015
Organic Impressions 100% 86% 72% 67% 65%
Paid Impressions 100% 108% 97% 116% 108%
Facebook Branded Post Growth
ADOBE DIGITAL INDEX | Q1 2015 Digital Advertising Report
ADOBE DIGITAL INDEX
Tables
21
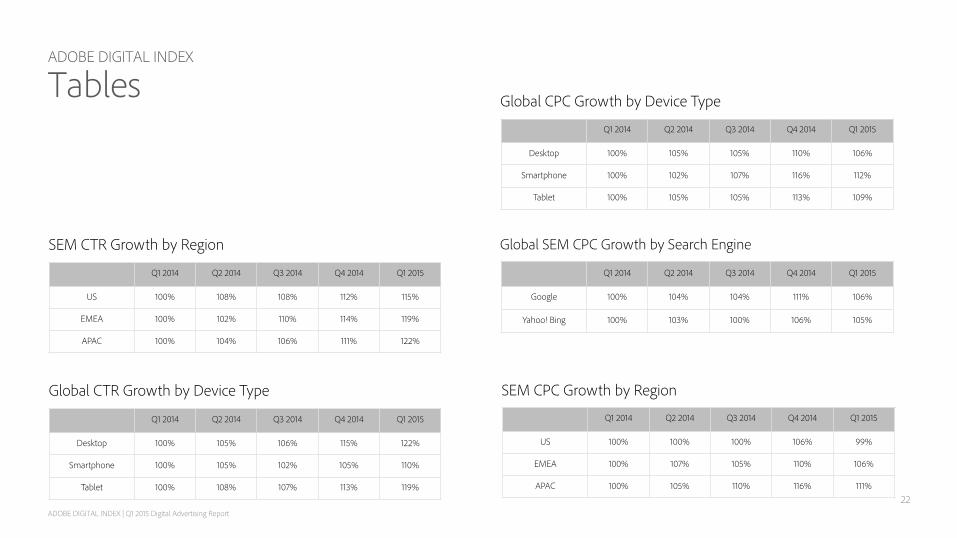
Q1 2014 Q2 2014 Q3 2014 Q4 2014 Q1 2015
US 100% 108% 108% 112% 115%
EMEA 100% 102% 110% 114% 119%
APAC 100% 104% 106% 111% 122%
SEM CTR Growth by Region
Q1 2014 Q2 2014 Q3 2014 Q4 2014 Q1 2015
Desktop 100% 105% 106% 115% 122%
Smartphone 100% 105% 102% 105% 110%
Tablet 100% 108% 107% 113% 119%
Global CTR Growth by Device Type
Q1 2014 Q2 2014 Q3 2014 Q4 2014 Q1 2015
Desktop 100% 105% 105% 110% 106%
Smartphone 100% 102% 107% 116% 112%
Tablet 100% 105% 105% 113% 109%
Global CPC Growth by Device Type
Q1 2014 Q2 2014 Q3 2014 Q4 2014 Q1 2015
Google 100% 104% 104% 111% 106%
Yahoo! Bing 100% 103% 100% 106% 105%
Global SEM CPC Growth by Search Engine
Q1 2014 Q2 2014 Q3 2014 Q4 2014 Q1 2015
US 100% 100% 100% 106% 99%
EMEA 100% 107% 105% 110% 106%
APAC 100% 105% 110% 116% 111%
SEM CPC Growth by Region
ADOBE DIGITAL INDEX | Q1 2015 Digital Advertising Report
ADOBE DIGITAL INDEX
Tables
22