Embed Size (px)
Citation preview

1
Q1 FY11 Analyst Presentation
28th July 2010
Q1 FY11 Analyst Presentation Q1 FY11 Analyst Presentation
2828thth July 2010July 2010

2
SAFE HARBOUR
This presentation contains certain forward looking statements concerning DLF’s future business prospects and business profitability, which are subject to a number of risks and uncertainties and the actual results could materially differ from those in such forward looking statements. The risks and uncertainties relating to these statements include, but not limited to, risks and uncertainties, regarding fluctuations in earnings, our ability to manage growth, competition , economic growth in India, ability to attract and retain highly skilled professionals, time and cost over runs on contracts, government policies and actions with respect to investments, fiscal deficits, regulation etc., interest and other fiscal cost generally prevailing in the economy. The company does not undertake to make any announcement in case any of these forward looking statements become materially incorrect in future or update any forward looking statements made from time to time on behalf of the company.

3
FY 11 ..An Optimistic Start……..
Strong GDP growth outlook, robust business confidence parameters and positive consumer sentiment continue to lead the India growth story
On going recovery in real estate seems well entrenched & broad based across segments
Homes Focus on ongoing project execution, lower number of new launches Continuing buyer interest Pricing at reasonable levels, price volume equation stabilized
Offices Leasing momentum improving Uncertainty on DTC impacting IT SEZs in the near term
Retail Signs of enquiry / interest in select locations…footfalls improving significantly Clarity on FDI policy in multi-brand retail could be potential trigger for growth
Industry Outlook - FY11
Inflationary concerns and aggressive policy actions may impact demand / margins in the near term
Select developers more focused on execution than in the past
Pace of launches to increase over progressive quarters with more emphasis in H2 FY 11

4
Performance of Company – Q1 FY11
DevCo:
1.9 msf sales booked vs 2.7 msf in Q1 10 & 3.6 msf in Q4 10
Phase V city center projects – 0.66 msf
MICO city center Chennai (soft launch) – 0.23 msf
New Gurgaon, Chennai, Bangalore and Panchkula mid-income homes – 0.84 msf
RentCo :
0.98 msf of leasing vs 0.01 msf in Q1 10 & 0.69 msf in Q4 10
Higher number of enquiries / transactions being converted into actual leasing .
Rentals stable, current 0.93 msf (offices) leasing done within the range prevalent in respective micro markets
Divestment of non-core assets - Rs. 294 Crs
Delivery- 1.37 msf handed over during the Qtr comprising of offices & commercial complexes– Started handing over Magnolias
towers for starting interior works

5
Profit & Loss Summary – Q1 FY11
Q1 FY 11 vs Q4 FY 10
Sales(incl Other Income) at Rs 2161 Cr, compared to Rs 2146 Cr in Q4 FY 10.
Net profit at Rs 411 Cr , as against Rs 426 Cr in Q4 FY 10; Rs 396 Cr in Q1 FY10
EBIDTA margins at 51% versus 53%
Profitability All figures in Rs. Crs
Particulars Q1 11 Q4 10 Change Q1 11 Q1 10 Change
Sales 2161 2146 1% 2161 1746 24%
EBIDTA ( Core Operations ) 1164 1222 -5% 1164 874 33%
EBIDTA ( Consolidated ) 1112 1152 -3% 1112 840 32%
% 51 53 51 47
PBT ( Consolidated ) 574 742 -23% 574 478 20%
PAT 411 426 -4% 411 396 4%
6
Consolidated P&L – Q1 FY11
Above figures includes losses from non-core businesses .i.e. Hotels & the DLF Pramerica Life Insurance businesses
Sl.No. Consolidated Financials Rs. Crs. Percentage of Total Revenue Rs. Crs. Percentage of
Total Revenue Rs. Crs. Percentage of Total Revenue Rs. Crs. Percentage of
Total Revenue
A)1 Sales and Other Receipts 2,029 1,650 1,994 7,423 2 Other Income 132 96 152 428
Total Income(A1+A2) 2,161 100% 1,746 100% 2,146 100% 7,851 100%
B) Total Expenditure(B1+B2+B3) 1,049 49 906 52 994 46 3,912 501 Construction Cost 734 34 666 38 607 28 2,580 332 Staff cost 129 6 113 6 119 6 467 63 Other Expenditure 186 9 127 7 268 12 865 11
C) Gross Profit Margin(%) 66% 62% 72% 67%
D) EBITDA (D/A1) 1,112 51 840 48 1,152 54 3,939 50
E) EBIDTA ( Margin) 51% 47% 53% 50%
F) Financial charges 388 18 287 16 315 15 1,110 14G) Depreciation 150 7 73 4 95 4 325 4
H) Profit/loss before taxes 574 27 478 27 742 35 2,504 32I) Taxes expense 168 8 99 5 236 11 702 9J) Prior period expense/(income) (net) (3) 0 87 4 94 1K) Net Profit after Taxes before Minority Interest 409 19 381 22 419 20 1,708 22
L) Minority Interest (3) 0 16 1 3 0 11 0M) Profit/(losss) of Associates 5 0 (1) 0 5 0 1 0
N) Net Profit 411 19 396 23 426 20 1,720 22
1
2
Note :
Construction Cost Includes Cost of Land, Plots and Constructed Properties and Cost of Revenue-others
Gross Profit Margin = (Total Income - Construction Cost) / Total Income
Q1 FY11 (reviewed) Q4 FY10 (reviewed)Q1 FY10 (reviewed) Year Ended FY10 (Audited)

7
Consolidated Balance Sheet – Q1 FY11
30-Jun-10 30-Jun-09 31-Mar-10
Shareholders' funds 3361 1735 6259
Reserves and surplus 23736 22804 2417427097 24539 30433
Minority Interests 653 606 628
Loan funds Secured loans 20946 13386 19302 Unsecured loans 2428 1389 2375
Deferred tax liabilities (net) 297 - 251 51,421 39,920 52,989
Fixed assets Gross block 18197 8561 17884 Less: Depreciation 1472 643 1326 Net block 16725 7918 16558 Capital work in progress 11079 5851 11129
Investments 3006 2138 5505
1258 2208 1268
0 34 0
13096 11296 12528 Sundry debtors 1439 1821 1619 Cash and bank balances 1297 717 928 Loans and advances 7364 8593 7594Other Current Assets 4768 6494 4637
27964 28921 27306
Liabilities 5059 3557 4637 Provisions 3552 3593 4140
8611 7150 8777 Net current assets 19353 21771 18529
51421 39920 52989
(Rs. In Crores)As at
Less :
Current liabilities and provisions
APPLICATION OF FUNDS
Goodwill on consolidation
Current assets, loans and advances Stocks
Deferred Tax Assets
SOURCES OF FUNDS
Capital
Reduction in share capital is on account of buyback/redemption of CCPS / RPS

8
Consolidated Cash Flow – Q1 FY11 Rs in crores
Period ended Period ended Period ended 30-Jun-10 31-Mar-10 30-Jun-09
A. Cash flow from operating activities:Net profit before tax 573 2,489 479
Adjustments for:Depreciation 150 326 73 Loss/(profit) on sale of fixed assets, net 1 (58) - Provision for doubtful debts/unclaimed balances written back (2) 107 8 Loss/(profit) on sale of current Investments (12) (9) (1) Amortisation cost of Employee Stock Option 15 41 12 Interest/gurantee expense 388 1,110 287 Interest/dividend income (97) (259) (82)
Operating profit before working capital changes 1,016 3,747 776 Adjustments for:
Trade and other receivables (84) 5,893 2,485 Inventories (389) (960) (180) Trade and other payables 380 732 (388) Taxes paid (268) (857) (70)
Net cash (used in) / from operating activities 655 8,555 2,623
B. Cash flow from investing activities:Sale/Purchases of fixed assets(net) (172) (14,384) (227) Interest/Dividend received 123 179 61 Sale/Purchases of Investment(net) 2,559 (2,050) (652)
Net cash used in investing activities 2,510 (16,255) (818) C. Cash flow from financing activities:
Proceeds/(repayment) from long term borrowings (net) 1,302 4,957 (1,039) Proceeds from issuance of preference shares 4,524 Proceeds from issue of debentures 500 1,067 Buy back of Preference shares of group companies (3,752) - Proceeds of short term borrowings (net) (107) (644) (532) Proceeds from issuance of prefernce sharesInterest paid (550) (2,103) (683) Share premium - 13 - Dividend Paid (207) (383) - Increase in share capital (1)
Net cash used in financing activities (2,814) 7,431 (2,255) Net increase / (decrease) in cash and cash equivalents 351 (269) (449)
Opening cash and cash equivalents 827 1,096 1,096 Closing cash and cash equivalents 1,178 827 647
Net Increase / (decrease) 351 (269) (449) Difference
Particulars

9
Debt Position – Q1-11
DEBT STATUSRs.\ Crs. Rs.\ Crs.
Gross Opening Debt ( as on 1st April-10 ) 21,677
Less / Add : Repaid during Q1-11 (732)
: New loan availed 2,330
: Debt Increase due to Consolidation 100
: Net Increase in Debt 1,697
Gross Debt position ( as on 30th June-10 ) 23,374
Less : Cash in hand 3,533
: Equity shown as Debt / JV Co. Debt 1,378 4,911
Net Debt ( Rs. 14,820 Crs was at 31st Mar-10) 18,463
DEBT REPAYMENT ACTION PLANMandatory Debt Repayment in f.y.2010-11 ( as on 30th June-10 ) 2,890
Less : Paid till 30th June-10 732
BALANCE OBLIGATION 2,158

10
Debt De-Leveraging Plan
Continued Focus on de-leveraging continues with monies from operational cash flows & non-core asset divestments
Plans ongoing for achieving the divestment targets of non-core assets / businesses over the medium term
Improved cash flows from operations given the success of recent launches as well as launches yet to be done
With commencement of construction of many projects, the cash flows are expected to further improve as installments are
linked to constructions
Reduction in Cost of Debt
Average cost of debt has come down from 11.9% in Dec 2008 to 10.5% in Jun 2010
Current net debt/equity ratio: 0.68
Targeting net debt equity of 0.4x – 0.5x versus a peak range of 0.65x - 0.75x
On-going Strategy
Continue to use all free cash flows to reduce debt on an accelerated basis
Keep improving the tenure and quality of debt
Further reduction of cost of debt through refinancing

11
Divestments Plans of Non-core assets / businesses Progress on divestment plan on track
Targeting potential divestment proceeds in excess of Rs 2500 Crores in 15-18 months
Rs. 294 Crs recovered during the quarter
DLF Retail Brands - Wholly owned subsidiary, having paid up equity capital of Rs. 8 Crs, engaged in the business of retailing various life style / luxury brands. For FY10, the business had revenue’s of approx.Rs 33 Crs, with losses of approx. Rs 25 Crs (cumulative losses of approx. Rs.45 Crs)
Preferential allotment to a promoter company at par resulting in
- Infusion of Rs 92 crores by the promoter company to take 92% stake at par via new share allotment
- Dilution of DLF stake from 100% to 8% post promoter infusion
- Rationale – identified as non-core business, recovers shareholder loans
Aman Resorts
- Operating performance continues to improve as global economic environment stabilizes
- Explore possibilities for strategic partnerships to further strengthen the business model

12
Business Operations

13
Execution Capability
Area in msf
Region Q1 11 Q4 10 Q1 10
Gurgaon 21 21 15
Super Metro 5 6 3
Rest of India 12 12 7
For Rent Co 16 17 17
Area under construction 55 56 42
Strong focus on timely approvals, faster execution and meeting delivery
commitment to customers
Handed over 1.37 msf during the Qtr, (Offices - 0.86, Comm. Complex – 0.51)
~ 30 msf expected to be delivered through 2012-13
Addition to execution of another 3-4 msf expected during the year

14
Nationwide Execution Footprint
Chennai
Chandigarh
Gurgaon
Cochin
Bangalore
HyderabadGoa
Mumbai
Delhi
Pune
Noida
Jalandhar
Indore
Kolkatta

15
DevCo
Homes
Q1-FY 11 witnessed sales of 1.44 msf, comprising 1.21 msf of existing stock & 0.23 msf of Sales
from new launch in Chennai
New launches in Q1 low as approvals are awaited.
Sales in coming quarters to come from both existing inventory & new launches / subsequent phases of existing
launches
Cost visibility & execution scale up to provide sustainability to margins
On track to meet planned sales (more from existing projects already launched) of > 15 msf in 2011, subject to
market conditions remaining stable
Mumbai NTC mills project launch - timing dependent on all approvals being received
New launches keeping volume-margin mix in balance

16
DevCo - Q1 FY11
Development Potential (Msf)
315 313
200
250
300
350
Q4' 10 Q1' 11
Under Construction (msf)
39 38
1020304050
Q4' 10 Q1' 11
ParticularsTotal Mn sqft
Q1-11 Q1- 10 Q4 - 10
Sales Status
Opening Balance 38.85 28.25 35.21
Add:- Sale Booked During the Qty 1.90 2.67 3.64
Less : Handed over 0.51 0.83 -
Closing Balance 40.24 30.09 38.85
Under Construction
Opening Balance 38.83 18.31 33.4
New Launches / Additions 0.00 7.53 5.43
Less:- Handed over 0.51 0.83 0.00
Closing Balance 38.32 25.01 38.83
Wt. Avg. Sale RateHomes (in Rs.sqft ) 6074 5369 4180
C.Comples (in Rs.sqft ) 8965 13132 0
Wt. Avg. Project CostHomes (in Rs.sqft ) 2667 2452 1934
C.Complex (in Rs.sqft ) 2225 5372 0

17
DevCo
Commercial Complexes
- Buying being witnessed in select locations as interest coming back (Q1 sales – 0.46 msf)
- Incremental sales of unsold inventory to contribute to profitability going forward
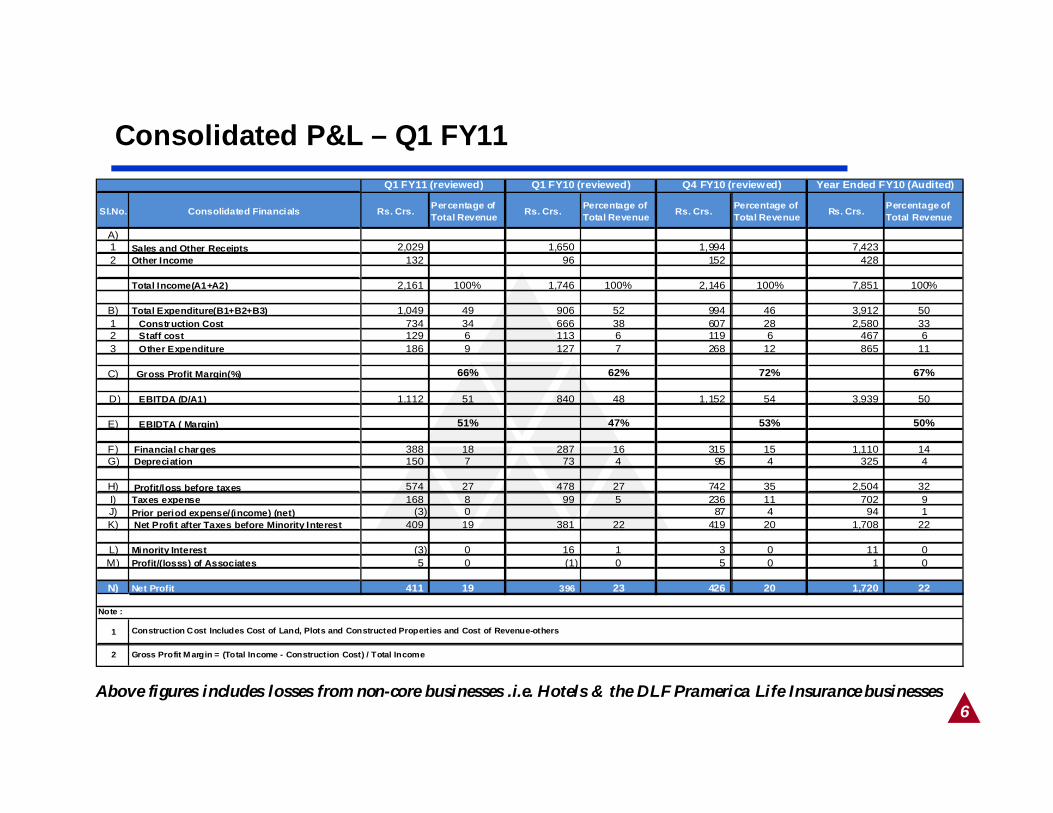
Sale of Commercial Office Towers
Strategic extension to the Dev Co model
Sale of commercial Office Towers in select locations to large MNC’s on specific demand
Utilizing available Commercial development opportunities in vicinity of “ Townships ”
Attractive profit margins with strong cash flows
Fortifying existing large customer relationships – ( tenant + customer profile )
Complimenting and not in conflict with company’s primary commercial office developments ( i.e. Cyber City & SEZ’s )
Does not impact strategic & continuing focus on increasing the Rental portfolio
18
Proposed Commercial Office Towers

19
RentCoOffices
Current Lease portfolio of 20 msf providing annualized Rental of > Rs.1400 Crs (Q1 2011 ~ Rs 300 Crs of rental income)
Improving momentum in leasing with 1.12 msf done in Q1 2011, more than whole of last year(net leasing of 0.93 msf)
Average rentals across locations at Rs.48 psf pm for current leasing done – rentals stabilizing across micro markets ( e.g. Gurgaon – current leasing at Rs 55 psf pm)
Subject to clarity in the proposed DTC & its impact of SEZ’s, volume improvement may take place in coming quarters as tenants will have to move in prior to March 2011 to avail benefits.
Targeting leasing of 3 - 4 msf in the year, assuming no significant change in Govt. policy actions / macro environment
Retail Malls
Increased traction in mall occupancy witnessed in the quarter with enquiries increasing and interest coming back ( Q1 FY 11 leasing of 0.05 msf)
Mall rentals across micro markets are likely to remain stable in the medium term.

20
RentCo
Under Construction (Annuity) ( Msf)
17 16
10
12
14
16
18
20Q 4 Q 1
ParticularsTotal Mn sqft
Q1-11 Q1- 10 Q4 - 10
Lease Status
Opening Balance 19.40 17.50 18.71
Add:- Lease Booked During the Qty 1.17 0.01 0.69
Less :- Cancellation / Adjustment (0.18) (0.56) 0.0
Closing Balance 20.38 16.95 19.40
Under Construction
Opening Balance 17.13 17.69 17.13
New Launches / Additions 0.00 0.00 0.00
Less:- Handed over 0.86 0.56 0.00
Less :- Suspension/Adju 0.00 0.00 0.00
Closing Balance 16.27 17.13 17.13
Wt. Avg. Leasing RateOffice Building (in Rs.sqft ) 48 30 41
Retail Building (in Rs.sqft ) 77 152 0
Wt. Avg. Project CostOffice Building (in Rs.sqft ) 2173 1891 1858
Retail Building (in Rs.sqft ) 7530 7762 0

21
Our Land Resources
Area ( msf ) Other Land Hotel Land G.TotalGross Area – as on 1st April-10 405 12 416
Less : Projects Disposed off ( Net ) 3 - 3
Net Land Bank - as on 30th June-10 402 12 413
Cost ( Rs \ Crs )Total Payable – as on 30th June-10 1584 2 1586
Amt payable includes Rs.1,533 crs outstanding towards HSIIDC New Golf Course land payable over 13 half yearlyInstilments.
Break up of 413 msf of Land Resources availableParticulars Dev. Co Rent. Co Hotel TotalBreak up 313 89 11 413Project Under Construction 39 16 0 55Notes1. Short / medium term development potential land parcels not impacted
2. Projects disposed off ( 3 msf ) relate to non-core, non-strategic land parcels across various locations and amounts recovered
thereof are a part of non core sales made in Q1-11.

22
Going Forward Further strengthening of cash flows / profitability via -
Right pricing strategy
Budgetary controls
Value engineering
Timely execution / deliveries
Material Inflation could impact EBIDTA margins going forward
Continue to focus on the Balance Sheet through debt reduction and improving the quality of the debt portfolio
Focus on execution and sale of stock in existing projects, with selective launches in ensuing quarters
Sale of commercial office towers to provide impetus to profitability
Focus on non-core asset divestment to continue, leading to rationalization of our core real estate portfolio
Given stable cash flows, Company is comfortable with a debt equity of 0.75x. On a longer term sustainable basis, this ratio is expected to be lower for FY11 targeting between 0.4x -0.5x
Well positioned to capture increased momentum in leasing demand provided clarity on the Govt. policy front; improved leasing
seen in Q1

23
EXECUTION UPDATE

24
NEW DELHI PROJECTS
OKHLA COMMERCIAL COMPLEXSIEL – COMMERCIAL COMPLEX NEW DELHI
BKS – MLCP, NEW DELHI

25
GURGAON PROJECTS
Magnolias – DLF Phase V, GugaonBelaire – DLF Phase V, Gurgaon
NTH – Sector-91, New Gurgaon Corporate Greens – Sector 74A, New Gurgaon

26
REST OF INDIA PROJECTS
JALANDHAR COMMERCIAL COMPLEXKAKANAD HOMES - COCHIN
GARDEN CITY – OMR, CHENNAI HOMES

27
SEZ PROJECTS
SILOKHERA - GURGAON
PUNE IT PARK – PUNE

28
Thank You