Embed Size (px)
Citation preview
Copyright (C) 2021 Seven & i Holdings Co., Ltd. All Rights Reserved.
Q1 FY2022Financial Results Presentation
1
July 8, 2021
Seven & i Holdings Co., Ltd.
Director, Senior Executive Officer
Junro Ito
Copyright (C) 2021 Seven & i Holdings Co., Ltd. All Rights Reserved.
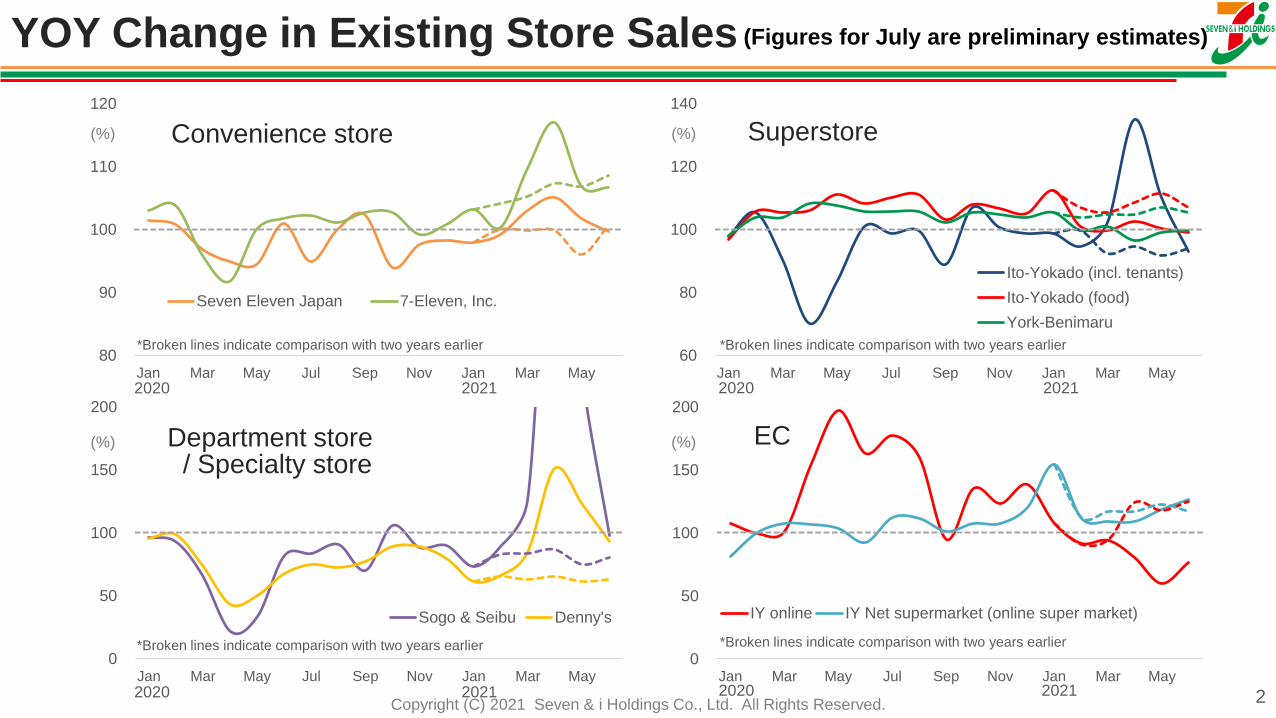
YOY Change in Existing Store Sales (Figures for July are preliminary estimates)
2
0
50
100
150
200
Jan Mar May Jul Sep Nov Jan Mar May
IY online IY Net supermarket (online super market)
80
90
100
110
120
Jan Mar May Jul Sep Nov Jan Mar May
Seven Eleven Japan 7-Eleven, Inc.
60
80
100
120
140
Jan Mar May Jul Sep Nov Jan Mar May
Ito-Yokado (incl. tenants)
Ito-Yokado (food)
York-Benimaru
0
50
100
150
200
Jan Mar May Jul Sep Nov Jan Mar May
Sogo & Seibu Denny's
(%)
(%) (%)
(%)
*Broken lines indicate comparison with two years earlier
2020 2021
2020 2021 2020 2021
2020 2021
Convenience store Superstore
Department store/ Specialty store
EC
*Broken lines indicate comparison with two years earlier*Broken lines indicate comparison with two years earlier
*Broken lines indicate comparison with two years earlier
Copyright (C) 2021 Seven & i Holdings Co., Ltd. All Rights Reserved. 3
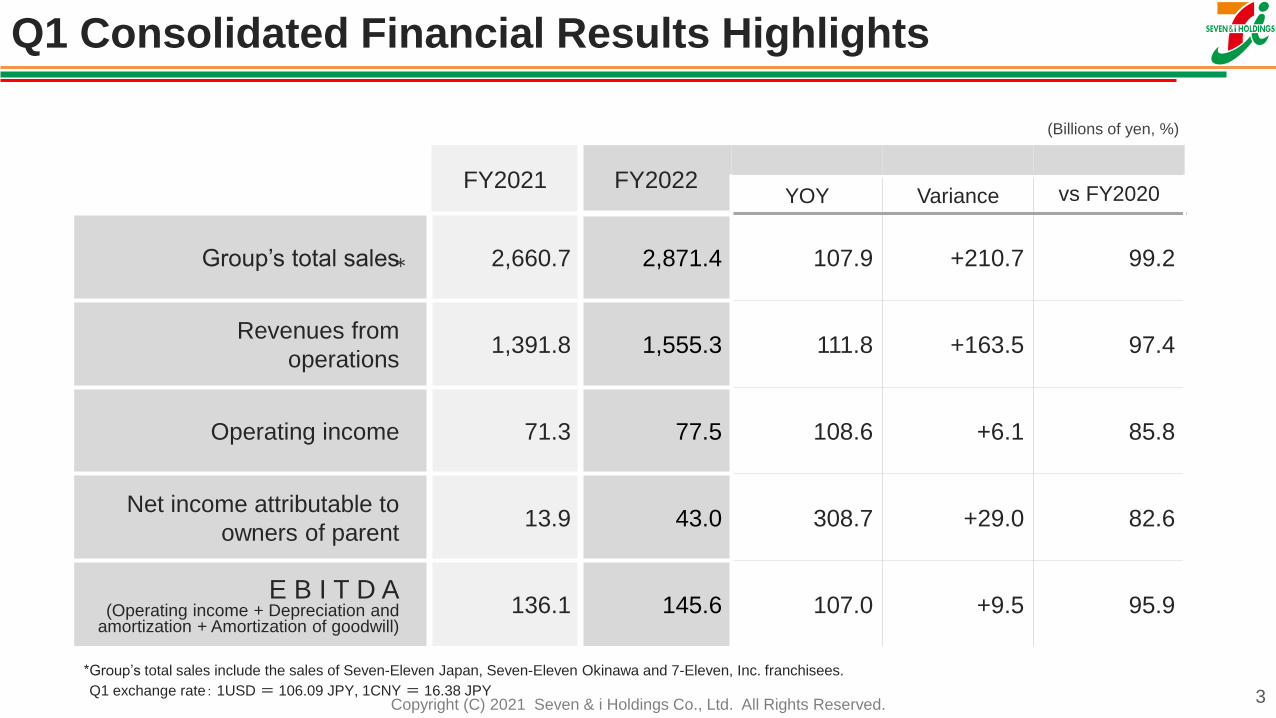
FY2021 FY2022YOY Variance vs FY2020
Group’s total sales 2,660.7 2,871.4 107.9 +210.7 99.2
Revenues from
operations1,391.8 1,555.3 111.8 +163.5 97.4
Operating income 71.3 77.5 108.6 +6.1 85.8
Net income attributable to
owners of parent13.9 43.0 308.7 +29.0 82.6
E B I T D A(Operating income + Depreciation and
amortization + Amortization of goodwill)136.1 145.6 107.0 +9.5 95.9
*
Q1 Consolidated Financial Results Highlights
(Billions of yen, %)
*Group’s total sales include the sales of Seven-Eleven Japan, Seven-Eleven Okinawa and 7-Eleven, Inc. franchisees.
Q1 exchange rate: 1USD = 106.09 JPY, 1CNY = 16.38 JPY
Copyright (C) 2021 Seven & i Holdings Co., Ltd. All Rights Reserved.
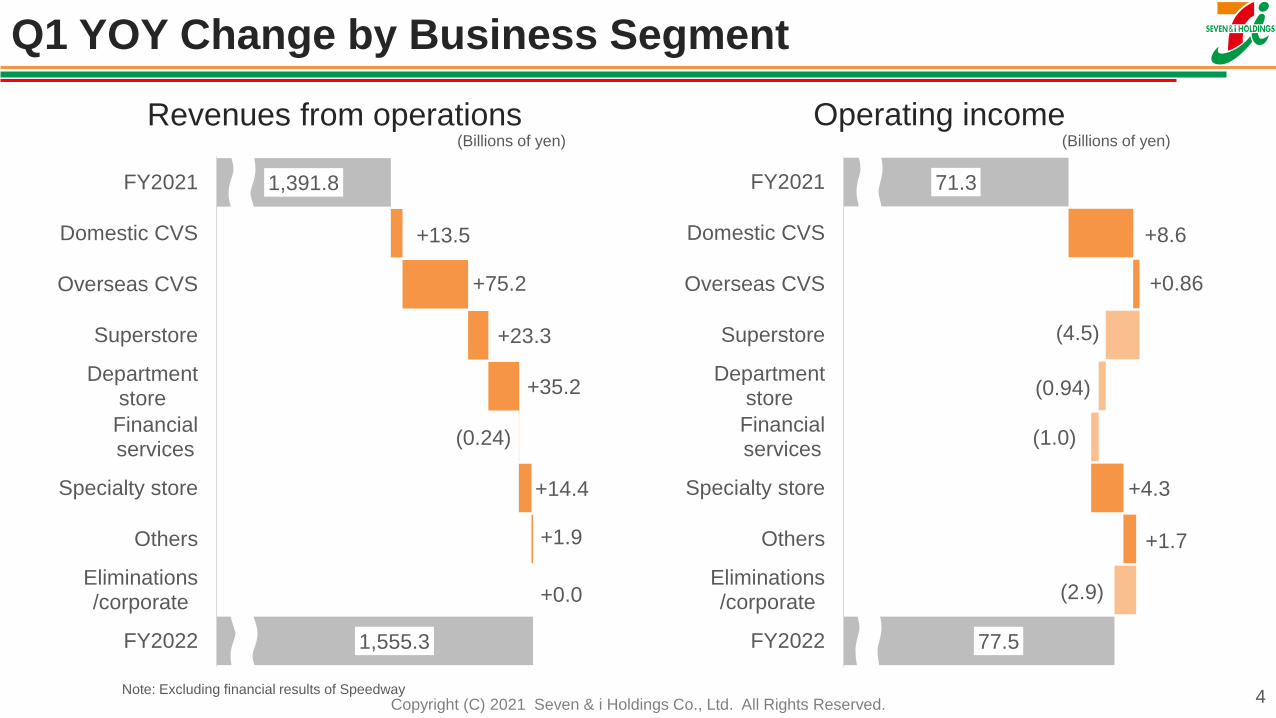
1,555.3
1,391.8
+0.0
+1.9
+14.4
(0.24)
+35.2
+23.3
+75.2
+13.5
FY2022
Eliminations/corporate
Others
Specialty store
Financialservices
Departmentstore
Superstore
Overseas CVS
Domestic CVS
FY2021
Revenues from operations Operating income
Q1 YOY Change by Business Segment
77.5
71.3
(2.9)
+1.7
+4.3
(1.0)
(0.94)
(4.5)
+0.86
+8.6
FY2022
Eliminations/corporate
Others
Specialty store
Financialservices
Departmentstore
Superstore
Overseas CVS
Domestic CVS
FY2021
4Note: Excluding financial results of Speedway
(Billions of yen) (Billions of yen)
Copyright (C) 2021 Seven & i Holdings Co., Ltd. All Rights Reserved.
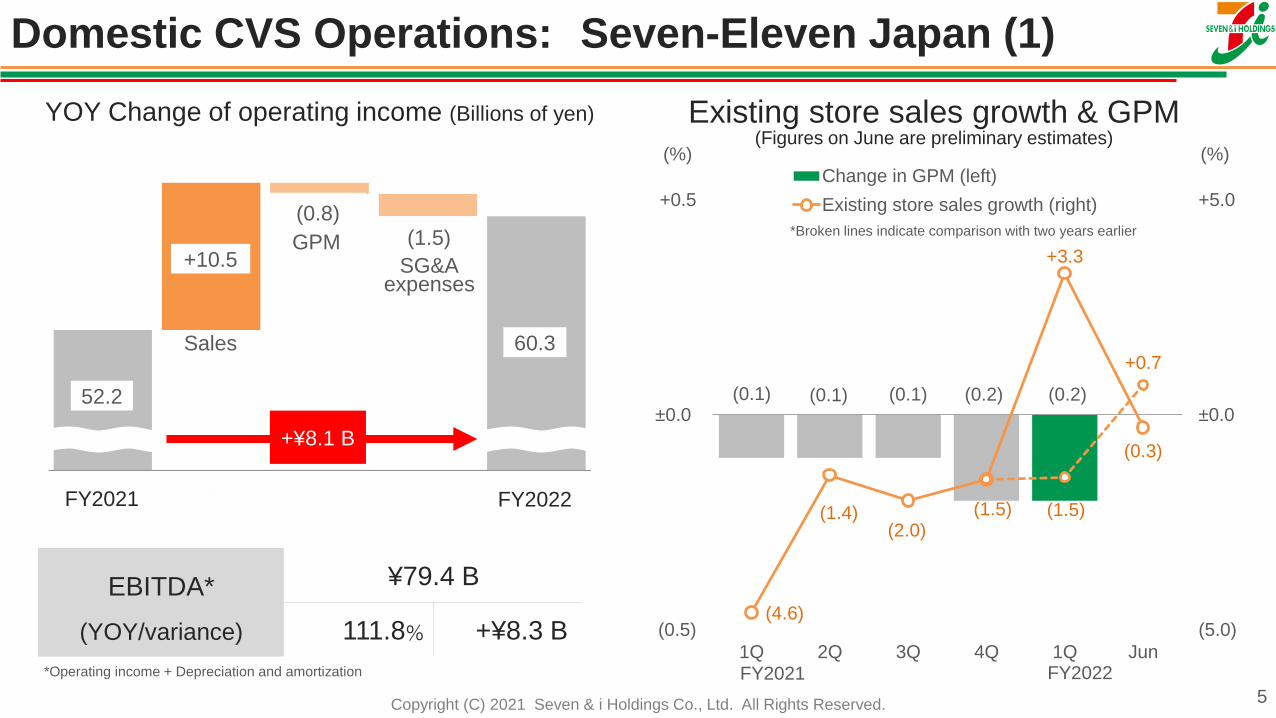
Domestic CVS Operations: Seven-Eleven Japan (1)
5
YOY Change of operating income (Billions of yen)
FY2021 FY2022
Sales
GPM
52.2
+¥8.1 B
EBITDA*
(YOY/variance)
¥79.4 B
111.8% +¥8.3 B
(0.1) (0.1) (0.1) (0.2) (0.2)
(4.6)
(1.4)(2.0)
(1.5)
+3.3
(0.3)
(1.5)
+0.7
(5.0)
±0.0
+5.0
(0.5)
±0.0
+0.5
1Q 2Q 3Q 4Q 1Q Jun
Change in GPM (left)
Existing store sales growth (right)
Existing store sales growth & GPM(Figures on June are preliminary estimates)
(%) (%)
FY2021 FY2022
(0.8)(1.5)
60.3
+10.5 SG&Aexpenses
*Broken lines indicate comparison with two years earlier
*Operating income + Depreciation and amortization
Copyright (C) 2021 Seven & i Holdings Co., Ltd. All Rights Reserved.
50
75
100
125
150
Jan Mar May Jul Sep Nov Jan Mar May
7P
Frozen foods
Wine & liquor
Counter products
70
85
100
115
130
Jan Mar May Jul Sep Nov Jan Mar May
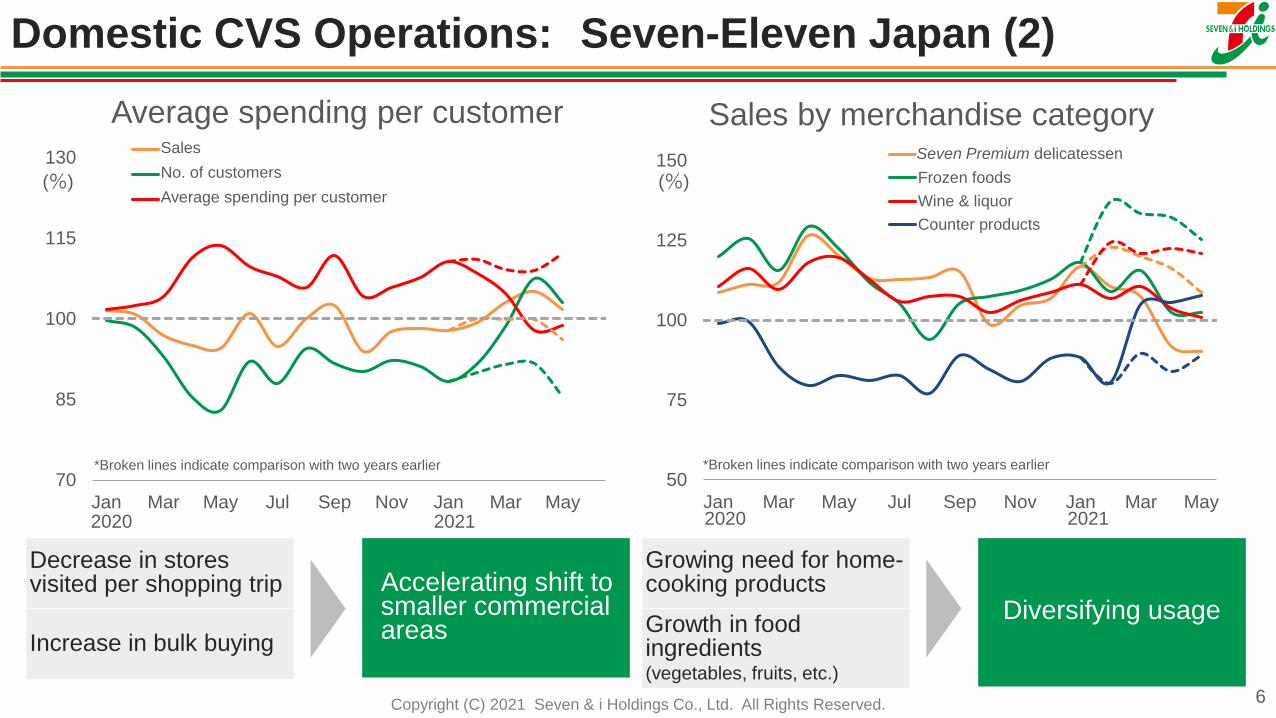
Sales
No. of customers
Average spending per customer
6
(%) (%)
Decrease in stores visited per shopping trip Accelerating shift to
smaller commercial areas
Increase in bulk buying
Growing need for home-cooking products
Diversifying usageGrowth in food ingredients (vegetables, fruits, etc.)
2020 2021 2020 2021
Domestic CVS Operations: Seven-Eleven Japan (2)
Average spending per customer Sales by merchandise categorySeven Premium delicatessen
*Broken lines indicate comparison with two years earlier *Broken lines indicate comparison with two years earlier
Copyright (C) 2021 Seven & i Holdings Co., Ltd. All Rights Reserved. 7
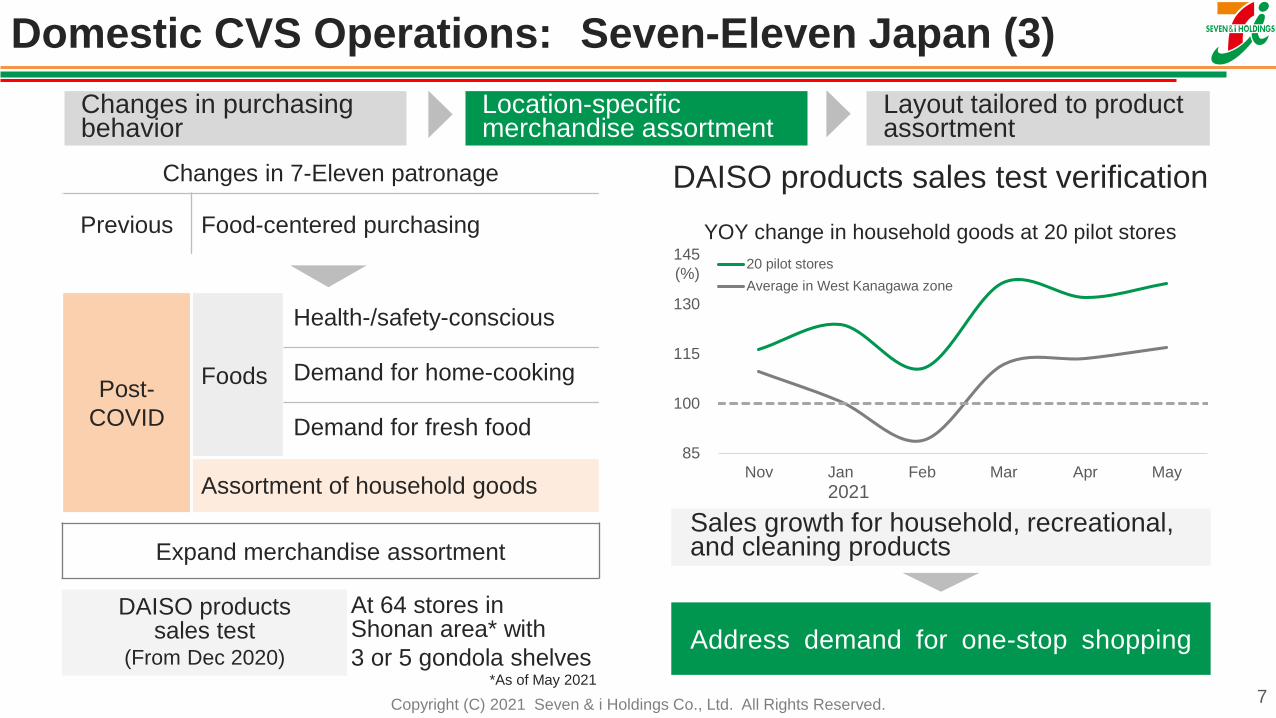
Changes in purchasing behavior
Location-specific merchandise assortment
Layout tailored to product assortment
DAISO products sales test verification
Address demand for one-stop shopping
Changes in 7-Eleven patronage
Previous Food-centered purchasing
Post-
COVID
Foods
Health-/safety-conscious
Demand for home-cooking
Demand for fresh food
Assortment of household goods
Expand merchandise assortment
DAISO products sales test
(From Dec 2020)
At 64 stores inShonan area* with
3 or 5 gondola shelves*As of May 2021
Domestic CVS Operations: Seven-Eleven Japan (3)
85
100
115
130
145
Nov Jan Feb Mar Apr May
20 pilot stores
Average in West Kanagawa zone(%)
2021
YOY change in household goods at 20 pilot stores
Sales growth for household, recreational, and cleaning products
Copyright (C) 2021 Seven & i Holdings Co., Ltd. All Rights Reserved. 8
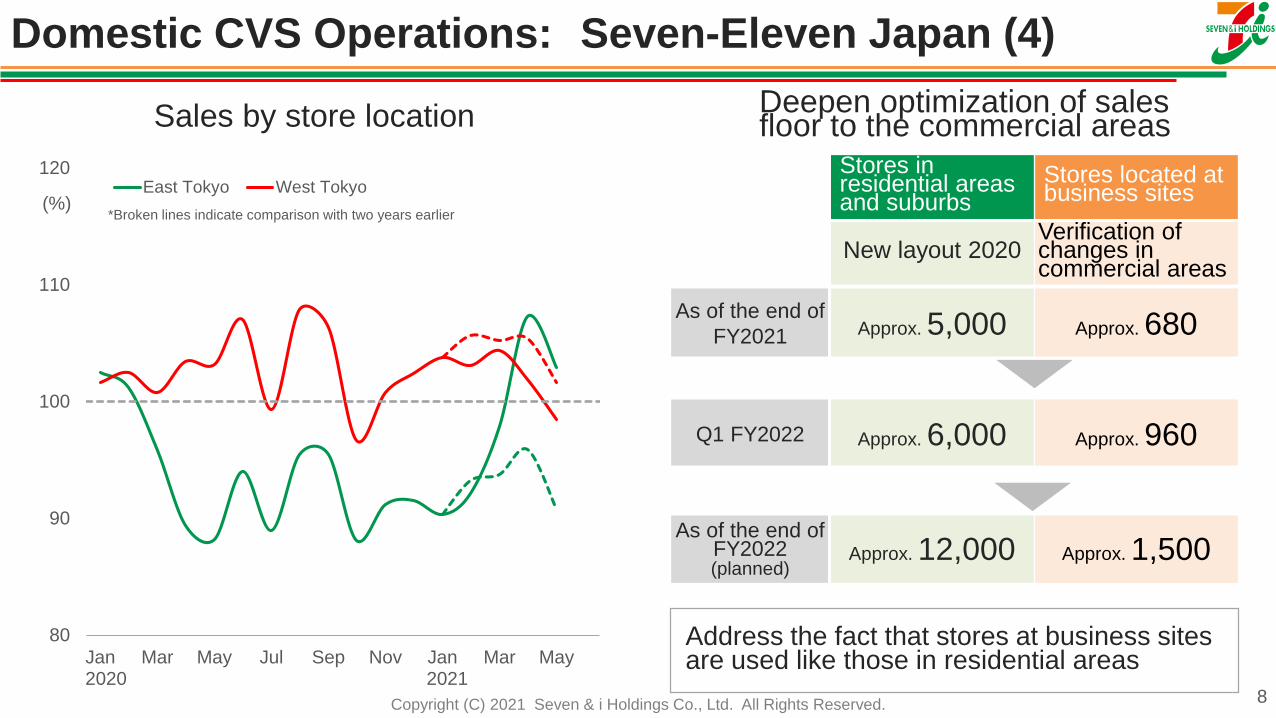
Sales by store location
80
90
100
110
120
Jan Mar May Jul Sep Nov Jan Mar May
East Tokyo West Tokyo(%)
2020 2021
Deepen optimization of salesfloor to the commercial areas
Stores in residential areas and suburbs
Stores located at business sites
New layout 2020Verification of changes in commercial areas
As of the end of
FY2021 Approx. 5,000 Approx. 680
Q1 FY2022 Approx. 6,000 Approx. 960
As of the end of FY2022(planned)
Approx. 12,000 Approx. 1,500
Address the fact that stores at business sites are used like those in residential areas
Domestic CVS Operations: Seven-Eleven Japan (4)
*Broken lines indicate comparison with two years earlier
Copyright (C) 2021 Seven & i Holdings Co., Ltd. All Rights Reserved. 9
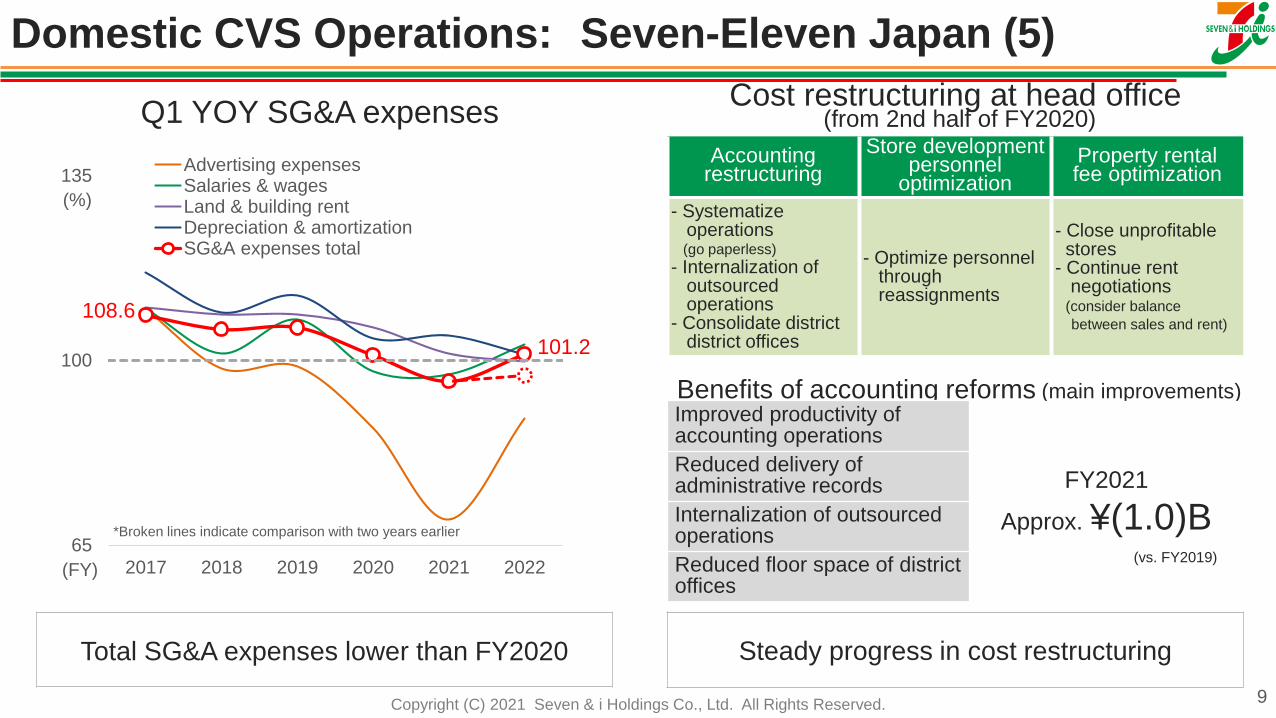
Q1 YOY SG&A expenses
108.6
101.2
65
100
135
2017 2018 2019 2020 2021 2022
Advertising expensesSalaries & wagesLand & building rentDepreciation & amortizationSG&A expenses total
Steady progress in cost restructuring
(FY)
(%)
Total SG&A expenses lower than FY2020
Accountingrestructuring
Store development personnel
optimization
Property rentalfee optimization
- Systematize operations(go paperless)
- Internalization of outsourced operations
- Consolidate district district offices
- Optimize personnel through reassignments
- Close unprofitable stores
- Continue rent negotiations
(consider balance
between sales and rent)
Cost restructuring at head office(from 2nd half of FY2020)
Benefits of accounting reforms (main improvements)Improved productivity of accounting operations
FY2021
Approx. ¥(1.0)B
Reduced delivery of administrative records
Internalization of outsourced operations
Reduced floor space of district offices
(vs. FY2019)
Domestic CVS Operations: Seven-Eleven Japan (5)
*Broken lines indicate comparison with two years earlier
Copyright (C) 2021 Seven & i Holdings Co., Ltd. All Rights Reserved. 10
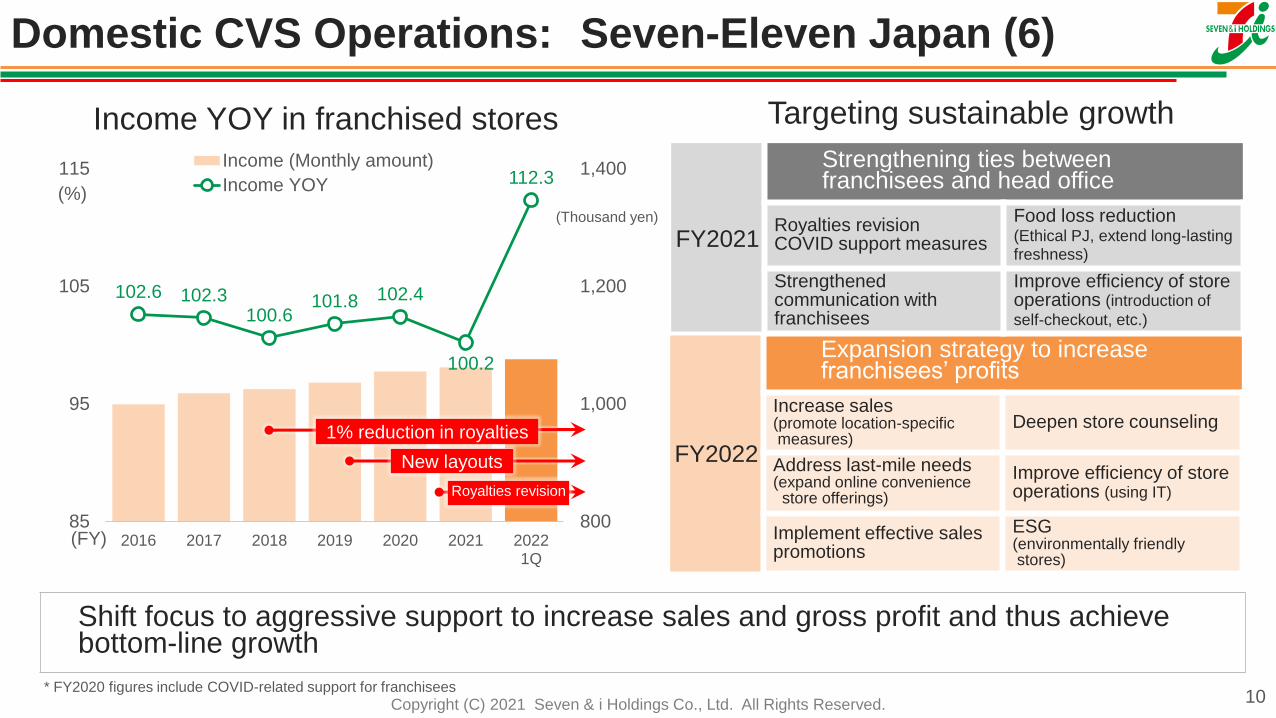
Income YOY in franchised stores
102.6 102.3100.6
101.8 102.4
100.2
112.3
800
1,000
1,200
1,400
2016 2017 2018 2019 2020 2021 20221Q
85
95
105
115 Income (Monthly amount)
Income YOY(%)
Targeting sustainable growth
Shift focus to aggressive support to increase sales and gross profit and thus achieve bottom-line growth
* FY2020 figures include COVID-related support for franchisees
FY2022
Expansion strategy to increase franchisees’ profits
Increase sales (promote location-specific measures)
Deepen store counseling
Address last-mile needs (expand online convenience
store offerings)
Improve efficiency of store operations (using IT)
Implement effective sales promotions
ESG(environmentally friendly stores)
Domestic CVS Operations: Seven-Eleven Japan (6)
1% reduction in royalties
New layouts
Royalties revision
(FY)
(Thousand yen)
FY2021
Strengthening ties betweenfranchisees and head office
Royalties revisionCOVID support measures
Food loss reduction(Ethical PJ, extend long-lasting freshness)
Strengthened communication withfranchisees
Improve efficiency of store operations (introduction of
self-checkout, etc.)
Copyright (C) 2021 Seven & i Holdings Co., Ltd. All Rights Reserved.
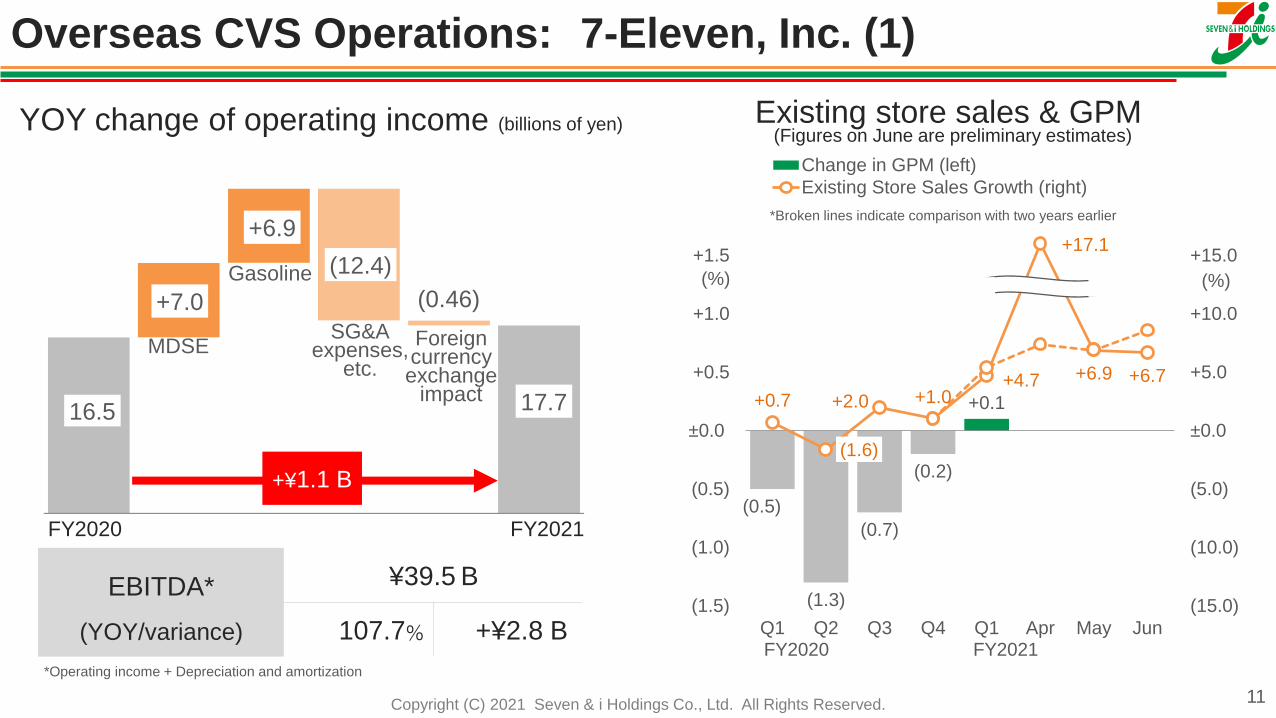
Overseas CVS Operations: 7-Eleven, Inc. (1)
11
Existing store sales & GPM(Figures on June are preliminary estimates)
MDSE
Gasoline
SG&Aexpenses,
etc.
Foreigncurrencyexchange
impact 17.716.5
FY2020 FY2021
(0.46)
(12.4)
+6.9
+7.0
EBITDA*
(YOY/variance)
¥39.5 B
107.7% +¥2.8 B
+¥1.1 B(0.5)
(1.3)
(0.7)
(0.2)
+0.1+0.7
(1.6)
+2.0 +1.0+4.7 +6.9 +6.7
(15.0)
(10.0)
(5.0)
±0.0
+5.0
+10.0
+15.0
(1.5)
(1.0)
(0.5)
±0.0
+0.5
+1.0
+1.5
Q1 Q2 Q3 Q4 Q1 Apr May Jun
Change in GPM (left)
Existing Store Sales Growth (right)
(%) (%)
FY2020 FY2021
+17.1
YOY change of operating income (billions of yen)
*Broken lines indicate comparison with two years earlier
*Operating income + Depreciation and amortization
Copyright (C) 2021 Seven & i Holdings Co., Ltd. All Rights Reserved.
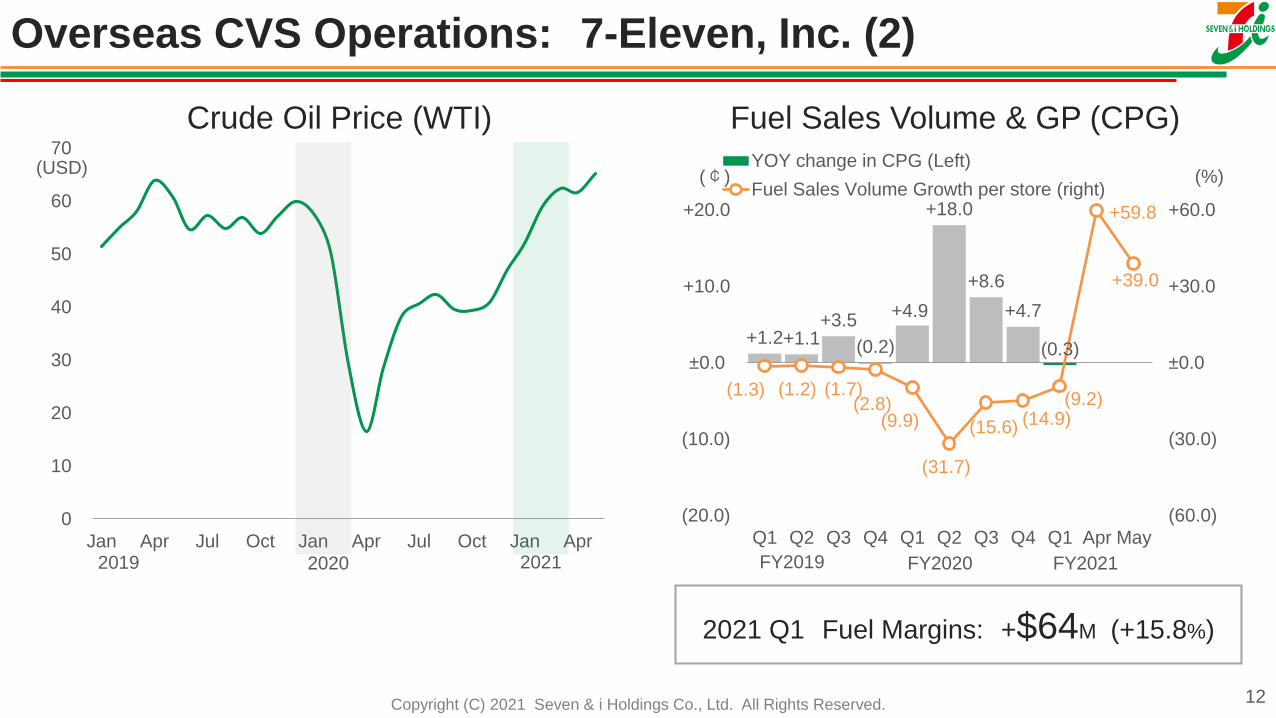
Overseas CVS Operations: 7-Eleven, Inc. (2)
12
0
10
20
30
40
50
60
70
Jan Apr Jul Oct Jan Apr Jul Oct Jan Apr
Crude Oil Price (WTI)
(USD)
2019 2020 2021
+1.2+1.1+3.5
(0.2)
+4.9
+18.0
+8.6
+4.7
(0.3)
(1.3) (1.2) (1.7)(2.8)
(9.9)
(31.7)
(15.6) (14.9)(9.2)
+59.8
+39.0
(60.0)
(30.0)
±0.0
+30.0
+60.0
(20.0)
(10.0)
±0.0
+10.0
+20.0
Q1 Q2 Q3 Q4 Q1 Q2 Q3 Q4 Q1 Apr May
YOY change in CPG (Left)
Fuel Sales Volume Growth per store (right)
Fuel Sales Volume & GP (CPG)
(¢) (%)
FY2019 FY2020
2021 Q1 Fuel Margins: +$64M (+15.8%)
FY2021
Copyright (C) 2021 Seven & i Holdings Co., Ltd. All Rights Reserved. 13
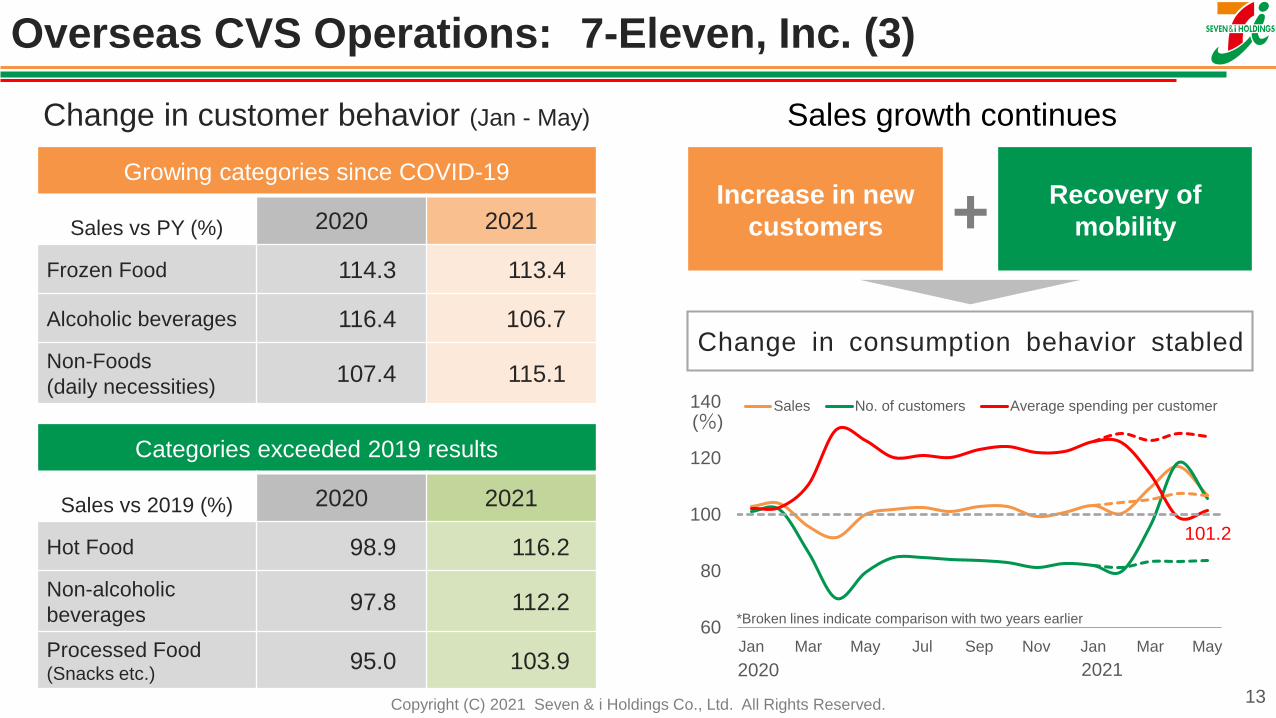
Overseas CVS Operations: 7-Eleven, Inc. (3)
Change in customer behavior (Jan - May)
Growing categories since COVID-19
Sales vs PY (%) 2020 2021
Frozen Food 114.3 113.4
Alcoholic beverages 116.4 106.7
Non-Foods
(daily necessities)107.4 115.1
Categories exceeded 2019 results
Sales vs 2019 (%) 2020 2021
Hot Food 98.9 116.2
Non-alcoholic
beverages97.8 112.2
Processed Food (Snacks etc.)
95.0 103.9
Sales growth continues
Increase in new
customers + Recovery of
mobility
Change in consumption behavior stabled
101.2
60
80
100
120
140
Jan Mar May Jul Sep Nov Jan Mar May
Sales No. of customers Average spending per customer(%)
20212020
*Broken lines indicate comparison with two years earlier
Copyright (C) 2021 Seven & i Holdings Co., Ltd. All Rights Reserved. 14
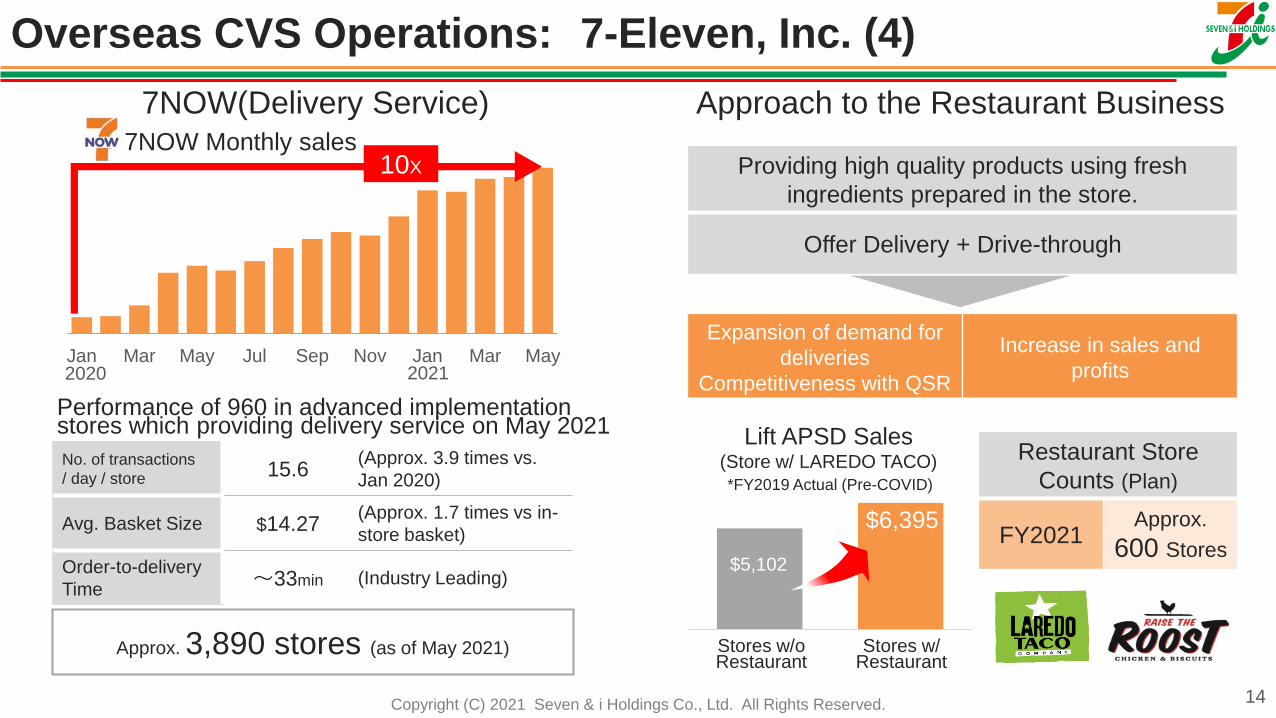
Overseas CVS Operations: 7-Eleven, Inc. (4)
Approach to the Restaurant Business
Expansion of demand for
deliveries
Competitiveness with QSR
Increase in sales and
profits
Net Margin %* Net Margin $*
Restaurant # of Locations PSD 2020 FY 2020 FY 2020 FY 2020
Total** 587 $830 $177.9M 48.33% $86.0M
405 $1,088 $160.8M 49.00% $78.8M
18 $1,021 $6.7M 44.50% $3.0M
64 $451 $10.5M 42.60% $4.5M
17 $447 $2.7M 43.30% $1.2M
Sales
Net Margin %* Net Margin $*
Restaurant # of Locations PSD 2020 FY 2020 FY 2020 FY 2020
Total** 587 $830 $177.9M 48.33% $86.0M
405 $1,088 $160.8M 49.00% $78.8M
18 $1,021 $6.7M 44.50% $3.0M
64 $451 $10.5M 42.60% $4.5M
17 $447 $2.7M 43.30% $1.2M
Sales
Providing high quality products using fresh
ingredients prepared in the store.
Offer Delivery + Drive-through
Stores w/oRestaurant
Stores w/Restaurant
$5,102
$6,395
*FY2019 Actual (Pre-COVID)
Lift APSD Sales(Store w/ LAREDO TACO) Restaurant Store
Counts (Plan)
FY2021Approx.
600 Stores
7NOW(Delivery Service)
Jan Mar May Jul Sep Nov Jan Mar May
7NOW Monthly sales10X
Approx. 3,890 stores (as of May 2021)
Performance of 960 in advanced implementationstores which providing delivery service on May 2021
20212020
No. of transactions
/ day / store15.6
(Approx. 3.9 times vs.
Jan 2020)
Avg. Basket Size $14.27(Approx. 1.7 times vs in-
store basket)
Order-to-delivery
Time~33min (Industry Leading)
Copyright (C) 2021 Seven & i Holdings Co., Ltd. All Rights Reserved.
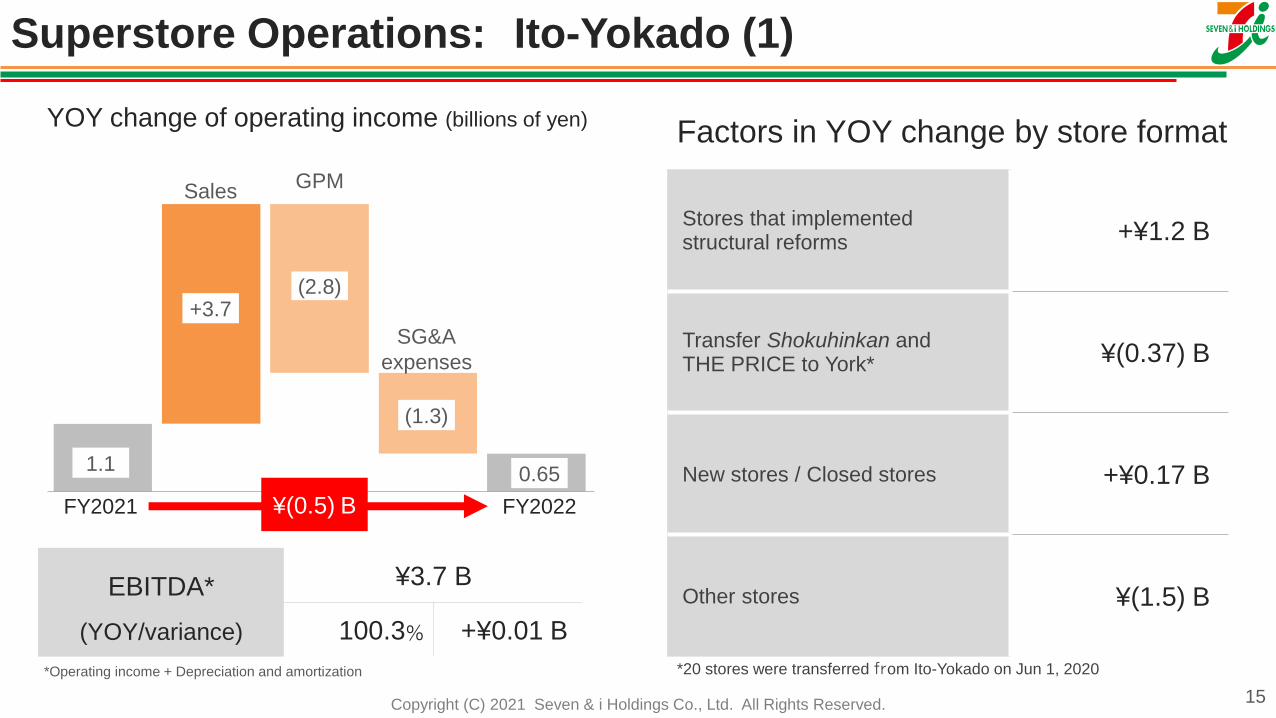
Superstore Operations: Ito-Yokado (1)
15
YOY change of operating income (billions of yen)
FY2021 FY2022
SalesGPM
SG&A
expenses
+3.7
(1.3)
(2.8)
¥(0.5) B
EBITDA*
(YOY/variance)
¥3.7 B
100.3% +¥0.01 B
0.651.1
Stores that implemented structural reforms +¥1.2 B
Transfer Shokuhinkan andTHE PRICE to York* ¥(0.37) B
New stores / Closed stores +¥0.17 B
Other stores ¥(1.5) B
Factors in YOY change by store format
*20 stores were transferred from Ito-Yokado on Jun 1, 2020*Operating income + Depreciation and amortization
Copyright (C) 2021 Seven & i Holdings Co., Ltd. All Rights Reserved. 16
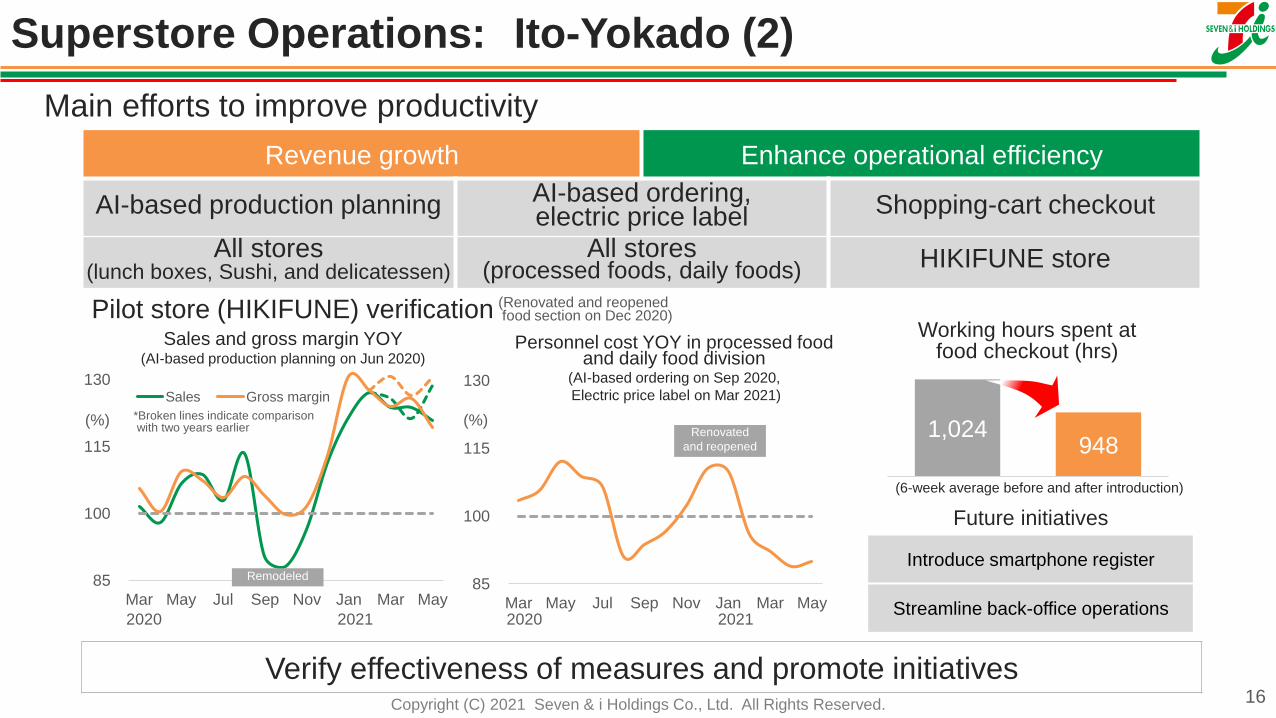
Superstore Operations: Ito-Yokado (2)
Main efforts to improve productivity
Revenue growth Enhance operational efficiency
AI-based production planning AI-based ordering,electric price label Shopping-cart checkout
All stores (lunch boxes, Sushi, and delicatessen)
All stores(processed foods, daily foods) HIKIFUNE store
Pilot store (HIKIFUNE) verification
1,024 948
Working hours spent at food checkout (hrs)
(6-week average before and after introduction)
Future initiatives
Introduce smartphone register
Streamline back-office operations
(Renovated and reopenedfood section on Dec 2020)
85
100
115
130
Mar May Jul Sep Nov Jan Mar May
Sales Gross margin
2020 2021
Sales and gross margin YOY(AI-based production planning on Jun 2020)
85
100
115
130
Mar May Jul Sep Nov Jan Mar May2020 2021
Personnel cost YOY in processed food and daily food division
(AI-based ordering on Sep 2020,
Electric price label on Mar 2021)
Remodeled
Renovated
and reopened
(%)(%)
Verify effectiveness of measures and promote initiatives
*Broken lines indicate comparisonwith two years earlier
Copyright (C) 2021 Seven & i Holdings Co., Ltd. All Rights Reserved.
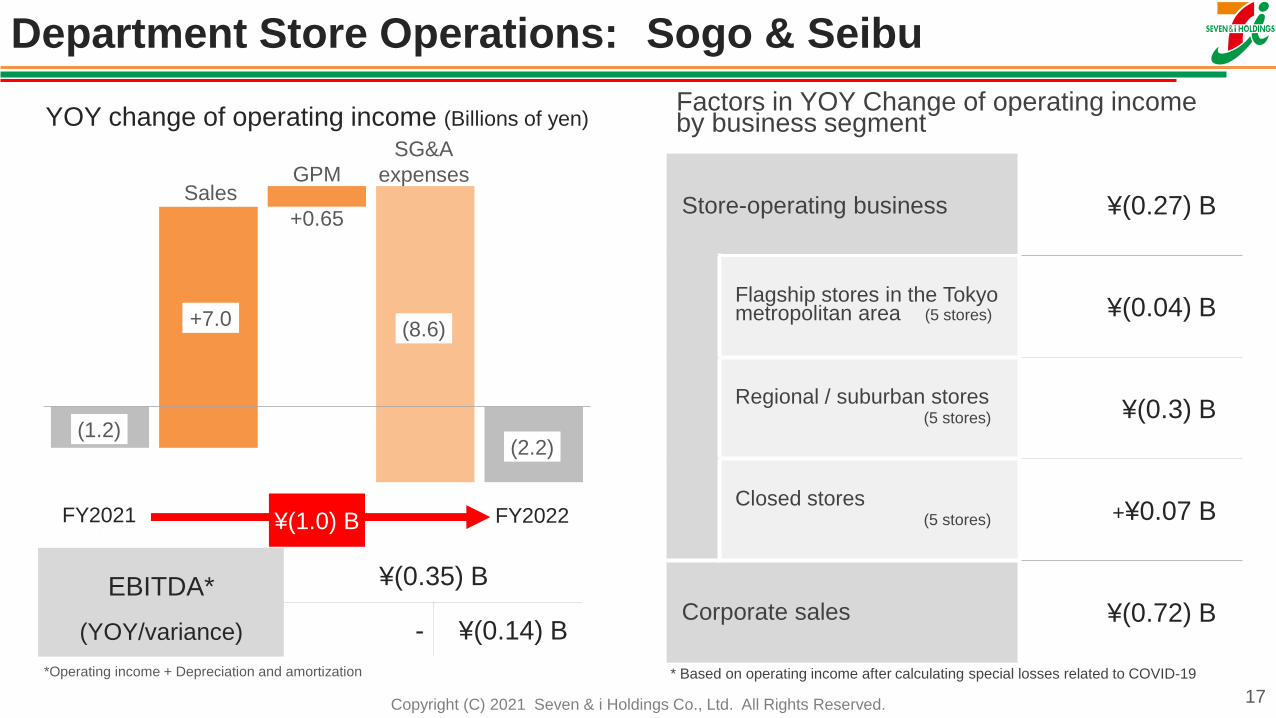
Department Store Operations: Sogo & Seibu
17
YOY change of operating income (Billions of yen)
FY2021 FY2022
SalesGPM
SG&A
expenses
+7.0(8.6)
¥(1.0) B
+0.65
EBITDA*
(YOY/variance)
¥(0.35) B
- ¥(0.14) B
Store-operating business ¥(0.27) B
Flagship stores in the Tokyo metropolitan area (5 stores) ¥(0.04) B
Regional / suburban stores (5 stores) ¥(0.3) B
Closed stores (5 stores) +¥0.07 B
Corporate sales ¥(0.72) B
Factors in YOY Change of operating incomeby business segment
(2.2)(1.2)
* Based on operating income after calculating special losses related to COVID-19*Operating income + Depreciation and amortization
Copyright (C) 2021 Seven & i Holdings Co., Ltd. All Rights Reserved.
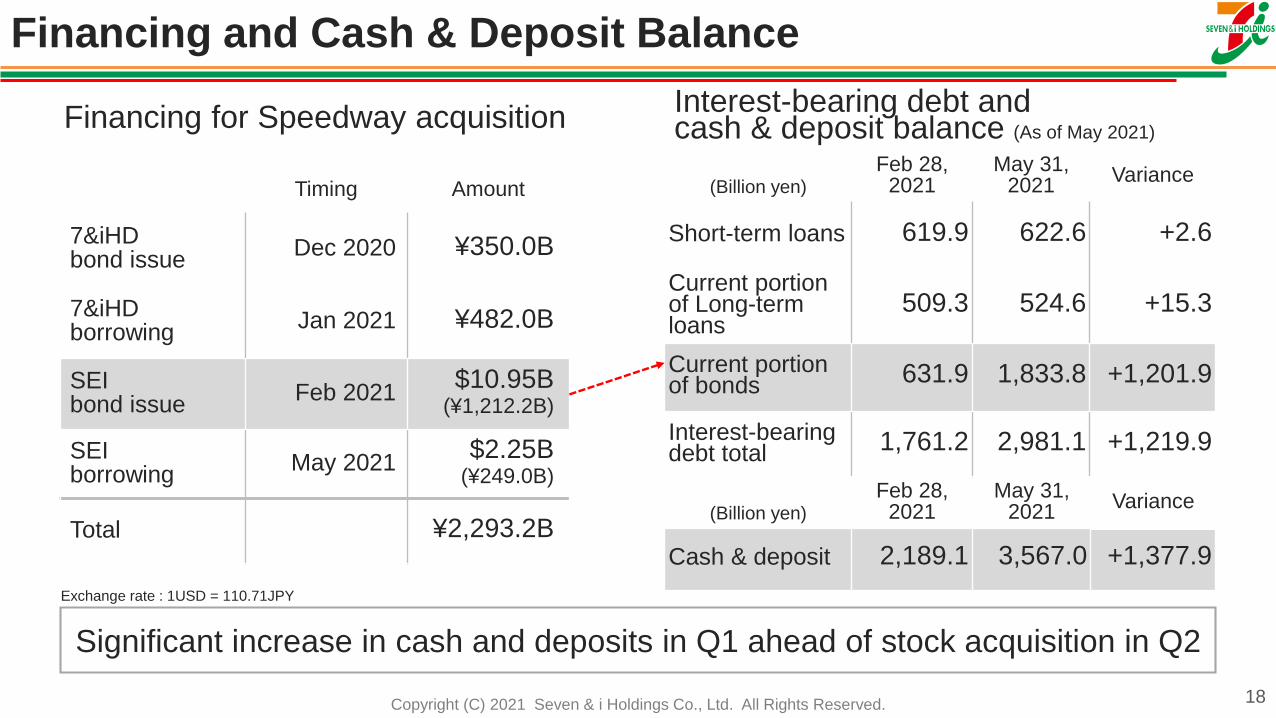
Financing and Cash & Deposit Balance
18
Financing for Speedway acquisition
Timing Amount
7&iHDbond issue
Dec 2020 ¥350.0B
7&iHDborrowing
Jan 2021 ¥482.0B
SEIbond issue
Feb 2021$10.95B
(¥1,212.2B)
SEIborrowing
May 2021$2.25B
(¥249.0B)
Total ¥2,293.2B
(Billion yen)
Feb 28, 2021
May 31, 2021
Variance
Short-term loans 619.9 622.6 +2.6
Current portion of Long-term loans
509.3 524.6 +15.3
Current portion of bonds 631.9 1,833.8 +1,201.9
Interest-bearing debt total 1,761.2 2,981.1 +1,219.9
(Billion yen)
Feb 28,2021
May 31,2021
Variance
Cash & deposit 2,189.1 3,567.0 +1,377.9
Interest-bearing debt andcash & deposit balance (As of May 2021)
Significant increase in cash and deposits in Q1 ahead of stock acquisition in Q2
Exchange rate : 1USD = 110.71JPY
Copyright (C) 2021 Seven & i Holdings Co., Ltd. All Rights Reserved.
Appendix
19
Copyright (C) 2021 Seven & i Holdings Co., Ltd. All Rights Reserved.
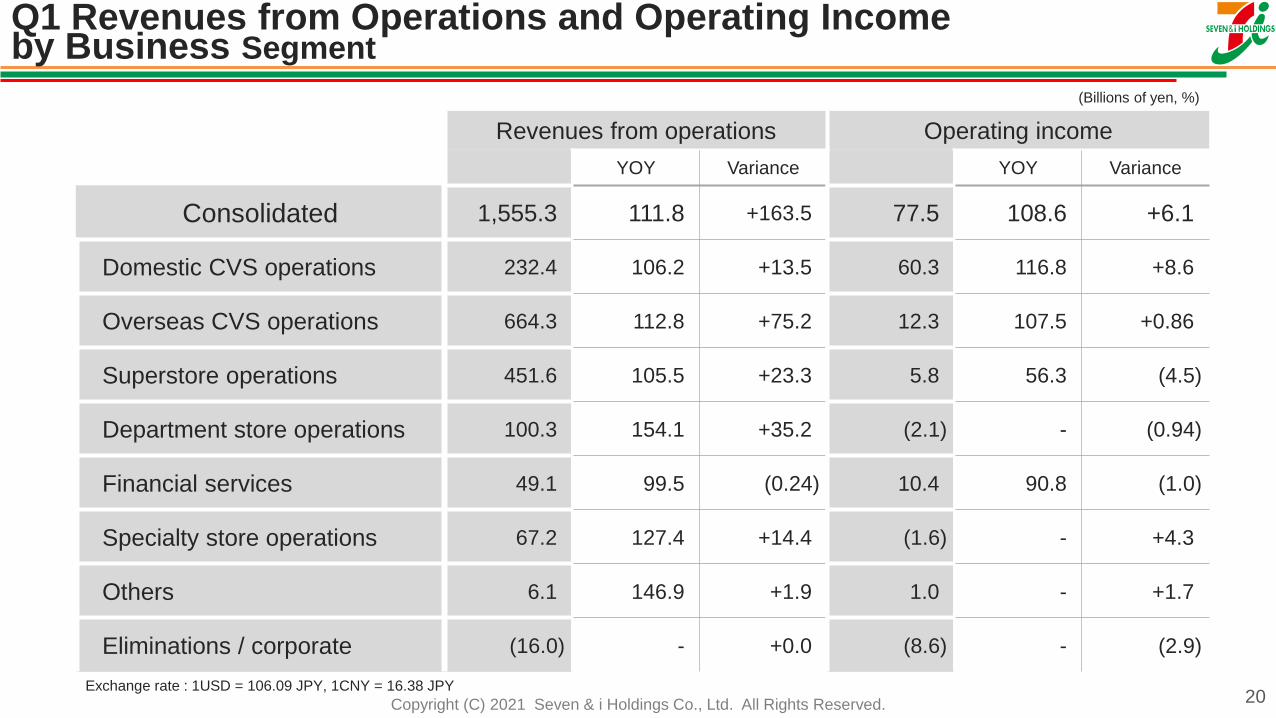
Q1 Revenues from Operations and Operating Incomeby Business Segment
(Billions of yen, %)
Revenues from operations Operating income
YOY Variance YOY Variance
Consolidated 1,555.3 111.8 +163.5 77.5 108.6 +6.1
Domestic CVS operations 232.4 106.2 +13.5 60.3 116.8 +8.6
Overseas CVS operations 664.3 112.8 +75.2 12.3 107.5 +0.86
Superstore operations 451.6 105.5 +23.3 5.8 56.3 (4.5)
Department store operations 100.3 154.1 +35.2 (2.1) - (0.94)
Financial services 49.1 99.5 (0.24) 10.4 90.8 (1.0)
Specialty store operations 67.2 127.4 +14.4 (1.6) - +4.3
Others 6.1 146.9 +1.9 1.0 - +1.7
Eliminations / corporate (16.0) - +0.0 (8.6) - (2.9)
Exchange rate : 1USD = 106.09 JPY, 1CNY = 16.38 JPY20
Copyright (C) 2021 Seven & i Holdings Co., Ltd. All Rights Reserved.
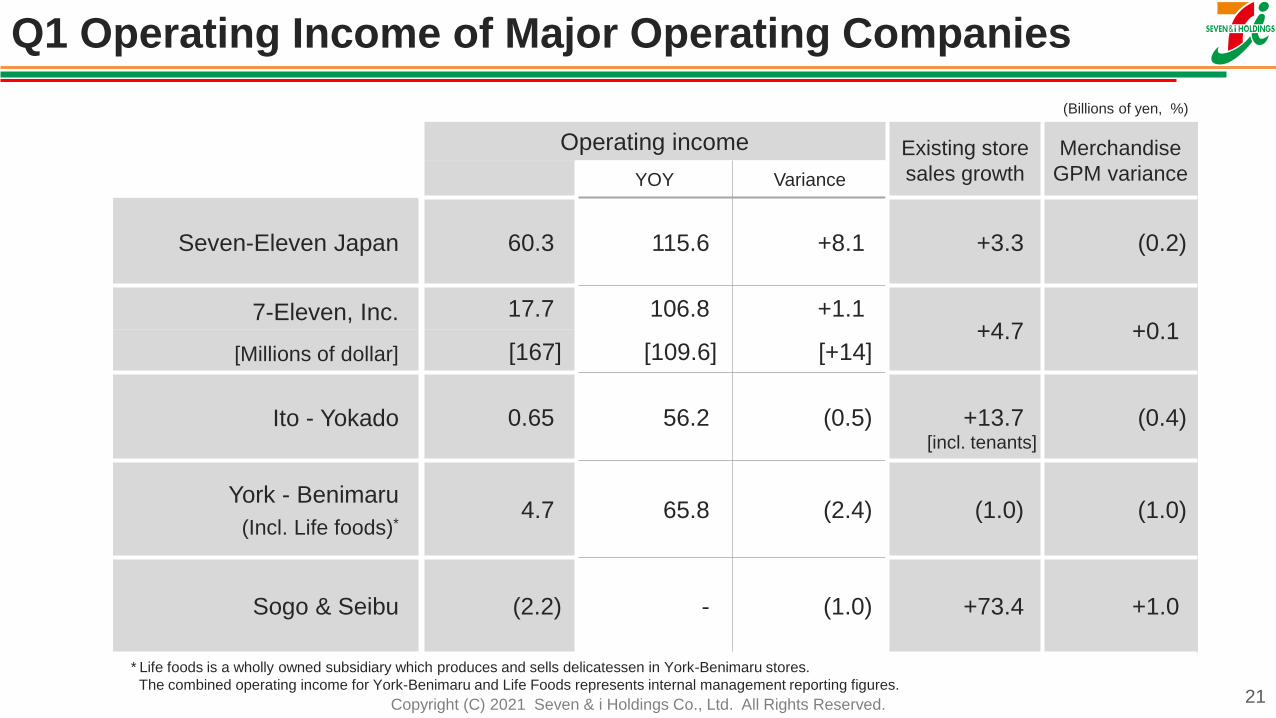
Q1 Operating Income of Major Operating Companies
21
Operating income Existing store
sales growth
Merchandise
GPM varianceYOY Variance
Seven-Eleven Japan 60.3 115.6 +8.1 +3.3 (0.2)
7-Eleven, Inc. 17.7 106.8 +1.1+4.7 +0.1
[Millions of dollar] [167] [109.6] [+14]
Ito - Yokado 0.65 56.2 (0.5) +13.7 (0.4)
York - Benimaru
(Incl. Life foods)*4.7 65.8 (2.4) (1.0) (1.0)
Sogo & Seibu (2.2) - (1.0) +73.4 +1.0
* Life foods is a wholly owned subsidiary which produces and sells delicatessen in York-Benimaru stores.
The combined operating income for York-Benimaru and Life Foods represents internal management reporting figures.
(Billions of yen, %)
[incl. tenants]
Copyright (C) 2021 Seven & i Holdings Co., Ltd. All Rights Reserved.
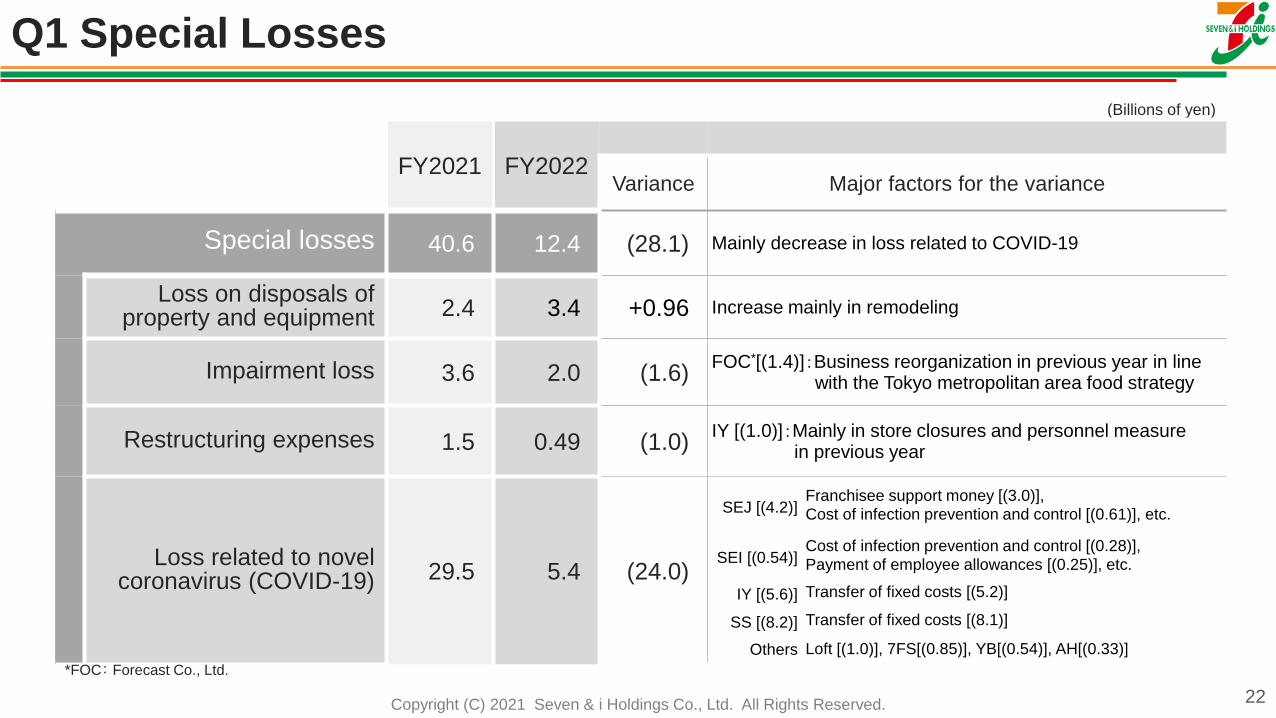
Q1 Special Losses
(Billions of yen)
22
FY2021 FY2022Variance Major factors for the variance
Special losses 40.6 12.4 (28.1) Mainly decrease in loss related to COVID-19
Loss on disposals of property and equipment 2.4 3.4 +0.96 Increase mainly in remodeling
Impairment loss 3.6 2.0 (1.6)FOC*[(1.4)]:Business reorganization in previous year in line
with the Tokyo metropolitan area food strategy
Restructuring expenses 1.5 0.49 (1.0)IY [(1.0)]:Mainly in store closures and personnel measure
in previous year
Loss related to novelcoronavirus (COVID-19) 29.5 5.4 (24.0)
SEJ [(4.2)]Franchisee support money [(3.0)],Cost of infection prevention and control [(0.61)], etc.
SEI [(0.54)]Cost of infection prevention and control [(0.28)],Payment of employee allowances [(0.25)], etc.
IY [(5.6)] Transfer of fixed costs [(5.2)]
SS [(8.2)] Transfer of fixed costs [(8.1)]
Others Loft [(1.0)], 7FS[(0.85)], YB[(0.54)], AH[(0.33)]
*FOC: Forecast Co., Ltd.
Copyright (C) 2021 Seven & i Holdings Co., Ltd. All Rights Reserved.
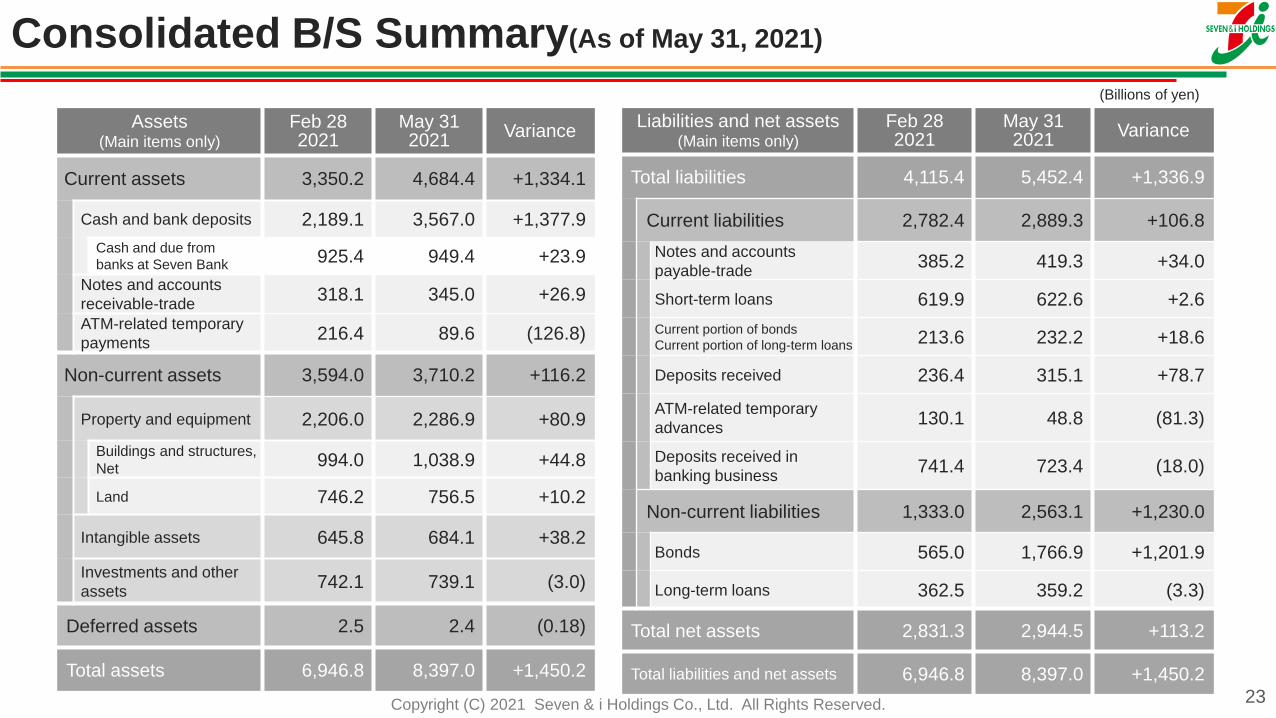
Consolidated B/S Summary(As of May 31, 2021)
(Billions of yen)
23
Assets(Main items only)
Feb 282021
May 312021
Variance
Current assets 3,350.2 4,684.4 +1,334.1
Cash and bank deposits 2,189.1 3,567.0 +1,377.9
Cash and due from
banks at Seven Bank925.4 949.4 +23.9
Notes and accounts
receivable-trade 318.1 345.0 +26.9
ATM-related temporary
payments216.4 89.6 (126.8)
Non-current assets 3,594.0 3,710.2 +116.2
Property and equipment 2,206.0 2,286.9 +80.9
Buildings and structures,
Net994.0 1,038.9 +44.8
Land 746.2 756.5 +10.2
Intangible assets 645.8 684.1 +38.2
Investments and other
assets742.1 739.1 (3.0)
Deferred assets 2.5 2.4 (0.18)
Total assets 6,946.8 8,397.0 +1,450.2
Liabilities and net assets(Main items only)
Feb 282021
May 312021
Variance
Total liabilities 4,115.4 5,452.4 +1,336.9
Current liabilities 2,782.4 2,889.3 +106.8
Notes and accounts
payable-trade385.2 419.3 +34.0
Short-term loans 619.9 622.6 +2.6
Current portion of bonds
Current portion of long-term loans 213.6 232.2 +18.6
Deposits received 236.4 315.1 +78.7
ATM-related temporary
advances130.1 48.8 (81.3)
Deposits received in
banking business741.4 723.4 (18.0)
Non-current liabilities 1,333.0 2,563.1 +1,230.0
Bonds 565.0 1,766.9 +1,201.9
Long-term loans 362.5 359.2 (3.3)
Total net assets 2,831.3 2,944.5 +113.2
Total liabilities and net assets 6,946.8 8,397.0 +1,450.2
Copyright (C) 2021 Seven & i Holdings Co., Ltd. All Rights Reserved.
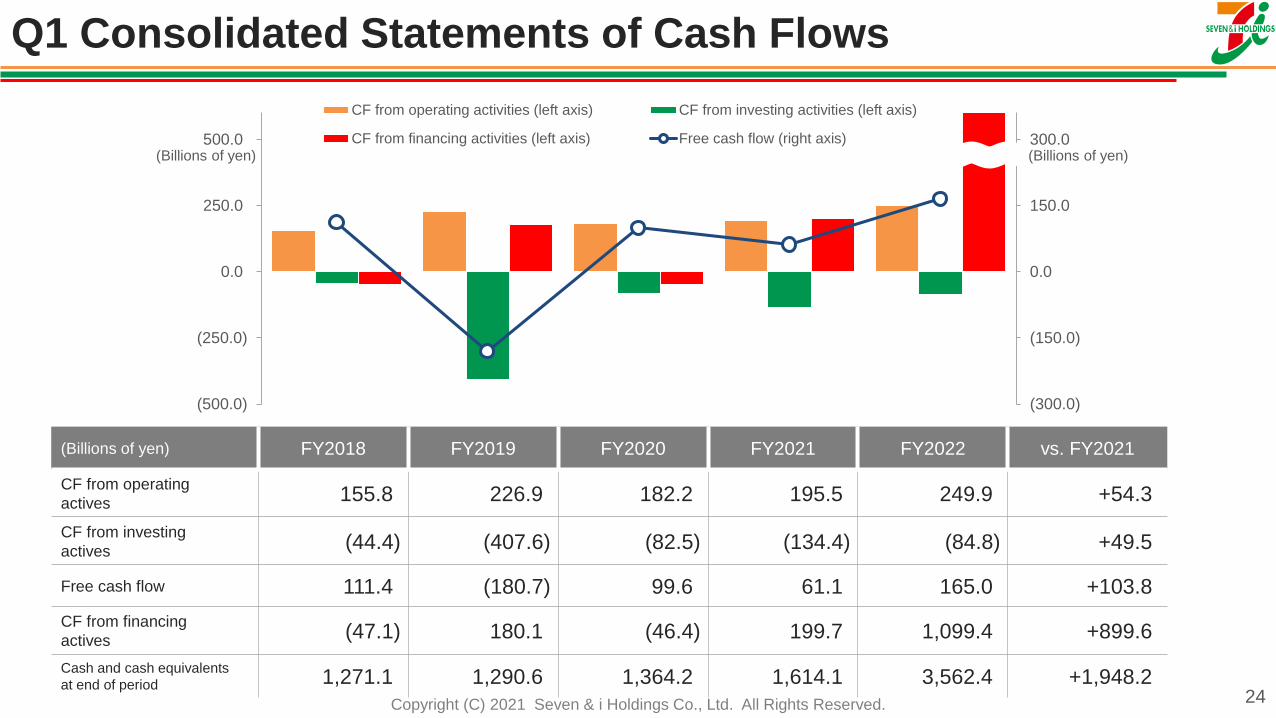
Q1 Consolidated Statements of Cash Flows
(300.0)
(150.0)
0.0
150.0
300.0
(500.0)
(250.0)
0.0
250.0
500.0
CF from operating activities (left axis) CF from investing activities (left axis)
CF from financing activities (left axis) Free cash flow (right axis)(Billions of yen) (Billions of yen)
(Billions of yen) FY2018 FY2019 FY2020 FY2021 FY2022 vs. FY2021
CF from operating
actives155.8 226.9 182.2 195.5 249.9 +54.3
CF from investing
actives(44.4) (407.6) (82.5) (134.4) (84.8) +49.5
Free cash flow 111.4 (180.7) 99.6 61.1 165.0 +103.8
CF from financing
actives(47.1) 180.1 (46.4) 199.7 1,099.4 +899.6
Cash and cash equivalents
at end of period 1,271.1 1,290.6 1,364.2 1,614.1 3,562.4 +1,948.224
Copyright (C) 2021 Seven & i Holdings Co., Ltd. All Rights Reserved. 25
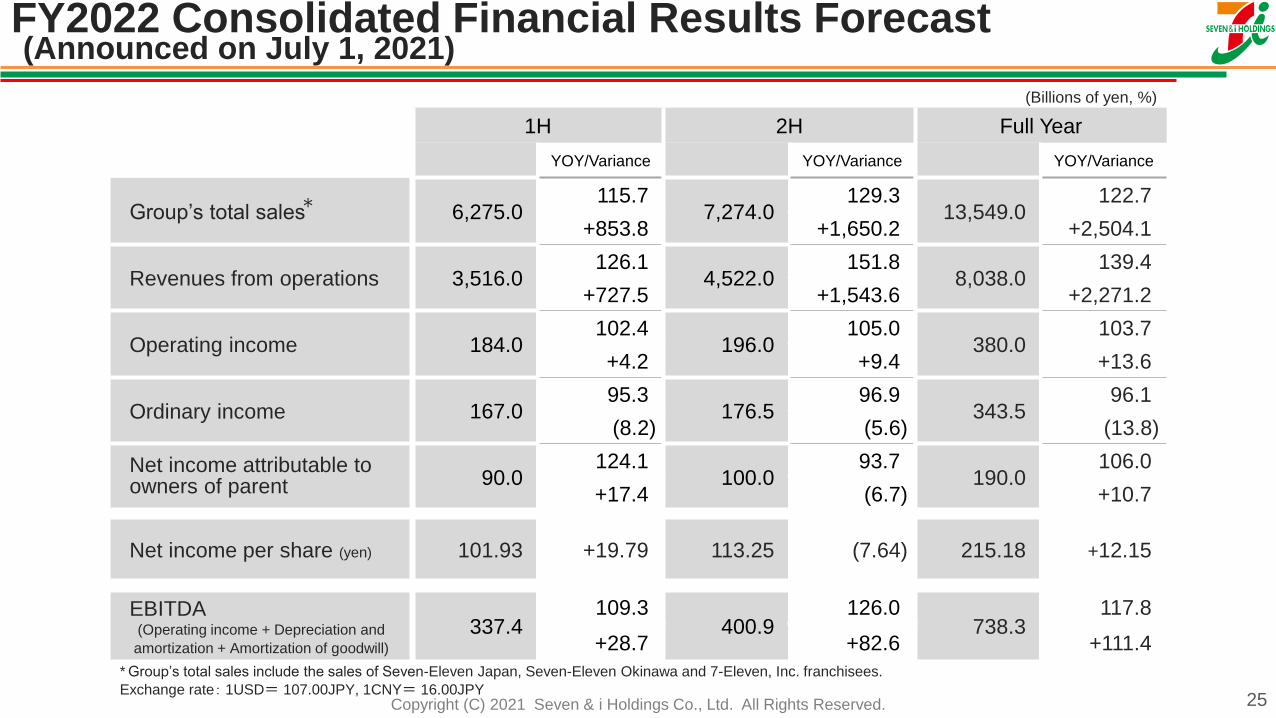
1H 2H Full Year
YOY/Variance YOY/Variance YOY/Variance
Group’s total sales 6,275.0115.7
7,274.0129.3
13,549.0122.7
+853.8 +1,650.2 +2,504.1
Revenues from operations 3,516.0126.1
4,522.0151.8
8,038.0139.4
+727.5 +1,543.6 +2,271.2
Operating income 184.0102.4
196.0105.0
380.0103.7
+4.2 +9.4 +13.6
Ordinary income 167.095.3
176.596.9
343.596.1
(8.2) (5.6) (13.8)
Net income attributable to owners of parent 90.0
124.1100.0
93.7190.0
106.0
+17.4 (6.7) +10.7
Net income per share (yen) 101.93 +19.79 113.25 (7.64) 215.18 +12.15
EBITDA(Operating income + Depreciation and
amortization + Amortization of goodwill)
337.4109.3
400.9126.0
738.3117.8
+28.7 +82.6 +111.4
*
FY2022 Consolidated Financial Results Forecast(Announced on July 1, 2021)
(Billions of yen, %)
* Group’s total sales include the sales of Seven-Eleven Japan, Seven-Eleven Okinawa and 7-Eleven, Inc. franchisees.
Exchange rate: 1USD= 107.00JPY, 1CNY= 16.00JPY
Copyright (C) 2021 Seven & i Holdings Co., Ltd. All Rights Reserved. 26
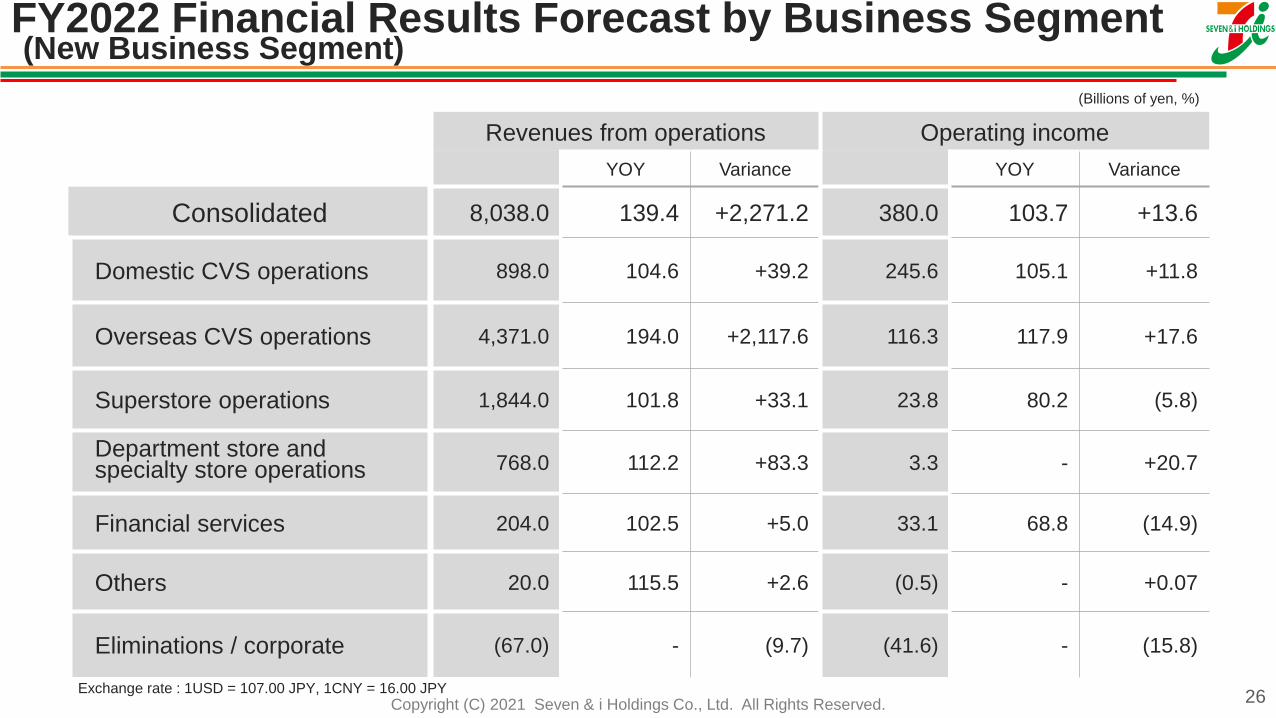
(Billions of yen, %)
Revenues from operations Operating income
YOY Variance YOY Variance
Consolidated 8,038.0 139.4 +2,271.2 380.0 103.7 +13.6
Domestic CVS operations 898.0 104.6 +39.2 245.6 105.1 +11.8
Overseas CVS operations 4,371.0 194.0 +2,117.6 116.3 117.9 +17.6
Superstore operations 1,844.0 101.8 +33.1 23.8 80.2 (5.8)
Department store and specialty store operations 768.0 112.2 +83.3 3.3 - +20.7
Financial services 204.0 102.5 +5.0 33.1 68.8 (14.9)
Others 20.0 115.5 +2.6 (0.5) - +0.07
Eliminations / corporate (67.0) - (9.7) (41.6) - (15.8)
Exchange rate : 1USD = 107.00 JPY, 1CNY = 16.00 JPY
FY2022 Financial Results Forecast by Business Segment(New Business Segment)
Copyright (C) 2021 Seven & i Holdings Co., Ltd. All Rights Reserved.
The information disclosed by the Company may contain forward-looking statements. These statementsare based on management’s judgment in accordance with materials available to the Company at the timeof disclosure, with future projections based on certain assumptions. The forward-looking statementstherefore incorporate various risks, estimates, and uncertainties, and as such, actual results andperformance may differ from the future outlook included in disclosed information due to various factors,such as changes in business operations and the financial situation going forward.
With Livings - Seven & i Group
27