Embed Size (px)
Citation preview
Investor Presentation
Q1 FY 2019-20
August 2019
2
DisclaimerThis presentation has been prepared by Ujjivan Financial Services Limited (the “Company”) for general information purposes only, without regard to any specific objectives, suitability, financial
situations and needs of any particular person and does not constitute any recommendation or form part of any offer or invitation, directly or indirectly, in any manner, or inducement to sell or
issue, or any solicitation of any offer to purchase or subscribe for, any securities of the Company, nor shall it or any part of it or the fact of its distribution form the basis of, or be relied on in
connection with, any contract or commitment therefor. This presentation does not solicit any action based on the material contained herein. Nothing in this presentation is intended by the
Company to be construed as legal, accounting or tax advice.
This presentation has been prepared by the Company based upon information available in the public domain. This presentation has not been approved and will not or may not be reviewed or
approved by any statutory or regulatory authority in India or by any Stock Exchange in India. This presentation may include statements which may constitute forward-looking statements. The actual
results could differ materially from those projected in any such forward-looking statements because of various factors. The Company assumes no responsibility to publicly amend, modify or revise
any forward-looking statements, on the basis of any subsequent developments, information or events, or otherwise.
This presentation contains certain forward-looking statements relating to the business, financial performance, strategy and results of the Company and/ or the industry in which it operates.
Forward-looking statements are statements concerning future circumstances and results, and any other statements that are not historical facts, sometimes identified by the words including,
without limitation “believes”, “expects”, “predicts”, “intends”, “projects”, “plans”, “estimates”, “aims”, “foresees”, “anticipates”, “targets”, and similar expressions. The forward-looking statements,
including those cited from third party sources, contained in this presentation are based on numerous assumptions and are uncertain and subject to risks. A multitude of factors including, but not
limited to, changes in demand, competition and technology, can cause actual events, performance or results to differ significantly from any anticipated development. Neither the Company nor its
affiliates or advisors or representatives nor any of its or their parent or subsidiary undertakings or any such person's officers or employees guarantees that the assumptions underlying such
forward-looking statements are free from errors nor does either accept any responsibility for the future accuracy of the forward-looking statements contained in this presentation or the actual
occurrence of the forecasted developments. Forward-looking statements speak only as of the date of this presentation and are not guarantees of future performance. As a result, the Company
expressly disclaims any obligation or undertaking to release any update or revisions to any forward-looking statements in this presentation as a result of any change in expectations or any change in
events, conditions, assumptions or circumstances on which these forward looking statements are based. Given these uncertainties and other factors, viewers of this presentation are cautioned not
to place undue reliance on these forward-looking statements.
The information contained in these materials has not been independently verified. None of the Company, its directors, promoter or affiliates, nor any of its or their respective employees, advisers
or representatives or any other person accepts any responsibility or liability whatsoever, whether arising in tort, contract or otherwise, for any errors, omissions or inaccuracies in such information
or opinions or for any loss, cost or damage suffered or incurred howsoever arising, directly or indirectly, from any use of this presentation or its contents or otherwise in connection with this
presentation, and makes no representation or warranty, express or implied, for the contents of this presentation including its accuracy, fairness, completeness or verification or for any other
statement made or purported to be made by any of them, or on behalf of them, and nothing in this presentation or at this presentation shall be relied upon as a promise or representation in this
respect, whether as to the past or the future. Past performance is not a guide for future performance. The information contained in this presentation is current, and if not stated otherwise, made as
of the date of this presentation. The Company undertakes no obligation to update or revise any information in this presentation as a result of new information, future events or otherwise. Any
person/ party intending to provide finance/ invest in the shares/ businesses of the Company shall do so after seeking their own professional advice and after carrying out their own due diligence
procedure to ensure that they are making an informed decision.
3
Disclaimer
This presentation is not a prospectus, a statement in lieu of a prospectus, an offering circular, an advertisement or an offer document under the Companies Act, 2013, as amended, the Securities
and Exchange Board of India (Issue of Capital and Disclosure Requirements) Regulations, 2018, as amended, or any other applicable law in India.
This presentation is strictly confidential and may not be copied or disseminated, in whole or in part, and in any manner or for any purpose. No person is authorized to give any information or to
make any representation not contained in or inconsistent with this presentation and if given or made, such information or representation must not be relied upon as having been authorized by any
person. Failure to comply with this restriction may constitute a violation of the applicable securities laws. Neither this document nor any part or copy of it may be distributed, directly or indirectly,
in the United States. The distribution of this document in certain jurisdictions may be restricted by law and persons in to whose possession this presentation comes should inform themselves about
and observe any such restrictions. By reviewing this presentation, you agree to be bound by the foregoing limitations. You further represent and agree that you are located outside the United
States and you are permitted under the laws of your jurisdiction to receive this presentation.
This presentation is not an offer to sell or a solicitation of any offer to buy the securities of the Company in the United States or in any other jurisdiction where such offer or sale would be unlawful.
Securities may not be offered, sold, resold, pledged, delivered, distributed or transferred, directly or indirectly, in to or within the United States absent registration under the United States
Securities Act of 1933, as amended (the “Securities Act”), except pursuant to an exemption from, or in a transaction not subject to, the registration requirements of the Securities Act and in
compliance with any applicable securities laws of any state or other jurisdiction of the United States. The Company’s securities have not been and will not be registered under the Securities Act.
4
Contents
Performance Highlights - USFB
Business Performance Overview - USFB
Liabilities Profile – USFB
Financial Performance Overview - USFB
Financial Performance Overview – Consolidated UFSL
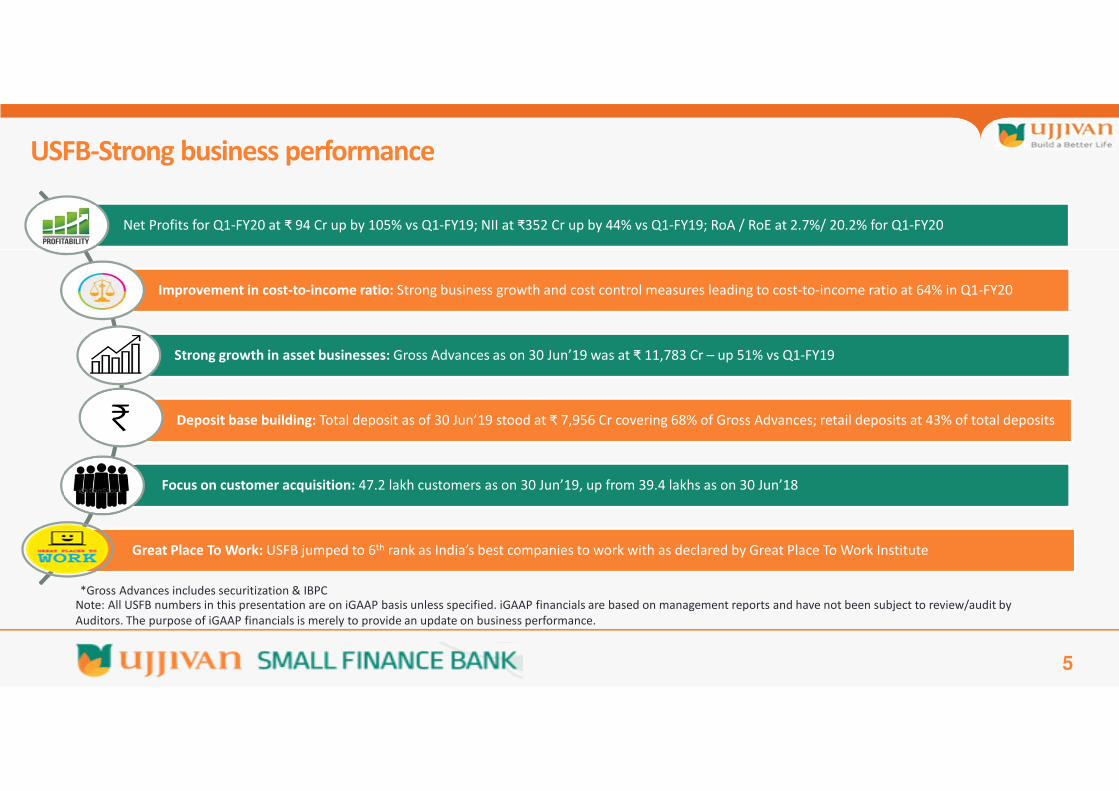
USFB-Strong business performance
5
Net Profits for Q1-FY20 at ₹ 94 Cr up by 105% vs Q1-FY19; NII at ₹352 Cr up by 44% vs Q1-FY19; RoA / RoE at 2.7%/ 20.2% for Q1-FY20
Improvement in cost-to-income ratio: Strong business growth and cost control measures leading to cost-to-income ratio at 64% in Q1-FY20
Strong growth in asset businesses: Gross Advances as on 30 Jun’19 was at ₹ 11,783 Cr – up 51% vs Q1-FY19
Deposit base building: Total deposit as of 30 Jun’19 stood at ₹ 7,956 Cr covering 68% of Gross Advances; retail deposits at 43% of total deposits
Focus on customer acquisition: 47.2 lakh customers as on 30 Jun’19, up from 39.4 lakhs as on 30 Jun’18
Great Place To Work: USFB jumped to 6th rank as India’s best companies to work with as declared by Great Place To Work Institute
Note: All USFB numbers in this presentation are on iGAAP basis unless specified. iGAAP financials are based on management reports and have not been subject to review/audit by
Auditors. The purpose of iGAAP financials is merely to provide an update on business performance.
*Gross Advances includes securitization & IBPC
6
Performance Highlights
Ujjivan Small Finance Bank
Note: All financials given in this presentation are on I-GAAP basis unless specified. These are for informational purpose only
7
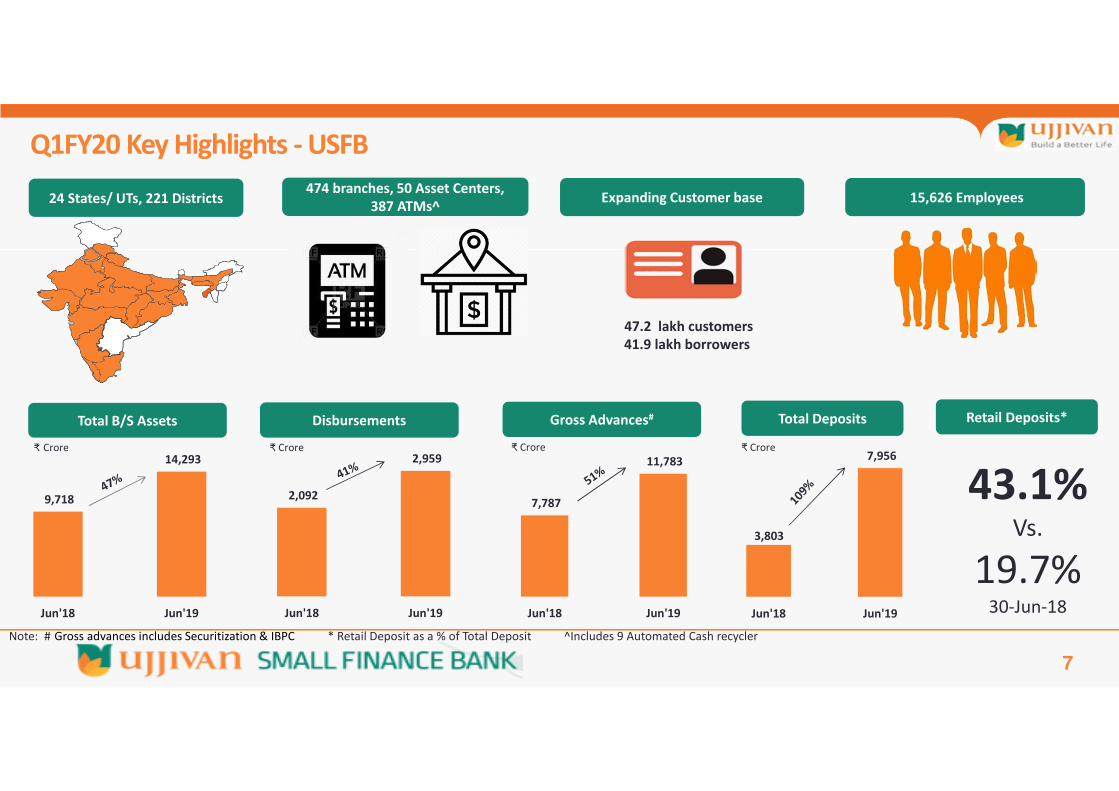
Q1FY20 Key Highlights - USFB
24 States/ UTs, 221 Districts474 branches, 50 Asset Centers,
387 ATMs^Expanding Customer base 15,626 Employees
Total B/S Assets
9,718
14,293
Jun'18 Jun'19
Disbursements
2,092
2,959
Jun'18 Jun'19
7,787
11,783
Jun'18 Jun'19
Gross Advances# Total Deposits
3,803
7,956
Jun'18 Jun'19
₹ Crore
Retail Deposits*
43.1%Vs.
19.7%30-Jun-18
₹ Crore ₹ Crore ₹ Crore
47.2 lakh customers
41.9 lakh borrowers
Note: # Gross advances includes Securitization & IBPC * Retail Deposit as a % of Total Deposit ^Includes 9 Automated Cash recycler
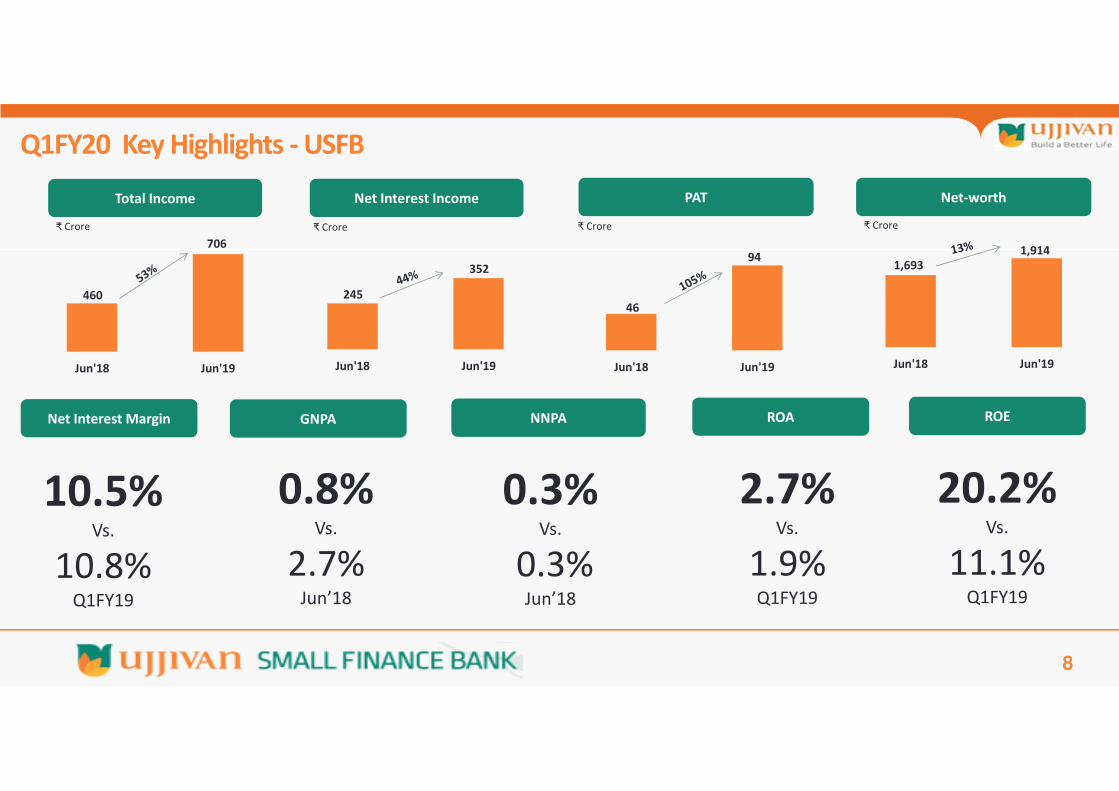
Q1FY20 Key Highlights - USFB
8
Net Interest Income PAT Net-worth
₹ Crore ₹ Crore ₹ Crore
Net Interest Margin GNPA NNPA ROA ROE
10.5%Vs.
10.8%Q1FY19
0.8%Vs.
2.7%Jun’18
0.3%Vs.
0.3%Jun’18
2.7%Vs.
1.9%Q1FY19
20.2%Vs.
11.1%Q1FY19
Total Income
460
706
Jun'18 Jun'19
₹ Crore
245
352
Jun'18 Jun'19
46
94
Jun'18 Jun'19
1,693
1,914
Jun'18 Jun'19
9
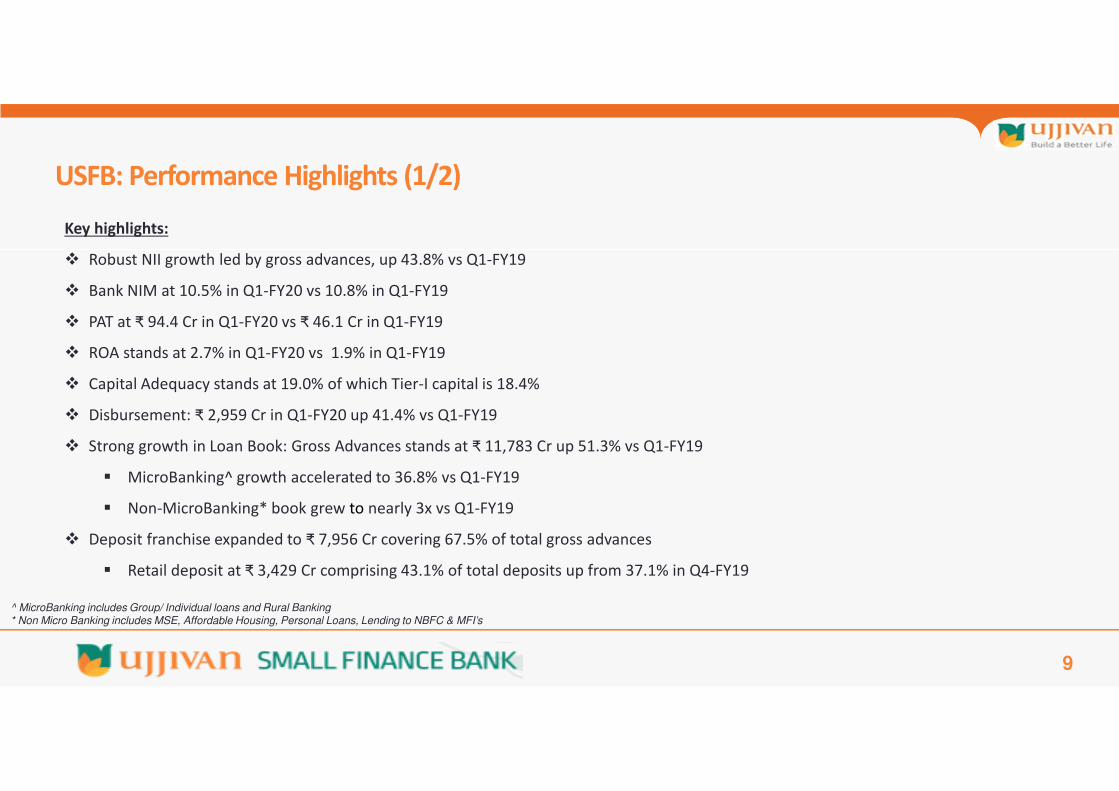
Key highlights:
Robust NII growth led by gross advances, up 43.8% vs Q1-FY19
Bank NIM at 10.5% in Q1-FY20 vs 10.8% in Q1-FY19
PAT at ₹ 94.4 Cr in Q1-FY20 vs ₹ 46.1 Cr in Q1-FY19
ROA stands at 2.7% in Q1-FY20 vs 1.9% in Q1-FY19
Capital Adequacy stands at 19.0% of which Tier-I capital is 18.4%
Disbursement: ₹ 2,959 Cr in Q1-FY20 up 41.4% vs Q1-FY19
Strong growth in Loan Book: Gross Advances stands at ₹ 11,783 Cr up 51.3% vs Q1-FY19
MicroBanking^ growth accelerated to 36.8% vs Q1-FY19
Non-MicroBanking* book grew to nearly 3x vs Q1-FY19
Deposit franchise expanded to ₹ 7,956 Cr covering 67.5% of total gross advances
Retail deposit at ₹ 3,429 Cr comprising 43.1% of total deposits up from 37.1% in Q4-FY19
USFB: Performance Highlights (1/2)
^ MicroBanking includes Group/ Individual loans and Rural Banking* Non Micro Banking includes MSE, Affordable Housing, Personal Loans, Lending to NBFC & MFI’s
10
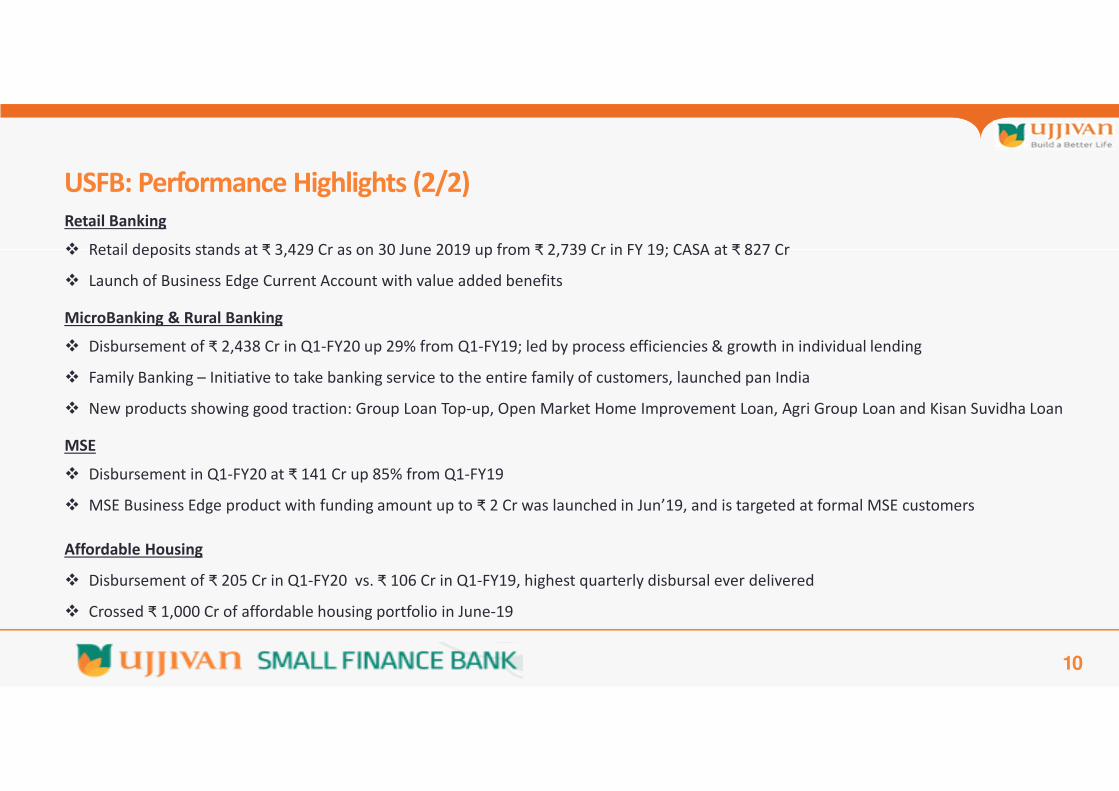
Retail Banking
Retail deposits stands at ₹ 3,429 Cr as on 30 June 2019 up from ₹ 2,739 Cr in FY 19; CASA at ₹ 827 Cr
Launch of Business Edge Current Account with value added benefits
MicroBanking & Rural Banking
Disbursement of ₹ 2,438 Cr in Q1-FY20 up 29% from Q1-FY19; led by process efficiencies & growth in individual lending
Family Banking – Initiative to take banking service to the entire family of customers, launched pan India
New products showing good traction: Group Loan Top-up, Open Market Home Improvement Loan, Agri Group Loan and Kisan Suvidha Loan
MSE
Disbursement in Q1-FY20 at ₹ 141 Cr up 85% from Q1-FY19
MSE Business Edge product with funding amount up to ₹ 2 Cr was launched in Jun’19, and is targeted at formal MSE customers
Affordable Housing
Disbursement of ₹ 205 Cr in Q1-FY20 vs. ₹ 106 Cr in Q1-FY19, highest quarterly disbursal ever delivered
Crossed ₹ 1,000 Cr of affordable housing portfolio in June-19
USFB: Performance Highlights (2/2)
11
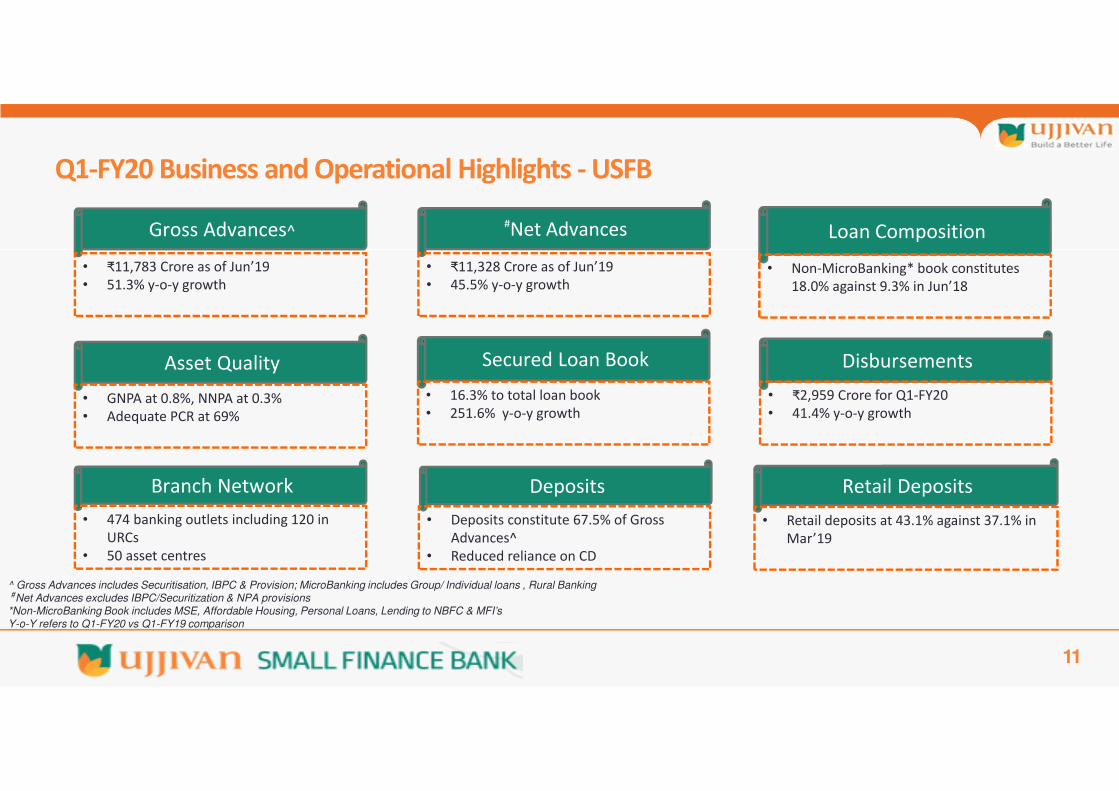
Q1-FY20 Business and Operational Highlights - USFB
Gross Advances^
• ₹11,783 Crore as of Jun’19
• 51.3% y-o-y growth
Loan Composition
• Non-MicroBanking* book constitutes
18.0% against 9.3% in Jun’18
Disbursements
• ₹2,959 Crore for Q1-FY20
• 41.4% y-o-y growth
Secured Loan Book
• 16.3% to total loan book
• 251.6% y-o-y growth
Asset Quality
• GNPA at 0.8%, NNPA at 0.3%
• Adequate PCR at 69%
Deposits
• Deposits constitute 67.5% of Gross
Advances^
• Reduced reliance on CD
Retail Deposits
• Retail deposits at 43.1% against 37.1% in
Mar’19
#Net Advances
• ₹11,328 Crore as of Jun’19
• 45.5% y-o-y growth
^ Gross Advances includes Securitisation, IBPC & Provision; MicroBanking includes Group/ Individual loans , Rural Banking#Net Advances excludes IBPC/Securitization & NPA provisions
*Non-MicroBanking Book includes MSE, Affordable Housing, Personal Loans, Lending to NBFC & MFI’sY-o-Y refers to Q1-FY20 vs Q1-FY19 comparison
Branch Network
• 474 banking outlets including 120 in
URCs
• 50 asset centres
12
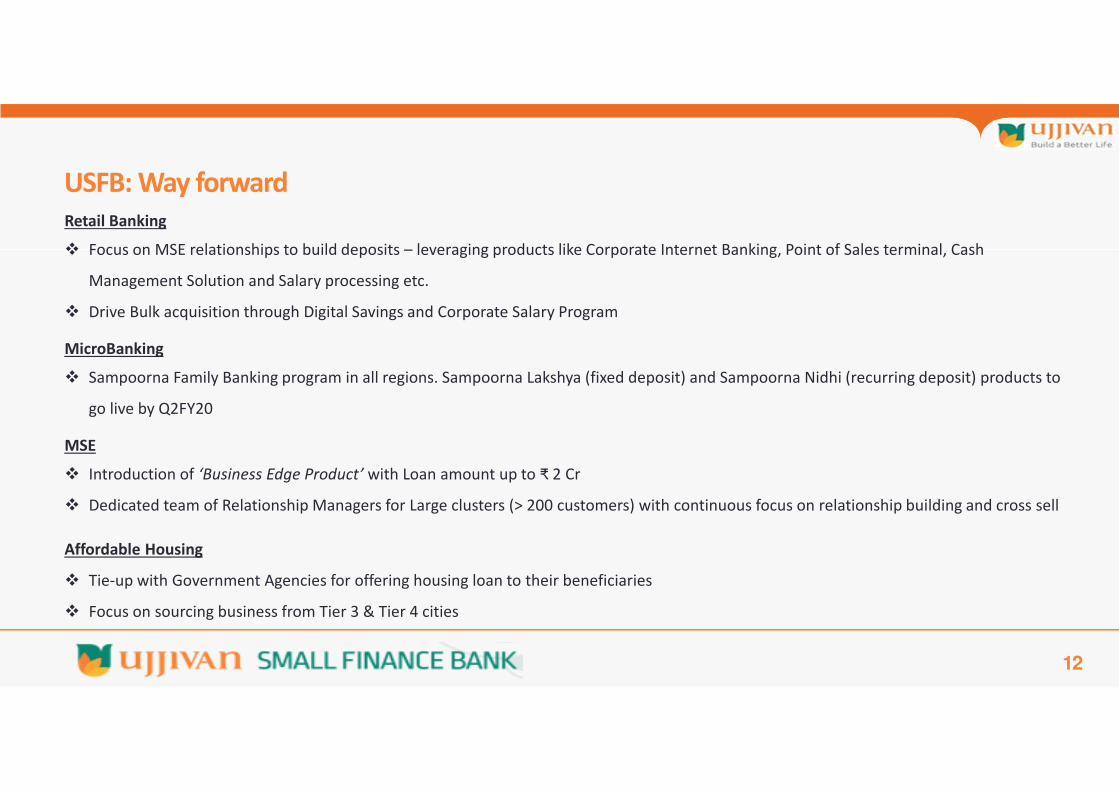
Retail Banking
Focus on MSE relationships to build deposits – leveraging products like Corporate Internet Banking, Point of Sales terminal, Cash
Management Solution and Salary processing etc.
Drive Bulk acquisition through Digital Savings and Corporate Salary Program
MicroBanking
Sampoorna Family Banking program in all regions. Sampoorna Lakshya (fixed deposit) and Sampoorna Nidhi (recurring deposit) products to
go live by Q2FY20
MSE
Introduction of ‘Business Edge Product’ with Loan amount up to ₹ 2 Cr
Dedicated team of Relationship Managers for Large clusters (> 200 customers) with continuous focus on relationship building and cross sell
Affordable Housing
Tie-up with Government Agencies for offering housing loan to their beneficiaries
Focus on sourcing business from Tier 3 & Tier 4 cities
USFB: Way forward
13
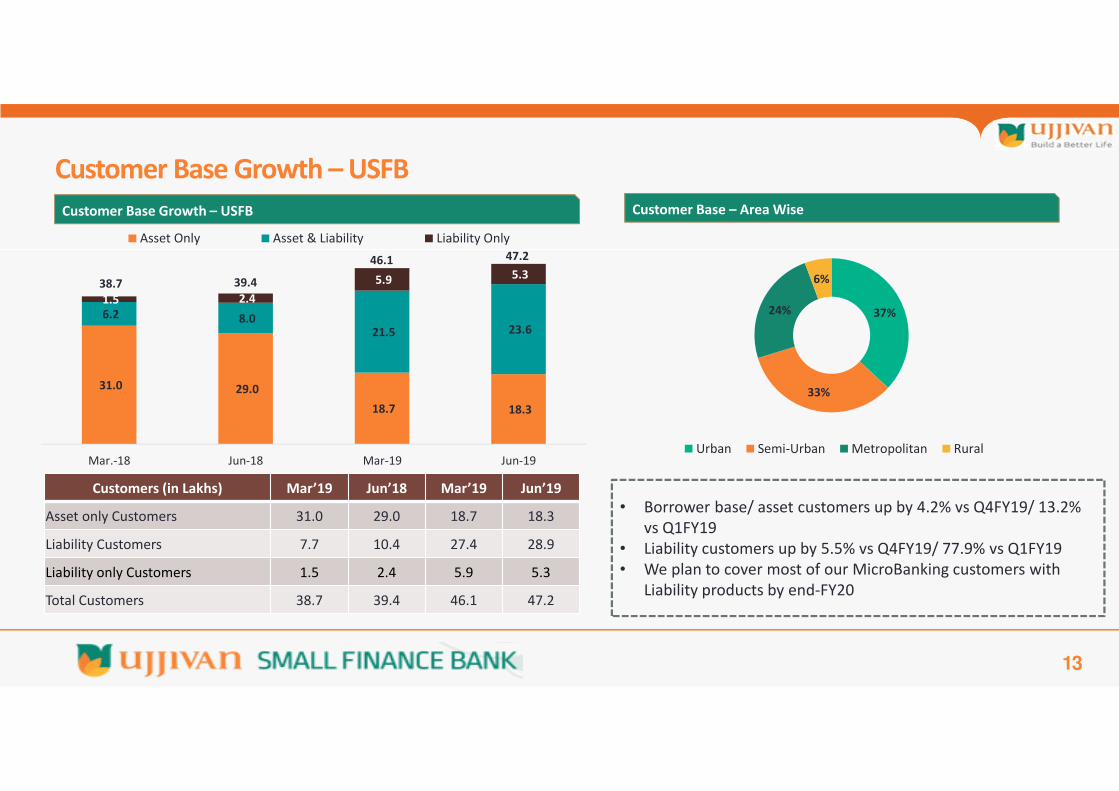
Customers (in Lakhs) Mar’19 Jun’18 Mar’19 Jun’19
Asset only Customers 31.0 29.0 18.7 18.3
Liability Customers 7.7 10.4 27.4 28.9
Liability only Customers 1.5 2.4 5.9 5.3
Total Customers 38.7 39.4 46.1 47.2
Customer Base Growth – USFB
Customer Base – Area WiseCustomer Base Growth – USFB
37%
33%
24%
6%
Urban Semi-Urban Metropolitan Rural
• Borrower base/ asset customers up by 4.2% vs Q4FY19/ 13.2%
vs Q1FY19
• Liability customers up by 5.5% vs Q4FY19/ 77.9% vs Q1FY19
• We plan to cover most of our MicroBanking customers with
Liability products by end-FY20
31.0 29.0
18.7 18.3
6.2 8.0 21.5 23.6
1.5 2.4
5.9 5.3
Mar.-18 Jun-18 Mar-19 Jun-19
Asset Only Asset & Liability Liability Only
46.1
39.4
47.2
38.7
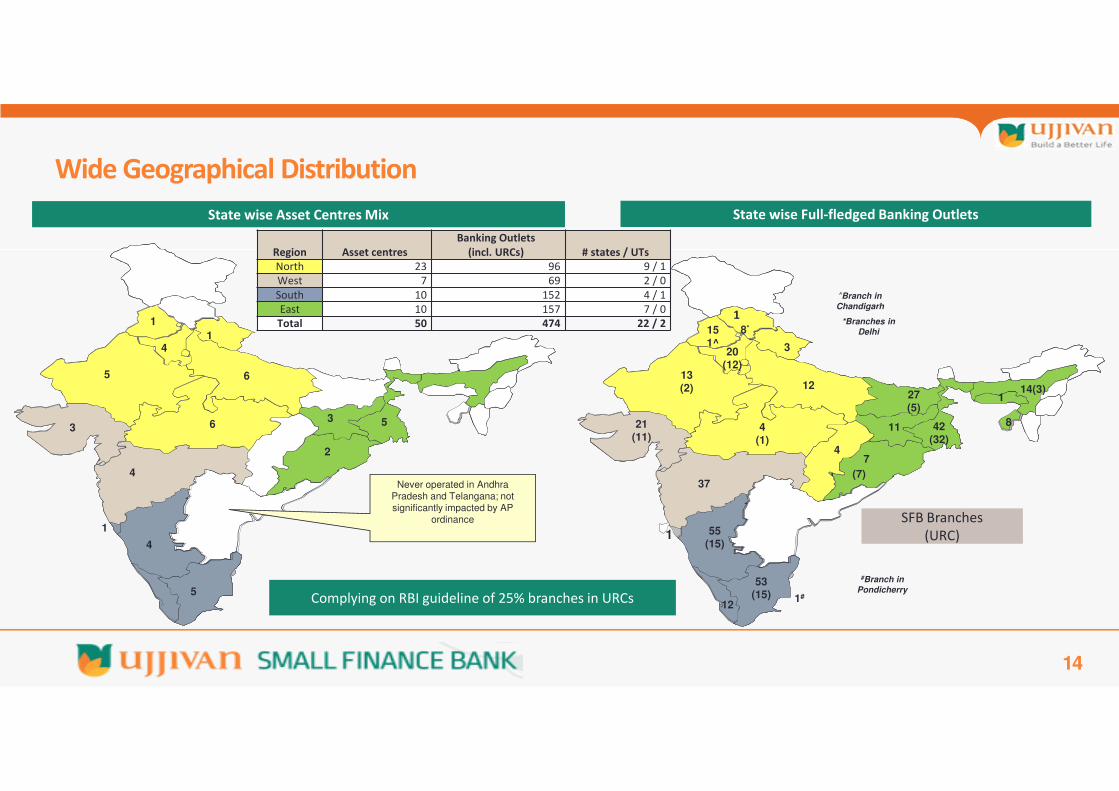
Wide Geographical Distribution
14
State wise Asset Centres Mix
41
4
5
5
4
3
65
3
1
2
#Branch in
Pondicherry
6
^Branch in
Chandigarh
1
Region Asset centres
Banking Outlets
(incl. URCs) # states / UTs
North 23 96 9 / 1
West 7 69 2 / 0
South 10 152 4 / 1
East 10 157 7 / 0
Total 50 474 22 / 2
Never operated in Andhra Pradesh and Telangana; not significantly impacted by AP
ordinance
1
7
( (7)
1
State wise Full-fledged Banking Outlets
15
1^
14(3)27
(5)
4
21
(11)
20
(12)
11
55
(15)
53
(15)12
42
(32)
37
1213
(2)
3
8**Branches in
Delhi
1#
8
SFB Branches
(URC)
1
4
(1)
Complying on RBI guideline of 25% branches in URCs
15
Business Performance Overview
Ujjivan Small Finance Bank
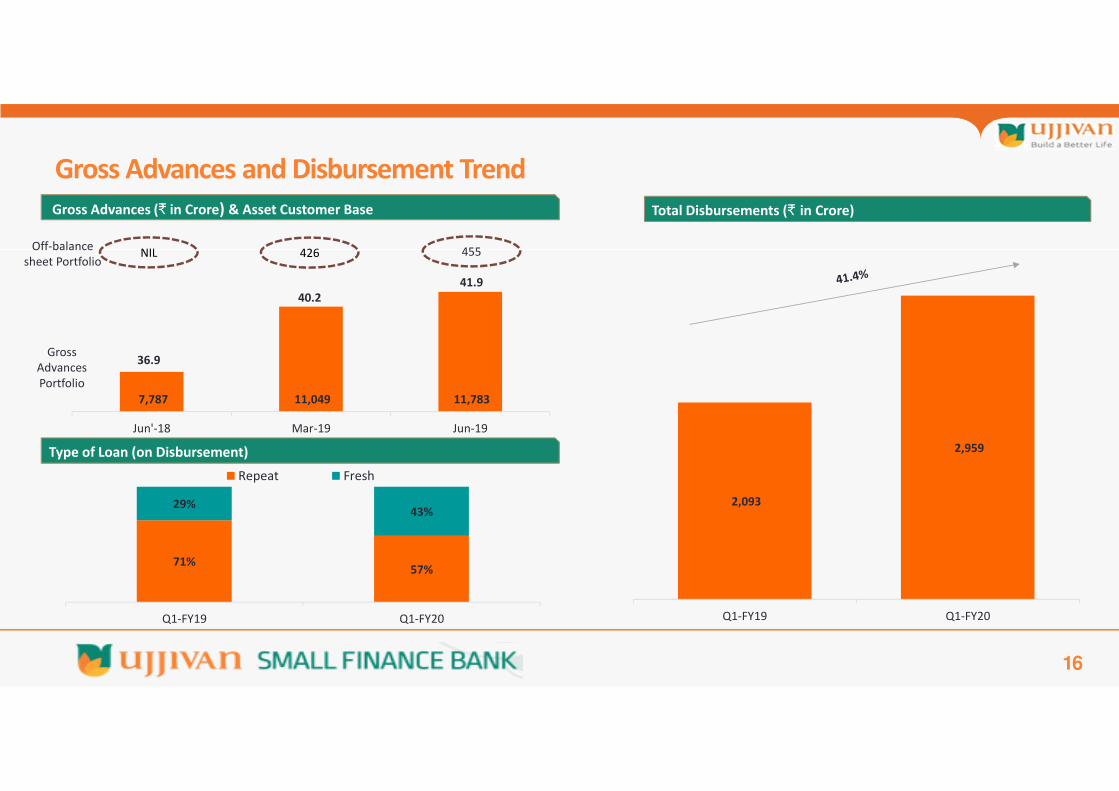
Gross Advances and Disbursement Trend
16
7,787 11,049 11,783
Jun'-18 Mar-19 Jun-19
40.2
36.9
Gross Advances (₹ in Crore) & Asset Customer Base
Type of Loan (on Disbursement)
71%57%
29%43%
Q1-FY19 Q1-FY20
Repeat Fresh
Gross
Advances
Portfolio
455Off-balance
sheet PortfolioNIL 426
2,093
2,959
Q1-FY19 Q1-FY20
Total Disbursements (₹ in Crore)
41.9
Branch location wise Gross Advances break-upBranch location wise Gross Advances break-up
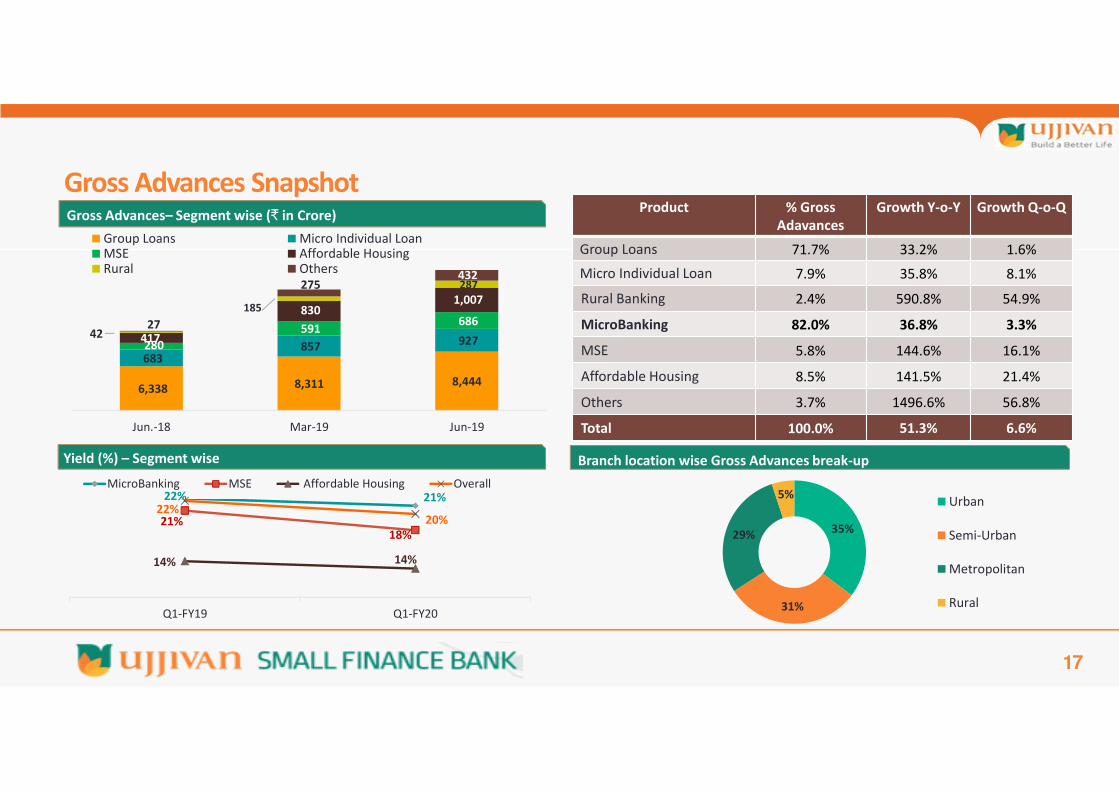
17
Gross Advances Snapshot
21%
21%18%
14% 14%
22%20%
Q1-FY19 Q1-FY20
MicroBanking MSE Affordable Housing Overall
Yield (%) – Segment wise
Product % Gross
Adavances
Growth Y-o-Y Growth Q-o-Q
Group Loans 71.7% 33.2% 1.6%
Micro Individual Loan 7.9% 35.8% 8.1%
Rural Banking 2.4% 590.8% 54.9%
MicroBanking 82.0% 36.8% 3.3%
MSE 5.8% 144.6% 16.1%
Affordable Housing 8.5% 141.5% 21.4%
Others 3.7% 1496.6% 56.8%
Total 100.0% 51.3% 6.6%
Gross Advances– Segment wise (₹ in Crore)
6,338 8,311 8,444
683 857 927 280
591 686 27
830 1,007
185
287
Jun.-18 Mar-19 Jun-19
Group Loans Micro Individual LoanMSE Affordable HousingRural Others
42
432275
22%
417
35%
31%
29%
5%Urban
Semi-Urban
Metropolitan
Rural
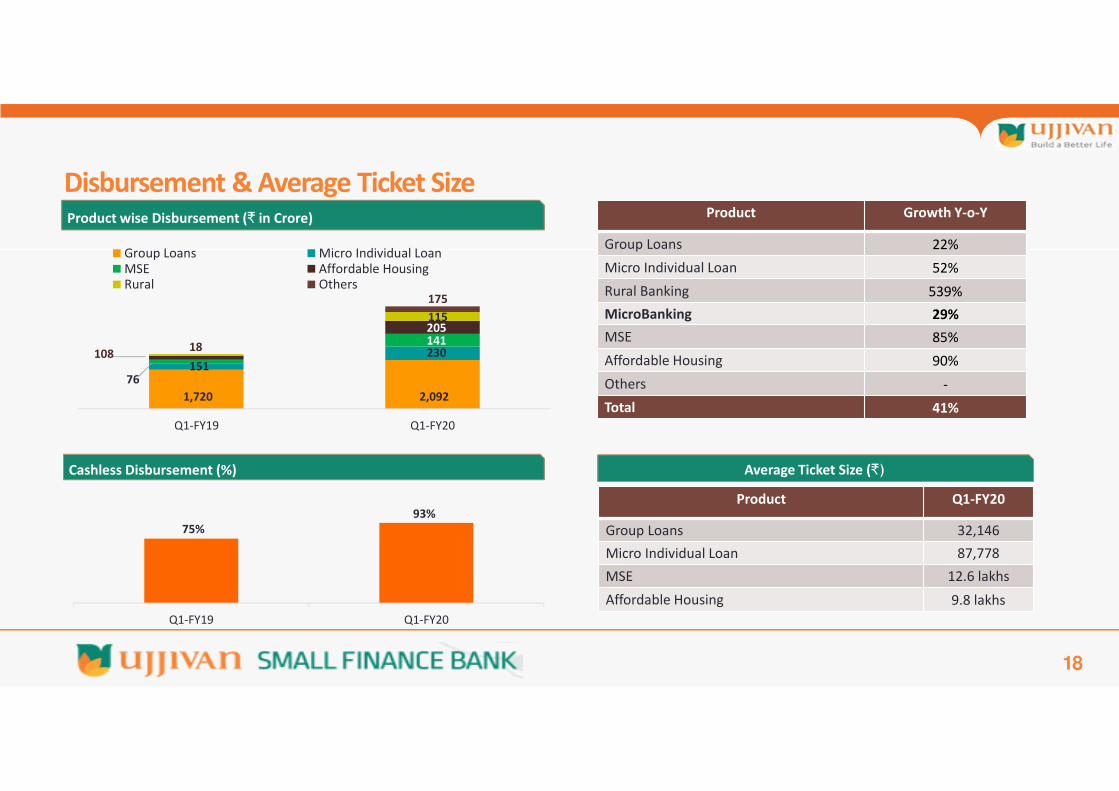
18
Product wise Disbursement (₹ in Crore)
Product Q1-FY20
Group Loans 32,146
Micro Individual Loan 87,778
MSE 12.6 lakhs
Affordable Housing 9.8 lakhs
Average Ticket Size (₹)
Product Growth Y-o-Y
Group Loans 22%
Micro Individual Loan 52%
Rural Banking 539%
MicroBanking 29%
MSE 85%
Affordable Housing 90%
Others -
Total 41%
Cashless Disbursement (%)
Disbursement & Average Ticket Size
1,720 2,092
151 230
76
141 108
205115
Q1-FY19 Q1-FY20
Group Loans Micro Individual LoanMSE Affordable HousingRural Others
18
175
75%
93%
Q1-FY19 Q1-FY20
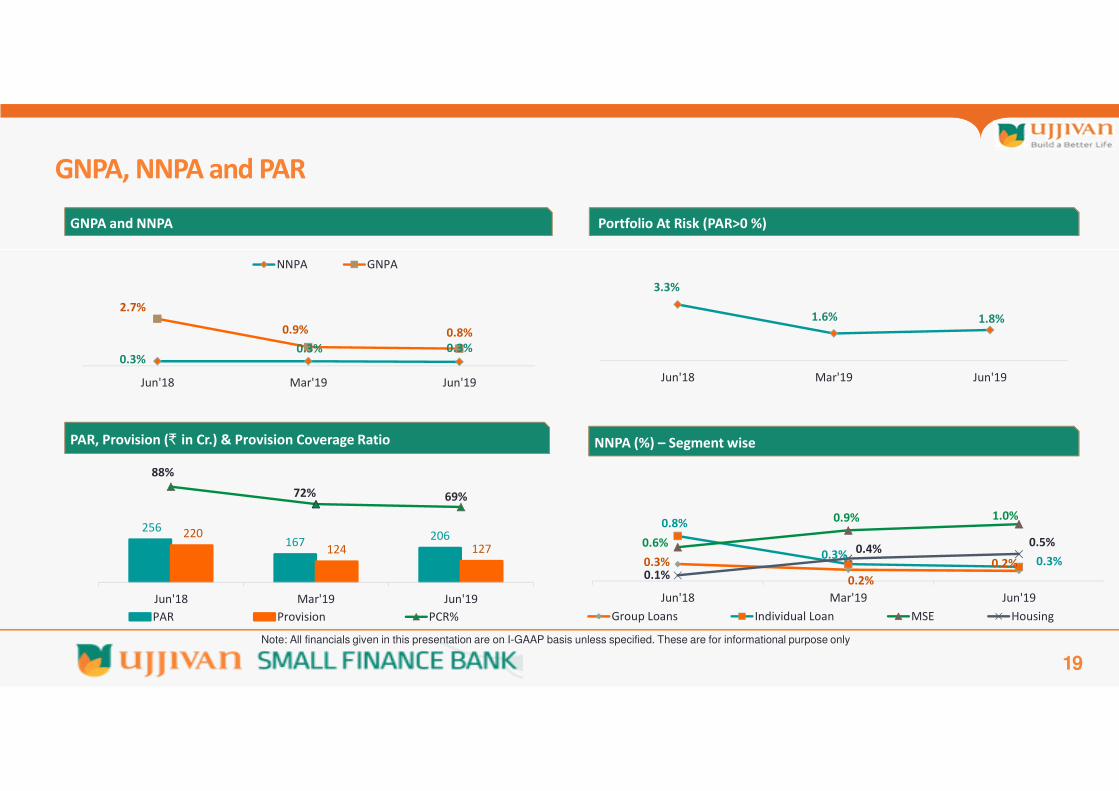
GNPA, NNPA and PAR
19
GNPA and NNPA
PAR, Provision (₹ in Cr.) & Provision Coverage Ratio
Portfolio At Risk (PAR>0 %)
NNPA (%) – Segment wise
256
167206220
124 127
88%
72% 69%
Jun'18 Mar'19 Jun'19
PAR Provision PCR%
0.3%
0.2%
0.2%
0.8%
0.3%0.3%
0.6%
0.9% 1.0%
0.1%
0.4%0.5%
Jun'18 Mar'19 Jun'19
Group Loans Individual Loan MSE Housing
0.3%0.3% 0.3%
2.7%
0.9% 0.8%
Jun'18 Mar'19 Jun'19
NNPA GNPA
3.3%
1.6% 1.8%
Jun'18 Mar'19 Jun'19
Note: All financials given in this presentation are on I-GAAP basis unless specified. These are for informational purpose only
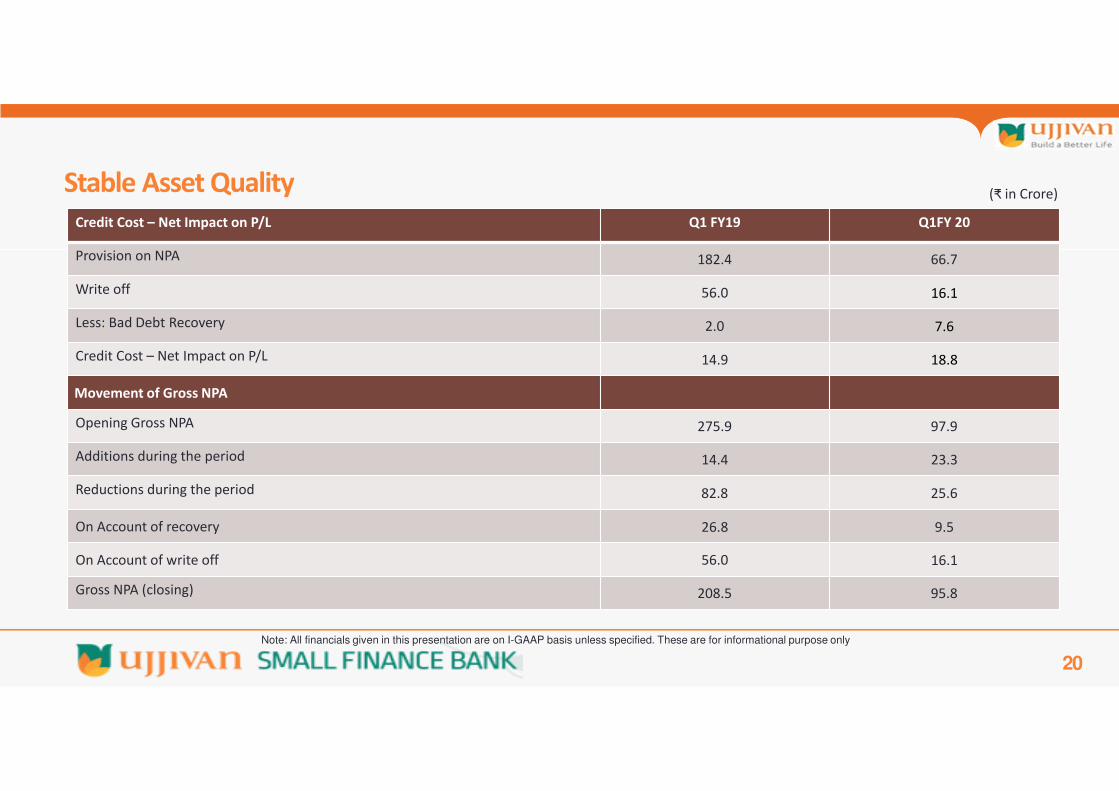
20
Credit Cost – Net Impact on P/L Q1 FY19 Q1FY 20
Provision on NPA 182.4 66.7
Write off 56.0 16.1
Less: Bad Debt Recovery 2.0 7.6
Credit Cost – Net Impact on P/L 14.9 18.8
Movement of Gross NPA
Opening Gross NPA 275.9 97.9
Additions during the period 14.4 23.3
Reductions during the period 82.8 25.6
On Account of recovery 26.8 9.5
On Account of write off 56.0 16.1
Gross NPA (closing) 208.5 95.8
Stable Asset Quality (₹ in Crore)
Note: All financials given in this presentation are on I-GAAP basis unless specified. These are for informational purpose only
21
Liabilities Profile
Ujjivan Small Finance Bank
22
Bo
rro
win
gs*
Pro
file
Co
st o
f fu
nd
s^
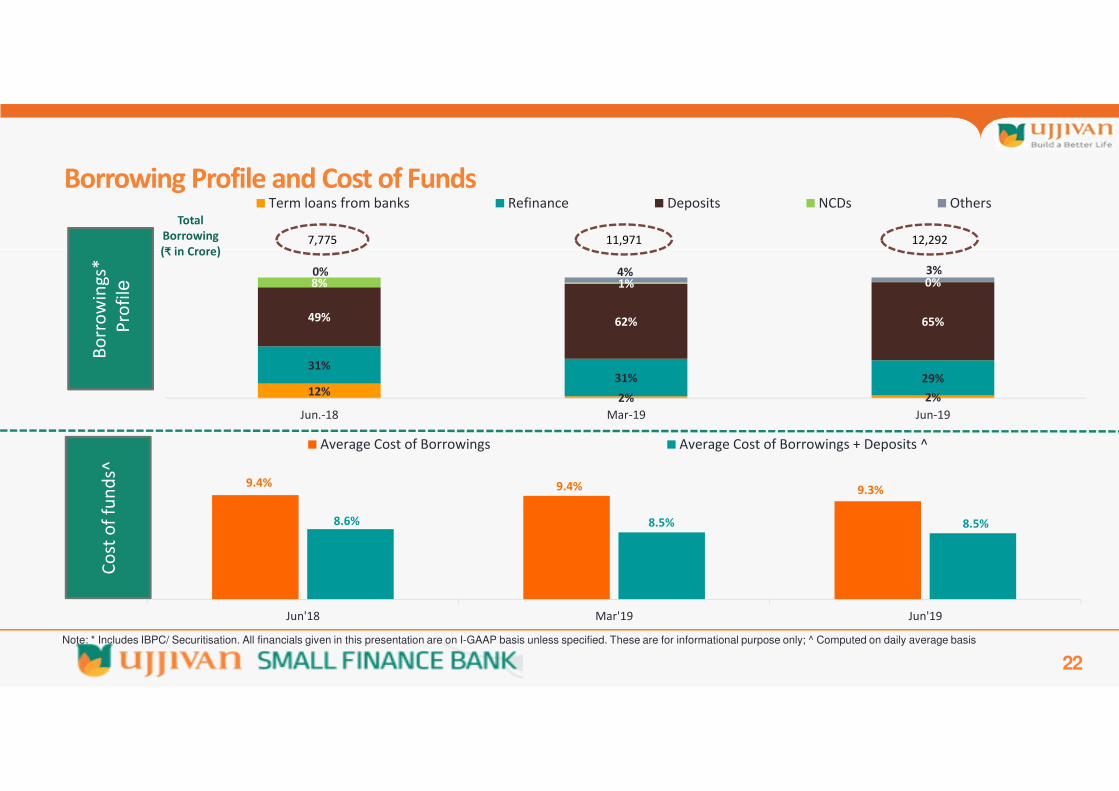
11,9717,775 12,292
Total
Borrowing
(₹ in Crore)
Borrowing Profile and Cost of Funds
9.4% 9.4% 9.3%
8.6% 8.5% 8.5%
Jun'18 Mar'19 Jun'19
Average Cost of Borrowings Average Cost of Borrowings + Deposits ^
12%2% 2%
31%31% 29%
49% 62% 65%
8% 1% 0%0% 4% 3%
Jun.-18 Mar-19 Jun-19
Term loans from banks Refinance Deposits NCDs Others
Note: * Includes IBPC/ Securitisation. All financials given in this presentation are on I-GAAP basis unless specified. These are for informational purpose only; ^ Computed on daily average basis
23
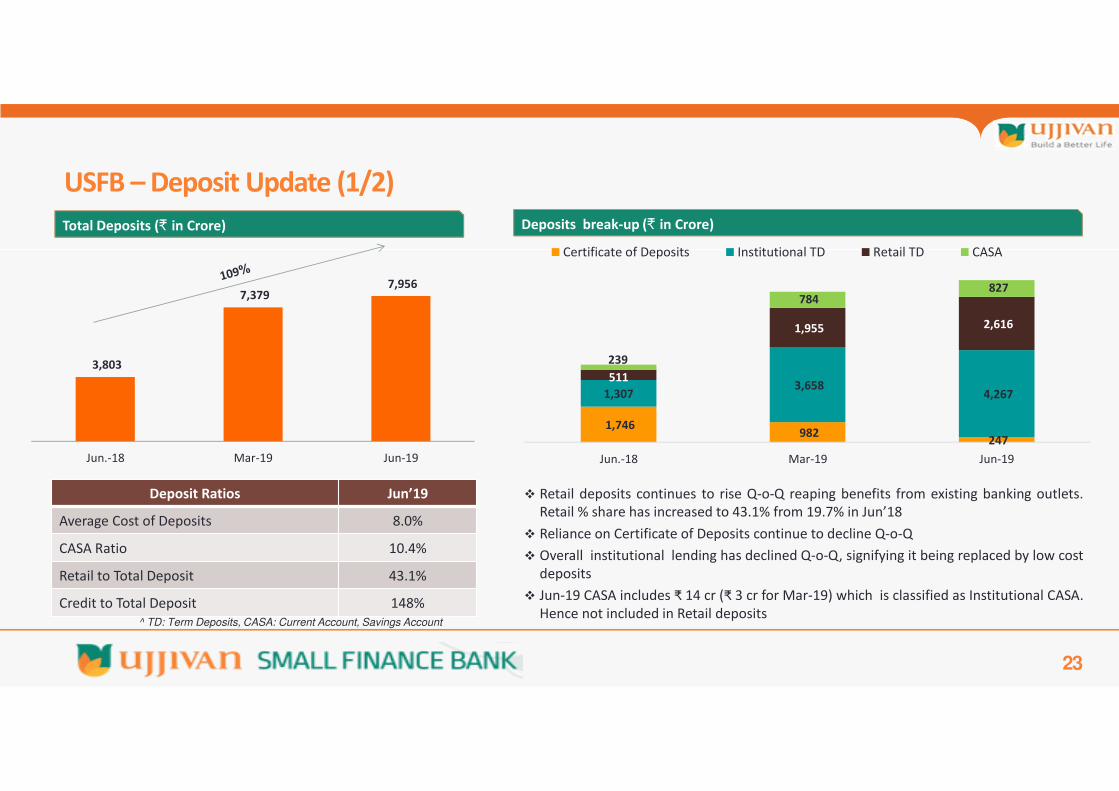
Deposit Ratios Jun’19
Average Cost of Deposits 8.0%
CASA Ratio 10.4%
Retail to Total Deposit 43.1%
Credit to Total Deposit 148%
Retail deposits continues to rise Q-o-Q reaping benefits from existing banking outlets.
Retail % share has increased to 43.1% from 19.7% in Jun’18
Reliance on Certificate of Deposits continue to decline Q-o-Q
Overall institutional lending has declined Q-o-Q, signifying it being replaced by low cost
deposits
Jun-19 CASA includes ₹ 14 cr (₹ 3 cr for Mar-19) which is classified as Institutional CASA.
Hence not included in Retail deposits^ TD: Term Deposits, CASA: Current Account, Savings Account
Total Deposits (₹ in Crore) Deposits break-up (₹ in Crore)
USFB – Deposit Update (1/2)
1,746 982
247
1,3073,658
4,267
511
1,955 2,616
239
784 827
Jun.-18 Mar-19 Jun-19
Certificate of Deposits Institutional TD Retail TD CASA
3,803
7,379 7,956
Jun.-18 Mar-19 Jun-19
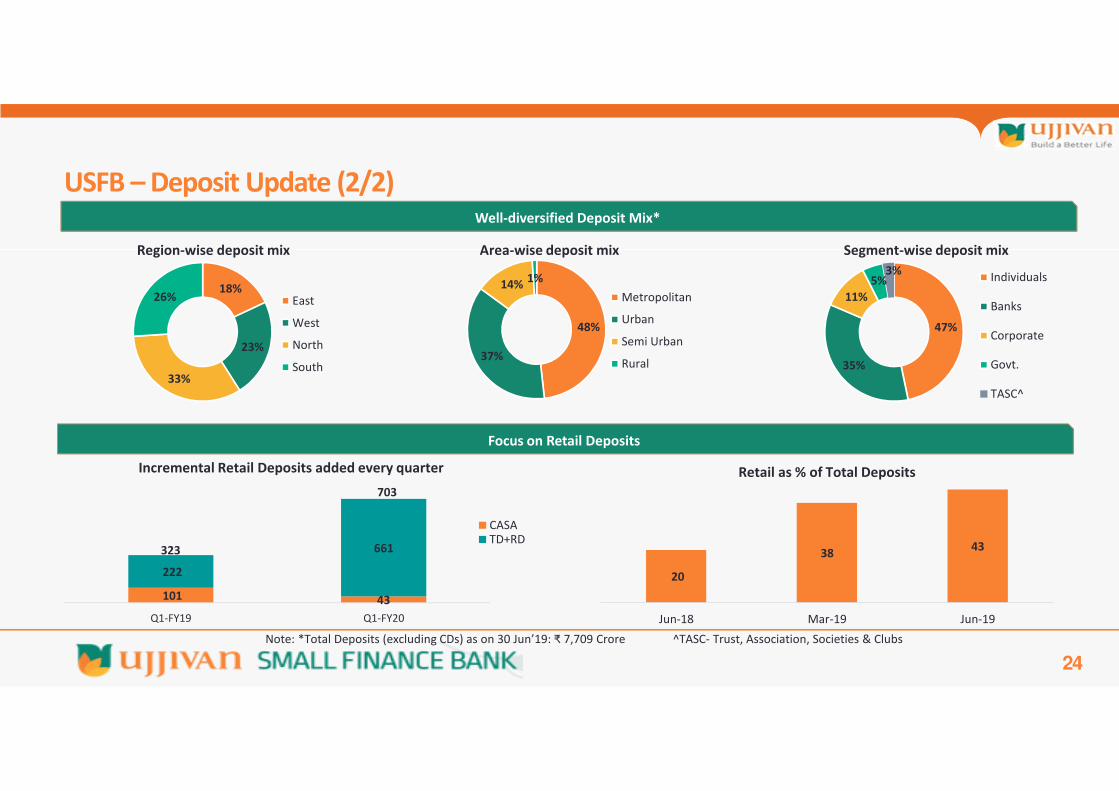
20
3843
Jun-18 Mar-19 Jun-19
24
48%
37%
14%1%
Metropolitan
Urban
Semi Urban
Rural
47%
35%
11%
5%3%
Individuals
Banks
Corporate
Govt.
TASC^
Region-wise deposit mix
Well-diversified Deposit Mix*
USFB – Deposit Update (2/2)
Note: *Total Deposits (excluding CDs) as on 30 Jun’19: ₹ 7,709 Crore ^TASC- Trust, Association, Societies & Clubs
Segment-wise deposit mixArea-wise deposit mix
Focus on Retail Deposits
101 43
222
661
Q1-FY19 Q1-FY20
CASATD+RD
Retail as % of Total Deposits
323
Incremental Retail Deposits added every quarter
18%
23%
33%
26% East
West
North
South
703
25
^ CAR: Capital Adequacy Ratio, LCR: Liquidity Coverage Ratio, CD: Certificate of Deposits
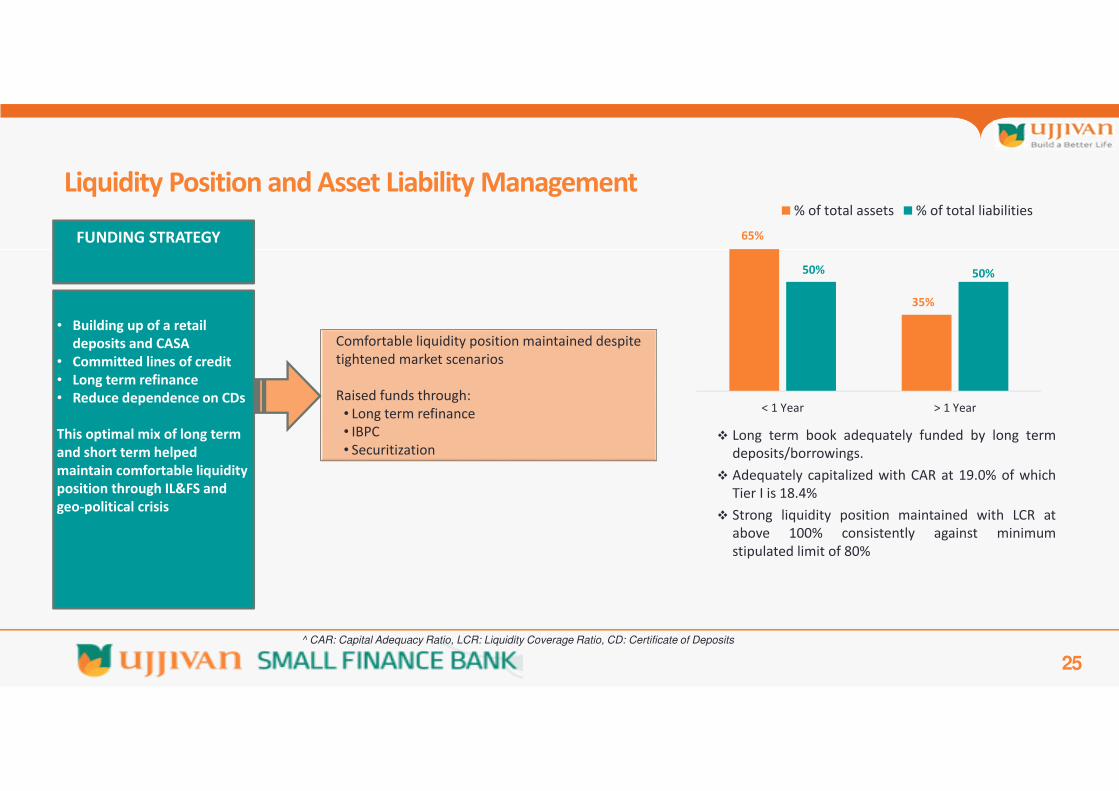
FUNDING STRATEGY
• Building up of a retail
deposits and CASA
• Committed lines of credit
• Long term refinance
• Reduce dependence on CDs
This optimal mix of long term
and short term helped
maintain comfortable liquidity
position through IL&FS and
geo-political crisis
Comfortable liquidity position maintained despite
tightened market scenarios
Raised funds through:
• Long term refinance
• IBPC
• Securitization
Liquidity Position and Asset Liability Management
65%
35%
50% 50%
< 1 Year > 1 Year
% of total assets % of total liabilities
Long term book adequately funded by long term
deposits/borrowings.
Adequately capitalized with CAR at 19.0% of which
Tier I is 18.4%
Strong liquidity position maintained with LCR at
above 100% consistently against minimum
stipulated limit of 80%
26
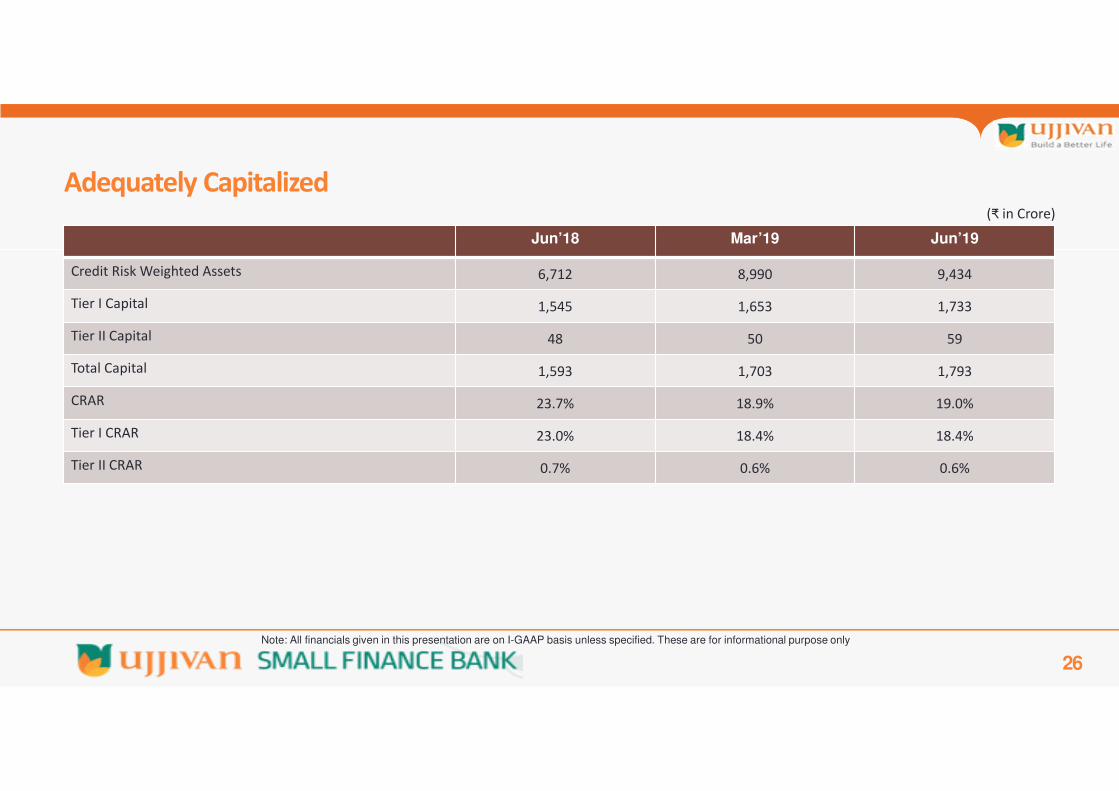
Jun’18 Mar’19 Jun’19
Credit Risk Weighted Assets 6,712 8,990 9,434
Tier I Capital 1,545 1,653 1,733
Tier II Capital 48 50 59
Total Capital 1,593 1,703 1,793
CRAR 23.7% 18.9% 19.0%
Tier I CRAR 23.0% 18.4% 18.4%
Tier II CRAR 0.7% 0.6% 0.6%
Adequately Capitalized(₹ in Crore)
Note: All financials given in this presentation are on I-GAAP basis unless specified. These are for informational purpose only
27
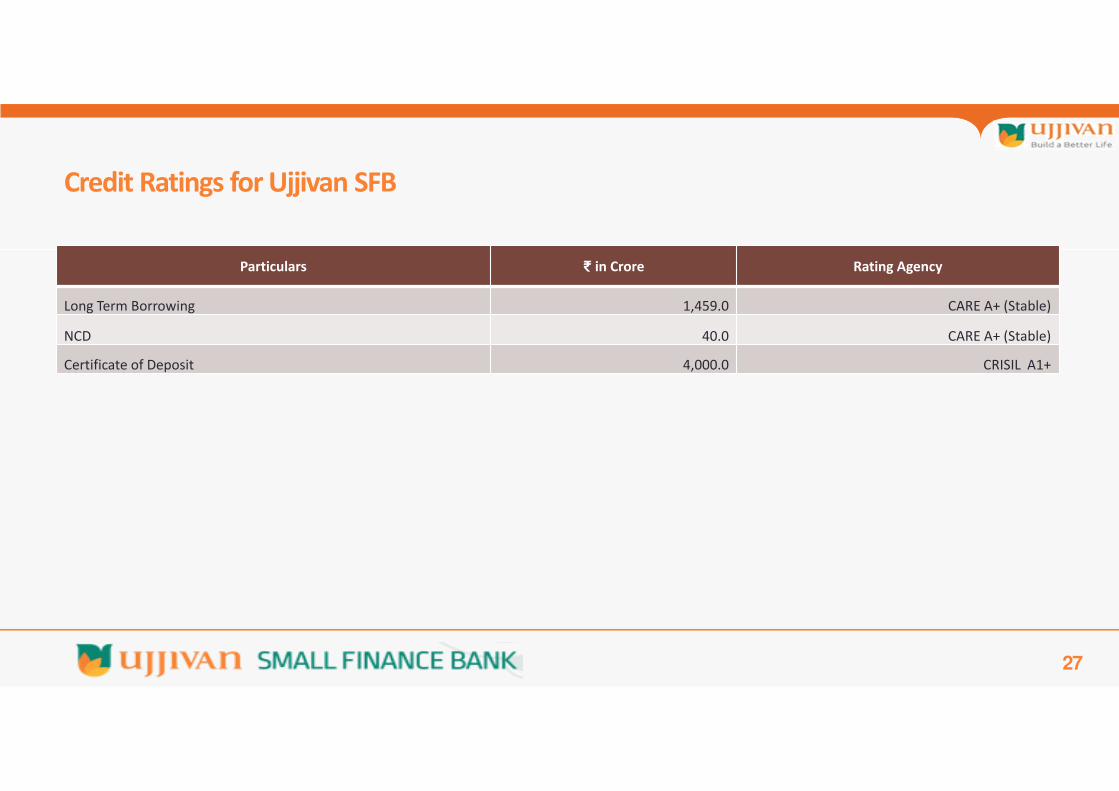
Particulars ₹ in Crore Rating Agency
Long Term Borrowing 1,459.0 CARE A+ (Stable)
NCD 40.0 CARE A+ (Stable)
Certificate of Deposit 4,000.0 CRISIL A1+
Credit Ratings for Ujjivan SFB
28
Financial Overview
Ujjivan Small Finance Bank
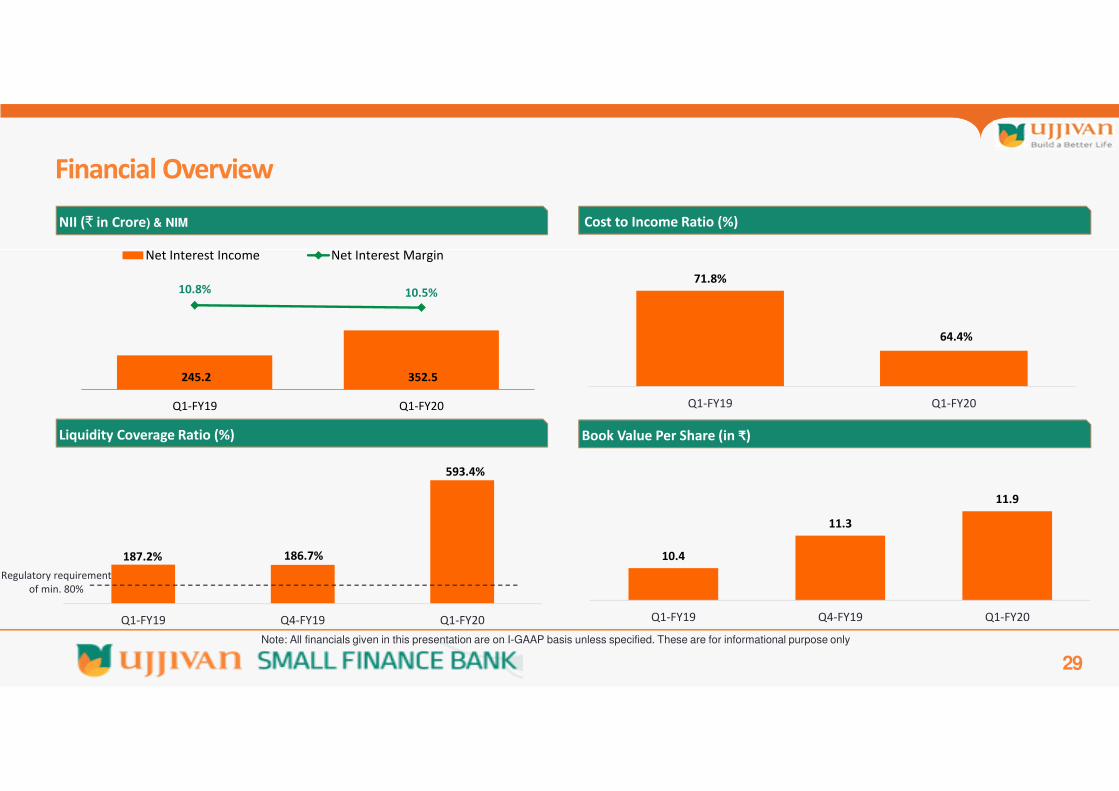
245.2 352.5
10.8% 10.5%
Q1-FY19 Q1-FY20
Net Interest Income Net Interest Margin
29
Financial Overview
Liquidity Coverage Ratio (%)
Cost to Income Ratio (%)
71.8%
64.4%
Q1-FY19 Q1-FY20
NII (₹ in Crore) & NIM
Book Value Per Share (in ₹)
10.4
11.3
11.9
Q1-FY19 Q4-FY19 Q1-FY20
Note: All financials given in this presentation are on I-GAAP basis unless specified. These are for informational purpose only
187.2% 186.7%
593.4%
Q1-FY19 Q4-FY19 Q1-FY20
Regulatory requirement
of min. 80%
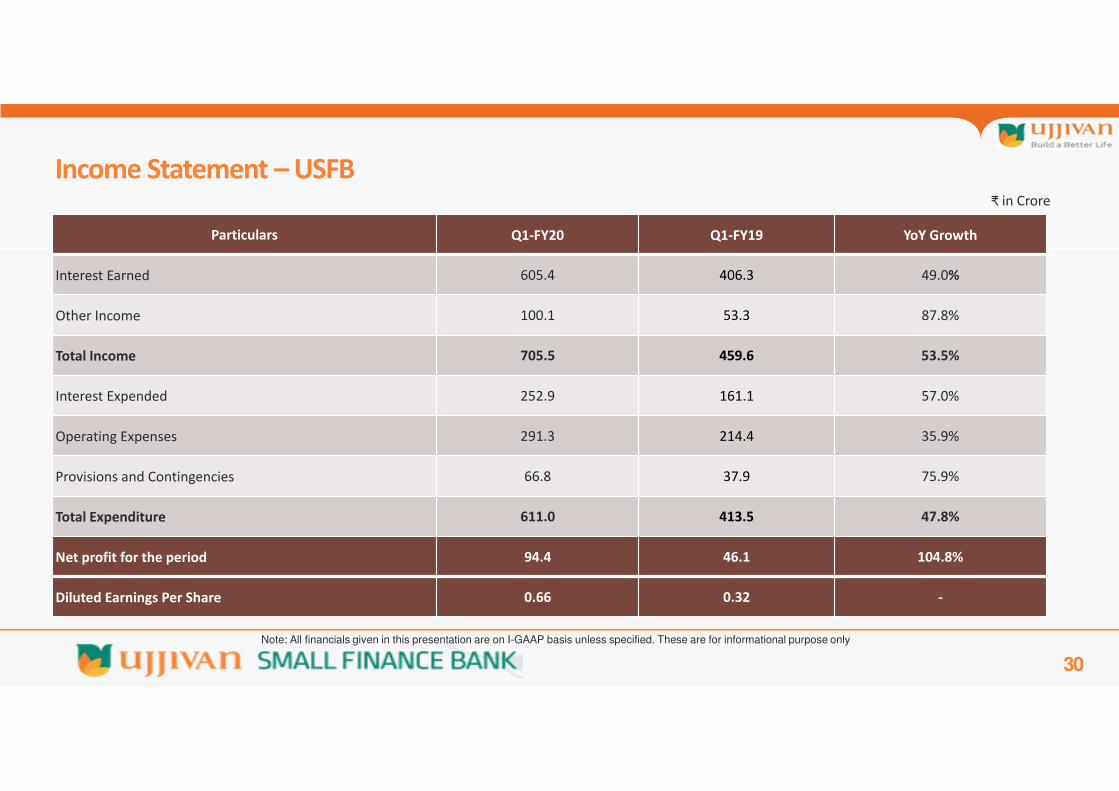
30
Income Statement – USFB₹ in Crore
Note: All financials given in this presentation are on I-GAAP basis unless specified. These are for informational purpose only
Particulars Q1-FY20 Q1-FY19 YoY Growth
Interest Earned 605.4 406.3 49.0%
Other Income 100.1 53.3 87.8%
Total Income 705.5 459.6 53.5%
Interest Expended 252.9 161.1 57.0%
Operating Expenses 291.3 214.4 35.9%
Provisions and Contingencies 66.8 37.9 75.9%
Total Expenditure 611.0 413.5 47.8%
Net profit for the period 94.4 46.1 104.8%
Diluted Earnings Per Share 0.66 0.32 -
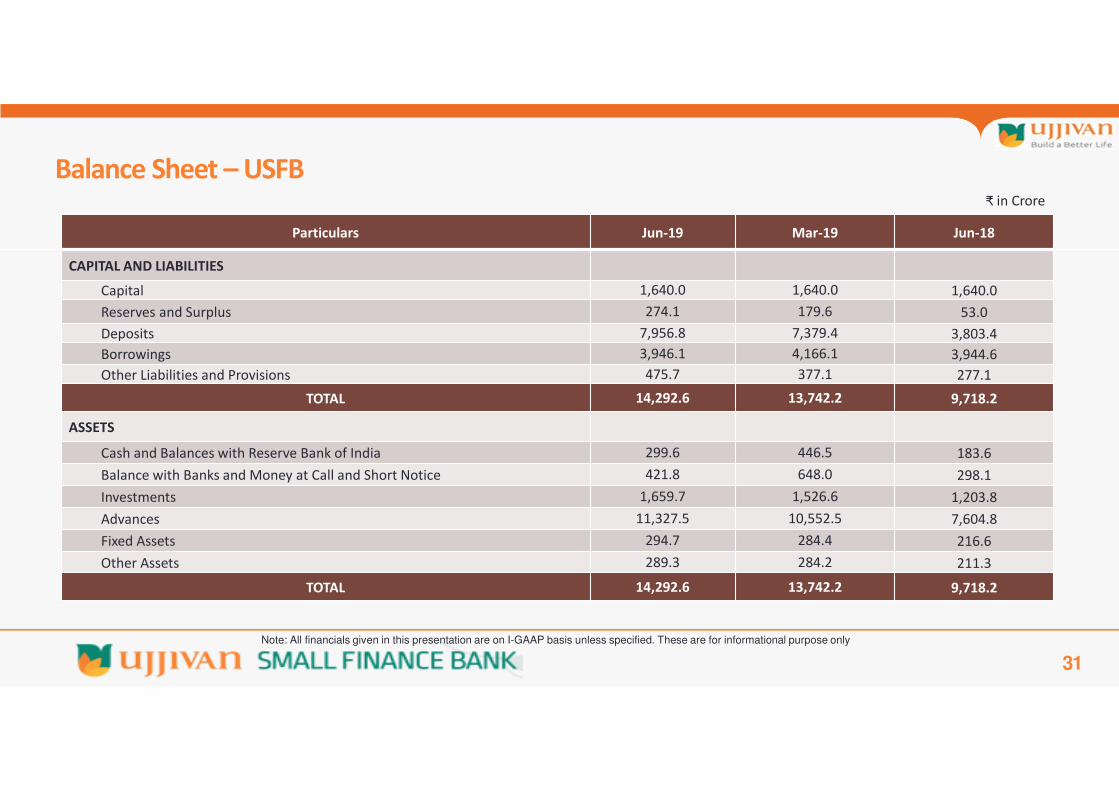
31
Balance Sheet – USFB
Particulars Jun-19 Mar-19 Jun-18
CAPITAL AND LIABILITIES
Capital 1,640.0 1,640.0 1,640.0
Reserves and Surplus 274.1 179.6 53.0
Deposits 7,956.8 7,379.4 3,803.4
Borrowings 3,946.1 4,166.1 3,944.6
Other Liabilities and Provisions 475.7 377.1 277.1
TOTAL 14,292.6 13,742.2 9,718.2
ASSETS
Cash and Balances with Reserve Bank of India 299.6 446.5 183.6
Balance with Banks and Money at Call and Short Notice 421.8 648.0 298.1
Investments 1,659.7 1,526.6 1,203.8
Advances 11,327.5 10,552.5 7,604.8
Fixed Assets 294.7 284.4 216.6
Other Assets 289.3 284.2 211.3
TOTAL 14,292.6 13,742.2 9,718.2
₹ in Crore
Note: All financials given in this presentation are on I-GAAP basis unless specified. These are for informational purpose only
32
Financial Overview
Consolidated Ujjivan Financial Services
33
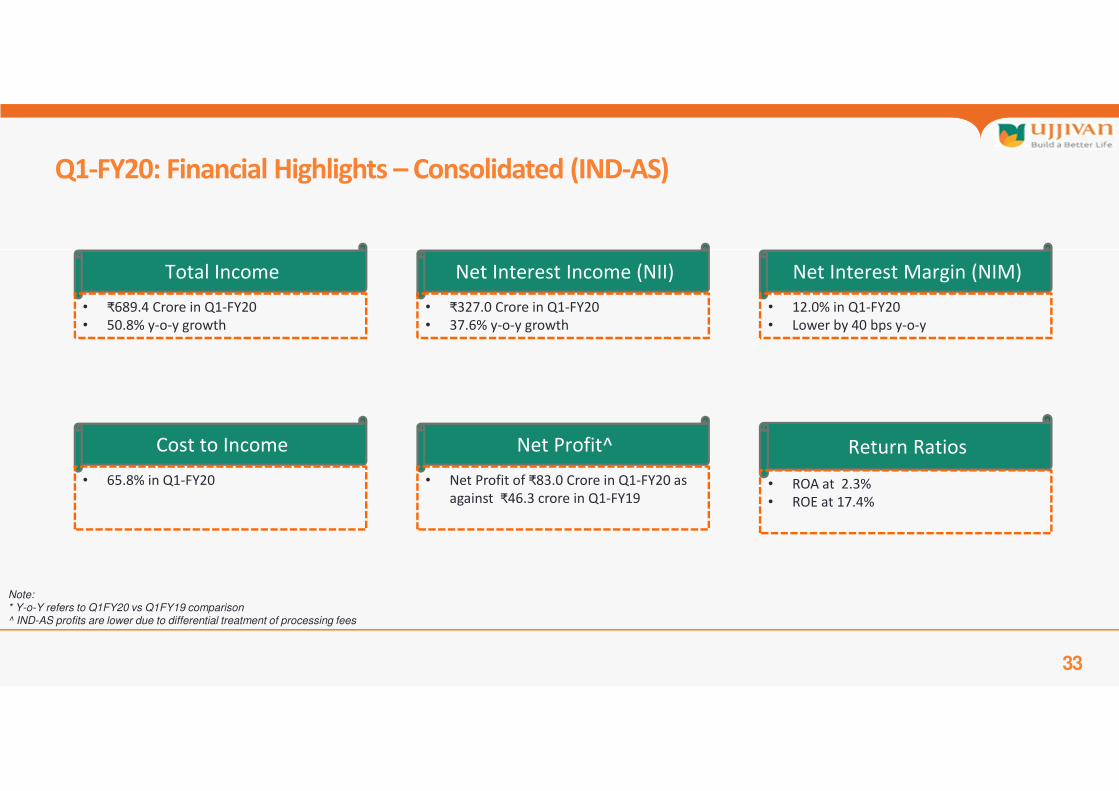
Q1-FY20: Financial Highlights – Consolidated (IND-AS)
Total Income
• ₹689.4 Crore in Q1-FY20
• 50.8% y-o-y growth
Net Interest Income (NII)
• ₹327.0 Crore in Q1-FY20
• 37.6% y-o-y growth
Net Interest Margin (NIM)
• 12.0% in Q1-FY20
• Lower by 40 bps y-o-y
Cost to Income
• 65.8% in Q1-FY20
Net Profit^
• Net Profit of ₹83.0 Crore in Q1-FY20 as
against ₹46.3 crore in Q1-FY19
Return Ratios
• ROA at 2.3%
• ROE at 17.4%
Note:* Y-o-Y refers to Q1FY20 vs Q1FY19 comparison ^ IND-AS profits are lower due to differential treatment of processing fees
34
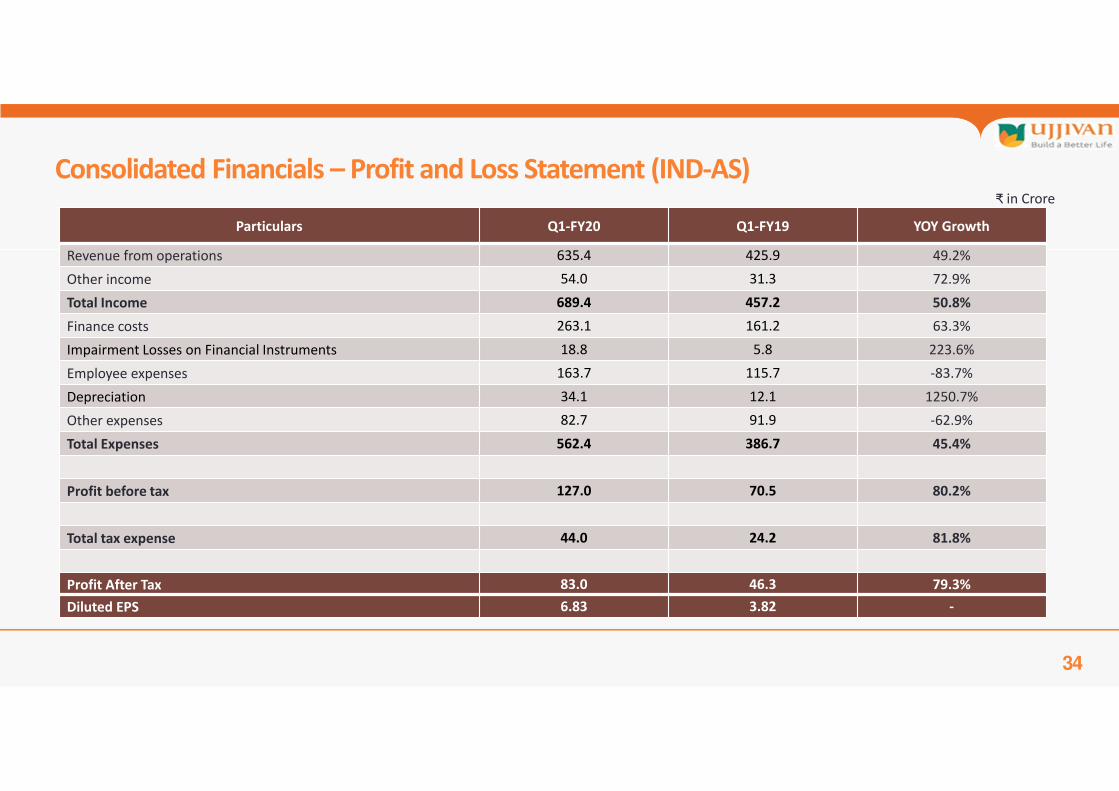
Consolidated Financials – Profit and Loss Statement (IND-AS)
Particulars Q1-FY20 Q1-FY19 YOY Growth
Revenue from operations 635.4 425.9 49.2%
Other income 54.0 31.3 72.9%
Total Income 689.4 457.2 50.8%
Finance costs 263.1 161.2 63.3%
Impairment Losses on Financial Instruments 18.8 5.8 223.6%
Employee expenses 163.7 115.7 -83.7%
Depreciation 34.1 12.1 1250.7%
Other expenses 82.7 91.9 -62.9%
Total Expenses 562.4 386.7 45.4%
Profit before tax 127.0 70.5 80.2%
Total tax expense 44.0 24.2 81.8%
Profit After Tax 83.0 46.3 79.3%
Diluted EPS 6.83 3.82 -
₹ in Crore
35
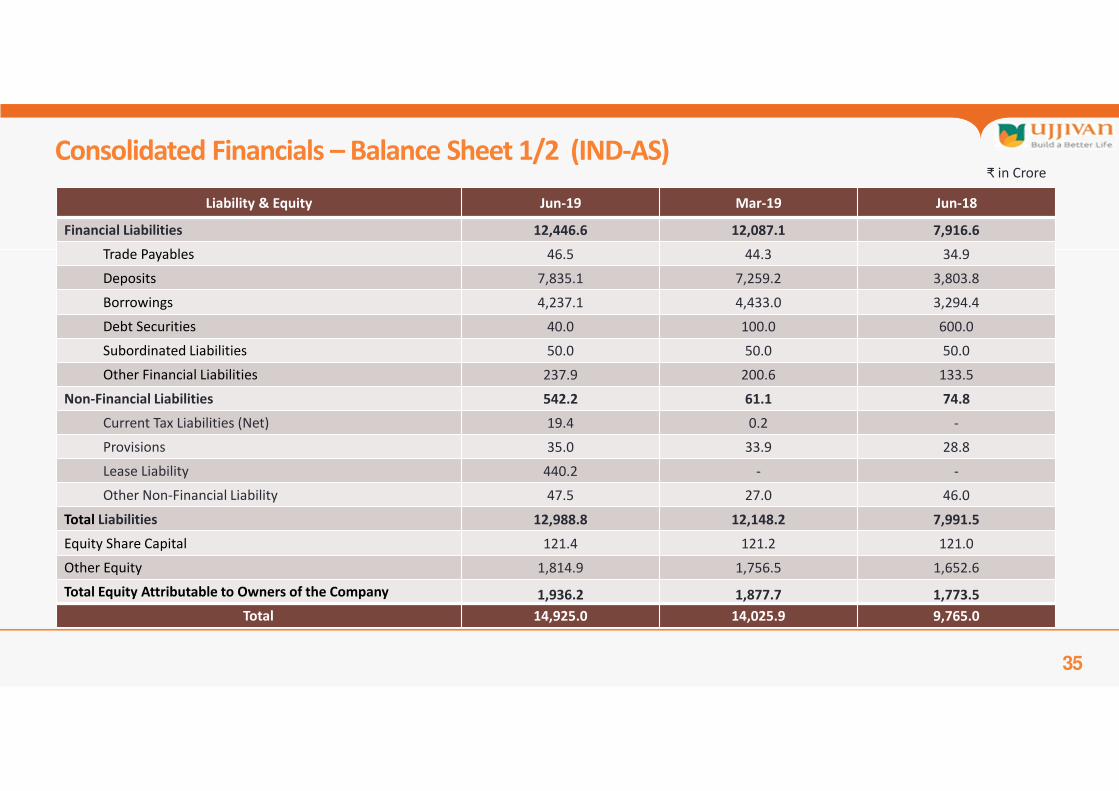
Consolidated Financials – Balance Sheet 1/2 (IND-AS)
Liability & Equity Jun-19 Mar-19 Jun-18
Financial Liabilities 12,446.6 12,087.1 7,916.6
Trade Payables 46.5 44.3 34.9
Deposits 7,835.1 7,259.2 3,803.8
Borrowings 4,237.1 4,433.0 3,294.4
Debt Securities 40.0 100.0 600.0
Subordinated Liabilities 50.0 50.0 50.0
Other Financial Liabilities 237.9 200.6 133.5
Non-Financial Liabilities 542.2 61.1 74.8
Current Tax Liabilities (Net) 19.4 0.2 -
Provisions 35.0 33.9 28.8
Lease Liability 440.2 - -
Other Non-Financial Liability 47.5 27.0 46.0
Total Liabilities 12,988.8 12,148.2 7,991.5
Equity Share Capital 121.4 121.2 121.0
Other Equity 1,814.9 1,756.5 1,652.6
Total Equity Attributable to Owners of the Company 1,936.2 1,877.7 1,773.5
Total 14,925.0 14,025.9 9,765.0
₹ in Crore
36
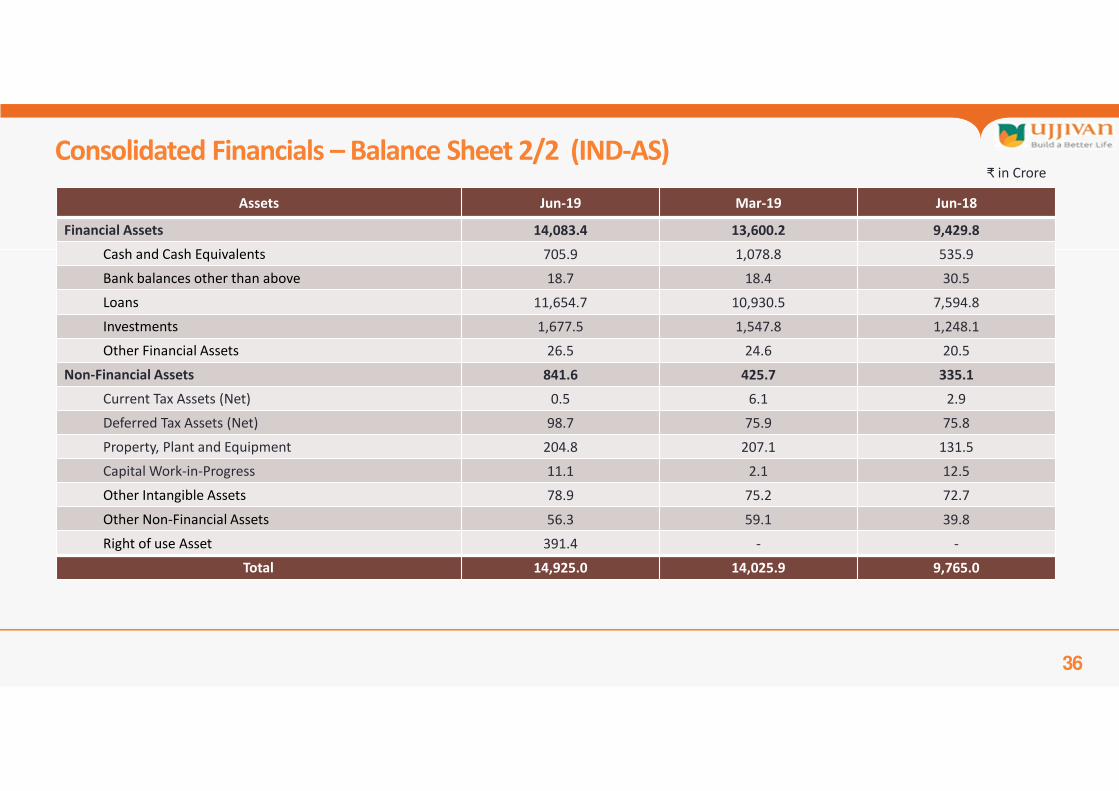
Consolidated Financials – Balance Sheet 2/2 (IND-AS)
Assets Jun-19 Mar-19 Jun-18
Financial Assets 14,083.4 13,600.2 9,429.8
Cash and Cash Equivalents 705.9 1,078.8 535.9
Bank balances other than above 18.7 18.4 30.5
Loans 11,654.7 10,930.5 7,594.8
Investments 1,677.5 1,547.8 1,248.1
Other Financial Assets 26.5 24.6 20.5
Non-Financial Assets 841.6 425.7 335.1
Current Tax Assets (Net) 0.5 6.1 2.9
Deferred Tax Assets (Net) 98.7 75.9 75.8
Property, Plant and Equipment 204.8 207.1 131.5
Capital Work-in-Progress 11.1 2.1 12.5
Other Intangible Assets 78.9 75.2 72.7
Other Non-Financial Assets 56.3 59.1 39.8
Right of use Asset 391.4 - -
Total 14,925.0 14,025.9 9,765.0
₹ in Crore
37
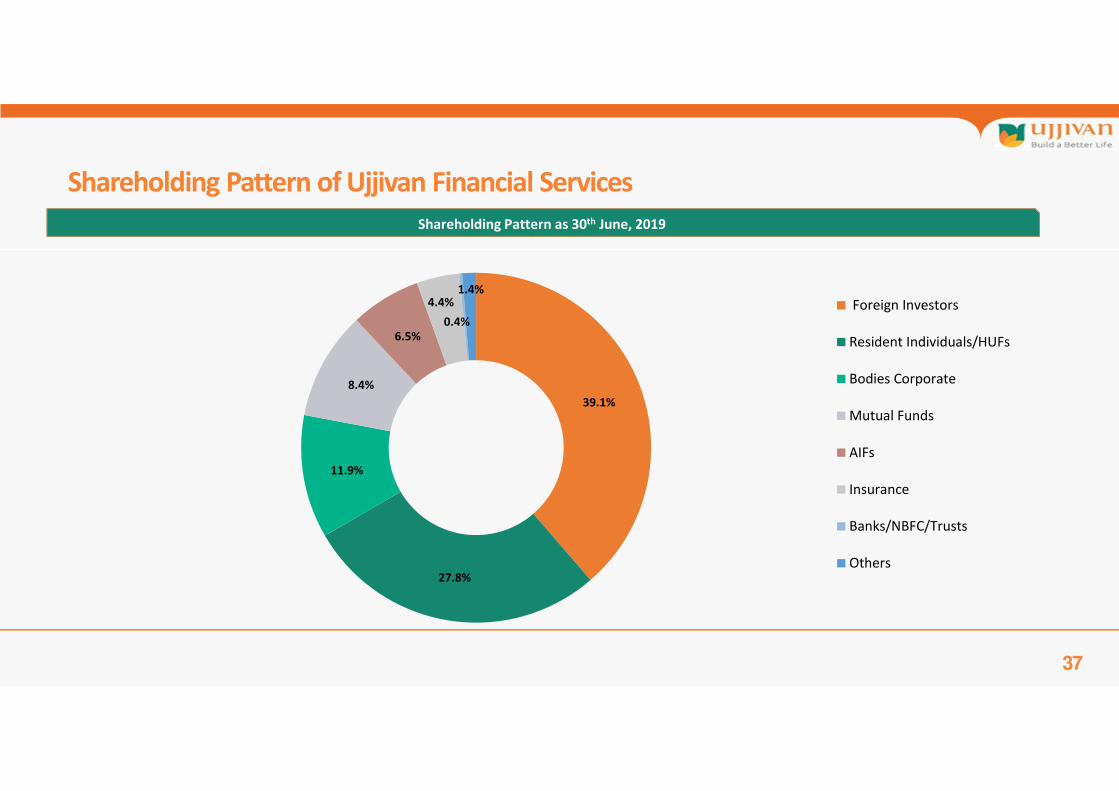
Shareholding Pattern as 30th June, 2019
Shareholding Pattern of Ujjivan Financial Services
39.1%
27.8%
11.9%
8.4%
6.5%
4.4%
0.4%
1.4%
Foreign Investors
Resident Individuals/HUFs
Bodies Corporate
Mutual Funds
AIFs
Insurance
Banks/NBFC/Trusts
Others

38
Thank You!