Embed Size (px)
Citation preview
Q1FY2018 performance review
July 25, 2017
Opportunity
Industry overview
Agenda
Company strategy and performance
2
Opportunity
Industry overview
Agenda
Company strategy and performance
3
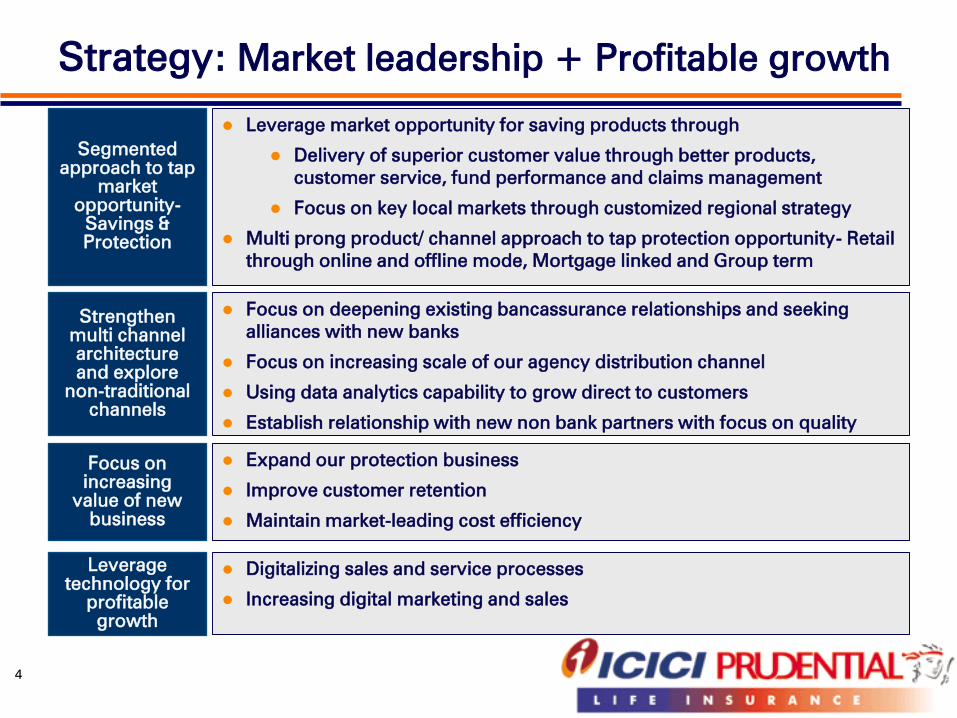
Strategy: Market leadership + Profitable growth
Leverage market opportunity for saving products through
Delivery of superior customer value through better products,
customer service, fund performance and claims management
Focus on key local markets through customized regional strategy
Multi prong product/ channel approach to tap protection opportunity- Retail
through online and offline mode, Mortgage linked and Group term
Segmented
approach to tap
market
opportunity-
Savings &
Protection
Expand our protection business
Improve customer retention
Maintain market-leading cost efficiency
Focus on
increasing
value of new
business
Focus on deepening existing bancassurance relationships and seeking
alliances with new banks
Focus on increasing scale of our agency distribution channel
Using data analytics capability to grow direct to customers
Establish relationship with new non bank partners with focus on quality
Strengthen
multi channel
architecture
and explore
non-traditional
channels
Leverage
technology for
profitable
growth
Digitalizing sales and service processes
Increasing digital marketing and sales
4
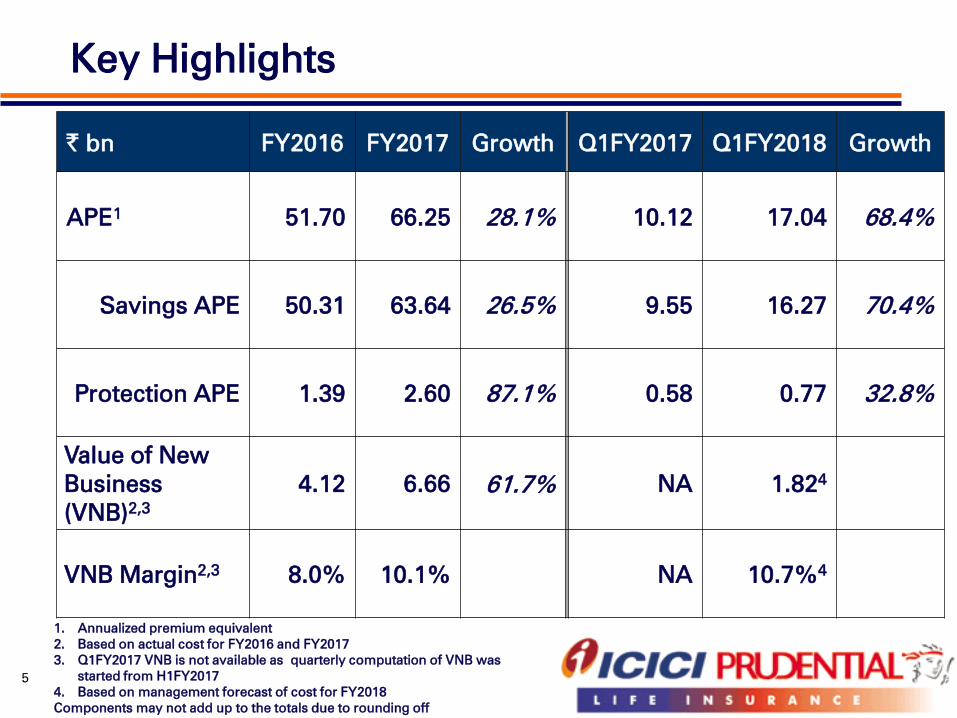
Key Highlights
5
` bn FY2016 FY2017 Growth Q1FY2017 Q1FY2018 Growth
APE1
51.70 66.25 28.1% 10.12 17.04 68.4%
Savings APE 50.31 63.64 26.5% 9.55 16.27 70.4%
Protection APE 1.39 2.60 87.1% 0.58 0.77 32.8%
Value of New
Business
(VNB)2,3
4.12 6.66 61.7% NA 1.824
VNB Margin2,3
8.0% 10.1% NA 10.7%4
1. Annualized premium equivalent
2. Based on actual cost for FY2016 and FY2017
3. Q1FY2017 VNB is not available as quarterly computation of VNB was
started from H1FY2017
4. Based on management forecast of cost for FY2018
Components may not add up to the totals due to rounding off
New business
6
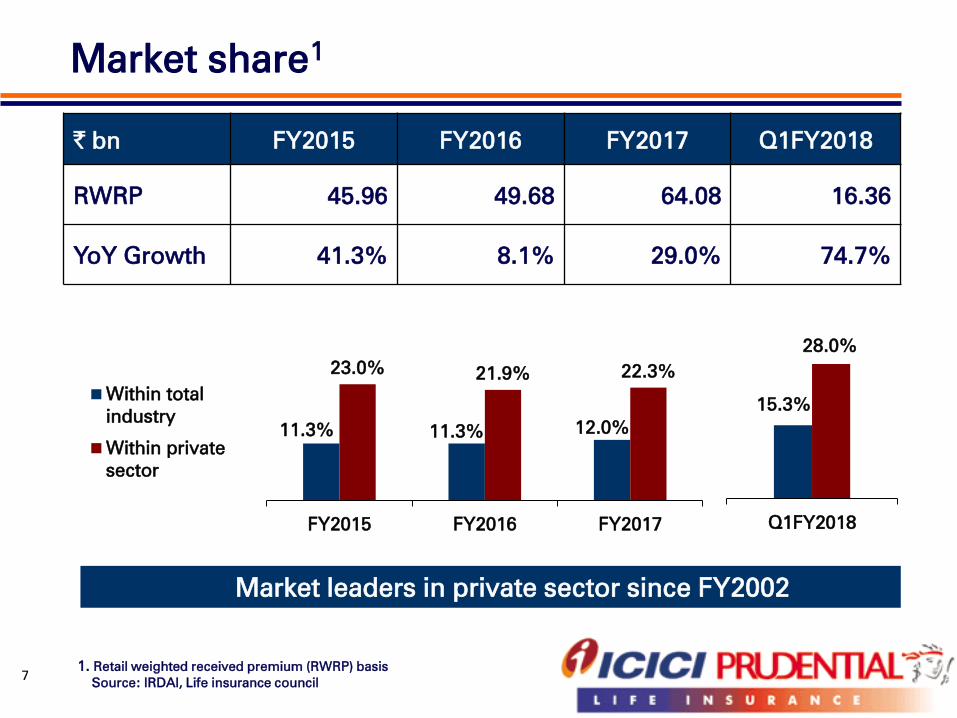
Market share1
7
1. Retail weighted received premium (RWRP) basis
Source: IRDAI, Life insurance council
Market leaders in private sector since FY2002
` bn FY2015 FY2016 FY2017 Q1FY2018
RWRP 45.96 49.68 64.08 16.36
YoY Growth 41.3% 8.1% 29.0% 74.7%
11.3% 11.3% 12.0%
23.0%21.9% 22.3%
FY2015 FY2016 FY2017
Within total
industry
Within private
sector
15.3%
28.0%
Q1FY2018
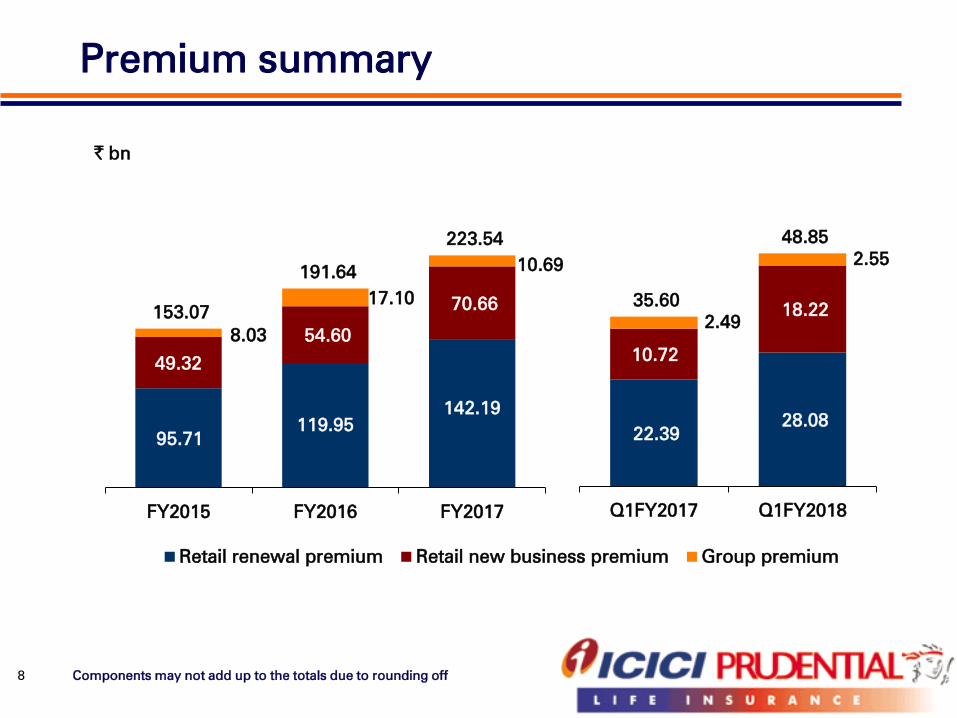
Premium summary
Components may not add up to the totals due to rounding off 8
95.71
119.95
142.19
49.32
54.60
70.66
8.03
17.10
10.69
153.07
191.64
223.54
FY2015 FY2016 FY2017
Retail renewal premium Retail new business premium Group premium
22.39
28.08
10.72
18.22
2.49
2.55
35.60
48.85
Q1FY2017 Q1FY2018
` bn
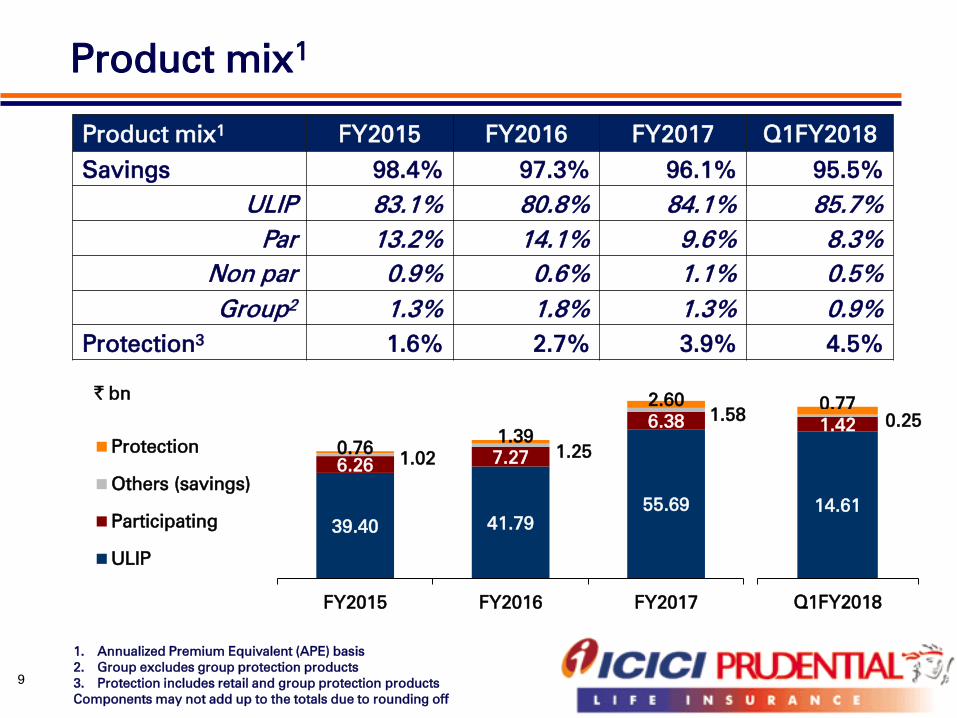
Product mix1
1. Annualized Premium Equivalent (APE) basis
2. Group excludes group protection products
3. Protection includes retail and group protection products
Components may not add up to the totals due to rounding off
9
Product mix1
FY2015 FY2016 FY2017 Q1FY2018
Savings 98.4% 97.3% 96.1% 95.5%
ULIP 83.1% 80.8% 84.1% 85.7%
Par 13.2% 14.1% 9.6% 8.3%
Non par 0.9% 0.6% 1.1% 0.5%
Group2 1.3% 1.8% 1.3% 0.9%
Protection3
1.6% 2.7% 3.9% 4.5%
39.40 41.79
55.69
6.267.27
6.38
1.021.25
1.58
0.761.39
2.60
FY2015 FY2016 FY2017
Protection
Others (savings)
Participating
ULIP
` bn
14.61
1.42 0.25
0.77
Q1FY2018
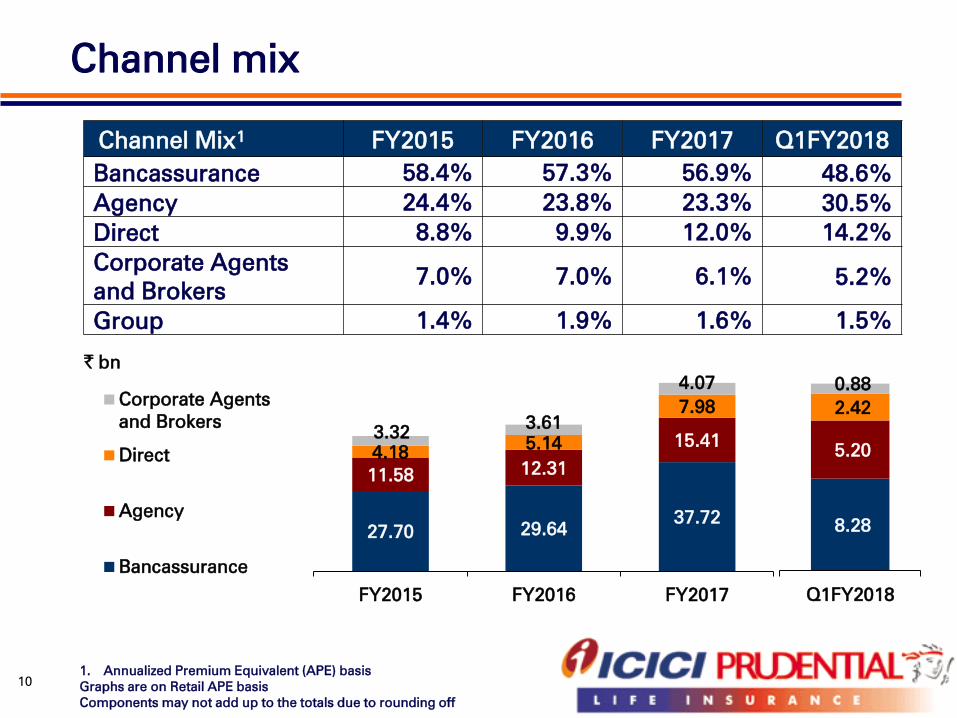
Channel mix
1. Annualized Premium Equivalent (APE) basis
Graphs are on Retail APE basis
Components may not add up to the totals due to rounding off
Channel Mix1
FY2015 FY2016 FY2017 Q1FY2018
Bancassurance 58.4% 57.3% 56.9% 48.6%
Agency 24.4% 23.8% 23.3% 30.5%
Direct 8.8% 9.9% 12.0% 14.2%
Corporate Agents
and Brokers7.0% 7.0% 6.1% 5.2%
Group 1.4% 1.9% 1.6% 1.5%
10
` bn
27.70 29.6437.72
11.5812.31
15.414.18
5.14
7.98
3.323.61
4.07
FY2015 FY2016 FY2017
Corporate Agents
and Brokers
Direct
Agency
Bancassurance
8.28
5.20
2.42
0.88
Q1FY2018

Quality parameters
11
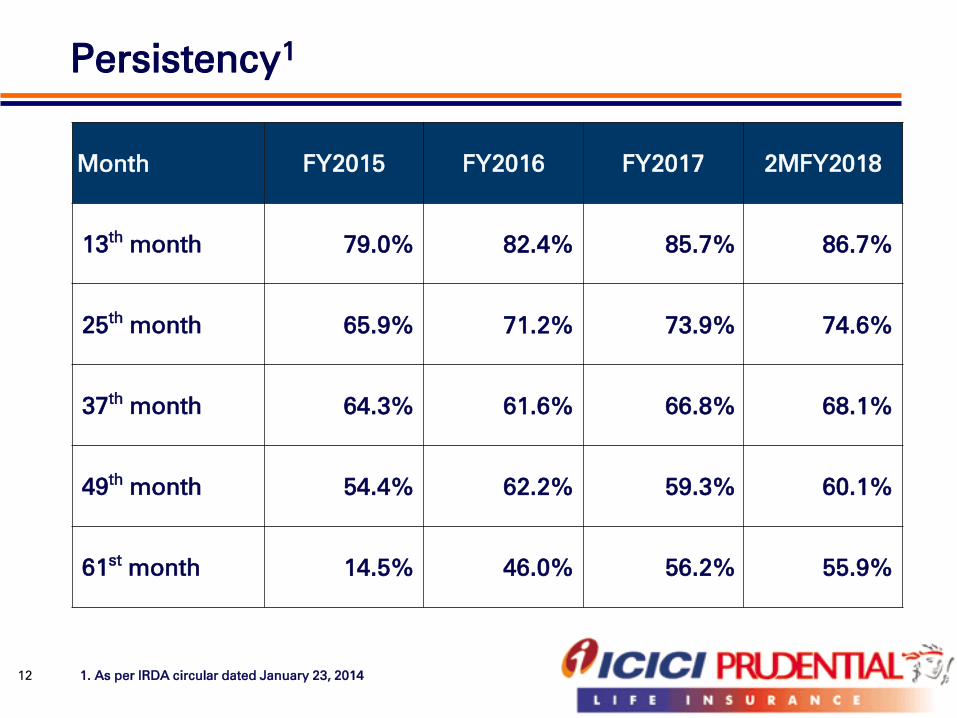
Persistency1
Month FY2015 FY2016 FY2017 2MFY2018
13th
month 79.0% 82.4% 85.7% 86.7%
25th
month 65.9% 71.2% 73.9% 74.6%
37th
month 64.3% 61.6% 66.8% 68.1%
49th
month 54.4% 62.2% 59.3% 60.1%
61st
month 14.5% 46.0% 56.2% 55.9%
1. As per IRDA circular dated January 23, 201412
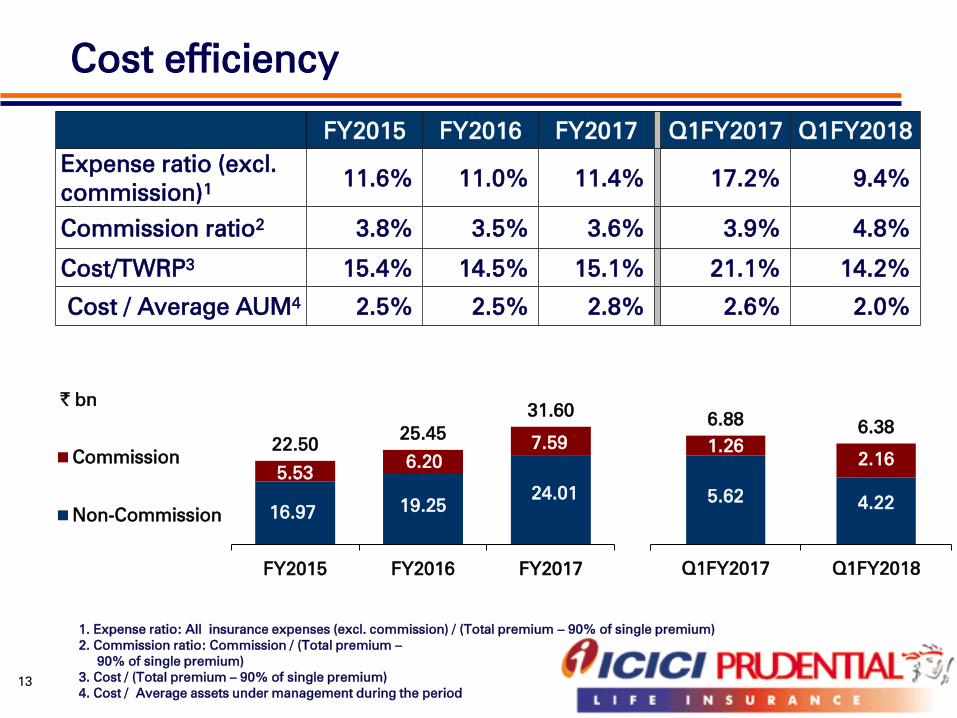
Cost efficiency
1. Expense ratio: All insurance expenses (excl. commission) / (Total premium – 90% of single premium)
2. Commission ratio: Commission / (Total premium –
90% of single premium)
3. Cost / (Total premium – 90% of single premium)
4. Cost / Average assets under management during the period
FY2015 FY2016 FY2017 Q1FY2017 Q1FY2018
Expense ratio (excl.
commission)1
11.6% 11.0% 11.4% 17.2% 9.4%
Commission ratio2
3.8% 3.5% 3.6% 3.9% 4.8%
Cost/TWRP3
15.4% 14.5% 15.1% 21.1% 14.2%
Cost / Average AUM4
2.5% 2.5% 2.8% 2.6% 2.0%
13
16.9719.25
24.01
5.536.20
7.5922.5025.45
31.60
FY2015 FY2016 FY2017
Commission
Non-Commission
` bn
5.624.22
1.26
2.16
6.886.38
Q1FY2017 Q1FY2018
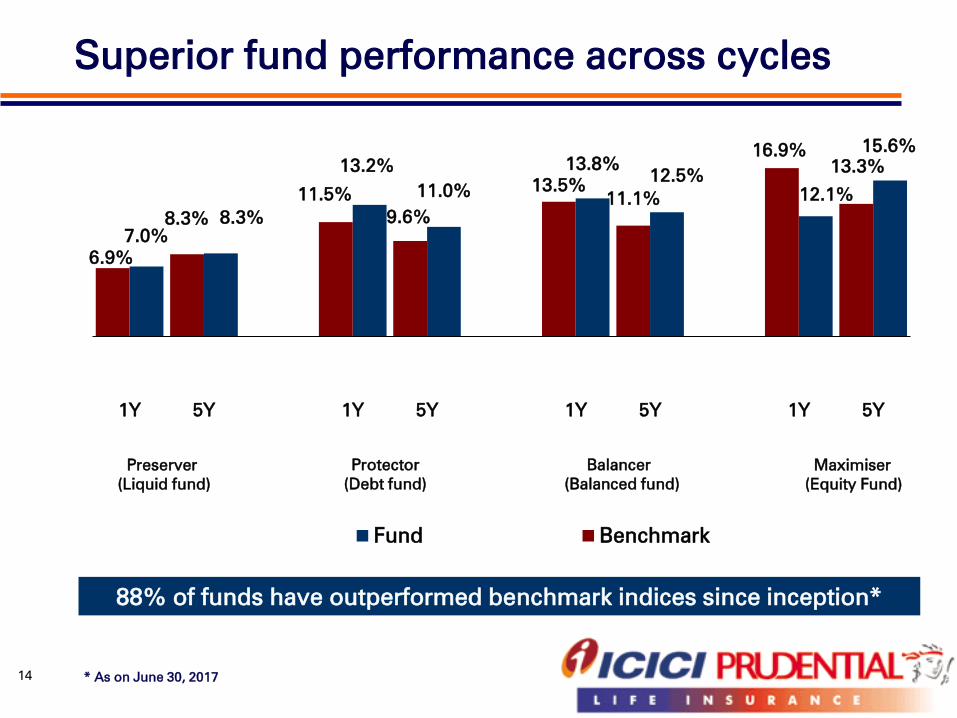
Maximiser
(Equity Fund)
Balancer
(Balanced fund)
Protector
(Debt fund)
Preserver
(Liquid fund)
Superior fund performance across cycles
* As on June 30, 201714
88% of funds have outperformed benchmark indices since inception*
15.6%
12.1%
12.5%13.8%
11.0%
13.2%
8.3%
7.0%
13.3%
16.9%
11.1%
13.5%
9.6%
11.5%
8.3%
6.9%
5Y1Y5Y1Y5Y1Y5Y1Y
Fund Benchmark
15
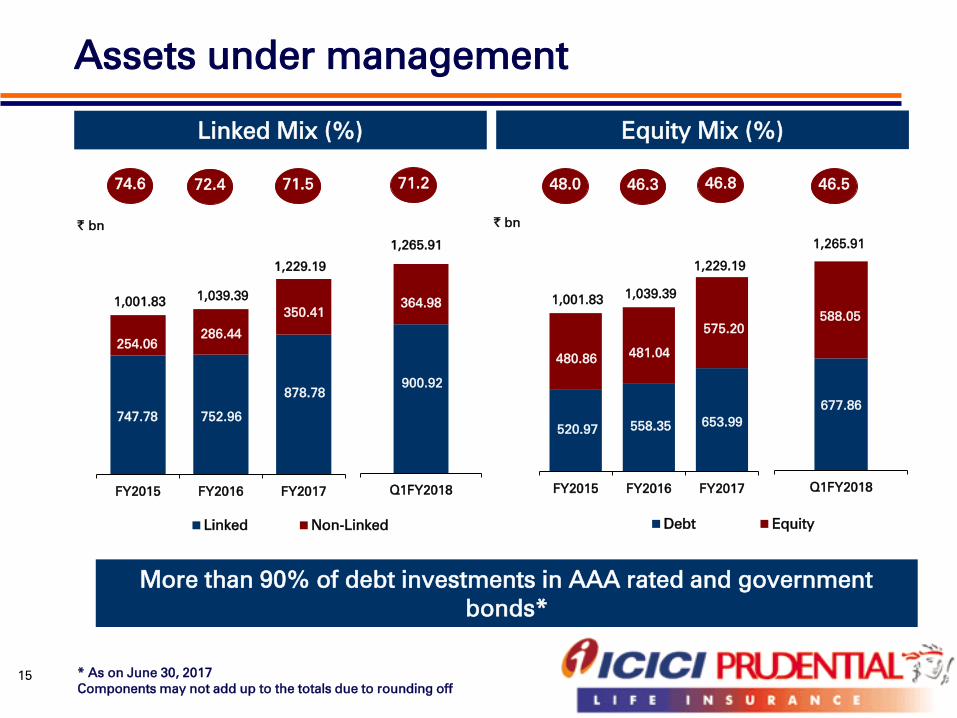
Assets under management
More than 90% of debt investments in AAA rated and government
bonds*
Linked Mix (%)
` bn
* As on June 30, 2017
Components may not add up to the totals due to rounding off
71.5
Equity Mix (%)
15
747.78 752.96
878.78
254.06
286.44
350.41
1,001.83 1,039.39
1,229.19
FY2015 FY2016 FY2017
Linked Non-Linked
520.97 558.35 653.99
480.86 481.04
575.20
1,001.83 1,039.39
1,229.19
FY2015 FY2016 FY2017
Debt Equity
` bn
71.272.4 48.0 46.546.846.374.6
677.86
588.05
1,265.91
Q1FY2018
900.92
364.98
1,265.91
Q1FY2018
Profitability
16
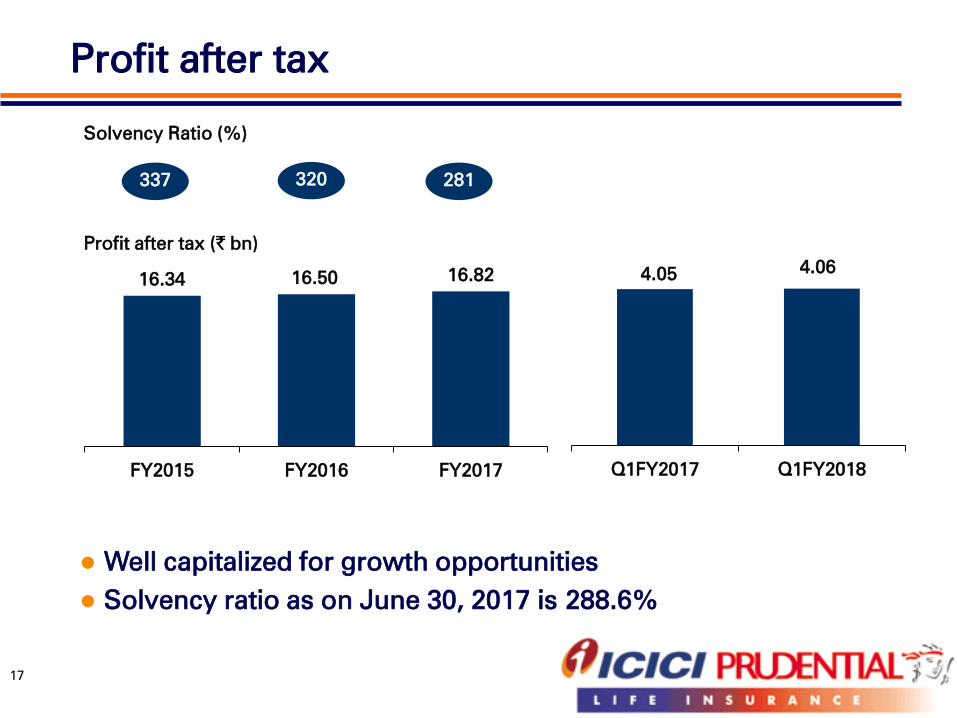
Profit after tax
17
Well capitalized for growth opportunities
Solvency ratio as on June 30, 2017 is 288.6%
Solvency Ratio (%)
Profit after tax (` bn)
337 320 281
16.34 16.50 16.82
FY2015 FY2016 FY2017
4.05 4.06
Q1FY2017 Q1FY2018
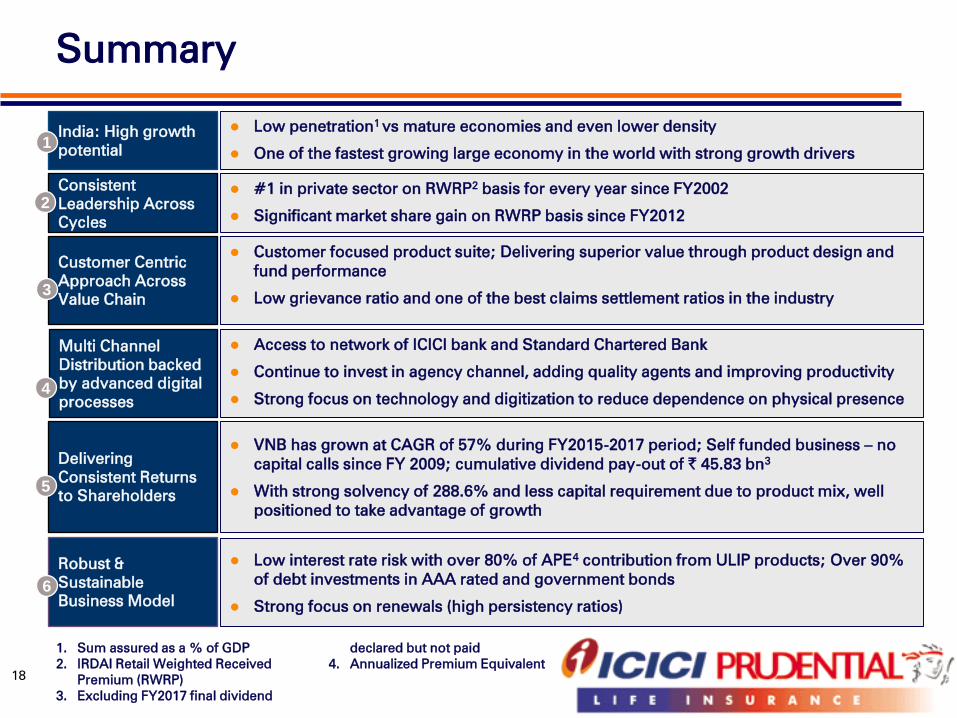
Summary
1. Sum assured as a % of GDP
2. IRDAI Retail Weighted Received
Premium (RWRP)
3. Excluding FY2017 final dividend
declared but not paid
4. Annualized Premium Equivalent
Low penetration1 vs mature economies and even lower density
One of the fastest growing large economy in the world with strong growth drivers
India: High growth
potential1
#1 in private sector on RWRP2
basis for every year since FY2002
Significant market share gain on RWRP basis since FY2012
Consistent
Leadership Across
Cycles
2
Customer focused product suite; Delivering superior value through product design and
fund performance
Low grievance ratio and one of the best claims settlement ratios in the industry
Customer Centric
Approach Across
Value Chain3
Access to network of ICICI bank and Standard Chartered Bank
Continue to invest in agency channel, adding quality agents and improving productivity
Strong focus on technology and digitization to reduce dependence on physical presence
Multi Channel
Distribution backed
by advanced digital
processes
4
Low interest rate risk with over 80% of APE4
contribution from ULIP products; Over 90%
of debt investments in AAA rated and government bonds
Strong focus on renewals (high persistency ratios)
Robust &
Sustainable
Business Model
VNB has grown at CAGR of 57% during FY2015-2017 period; Self funded business – no
capital calls since FY 2009; cumulative dividend pay-out of ` 45.83 bn3
With strong solvency of 288.6% and less capital requirement due to product mix, well
positioned to take advantage of growth
Delivering
Consistent Returns
to Shareholders5
6
18
Opportunity
Industry overview
Agenda
Company strategy and performance
19
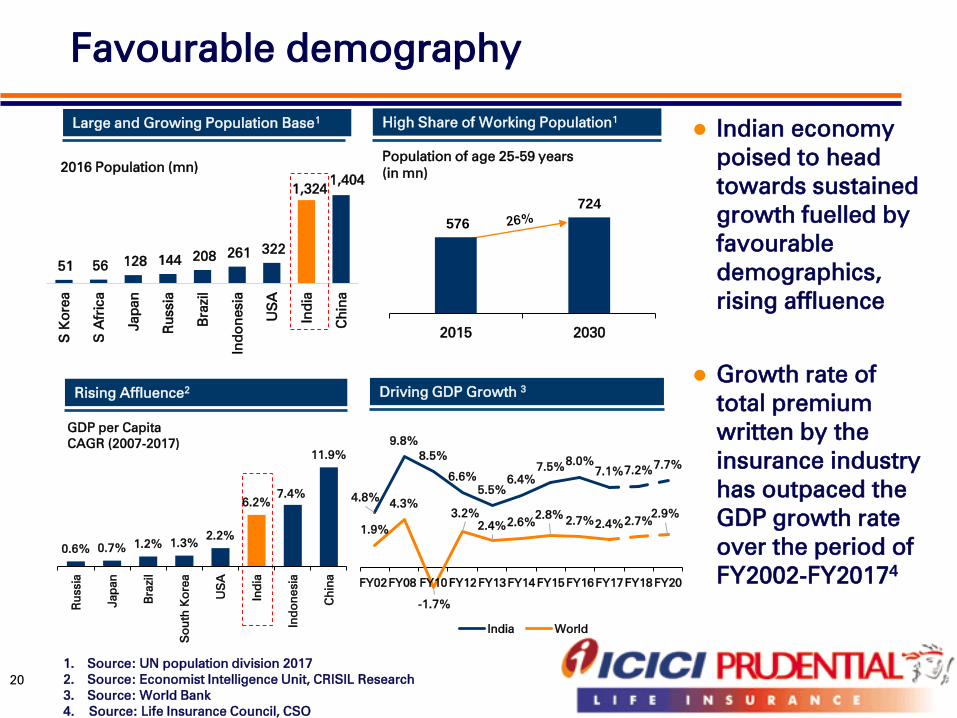
Large and Growing Population Base1
Driving GDP Growth 3
High Share of Working Population1
Rising Affluence2
Indian economy
poised to head
towards sustained
growth fuelled by
favourable
demographics,
rising affluence
Growth rate of
total premium
written by the
insurance industry
has outpaced the
GDP growth rate
over the period of
FY2002-FY20174
1. Source: UN population division 2017
2. Source: Economist Intelligence Unit, CRISIL Research
3. Source: World Bank
4. Source: Life Insurance Council, CSO
Favourable demography
GDP per Capita
CAGR (2007-2017)
0.6% 0.7%1.2% 1.3%
2.2%
6.2%
7.4%
11.9%
Ru
ssia
Jap
an
Brazil
So
uth
K
orea
US
A
In
dia
In
do
ne
sia
Ch
ina
576
724
2015 2030
Population of age 25-59 years
(in mn)
20
51 56 128 144
208 261 322
1,324 1,404
S K
orea
S A
fric
a
Jap
an
Ru
ssia
Brazil
In
do
nesia
US
A
In
dia
Ch
ina
2016 Population (mn)
4.8%
9.8%
8.5%
6.6%
5.5%
6.4%
7.5%8.0%
7.1%7.2%7.7%
1.9%
4.3%
-1.7%
3.2%
2.4%2.6%
2.8%2.7%
2.4%2.7%2.9%
FY02FY08 FY10FY12FY13FY14FY15FY16FY17FY18FY20
India World
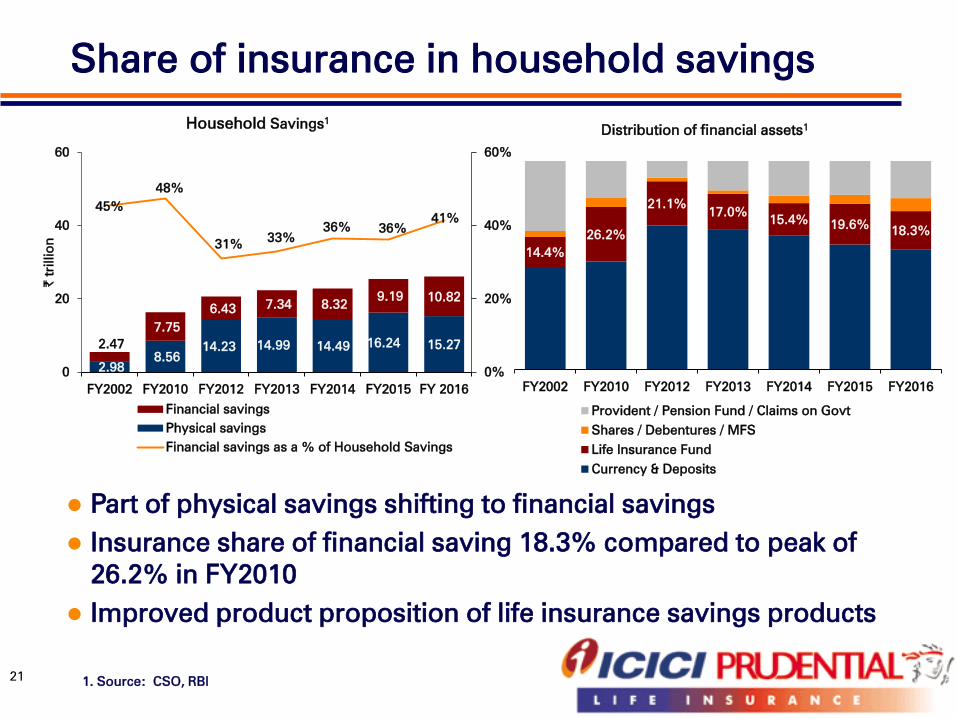
Share of Insurance in Savings Expected to RiseShare of insurance in household savings
1. Source: CSO, RBI
14.4%
26.2%
21.1%17.0%
15.4%19.6%
18.3%
FY2002 FY2010 FY2012 FY2013 FY2014 FY2015 FY2016
Distribution of financial assets1
Provident / Pension Fund / Claims on Govt
Shares / Debentures / MFS
Life Insurance Fund
Currency & Deposits
Household Savings1
Part of physical savings shifting to financial savings
Insurance share of financial saving 18.3% compared to peak of
26.2% in FY2010
Improved product proposition of life insurance savings products
21
2.98
8.56
14.23 14.99 14.49 16.24 15.272.47
7.75
6.43 7.34 8.32
9.19 10.82
45%
48%
31%33%
36% 36%
41%
0%
20%
40%
60%
0
20
40
60
FY2002 FY2010 FY2012 FY2013 FY2014 FY2015 FY 2016
` t
rillio
n
Financial savings
Physical savings
Financial savings as a % of Household Savings
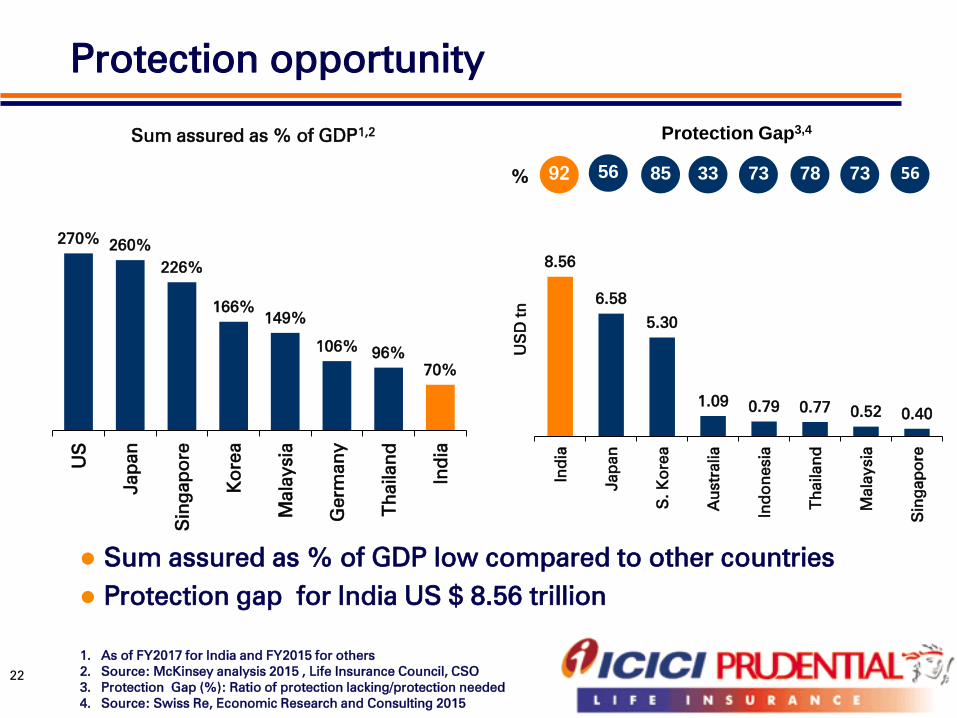
Protection opportunity
1. As of FY2017 for India and FY2015 for others
2. Source: McKinsey analysis 2015 , Life Insurance Council, CSO
3. Protection Gap (%): Ratio of protection lacking/protection needed
4. Source: Swiss Re, Economic Research and Consulting 2015
Sum assured as % of GDP low compared to other countries
Protection gap for India US $ 8.56 trillion
8.56
6.58
5.30
1.090.79 0.77
0.52 0.40
In
dia
Jap
an
S. K
ore
a
Au
stralia
In
do
nesia
Th
ailan
d
Mala
ysia
Sin
gap
ore
US
D t
n
92 56 85 33 73 78 73 56
Protection Gap3,4
22
%
270%260%
226%
166%
149%
106%96%
70%
US
Jap
an
Sin
gap
ore
Ko
re
a
Mala
ysia
Germ
an
y
Th
ailan
d
In
dia
Sum assured as % of GDP1,2
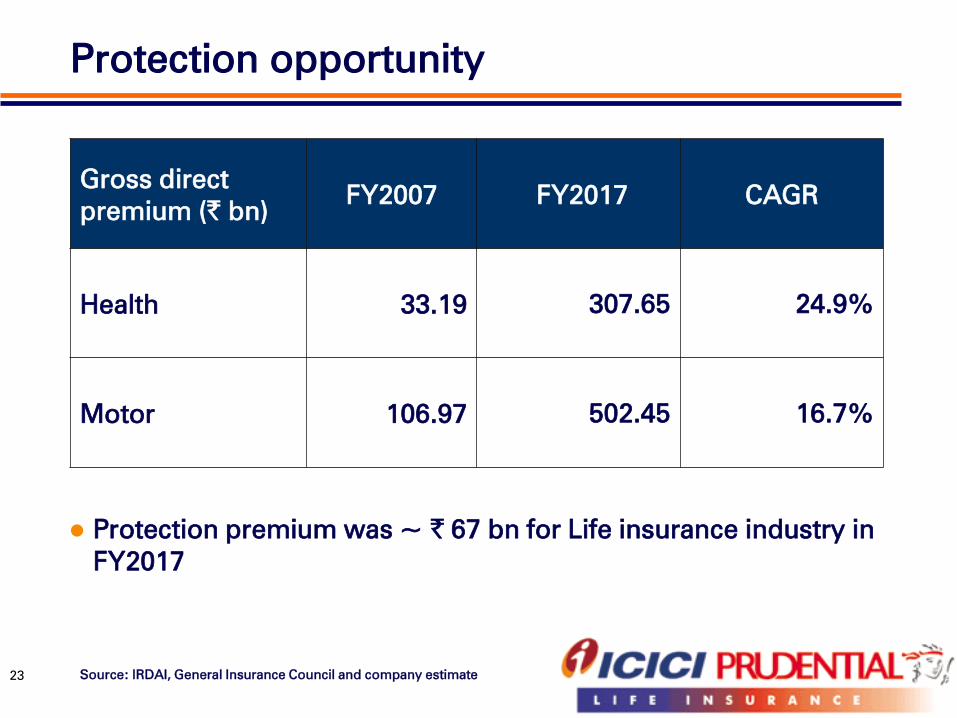
Protection opportunity
Gross direct
premium (` bn)FY2007 FY2017 CAGR
Health 33.19 307.65 24.9%
Motor 106.97 502.45 16.7%
Protection premium was ~ ` 67 bn for Life insurance industry in
FY2017
23 Source: IRDAI, General Insurance Council and company estimate
Opportunity
Industry overview
Agenda
Company strategy and performance
24
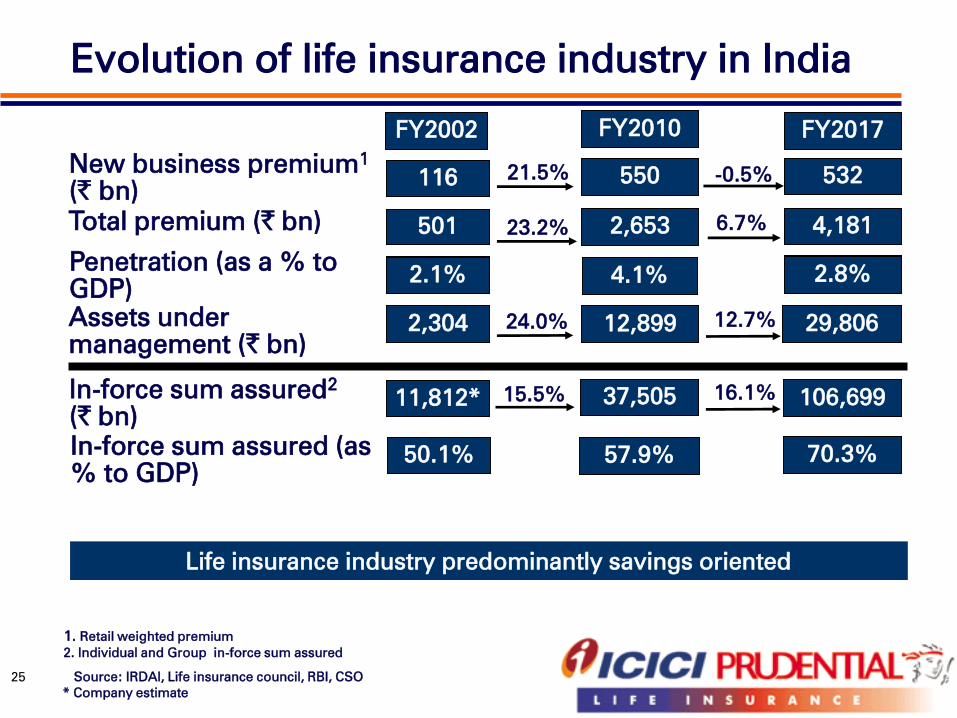
Total premium (` bn)
Penetration (as a % to
GDP)
New business premium1
(` bn)
FY2017
532
4,181
FY2002
116
501
2.1%
21.5%
23.2%
Source: IRDAI, Life insurance council, RBI, CSO
* Company estimate
Evolution of life insurance industry in India
Assets under
management (` bn)
29,8062,304 24.0%
1. Retail weighted premium
2. Individual and Group in-force sum assured
FY2010
550
2,653
12,899
-0.5%
6.7%
12.7%
2.8%
In-force sum assured2
(` bn)
11,812* 37,505 106,69915.5% 16.1%
2.1% 4.1% 2.8%
In-force sum assured (as
% to GDP)
50.1% 57.9% 70.3%
Life insurance industry predominantly savings oriented
25
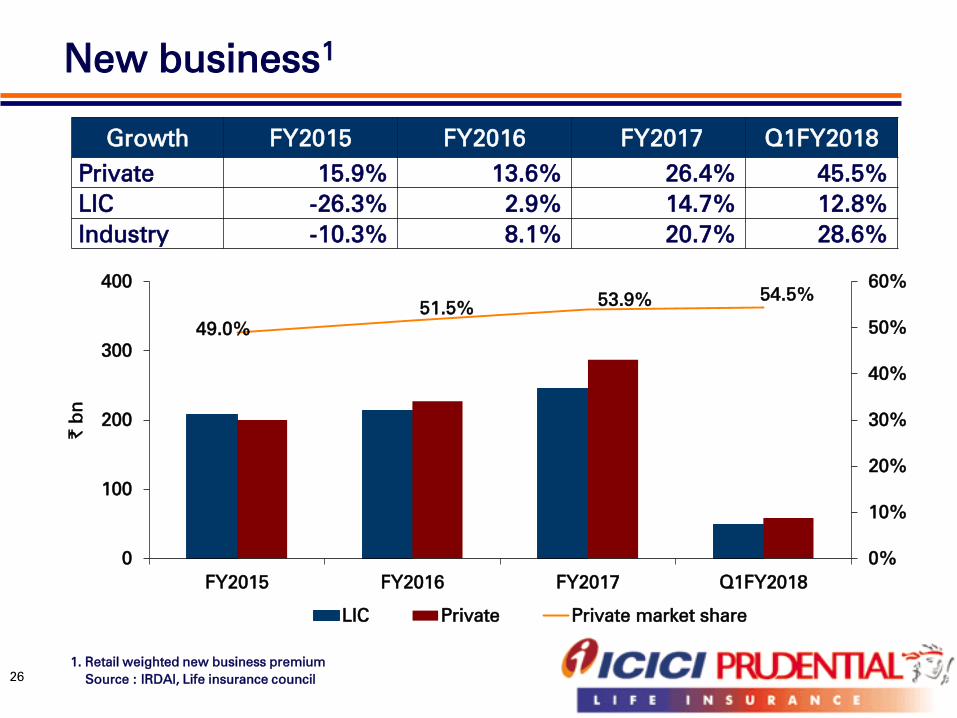
1. Retail weighted new business premium
Source : IRDAI, Life insurance council
Growth FY2015 FY2016 FY2017 Q1FY2018
Private 15.9% 13.6% 26.4% 45.5%
LIC -26.3% 2.9% 14.7% 12.8%
Industry -10.3% 8.1% 20.7% 28.6%
New business1
26
49.0%
51.5%53.9%
54.5%
0%
10%
20%
30%
40%
50%
60%
0
100
200
300
400
FY2015 FY2016 FY2017 Q1FY2018
` b
n
LIC Private Private market share
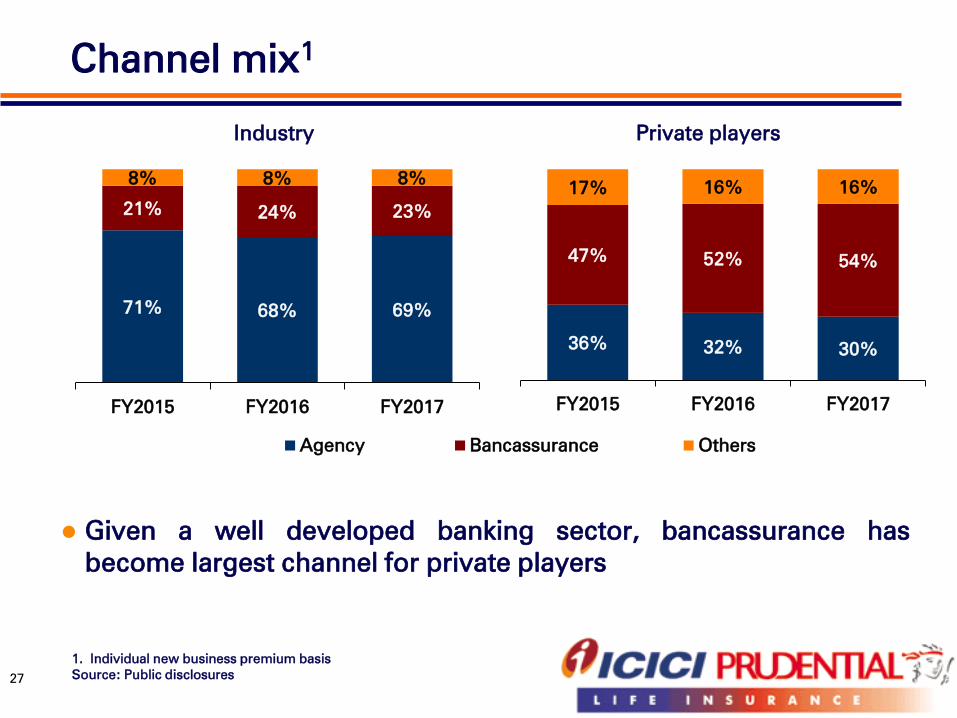
Channel mix1
27
1. Individual new business premium basis
Source: Public disclosures
Given a well developed banking sector, bancassurance has
become largest channel for private players
Industry Private players
71% 68% 69%
21% 24% 23%
8% 8% 8%
FY2015 FY2016 FY2017
Agency Bancassurance Others
36% 32% 30%
47% 52% 54%
17% 16% 16%
FY2015 FY2016 FY2017
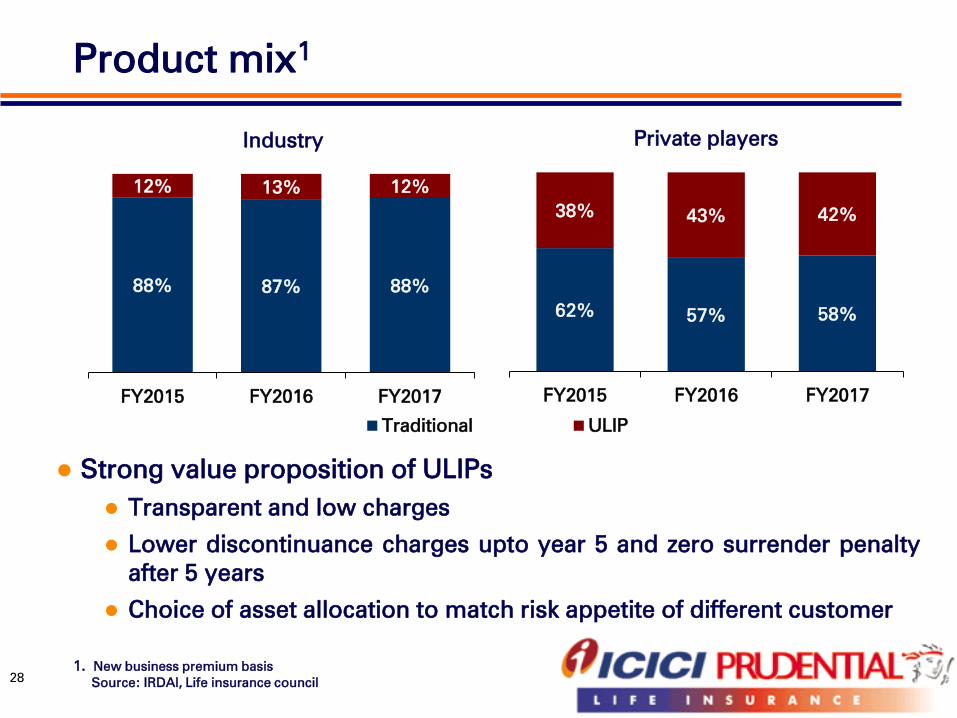
Product mix1
28
1. New business premium basis
Source: IRDAI, Life insurance council
Strong value proposition of ULIPs
Transparent and low charges
Lower discontinuance charges upto year 5 and zero surrender penalty
after 5 years
Choice of asset allocation to match risk appetite of different customer
Industry Private players
88% 87% 88%
12% 13% 12%
FY2015 FY2016 FY2017
Traditional ULIP
62% 57% 58%
38% 43% 42%
FY2015 FY2016 FY2017
29
Annexures
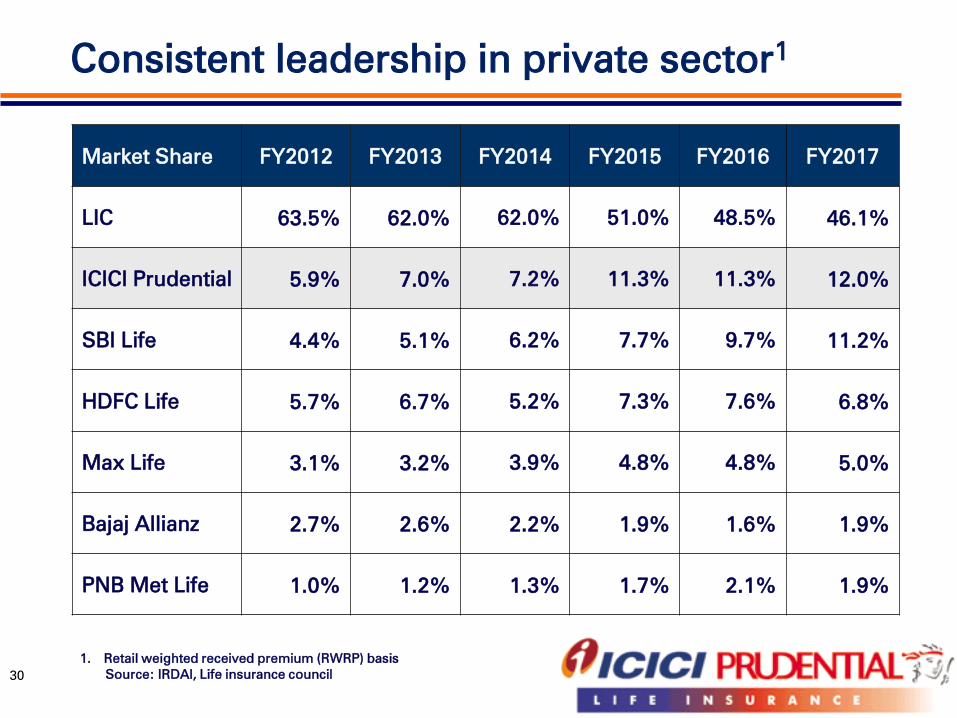
Consistent leadership in private sector1
Market Share FY2012 FY2013 FY2014 FY2015 FY2016 FY2017
LIC 63.5% 62.0% 62.0% 51.0% 48.5% 46.1%
ICICI Prudential 5.9% 7.0% 7.2% 11.3% 11.3% 12.0%
SBI Life 4.4% 5.1% 6.2% 7.7% 9.7% 11.2%
HDFC Life 5.7% 6.7% 5.2% 7.3% 7.6% 6.8%
Max Life 3.1% 3.2% 3.9% 4.8% 4.8% 5.0%
Bajaj Allianz 2.7% 2.6% 2.2% 1.9% 1.6% 1.9%
PNB Met Life 1.0% 1.2% 1.3% 1.7% 2.1% 1.9%
30
1. Retail weighted received premium (RWRP) basis
Source: IRDAI, Life insurance council
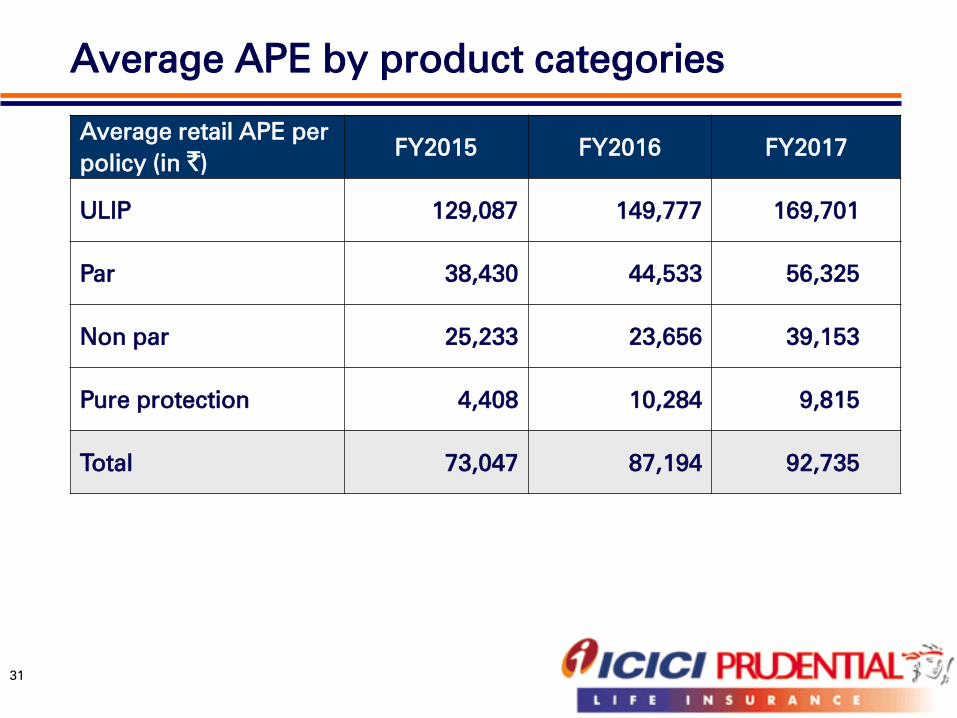
Average APE by product categories
Average retail APE per
policy (in `)
FY2015 FY2016 FY2017
ULIP 129,087 149,777 169,701
Par 38,430 44,533 56,325
Non par 25,233 23,656 39,153
Pure protection 4,408 10,284 9,815
Total 73,047 87,194 92,735
31
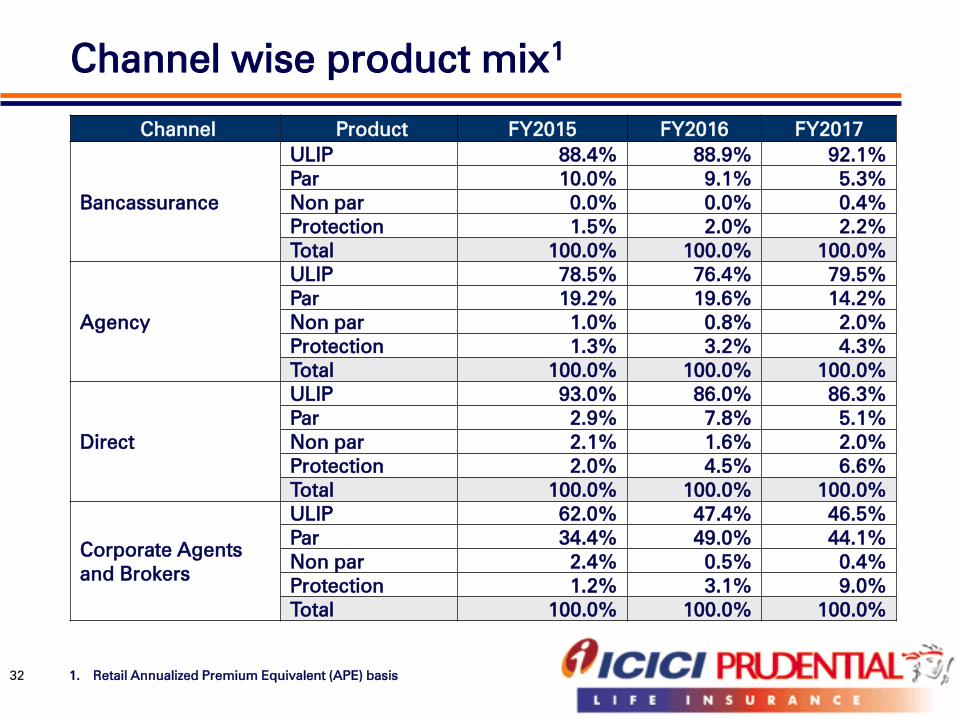
Channel wise product mix1
32
Channel Product FY2015 FY2016 FY2017
Bancassurance
ULIP 88.4% 88.9% 92.1%
Par 10.0% 9.1% 5.3%
Non par 0.0% 0.0% 0.4%
Protection 1.5% 2.0% 2.2%
Total 100.0% 100.0% 100.0%
Agency
ULIP 78.5% 76.4% 79.5%
Par 19.2% 19.6% 14.2%
Non par 1.0% 0.8% 2.0%
Protection 1.3% 3.2% 4.3%
Total 100.0% 100.0% 100.0%
Direct
ULIP 93.0% 86.0% 86.3%
Par 2.9% 7.8% 5.1%
Non par 2.1% 1.6% 2.0%
Protection 2.0% 4.5% 6.6%
Total 100.0% 100.0% 100.0%
Corporate Agents
and Brokers
ULIP 62.0% 47.4% 46.5%
Par 34.4% 49.0% 44.1%
Non par 2.4% 0.5% 0.4%
Protection 1.2% 3.1% 9.0%
Total 100.0% 100.0% 100.0%
1. Retail Annualized Premium Equivalent (APE) basis
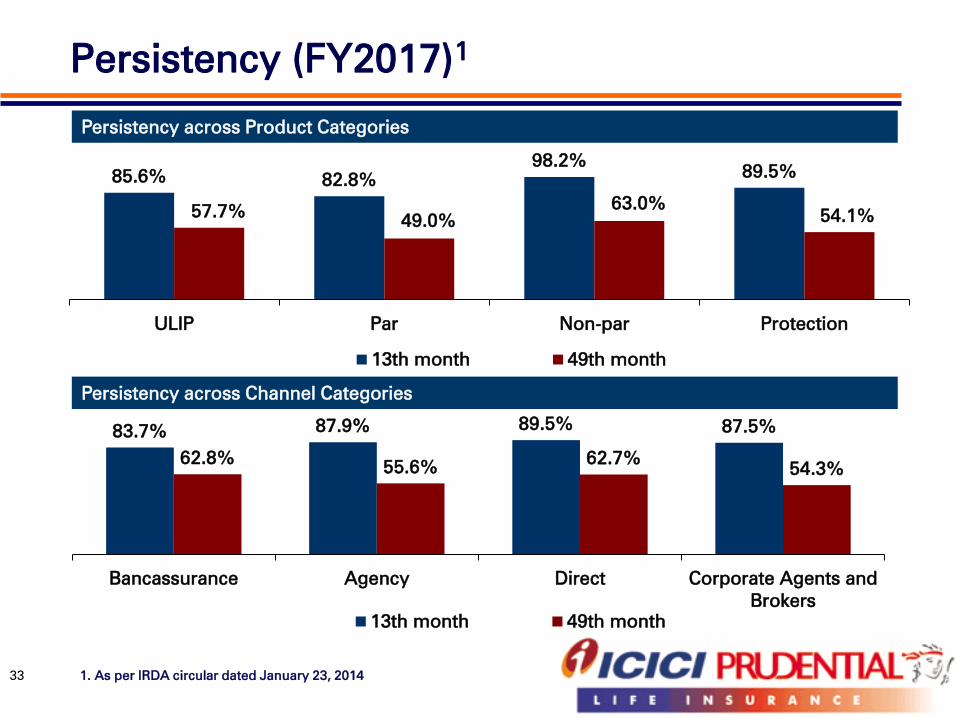
Persistency (FY2017)1
1. As per IRDA circular dated January 23, 201433
Persistency across Product Categories
Persistency across Channel Categories
83.7%87.9% 89.5% 87.5%
62.8%55.6%
62.7%54.3%
Bancassurance Agency Direct Corporate Agents and
Brokers
13th month 49th month
85.6% 82.8%
98.2%89.5%
57.7%49.0%
63.0%
54.1%
ULIP Par Non-par Protection
13th month 49th month
Indian Embedded Value
34
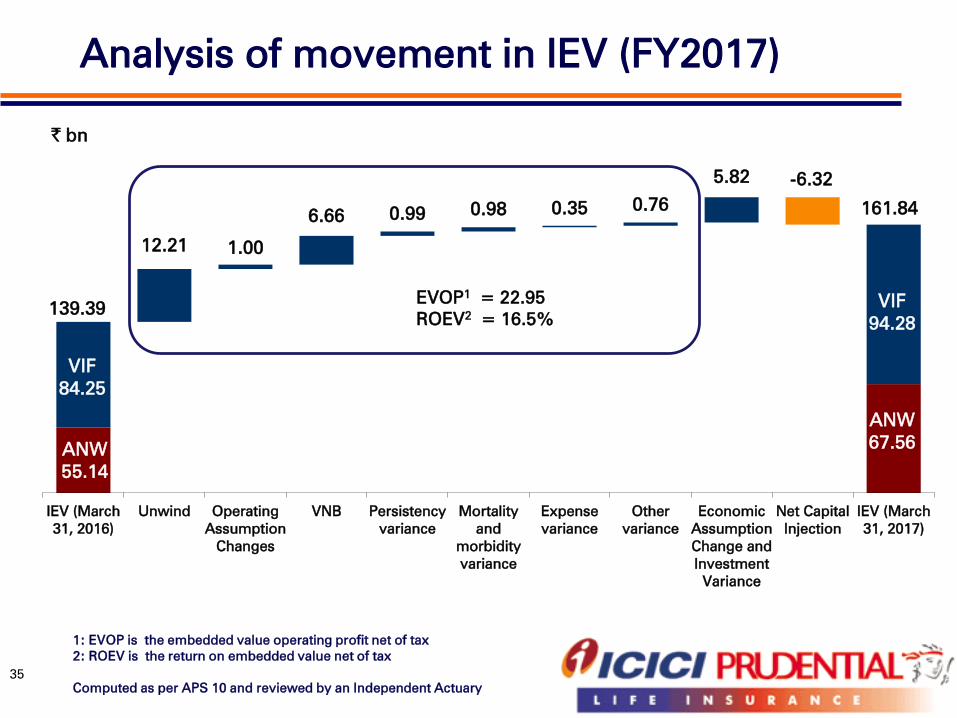
12.21 1.00
6.66 0.99 0.98 0.35 0.76
5.82 -6.32
IEV (March
31, 2016)
Unwind Operating
Assumption
Changes
VNB Persistency
variance
Mortality
and
morbidity
variance
Expense
variance
Other
variance
Economic
Assumption
Change and
Investment
Variance
Net Capital
Injection
IEV (March
31, 2017)
ANW
55.14
VIF
84.25
139.39EVOP
1= 22.95
ROEV2
= 16.5%
VIF
94.28
ANW
67.56
161.84
` bn
1: EVOP is the embedded value operating profit net of tax
2: ROEV is the return on embedded value net of tax
Computed as per APS 10 and reviewed by an Independent Actuary
35
Analysis of movement in IEV (FY2017)
IEV methodology … (1/2)
EV results prepared based on the Indian Embedded
Value (IEV) methodology and principles as set out in
Actuarial Practice Standard 10 (APS10) issued by the
Institute of Actuaries of India (IAI)
36
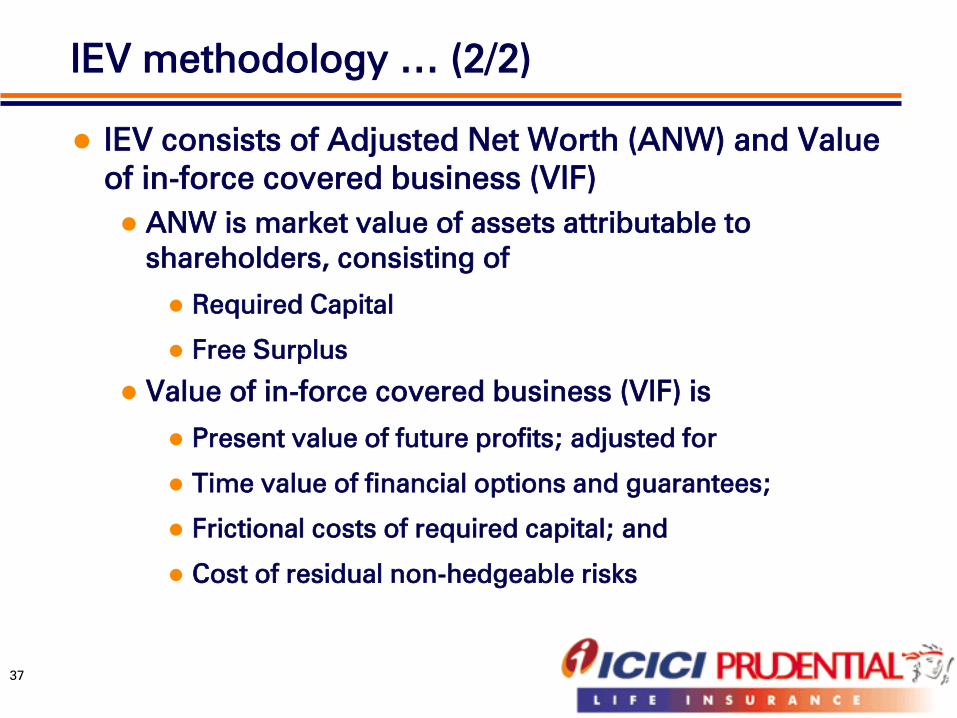
IEV methodology … (2/2)
IEV consists of Adjusted Net Worth (ANW) and Value
of in-force covered business (VIF)
ANW is market value of assets attributable to
shareholders, consisting of
Required Capital
Free Surplus
Value of in-force covered business (VIF) is
Present value of future profits; adjusted for
Time value of financial options and guarantees;
Frictional costs of required capital; and
Cost of residual non-hedgeable risks
37
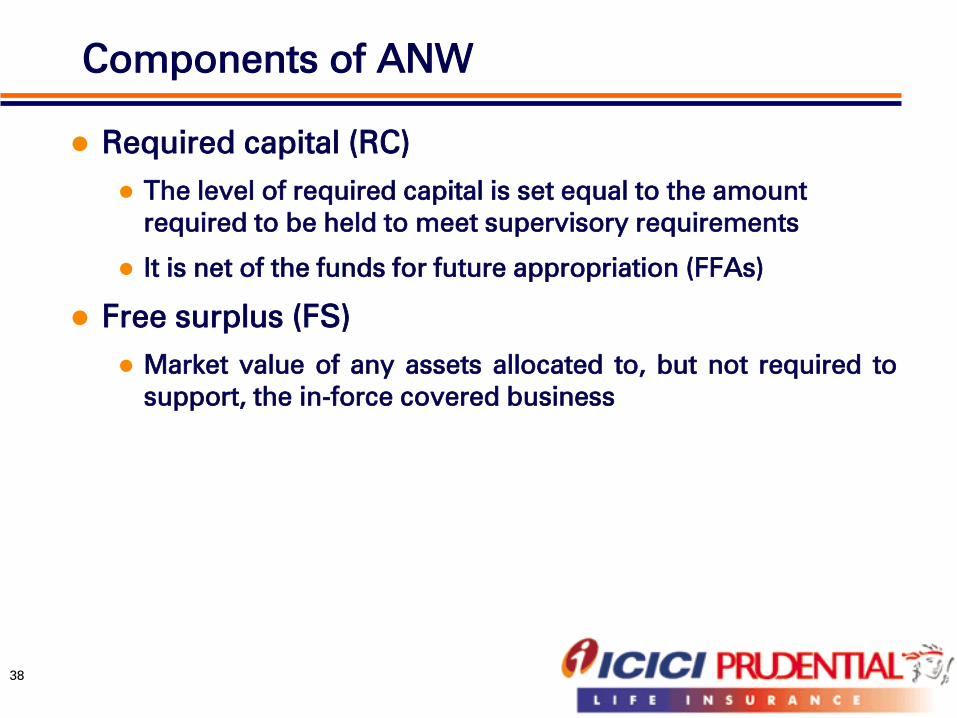
Required capital (RC)
The level of required capital is set equal to the amount
required to be held to meet supervisory requirements
It is net of the funds for future appropriation (FFAs)
Free surplus (FS)
Market value of any assets allocated to, but not required to
support, the in-force covered business
38
Components of ANW
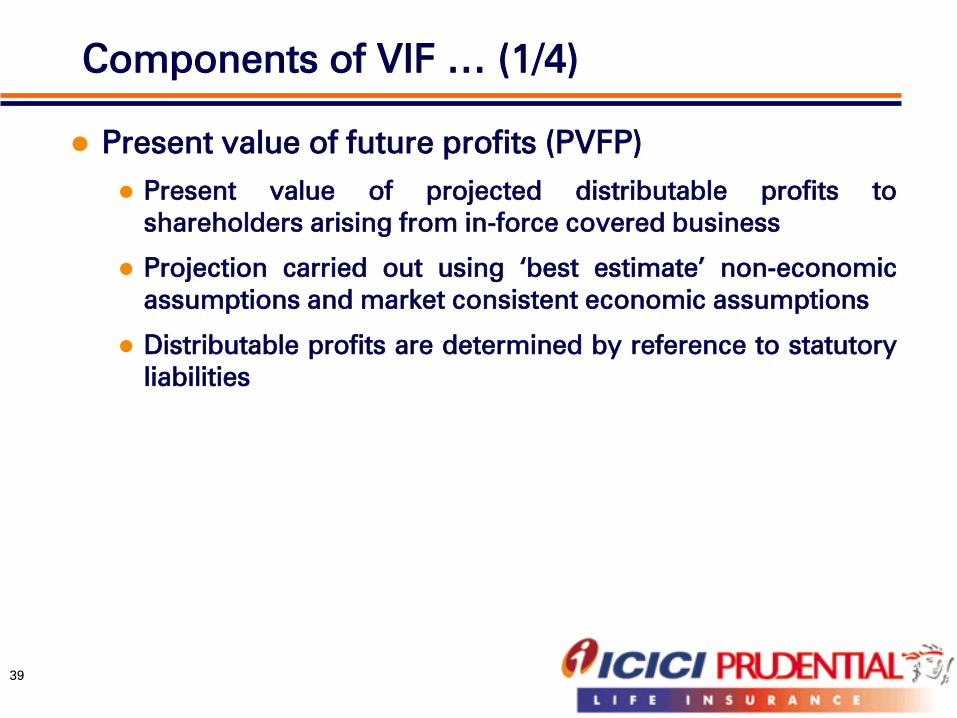
Present value of future profits (PVFP)
Present value of projected distributable profits to
shareholders arising from in-force covered business
Projection carried out using ‘best estimate’ non-economic
assumptions and market consistent economic assumptions
Distributable profits are determined by reference to statutory
liabilities
39
Components of VIF … (1/4)
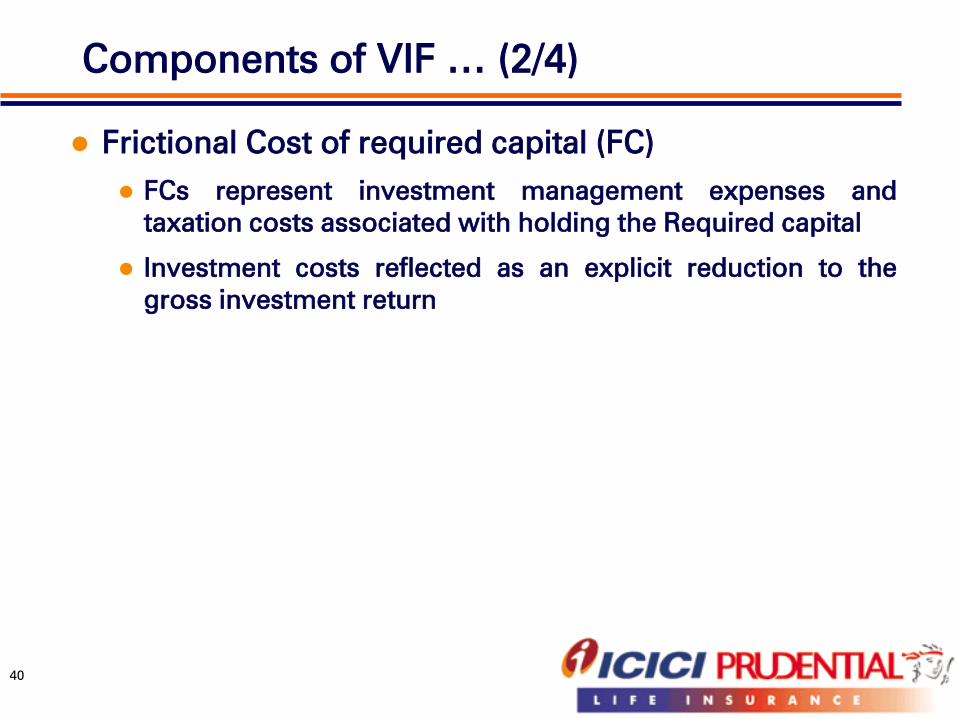
Frictional Cost of required capital (FC)
FCs represent investment management expenses and
taxation costs associated with holding the Required capital
Investment costs reflected as an explicit reduction to the
gross investment return
40
Components of VIF … (2/4)
Time value of financial options and guarantees
(TVFOG)
TVFOG represents additional cost to shareholders that may
arise from the embedded financial options and guarantees
Stochastic approach is adopted with methods and
assumptions consistent with the underlying embedded value
41
Components of VIF … (3/4)
Cost of residual non-hedgeable risk (CRNHR)
CRNHR is an allowance for risks to shareholder value to the
extent not already allowed for in the TVFOG or the PVFP
Allowance has been made for asymmetric risks of
operational, catastrophe mortality / morbidity and mass
lapsation risk
CRNHR determined using a cost-of-capital approach
Allowance has been made for diversification benefits among
the non-hedgeable risks, other than the operational risk
4% annual charge applied to capital required
42
Components of VIF … (4/4)
Operating assumption changes
Impact of the update of non-economic assumptions both on
best estimate and statutory bases to those adopted in the
closing IEV
Expected return on existing business (unwind)
Expected investment income at opening reference rate on VIF
and ANW
Expected excess ‘real world’ investment return over the opening
reference rate on VIF and ANW
Value of new business
Additional value to shareholders created through new business
during the period
Components of IEV movement … (1/2)
43
Operating experience variance
Captures impact of any deviation of actual experience from
assumed in the opening IEV during the inter-valuation period
Economic assumption changes and Investment
variance
Impact of the update of the reference rate yield curve,
inflation and valuation economic assumptions from opening
IEV to closing IEV
Captures the difference between the actual investment
return and the expected ‘real world’ assumed return
Net capital injection
Reflects any capital injected less any dividends paid out
Components of IEV movement … (2/2)
44
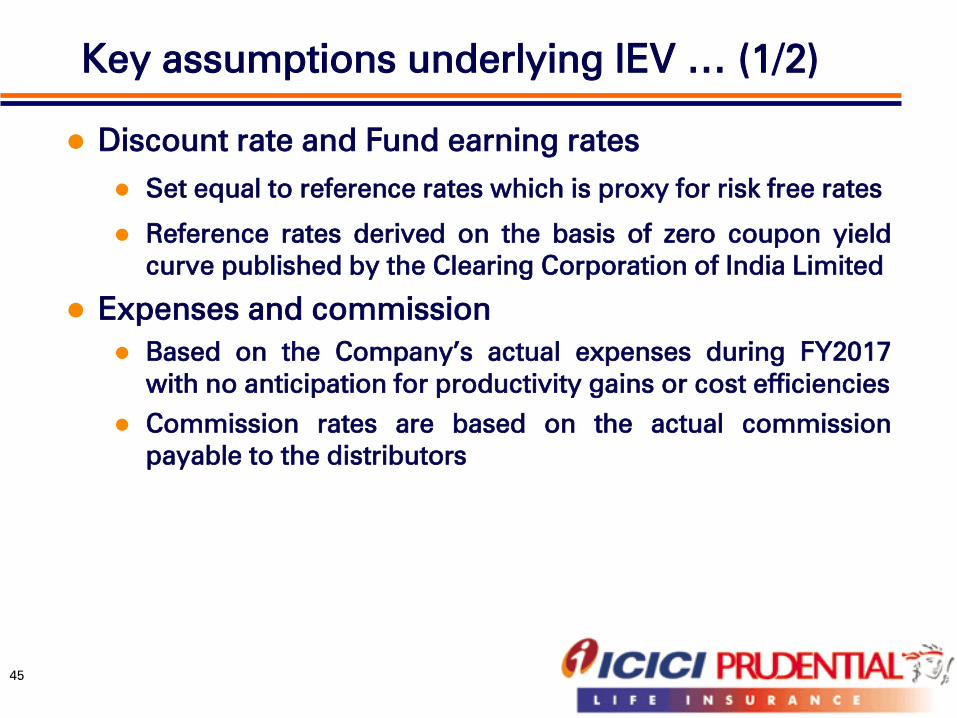
Discount rate and Fund earning rates
Set equal to reference rates which is proxy for risk free rates
Reference rates derived on the basis of zero coupon yield
curve published by the Clearing Corporation of India Limited
Expenses and commission
Based on the Company’s actual expenses during FY2017
with no anticipation for productivity gains or cost efficiencies
Commission rates are based on the actual commission
payable to the distributors
Key assumptions underlying IEV … (1/2)
45
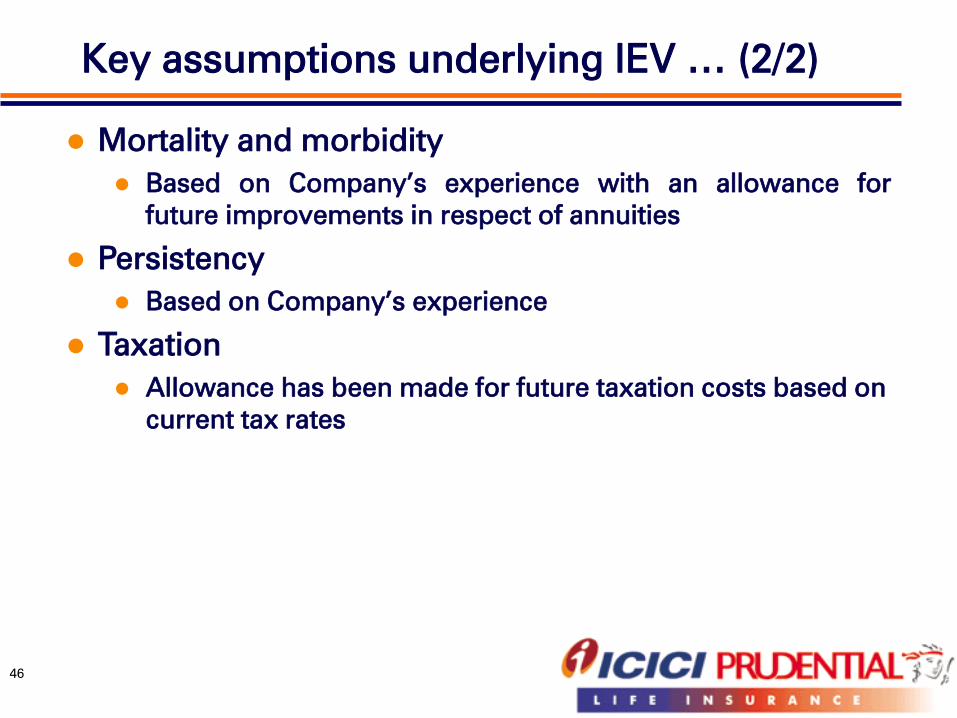
Mortality and morbidity
Based on Company’s experience with an allowance for
future improvements in respect of annuities
Persistency
Based on Company’s experience
Taxation
Allowance has been made for future taxation costs based on
current tax rates
Key assumptions underlying IEV … (2/2)
46
47
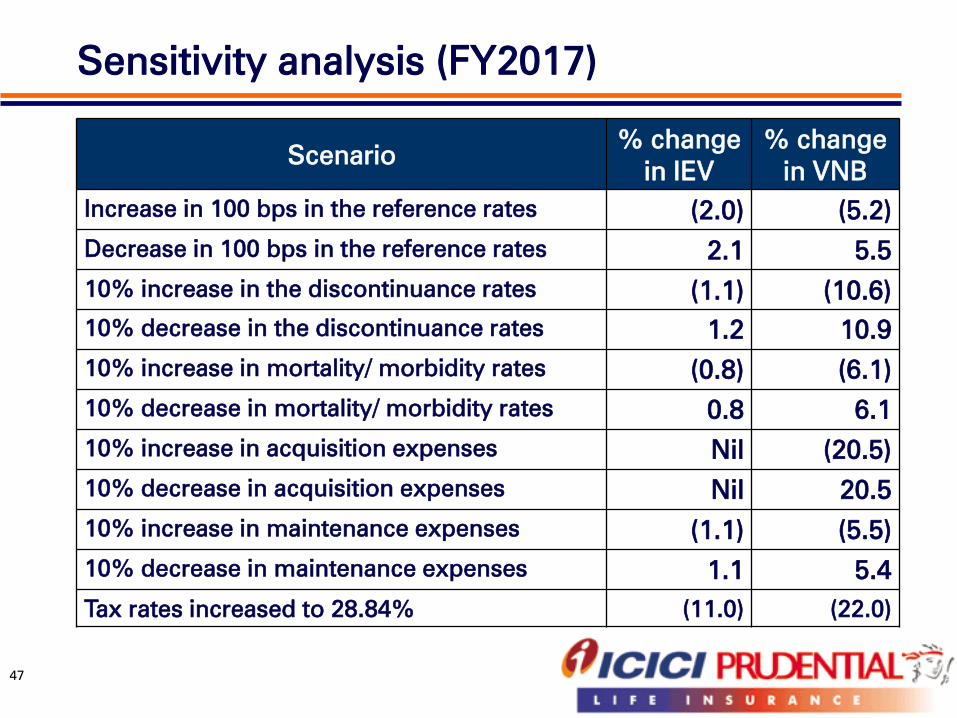
Sensitivity analysis (FY2017)
Scenario% change
in IEV
% change
in VNB
Increase in 100 bps in the reference rates (2.0) (5.2)
Decrease in 100 bps in the reference rates 2.1 5.5
10% increase in the discontinuance rates (1.1) (10.6)
10% decrease in the discontinuance rates 1.2 10.9
10% increase in mortality/ morbidity rates (0.8) (6.1)
10% decrease in mortality/ morbidity rates 0.8 6.1
10% increase in acquisition expenses Nil (20.5)
10% decrease in acquisition expenses Nil 20.5
10% increase in maintenance expenses (1.1) (5.5)
10% decrease in maintenance expenses 1.1 5.4
Tax rates increased to 28.84% (11.0) (22.0)
48
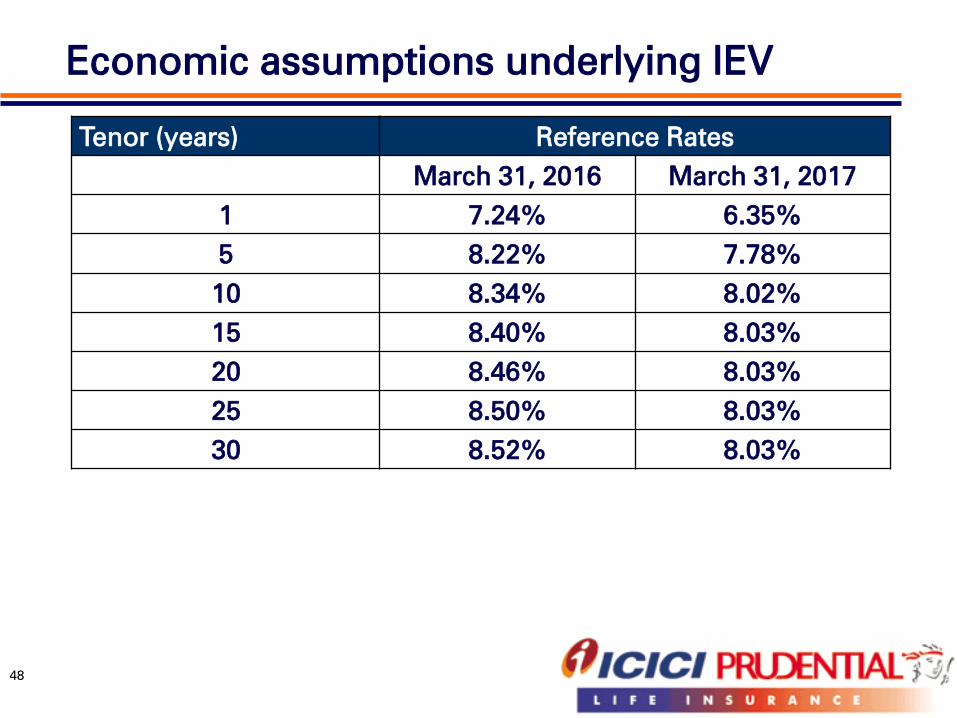
Economic assumptions underlying IEV
Tenor (years) Reference Rates
March 31, 2016 March 31, 2017
1 7.24% 6.35%
5 8.22% 7.78%
10 8.34% 8.02%
15 8.40% 8.03%
20 8.46% 8.03%
25 8.50% 8.03%
30 8.52% 8.03%
Safe harbor
Except for the historical information contained herein, statements in this release
which contain words or phrases such as 'will', 'would', ‘indicating’, ‘expected to’ etc.,
and similar expressions or variations of such expressions may constitute 'forward-
looking statements'. These forward-looking statements involve a number of risks,
uncertainties and other factors that could cause actual results to differ materially
from those suggested by the forward-looking statements. These risks and
uncertainties include, but are not limited to our ability to successfully implement our
strategy, our growth and expansion in business, the impact of any acquisitions,
technological implementation and changes, the actual growth in demand for
insurance products and services, investment income, cash flow projections, our
exposure to market risks, policies and actions of regulatory authorities; impact of
competition; experience with regard to mortality and morbidity trends, lapse rates
and policy renewal rates; the impact of changes in capital , solvency or accounting
standards , tax and other legislations and regulations in the jurisdictions as well as
other risks detailed in the reports filed by ICICI Bank Limited, our holding company,
with the United States Securities and Exchange Commission. ICICI Prudential Life
Insurance undertakes no obligation to update forward-looking statements to reflect
events or circumstances after the date thereof.
49
Thank you
50
![gammaApe - motocastelo.commotocastelo.com/ficheiros/produtos/1321702228Ape_2008[1].pdf · Ape 50 Ape 50 Pianale lungo Ape 50 Pianale corto Ape 50 Cross Ape 50 Furgone Motorizzazione](https://img.pdfslide.net/doc/110x75/5c6dc74309d3f2fe088c310f/gammaape-1pdf-ape-50-ape-50-pianale-lungo-ape-50-pianale-corto-ape-50-cross.jpg)