Embed Size (px)
Citation preview

Q2 2012 Analyst & Investor Conference Call
Kasper Rorsted, CEO Carsten Knobel, CFO
Düsseldorf, August 1, 2012

August 1, 2012 Q2 2012 – Henkel Analyst & Investor Conference Call2
This information contains forward-looking statements which are based on current estimates and assumptions made by the corporate management of Henkel AG & Co. KGaA. Statements with respect to the future are characterized by the use of words such as “expect”, “intend”, “plan”, “anticipate”, “believe”, “estimate”, and similar terms. Such statements are not to be understood as in any way guaranteeing that those expectations will turn out to be accurate. Future performance and results actually achieved by Henkel AG & Co. KGaA and its affiliated companies depend on a number of risks and uncertainties and may therefore differ materially from the forward-looking statements. Many of these factors are outside Henkel's control and cannot be accurately estimated in advance, such as the future economic environment and the actions of competitors and others involved in the marketplace. Henkel neither plans nor undertakes to update any forward-looking statements.
Disclaimer

August 1, 2012 Q2 2012 – Henkel Analyst & Investor Conference Call3
Agenda
Key Developments Q2 2012
Financials Q2 2012
Outlook FY 2012

August 1, 2012 Q2 2012 – Henkel Analyst & Investor Conference Call4
2012 Well on Track
19.2%
13.7%
4.7%
Q1/2012
21.1%
14.1%
4.3%
H1/2012
3-5 %4.0%Organic sales growth
~15%
14%
Guidance FY 2012
22.8%Adjusted EPS growth
14.5%Adjusted EBIT margin
Q2/2012

August 1, 2012 Q2 2012 – Henkel Analyst & Investor Conference Call5
Key Developments Q2/2012Henkel
• Significant increasein gross margin
• Adj. EBIT margin at 14.5%
• Emerging Markets very strong, Eastern Europe with reinforced growth momentum
• Net working capital further improved
• Portfolio further optimized
• Further intensified head-wind in Southern Europe
• Electronic Adhesives sales development remaining negative
• Growth in Latin Americaslowing

August 1, 2012 Q2 2012 – Henkel Analyst & Investor Conference Call6
Key Developments Q2/2012Laundry & Home Care
Strong sales & earnings performance
• Strong organic sales growth
• Adj. EBIT margin strongly increased
• Double-digit growth in Emerging Markets,supported by Mature Markets
• Further market share gains
• Key innovation: Bref “Power Aktiv“ with Chlorine Power Balls

August 1, 2012 Q2 2012 – Henkel Analyst & Investor Conference Call7
Key Developments Q2/2012Cosmetics/Toiletries
Continued strong profitable growth
• Solid organic sales growth
• Adj. EBIT margin further improved
• Emerging Markets with very strong growth,Mature Markets flat
• Further market share gains
• Key innovation: Right Guard Cooling

August 1, 2012 Q2 2012 – Henkel Analyst & Investor Conference Call8
Key Developments Q2/2012Adhesive Technologies
Solid sales growth & strong increase in profitability
• Solid organic sales growth
• Adj. EBIT margin strongly increased
• Strong growth in Emerging Markets,supported by North America
• Electronic Adhesives sales growth negative
• Further market share gains
• Key innovation: Liofol laminating adhesive without free isocyanates

August 1, 2012 Q2 2012 – Henkel Analyst & Investor Conference Call9
Innovations as Drivers of Revenue & Margin Enhancements
Right GuardCooling
Liofol LA-1640 21Laminating Adhesive
Bref “Power Aktiv” with Chlorine Power Balls

August 1, 2012 Q2 2012 – Henkel Analyst & Investor Conference Call10
Continuous Portfolio Optimization
Non-core brand & business divestments & disposals
Additions & extensions toexisting portfolio
• Exits from selected lower profit businesses in Adhesive Technologies
• Divestment of non-core US brands in Cosmetics/Toiletries
• Acquisition of industrial high-performance pressure sensitive adhesives from Cytec Industries, USA

August 1, 2012 Q2 2012 – Henkel Analyst & Investor Conference Call11
Key Financials Q2/2012
Well on track for reaching FY 2012 guidance
-90bp
+22.8%
+150bp
+18.6%
+150bp
+ 6.4% (+ 4.0%)Change
7.58.4NWC / sales (%)
0.970.79Adj. EPS per pref. share
14.513.0Adjusted EBIT margin (%)
609514Adjusted EBIT (m€)
47.646.1Adjusted gross margin (%)
4,2063,953Sales (m€) (OSG in %)Q2/2012Q2/2011

August 1, 2012 Q2 2012 – Henkel Analyst & Investor Conference Call12
Agenda
Key Developments Q2 2012
Financials Q2 2012
Outlook FY 2012

August 1, 2012 Q2 2012 – Henkel Analyst & Investor Conference Call13
Sales Growth by Business SectorQ2/2012 vs. Q2/2011
Total Henkel
AdhesiveTechnologies
Cosmetics/Toiletries
Laundry &Home Care
in %
6.4
6.9
4.5
6.6
Total
3.5
4.3
3.1
2.2
FX Impact
4.0
3.6
2.8
5.1
Organic
3.7 / 0.3
4.1 / -0.5
2.5 / 0.3
3.9 / 1.2
ThereofPrice/
Volume*
* new product launches included in price for L&HC and C/T and in volume for Adhesive Technologies

August 1, 2012 Q2 2012 – Henkel Analyst & Investor Conference Call14
Sales Growth by Business SectorQ2/2012 vs. Q2/2011
Total Henkel
AdhesiveTechnologies
Cosmetics/Toiletries
Laundry &Home Care
in %
6.4
6.9
4.5
6.6
Total
3.5
4.3
3.1
2.2
FX Impact
4.0
3.6
2.8
5.1
Organic
3.7 / 0.3
4.1 / -0.5
2.5 / 0.3
3.9 / 1.2
ThereofPrice/
Volume*
• All regions contributing, with double-digit growth in Emerging Markets, Western Europe and North America positive
• Laundry with solid growth, Home Care strong* new product launches included in price for L&HC and C/T and in volume for Adhesive Technologies

August 1, 2012 Q2 2012 – Henkel Analyst & Investor Conference Call15
Sales Growth by Business SectorQ2/2012 vs. Q2/2011
Total Henkel
AdhesiveTechnologies
Cosmetics/Toiletries
Laundry &Home Care
in %
6.4
6.9
4.5
6.6
Total
3.5
4.3
3.1
2.2
FX Impact
4.0
3.6
2.8
5.1
Organic
3.7 / 0.3
4.1 / -0.5
2.5 / 0.3
3.9 / 1.2
ThereofPrice/
Volume*
• All regions contributing, with strongest growth in Emerging Markets – esp. China; Western Europe and North America positive
• Retail with solid growth, Hair Salon flat * new product launches included in price for L&HC and C/T and in volume for Adhesive Technologies

August 1, 2012 Q2 2012 – Henkel Analyst & Investor Conference Call16
Sales Growth by Business SectorQ2/2012 vs. Q2/2011
Total Henkel
AdhesiveTechnologies
Cosmetics/Toiletries
Laundry &Home Care
in %
6.4
6.9
4.5
6.6
Total
3.5
4.3
3.1
2.2
FX Impact
4.0
3.6
2.8
5.1
Organic
3.7 / 0.3
4.1 / -0.5
2.5 / 0.3
3.9 / 1.2
ThereofPrice/
Volume*
• Strong growth in Emerging Markets, driven by Africa/Middle East and Eastern Europe, North America strong, Asia impacted by selected business exits
• Transport & Metal with strongest growth, Electronic Adhesives negative* new product launches included in price for L&HC and C/T and in volume for Adhesive Technologies

August 1, 2012 Q2 2012 – Henkel Analyst & Investor Conference Call17
Sales Growth by Business SectorQ2/2012 vs. Q2/2011
Total Henkel
AdhesiveTechnologies
Cosmetics/Toiletries
Laundry &Home Care
in %
6.4
6.9
4.5
6.6
Total
3.5
4.3
3.1
2.2
FX Impact
4.0
3.6
2.8
5.1
Organic
3.7 / 0.3
4.1 / -0.5
2.5 / 0.3
3.9 / 1.2
ThereofPrice/
Volume*
• Positive FX impact of 3.5% mainly from US Dollar, Chinese Renminbi and Japanese Yen
• Acquisitions/divestments accounting for -1.1%* new product launches included in price for L&HC and C/T and in volume for Adhesive Technologies

August 1, 2012 Q2 2012 – Henkel Analyst & Investor Conference Call18
• Western Europe flat (34% sales share), increasing weakness in Southern Europe
• North America with solid growth in a sluggish consumer climate• Asia-Pacific with double-digit contribution from Cosmetics/Toiletries
Sales Growth by RegionQ2/2012 vs. Q2/2011
Emerging Markets
Asia-Pacific
Latin America
North America
Africa/ Middle East
Eastern Europe
Western Europe
-0.1 7.9 14.1 3.8 3.9 4.5 8.1
XX Organic, percent
729
231
676
272587
771
279
765
270
657
1,6741,425 1,425
1,829

August 1, 2012 Q2 2012 – Henkel Analyst & Investor Conference Call19
Sales Growth by RegionQ2/2012 vs. Q2/2011
Emerging Markets
Asia-Pacific
Latin America
North America
Africa/ Middle East
Eastern Europe
Western Europe
XX Organic, percent
• Emerging Markets sales share increased to 43%• All businesses very strong, Laundry & Home Care with strongest growth• Latin America below expectations• Russia with double-digit growth supported by all businesses, China strong
729
231
676
272587
771
279
765
270
657
1,6741,425 1,425
1,829
-0.1 7.9 14.1 3.8 3.9 4.5 8.1
August 1, 2012 Q2 2012 – Henkel Analyst & Investor Conference Call20
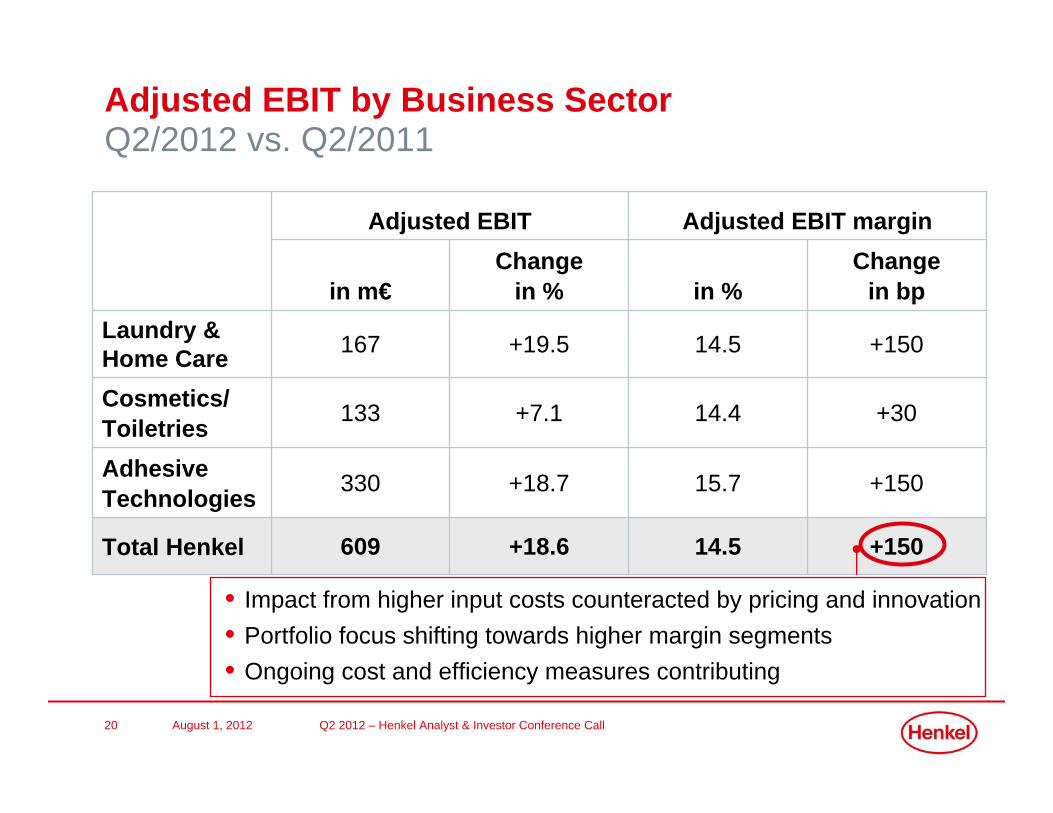
Adjusted EBIT by Business SectorQ2/2012 vs. Q2/2011
Adjusted EBIT marginAdjusted EBIT
Total Henkel
AdhesiveTechnologies
Cosmetics/Toiletries
Laundry &Home Care
609
330
133
167
in m€
+18.6
+18.7
+7.1
+19.5
Change in %
14.5
15.7
14.4
14.5
in %
+150
+150
+30
+150
Changein bp
• Impact from higher input costs counteracted by pricing and innovation• Portfolio focus shifting towards higher margin segments• Ongoing cost and efficiency measures contributing

August 1, 2012 Q2 2012 – Henkel Analyst & Investor Conference Call21
Income Statement AdjustedSales to Gross Profit
Gross margin (in%)
Gross profit
Cost of sales
Sales
in m€
46.1
1,821
-2,132
3,953
Q2/2011
47.6
2,003
-2,203
4,206
Q2/2012
+150bp
+10.0
+3.3
+6.4
Changein %

August 1, 2012 Q2 2012 – Henkel Analyst & Investor Conference Call22
Income Statement AdjustedSales to Gross Profit
Gross margin (in%)
Gross profit
Cost of sales
Sales
in m€
46.1
1,821
-2,132
3,953
Q2/2011
47.6
2,003
-2,203
4,206
Q2/2012
+150bp
+10.0
+3.3
+6.4
Changein %
• Significant increase in gross margin despite negative impact of 200bp from COGS
• Disciplined execution of countermeasures• Remaining vigilant on development of raw material prices

August 1, 2012 Q2 2012 – Henkel Analyst & Investor Conference Call23
Income Statement Adjusted Sales to Adjusted EBIT
+15014.5609514Adjusted EBIT
0.1129Net other op. income/charges
-30-4.4-184-186Administrative expenses
-2.5-104-103Research & development exp.
-20-26.3-1,107-1,047Marketing, selling & distrib. exp.
47.62,0031,821Gross profit-52.4-2,203-2,132Cost of sales100.04,2063,953Sales
Change in bp
Q2/2012in %Q2/2012Q2/2011in m€

August 1, 2012 Q2 2012 – Henkel Analyst & Investor Conference Call24
Income Statement Adjusted Sales to Adjusted EBIT
+15014.5609514Adjusted EBIT
0.1129Net other op. income/charges
-30-4.4-184-186Administrative expenses
-2.5-104-103Research & development exp.
-20-26.3-1,107-1,047Marketing, selling & distrib. exp.
47.62,0031,821Gross profit-52.4-2,203-2,132Cost of sales100.04,2063,953Sales
Change in bp
Q2/2012in %Q2/2012Q2/2011in m€
• Marketing expenses in relation to sales increasing, relation for selling & distribution expenses decreasing
August 1, 2012 Q2 2012 – Henkel Analyst & Investor Conference Call25
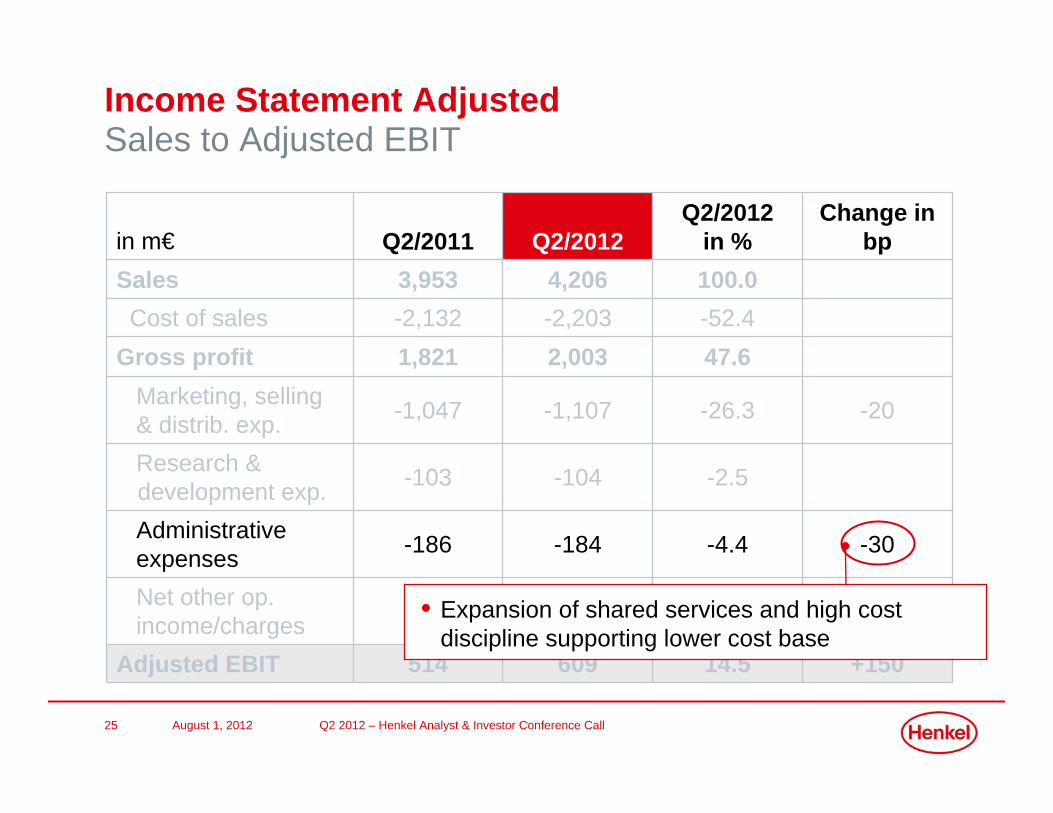
Income Statement Adjusted Sales to Adjusted EBIT
+15014.5609514Adjusted EBIT
0.1129Net other op. income/charges
-30-4.4-184-186Administrative expenses
-2.5-104-103Research & development exp.
-20-26.3-1,107-1,047Marketing, selling & distrib. exp.
47.62,0031,821Gross profit-52.4-2,203-2,132Cost of sales100.04,2063,953Sales
Change in bp
Q2/2012in %Q2/2012Q2/2011in m€
• Expansion of shared services and high cost discipline supporting lower cost base

August 1, 2012 Q2 2012 – Henkel Analyst & Investor Conference Call26
Reported to Adjusted EBITQ2/2012 vs. Q2/2011
2634Restructuring charges
Adjusted EBIT
One-timecharges
One-time gains
EBIT (as reported)
in m€
514
0
-57
537
Q2/2011
609
0
0
583
Q2/2012
+18.6
+8.5
Changein %
Continuous adaptation of structures to market

August 1, 2012 Q2 2012 – Henkel Analyst & Investor Conference Call27
Development of Net Working Capital*NWC/Sales Ratio in %
* Inventories + trade accounts receivable ./. trade accounts payable
Q2 2012Q2 2011
Cosmetics/Toiletries
Adhesive Technologies
Laundry & Home Care
Henkel
7.58.4
-1.5
0.3
3.54.1
14.515.3
Net working capital reduced in all businesses

August 1, 2012 Q2 2012 – Henkel Analyst & Investor Conference Call28
Net Debt* Developmentin m€
Net debt with slight increase vs. Q1/2012 due to dividend payment* All figures above are calculated according to adapted net debt definition, now also including marketable securities and time deposits.
1,2691,1591,392
1,570
1,959
Q3/2011 Q4/2011Q2/2011 Q1/2012 Q2/2012
-690 m€

August 1, 2012 Q2 2012 – Henkel Analyst & Investor Conference Call29
Cash Flow Generation
1,269
330
444
Q2/2012
+195135Free cash flow
Net debt
Cash flow from operating activities
in m€
1,959
273
Q2/2011
-690
+171
Change
Continued strong cash flow generation& disciplined net debt reduction

August 1, 2012 Q2 2012 – Henkel Analyst & Investor Conference Call30
Agenda
Key Developments Q2 2012
Financials Q2 2012
Outlook FY 2012

August 1, 2012 Q2 2012 – Henkel Analyst & Investor Conference Call31
Summary Q2/2012
• Continued positive development despite ongoing macro-economic challenges
• Successful performance driven by Emerging Markets, supported by Mature Markets
• All financial KPIs on track to reach FY guidance
• Adj. EBIT margin at 14.5% for total Henkel (H1: 14.1%)
• Active portfolio management continued
• Continuous adaptation of structures to market
Fully committed to reach 2012 targets

August 1, 2012 Q2 2012 – Henkel Analyst & Investor Conference Call32
Guidance FY 2012 (updated)*
3-5%Organic sales growth
Adhesive Technologies
Cosmetics/ Toiletries
Laundry & Home Care
mid single-digitlow single-digitlow single-digit
~15%Adjusted EPS growth
14%Adjusted EBIT margin
Confirmed guidance for financial targets 2012
previously: 10%
* Please also see backup chart for guidance on additional KPIs (updated).

August 1, 2012 Q2 2012 – Henkel Analyst & Investor Conference Call33
Well Prepared for 2012 and Beyond
Very confident to reach 2012 targets
2008
Shift to Emerging Markets / Strong Mature MarketsShift to Emerging Markets / Strong Mature Markets
2012
Shared ServicesShared Services
Optimization of Manufacturing FootprintOptimization of Manufacturing Footprint
Strengthening of Top Brands / Reduction of BrandsStrengthening of Top Brands / Reduction of Brands
New Vision & ValuesNew Vision & Values
New Sustainability StrategyNew Sustainability Strategy
Talent Management / Development Round TableTalent Management / Development Round Table
Strategy, targets beyond 2012Strategy, targets beyond 2012

August 1, 2012 Q2 2012 – Henkel Analyst & Investor Conference Call34
Upcoming Events
• Investor Day Laundry & Home Care Sep 4, 2012, Düsseldorf
• Publication Q3 results Nov 16, 2012, London• Q3 financials• Strategy, targets beyond 2012

Thank you!

August 1, 2012 Q2 2012 – Henkel Analyst & Investor Conference Call36
Additional information: Backup

August 1, 2012 Q2 2012 – Henkel Analyst & Investor Conference Call37
Further FY 2012 Guidance for Selected KPIs (updated)
• Direct materials increase oflow single-digit percentage
• Restructuring charges ~100m€
• CAPEX on PPE slightly above 400m€
previously:mid single-digit


![Analyst Call Q2 FY2016 [Read-Only] - Jyothy Laboratoriesjyothylaboratories.com/admin/docs/Analyst Call Q2 FY2016.pdf · Q2 Volume Growth H1 Volume Growth 10% Value *Market Growth](https://img.pdfslide.net/doc/110x75/5f04e4af7e708231d4103c6e/analyst-call-q2-fy2016-read-only-jyothy-laboratori-call-q2-fy2016pdf-q2-volume.jpg)


![Investor and Analyst Q2 FY16 - Conference Call [Company Update]](https://img.pdfslide.net/doc/110x75/577ca7411a28abea748c4ee2/investor-and-analyst-q2-fy16-conference-call-company-update.jpg)
![Q2 FY16 Analyst Presentation [Company Update]](https://img.pdfslide.net/doc/110x75/577ca7ae1a28abea748c8364/q2-fy16-analyst-presentation-company-update.jpg)


![Analyst Presentation (Q2 FY2015-16) [Company Update]](https://img.pdfslide.net/doc/110x75/577ca7931a28abea748c763a/analyst-presentation-q2-fy2015-16-company-update.jpg)