Embed Size (px)
Citation preview
CEO Einar Wathne CFO Brent Baumbusch
Interim Financial Presentation Q2 2015
EWOS Group AS is providing the following consolidated financial results for the second quarter of 2015 to holders of its NOK 1,040,000,000 Senior Subordinated Floating Rate Notes due 2021, and, on behalf of EWOS Holding AS to holders of its EUR 225,000,000 6.75% Senior Secured Notes due 2020 and NOK 1,810,000,000 Senior Secured Floating Rate Notes due 2020.
This report is for information purposes only and does not constitute an offer to sell or the solicitation of an offer to buy the notes or any other security.
This report may include forward-looking statements which are based on our current expectations and projections about future events. By their nature, forward-looking statements involve known and unknown risks and uncertainties because they relate to events and depend on circumstances that may or may not occur in the future. Forward-looking statements are not guarantees of future performance. You should not place undue reliance on these forward-looking statements. In addition any forward-looking statements are made only as of the date of this notice, and we do not intend and do not assume any obligation to update any statements set forth in this notice.
2
Disclaimer
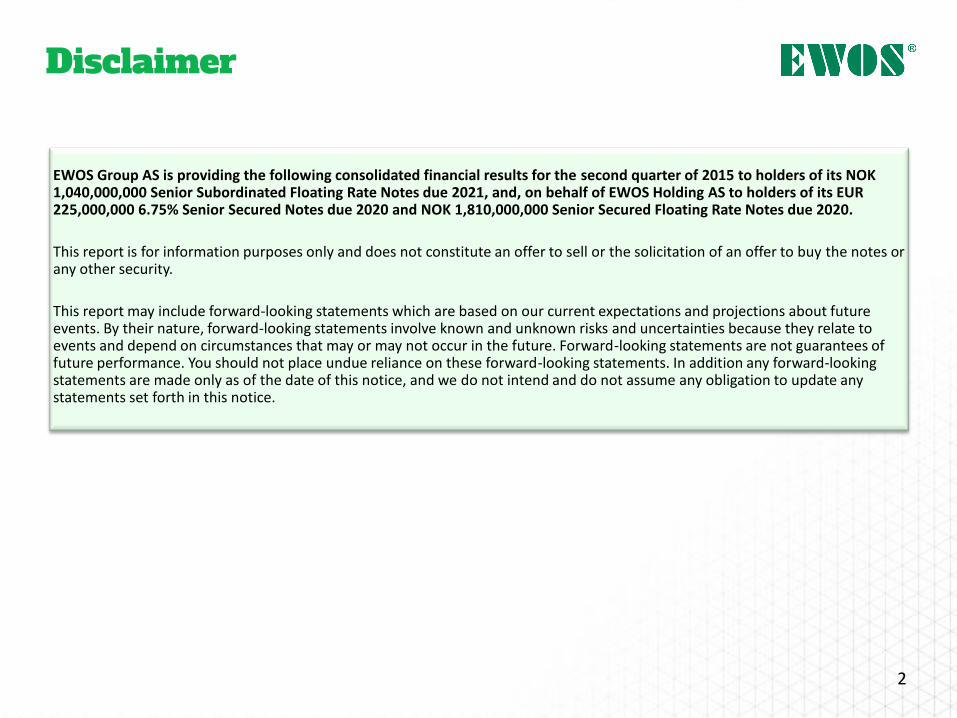
If not explicitly mentioned otherwise, the financial information contained herein relates to the unaudited financial information on a consolidated basis at EWOS Group AS level for the second quarter of 2015 compared to the second quarter of 2014 and the first half year of 2015 compared to the first half year of 2014.
On October 22, 2014 Albain Holdco Norway AS, through a directly owned subsidiary other than EWOS Group AS, completed the acquisition of the Chilean fish farming company Nova Austral. This acquisition is made outside of the listed bond group, and Nova Austral’s operation is not consolidated into the financial reporting of either the EWOS Group or EWOS Holding, the two companies with listed bonds on either the Oslo Stock Exchange or the Irish Stock Exchange.
For further information, please refer to the Annual Reports 2014 as published on www.reporting.ewos.com
On August 16, 2015 Albain Holdco Norway AS entered into an agreement with Cargill Incorporated to sell all of its shares in EWOS Group AS. The transaction, which is subject to regulatory approvals, is expected to close before the end of the calendar year and is reflected by disclosure information only in the financial reporting as of June 30, 2015.
3
Basis of preparation
• Satisfactory results despite lower volumes in second quarter compared to last year due to temporary low share in Norway
• 7% increase in revenues and 5% increase in Adjusted EBITDA, with strong currency impact
• Blueprint strategy execution under way
– Continued good outcomes for customers using EWOS’s health and performance feed
– Progress on operational efficiency, particularly in freight cost in Norway
– Improvement in technical quality
– Good progress on investments in Vietnam, Canada and Chile
4
Satisfactory results in second quarter
• Leading, world-class fish and shrimp nutrition capability
• Footprint in the world’s most critical aquaculture markets
• Depth in R&D, technology and manufacturing expertise
• High focus on creating success for our customers and employees
• Strong values-driven culture
• Commitment to sustainability
5
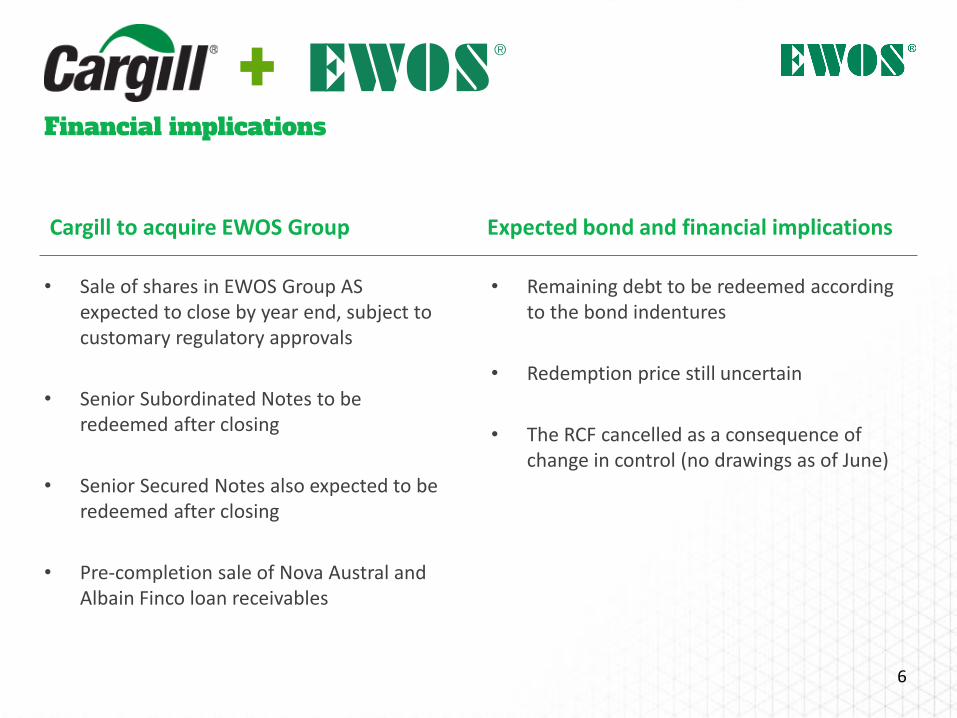
Cargill to acquire EWOS Group
• Sale of shares in EWOS Group AS expected to close by year end, subject to customary regulatory approvals
• Senior Subordinated Notes to be redeemed after closing
• Senior Secured Notes also expected to be redeemed after closing
• Pre-completion sale of Nova Austral and Albain Finco loan receivables
• Remaining debt to be redeemed according to the bond indentures
• Redemption price still uncertain
• The RCF cancelled as a consequence of change in control (no drawings as of June)
Expected bond and financial implications
Financial implications
6
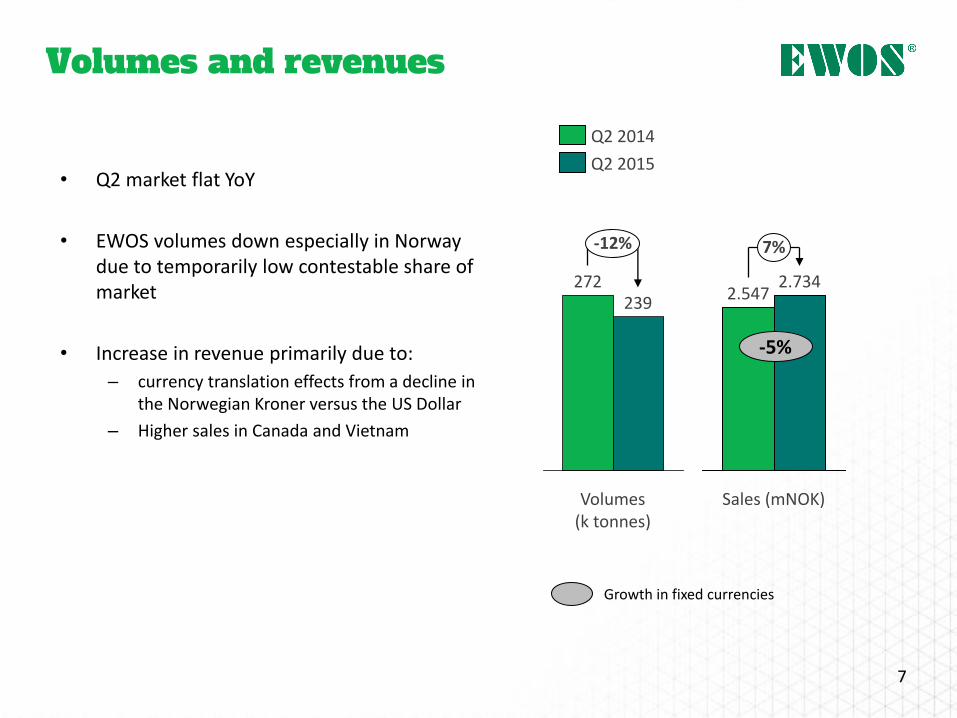
Volumes and revenues
• Q2 market flat YoY
• EWOS volumes down especially in Norway due to temporarily low contestable share of market
• Increase in revenue primarily due to:
– currency translation effects from a decline in the Norwegian Kroner versus the US Dollar
– Higher sales in Canada and Vietnam
Growth in fixed currencies
2.734 2.547
7%
Sales (mNOK)
-5%
-12%
239
Volumes (k tonnes)
272
Q2 2014
Q2 2015
7
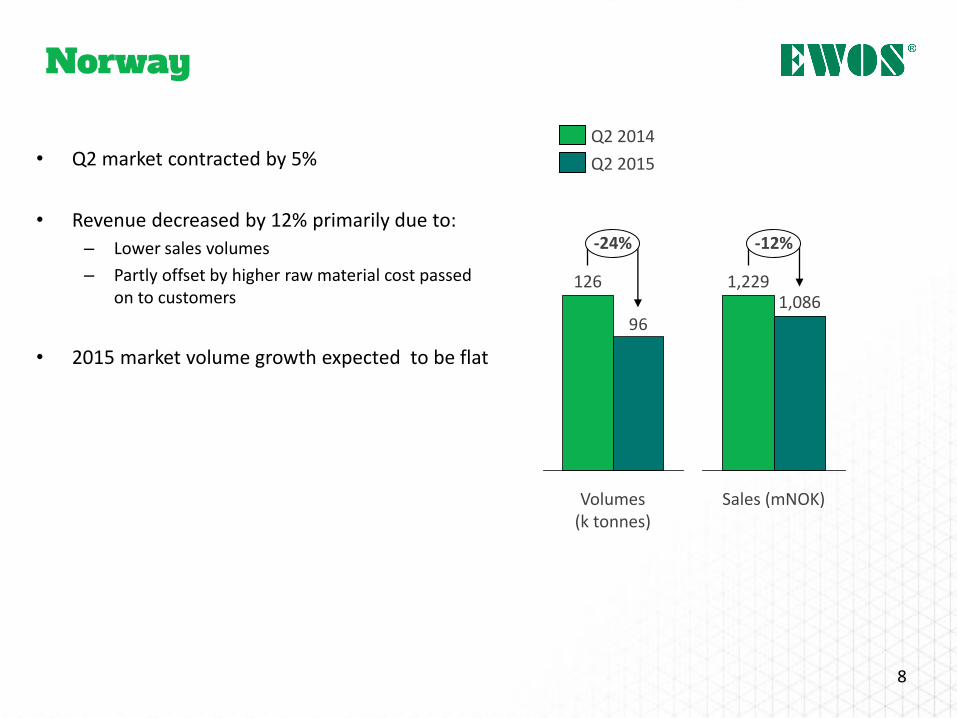
Norway
• Q2 market contracted by 5%
• Revenue decreased by 12% primarily due to:
– Lower sales volumes
– Partly offset by higher raw material cost passed on to customers
• 2015 market volume growth expected to be flat
-12%
Sales (mNOK)
1,086 1,229
96
-24%
Volumes (k tonnes)
126
8
Q2 2014
Q2 2015
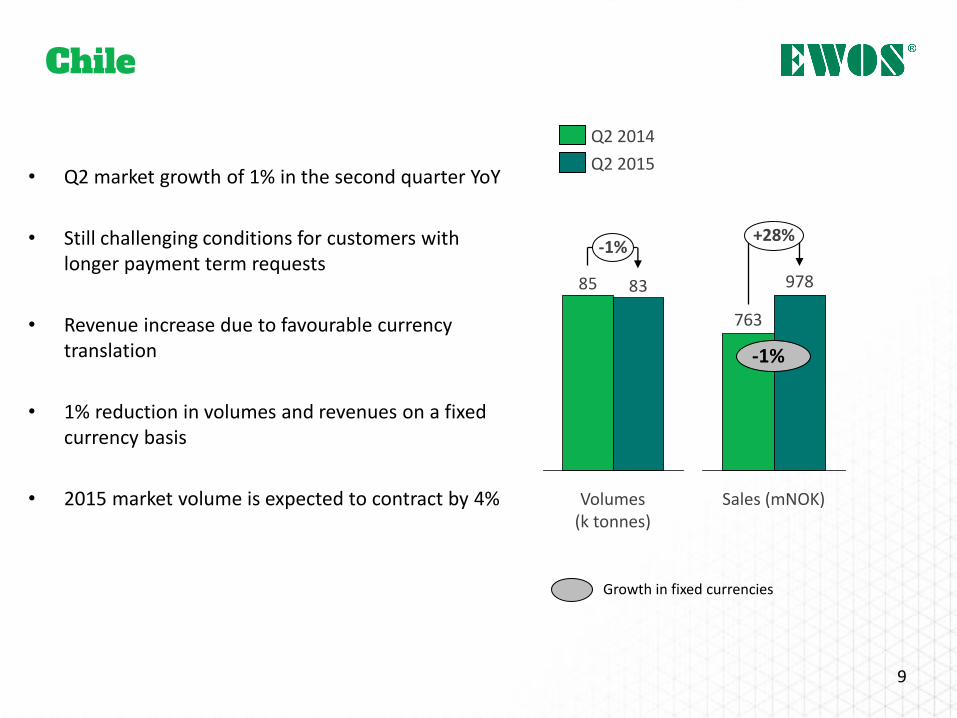
978
+28%
763
Sales (mNOK)
Chile
• Q2 market growth of 1% in the second quarter YoY
• Still challenging conditions for customers with longer payment term requests
• Revenue increase due to favourable currency translation
• 1% reduction in volumes and revenues on a fixed currency basis
• 2015 market volume is expected to contract by 4%
-1%
Growth in fixed currencies
85 83
-1%
Volumes (k tonnes)
9
Q2 2014
Q2 2015
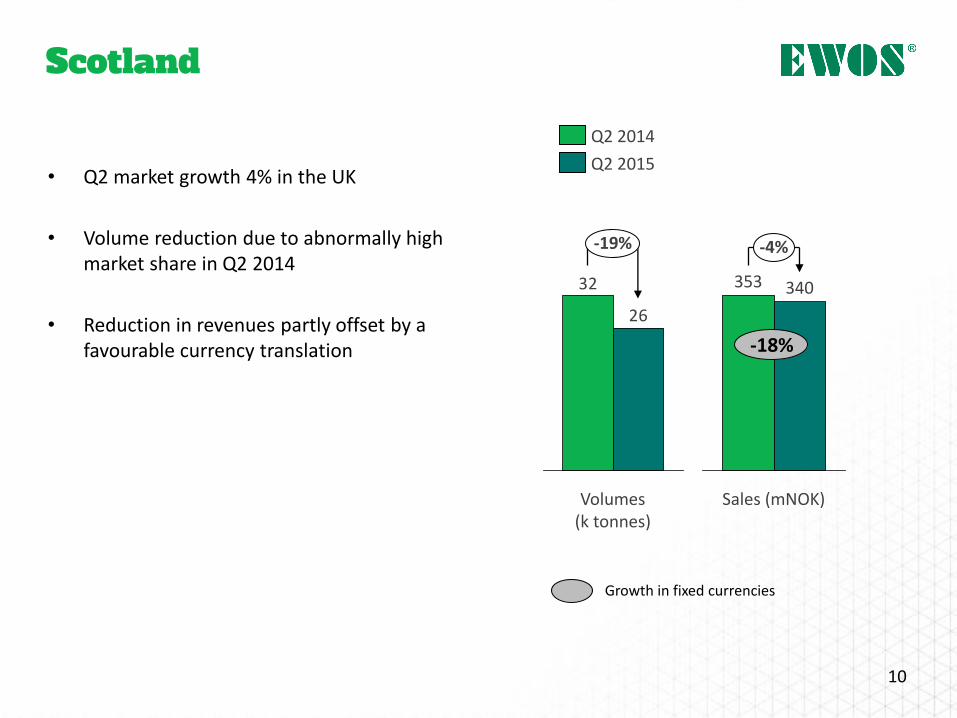
Sales (mNOK)
340 353
-4%
Scotland
• Q2 market growth 4% in the UK
• Volume reduction due to abnormally high market share in Q2 2014
• Reduction in revenues partly offset by a favourable currency translation
Growth in fixed currencies
-18%
32
26
-19%
Volumes (k tonnes)
10
Q2 2014
Q2 2015
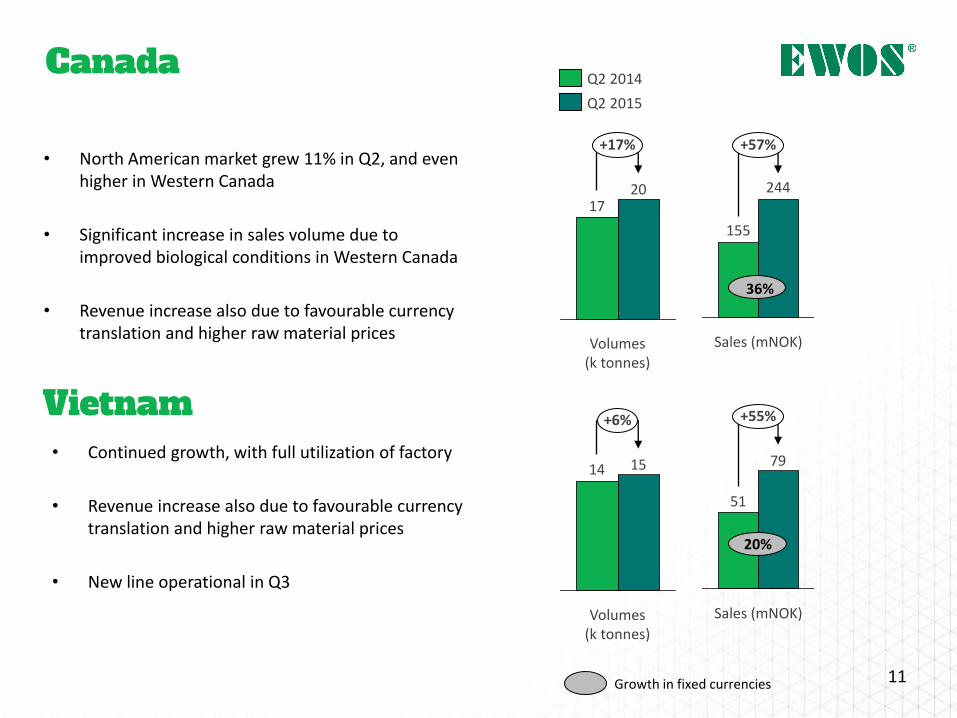
51
79
+55%
Sales (mNOK)
155
244
+57%
Sales (mNOK)
Canada
• North American market grew 11% in Q2, and even higher in Western Canada
• Significant increase in sales volume due to improved biological conditions in Western Canada
• Revenue increase also due to favourable currency translation and higher raw material prices
36%
Growth in fixed currencies
Vietnam • Continued growth, with full utilization of factory
• Revenue increase also due to favourable currency translation and higher raw material prices
• New line operational in Q3
1720
Volumes (k tonnes)
+17%
Q2 2015
Q2 2014
14 15
Volumes (k tonnes)
+6%
20%
11
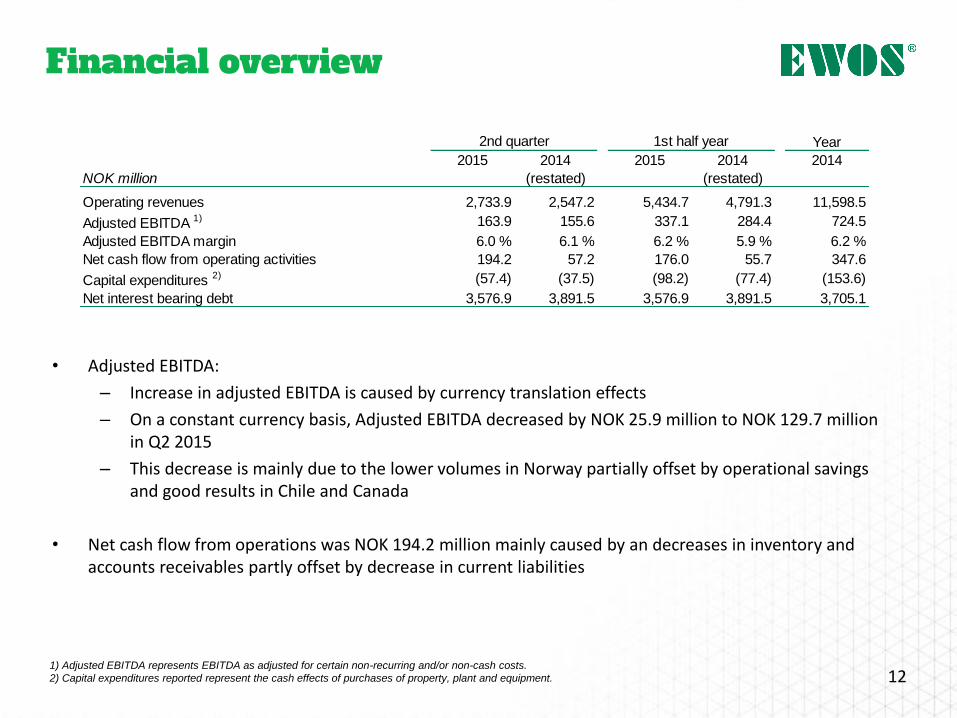
1) Adjusted EBITDA represents EBITDA as adjusted for certain non-recurring and/or non-cash costs.
2) Capital expenditures reported represent the cash effects of purchases of property, plant and equipment.
• Adjusted EBITDA:
– Increase in adjusted EBITDA is caused by currency translation effects
– On a constant currency basis, Adjusted EBITDA decreased by NOK 25.9 million to NOK 129.7 million in Q2 2015
– This decrease is mainly due to the lower volumes in Norway partially offset by operational savings and good results in Chile and Canada
• Net cash flow from operations was NOK 194.2 million mainly caused by an decreases in inventory and accounts receivables partly offset by decrease in current liabilities
12
Financial overview
Year
2015 2014 2015 2014 2014
NOK million (restated) (restated)
Operating revenues 2,733.9 2,547.2 5,434.7 4,791.3 11,598.5
Adjusted EBITDA 1) 163.9 155.6 337.1 284.4 724.5
Adjusted EBITDA margin 6.0 % 6.1 % 6.2 % 5.9 % 6.2 %
Net cash flow from operating activities 194.2 57.2 176.0 55.7 347.6
Capital expenditures 2) (57.4) (37.5) (98.2) (77.4) (153.6)
Net interest bearing debt 3,576.9 3,891.5 3,576.9 3,891.5 3,705.1
2nd quarter 1st half year
13
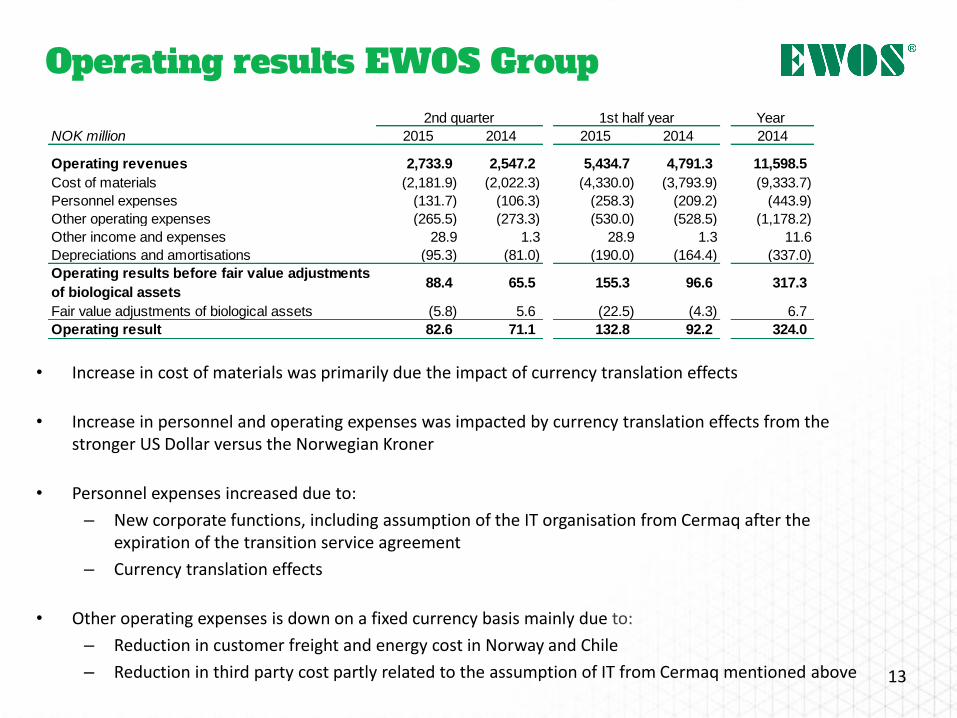
Operating results EWOS Group
• Increase in cost of materials was primarily due the impact of currency translation effects
• Increase in personnel and operating expenses was impacted by currency translation effects from the stronger US Dollar versus the Norwegian Kroner
• Personnel expenses increased due to:
– New corporate functions, including assumption of the IT organisation from Cermaq after the expiration of the transition service agreement
– Currency translation effects
• Other operating expenses is down on a fixed currency basis mainly due to:
– Reduction in customer freight and energy cost in Norway and Chile
– Reduction in third party cost partly related to the assumption of IT from Cermaq mentioned above
Year
NOK million 2015 2014 2015 2014 2014
Operating revenues 2,733.9 2,547.2 5,434.7 4,791.3 11,598.5
Cost of materials (2,181.9) (2,022.3) (4,330.0) (3,793.9) (9,333.7)
Personnel expenses (131.7) (106.3) (258.3) (209.2) (443.9)
Other operating expenses (265.5) (273.3) (530.0) (528.5) (1,178.2)
Other income and expenses 28.9 1.3 28.9 1.3 11.6
Depreciations and amortisations (95.3) (81.0) (190.0) (164.4) (337.0)
Operating results before fair value adjustments
of biological assets 88.4 65.5 155.3 96.6 317.3
Fair value adjustments of biological assets (5.8) 5.6 (22.5) (4.3) 6.7
Operating result 82.6 71.1 132.8 92.2 324.0
2nd quarter 1st half year
14
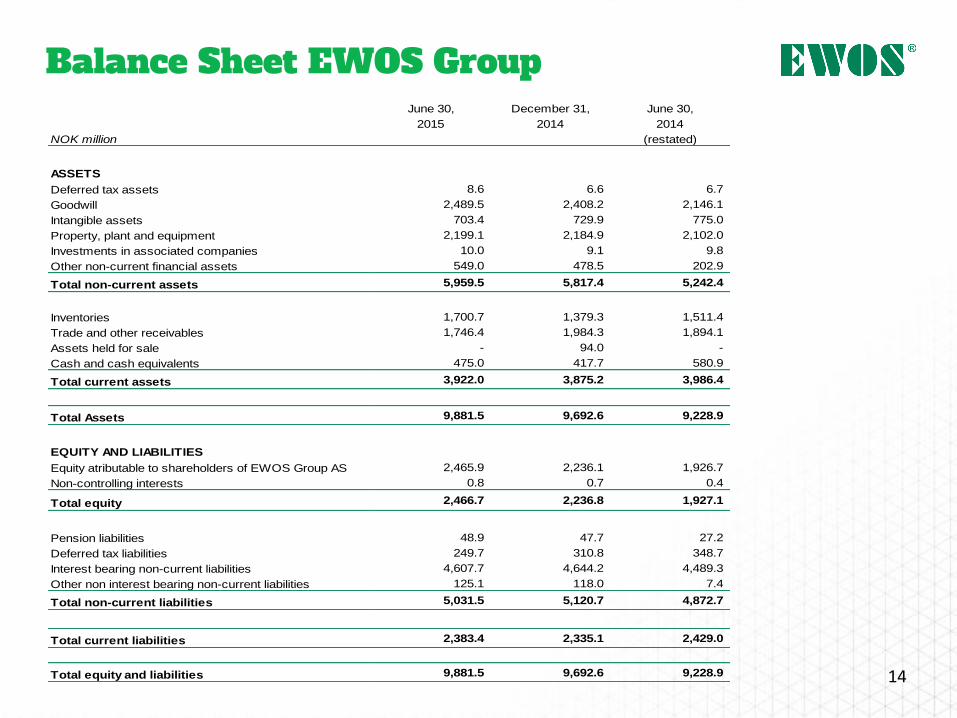
Balance Sheet EWOS Group June 30, December 31, June 30,
2015 2014 2014
NOK million (restated)
ASSETS
Deferred tax assets 8.6 6.6 6.7
Goodwill 2,489.5 2,408.2 2,146.1
Intangible assets 703.4 729.9 775.0
Property, plant and equipment 2,199.1 2,184.9 2,102.0
Investments in associated companies 10.0 9.1 9.8
Other non-current financial assets 549.0 478.5 202.9
Total non-current assets 5,959.5 5,817.4 5,242.4
Inventories 1,700.7 1,379.3 1,511.4
Trade and other receivables 1,746.4 1,984.3 1,894.1
Assets held for sale - 94.0 -
Cash and cash equivalents 475.0 417.7 580.9
Total current assets 3,922.0 3,875.2 3,986.4
Total Assets 9,881.5 9,692.6 9,228.9
EQUITY AND LIABILITIES
Equity atributable to shareholders of EWOS Group AS 2,465.9 2,236.1 1,926.7
Non-controlling interests 0.8 0.7 0.4
Total equity 2,466.7 2,236.8 1,927.1
Pension liabilities 48.9 47.7 27.2
Deferred tax liabilities 249.7 310.8 348.7
Interest bearing non-current liabilities 4,607.7 4,644.2 4,489.3
Other non interest bearing non-current liabilities 125.1 118.0 7.4
Total non-current liabilities 5,031.5 5,120.7 4,872.7
Total current liabilities 2,383.4 2,335.1 2,429.0
Total equity and liabilities 9,881.5 9,692.6 9,228.9
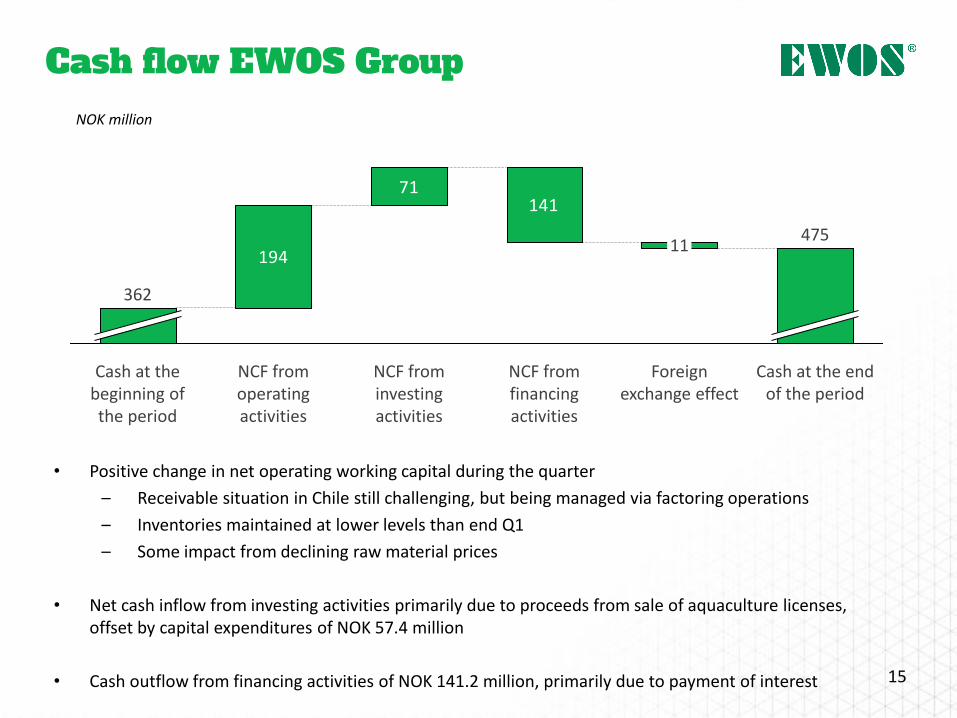
• Positive change in net operating working capital during the quarter
– Receivable situation in Chile still challenging, but being managed via factoring operations
– Inventories maintained at lower levels than end Q1
– Some impact from declining raw material prices
• Net cash inflow from investing activities primarily due to proceeds from sale of aquaculture licenses, offset by capital expenditures of NOK 57.4 million
• Cash outflow from financing activities of NOK 141.2 million, primarily due to payment of interest 15
Cash flow EWOS Group
194
71141
475
Cash at the end of the period
Foreign exchange effect
11
Cash at the beginning of the period
362
NCF from financing activities
NCF from investing activities
NCF from operating activities
NOK million
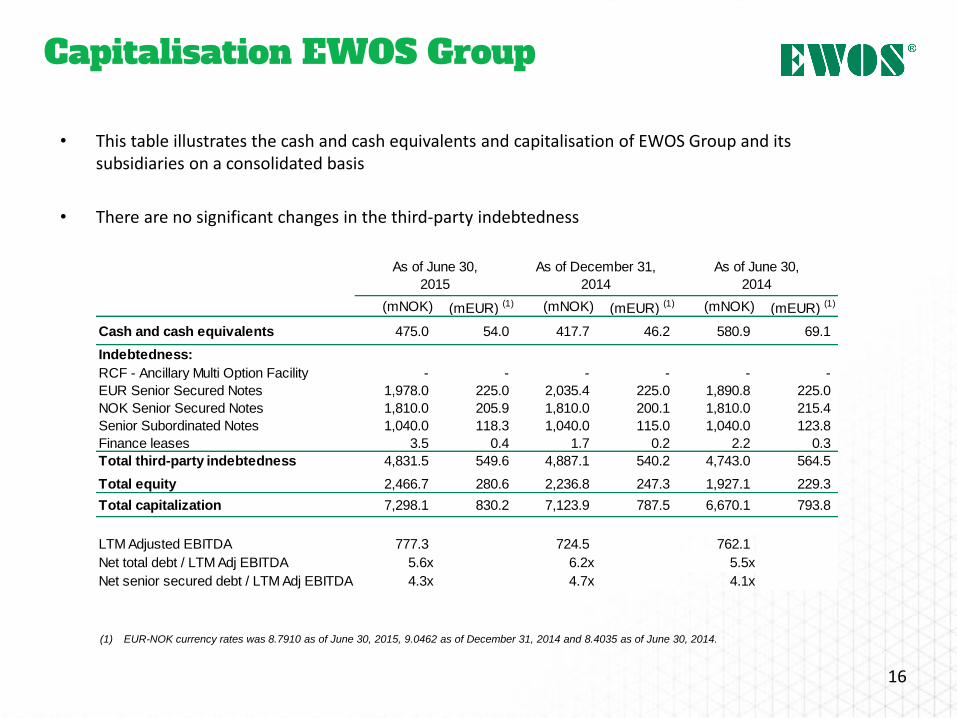
• This table illustrates the cash and cash equivalents and capitalisation of EWOS Group and its subsidiaries on a consolidated basis
• There are no significant changes in the third-party indebtedness
16
Capitalisation EWOS Group
(1) EUR-NOK currency rates was 8.7910 as of June 30, 2015, 9.0462 as of December 31, 2014 and 8.4035 as of June 30, 2014.
(mNOK) (mEUR) (1) (mNOK) (mEUR) (1) (mNOK) (mEUR) (1)
Cash and cash equivalents 475.0 54.0 417.7 46.2 580.9 69.1
Indebtedness:
RCF - Ancillary Multi Option Facility - - - - - -
EUR Senior Secured Notes 1,978.0 225.0 2,035.4 225.0 1,890.8 225.0
NOK Senior Secured Notes 1,810.0 205.9 1,810.0 200.1 1,810.0 215.4
Senior Subordinated Notes 1,040.0 118.3 1,040.0 115.0 1,040.0 123.8
Finance leases 3.5 0.4 1.7 0.2 2.2 0.3
Total third-party indebtedness 4,831.5 549.6 4,887.1 540.2 4,743.0 564.5
Total equity 2,466.7 280.6 2,236.8 247.3 1,927.1 229.3
Total capitalization 7,298.1 830.2 7,123.9 787.5 6,670.1 793.8
LTM Adjusted EBITDA 777.3 724.5 762.1
Net total debt / LTM Adj EBITDA 5.6x 6.2x 5.5x
Net senior secured debt / LTM Adj EBITDA 4.3x 4.7x 4.1x
As of June 30,
2014
As of December 31,
2014
As of June 30,
2015