Embed Size (px)
Citation preview

Your Aquaculture Technology and Service Partner
Q2 2015 PresentationOslo - August 20th, 2015
Trond Williksen, CEOEirik Børve Monsen, CFO

Your Aquaculture Technology and Service Partner
Agenda
Highlights
Financial performance
Outlook
1
2
3
Q&A4

Your Aquaculture Technology and Service Partner3
Highlights Q2 2015 - by CEO Trond Williksen

Your Aquaculture Technology and Service Partner
Best quarter & best first half ever – improved performance and growth continues
4
• Best Q2 and best Q ever
• All business segments and regions with good performance and positive development
• Chile – good profitability in Q2 – well underway in adjusting for challenges ahead
• Land based profitable and in positive development
• Possible strategic M&A on land based technology – LOI signed with Aquatec Solutions A/S. Transaction subject to due diligence and final SPA
• High market activity resulting in the best order backlog after a second quarter ever – 493 MNOK
YTD 2015 – Highlights
• Best First Half ever – growth in revenues and earnings
• Strong financial position
Second Quarter 2015 – Highlights

Your Aquaculture Technology and Service Partner
301
402
2Q13 3Q13 4Q13 1Q14 2Q14 3Q14 4Q14 1Q15 2Q15
MN
OK
Revenue
24
41
2Q13 3Q13 4Q13 1Q14 2Q14 3Q14 4Q14 1Q15 2Q15
MN
OK
EBITDA
Best quarter & best first half ever – improved performance and growth continues
5
+70%
+33%

Your Aquaculture Technology and Service Partner
Best quarter & best first half ever – improved performance and growth continues
6
+7%+3%
478 493
2Q13 3Q13 4Q13 1Q14 2Q14 3Q14 4Q14 1Q15 2Q15
MN
OK
Order Backlog
327 348
2Q13 3Q13 4Q13 1Q14 2Q14 3Q14 4Q14 1Q15 2Q15
MN
OK
Order Inflow

Your Aquaculture Technology and Service Partner
AKVA group – uniquely positioned for further growth
• The most recognized brand in aquaculture technology
• Leading technology solutions and service partner to the global aquaculture industry
• Global presence -subsidiaries in 8 countries
• 701 employees
• Market cap of NOK ~700m and net debt of NOK 76m

Your Aquaculture Technology and Service Partner
Presence in all main farming regions
Map of activities Revenue per region, Q2 2015
Nordic
Americas
Export
Nordic68 %
Americas18 %
Export14 %

Your Aquaculture Technology and Service Partner
Strategic priority to increase the proportion of recurring revenue
Technology sale vs recurring revenue, Q2 2015 Comments
• Aim of increasing relative share of recurring revenue through software and services – by developing software, farming services, technology services and rental further
• Introduction of rental business model in Norway in Q4 2014. Already successfully introduced in UK and Canada.
• First installations of rental equipment in Norway done in 1H 2015
• Rental is an “all inclusive” service providing for instance light or picture for an agreed period of time (2 to 5 years duration) -reducing CAPEX and reducing operational work for the customer
• Acquisition of YesMaritime in 2014, a provider of diving, ROV and other services to the salmon farming sector (Farming services)
• Development of Farming Services still in an early stage –opportunity for consolidation

Your Aquaculture Technology and Service Partner
Revenue by product groups and species
10
Cage based technologies = Cages, barges, feed systems and other operational systems for cage based aquaculture
Software = Software and software systems
Land based technologies = Recirculation systems and technologies for land based aquaculture
By product groups – Q2 2015 By species – Q2 2015
Salmon = Revenue from technology and services sold to production of salmon
Other species = Revenue from technology and services sold to production of other species than salmon
Non Seafood = Revenue from technology and services sold non seafood customers
Cage based78 %
Software8 %
Land based14 %
Salmon80 %
Other Species
10 %
Non Seafood
10 %
Your Aquaculture Technology and Service Partner
New product launches during AQUA NOR
11
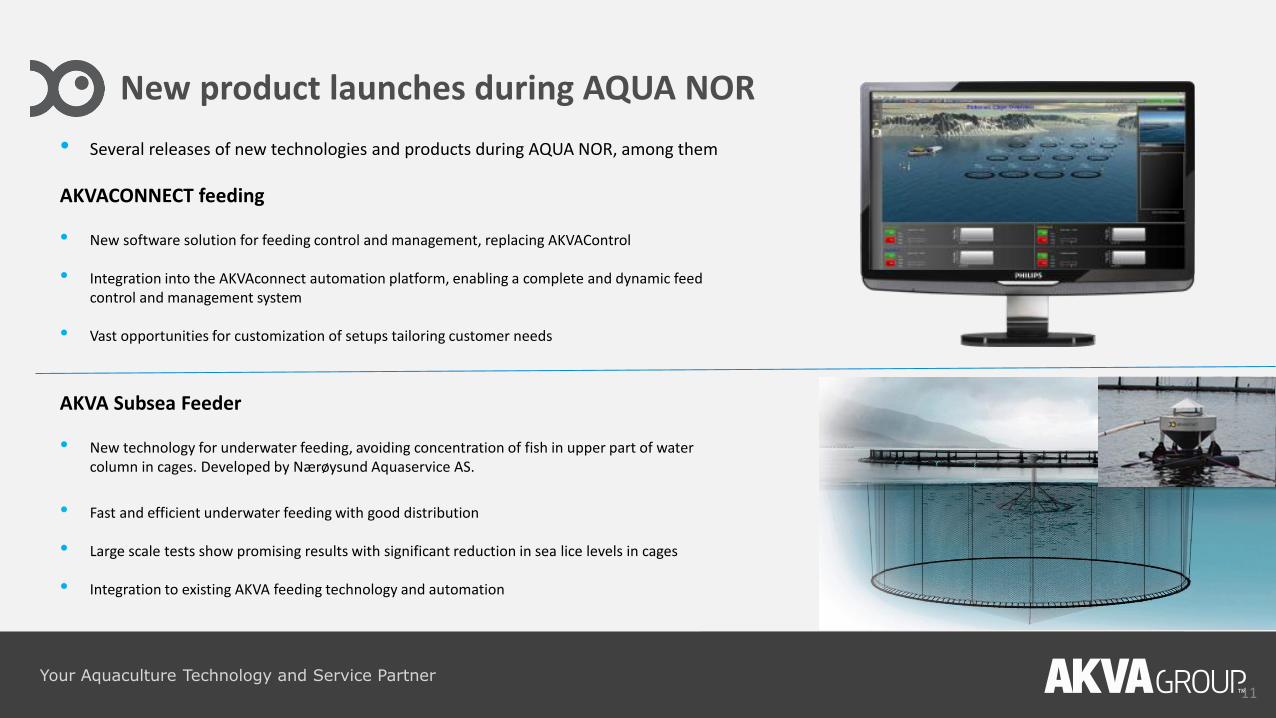
• Several releases of new technologies and products during AQUA NOR, among them
AKVACONNECT feeding
• New software solution for feeding control and management, replacing AKVAControl
• Integration into the AKVAconnect automation platform, enabling a complete and dynamic feed control and management system
• Vast opportunities for customization of setups tailoring customer needs
AKVA Subsea Feeder
• New technology for underwater feeding, avoiding concentration of fish in upper part of water column in cages. Developed by Nærøysund Aquaservice AS.
• Fast and efficient underwater feeding with good distribution
• Large scale tests show promising results with significant reduction in sea lice levels in cages
• Integration to existing AKVA feeding technology and automation

Your Aquaculture Technology and Service Partner12
Financial performance Q2 2015 – by CFO Eirik Børve Monsen

Your Aquaculture Technology and Service Partner
Q2 2015 - Financial highlights
13
• Good overall financial performance – taking advantage of the diversified operations
• Reducing cost / exposure in Chile again
• Strong balance sheet maintained - with improved working capital level
Revenue
-
50
100
150
200
250
300
350
400
450
1Q 2Q 3Q 4Q
2012
2013
2014
2015
MNOK

Your Aquaculture Technology and Service Partner
Q2 2015 - Financial highlights, continued
14
EBITDA EBITDA %
• Stabilizing on a historical higher EBITDA-level both in NOK and in %
• Medium term target of 10% EBITDA still valid
- 10
- 5
-
5
10
15
20
25
30
35
40
45
1Q 2Q 3Q 4Q
2012
2013
2014
2015
MNOK
-4%
-2%
0%
2%
4%
6%
8%
10%
12%
1Q 2Q 3Q 4Q
2012
2013
2014
2015
MNOK

Your Aquaculture Technology and Service Partner
160195
47
6632
54
238
315
8,5 %
10,4 %
5%
7%
9%
11%
13%
15%
17%
0
50
100
150
200
250
300
350
2014 Q2 2015 Q2
CBT (Revenue & EBITDA %)
Nordic Americas Export EBITDA %
Cage Based Technologies
15
Nordic● Good first half 2015
● Slightly different product mix compared to 2014. A wider range of products contribute to revenue and profit in 2015 vs 2014.
● Good order backlog
Americas● Strong H1 in Chile - the positive development in this market
continued in Q2.
● Number of employees / cost base is reduced in Q2 to be prepared for expected reduced market activity in the second half of 2015
● Canada continues the good performance in Q2 with the best 1H ever with a high order backlog
Export● UK continues the good performance in Q2 with the best 1H ever
with a high order backlog
● Turkey had a very good Q2 and 1H
● Low activity in Export to emerging markets YoY

Your Aquaculture Technology and Service Partner
Software
16
● AKVA group Software AS continues to deliver stable and high margins – with improved revenue and margins YoY
● Wise lausnir ehf had a good first half 2015 –with improved performance YoY
● Software continues to invest in new product modules, which is expected to strengthen the financial performance of the SW segment further
2024
5
60
1
26
31
12,9 %
15,4 %
7%
9%
11%
13%
15%
17%
0
5
10
15
20
25
30
35
2014 Q2 2015 Q2
SW (Revenue & EBITDA %)
Nordic Americas Export EBITDA %

Your Aquaculture Technology and Service Partner
Land Based Technologies
17
35
54
1
2
37
55
1,2 %
6,1 %
-6%
4%
14%
24%
0
10
20
30
40
50
60
2014 Q2 2015 Q2
LBT (Revenue & EBITDA %)
Nordic Americas EBITDA %
● Improved performance YoY and QoQ
● Good recovery in Q2 for AKVA group Denmark A/S after a slow start of the year in Q1. Continued good order backlog
● Plastsveis AS on track with profitable first half and a good order backlog

Your Aquaculture Technology and Service Partner
Financials – Detailed P & L
18
• Low interest cost due to low net debt and low interest rate
• Mainly currency – considered as an acceptable level
• Minority shareholders (30%) in Plastsveis AS
P&L 2015 2014 2015 2014 2014
(MNOK) Q2 Q2 YTD YTD Total
OPERATING REVENUES 401,5 300,9 726,5 611,3 1 246,1
Operating costs ex depreciations 360,7 276,9 659,1 555,6 1 142,7 EBITDA 40,9 24,0 67,5 55,8 103,4
Depreciation 10,8 8,9 21,3 17,2 35,7
EBIT 30,1 15,1 46,2 38,6 67,6
Net interest expense -1,5 -1,4 -2,8 -2,9 -4,8
Other financial items -1,5 0,8 -0,0 -0,6 0,0 Net financial items -3,0 -0,6 -2,8 -3,5 -4,7
EBT 27,0 14,6 43,4 35,1 62,9 Taxes 7,5 2,5 12,4 7,5 8,4
NET PROFIT 19,5 12,0 30,9 27,7 54,5
Net profit (loss) attributable to:Non-controlling interests 0,4 -0,2 0,5 -0,1 -0,6
Equity holders of AKVA group ASA 19,1 12,2 30,4 27,7 55,1
Revenue growth 33,4 % 11,4 % 18,8 % 24,2 % 35,6 %
EBITDA margin 10,2 % 8,0 % 9,3 % 9,1 % 8,3 %
EPS (NOK) 0,74 0,47 1,18 1,07 2,13

Your Aquaculture Technology and Service Partner
8,3 %
15,2 %14,1 %
12,3 %
15,2 %
Q2 - 2014 Q3 - 2014 Q4 - 2014 Q1 - 2015 Q2 - 2015
86 68
96
153 144
183
144 147 157
2Q13 3Q13 4Q13 1Q14 2Q14 3Q14 4Q14 1Q15 2Q15
MN
OK
Group financial profile – remains strongAvailable cash ROCE
+13 MNOK+6.9 percentage points
Your Aquaculture Technology and Service Partner
136 129 137 145
15,7 %
12,4 %
10,8 % 10,4 %
0 %
2 %
4 %
6 %
8 %
10 %
12 %
14 %
16 %
18 %
20 %
0
20
40
60
80
100
120
140
160
2Q
13
3Q
13
4Q
13
1Q
14
2Q
14
3Q
14
4Q
14
1Q
15
2Q
15
MN
OK
MNOKMNOKMNOKMNOKMNOKMNOKMNOKMNOKMNOKMNOKMNOKMNOKMNOKMNOKMNOKMNOKMNOKMNOKMNOKMNOKMNOKMNOKMNOKMNOKMNOKMNOKMNOKMNOKMNOKMNOKMNOKMNOKMNOKMNOKMNOKMNOKMNOKMNOKMNOKMNOKMNOKMNOKMNOKMNOKMNOKMNOKMNOKMNOKMNOKMNOKMNOKMNOKMNOKMNOKMNOKMNOKMNOKMNOKMNOKMNOKMNOKMNOKMNOKMNOKMNOKMNOKMNOKMNOK
MNOK
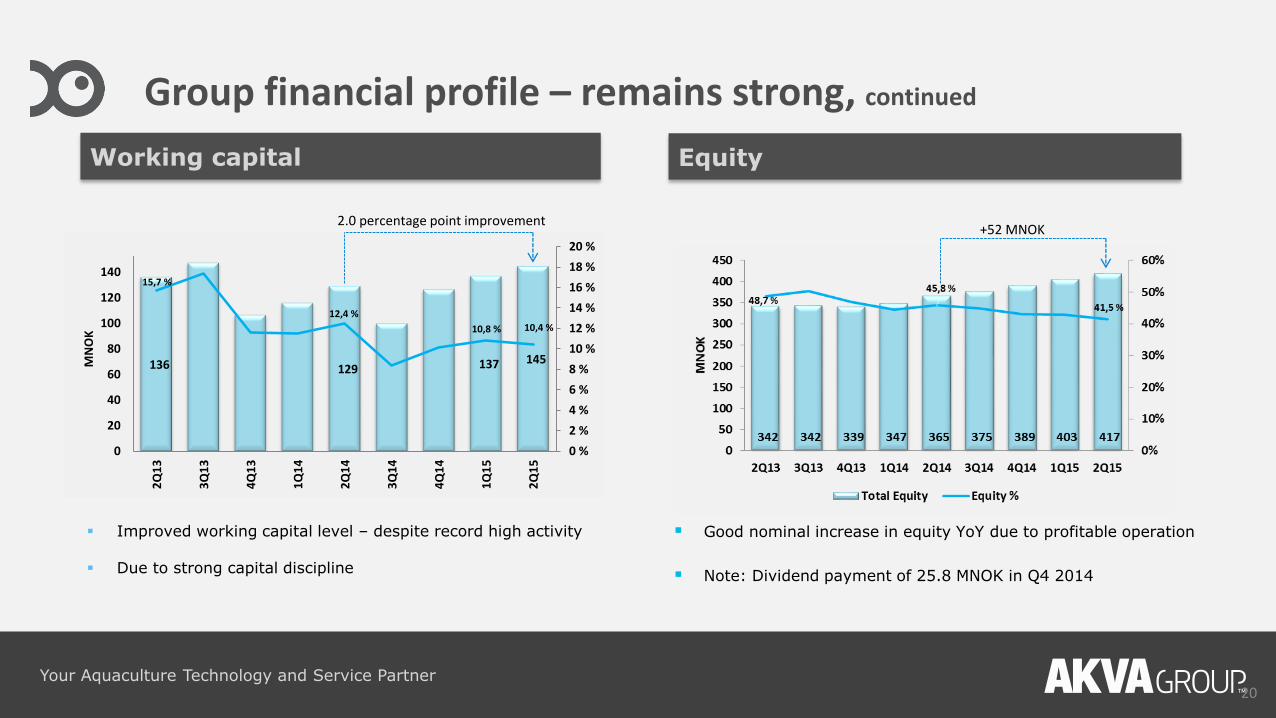
Group financial profile – remains strong, continued
20
Working capital Equity
Good nominal increase in equity YoY due to profitable operation
Note: Dividend payment of 25.8 MNOK in Q4 2014
Improved working capital level – despite record high activity
Due to strong capital discipline
+52 MNOK2.0 percentage point improvement

Your Aquaculture Technology and Service Partner
Net debt/EBITDA of 0.7x
21
Change in net debt (TNOK)Net debt (MNOK) and net debt/EBITDA
• Next possible dividend pay-out will according to the new dividend policy be in Q4
94
108
75 70
92
44
89 82
76
2,4
3,2
1,6
1,0
1,3
0,4
0,9 0,8 0,7
-
1,0
2,0
3,0
4,0
-
30
60
90
120
Q2 - 2013 Q3 - 2013 Q4 - 2013 Q1 - 2014 Q2 - 2014 Q3 - 2014 Q4 - 2014 Q1 - 2015 Q2 - 2015
Net interest bearing debt NIBD/EBITDA(12months rolling)
Net debt 31.03.2015 82 416
EBITDA -40 855
Income taxes paid 3 362
Net interest paid 1 473
Capex paid 16 037
Paid dividend -
Sale of fixed assets -521
Currency effects 2 025
Other changes in working capital 11 858
Net change -6 621
Net debt 30.06.2015 75 795

Your Aquaculture Technology and Service Partner
Balance sheet
22
BALANCE SHEET 2015 2014
(MNOK) 30.06 30.06
ASSETS 1 007 796
Intangible non-current assets 266 263
Tangible non-current assets 83 65
Financial non-current assets 2 2
Inventory 203 129
Receivables 385 283
Cash and cash equivalents 67 54
LIABILITIES AND EQUITY 1 007 796
Equity 415 363
Minority interest 2 2
Long-term interest bearing debt 127 130
Short-term interest bearing debt 16 16
Non-interest bearing liabilities 446 286

Your Aquaculture Technology and Service Partner
CAPEX
23
Capex (TNOK) and capex / sales (%)

Your Aquaculture Technology and Service Partner24
Outlooks – by CEO Trond Williksen

Your Aquaculture Technology and Service Partner
-
100
200
300
400
500
600
1Q 2Q 3Q 4Q
2012
2013
2014
2015
MNOK
Order backlog and inflow
25
Order backlog Order inflow
Highest order inflow and order backlog ever after a second quarter
The good market activity continues
-
50
100
150
200
250
300
350
400
450
500
1Q 2Q 3Q 4Q
2012
2013
2014
2015
MNOK

Your Aquaculture Technology and Service Partner
Maintaining positive outlook
26
● Strong overall short term outlook due to high market activity and order backlog. Our target remains to outperform 2014
● Strong demand in the Nordic market is expected to continue, with shift towards more investment in Land Based Technology
● UK and Canada are expected to continue to perform well in the next quarters with a significant order backlog and a large portion of recurring business
● Low expectations in Chile. Majority of our Chilean customers struggle with loss making operations and a need to restructure the industry. Situation expected to last. We are well underway to adjust our resources, costs and activity level to the situation
● Land based segment is expected to have a positive development with a growing order backlog and prospect mass. There is historically high market interest for land based technology
● Exports to emerging markets will continue to fluctuate short term, but improved project activity is expected in second half of the year
● We continue our effort to build service and after sales as a key business element in all markets and segments
Your Aquaculture Technology and Service Partner27
Q & A

Your Aquaculture Technology and Service Partner