Embed Size (px)
Citation preview
Q2 2015 results
29 July 2015
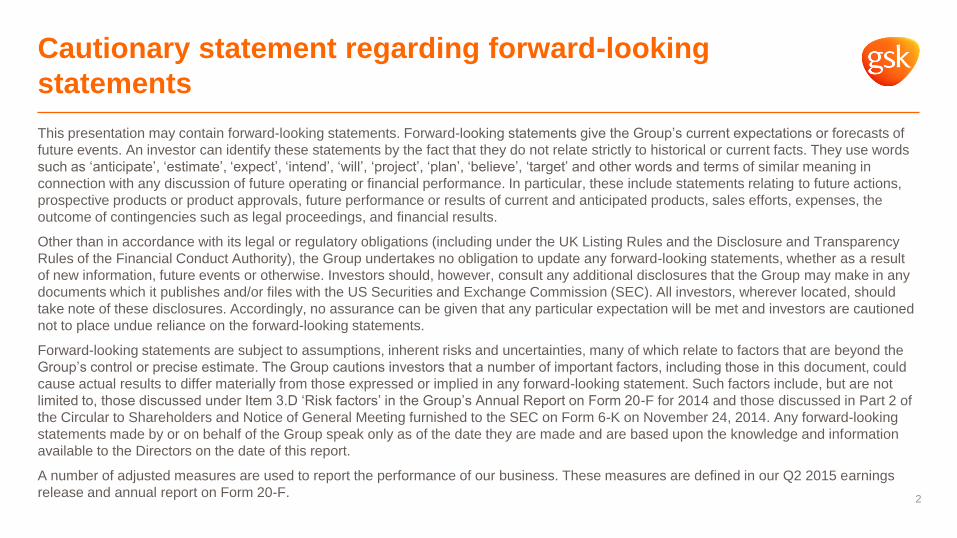
Cautionary statement regarding forward-looking
statements
2
This presentation may contain forward-looking statements. Forward-looking statements give the Group’s current expectations or forecasts of
future events. An investor can identify these statements by the fact that they do not relate strictly to historical or current facts. They use words
such as ‘anticipate’, ‘estimate’, ‘expect’, ‘intend’, ‘will’, ‘project’, ‘plan’, ‘believe’, ‘target’ and other words and terms of similar meaning in
connection with any discussion of future operating or financial performance. In particular, these include statements relating to future actions,
prospective products or product approvals, future performance or results of current and anticipated products, sales efforts, expenses, the
outcome of contingencies such as legal proceedings, and financial results.
Other than in accordance with its legal or regulatory obligations (including under the UK Listing Rules and the Disclosure and Transparency
Rules of the Financial Conduct Authority), the Group undertakes no obligation to update any forward-looking statements, whether as a result
of new information, future events or otherwise. Investors should, however, consult any additional disclosures that the Group may make in any
documents which it publishes and/or files with the US Securities and Exchange Commission (SEC). All investors, wherever located, should
take note of these disclosures. Accordingly, no assurance can be given that any particular expectation will be met and investors are cautioned
not to place undue reliance on the forward-looking statements.
Forward-looking statements are subject to assumptions, inherent risks and uncertainties, many of which relate to factors that are beyond the
Group’s control or precise estimate. The Group cautions investors that a number of important factors, including those in this document, could
cause actual results to differ materially from those expressed or implied in any forward-looking statement. Such factors include, but are not
limited to, those discussed under Item 3.D ‘Risk factors’ in the Group’s Annual Report on Form 20-F for 2014 and those discussed in Part 2 of
the Circular to Shareholders and Notice of General Meeting furnished to the SEC on Form 6-K on November 24, 2014. Any forward-looking
statements made by or on behalf of the Group speak only as of the date they are made and are based upon the knowledge and information
available to the Directors on the date of this report.
A number of adjusted measures are used to report the performance of our business. These measures are defined in our Q2 2015 earnings
release and annual report on Form 20-F.
Balanced business, driven by new products
and R&D innovation
3 * 2014 sales restated to exclude Oncology and include 12 months of NVS sales.
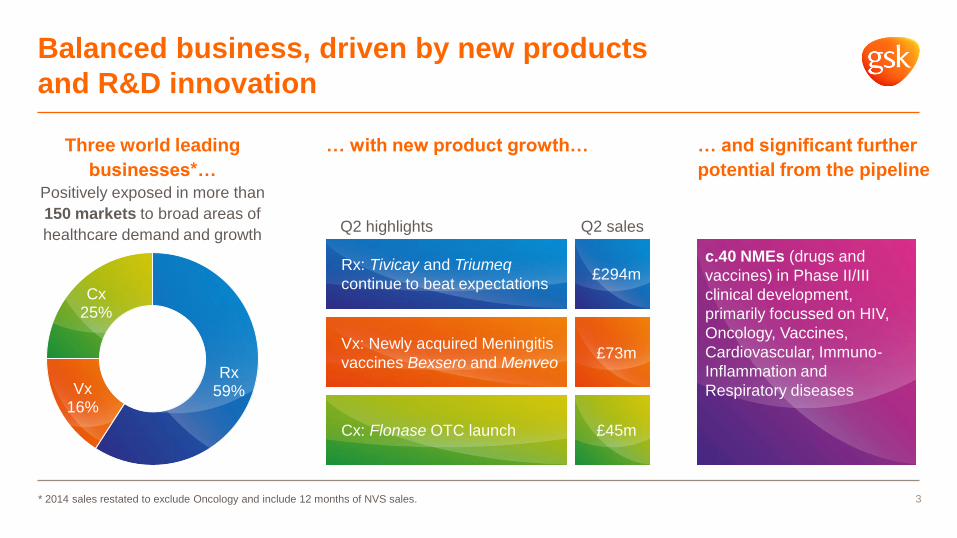
Three world leading
businesses*… Positively exposed in more than
150 markets to broad areas of
healthcare demand and growth
… with new product growth…
Rx: Tivicay and Triumeq
continue to beat expectations
Vx: Newly acquired Meningitis
vaccines Bexsero and Menveo
Cx: Flonase OTC launch
£294m
£73m
£45m
Q2 highlights Q2 sales
… and significant further
potential from the pipeline
c.40 NMEs (drugs and
vaccines) in Phase II/III
clinical development,
primarily focussed on HIV,
Oncology, Vaccines,
Cardiovascular, Immuno-
Inflammation and
Respiratory diseases Rx
59% Vx 16%
Cx 25%
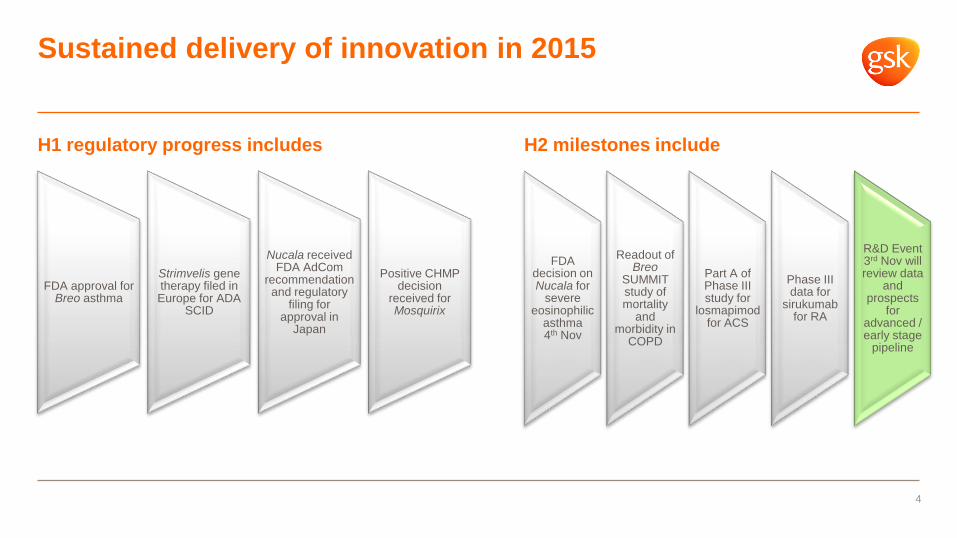
Sustained delivery of innovation in 2015
4
FDA decision on Nucala for
severe eosinophilic
asthma 4th Nov
Readout of Breo
SUMMIT study of mortality
and morbidity in
COPD
Part A of Phase III study for
losmapimod for ACS
Phase III data for
sirukumab for RA
R&D Event 3rd Nov will review data
and prospects
for advanced / early stage
pipeline
H2 milestones include
FDA approval for Breo asthma
Strimvelis gene therapy filed in Europe for ADA
SCID
Nucala received FDA AdCom
recommendation and regulatory
filing for approval in
Japan
Positive CHMP decision
received for Mosquirix
H1 regulatory progress includes
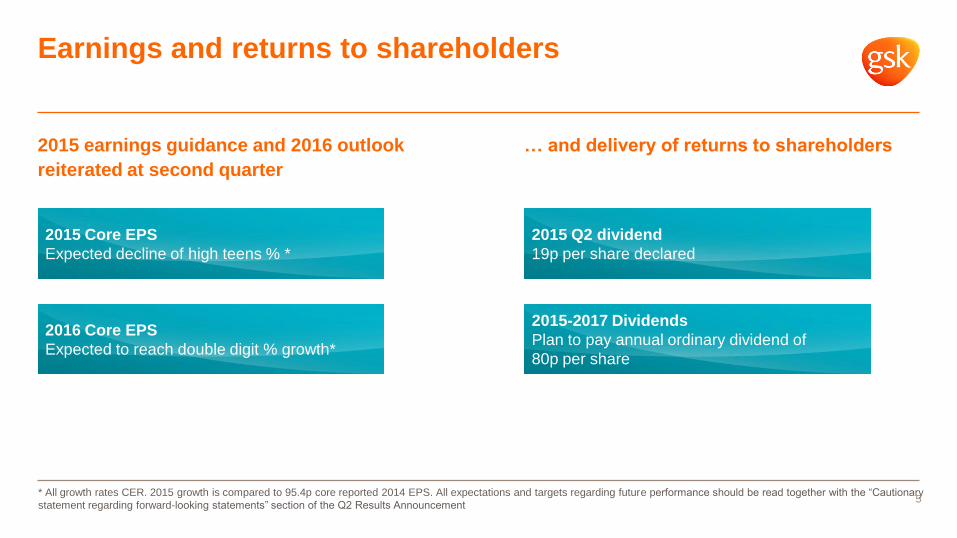
Earnings and returns to shareholders
5
2015 Q2 dividend
19p per share declared
… and delivery of returns to shareholders
* All growth rates CER. 2015 growth is compared to 95.4p core reported 2014 EPS. All expectations and targets regarding future performance should be read together with the “Cautionary
statement regarding forward-looking statements” section of the Q2 Results Announcement
2015 Core EPS
Expected decline of high teens % *
2016 Core EPS
Expected to reach double digit % growth*
2015 earnings guidance and 2016 outlook
reiterated at second quarter
2015-2017 Dividends
Plan to pay annual ordinary dividend of
80p per share
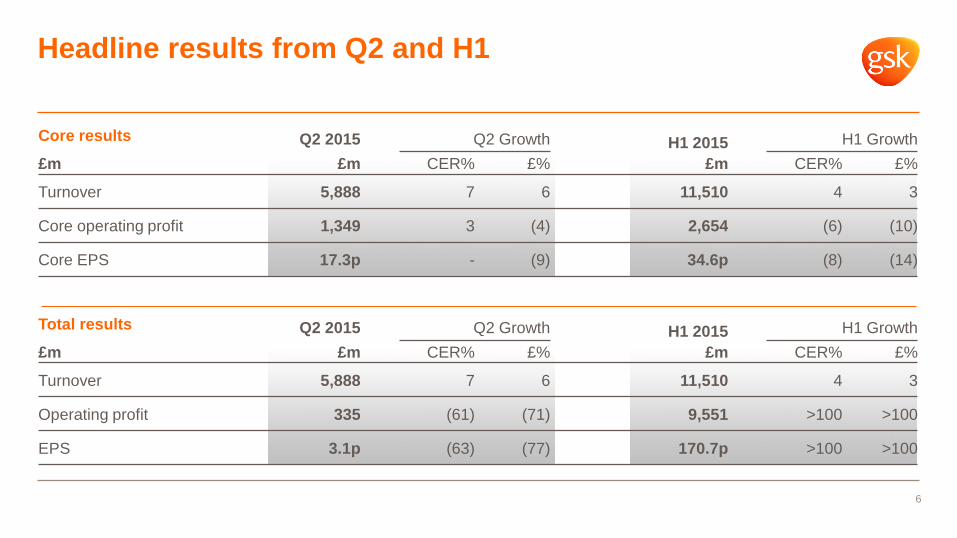
Core results Q2 2015 Q2 Growth H1 2015 H1 Growth
£m £m CER% £% £m CER% £%
Turnover 5,888 7 6 11,510 4 3
Core operating profit 1,349 3 (4) 2,654 (6) (10)
Core EPS 17.3p - (9) 34.6p (8) (14)
Headline results from Q2 and H1
6
Total results Q2 2015 Q2 Growth H1 2015 H1 Growth
£m £m CER% £% £m CER% £%
Turnover 5,888 7 6 11,510 4 3
Operating profit 335 (61) (71) 9,551 >100 >100
EPS 3.1p (63) (77) 170.7p >100 >100
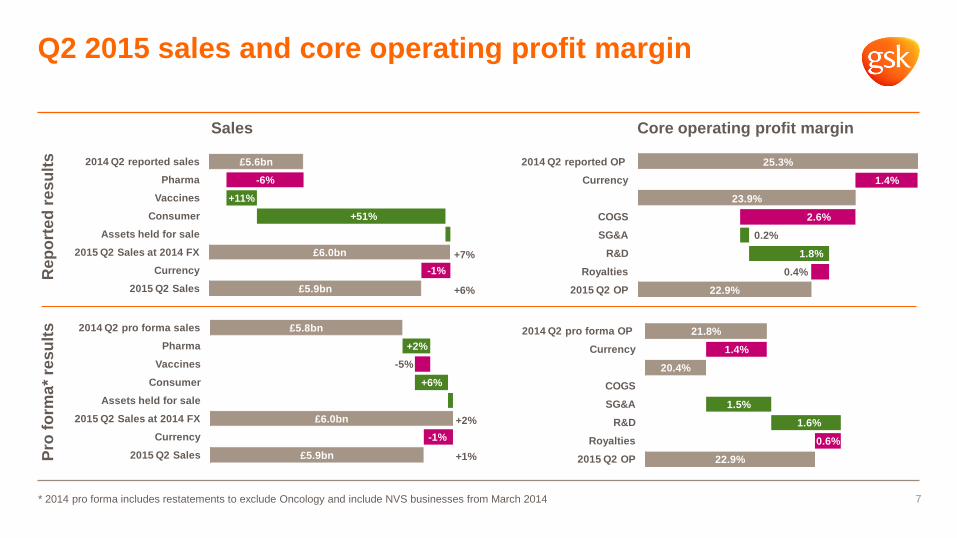
Q2 2015 sales and core operating profit margin
7
£5.8bn
£6.0bn
£5.9bn
+2%
+6%
-5%
-1%
2014 Q2 pro forma sales
Pharma
Vaccines
Consumer
Assets held for sale
2015 Q2 Sales at 2014 FX
Currency
2015 Q2 Sales
+2%
+1%
25.3%
23.9%
22.9%
0.2%
1.8%
1.4%
2.6%
0.4%
2014 Q2 reported OP
Currency
COGS
SG&A
R&D
Royalties
2015 Q2 OP
21.8%
20.4%
22.9%
1.5%
1.6%
1.4%
0.6%
2014 Q2 pro forma OP
Currency
COGS
SG&A
R&D
Royalties
2015 Q2 OP
Sales Core operating profit margin
Rep
ort
ed
re
su
lts
P
ro f
orm
a*
res
ult
s
* 2014 pro forma includes restatements to exclude Oncology and include NVS businesses from March 2014
£5.6bn
£6.0bn
£5.9bn
-6%
+11%
+51%
-1%
2014 Q2 reported sales
Pharma
Vaccines
Consumer
Assets held for sale
2015 Q2 Sales at 2014 FX
Currency
2015 Q2 Sales
+7%
+6%
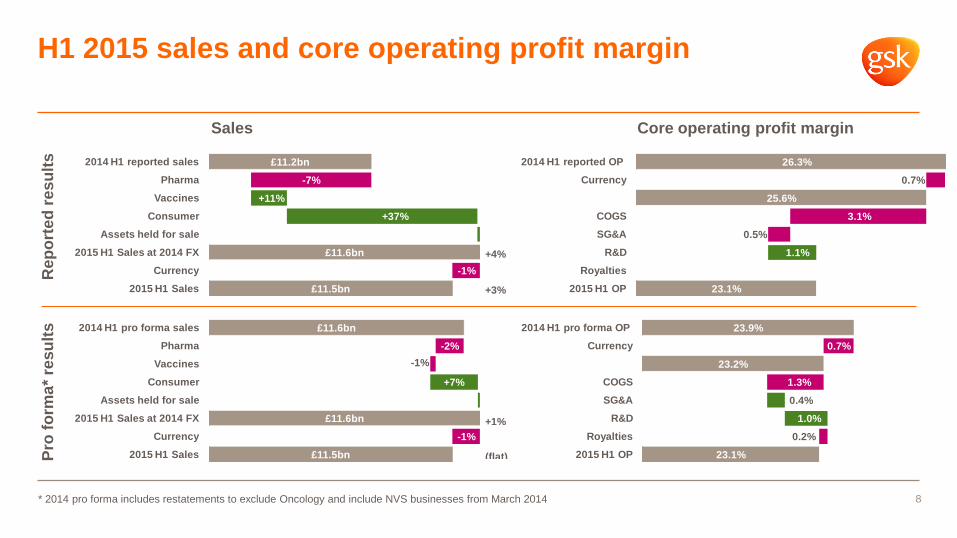
H1 2015 sales and core operating profit margin
8
Sales Core operating profit margin
Rep
ort
ed
re
su
lts
P
ro f
orm
a*
res
ult
s
£11.2bn
£11.6bn
£11.5bn
-7%
+11%
+37%
-1%
2014 H1 reported sales
Pharma
Vaccines
Consumer
Assets held for sale
2015 H1 Sales at 2014 FX
Currency
2015 H1 Sales
+4%
+3%
26.3%
25.6%
23.1%
1.1%
0.7%
3.1%
0.5%
2014 H1 reported OP
Currency
COGS
SG&A
R&D
Royalties
2015 H1 OP
* 2014 pro forma includes restatements to exclude Oncology and include NVS businesses from March 2014
£11.6bn
£11.6bn
£11.5bn
-2%
+7%
-1%
-1%
2014 H1 pro forma sales
Pharma
Vaccines
Consumer
Assets held for sale
2015 H1 Sales at 2014 FX
Currency
2015 H1 Sales
+1%
(flat)
23.9%
23.2%
23.1%
0.4%
1.0%
0.7%
1.3%
0.2%
2014 H1 pro forma OP
Currency
COGS
SG&A
R&D
Royalties
2015 H1 OP
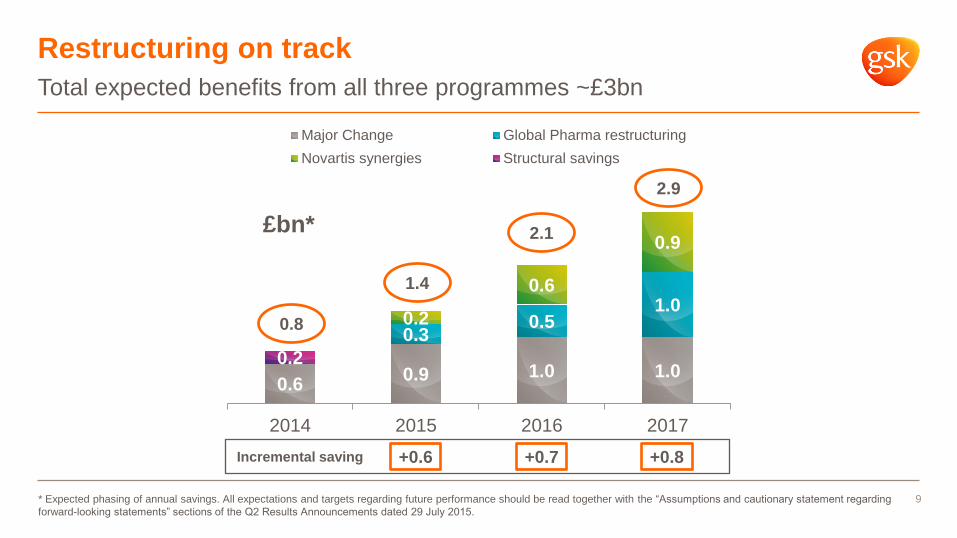
Restructuring on track
Total expected benefits from all three programmes ~£3bn
9
0.6 0.9 1.0 1.0
0.3 0.5
1.0 0.2
0.6
0.9
0.2
2014 2015 2016 2017
Major Change Global Pharma restructuring
Novartis synergies Structural savings
0.8
2.9
2.1
1.4
£bn*
Incremental saving +0.6 +0.7 +0.8
* Expected phasing of annual savings. All expectations and targets regarding future performance should be read together with the “Assumptions and cautionary statement regarding
forward-looking statements” sections of the Q2 Results Announcements dated 29 July 2015.
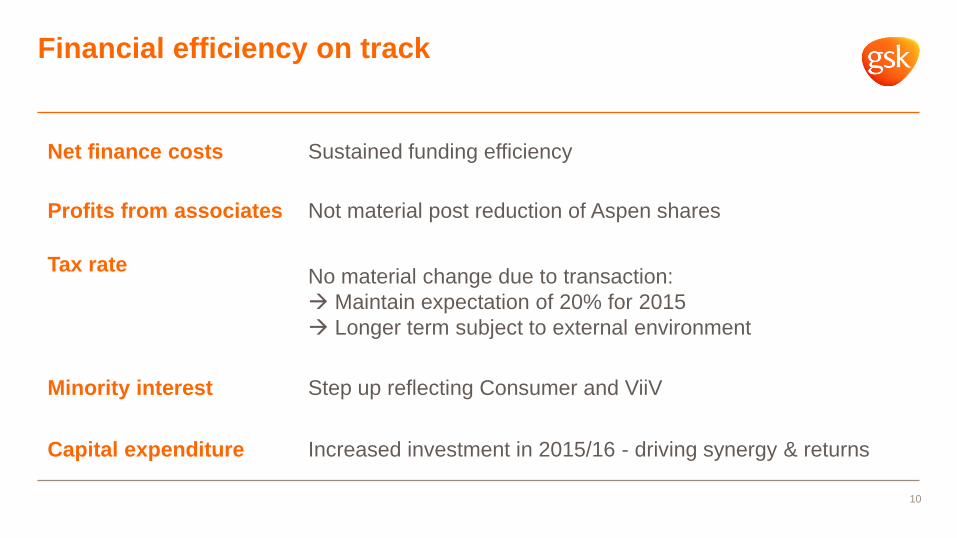
Financial efficiency on track
10
Net finance costs Sustained funding efficiency
Profits from associates Not material post reduction of Aspen shares
Tax rate No material change due to transaction:
Maintain expectation of 20% for 2015
Longer term subject to external environment
Minority interest Step up reflecting Consumer and ViiV
Capital expenditure Increased investment in 2015/16 - driving synergy & returns
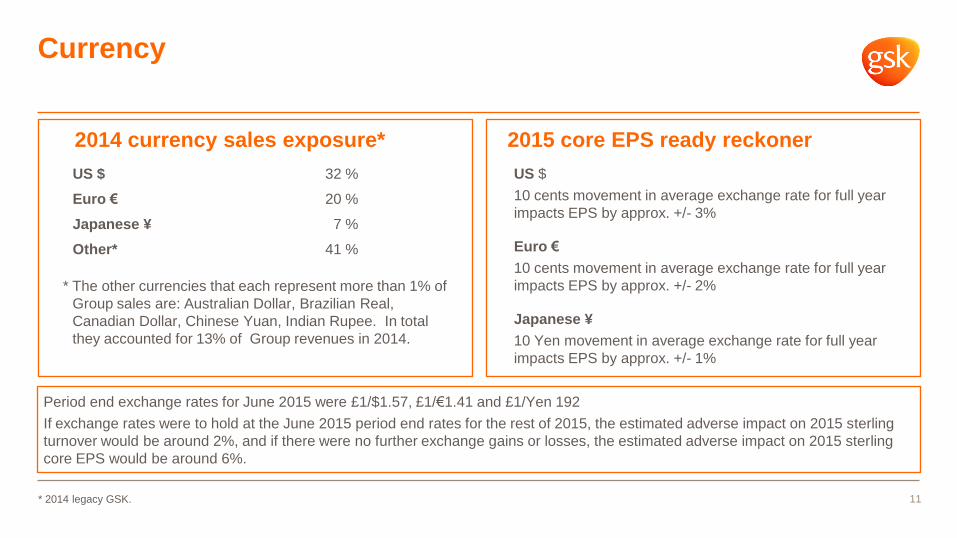
Currency
11
US $
10 cents movement in average exchange rate for full year
impacts EPS by approx. +/- 3%
Euro €
10 cents movement in average exchange rate for full year
impacts EPS by approx. +/- 2%
Japanese ¥
10 Yen movement in average exchange rate for full year
impacts EPS by approx. +/- 1%
US $ 32 %
Euro € 20 %
Japanese ¥ 7 %
Other* 41 %
Period end exchange rates for June 2015 were £1/$1.57, £1/€1.41 and £1/Yen 192
If exchange rates were to hold at the June 2015 period end rates for the rest of 2015, the estimated adverse impact on 2015 sterling
turnover would be around 2%, and if there were no further exchange gains or losses, the estimated adverse impact on 2015 sterling
core EPS would be around 6%.
* The other currencies that each represent more than 1% of
Group sales are: Australian Dollar, Brazilian Real,
Canadian Dollar, Chinese Yuan, Indian Rupee. In total
they accounted for 13% of Group revenues in 2014.
2015 core EPS ready reckoner 2014 currency sales exposure*
* 2014 legacy GSK.
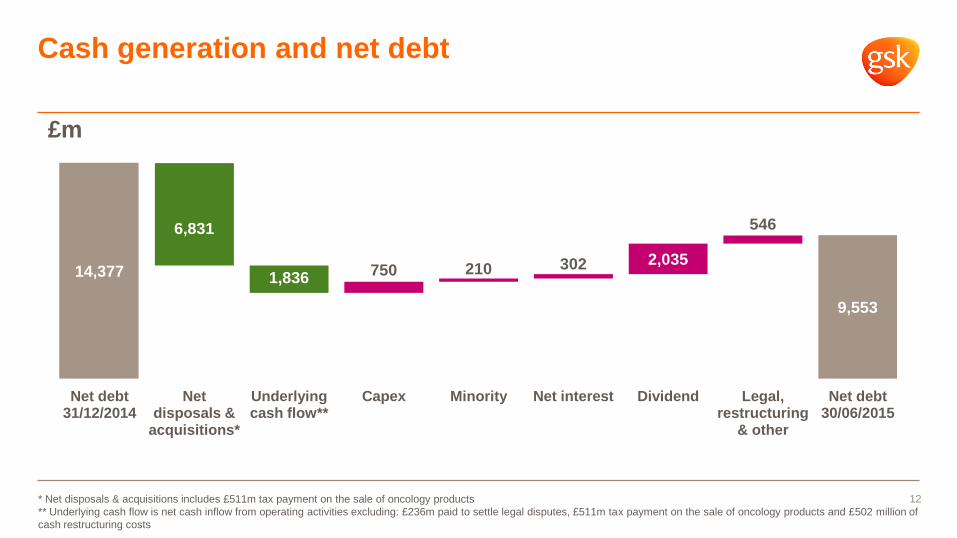
Cash generation and net debt
12 * Net disposals & acquisitions includes £511m tax payment on the sale of oncology products
** Underlying cash flow is net cash inflow from operating activities excluding: £236m paid to settle legal disputes, £511m tax payment on the sale of oncology products and £502 million of
cash restructuring costs
£m
14,377
9,553
750 210 302 2,035
546 6,831
1,836
Net debt 31/12/2014
Net disposals &
acquisitions*
Underlying cash flow**
Capex Minority Net interest Dividend Legal, restructuring
& other
Net debt 30/06/2015

Thank you