Embed Size (px)
Citation preview

Q2 2015 Results Presentation Uwe Röhrhoff, CEO
Rainer Beaujean, CFO
Duesseldorf, July 9, 2015

1. This presentation may contain certain forward-looking statements, including assumptions, opinions
and views of the Company or cited from third party sources. Various known and unknown risks,
uncertainties and other factors could cause the actual results, financial position, development or
performance of the Company to differ materially from the estimations expressed or implied herein.
2. The Company does not guarantee that the assumptions underlying such forward-looking statements
are free from errors nor does the Company accept any responsibility for the future accuracy of the
opinions expressed in this presentation or the actual occurrence of the forecast development.
3. No representation or warranty (express or implied) is made as to, and no reliance should be placed
on, any information, including projections, estimates, targets and opinions, contained herein, and no
liability whatsoever is accepted as to any errors, omissions or misstatements contained herein, and,
accordingly, none of the Company or any of its parent or subsidiary undertakings or any of such
person‘s officers, directors or employees accepts any liability whatsoever arising directly or indirectly
from the use of this document.
Disclaimer
2

Review Q2 2015 Uwe Röhrhoff, CEO

Key Group figures in EUR m, EPS in EUR
Q2 2015 sees strong increase in revenues and profits
335.4 356.4
Category 1
Revenues
Organic FXN: +1.9% +6.3%
Q2 2014 Q2 2015
0.73 0.84
Category 1
Adjusted EPS
+15.1%
Q2 2014 Q2 2015
30.3 40.1
Category 1
Operating Cash Flow
+32.3%
Q2 2014 Q2 2015
65.1 72.1
Category 1
Adjusted EBITDA
Q2 2015 FXN: EUR 70.3m +10.6%
Q2 2014 Q2 2015
Margin 19.4% 20.2%
4

Plastics & Devices
Very strong revenue growth in inhalers and diabetes care, tooling revenues back to normal levels as expected
Adjusted EBITDA increase driven by positive revenue mix effect
Primary Packaging Glass
US demand improved, revenues are recovering
US-based Millville glass plant to be closed in Q3 2015 as part of portfolio streamlining,
consolidation of moulded glass production at Chicago Heights plant started
Adjusted EBITDA improvement reflects capacity adjustment measures and strict cost management
Life Science Research
Revenue expansion driven by strong tailwind from currency
After balance sheet date
Refinancing completed
Disposal of tubing business to Corning Incorporated announced
Q2 2015 with a strong set of results in all divisions
5

We focus on our core competence in line with our strategy:
finished products in primary packaging glass – close to the customer
Corning is a world leader in material sciences and high-quality glass production
We have a 10-year supply agreement for pharmaceutical glass tubing with Corning
Outsourcing of tubing reduces capital intensity of business and cyclicality of investments
Key figures of Tubing operations (FY 2014):
Revenues: about EUR 83m
EBITDA margin: about 23%
Sale proceeds will amount to EUR 196m debt-free
A new joint-venture of Gerresheimer and Corning will accelerate innovations for the
pharmaceutical glass packaging market
Disposal of Tubing operations to Corning: deal rationale
Closing expected by the end of 2015
6

Financial overview Q2 2015 Rainer Beaujean, CFO
1. Organic growth: At const. FX rates, excluding acquisitions, divestments and optimization of business portfolio
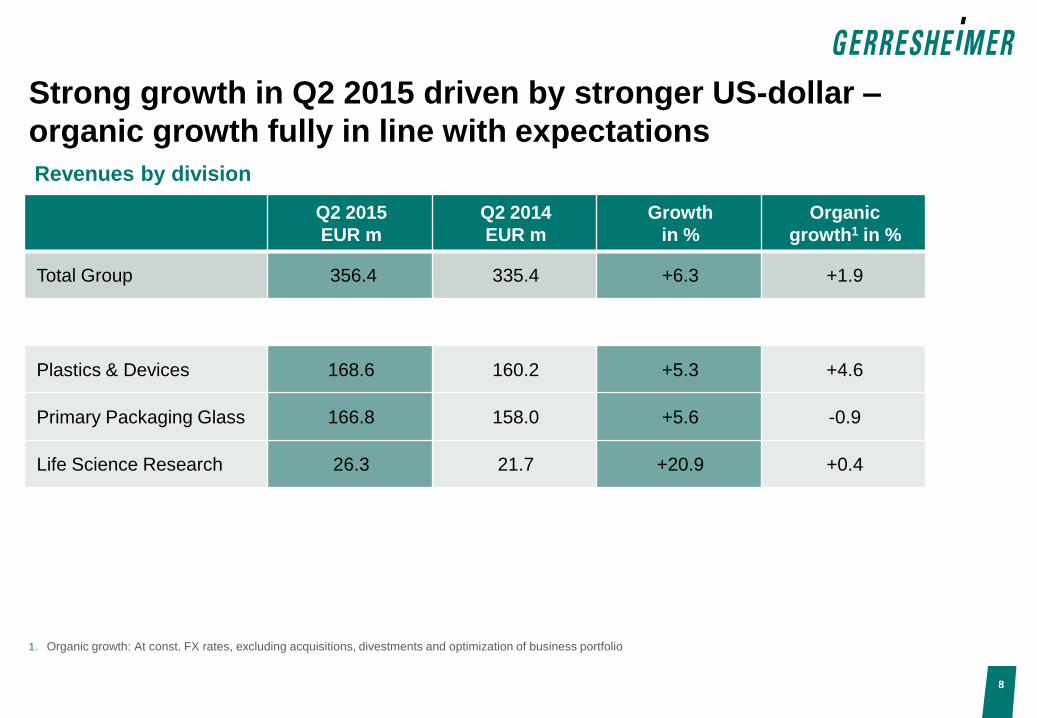
Strong growth in Q2 2015 driven by stronger US-dollar –
organic growth fully in line with expectations
8
Q2 2015
EUR m
Q2 2014
EUR m
Growth
in %
Organic
growth1 in %
Total Group 356.4 335.4 +6.3 +1.9
Plastics & Devices 168.6 160.2 +5.3 +4.6
Primary Packaging Glass 166.8 158.0 +5.6 -0.9
Life Science Research 26.3 21.7 +20.9 +0.4
Revenues by division

1. Earnings before income taxes, net finance expense, amortization of fair value adjustments, extraordinary depreciation, depreciation and amortization, restructuring
expenses and one-off expenses and income.
Broad-based EBITDA margin expansion in Q2 2015
9
Q2 2015 Q2 2014
EUR m Margin in % EUR m Margin in %
Total Group 72.1 20.2 65.1 19.4
Plastics & Devices 36.3 21.5 33.0 20.6
Primary Packaging Glass 36.8 22.1 33.7 21.3
Life Science Research 3.8 14.5 3.0 14.0
Adjusted EBITDA1 by division
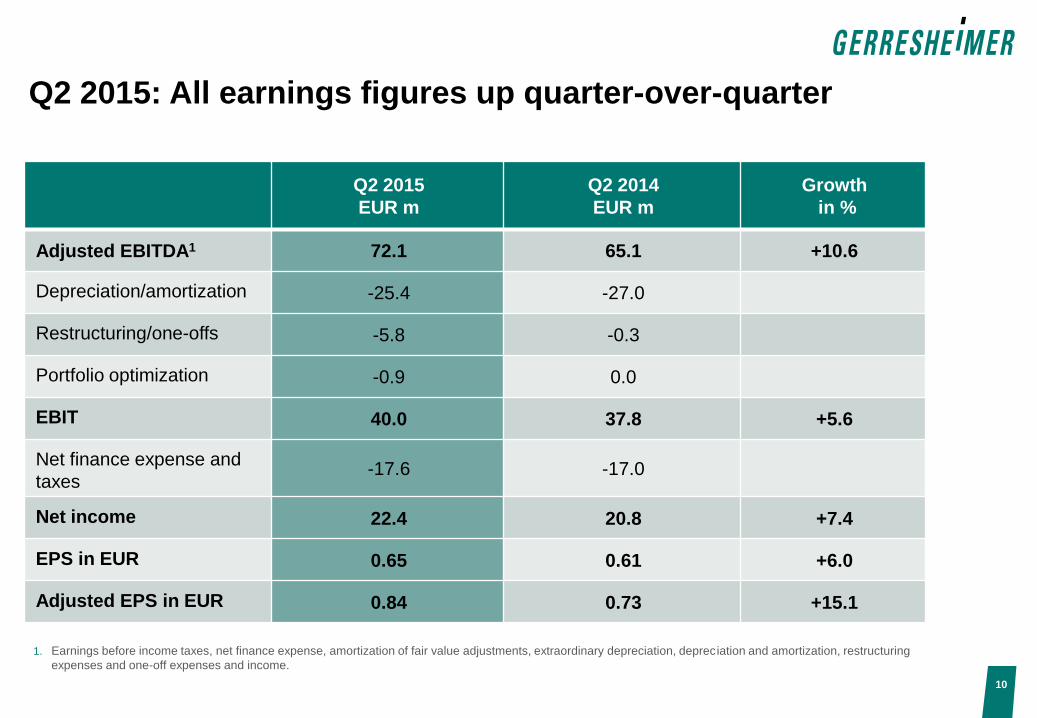
Q2 2015: All earnings figures up quarter-over-quarter
10
1. Earnings before income taxes, net finance expense, amortization of fair value adjustments, extraordinary depreciation, depreciation and amortization, restructuring
expenses and one-off expenses and income.
Q2 2015
EUR m
Q2 2014
EUR m
Growth
in %
Adjusted EBITDA1
72.1 65.1 +10.6
Depreciation/amortization -25.4 -27.0
Restructuring/one-offs -5.8 -0.3
Portfolio optimization -0.9 0.0
EBIT 40.0 37.8 +5.6
Net finance expense and
taxes -17.6 -17.0
Net income 22.4 20.8 +7.4
EPS in EUR 0.65 0.61 +6.0
Adjusted EPS in EUR 0.84 0.73 +15.1
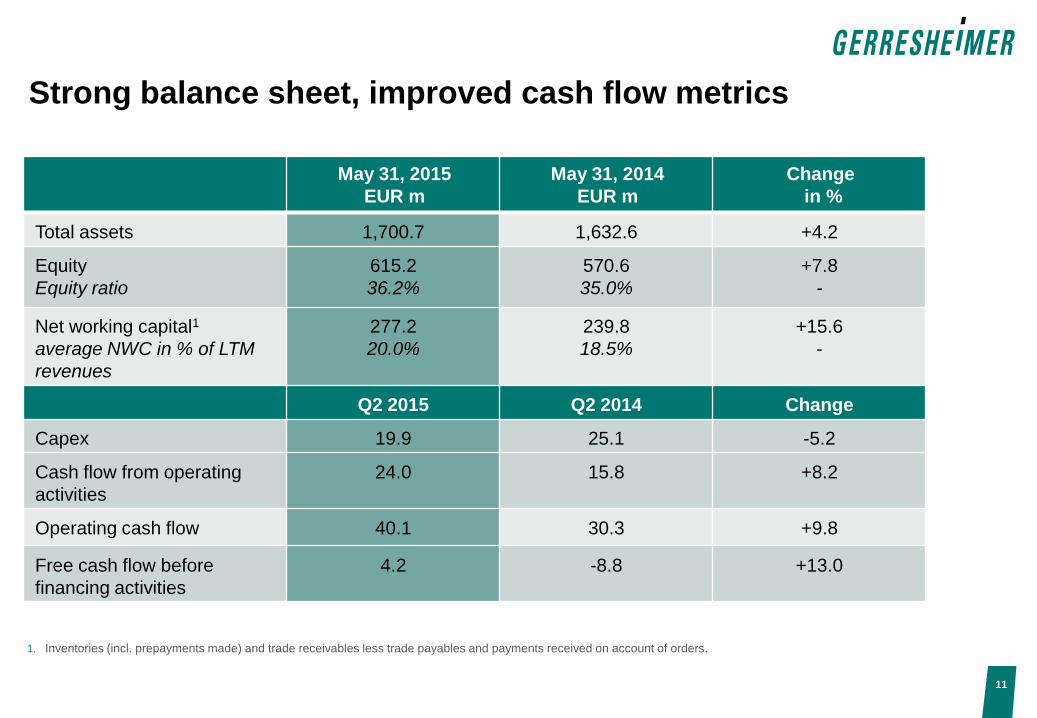
Strong balance sheet, improved cash flow metrics
11
May 31, 2015
EUR m
May 31, 2014
EUR m
Change
in %
Total assets 1,700.7 1,632.6 +4.2
Equity
Equity ratio
615.2
36.2%
570.6
35.0%
+7.8
-
Net working capital1
average NWC in % of LTM
revenues
277.2
20.0%
239.8
18.5%
+15.6
-
Q2 2015 Q2 2014 Change
Capex 19.9 25.1 -5.2
Cash flow from operating
activities
24.0 15.8 +8.2
Operating cash flow 40.1 30.3 +9.8
Free cash flow before
financing activities
4.2 -8.8 +13.0
1. Inventories (incl. prepayments made) and trade receivables less trade payables and payments received on account of orders.

12
Net financial debt development quarter-on-quarter
Comparison of debt/cash positions in EUR m
67.6 73.4
18.5 13.8
88.7 149.5
101.5 75.7
300.0 300.0
441.1
Feb 28, 2015
Interest rate (due date):
May 31, 2015
465.6
Headroom: EUR 100.5m
Bond
Long-term bank debt
Revolving bank debt
Local borrowings and leasing
Cashh
Interest rate hedged
at 3.26% (2016)
Fixed coupon at 5.0%
(2018)
1.7x 1.8x Adjusted EBITDA leverage
Net financial debt

Favorable market environment
Recent confirmation of Gerresheimer’s investment grade ratings by S&P and Moody’s
New revolving credit facility of EUR 450m, matures in year 2020
(previously: revolving + amortizing credit facility of initially EUR 400m)
EUR 300m bond to be kept in place, matures in May 2018
New revolving credit facility backed by international bank consortium
Improved cost structure: savings of annual interest expenses estimated to be ~EUR 1m per year;
interest rate at the moment 1.1% based on drawing of EUR 225m
FX rate flexibility: can be drawn in euro and US-dollar
Improved set of covenants with up to 3.5 x net debt/adj. EBITDA
Refinancing of syndicated bank debt successfully
completed in June 2015
13
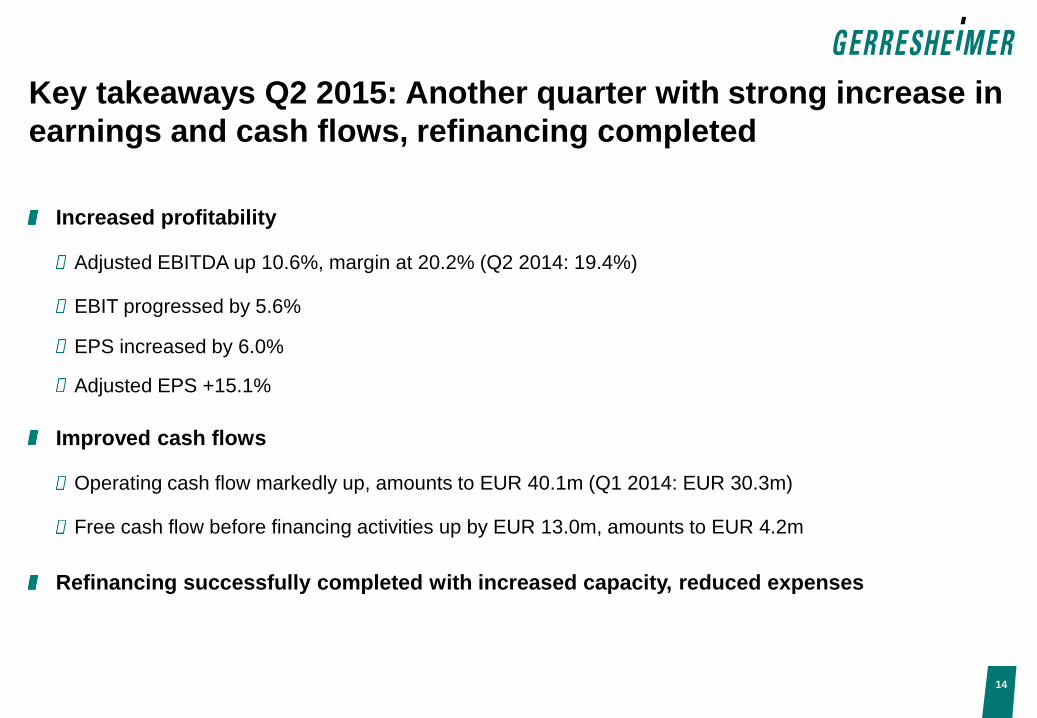
Increased profitability
Adjusted EBITDA up 10.6%, margin at 20.2% (Q2 2014: 19.4%)
EBIT progressed by 5.6%
EPS increased by 6.0%
Adjusted EPS +15.1%
Improved cash flows
Operating cash flow markedly up, amounts to EUR 40.1m (Q1 2014: EUR 30.3m)
Free cash flow before financing activities up by EUR 13.0m, amounts to EUR 4.2m
Refinancing successfully completed with increased capacity, reduced expenses
Key takeaways Q2 2015: Another quarter with strong increase in
earnings and cash flows, refinancing completed
14

Guidance FY 2015 Uwe Röhrhoff, CEO

Guidance FY 2015
Revenues (organic growth)1
+1% to +3%; equals approx. EUR 1,300m to EUR 1,330m
Adjusted EBITDA (at const. FX)2
EUR 255m to EUR 265m
Capex (at const. FX)2
9% to 10% of revenues
1. Organic growth: At const. FX rates, excluding acquisitions, divestments and optimization of business portfolio
2. Average budgeted exchange rate assumption: EUR 1.00 = USD 1.30
Full confirmation of Guidance FY 2015
16

Outlook
FY 2016-2018
Updated Outlook
FY 2016-2018 (Assumption: Tubing deal will be closed
by end of 2015)
Revenues (organic growth)1
+4% to +6% CAGR +4% to +6% CAGR
Adjusted EBITDA (at const. FX)2
Uplift towards 21% adjusted
EBITDA margin in 2018
Adjusted EBITDA margin
approximately 20% by 2018
Capex (at const. FX)2
9% to 10% of revenues 8.0% to 9.5% of revenues
1. Organic growth: At const. FX rates, excluding acquisitions, divestments and optimization of business portfolio
2. Average budgeted exchange rate assumption: EUR 1.00 = USD 1.30
Updated outlook FY 2016-2018 reflects disposal of
Tubing business
17

Questions & Answers

Our Vision
Gerresheimer will become the leading global partner
for enabling solutions that improve health and well-being.
Our success is driven by the passion of our people.

Backup

May 31, 2015
EUR m
May 31, 2014
EUR m
Inventories
thereof prepayments made
214.3
6.4
199.5
15.9
Trade receivables 216.4 189.8
Trade payables 115.1 104.2
Payments received on account
of orders
38.4
45.3
Net working capital
in % of LTM revenues
277.2
21.1
239.8
18.8
1. Inventories (incl. prepayments made) and trade receivables less trade payables and payments received on account of orders.
Development of net working capital1
21

May 31, 2015
EUR m
May 31, 2014
EUR m
Raw materials, consumables
and supplies
55.7
52.8
Work in progress 24.5 24.5
Finished goods and
merchandise 127.7 106.3
Prepayments made on
inventories
6.4
15.9
Inventories 214.3 199.5
Development of inventories
22
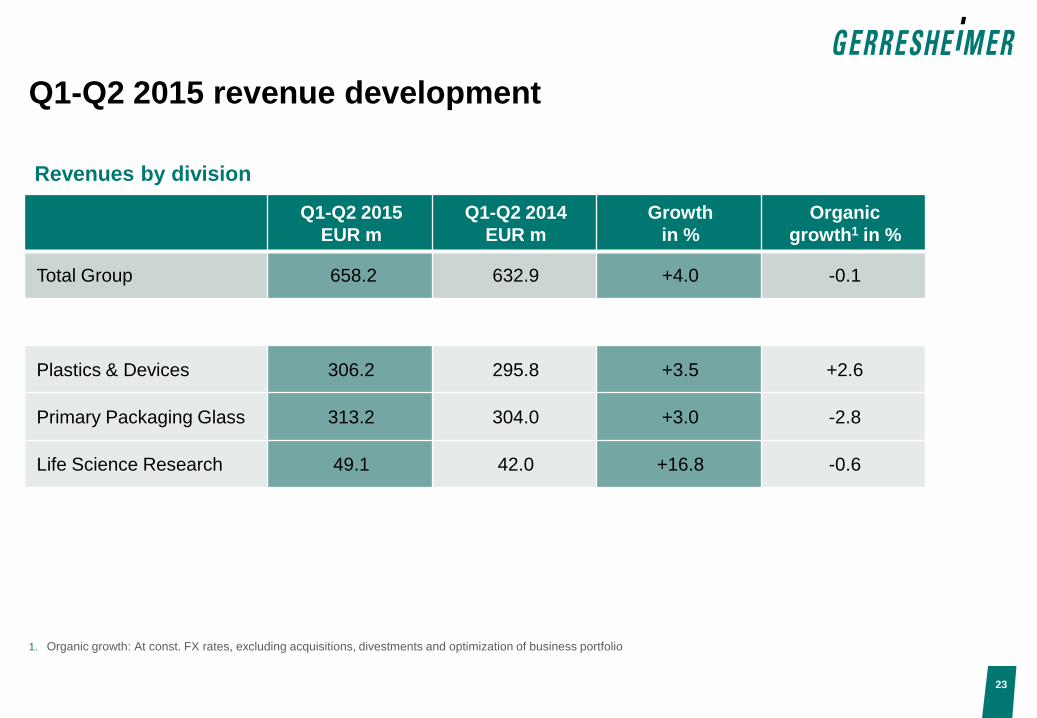
1. Organic growth: At const. FX rates, excluding acquisitions, divestments and optimization of business portfolio
Q1-Q2 2015 revenue development
23
Q1-Q2 2015
EUR m
Q1-Q2 2014
EUR m
Growth
in %
Organic
growth1 in %
Total Group 658.2 632.9 +4.0 -0.1
Plastics & Devices 306.2 295.8 +3.5 +2.6
Primary Packaging Glass 313.2 304.0 +3.0 -2.8
Life Science Research 49.1 42.0 +16.8 -0.6
Revenues by division
1. Earnings before income taxes, net finance expense, amortization of fair value adjustments, extraordinary depreciation, depreciation and amortization, restructuring
expenses and one-off expenses and income.
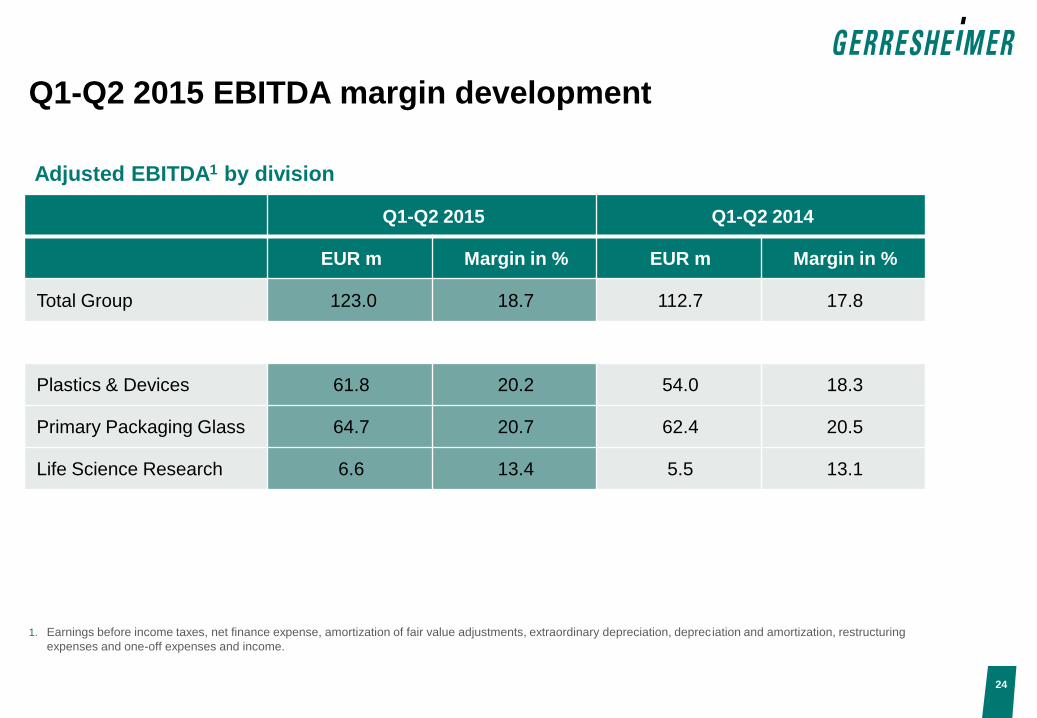
Q1-Q2 2015 EBITDA margin development
24
Q1-Q2 2015 Q1-Q2 2014
EUR m Margin in % EUR m Margin in %
Total Group 123.0 18.7 112.7 17.8
Plastics & Devices 61.8 20.2 54.0 18.3
Primary Packaging Glass 64.7 20.7 62.4 20.5
Life Science Research 6.6 13.4 5.5 13.1
Adjusted EBITDA1 by division

Q1-Q2 2015 earnings figures development
25
1. Earnings before income taxes, net finance expense, amortization of fair value adjustments, extraordinary depreciation, depreciation and amortization, restructuring
expenses and one-off expenses and income.
Q1-Q2 2015
EUR m
Q1-Q2 2014
EUR m
Growth
in %
Adjusted EBITDA1
123.0 112.7 +9.1
Depreciation/amortization -51.4 -52.9
Restructuring/one-offs -6.2 -0.3
Portfolio optimization -0.9 0.0
EBIT 64.5 59.5 +8.3
Net finance expense and
taxes -29.5 -28.4
Net income 35.0 31.1 +12.5
EPS in EUR 1.00 0.90 +10.8
Adjusted EPS in EUR 1.27 1.11 +14.4
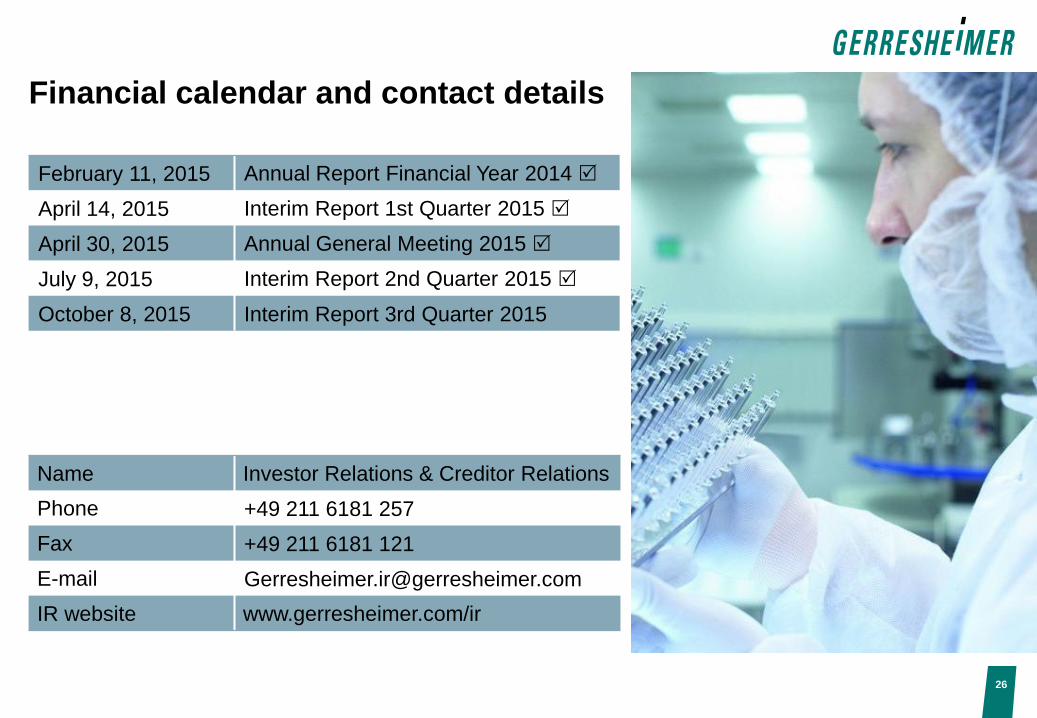
Financial calendar and contact details
February 11, 2015 Annual Report Financial Year 2014 R
April 14, 2015 Interim Report 1st Quarter 2015 R
April 30, 2015 Annual General Meeting 2015 R
July 9, 2015 Interim Report 2nd Quarter 2015 R
October 8, 2015 Interim Report 3rd Quarter 2015
26
Name Investor Relations & Creditor Relations
Phone +49 211 6181 257
Fax +49 211 6181 121
E-mail [email protected]
IR website www.gerresheimer.com/ir